Abstract
Calcite is the most stable crystalline phase of calcium carbonate. It is applied or found in composite products, the food industry, biomineralization, archaeology, and geology, and its mechanical properties have attracted more and more attention. In this paper, the mechanical behaviors of single-crystal calcite under uniaxial tension in different directions were simulated with the molecular dynamics method. The obtained elastic moduli are in good agreement with the experimental results. It has been found from further research that single-crystal calcite has typical quasi-brittle failure characteristics, and its elastic modulus, fracture strength, and fracture strain are all strongly anisotropic. The tensile failure is caused by dislocation emission, void formation, and phase transition along the and directions, but by continuous dislocation glide and multiplication along the direction. The fracture strength, fracture strain, and elastic modulus are all sensitive to temperature, but only elastic modulus is not sensitive to strain rate. The effects of temperature and logarithmic strain rate on fracture strength are in good agreement with the predictions of fracture dynamics.
1. Introduction
Calcium carbonate (CaCO3) is one of the most common of the mineral materials that provide important support for human life and industry. It occurs naturally in a wide variety of organisms, such as coccolithophores, foraminifers, and corals, as well as pearl oysters and animal bones [1,2]. Due to its biocompatibility and ease of use, calcium carbonate plays a very important role in biomedical aspects [3,4,5], such as regeneration [6,7]. It is also a biological mineral. When copolymer is added, its friction properties and other mechanical properties can be greatly improved [8,9]. In addition, it plays a key role in many anthropological and geological studies [10], materials protection [11], and accurate dating [12,13,14,15].
Calcium carbonate has three anhydrous crystal types, including calcite, aragonite, and vaterite. As a building material, calcite is found throughout nature. According to the statistics from European Calcium Carbonate Association (CCA–Europe), the global construction industry consumes hundreds of millions of tons of calcium carbonate every year. In addition, calcite accounts for more than 60% of the content of polymer fillers and is used to reinforce raw materials [16]. The addition of calcite not only improves the characteristics of raw materials, but also greatly reduces the product cost. These applications are inevitably affected by temperature and strain changes. Therefore, it is of great significance to understand the mechanical properties of calcite at different temperatures and strains.
At present, the research on calcite, from Bridgeman’s pioneering work [17] to many static and dynamic experimental studies [18,19,20,21,22,23,24], and then to the recent atomic scale simulations of phase-transition processes [25,26,27,28], mainly focuses on its high-pressure phase-transition behavior. In addition, Sokolá et al. [29] studied the effects of calcite content on the mechanical properties of calcium carbonate at different temperatures. They found that calcite can reduce the shrinkage of samples during sintering, which can improve the characteristics of samples. Kunitake et al. [30] obtained biological calcite from the prismatic layer of mollusks and compared the hardness and modulus of biological calcite and geological calcite through an indentation experiment. They found that biological calcite has higher hardness, and pointed out that the hardening mechanism in which the dislocation motion is hindered causes the failure of calcite. Subsequently, Schuster et al. [31] twisted the calcite aggregates under high pressure and characterized the products by X-ray diffraction. They found that the dominant slip plane has obvious dislocation characteristics.
Although some mechanical properties of calcite have been tested and some deformation mechanisms have been revealed, the research and understanding of these mechanisms are not complete. In this study, we used the molecular dynamics (MD) method to simulate the mechanical behavior of calcite under uniaxial tensile loading, studied the effects of temperature and strain rate on the mechanical properties of calcite, and tried to reveal its internal deformation mechanism at the atomic scale.
2. Model and Method
2.1. Interatomic Interaction Potential
An interatomic potential function describes the interaction between atoms. In MD simulations, the potential function plays a decisive role in the simulation results. For ionic materials, there are generally two interatomic potential function models: the rigid ion model (RIM) and the shell model (SM). In the RIM, the potential energy only depends on the distance of each atomic pair. In order to more accurately describe the polarization mechanism of negative ions, especially , the SM divides each negative ion into two particles, namely a core and a shell [32]. The polarization-coordinate-coupling method is used to shorten the simulation time and improve the convergence speed [33].
For calcite, a lot of RIMs [34,35,36,37,38,39,40] and SMs [35,37,41,42,43] have been developed. They have different descriptions of C–O interaction. Although the SMs show the volume characteristics [41,42] of calcite crystals through the polarization of CO32−, the addition of core and shell particles in significantly reduces the efficiency of calculation. Therefore, an available simulation model has a relatively small size.
The SM developed for calcite by Dove et al. [34] can give more consistent predictions of the mechanical properties with the experimental results. In this model, the total potential energy includes bonded and non-bonded parts, namely:
In the bonded part, the intermolecular harmonic function is used to deal with the bond-bending between O–C and C–O in O–C–O, and the out-of-plane potential of the CO32− group is realized by a four-body torsional term. Moreover:
where is the bond-bending constant, is the equilibrium bond angle between O–C and C–O in the O–C–O, taken as 120° here, is the actual bond angle, is the torsional constant, is the angle between two O–C–O planes in CO32− group, taken as 180° here, and subscripts , , , and represent different atoms.
In the non-bonded part, Born–Mayer interaction potential is used to characterize the short-range interactions of Ca–O, C–O, and O–O, and the Coulomb potential of their long-range interactions. See:
where and are Born–Mayer potential parameters, is the dielectric constant, is the charge of atom, and is the distance between two atoms with cut-off radius of 10 Å. All the potential function parameters are listed in Table 1.

Table 1.
Potential function parameters [34].
2.2. The Computer Model
Calcite belongs to the trigonal system, and the space group is . In a hexagonal calcite unit cell (a = b = 4.990 Å, c = 17.061 Å, α = β = 90°, and γ = 120°), there are 64 atoms (Figure 1). A computer model of single-crystal calcite with a size of 50 nm × 50 nm × 25 nm and 4.8 million atoms in total was constructed by using the unit cell structure proposed by Graf [44], as shown in Figure 2. A Cartesian coordinate system had the , , and directions, respectively.
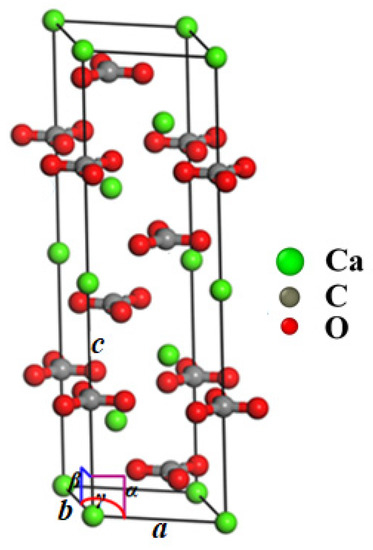
Figure 1.
Calcite unit cell (green for Ca, gray for C, and red for O).
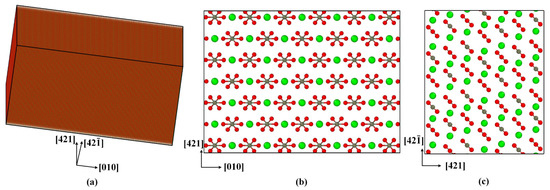
Figure 2.
Computer model of single-crystal calcite: (a) 3D view, (b) top view, and (c) side view.
The calculation was performed using the general MD simulation package LAMMPS [45]. The periodic boundary conditions were used along the , and directions. In the NPT ensemble with a constant number of atoms, pressure, and temperature, the model was relaxed for 100 ps to equilibrium at a time step of 1 fs and temperature of 500 K. Then, the model was stretched along the , and directions, respectively. The NPT ensemble was also used in the tension process simulations. The pressure was controlled by air pressure and the temperature by a Nose–Hoover thermostat. The particle–particle–particle–mesh (PPPM) algorithm [46], with accuracy of 10−6, was adopted to solve the dynamic equations.
3. Results and Discussion
3.1. Uniaxial Tensile Behaviors in Different Directions
Figure 3 shows the uniaxial tensile stress–strain curves along the , , and directions at 300 K temperature and 1 × 10⁸ s−1 strain rate. It can be seen that although the three stress–strain curves have very similar shapes, they obviously have different slopes of the elastic stage, different ultimate stresses or fracture strength, and different strains corresponding to the ultimate stresses. This reflects the remarkable anisotropy of single-crystal calcite in the mechanical properties. At the stage of elastic deformation, the stress increases with the strain in an approximately linear trend. When the fracture strength is reached, the curves enter into the fracture stage. The results indicate that the tensile failure behavior of single-crystal calcite exhibits typical quasi-brittleness characteristics along the three directions [47]. By fitting the elastic deformation stage with the least square method, the elastic modulus along the direction is about 73.2 GPa, which is very close to the experimental result of 70.23 ± 1.35 GPa [48]. Moreover, the elastic moduli along the and directions are 58.5 GPa and 60.4 GPa respectively. They are about 20% smaller than that along the direction.
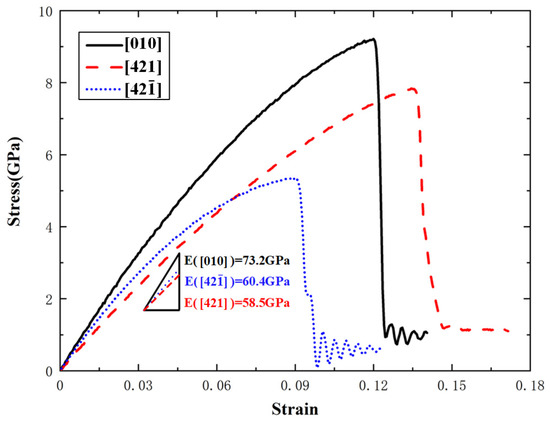
Figure 3.
Uniaxial tensile stress–strain curves of single-crystal calcite along the , , and directions at 300 K.
In order to understand the atomistic mechanism of tensile deformation and failure behavior of single-crystal calcite, we extracted the atomic configurations at different stages of tensile deformation along the direction, as shown in Figure 4. In this study, the radial distribution function (RDF) as well as the atomic coordination number was used to identify a new phase, as shown in Figure 5. The RDF analysis shows that Ca–Ca has the nearest-neighbor distance of 3.2 Å in the new phase, while it is 3.8 Å in calcite, which corresponds to the first peaks of RDFs in Figure 5. As an intermediate value between 3.2 Å and 3.8 Å, therefore, 3.5 Å was chosen as the cut-off radius to calculate the coordination number of calcium atoms. Figure 4a–c shows the atomic configurations when the strain reaches 0.084 in the elastic deformation stage, 0.121 at the rapid stress reduction stage, and 0.135 at the failure stage, respectively. It can be seen that at the elastic deformation stage, only some dislocations initiate from the middle of both sides along the direction. After the curve enters into a sharp stress-declining stage with the increase of strain, the dislocations in both the sides develop inwards and an amorphous phase forms gradually. Meanwhile, dislocations are also initiating, as shown in Figure 4b. At the failure stage, the dislocations develop rapidly along the slip plane . As the most important cleavage plane of calcite crystals [49,50,51], it is orthogonal to the direction. As the strain increases, the further development of dislocation leads to the occurrence of voids in the middle of both sides along the direction, while an ordered new phase is constantly formed in the center of the model, as shown in Figure 4c. Although the new phase is different from calcite, it has a regular atomic arrangement and a fixed radial distribution function, as shown in Figure 5. For observation, the atoms are colored according to the coordination number of calcium atoms in Figure 4, with green for calcite, blue for the new phase, and cyan for the amorphous phase, respectively. The development of the new phase and voids is the fundamental reason for the rapid stress reduction at the second stage [47]. The failure process of calcite in tension along the direction originates from initial dislocation emission and ends with the rapid development of the new phase and voids.
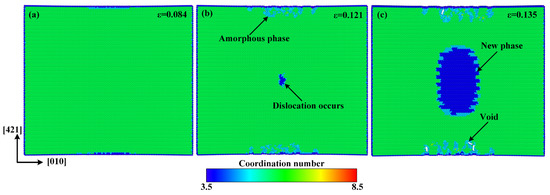
Figure 4.
Atomic configurations when the tensile strain along the direction reaches: (a) ε = 0.084, (b) ε = 0.121, and (c) ε = 0.135. The atoms are colored according to the coordination number of Ca with green for calcite, blue for the new phase, and cyan for the amorphous phase.
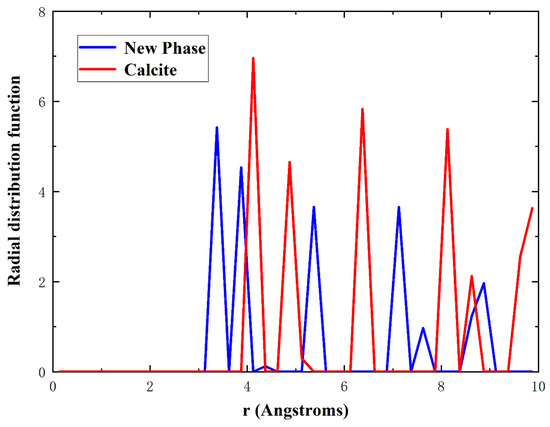
Figure 5.
Radial distribution functions of Ca–Ca for calcite in red and the new phase in blue.
Figure 6 shows the atomic configuration when the strain reaches 0.13 and its local enlarged diagrams for the atomic arrangements in the middle of both sides along the direction and the center of the model. It can be seen that, similar to the case for the direction, the amorphous phase also develops in the middle of both sides along the direction and the new ordered phase forms in the center of the model.
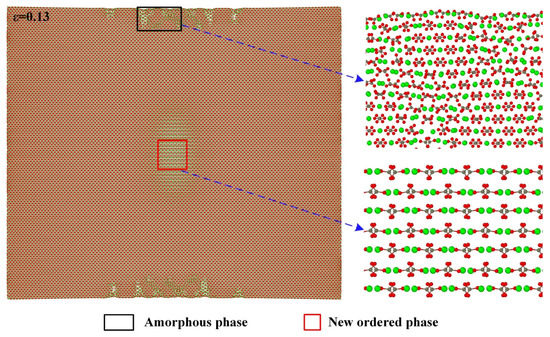
Figure 6.
Partial enlarged details of atomic configuration at strain of 0.13 along the direction.
In order to understand the internal mechanism of dislocation slip induced by the phase transition in uniaxially stretched calcite, Figure 7 shows the process from the dislocation initiation and development to the formation of the new ordered phase. Compared with the initial perfect calcite structure shown in Figure 7a, when the stress reaches the fracture strength, a dislocation line is formed in the center of the model, as shown in Figure 7b, which corresponds to Figure 4b. In Figure 7c, the rapid propagation and development of dislocations causes the new phase to form. The Ca2+ and CO32− interaction inside calcium carbonate molecule is much stronger than the interaction between calcium carbonate molecules, so dislocations easily occur between two adjacent calcium carbonate molecules. As reported in reference [52], they tend to break weaker bonds in the cleavage plane.

Figure 7.
Dislocation initiation and development: (a) initial perfect calcite structure, (b) a dislocation line formed at the rapid stress reduction stage, (c) a new ordered phase formed by dislocation development.
Figure 8 shows the layouts of computer model on the top plane and side plane. In this figure, each point has the average coordinates of the five atoms in the corresponding calcium carbonate molecule. When the model is stretched along the direction, as shown in Figure 8a, the calcium carbonate molecules in the dotted blue lines, such as molecules 1, 4, 7, and 10 or 2, 5, 8, and 11, act as a close-packed plane. There is a high molecular density on these planes. Due to large distance between two neighboring close-packed planes, there is a weak atomic binding force and a small slip resistance between them, so that the slip preferentially occurs.
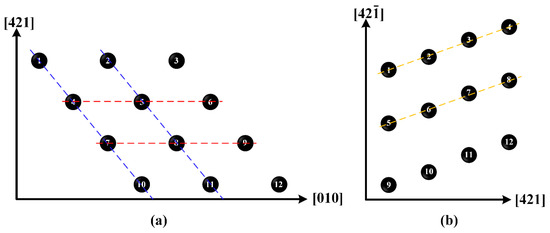
Figure 8.
Arrangement of calcium carbonate molecules on (a) top plane and (b) side plane.
In order to explain the anisotropic mechanical properties of single-crystal calcite, the atomic configurations of tensile deformation and failure processes along the and directions are given in Figure 9 and Figure 10, respectively. No defects occur at the elastic deformation stage along the and directions. Unlike the tensile failure case along the direction, there are a lot of voids that form in advance at the rapid stress reduction stage, as shown in Figure 9b. This phenomenon can also be explained by the arrangement of calcium carbonate molecules. As shown in Figure 8a, the calcium carbonate molecules in the dotted red lines, such as molecules 4, 5, and 6 or 7, 8, and 9, act as a close-packed plane, and are stretched in a direction just perpendicular to the close-packed plane, resulting in a direct separation between the two close-packed planes and the formation of voids. It is more similar to the tensile failure of single-crystal aragonite along the direction [53]. As the strain increases, the voids continue to grow up and phase transition takes place in the center of the model, as shown in Figure 9c. In the new phase, Ca–Ca has the nearest neighbor distance of 3.4 Å, which is different from the phase with the Ca–Ca nearest neighbor distance of 3.2 Å shown in Figure 4c.
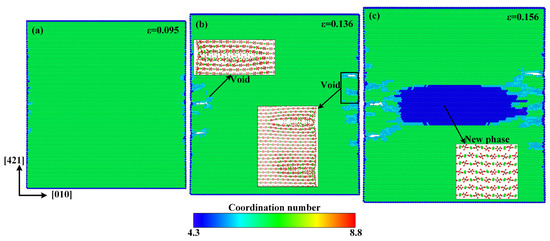
Figure 9.
Atomic configurations when the tensile strain along the direction reaches: (a) ε = 0.095, (b) ε = 0.136, and (c) ε = 0.156.

Figure 10.
Atomic configurations when the tensile strain along the direction reaches: (a) ε = 0.067, (b) ε = 0.095, and (c) ε = 0.119.
A similar quasi-brittle fracture can also be observed when the model is stretched along the direction. Compared with the atomic configuration at the elastic deformation stage shown in Figure 10a, some dislocations occur on both sides along the direction at the rapid stress-reduction stage, as shown in Figure 10b, and then rapidly multiply and are emitted to the center of the model at the failure stage, as shown in Figure 10c. As shown in Figure 8b, the calcium carbonate molecules in the dotted yellow lines, such as molecules 1, 2, 3, and 4; or 5, 6, 7, and 8, act as a close-packed plane. Different from the tensile failure cases along the and directions, there is no new phase to initiate in the whole tensile failure process along the direction.
The anisotropy of single-crystal calcite is not only reflected in the stress–strain curves, but also in the deformation and failure processes. When the model is stretched along the and directions, the rapid stress reduction is caused by dislocation initiation and subsequent phase transition and void formation. When the model is stretched along the direction, however, the stress drop is caused by dislocation initiation in both the sides parallel to the direction and then emission to the center of the model.
3.2. Influence of Temperature and Strain Rate
As with other inorganic materials, the mechanical properties of calcite are affected by temperature and strain rate [54,55]. In order to study the effect of temperature on the deformation behavior, the strain rate was fixed at 1 × 10⁸ s−1 but the temperature was changed from 10 K to 100 K, 200 K, 300 K, 400 K, and 500 K. Figure 11 shows the variations of fracture strength, fracture strain, and elastic modulus with temperature along the , , and directions. At 10 K, the fracture strength, fracture strain, and elastic modulus are 11.41 GPa, 0.140, and 76.35 GPa along the direction, respectively; they are 9.91 GPa, 0.149, and 66.34 GPa along the direction, respectively; but they are 6.82 GPa, 0.104, and 65.31 GPa along the direction, respectively. Obviously, the mechanical properties are significantly different along different directions, so they are strongly anisotropic. With elevated temperature, the fracture strength, fracture strain, and elastic modulus are all reduced. When the temperature is elevated from 10 K to 500 K, the fracture strength reduces by 32.3%, 34.1%, and 33.8% along the , , and directions, respectively, the fracture strain reduces by 23.3%, 22.6%, and 21.1%, respectively, and the elastic modulus reduces by 12.6%, 19.5%, and 19.1%, respectively.
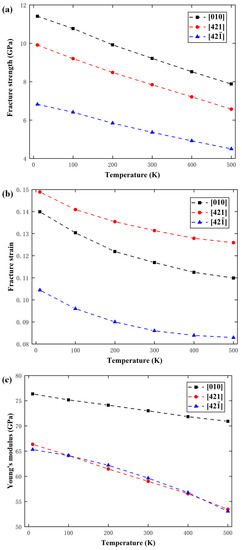
Figure 11.
Variations of (a) fracture strength, (b) fracture strain, and (c) elastic modulus with temperature.
In order to investigate the internal mechanisms of temperature effect, the atomic configurations at 100 K, 300 K, and 500 K when the tensile strain reaches 0.125 along the direction are given in Figure 12. It can be seen that when the temperature elevates from 100 K to 300 K and 500 K, the volume of the new phase expands rapidly, which should be the main reason for the decline of fracture strength, fracture strain, and elastic modulus caused by the elevated temperature.
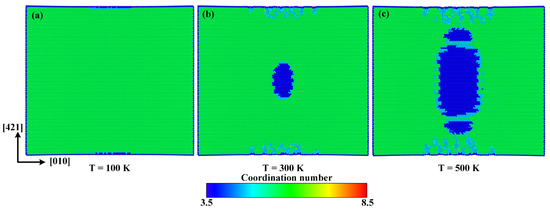
Figure 12.
Atomic configurations when the strain reaches 0.125 at (a) 100 K, (b) 300 K, and (c) 500 K, respectively.
In order to study the effect of strain rate on the mechanical properties of calcite, the temperature was fixed at 300 K, but the strain rate was changed from 0.00001 ps−1 to 0.0001 ps−1, 0.001 ps−1, 0.01 ps−1, and 0.1 ps−1. Figure 13 shows the variations of fracture strength, fracture strain, and elastic modulus with the strain rate along the , , and directions. It can be seen that with the increase of strain rate from 0.00001 ps−1 to 0.1 ps−1, the fracture strength along , , and directions increases by 10.8%, 14.4%, and 13.4% respectively, and the fracture strain along the directions increases by 16.6%, 15.6%, and 17.2% respectively. It can be seen that both the fracture strength and fracture strain increase monotonously with the increase of strain rate. However, the strain rate hardly has any effect on the elastic modulus.
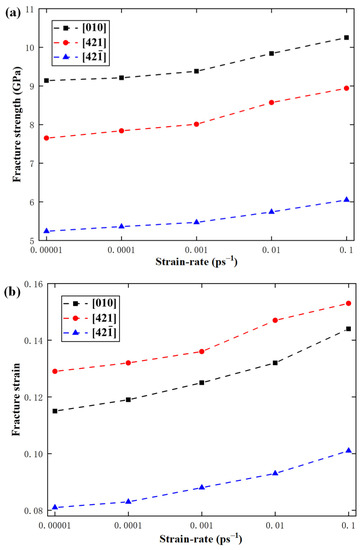
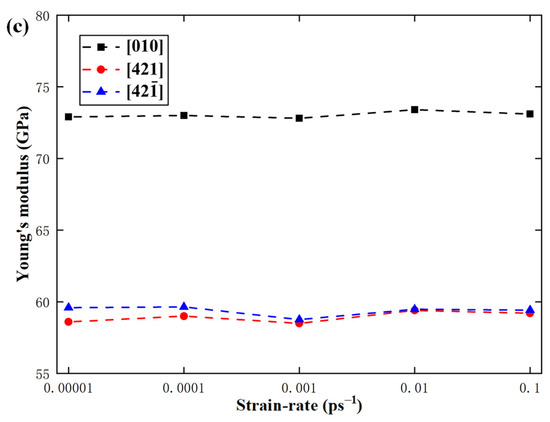
Figure 13.
Variations of (a) fracture strength, (b) fracture strain, and (c) elastic modulus with strain rate.
In order to investigate the internal mechanisms of strain rate effect, the atomic configurations with tensile strain of 0.125 along the direction are given in Figure 14 for strain rates of 0.00001 ps−1, 0.001 ps−1, and 0.1 ps−1. It can be seen that with the increase of strain rate, the volume of the new phase is noticeably reduced, which should be the main reason for the increase of the fracture strength and fracture strain caused by increasing strain rate. In general, the increase of strain rate leads to a shorter time for the atoms in calcite to respond to the load, so that they have less chance to overcome the energy barrier and destroy chemical bonds.
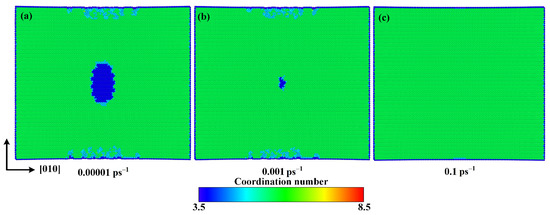
Figure 14.
Atomic configurations at 0.125 strain for strain rates of (a) 0.00001 ps−1, (b) 0.001 ps−1, and (c) 0.1 ps−1.
3.3. Fracture Dynamics Analysis
Fracture dynamics can explain the temperature and strain rate effects of bond failure through thermal activation. Arrhenius regarded the life cycle as the following function of tensile stress and temperature [56]:
where is the average vibration period of atoms, is the Boltzmann constant, is the dissociation energy of interatomic chemical bonds, is the activation volume, and is the local overstress coefficient.
In a uniaxial tensile process, the stress changes with time, that is . According to Bailey’s principle [57], the fracture time can be obtained by:
For linear elastic materials, we have:
By substituting Equations (4), (6), and (7) into Equation (5), the fracture strength can be given by:
where . This shows that there is a linear relationship between the fracture strength and the logarithmic strain rate when the temperature is fixed.
Equation (8) can be rewritten as:
If and [58], which is close to the average vibration period of solid atoms, would have a value between 26.02 and 26.71 when the temperature is changed from 10 K to 500 K. Therefore, is nearly temperature-independent in this temperature range [59]. Let , thus Equation (9) can be reduced to:
For calcium carbonate, . When , in Equation (8), which lies in the range of 0.0671 to 0.1137 GPa, given by the above MD simulations. In addition, in Equation (10), which is between and , given by the above MD simulations. Figure 15 and Figure 16 show the variations of calcite fracture strength with logarithmic strain rate and temperature along the , , and directions, respectively, with the predictions from Equations (8) and (10). Obviously, the MD simulations are in good agreement with the fracture dynamics analysis.
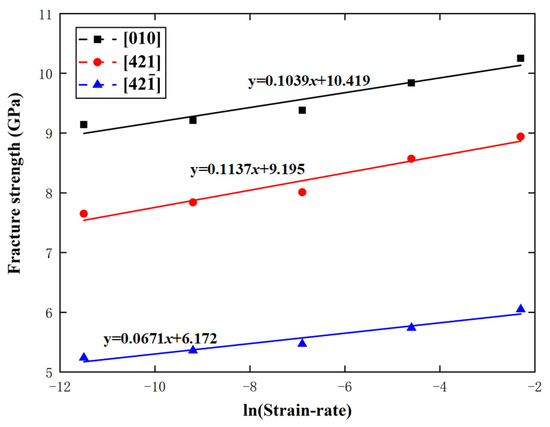
Figure 15.
Variations of fracture strength with logarithmic strain rate along the , , and directions.
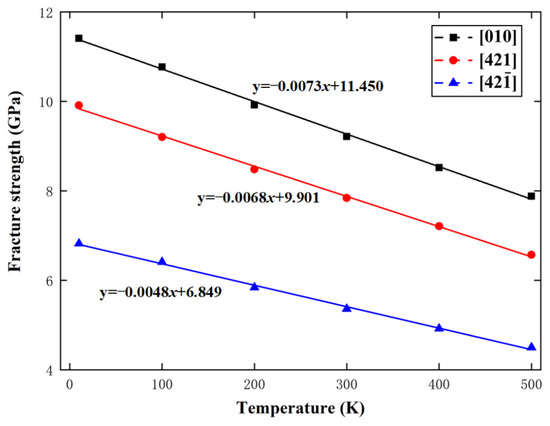
Figure 16.
Variations of fracture strength with temperature along the , , and directions.
4. Conclusions
In this paper, the mechanical properties of single-crystal calcite, as well as their temperature and strain-rate effects, were studied by MD simulations. Single-crystal calcite’s tensile failure behavior exhibits typical quasi-brittleness characteristics. The elastic moduli obtained by the simulations are very close to the experimental value, which confirms the reliability of MD simulations. The fracture strength, fracture strain, and elastic modulus are all highly anisotropic. The fracture strength and elastic modulus along the direction is much higher than those along the and directions. High anisotropy is caused by different failure and deformation mechanisms in different directions, including dislocation initiation and development, phase transition, and void formation. It is found that the fracture strength, fracture strain, and elastic modulus are all very sensitive to temperature, but only elastic modulus is not sensitive to strain rate. The variations of fracture strength with temperature and logarithmic strain rate are in good agreement with the predictions of fracture dynamics.
Author Contributions
Conceptualization, C.L. and X.Y.; methodology, C.L. and J.L.; software, C.L. and J.L.; Validation, X.Y.; formal analysis, X.Y.; investigation, C.L.; resources, C.L. and J.L.; data curation, C.L.; writing—original draft preparation, C.L.; writing—review and editing, X.Y.; funding acquisition, X.Y. All authors have read and agreed to the published version of the manuscript.
Funding
This work was supported by the National Natural Science Foundation of China (Grant Nos 12072120 and 11832013).
Institutional Review Board Statement
Not applicable.
Informed Consent Statement
Not applicable.
Data Availability Statement
The original contributions presented in the study are included in the article; further inquiries can be directed to the corresponding author.
Conflicts of Interest
The authors declare no conflict of interest.
References
- Kim, Y.Y.; Ribeiro, L.; Maillot, F.; Ward, O.; Eichhorn, S.J.; Meldrum, F.C. Bio-inspired synthesis and mechanical properties of calcite-polymer particle composites. Adv. Mater. 2010, 22, 2082–2086. [Google Scholar] [CrossRef] [PubMed]
- Marin, F.; Luquet, G.; Marie, B.; Medakovic, D. Molluscan Shell Proteins: Primary Structure, Origin, and Evolution. Curr. Top. Dev. Biol. 2007, 80, 209–276. [Google Scholar] [CrossRef]
- Li, J.; Jiang, H.; Ouyang, X.; Han, S.; Wang, J.; Xie, R.; Zhu, W.; Ma, N.; Wei, H.; Jiang, Z. CaCO3/Tetraethylenepentamine-Graphene Hollow Microspheres as Biocompatible Bone Drug Carriers for Controlled Release. ACS Appl. Mater. Interfaces 2016, 8, 30027–30036. [Google Scholar] [CrossRef] [PubMed]
- Ghosh, S.; Wu, V.; Pernal, S.; Uskokovic, V. Self-Setting Calcium Phosphate Cements with Tunable Antibiotic Release Rates for Advanced Antimicrobial Applications. ACS Appl. Mater. Interfaces 2016, 8, 7691–7708. [Google Scholar] [CrossRef]
- Chen, C.L.; Qi, J.; Zuckermann, R.N.; DeYoreo, J.J. Engineered biomimetic polymers as tunable agents for controlling CaCO3 mineralization. J. Am. Chem. Soc. 2011, 133, 5214–5217. [Google Scholar] [CrossRef]
- Tamimi, F.; Torres, J.; Al-Abedalla, K.; Lopez-Cabarcos, E.; Alkhraisat, M.H.; Bassett, D.C.; Gbureck, U.; Barralet, J.E. Osseointegration of dental implants in 3D-printed synthetic onlay grafts customized according to bone metabolic activity in recipient site. Biomaterials 2014, 35, 5436–5445. [Google Scholar] [CrossRef]
- Cusack, M.; Freer, A. Biomineralization: Elemental and organic influence in carbonate systems. Chem. Rev. 2008, 108, 4433–4454. [Google Scholar] [CrossRef]
- Rae Cho, K.; Kim, Y.Y.; Yang, P.; Cai, W.; Pan, H.; Kulak, A.N.; Lau, J.L.; Kulshreshtha, P.; Armes, S.P.; Meldrum, F.C.; et al. Direct observation of mineral-organic composite formation reveals occlusion mechanism. Nat. Commun. 2016, 7, 10187. [Google Scholar] [CrossRef]
- Kim, Y.Y.; Ganesan, K.; Yang, P.; Kulak, A.N.; Borukhin, S.; Pechook, S.; Ribeiro, L.; Kroger, R.; Eichhorn, S.J.; Armes, S.P.; et al. An artificial biomineral formed by incorporation of copolymer micelles in calcite crystals. Nat. Mater. 2011, 10, 890–896. [Google Scholar] [CrossRef]
- Wang, D.; Hamm, L.M.; Giuffre, A.J.; Echigo, T.; Rimstidt, J.D.; De Yoreo, J.J.; Grotzinger, J.; Dove, P.M. Revisiting geochemical controls on patterns of carbonate deposition through the lens of multiple pathways to mineralization. Faraday Discuss. 2012, 159, 371–386. [Google Scholar] [CrossRef][Green Version]
- King, H.E.; Mattner, D.C.; Plümper, O.; Geisler, T.; Putnis, A. Forming Cohesive Calcium Oxalate Layers on Marble Surfaces for Stone Conservation. Cryst. Growth Des. 2014, 14, 3910–3917. [Google Scholar] [CrossRef]
- Pike, A.W.; Hoffmann, D.L.; Garcia-Diez, M.; Pettitt, P.B.; Alcolea, J.; De Balbin, R.; Gonzalez-Sainz, C.; de las Heras, C.; Lasheras, J.A.; Montes, R.; et al. U-series dating of Paleolithic art in 11 caves in Spain. Science 2012, 336, 1409–1413. [Google Scholar] [CrossRef] [PubMed]
- Winograd, I.J.; Coplen, T.B.; Landwehr, J.M.; Riggs, A.C.; Ludwig, K.R.; Szabo, B.J.; Kolesar, P.T.; Revesz, K.M. Continuous 500,000-Year Climate Record from Vein Calcite in Devils Hole, Nevada. Science 1992, 258, 255–260. [Google Scholar] [CrossRef] [PubMed]
- Rink, W.J. Electron spin resonance (ESR) dating and ESR applications in quaternary science and archaeometry. Radiat. Meas. 1997, 27, 975–1025. [Google Scholar] [CrossRef]
- Gilbert, B.; Davies, M.J.; Murphy, D.M.; Ikeya, M. ESR Dating, Dosimetry and Microscopy for Terrestrial and Planetary Materials. ChemInform 2005, 36, 1–32. [Google Scholar]
- Huwald, E. Calcium carbonate—Pigment and filler. In Calcium Carbonate; Birkhäuser: Basel, Switzerland, 2001; pp. 160–170. [Google Scholar]
- Bridgman, P.W. The high pressure behavior of miscellaneous minerals. Am. J. Sci. 1939, 237, 7–18. [Google Scholar] [CrossRef]
- Tyburczy, J.A.; Ahrens, T.J. Dynamic compression and volatile release of carbonates. J. Geophys. Res. 1986, 91, 4730–4744. [Google Scholar] [CrossRef]
- Biellmann, C.; Guyot, F.; Gillet, P.; Reynard, B. High-pressure stability of carbonates; quenching of calcite-II, high-pressure polymorph of CaCO3. Eur. J. Mineral. 1993, 5, 503–510. [Google Scholar] [CrossRef]
- Fiquet, G.; Guyot, F.; Itie, J.P. High-pressure X-ray diffraction study of carbonates: MgCO3, CaMg(CO3)2, and CaCO3. Am. Mineral. 1994, 79, 15–23. [Google Scholar]
- Suito, K.; Namba, J.; Horikawa, T.; Taniguchi, Y.; Sakurai, N.; Kobayashi, M.; Onodera, A.; Shimomura, O.; Kikegawa, T. Phase relations of CaCO3 at high pressure and high temperature. Am. Mineral. 2001, 86, 997–1002. [Google Scholar] [CrossRef]
- Ivanov, B.A.; Deutsch, A. The phase diagram of CaCO3 in relation to shock compression and decomposition. Phys. Earth Planet. Inter. 2002, 129, 131–143. [Google Scholar] [CrossRef]
- Ono, S.; Kikegawa, T.; Ohishi, Y. High-pressure transition of CaCO3. Am. Mineral. 2007, 92, 1246–1249. [Google Scholar] [CrossRef]
- Oganov, A.R.; Glass, C.W.; Ono, S. High-pressure phases of CaCO3: Crystal structure prediction and experiment. Earth Planet. Sci. Lett. 2006, 241, 95–103. [Google Scholar] [CrossRef]
- Liu, J.; Duan, C.G.; Ossowski, M.M.; Mei, W.N.; Smith, R.W.; Hardy, J.R. Simulation of structural phase transition in NaNO3 and CaCO3. Phys. Chem. Miner. 2001, 28, 586–590. [Google Scholar] [CrossRef]
- Bearchell, C.A.; Heyes, D.M. Molecular modelling studies of calcium carbonate and its nanoparticles. Mol. Simul. 2002, 28, 517–538. [Google Scholar] [CrossRef]
- Akiyama, T.; Nakamura, K.; Ito, T. Effects of Atomic Arrangements on Structural Stability and Electronic Structures of Twin Boundary Interfaces in CaCO3 Calcite. J. Phys. Chem. C 2011, 116, 987–993. [Google Scholar] [CrossRef]
- Akiyama, T.; Nakamura, K.; Ito, T. Atomic and electronic structures of CaCO3 surfaces. Phys. Rev. B Condens. Matter. 2011, 84, 49–51. [Google Scholar] [CrossRef]
- Sokolá, R.; Vodová, L.; Grygarová, S.; Štubňa, I.; Šín, P. Mechanical properties of ceramic bodies based on calcite waste. Ceram. Int. 2012, 38, 6607–6612. [Google Scholar] [CrossRef]
- Kunitake, M.E.; Mangano, L.M.; Peloquin, J.M.; Baker, S.P.; Estroff, L.A. Evaluation of strengthening mechanisms in calcite single crystals from mollusk shells. Acta Biomater. 2013, 9, 5353–5359. [Google Scholar] [CrossRef]
- Schuster, R.; Schafler, E.; Schell, N.; Kunz, M.; Abart, R. Microstructure of calcite deformed by high-pressure torsion: An X-ray line profile study. Tectonophysics 2017, 721, 448–461. [Google Scholar] [CrossRef]
- Dick, B.G.; Overhauser, A.W. Theory of the Dielectric Constants of Alkali Halide Crystals. Phys. Rev. 1958, 112, 90–103. [Google Scholar] [CrossRef]
- Yip, S. Handbook of Materials Modeling: Methods. Mater. Today 2005, 8, 345–348. [Google Scholar]
- Dove, M.T.; Winkler, B.; Leslie, M.; Harris, M.J.; Salje, E.K. A new interatomic potential model for calcite; applications to lattice dynamics studies, phase transition, and isotope fractionation. Am. Mineral. 1992, 77, 244–250. [Google Scholar]
- Pavese, A.; Catti, M.; Price, G.D.; Jackson, R.A. Interatomic potentials for CaCO3 polymorphs (calcite and aragonite), fitted to elastic and vibrational data. Phys. Chem. Miner. 1992, 19, 80–87. [Google Scholar] [CrossRef]
- Jackson, R.A.; Price, G.D. A Transferable Interatomic Potential for Calcium Carbonate. Mol. Simul. 1992, 9, 175–177. [Google Scholar] [CrossRef]
- Catti, M.; Pavese, A.; Price, G.D. Thermodynamic properties of CaCO3 calcite and aragonite: A quasi-harmonic calculation. Phys. Chem. Miner. 1993, 19, 472–479. [Google Scholar] [CrossRef]
- Jackson, R.A.; Meenan, P.A.; Price, G.D.; Roberts, K.J.; Telfer, G.B.; Wilde, P.J. Deriving empirical potentials for molecular ionic materials. Mineral. Mag. 1995, 59, 617–622. [Google Scholar] [CrossRef]
- Jackson, R.A. Computer modelling of molecular ionic materials. Curr. Opin. Solid State Mater. Sci. 2001, 5, 463–467. [Google Scholar] [CrossRef]
- Braybrook, A.L.; Heywood, B.R.; Jackson, R.A.; Pitt, K. Parallel computational and experimental studies of the morphological modification of calcium carbonate by cobalt. J. Cryst. Growth 2002, 243, 336–344. [Google Scholar] [CrossRef]
- Pavese, A.; Catti, M.; Parker, S.C.; Wall, A. Modelling of the thermal dependence of structural and elastic properties of calcite, CaCO3. Phys. Chem. Miner. 1996, 23, 89–93. [Google Scholar] [CrossRef]
- Fisler, D.K.; Gale, J.D.; Cygan, R.T. A shell model for the simulation of rhombohedral carbonate minerals and their point defects. Am. Mineral. 2000, 85, 217–224. [Google Scholar] [CrossRef]
- Archer, T.D.; Birse, S.; Dove, M.T.; Redfern, S.; Gale, J.D.; Cygan, R.T. An interatomic potential model for carbonates allowing for polarization effects. Phys. Chem. Miner. 2003, 30, 416–424. [Google Scholar] [CrossRef]
- Graf, D.L. Crystallographic tables for the rhombohedral carbonates. Am. Mineral. 1961, 46, 1283–1316. [Google Scholar]
- Plimpton, S. Fast Parallel Algorithms for Short-Range Molecular Dynamics. J. Comput. Phys. 1995, 117, 1–19. [Google Scholar] [CrossRef]
- Hockney, R.W.; Eastwood, J.W. Computer Simulation Using Particles; CRC Press: Boca Raton, FL, USA, 1988; p. 540. [Google Scholar]
- Polishchuk, I.; Bracha, A.A.; Bloch, L.; Levy, D.; Kozachkevich, S.; Etinger-Geller, Y.; Kauffmann, Y.; Burghammer, M.; Giacobbe, C.; Villanova, J. Coherently aligned nanoparticles within a biogenic single crystal: A biological prestressing strategy. Science 2017, 358, 1294–1298. [Google Scholar] [CrossRef]
- Kabacinska, Z.; Yate, L.; Wencka, M.; Krzyminiewski, R.; Tadyszak, K.; Coy, E. Nanoscale Effects of Radiation (UV, X-ray, and γ) on Calcite Surfaces: Implications for its Mechanical and Physico-Chemical Properties. J. Phys. Chem. C 2017, 121, 13357–13369. [Google Scholar] [CrossRef]
- Orme, C.A.; Noy, A.; Wierzbicki, A.; McBride, M.T.; Grantham, M.; Teng, H.H.; Dove, P.M.; DeYoreo, J.J. Formation of chiral morphologies through selective binding of amino acids to calcite surface steps. Nature 2001, 411, 775–779. [Google Scholar] [CrossRef]
- Titiloye, J.O.; Parker, S.C.; Mann, S. Atomistic simulation of calcite surfaces and the influence of growth additives on their morphology. J. Cryst. Growth 1993, 131, 533–545. [Google Scholar] [CrossRef]
- Sekkal, W.; Zaoui, A. Nanoscale analysis of the morphology and surface stability of calcium carbonate polymorphs. Sci. Rep. 2013, 3, 1587. [Google Scholar] [CrossRef]
- Ihli, J.; Clark, J.N.; Côté, A.; Kim, Y.Y.; Schenk, A.S.; Kulak, A.N.; Comyn, T.P.; Chammas, O.; Harder, R.J.; Duffy, D.M. Strain-relief by single dislocation loops in calcite crystals grown on self-assembled monolayers. Nat. Commun. 2016, 7, 11878. [Google Scholar] [CrossRef]
- Zhang, N.; Hong, Y.; Chen, Y. Dynamic crack propagation behaviors of calcium carbonate: Aragonite. J. Mater. Sci. 2019, 54, 2779–2786. [Google Scholar] [CrossRef]
- Zhou, J.; Liang, Y. Effect of Water on the Dynamic Tensile Mechanical Properties of Calcium Silicate Hydrate: Based on Molecular Dynamics Simulation. Materials 2019, 12, 2837. [Google Scholar] [CrossRef] [PubMed]
- Hao, X.; Lin, W.; Jia, F.; Li, W.; Wang, Z. Temperature Effects on Tensile and Compressive Mechanical Behaviors of C-S-H Structure via Atomic Simulation. J. Nanomater. 2017, 2017, 8476258. [Google Scholar]
- Zhao, H.; Aluru, N.R. Temperature and strain-rate dependent fracture strength of graphene. J. Appl. Phys. 2010, 108, 064321. [Google Scholar] [CrossRef]
- Bailey, J. An attempt to correlate some tensile strength measurements on glass III. Glass Ind. 1939, 20, 21. [Google Scholar]
- Zhurkov, S. Thermofluctuation mechanism of fracture. Int. J. Fract. Mech. 1965, 1, 311–323. [Google Scholar] [CrossRef]
- Slutsker, A.I.; Betekhtin, V.I.; Lee, J.C.; Yusupov, D.; Kadomtsev, A.G.; Amosova, O.V. Temperature dependence of rupture strength of the amorphous alloy Ni82.1Cr7.8Si4.6Fe3.1Mn0.3Al0.1Cu<0.1B2. Acta Mater. 2004, 52, 2733–2738. [Google Scholar] [CrossRef]
Publisher’s Note: MDPI stays neutral with regard to jurisdictional claims in published maps and institutional affiliations. |
© 2022 by the authors. Licensee MDPI, Basel, Switzerland. This article is an open access article distributed under the terms and conditions of the Creative Commons Attribution (CC BY) license (https://creativecommons.org/licenses/by/4.0/).