
Destructive and Non-Destructive Evaluation of Fibre-Reinforced Concrete: A Comprehensive Study of Mechanical Properties


Abstract
:1. Introduction
2. Research Significance
3. Materials and Methods
3.1. Material Properties
3.1.1. Cement
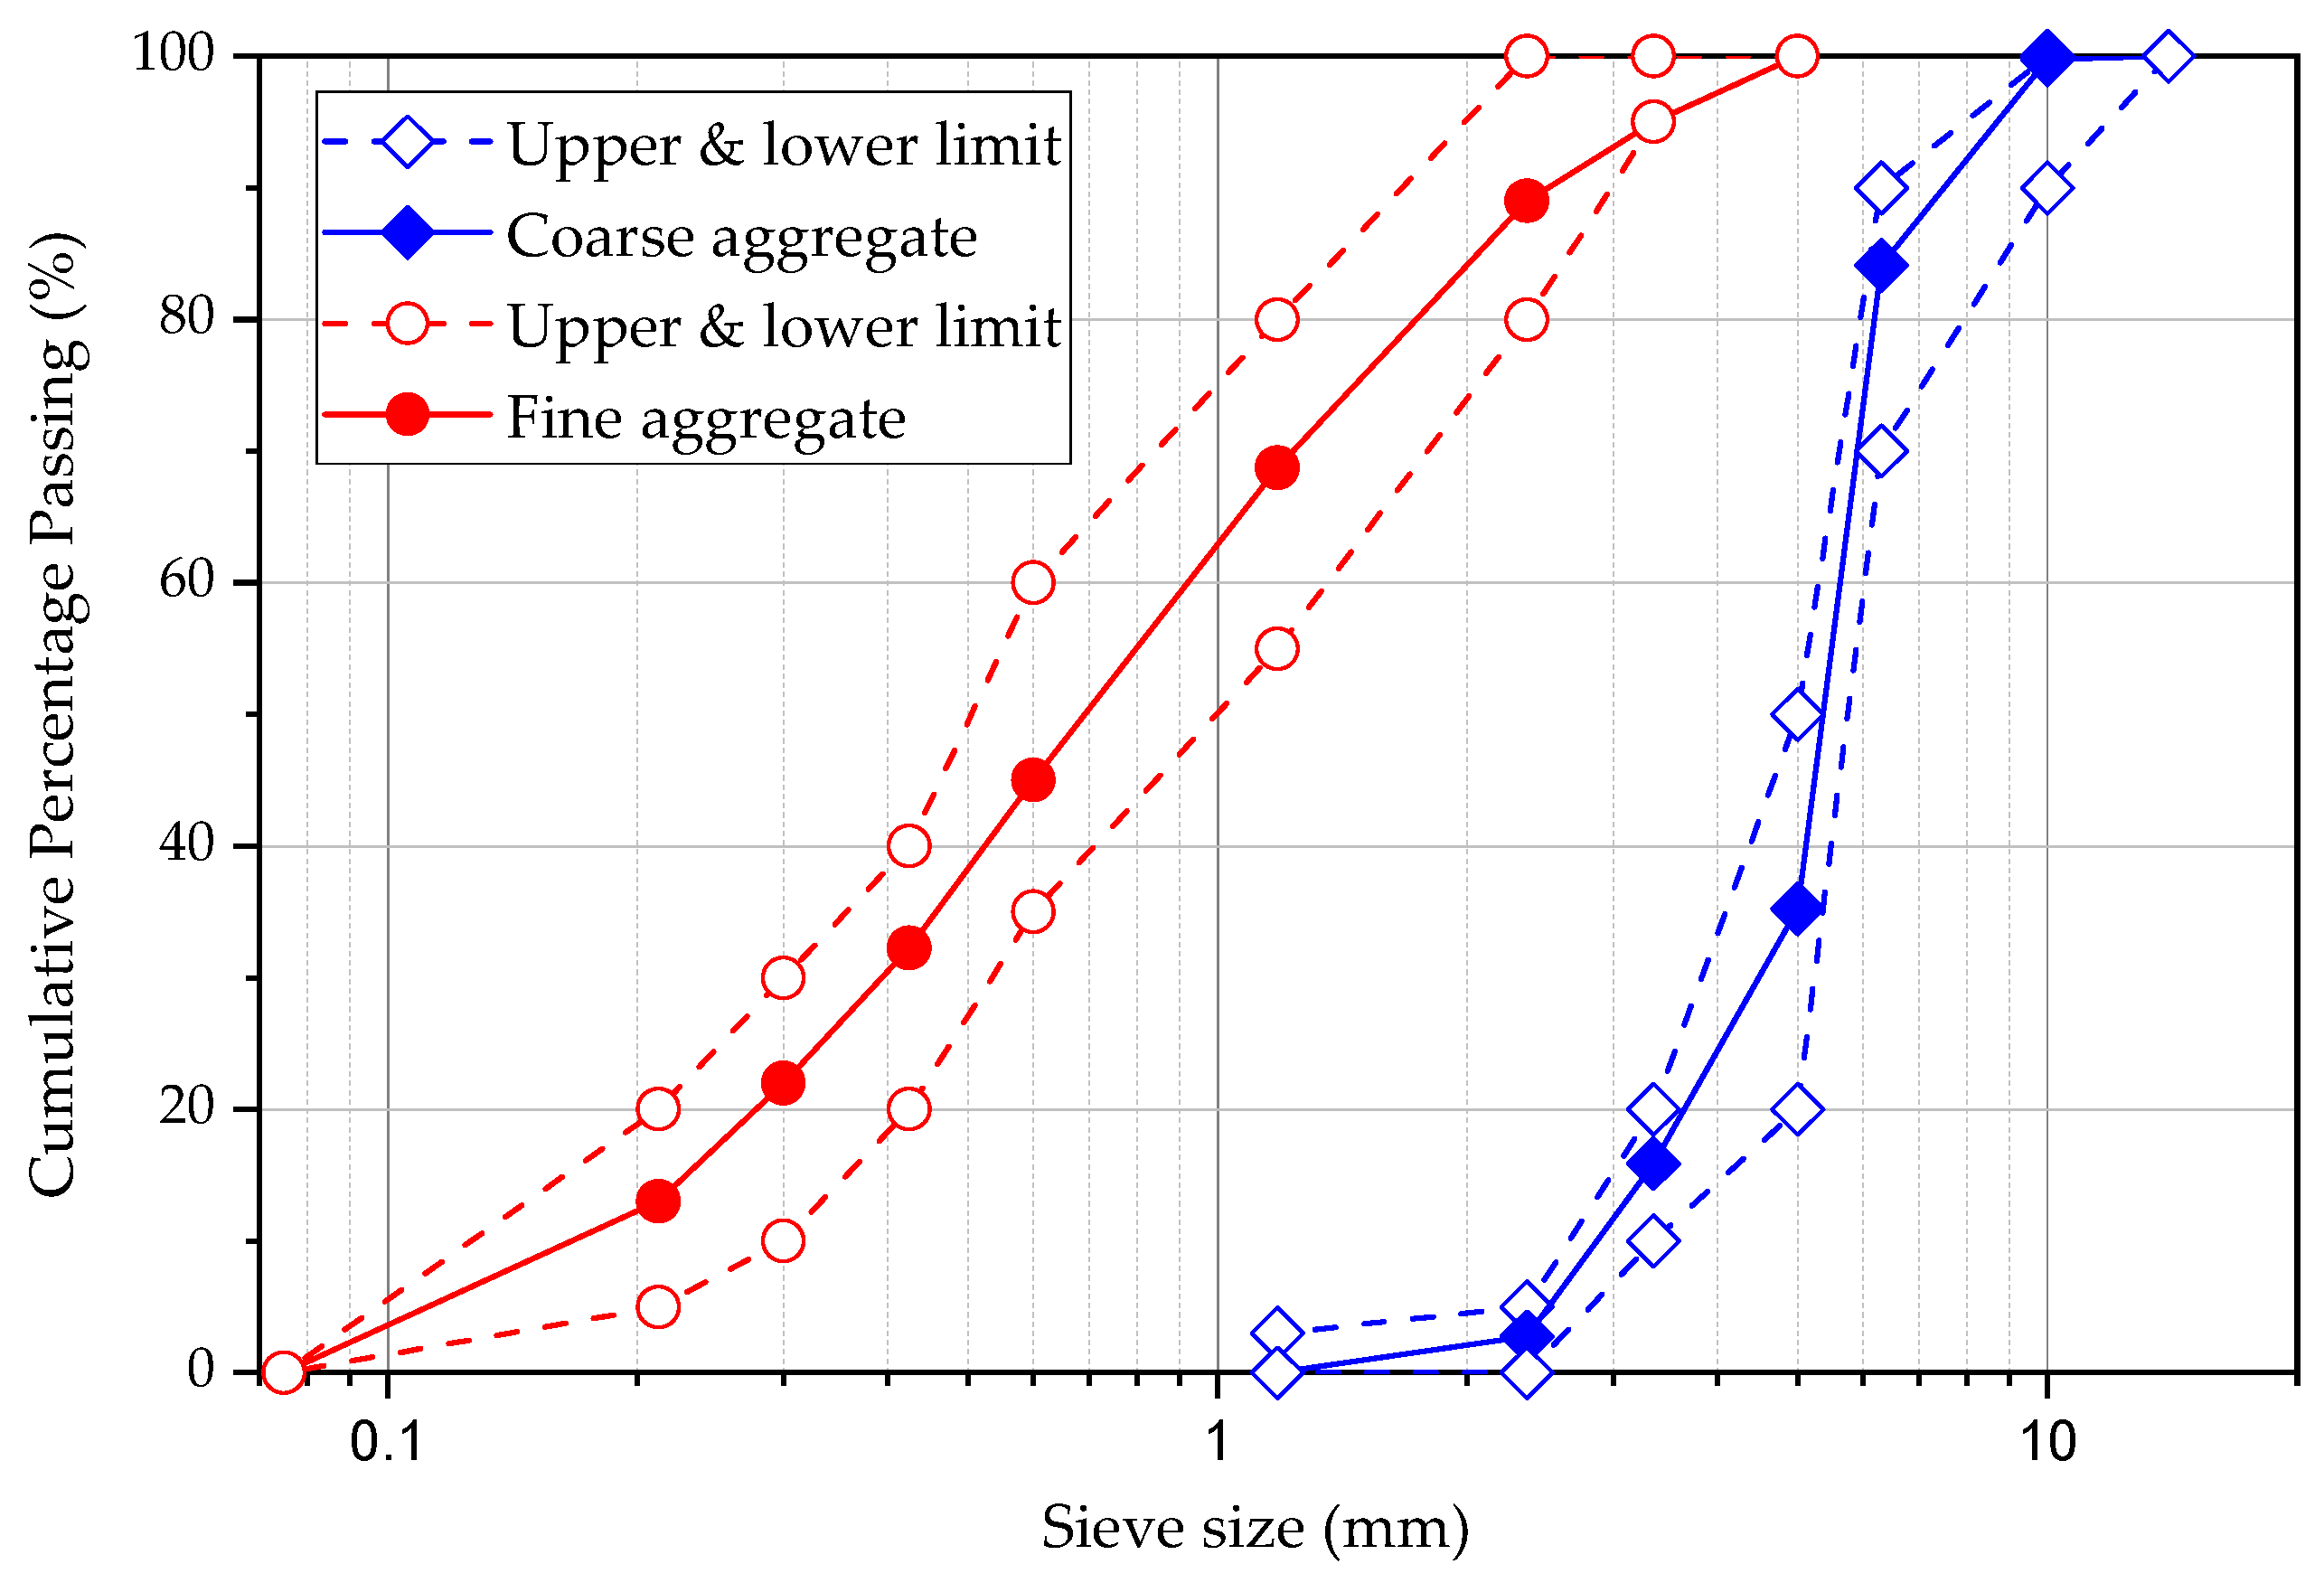
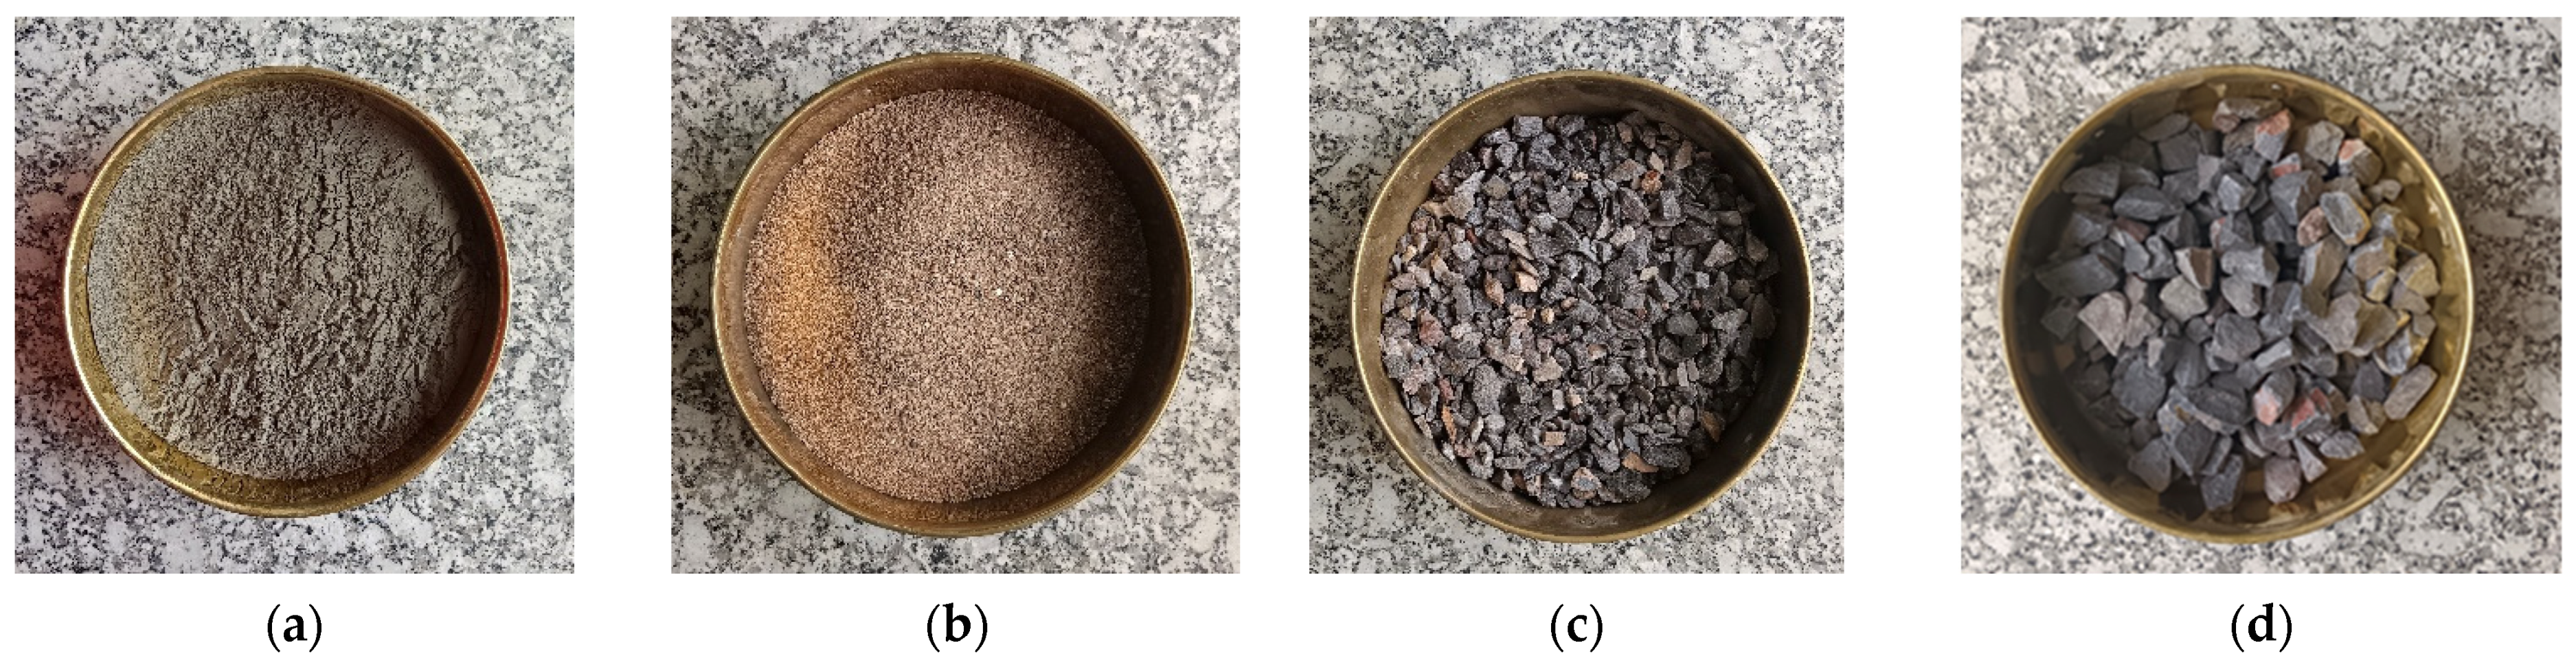
3.1.2. Aggregate
3.1.3. Steel Fibres
3.2. Mixture Proportions
3.2.1. Mixing Procedure
3.2.2. Dimensions of Specimens
3.3. Test Procedure
3.3.1. Curing Procedure
3.3.2. Compression Test
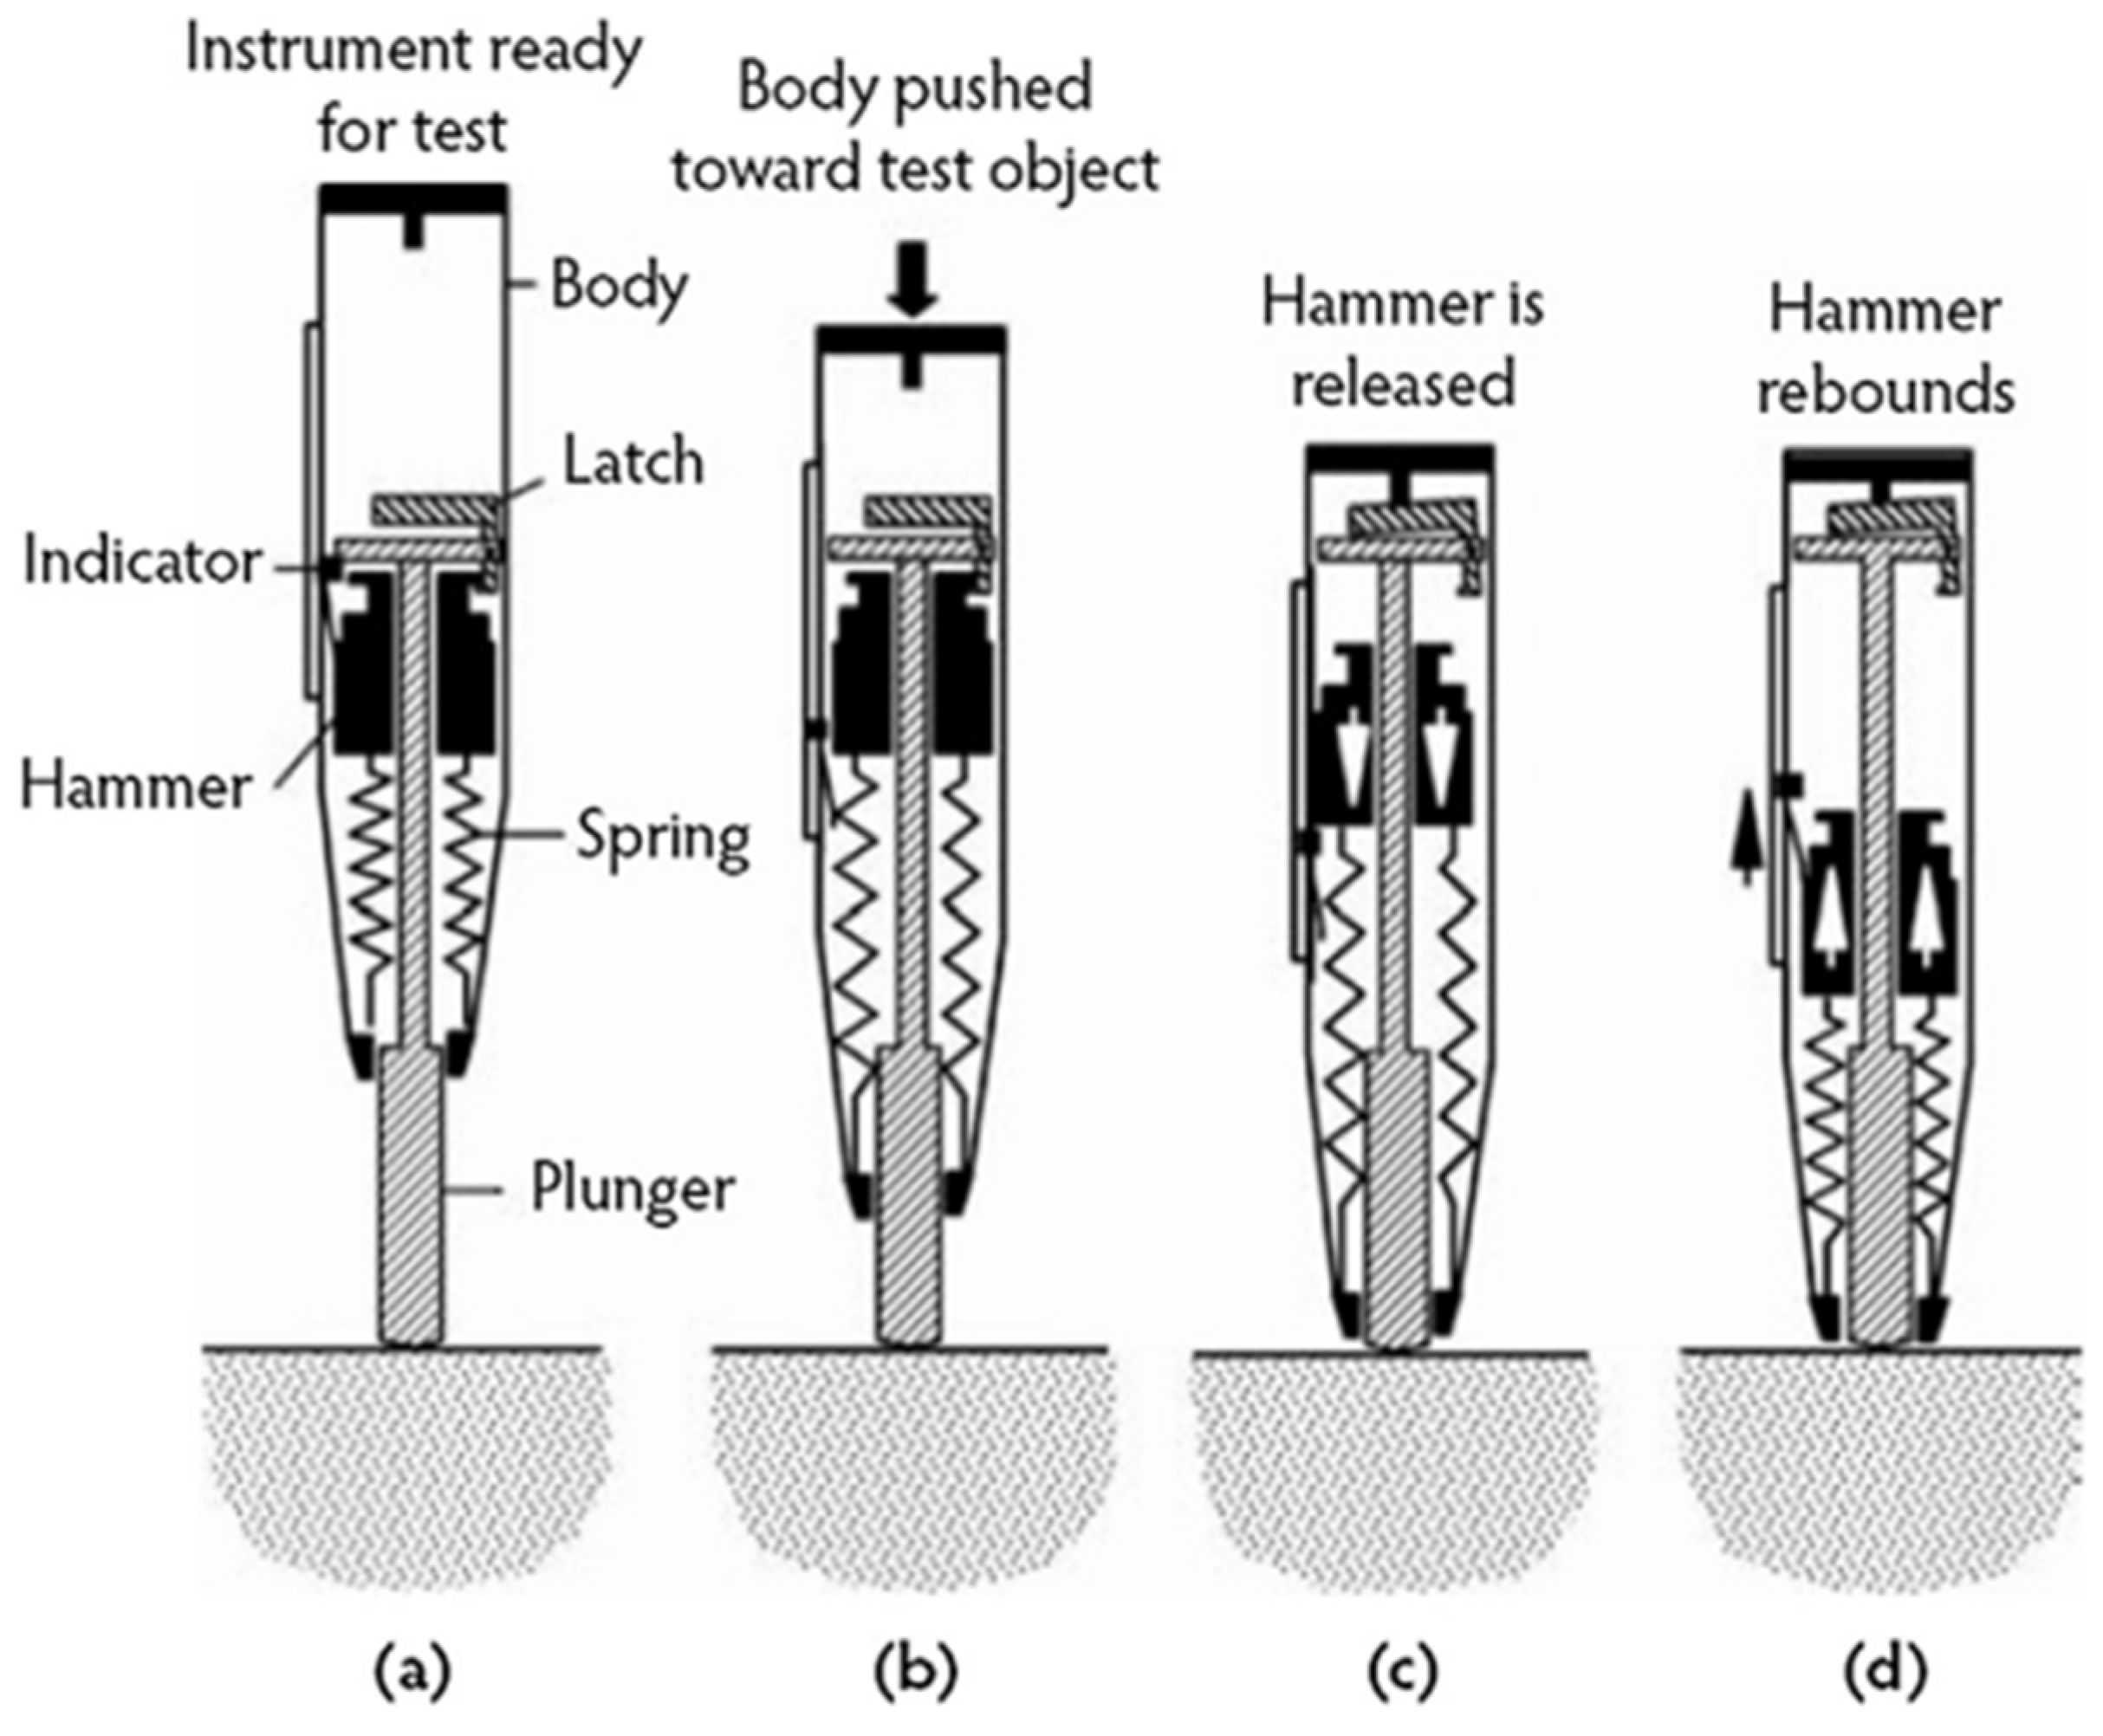
3.3.3. Rebound Hammer Test
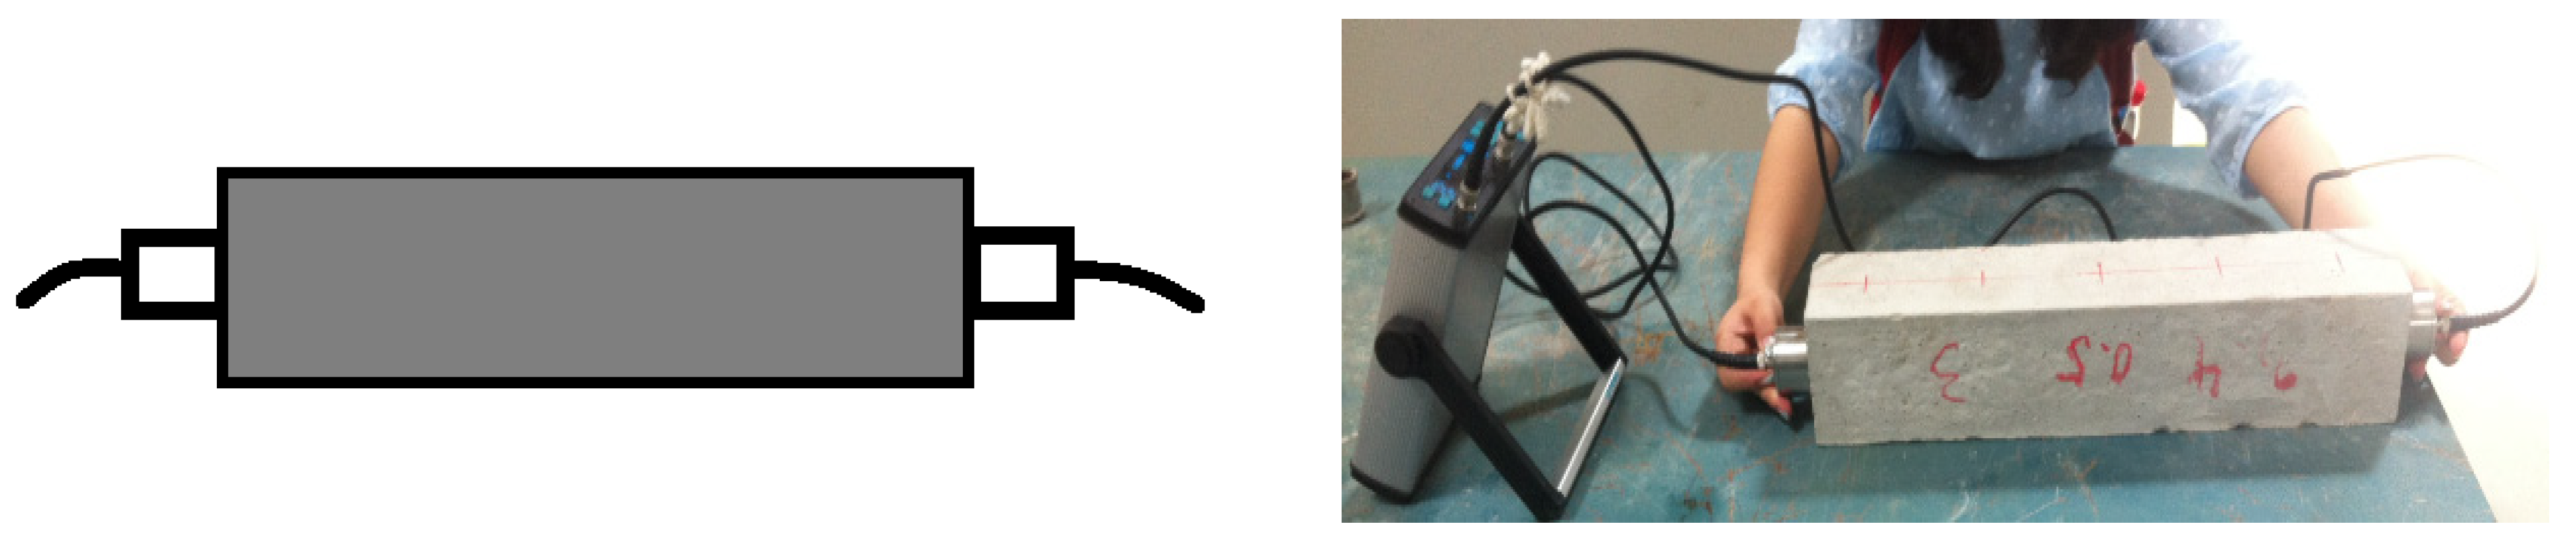
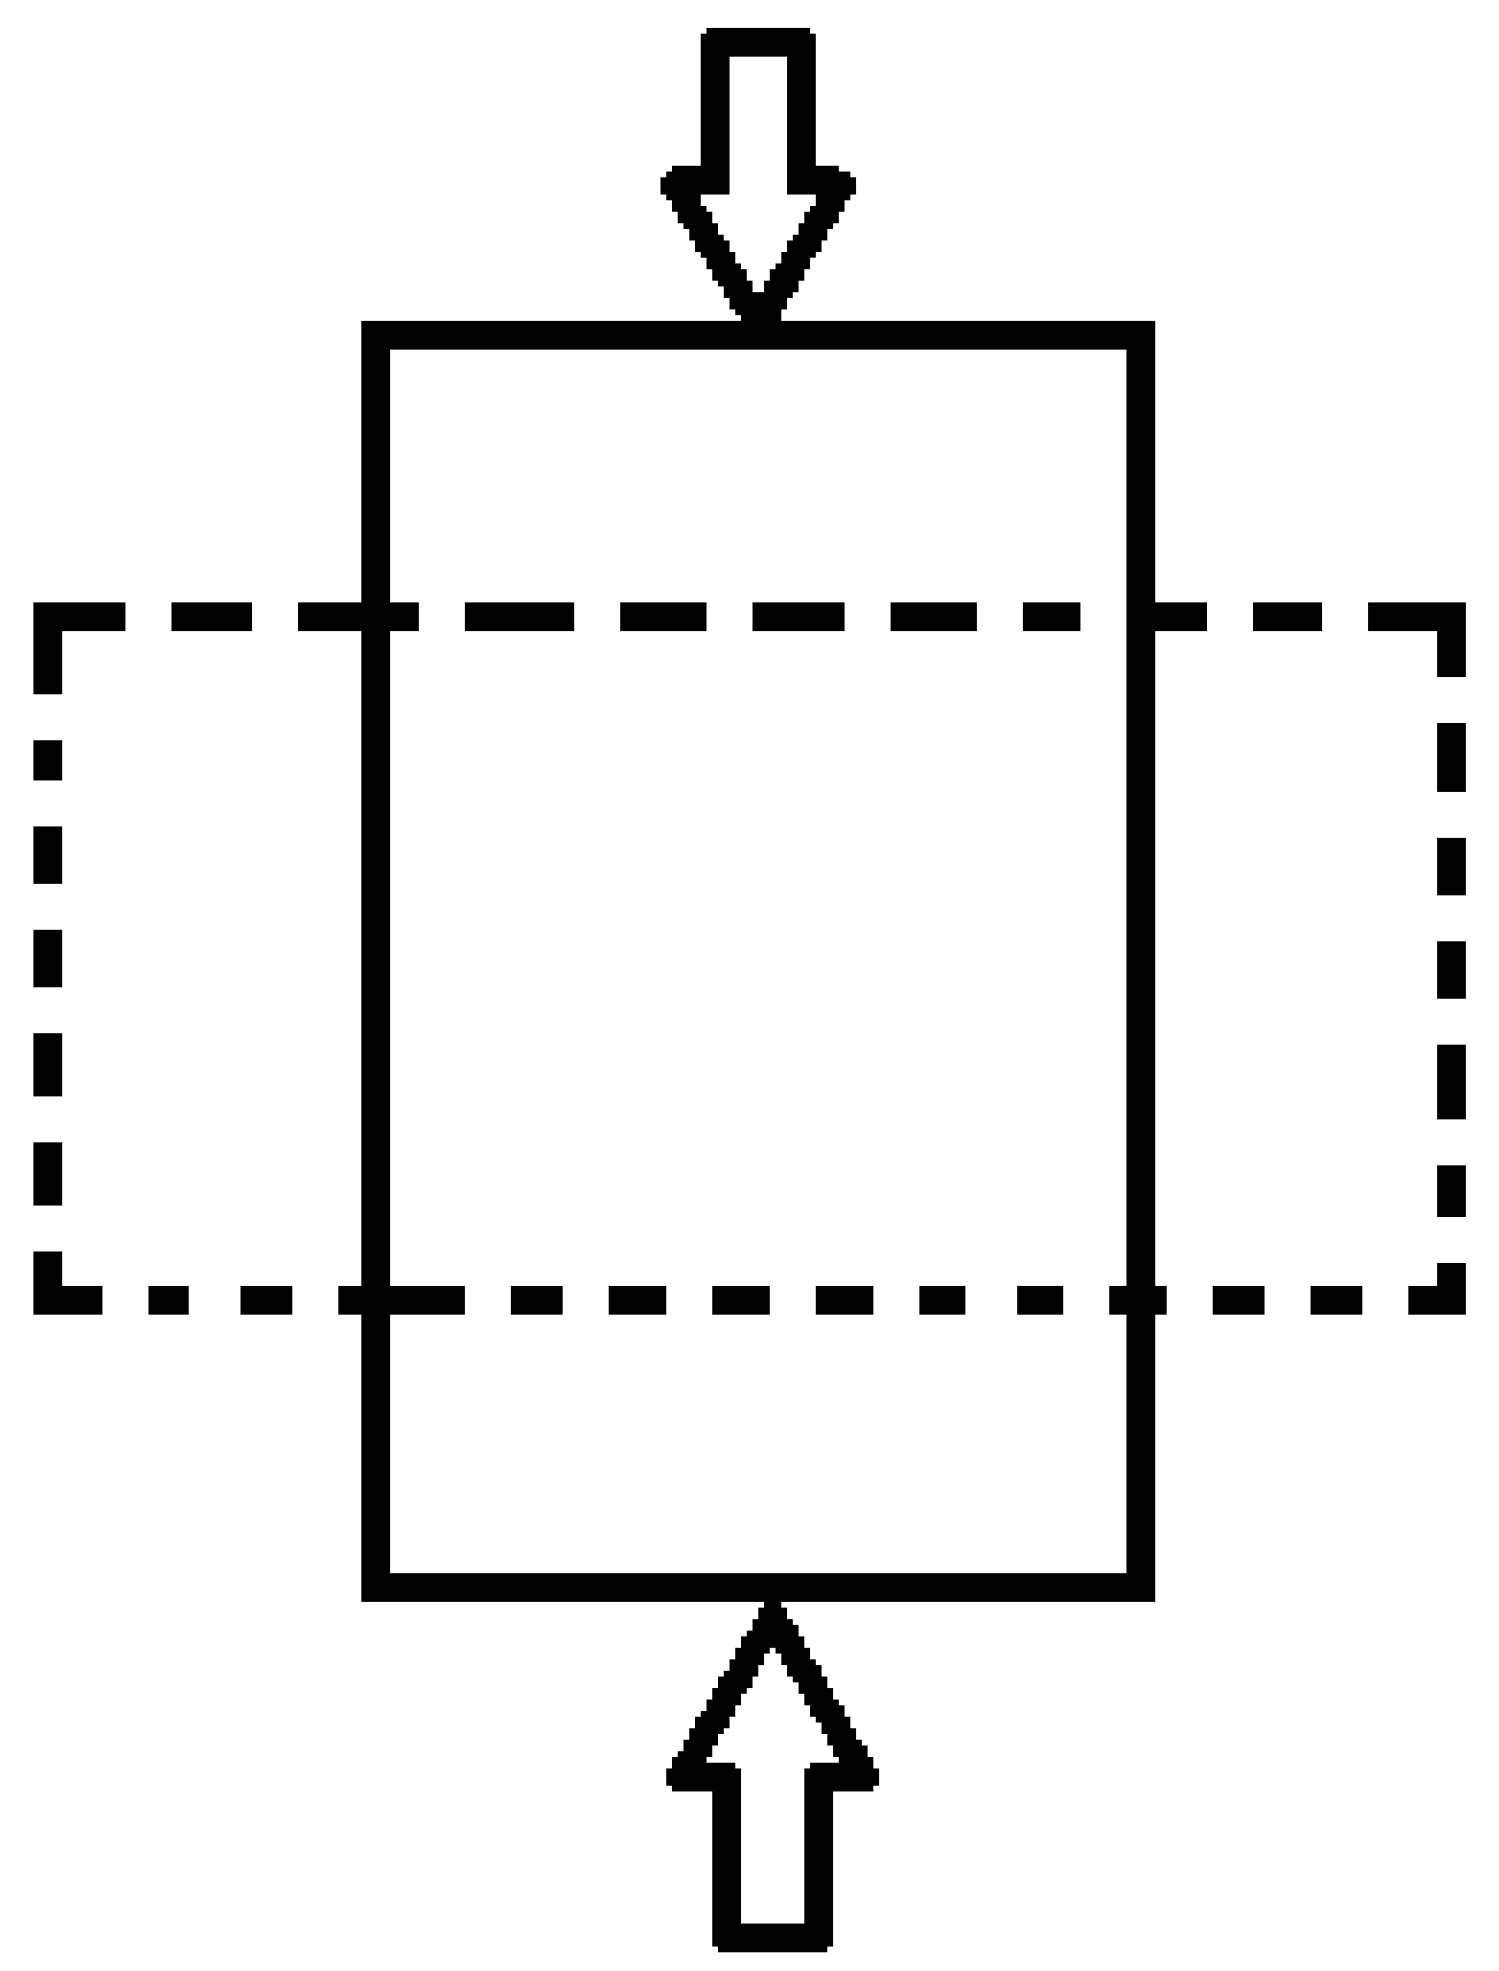
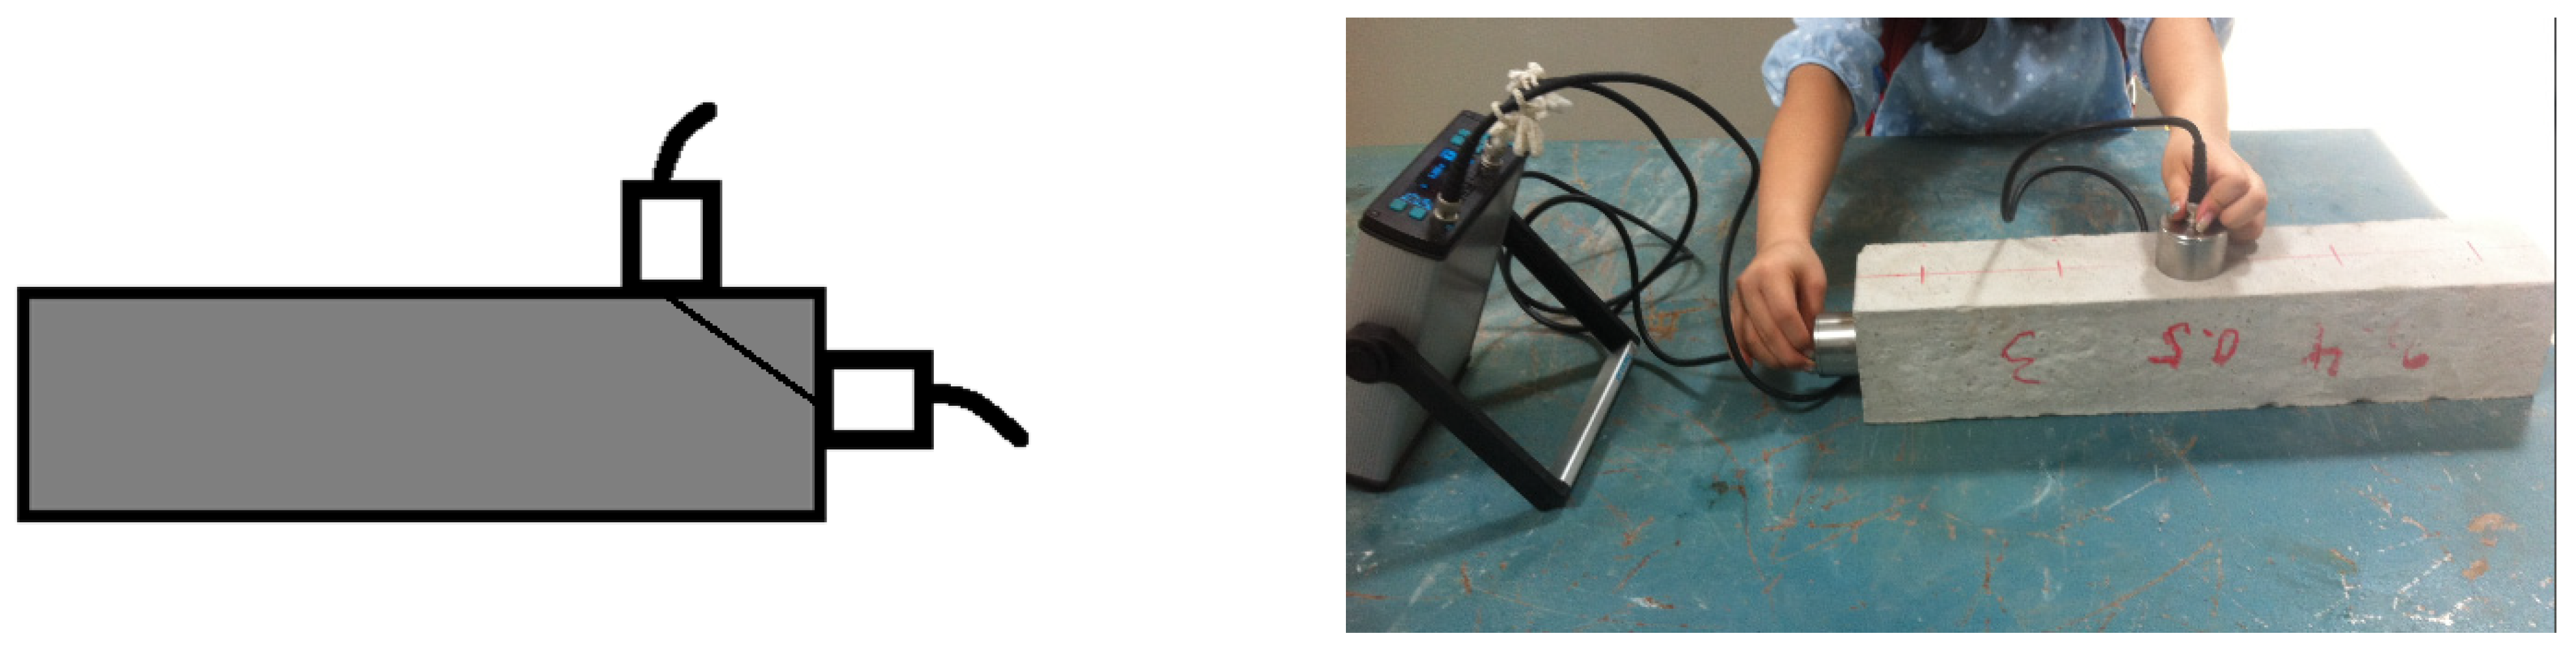
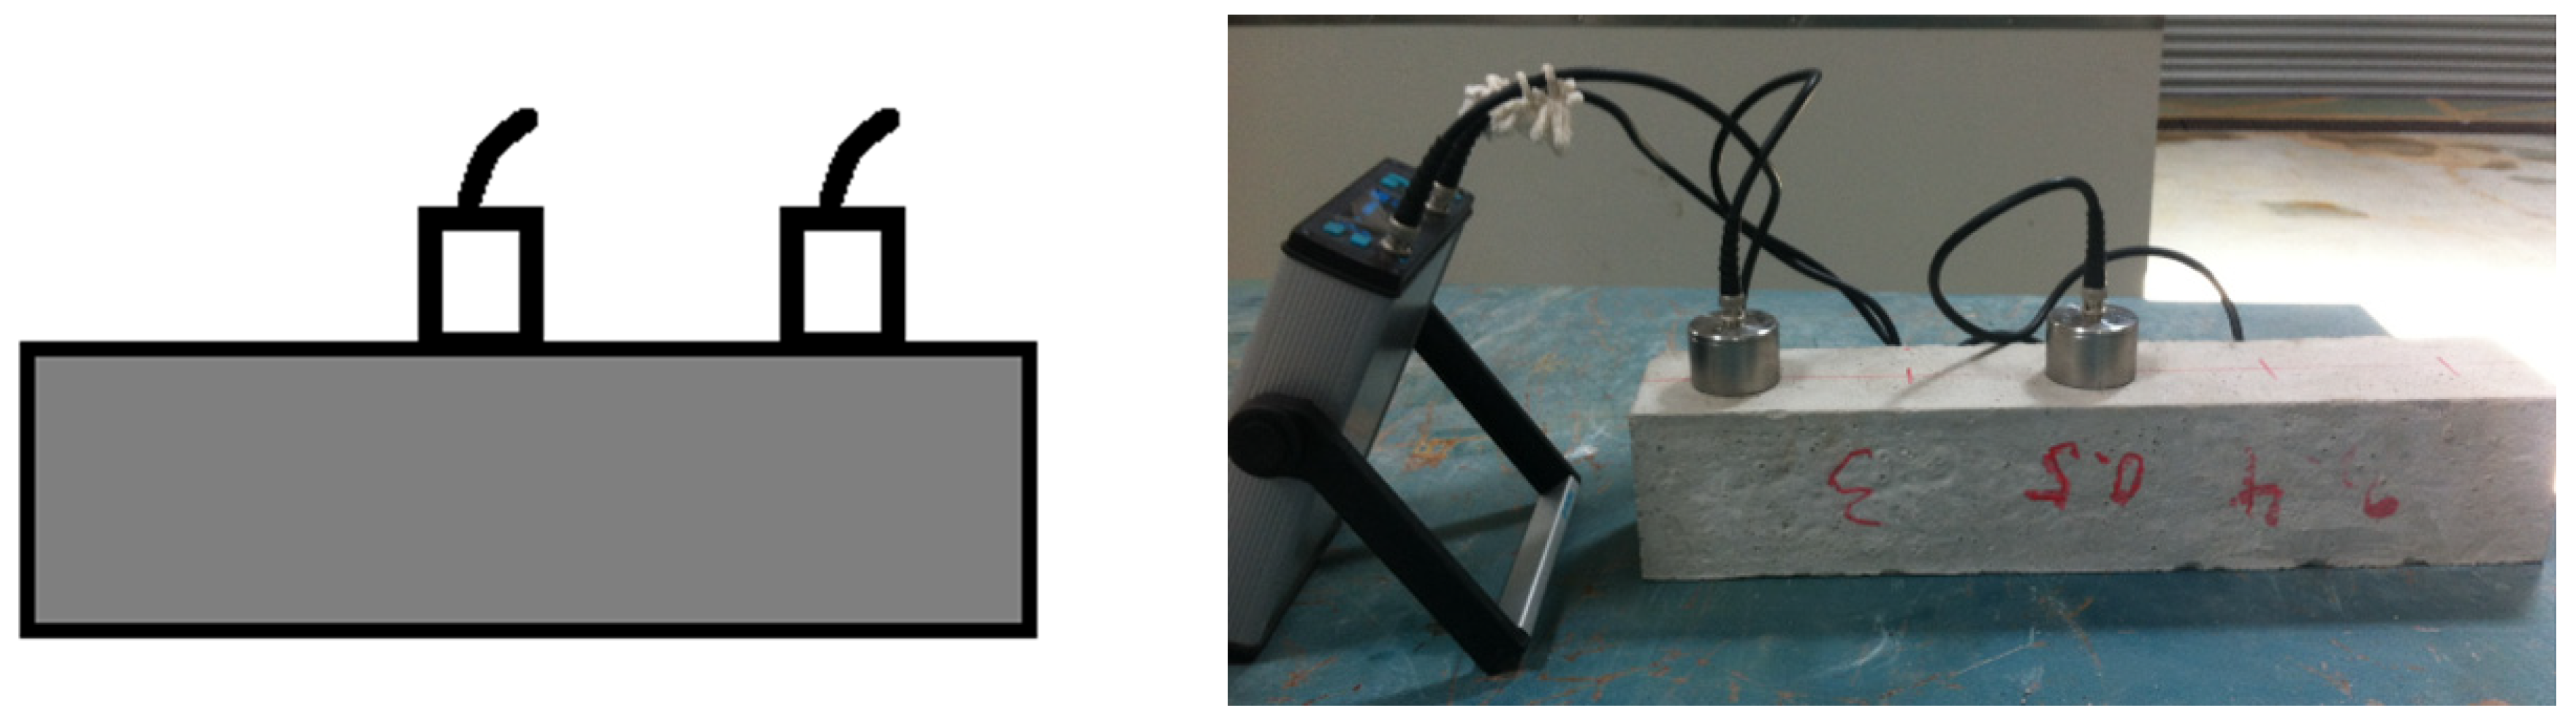
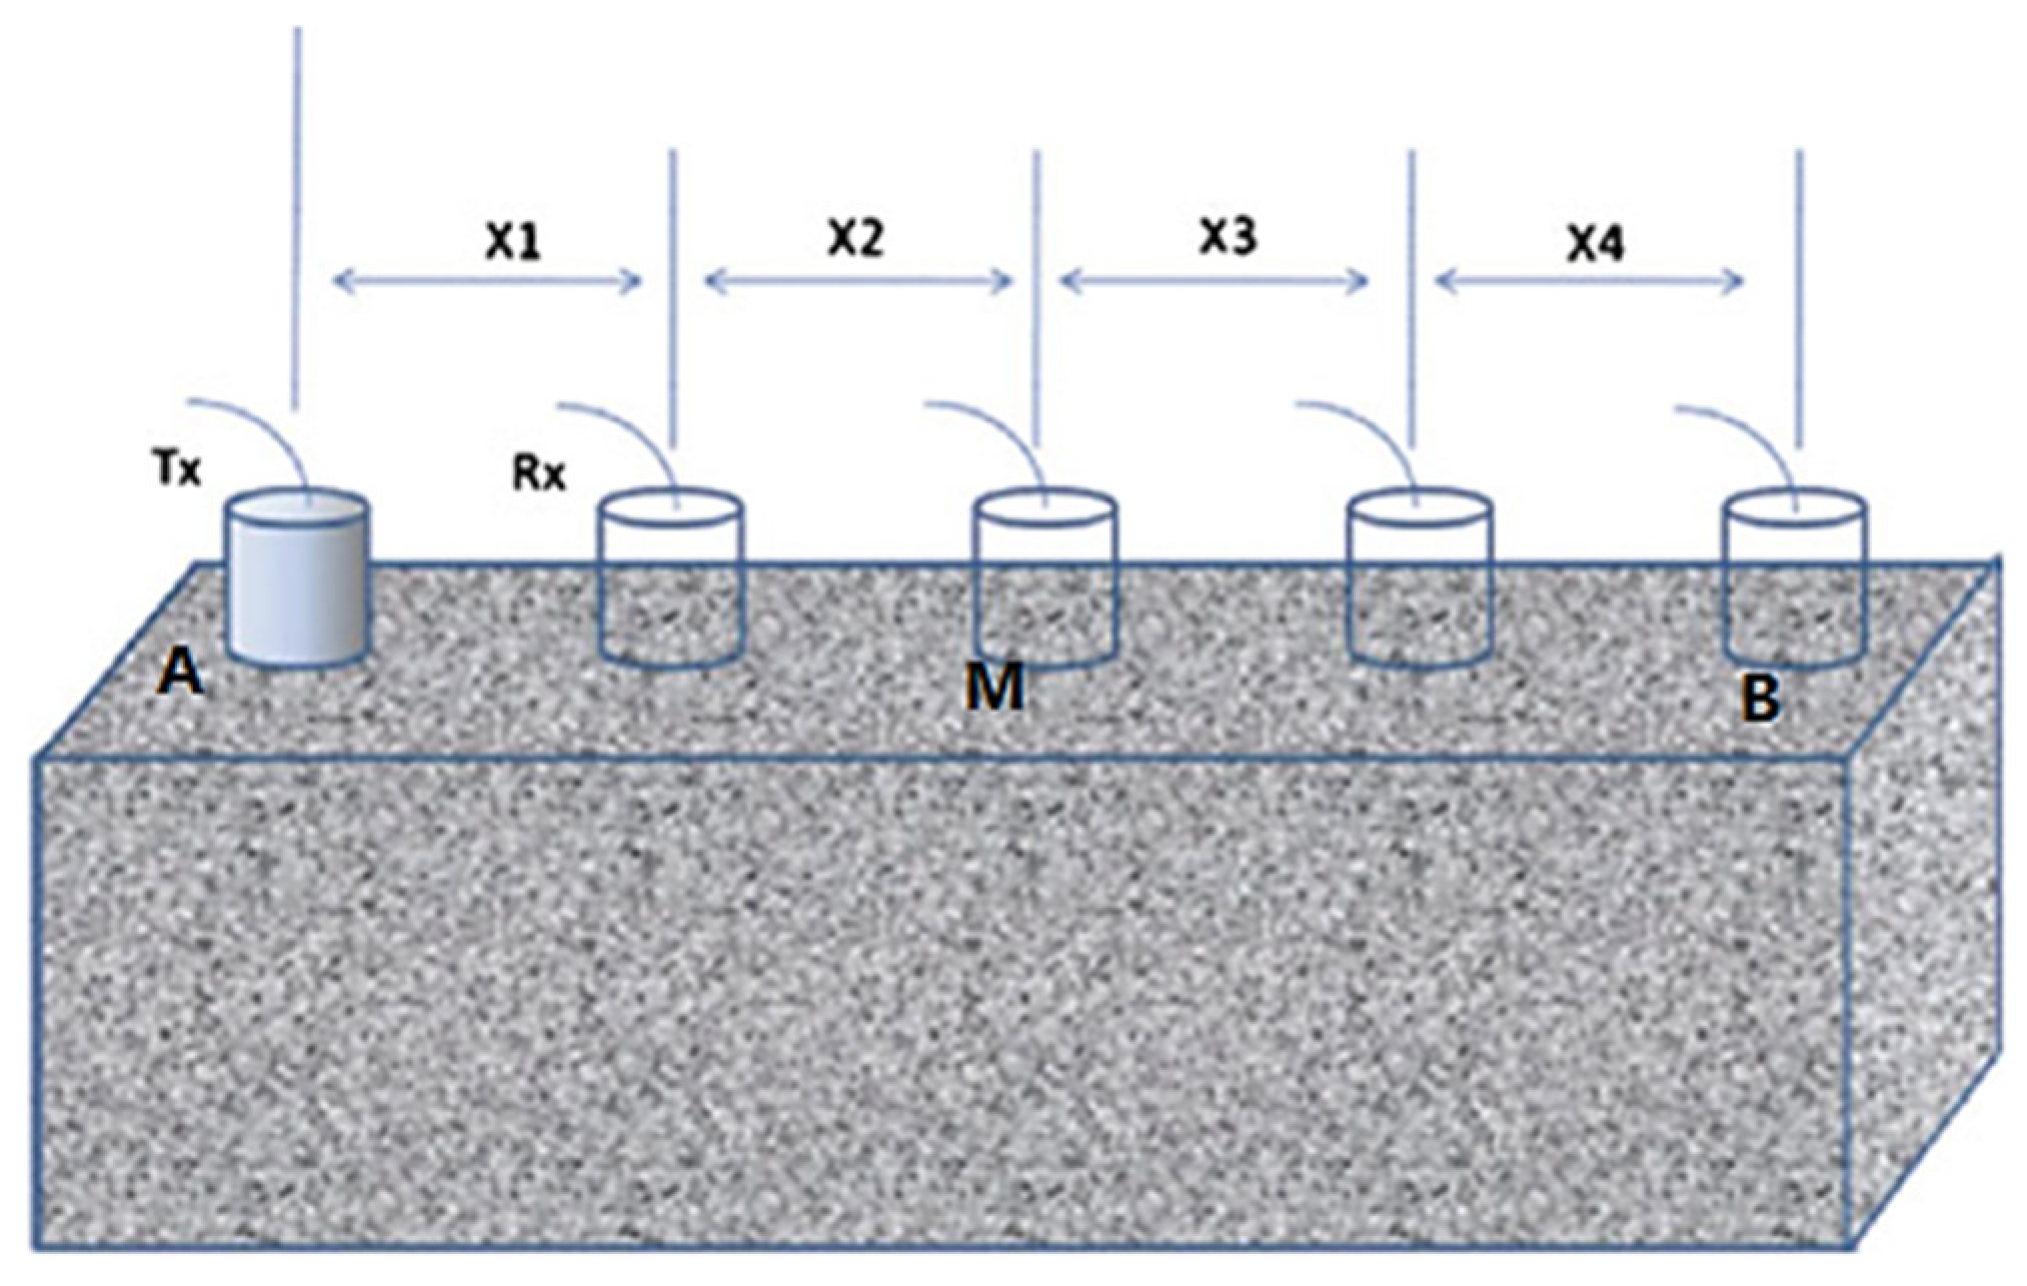
3.3.4. Ultrasonic Pulse Velocity (UPV)
- Age of concrete (3, 7, and 28 days).
- Testing procedure (direct, semi-direct, and indirect UPV test).
- Fibre percentage (0.25%, 0.50%, and 1.00%).
- Fibre length (30 mm and 50 mm).
- Direct UPV measurements.
- B.
- Semi-direct UPV measurements
- C.
- Indirect UPV measurements
4. Results and Discussion
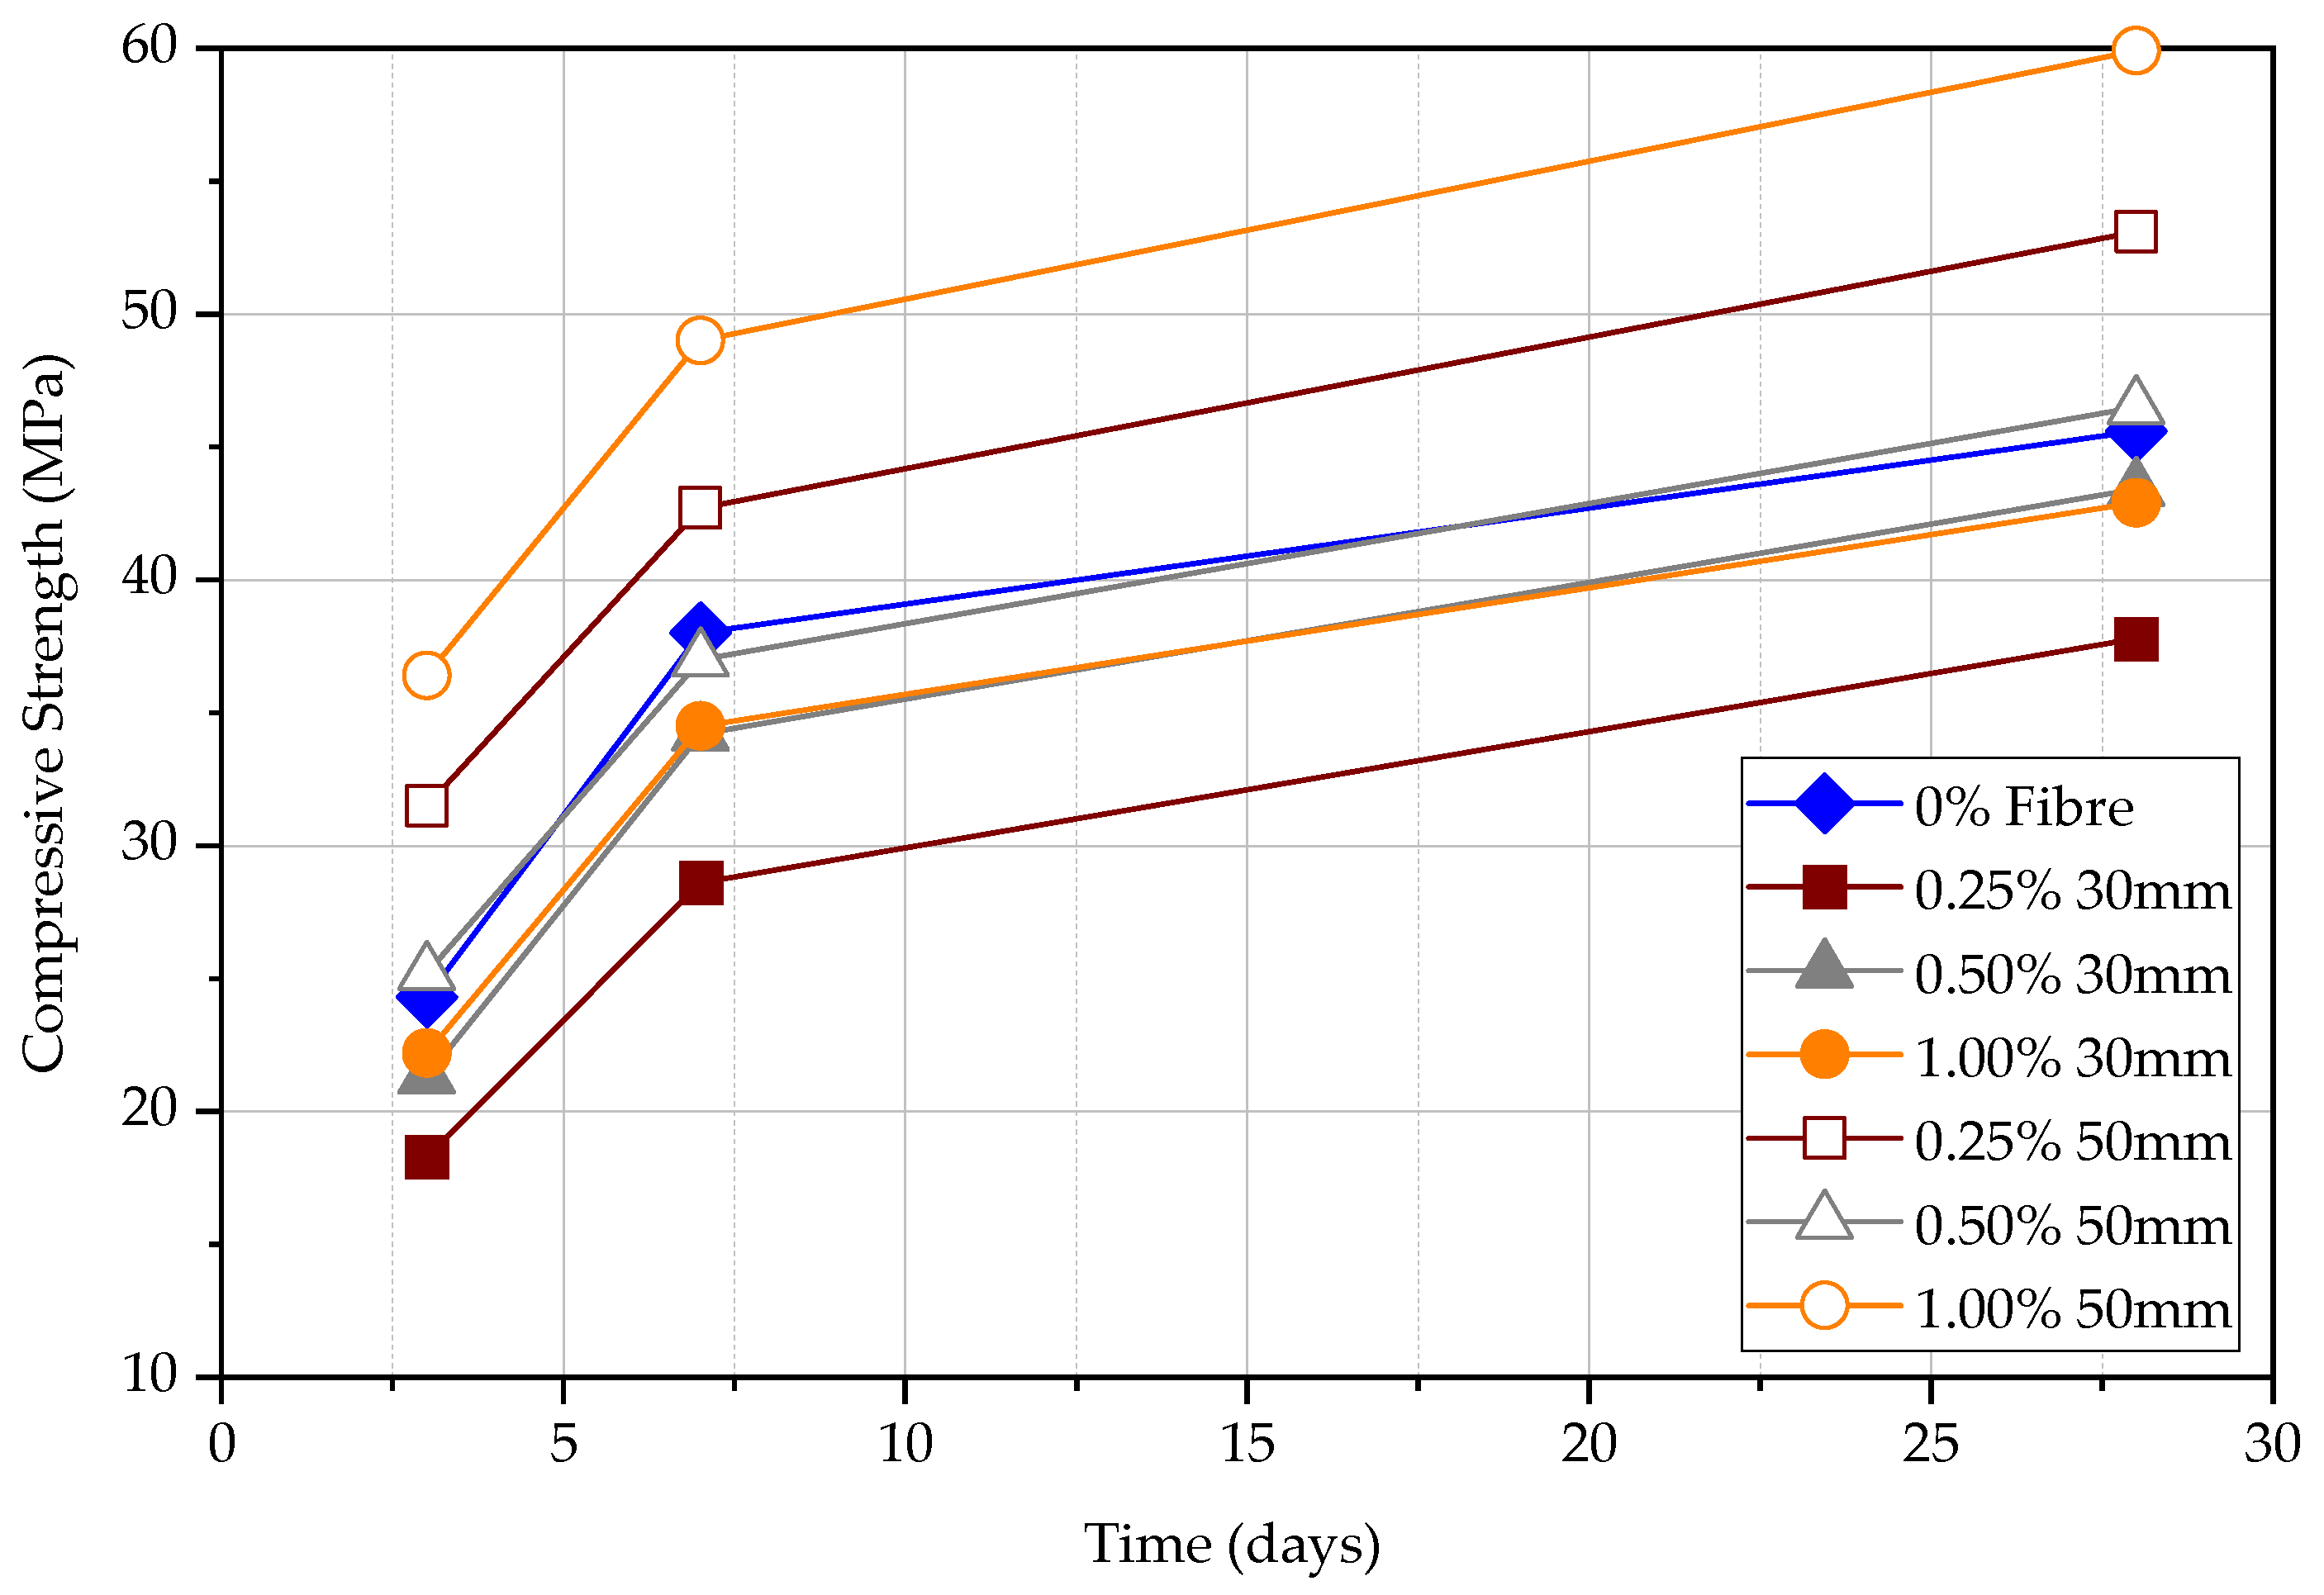
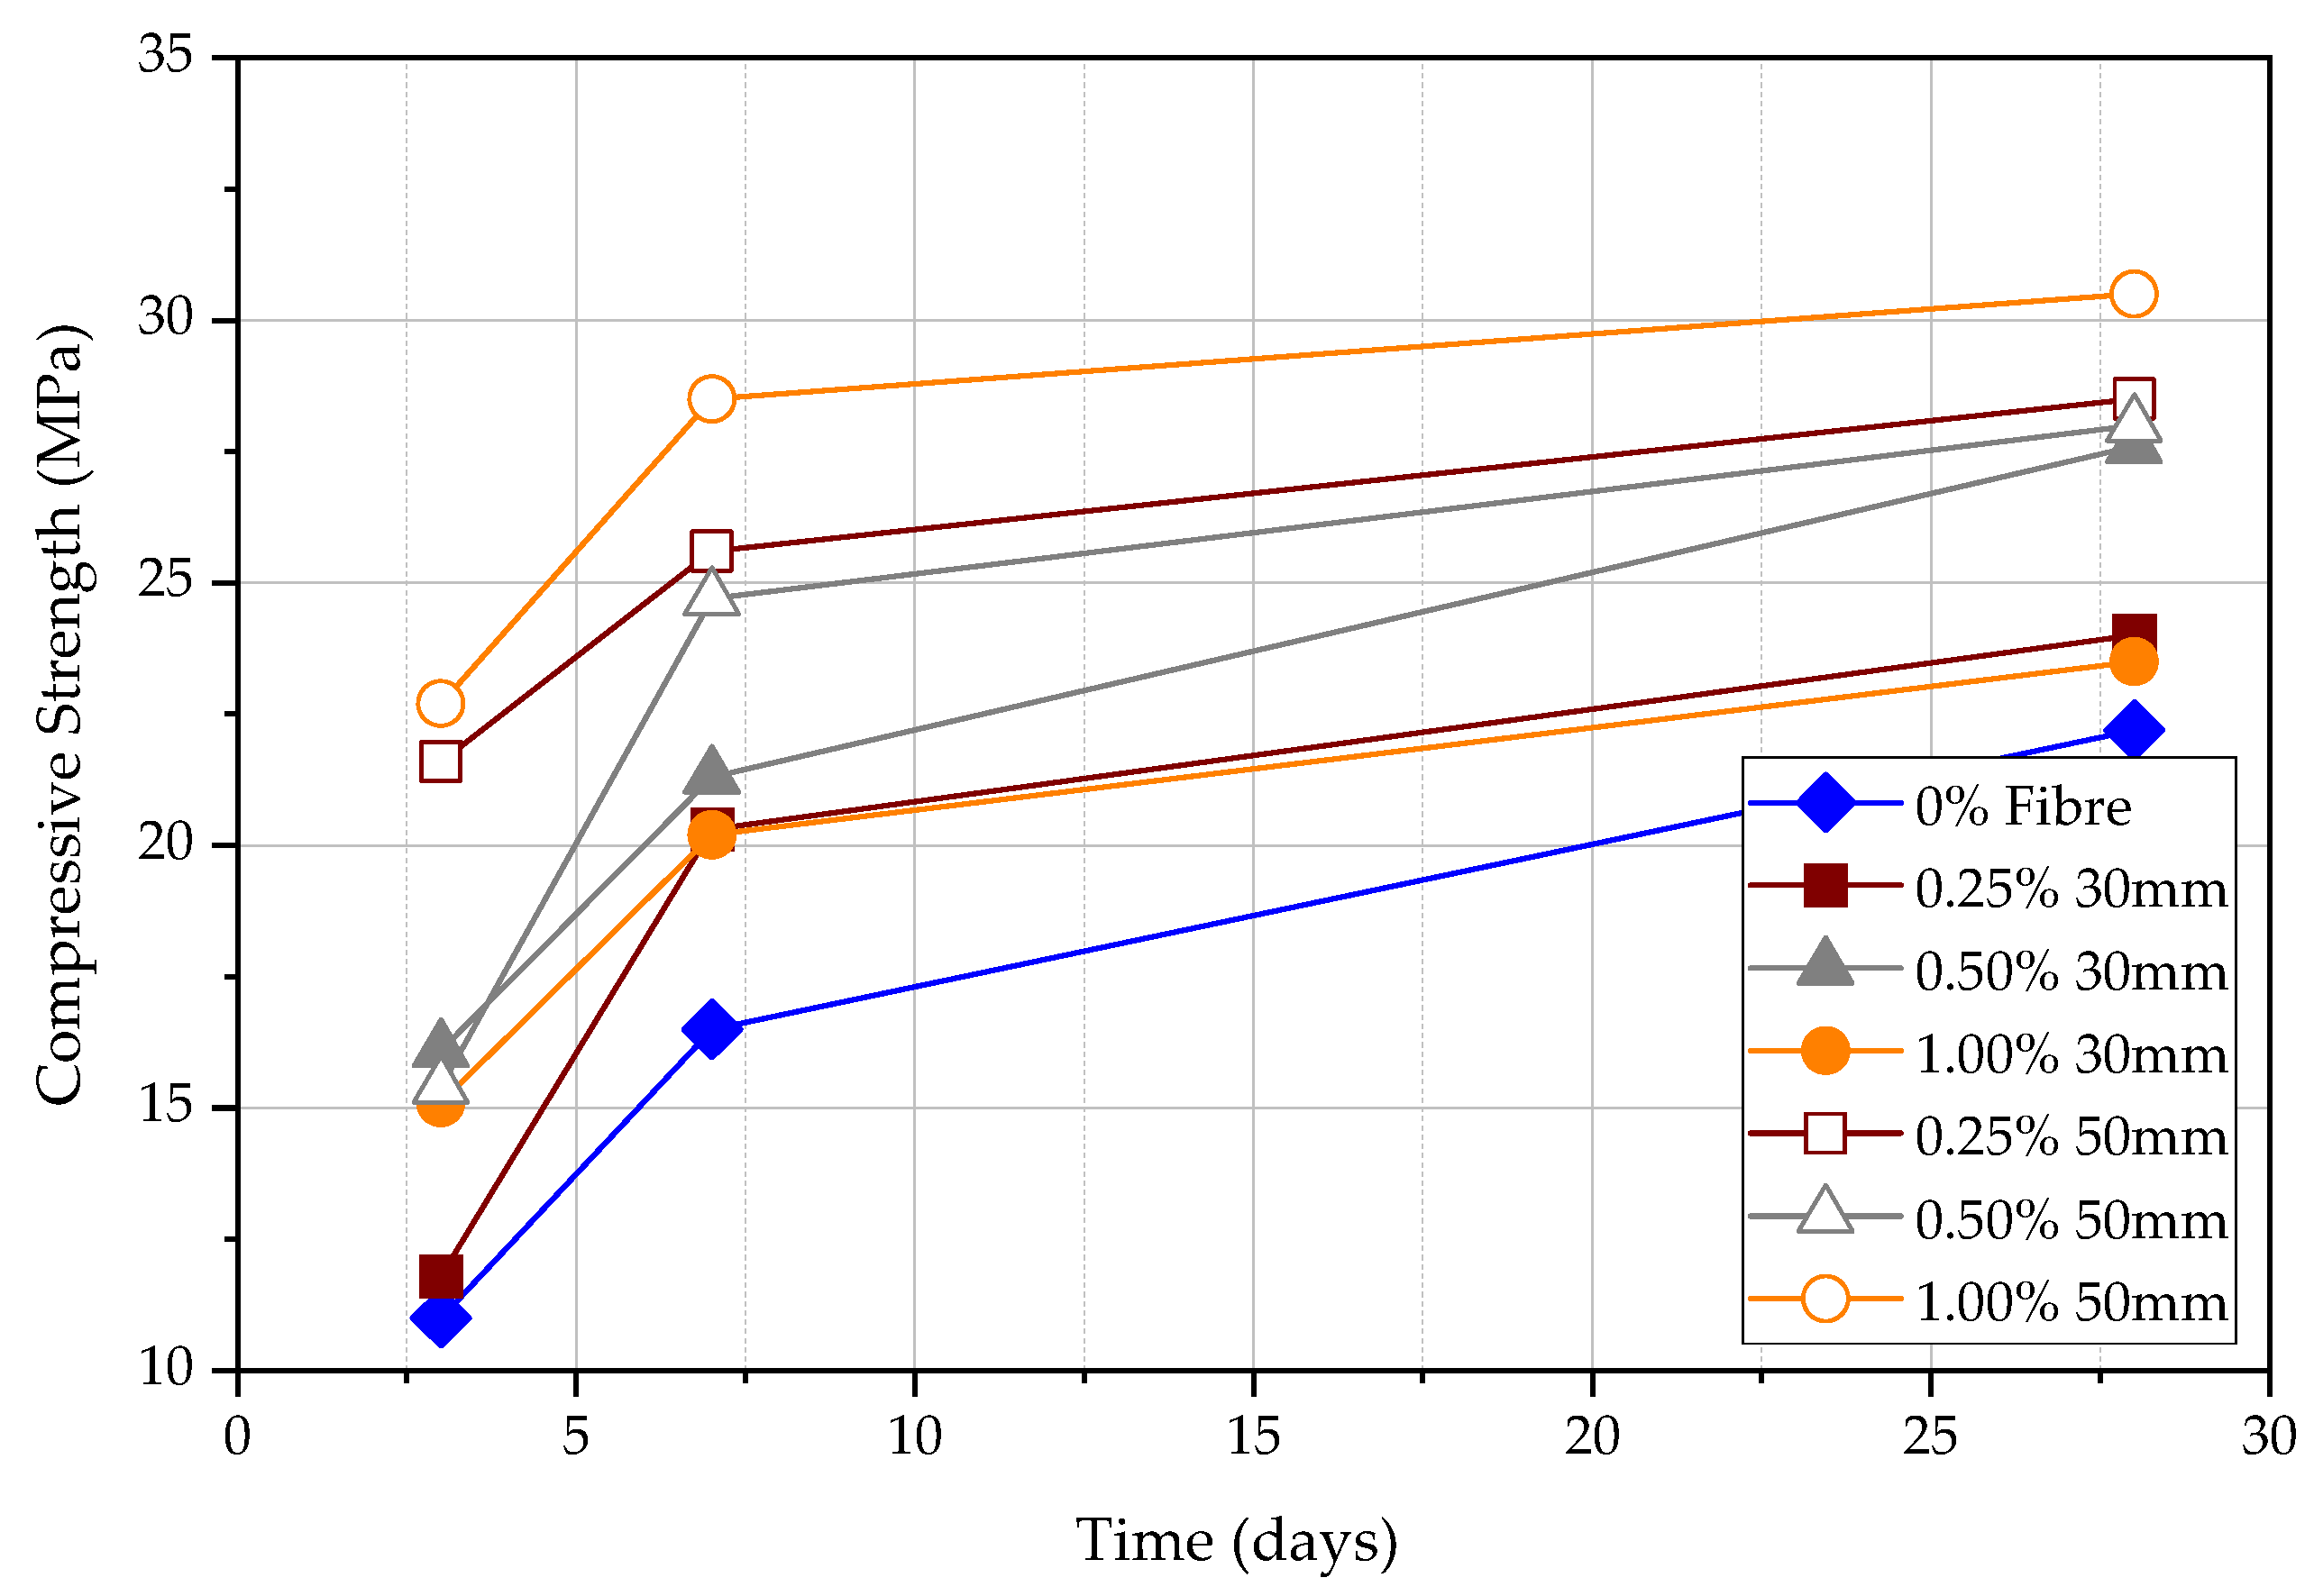
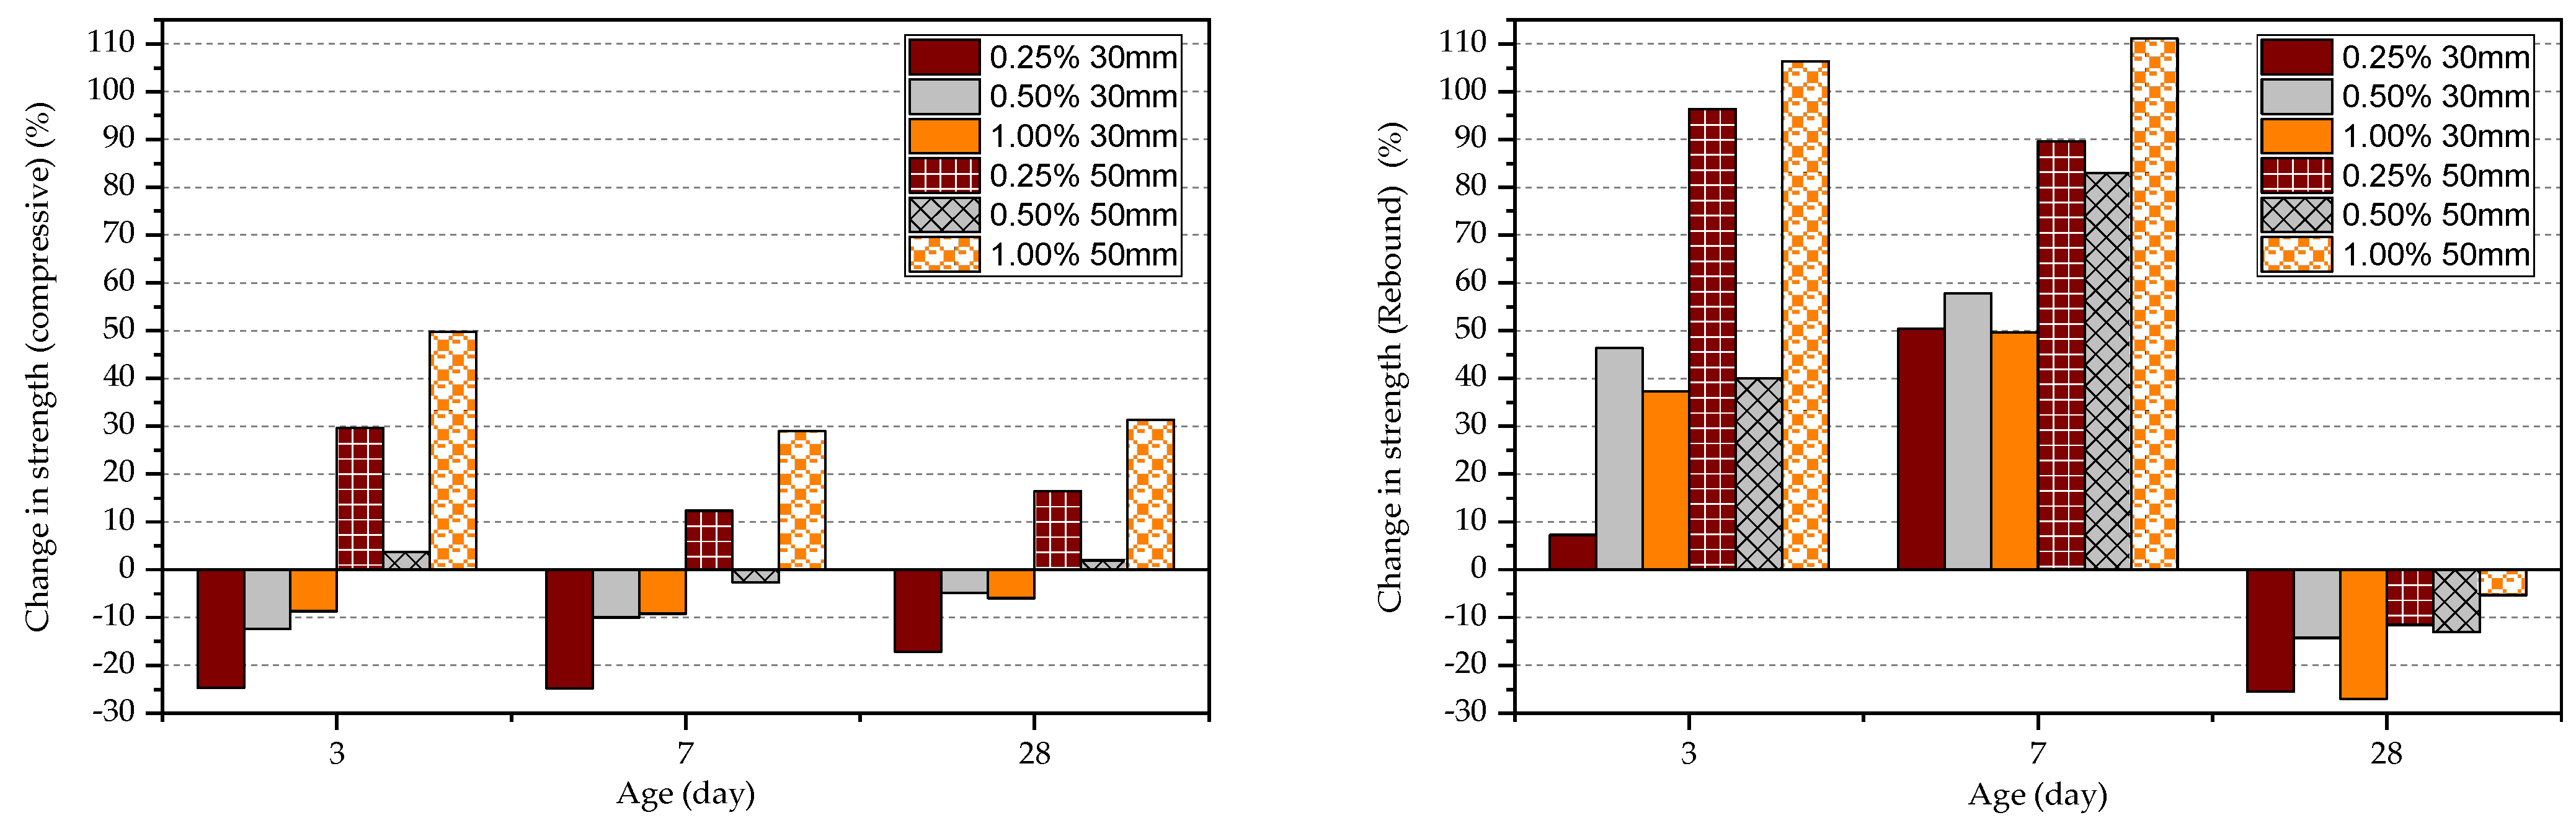
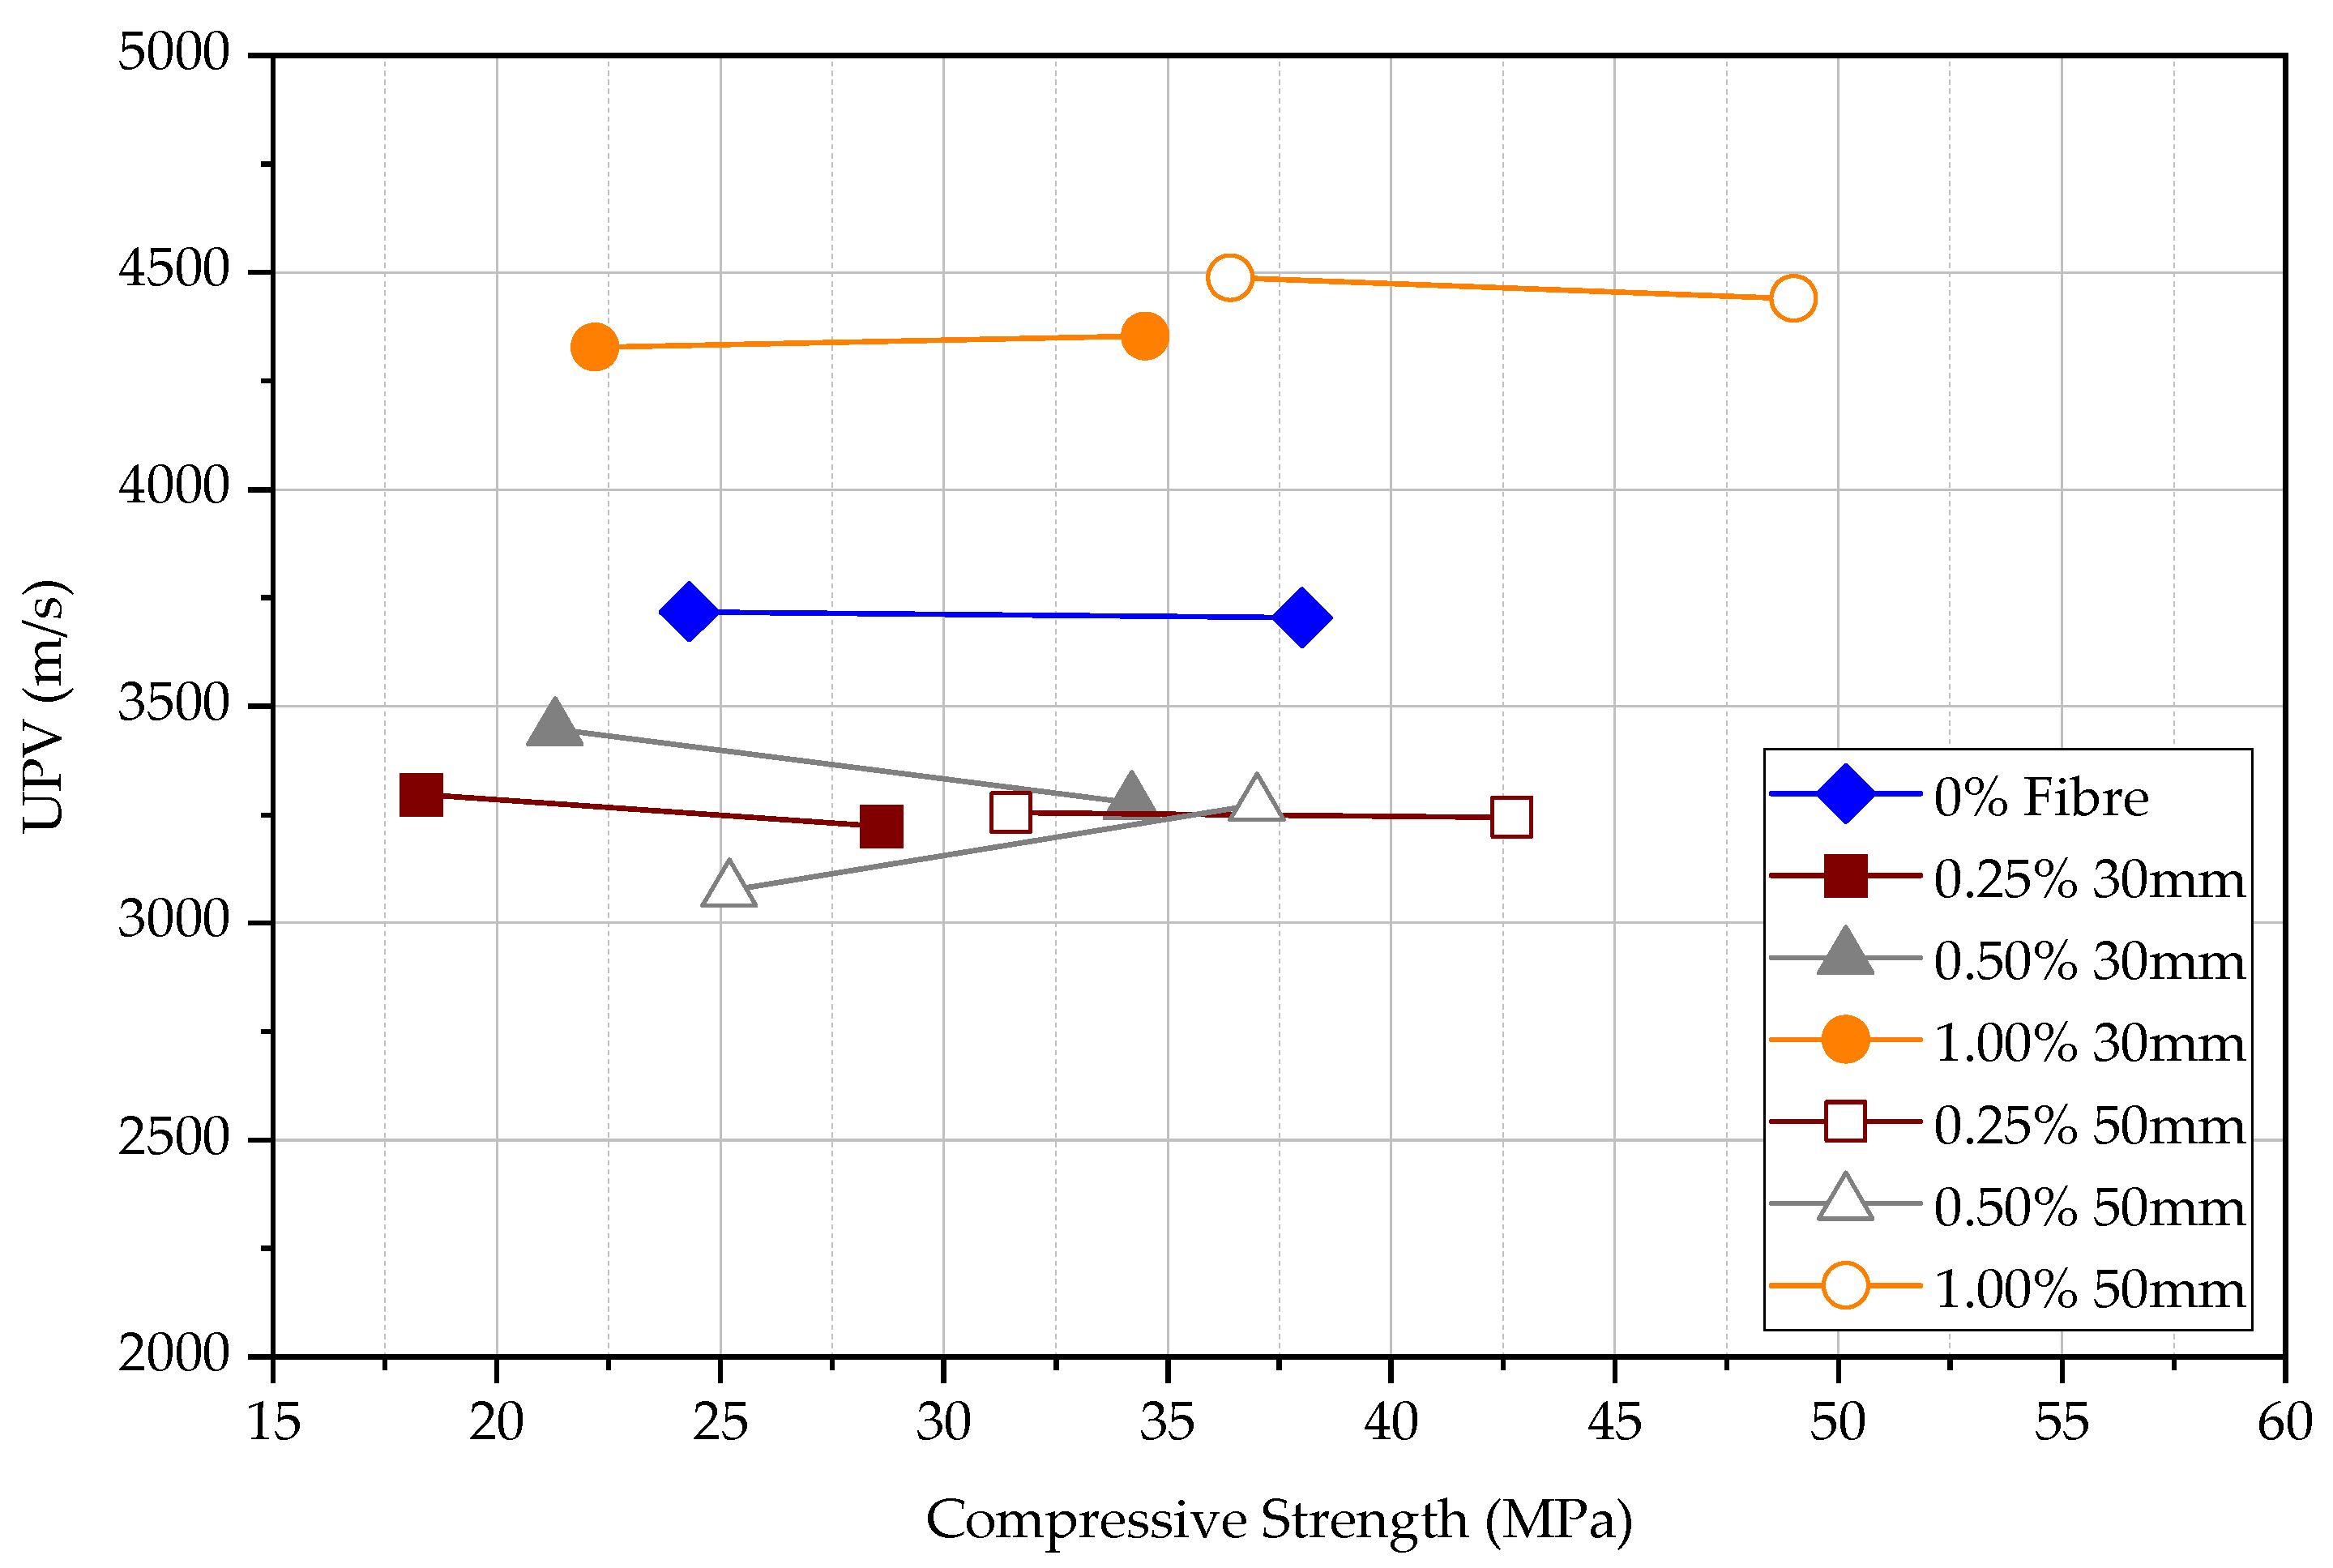
4.1. Compressive Test
4.2. Rebound Hammer Test
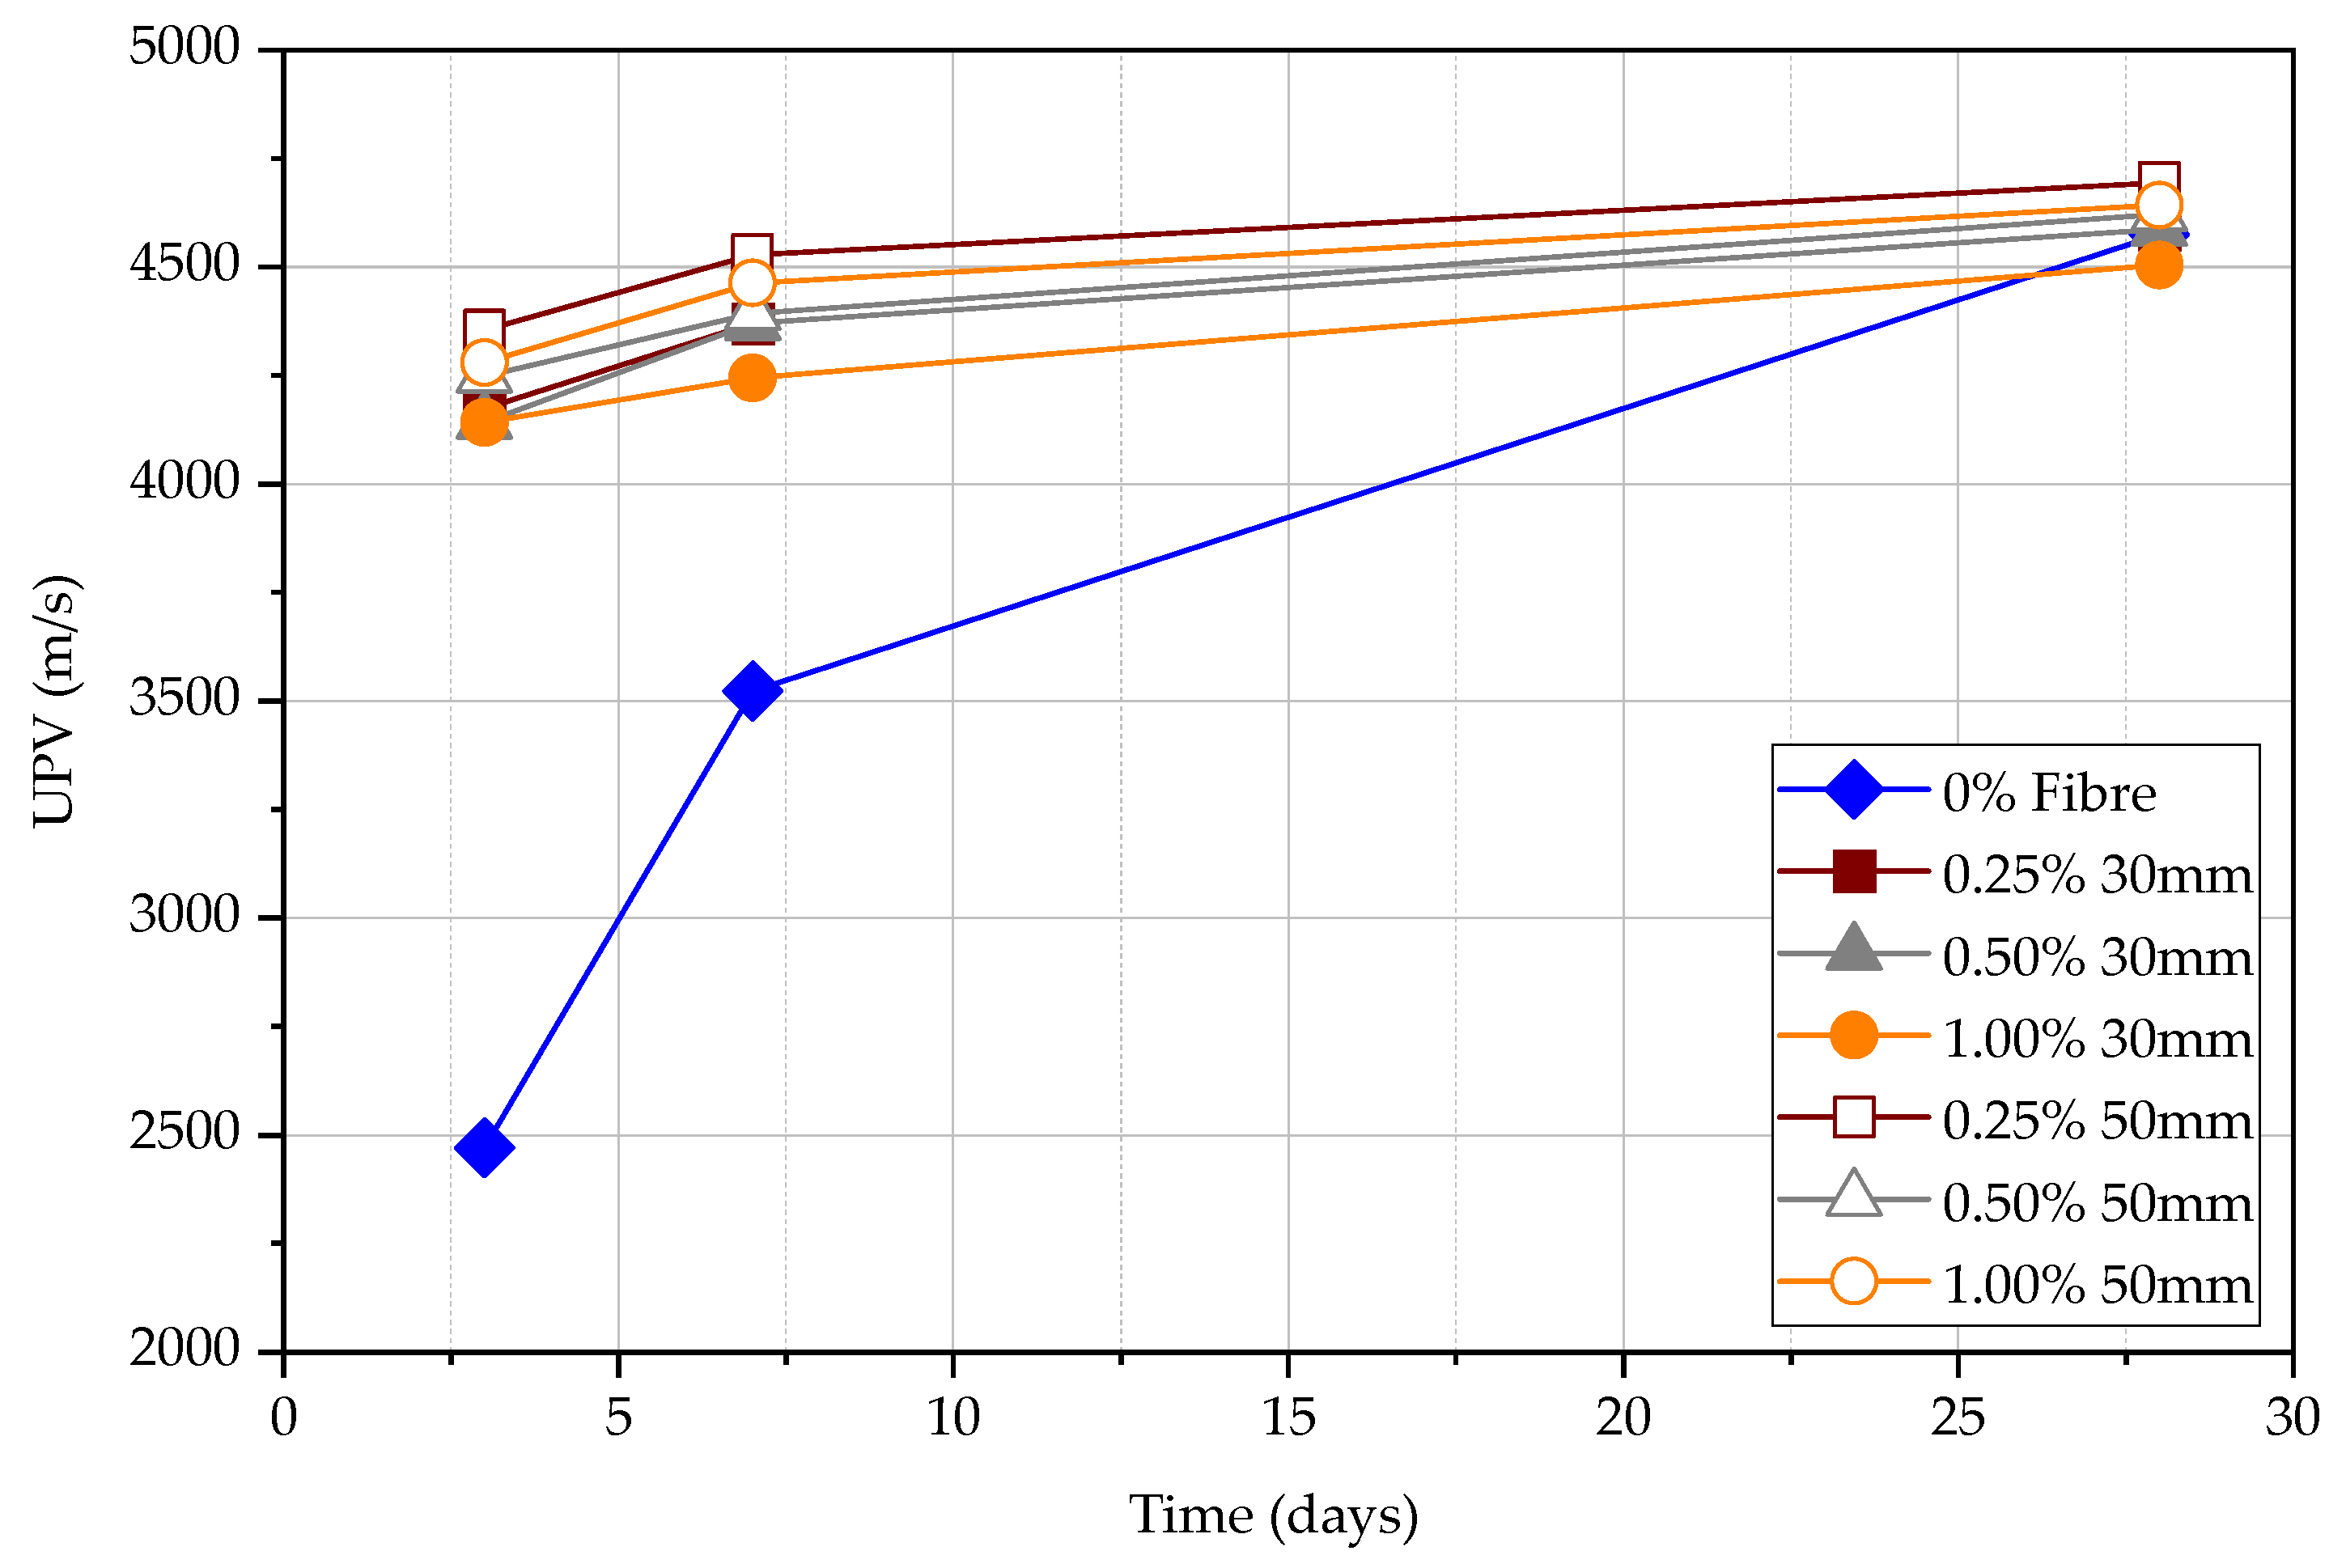
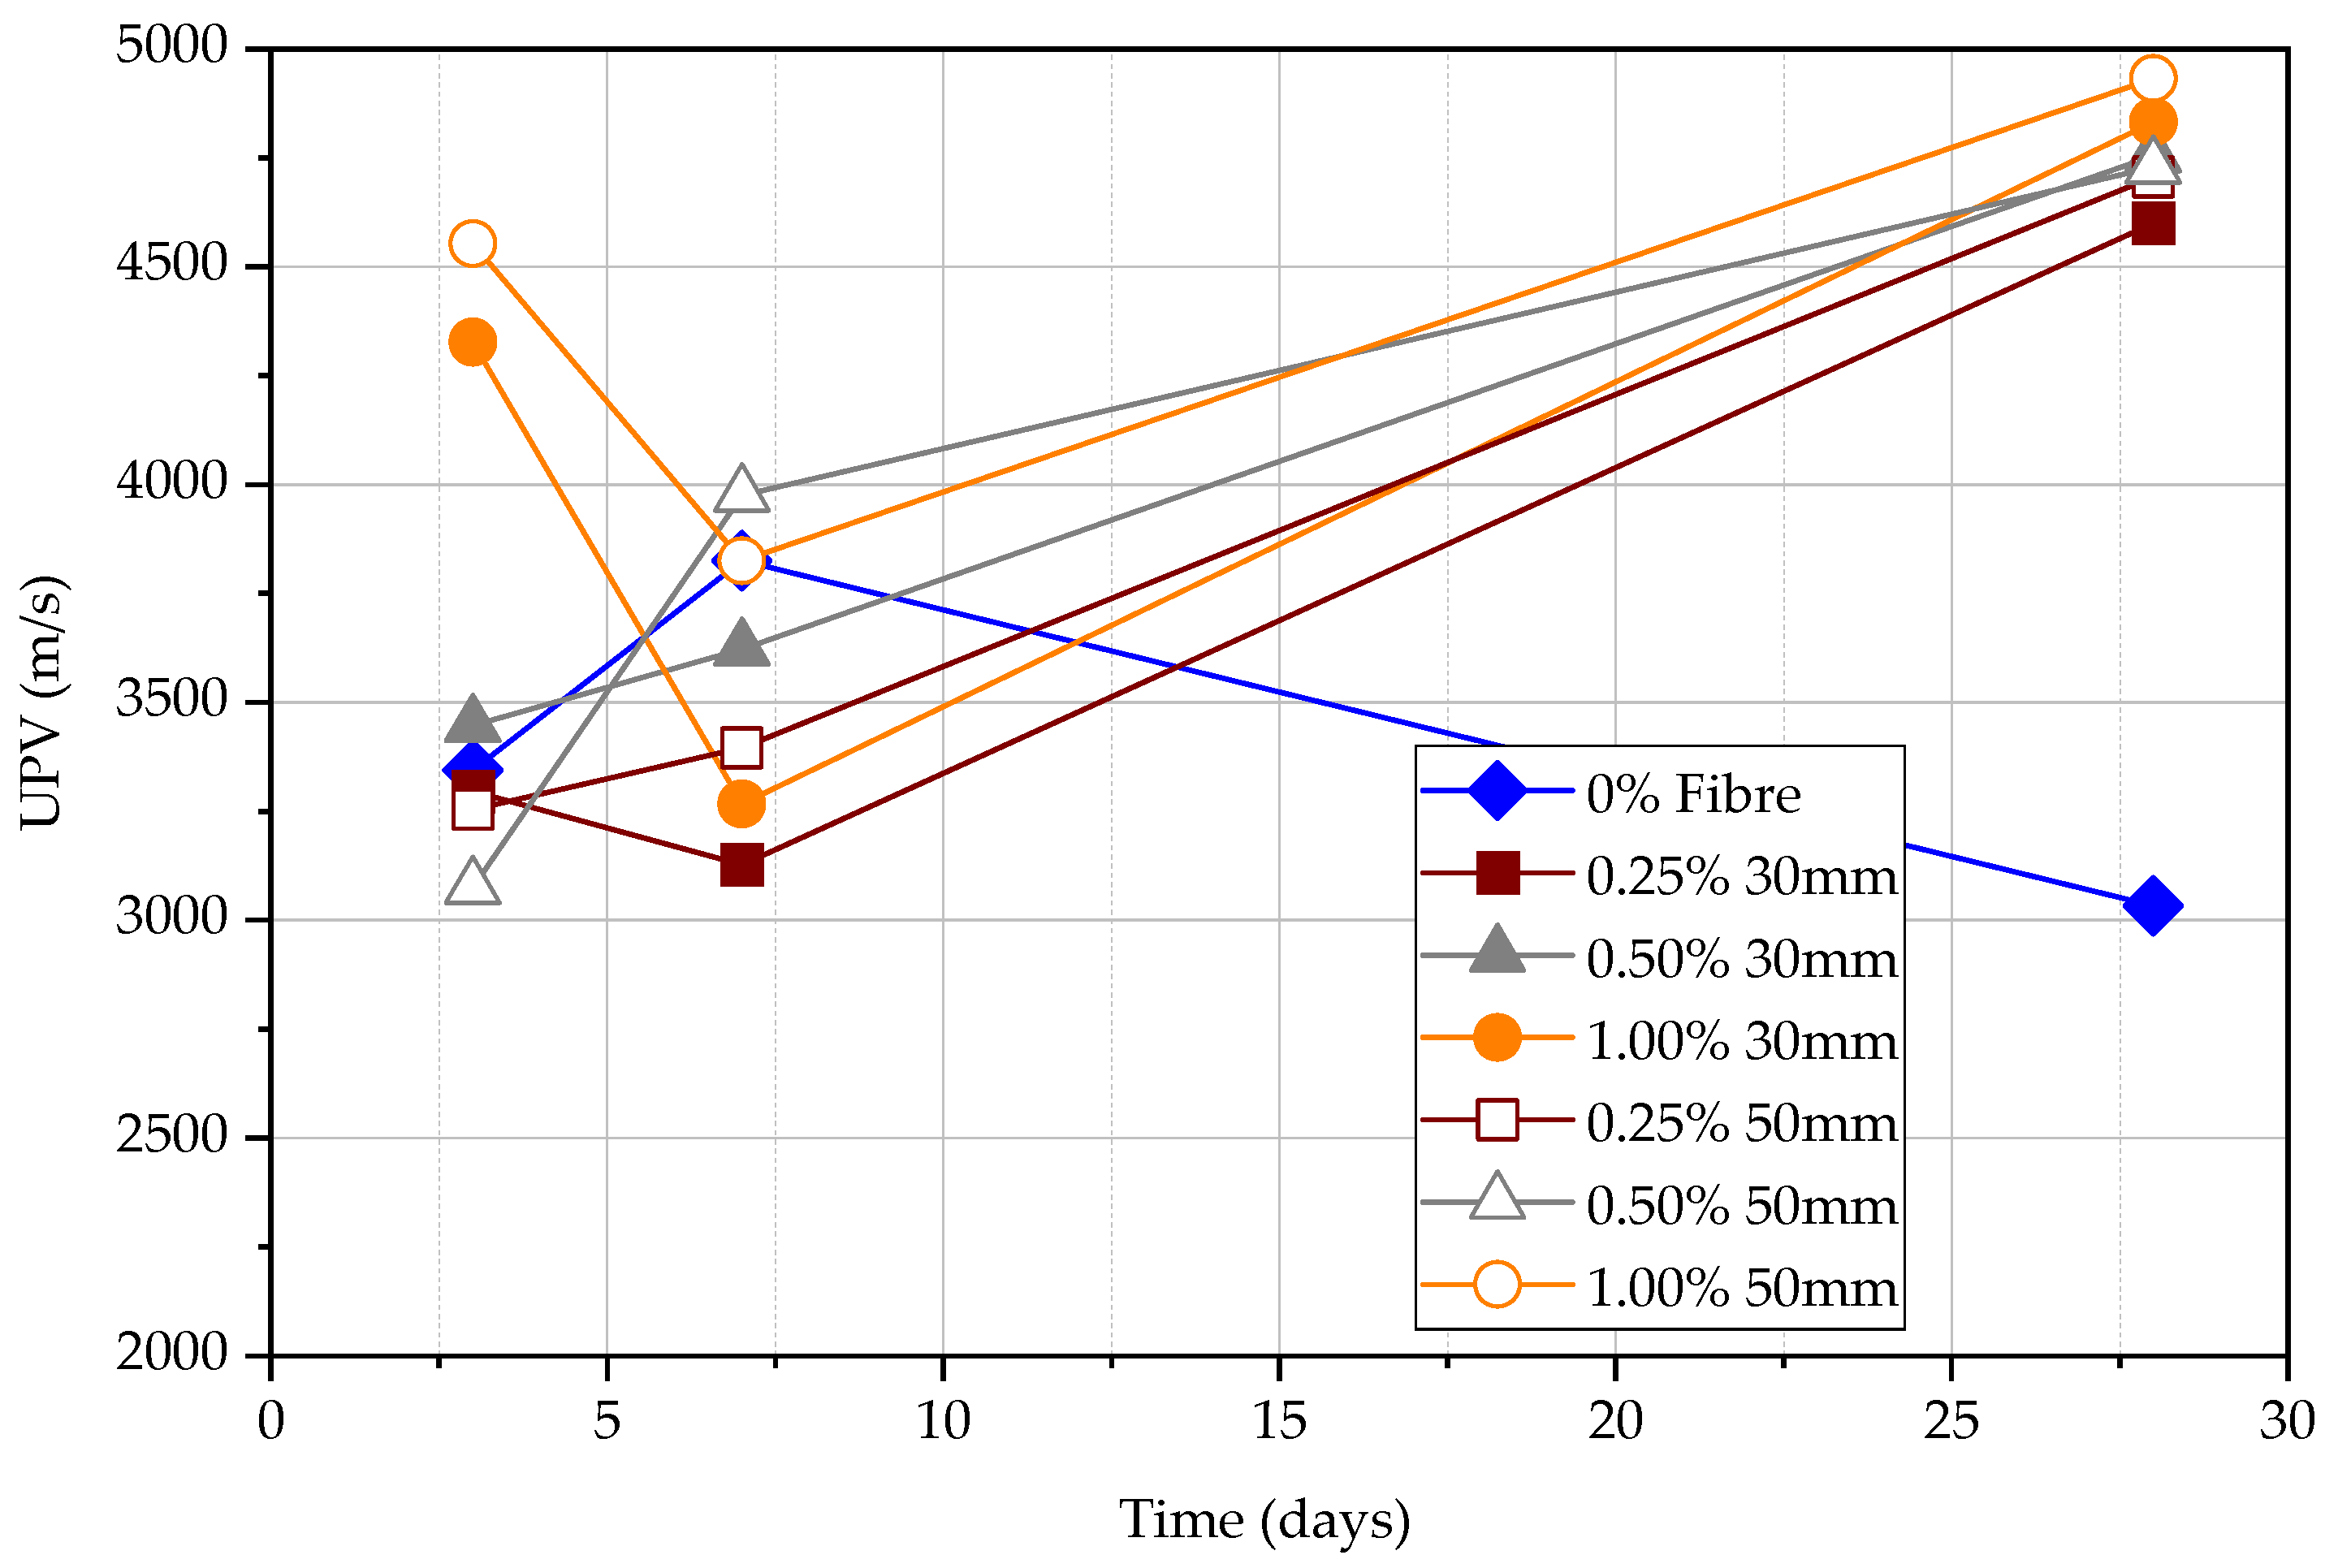
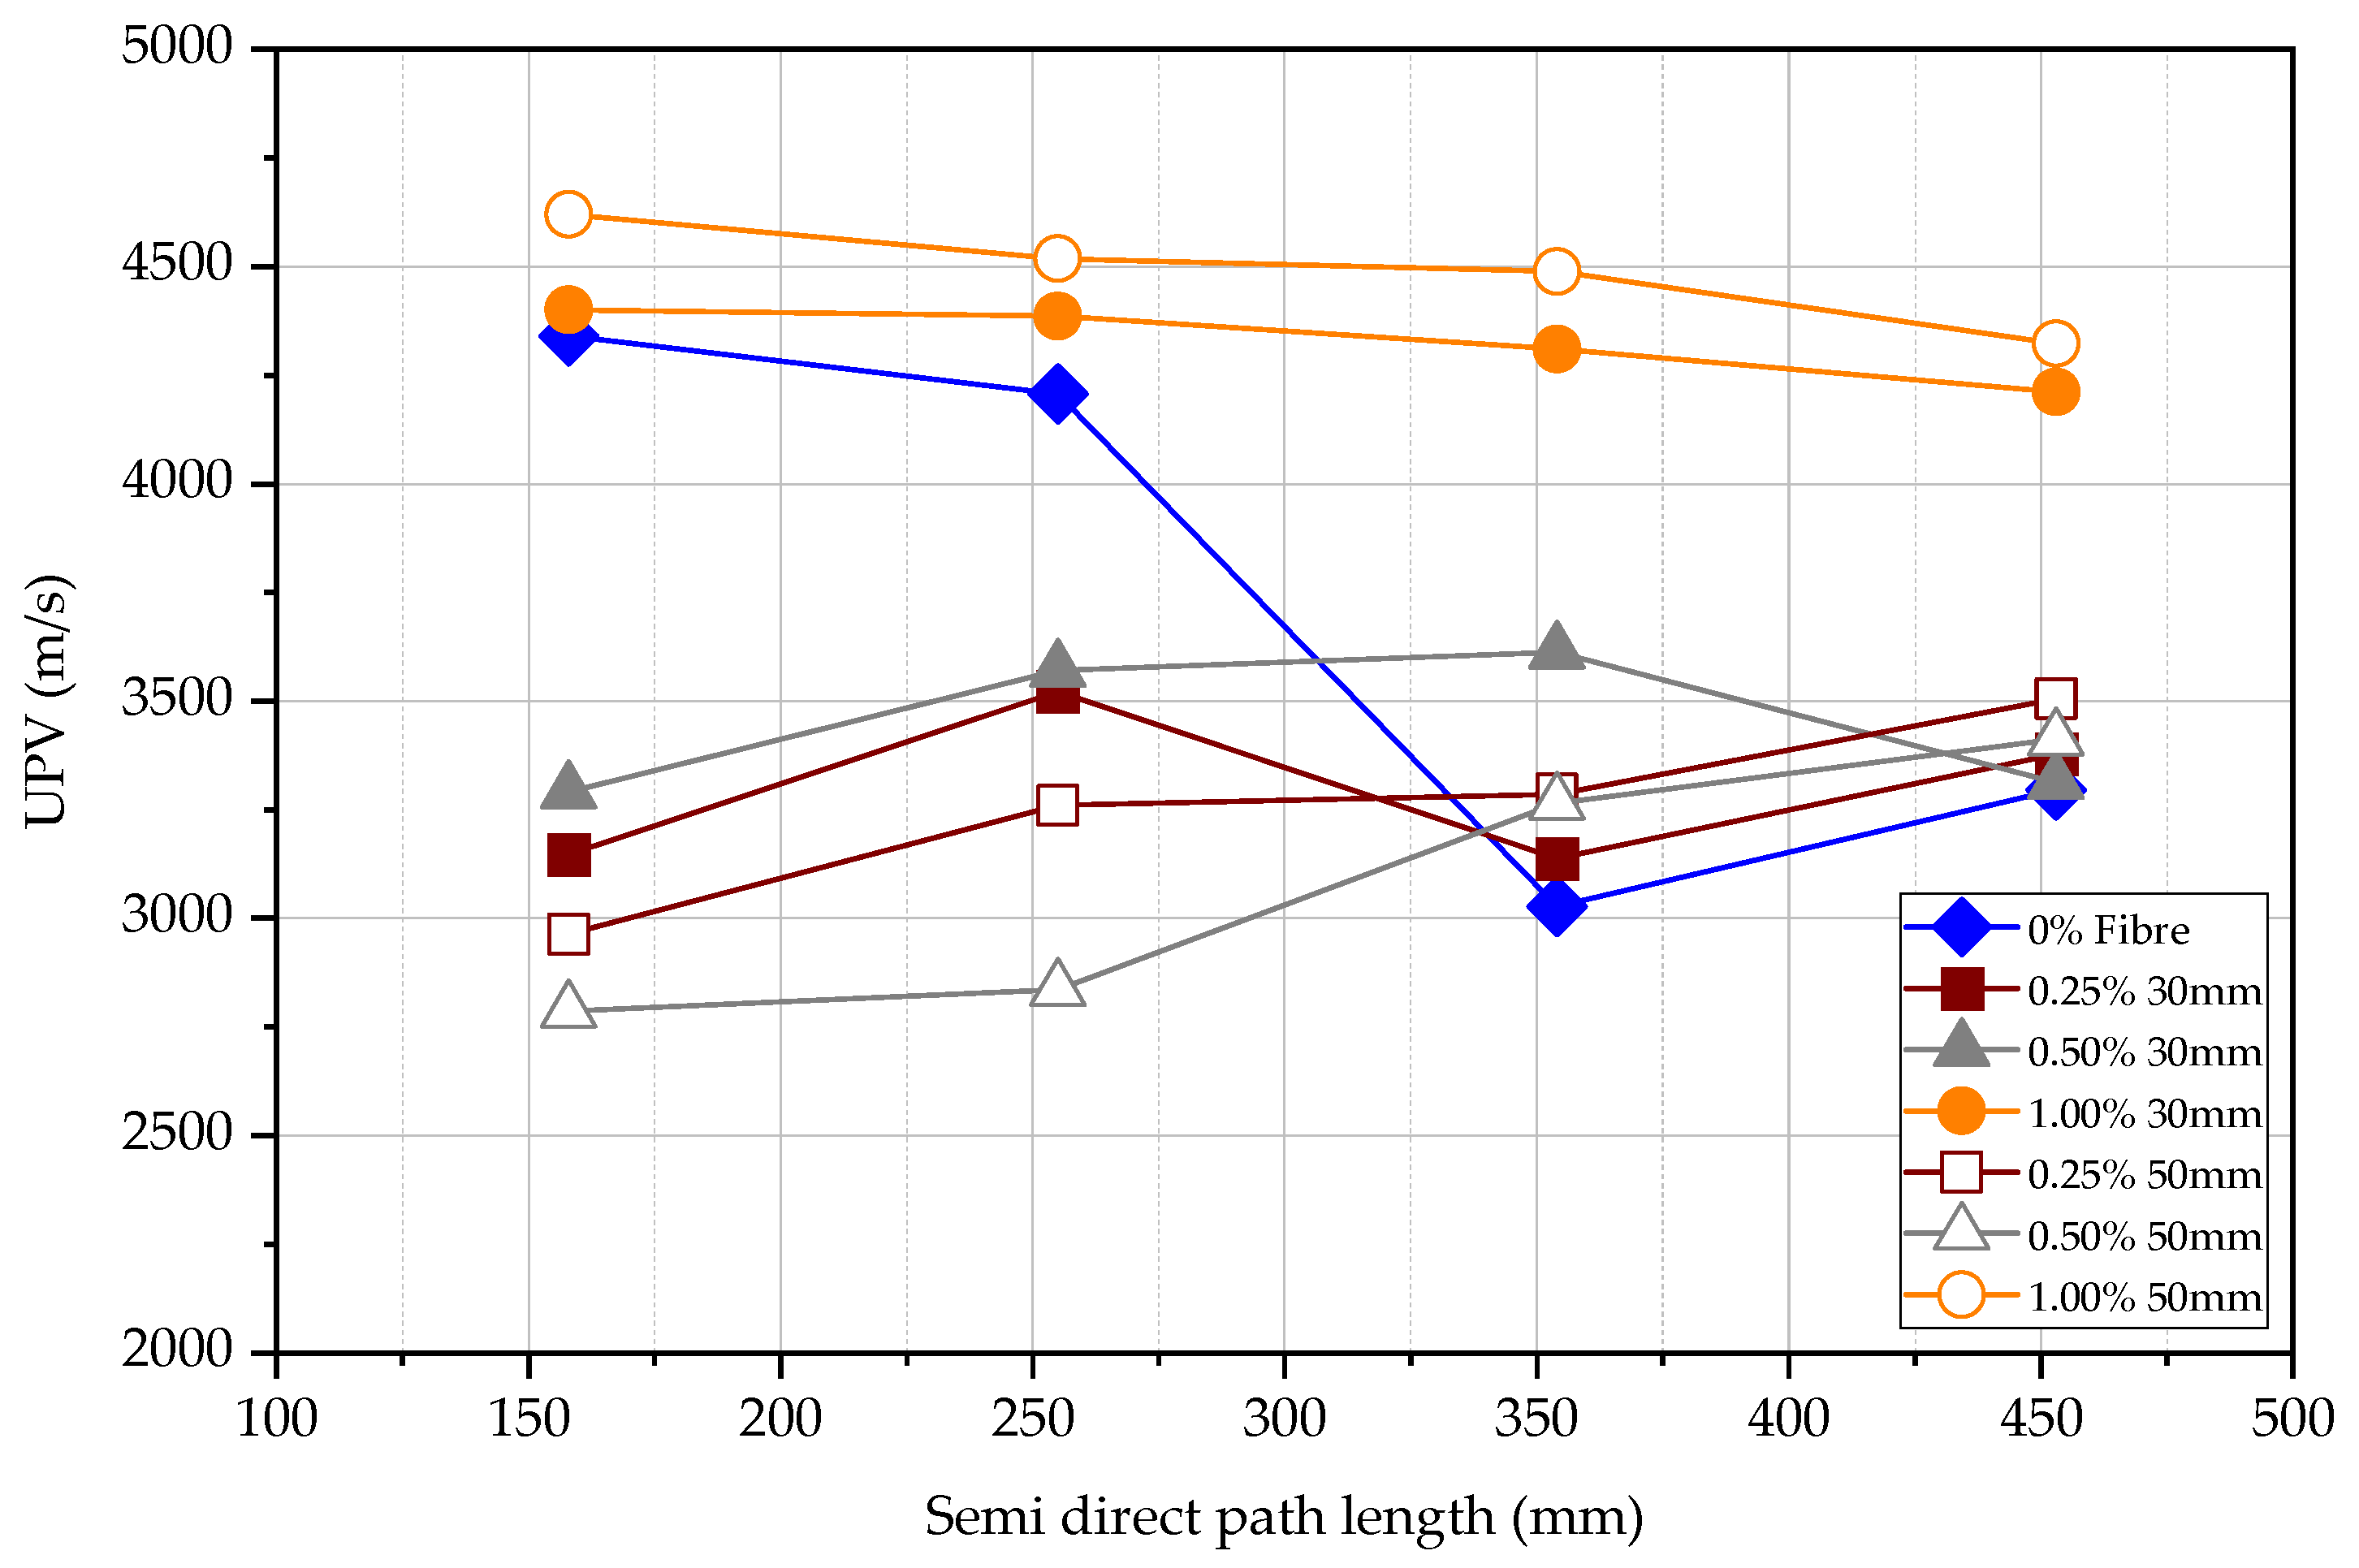
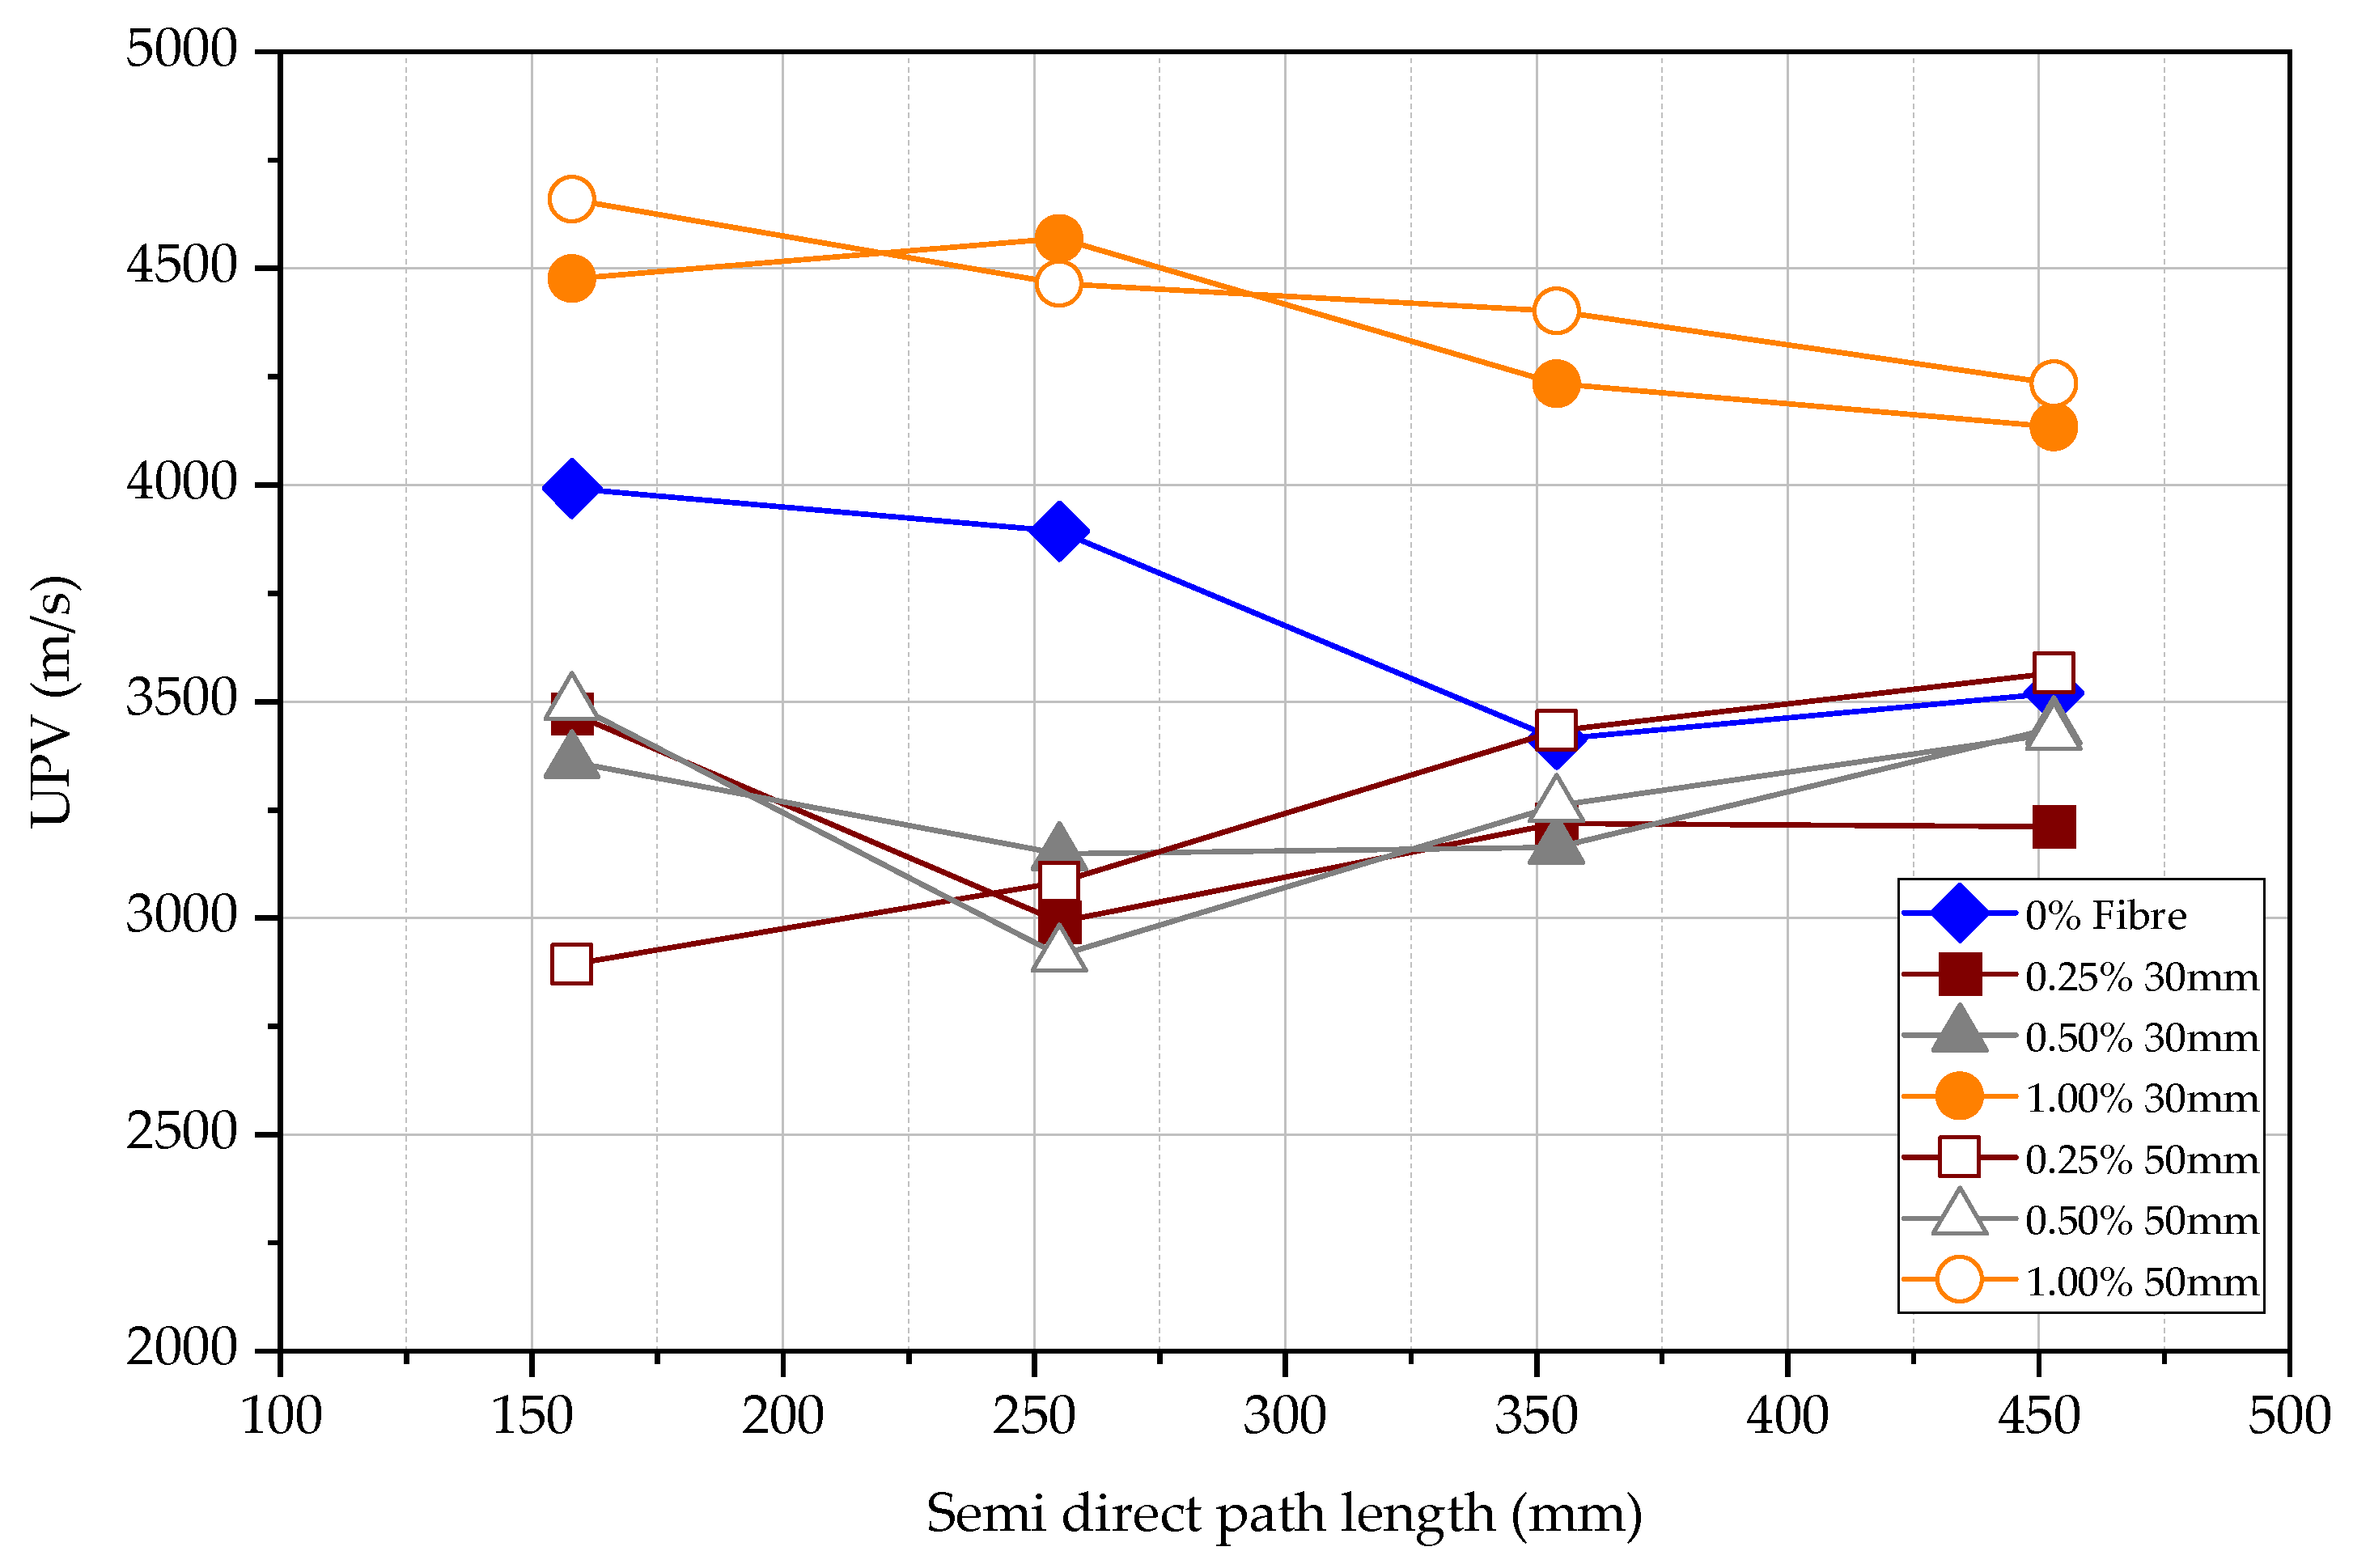
4.3. Ultrasonic Pulse Velocity (UPV) Test
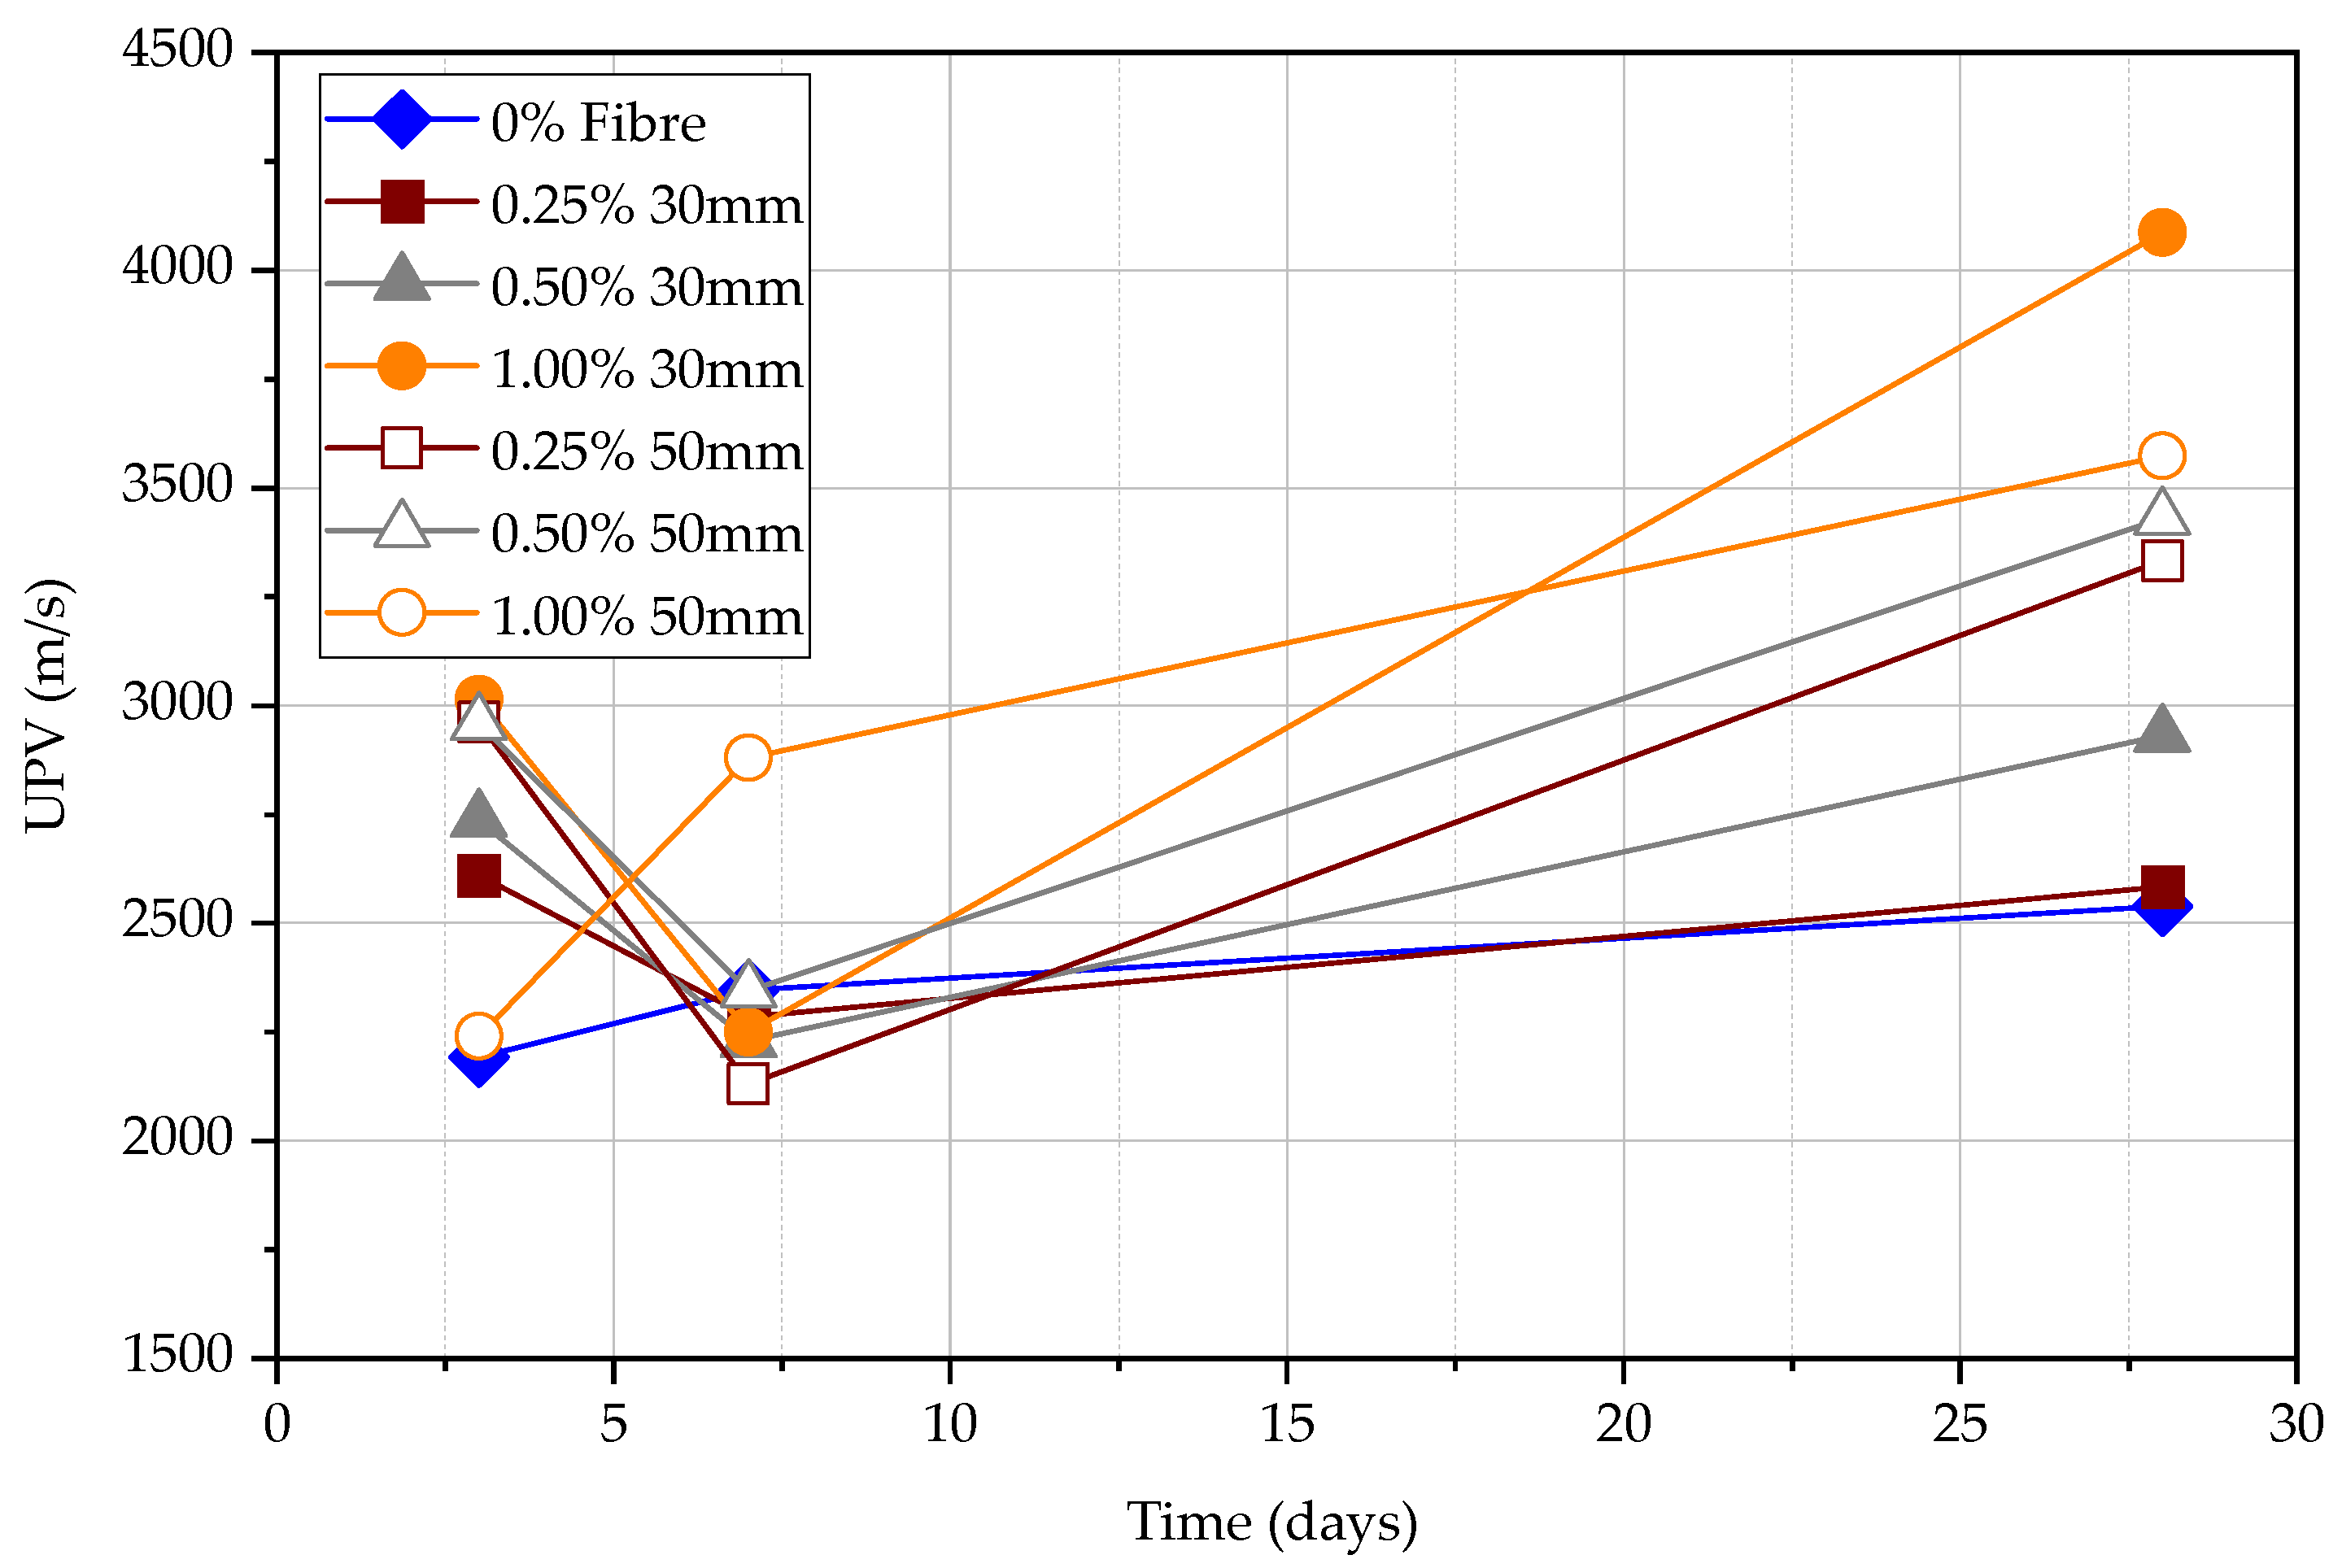
4.3.1. Direct UPV Measurements
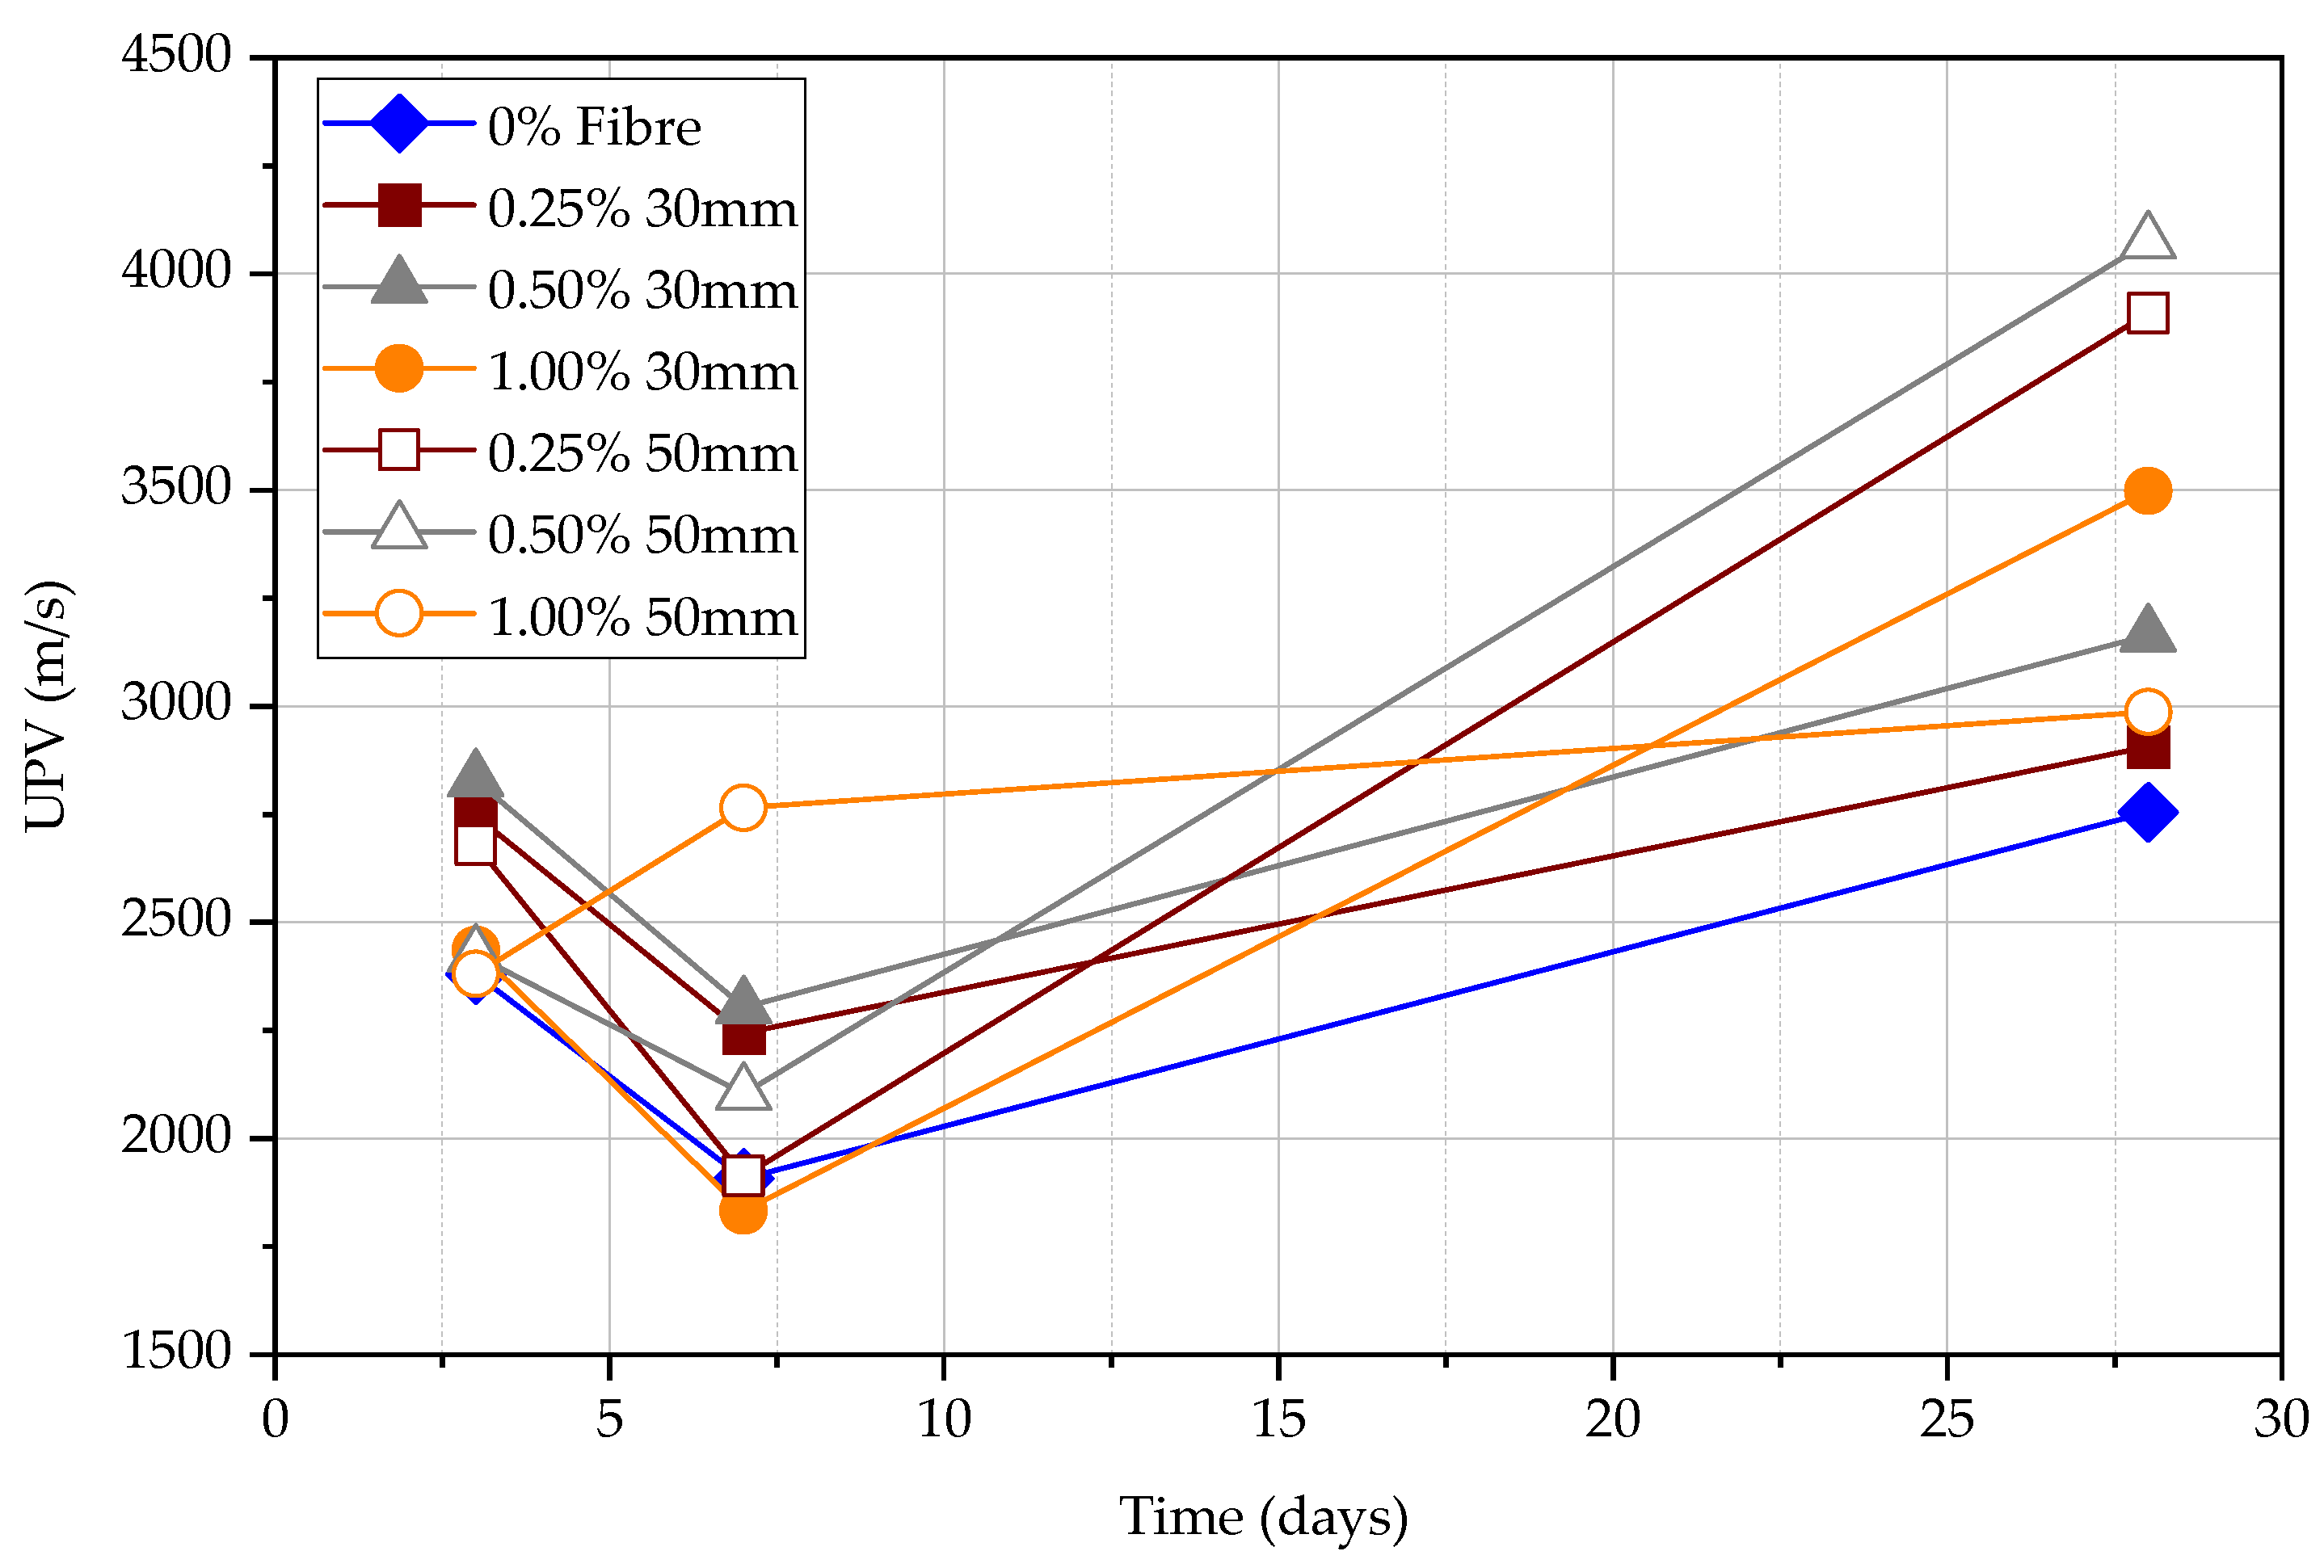
4.3.2. Semi-Direct UPV Measurements
4.3.3. Indirect UPV Measurements
4.4. Comparative Relationships of Direct, Semi-Direct, and Indirect Measurements
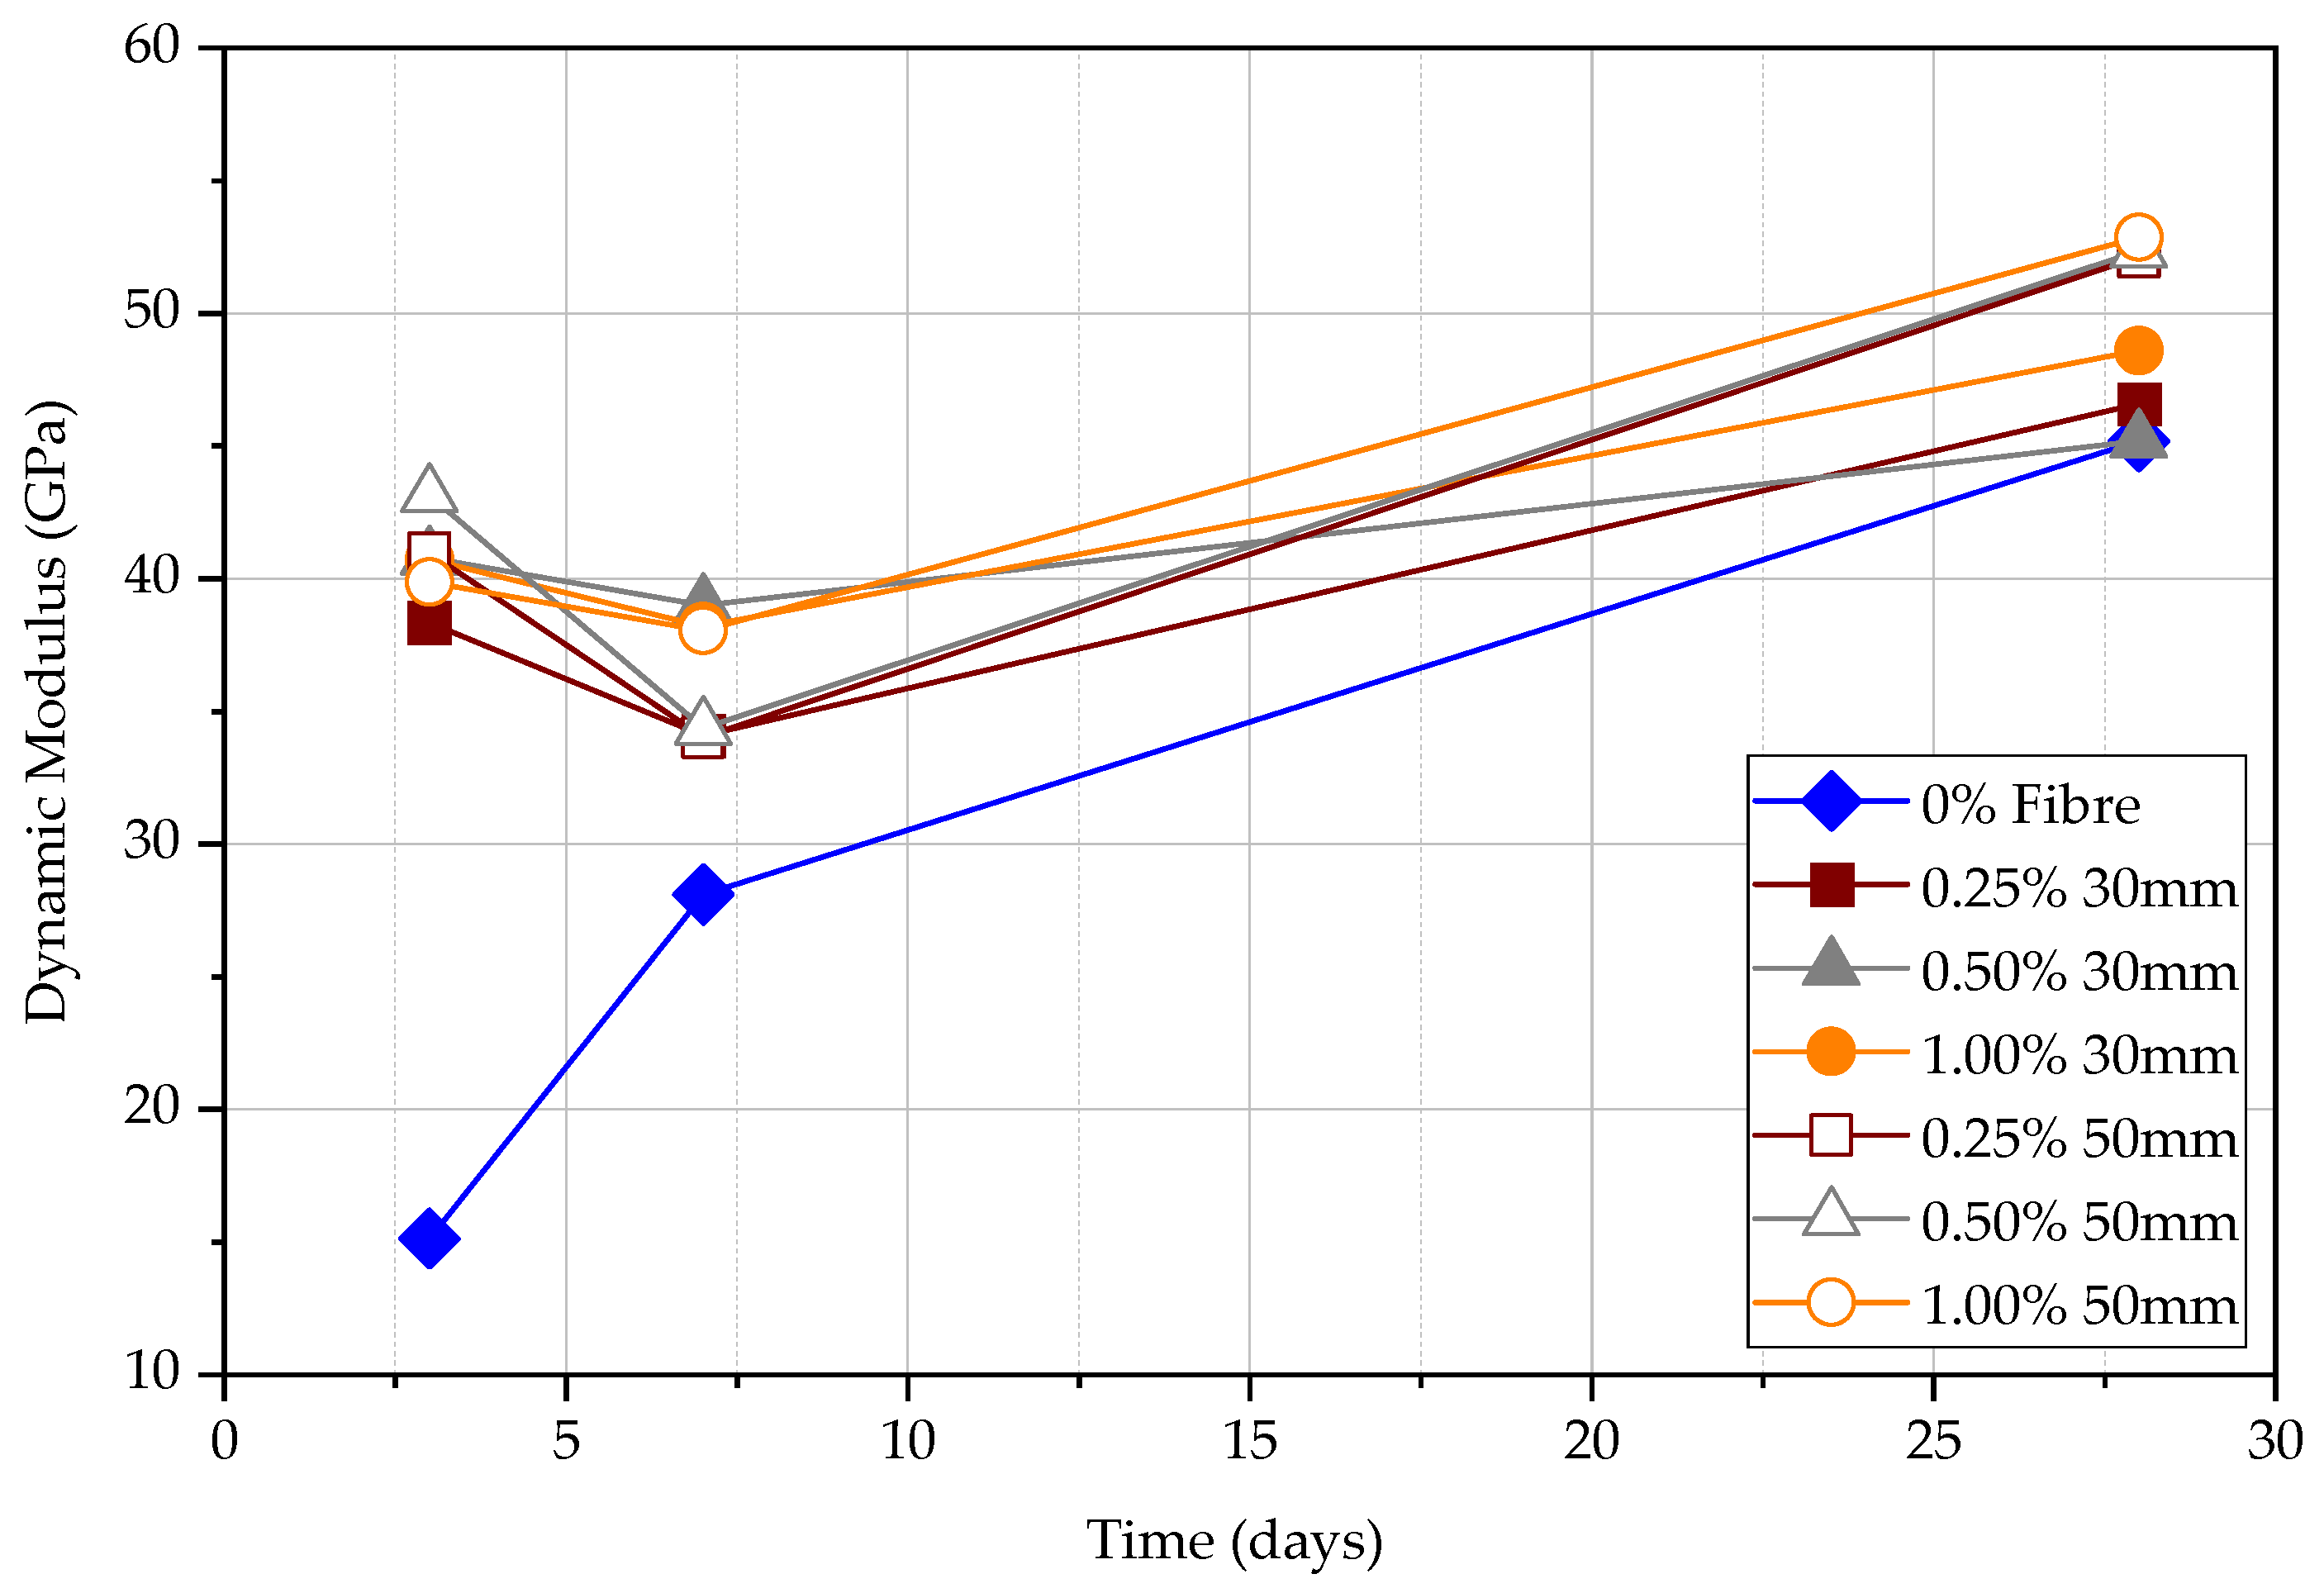
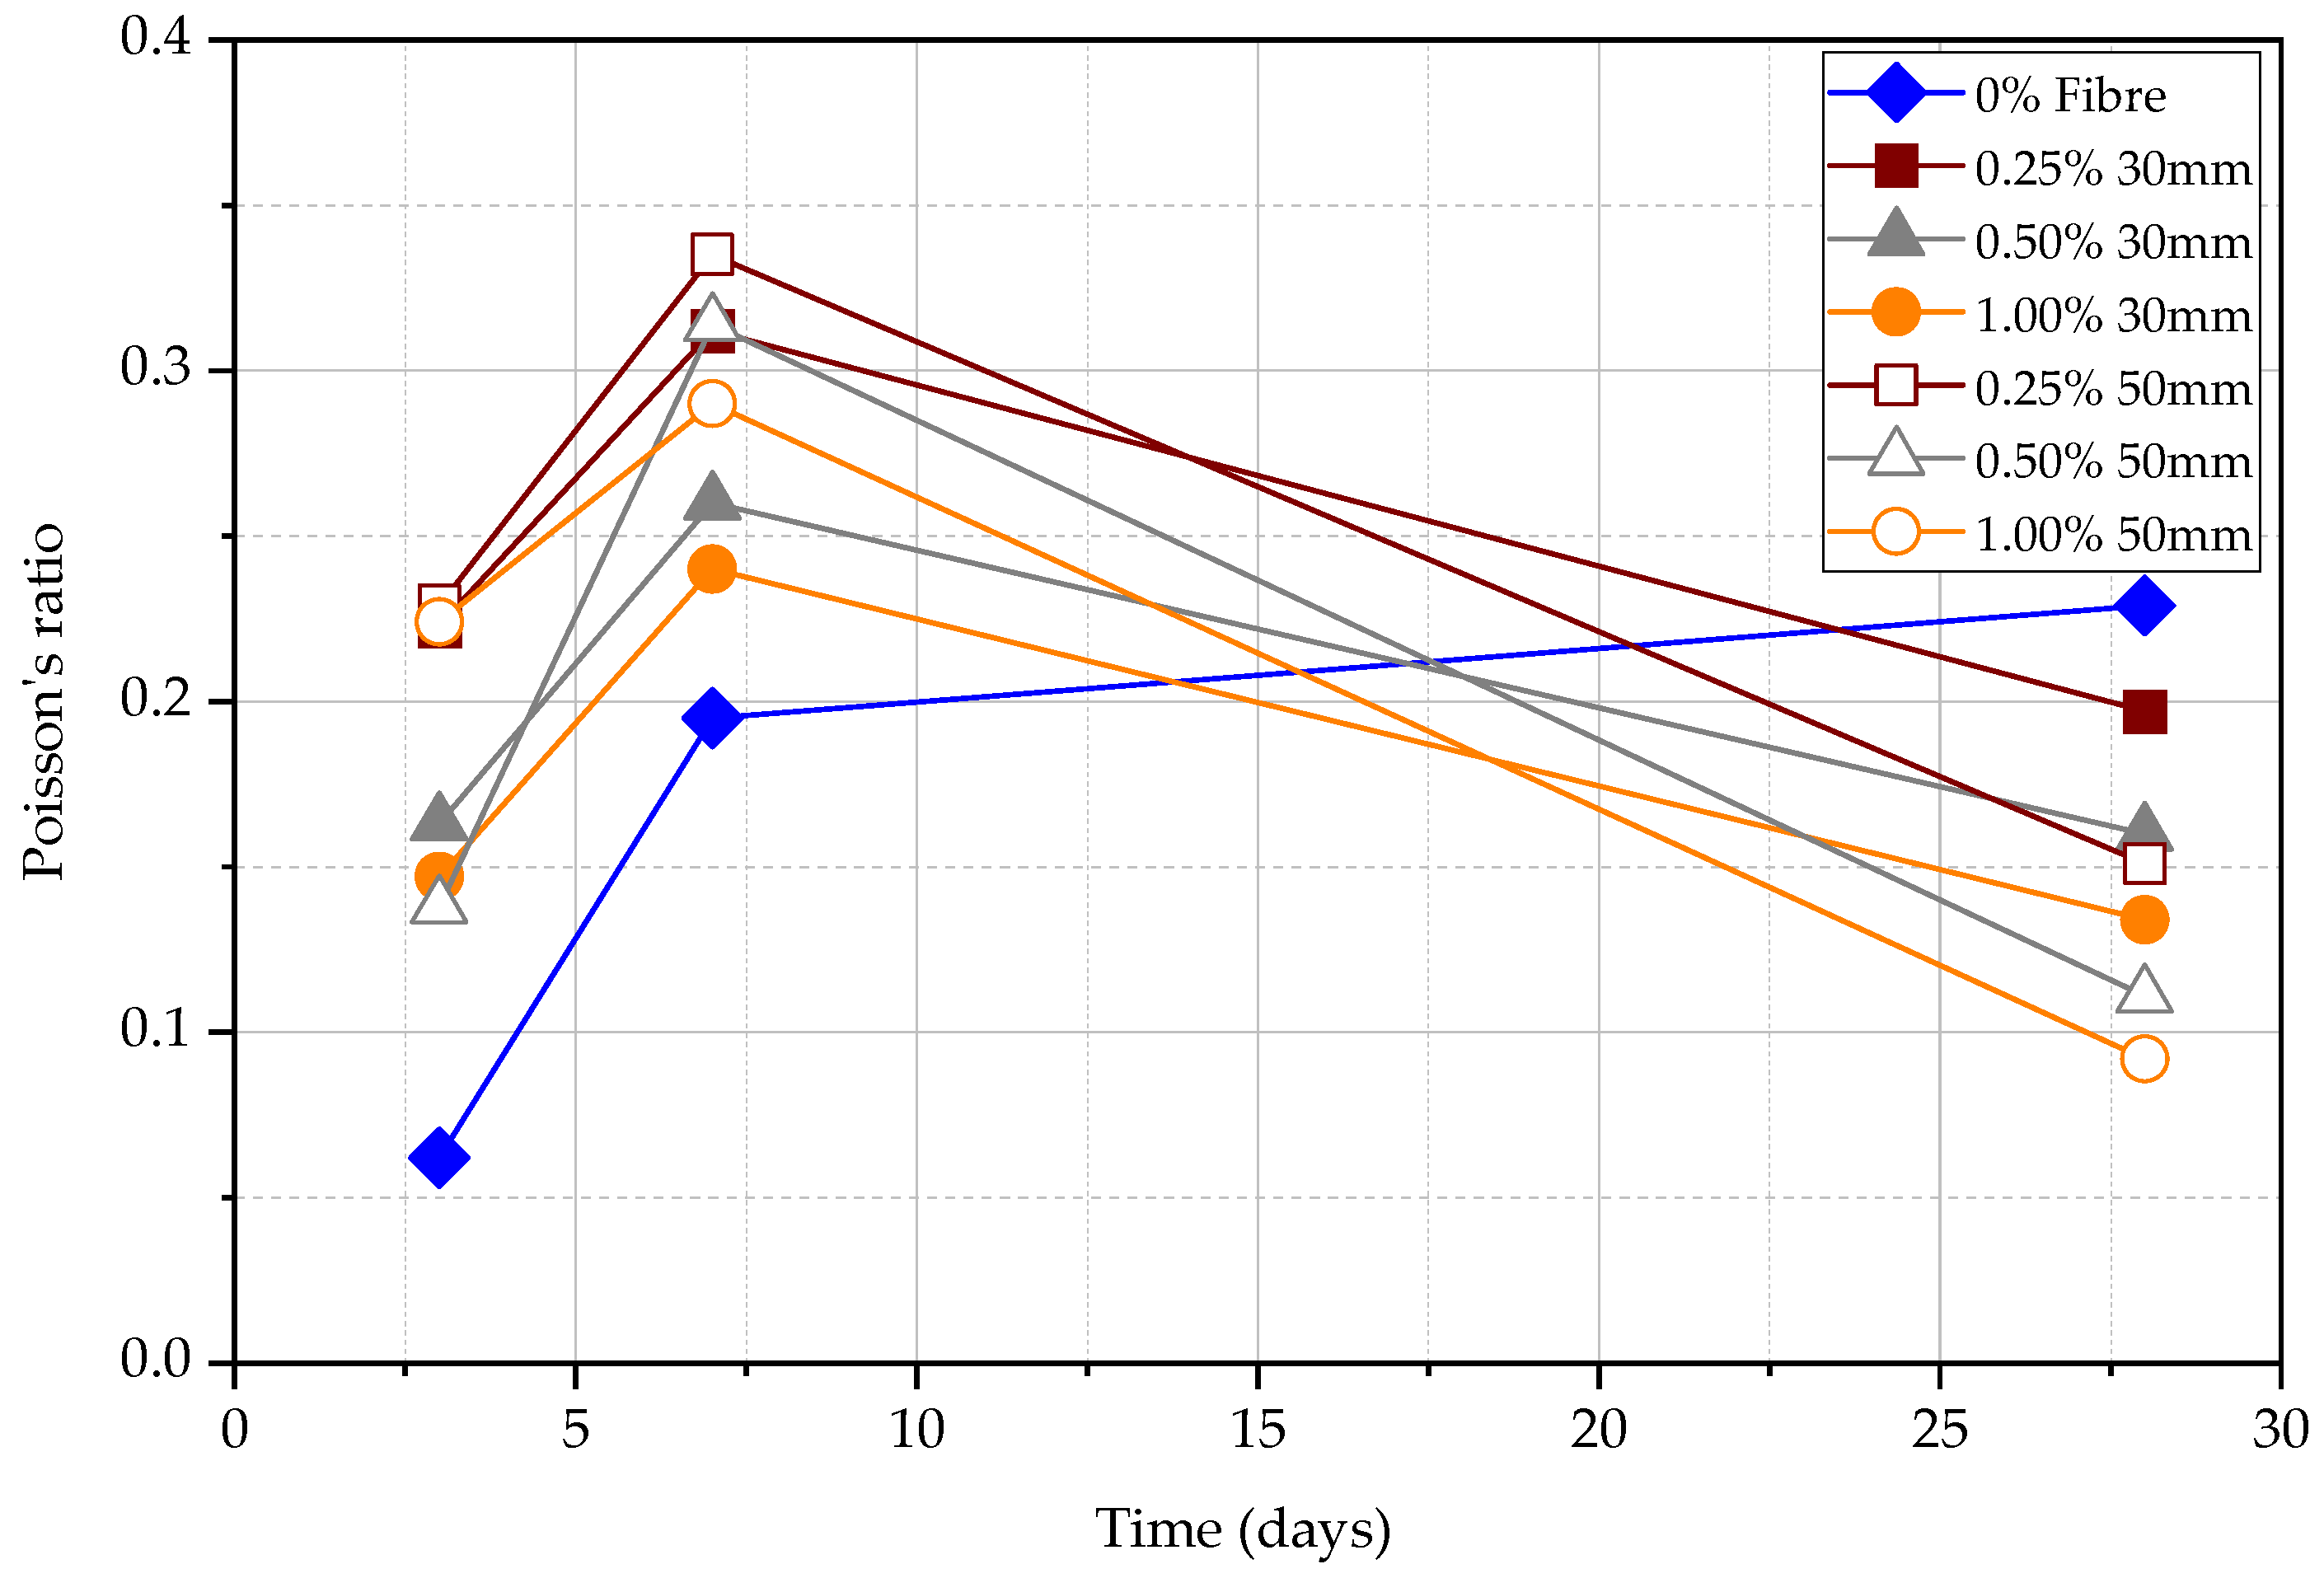
4.5. Poisson’s Ratio and Dynamic Elastic Modulus
5. Recommendations
- (1)
- To obtain a certain relationship between the compressive strength of FRC, the number of experimental cases should be increased. It is recommended to use larger dimensions of specimens to increase the accuracy.
- (2)
- It is recommended to find correlation equations from the statistical analysis of direct, semi-directed, and indirect methods to determine the compressive strength of FRC.
- (3)
- The semi-direct results are low in confidence level. Still, good correlations between semi-direct tests and compressive strength are needed as the semi-direct test could be applicable in most situations.
- (4)
- Different steel fibre lengths and fibre types should be explored in UPV tests as there are various types available and applied in real concrete structures.
- (5)
- To increase the confidence level of UPV to measure the properties of FRC, fibre content could be decided more widely and also matched with real applications. 0.25%, 0.5%, 0.75%, 1% and 1.25% steel fibre content.
6. Conclusions
- (1)
- In the long term, the effect of fibre on the rebound hammer result is minimal, while in the short term, the effect is significant. This can confirm that the rebound hammer test is unsuitable for obtaining compressive strength data in FRC early.
- (2)
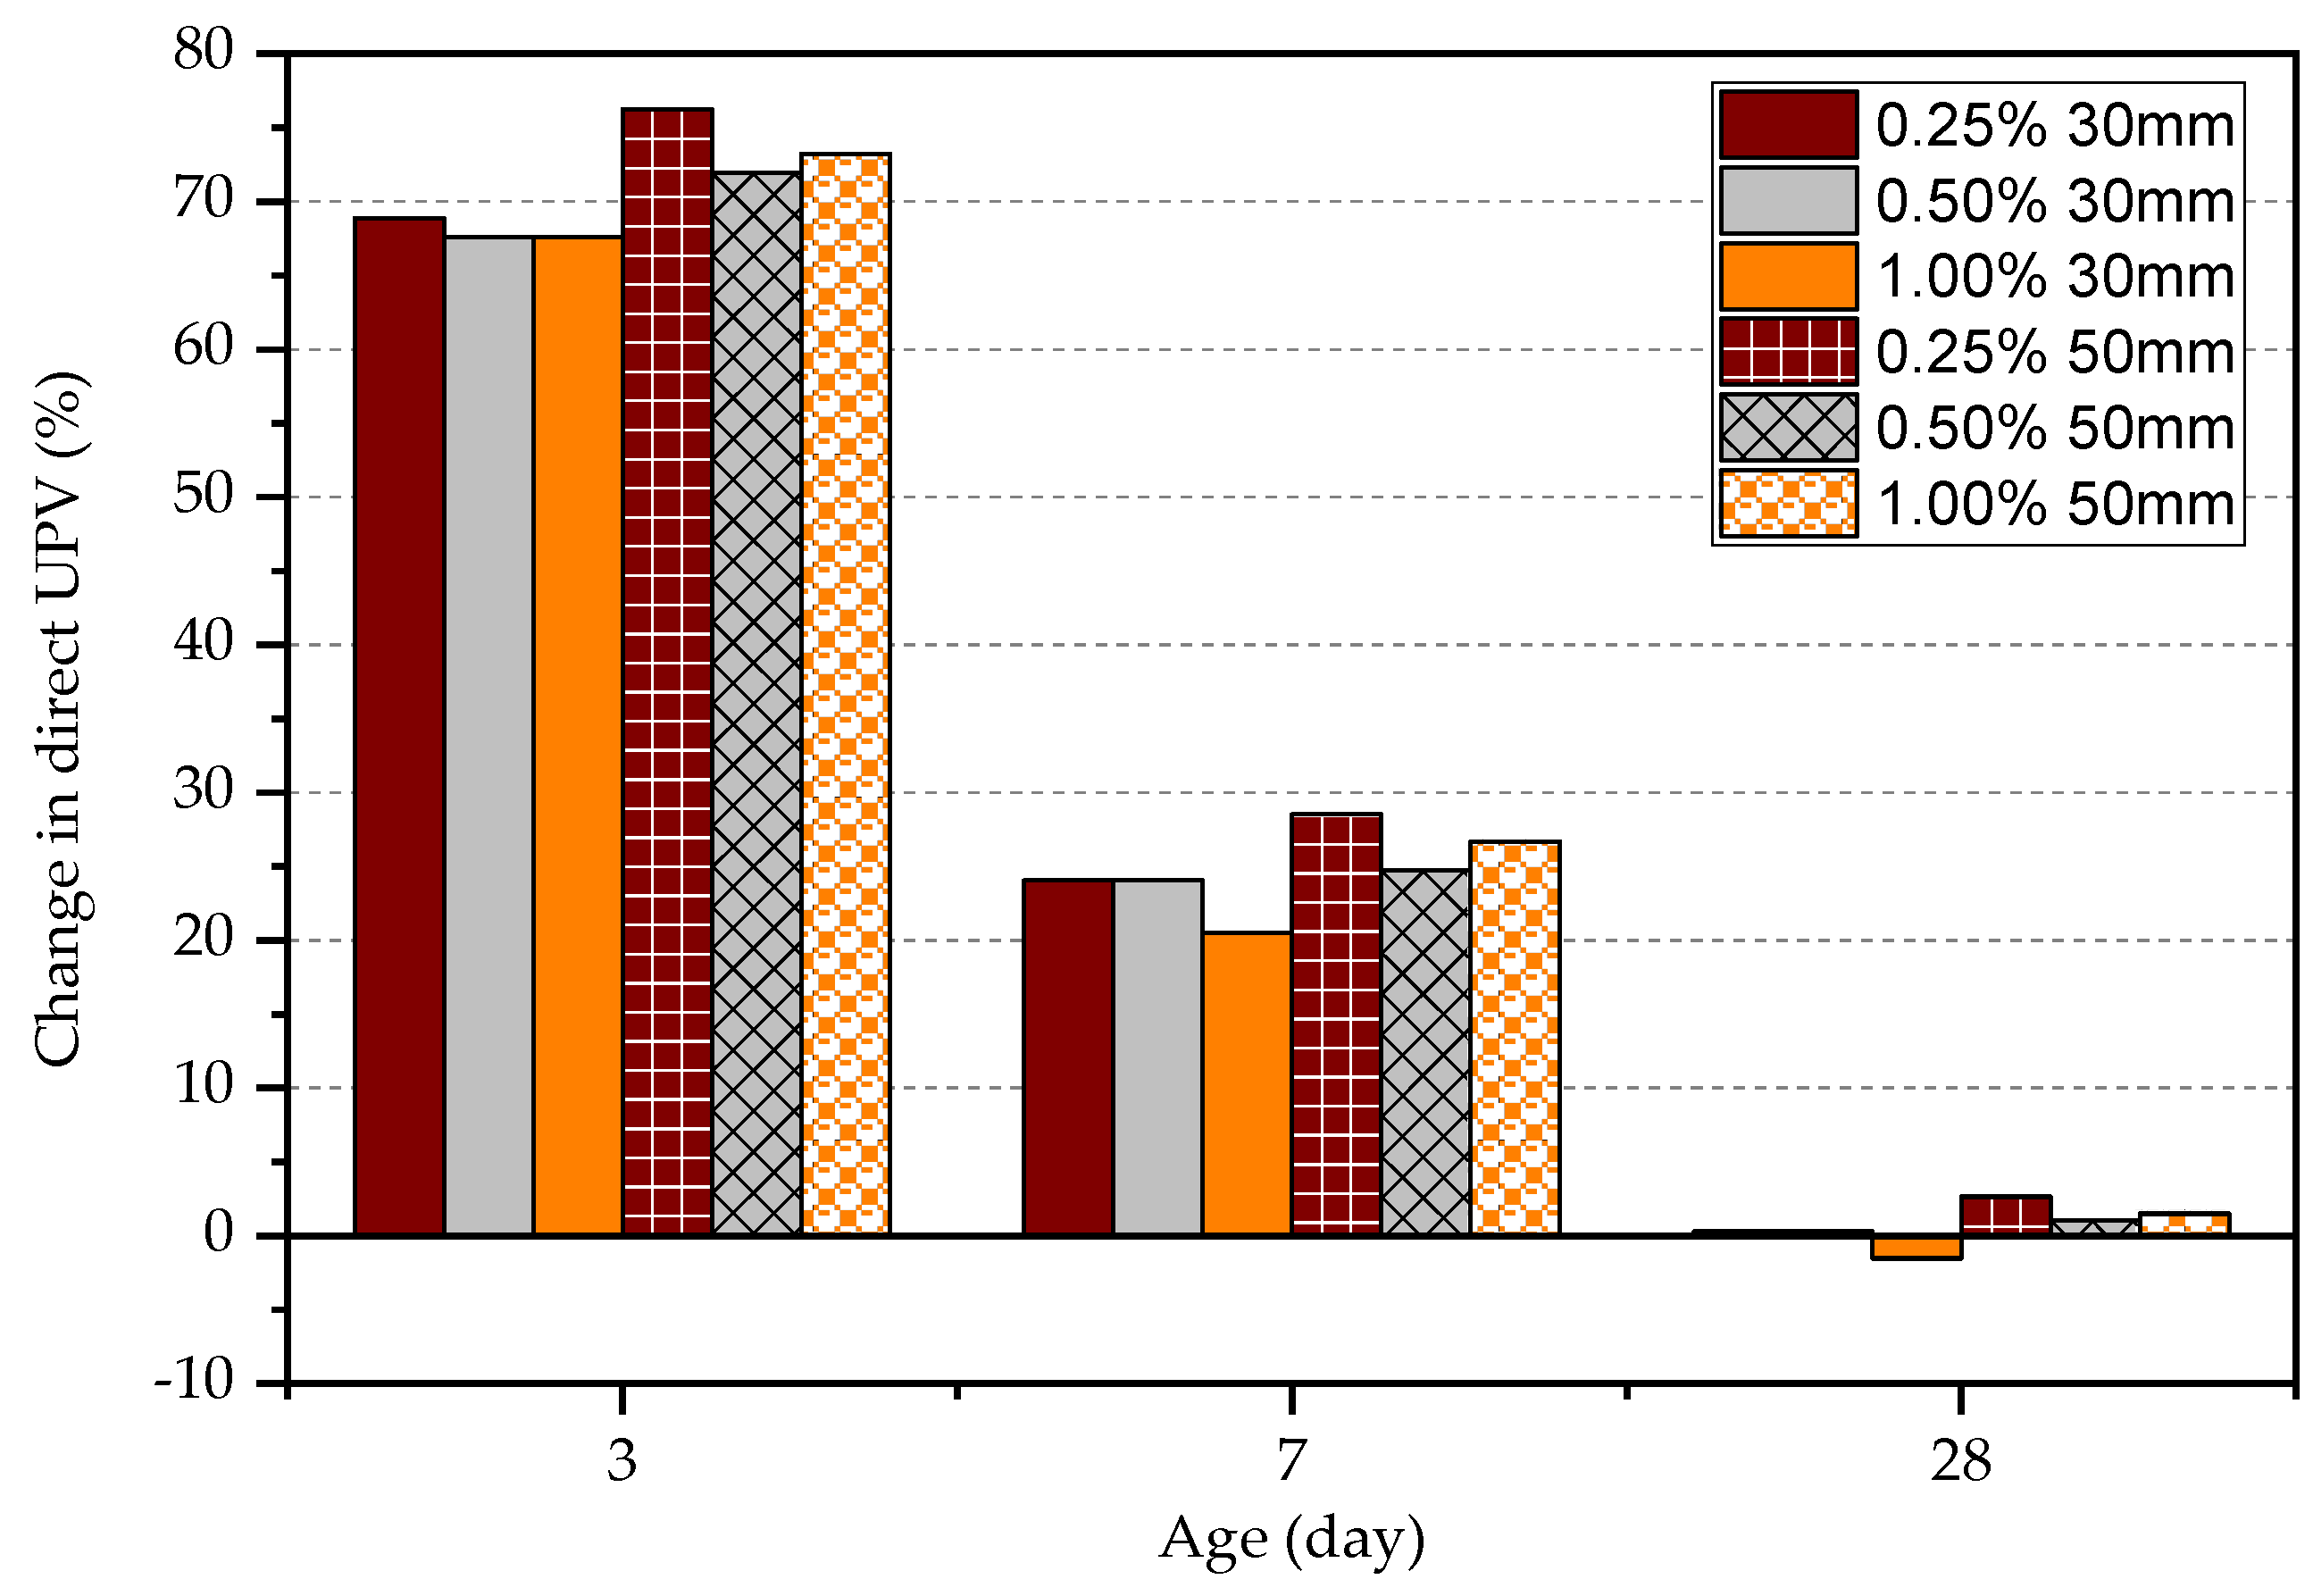
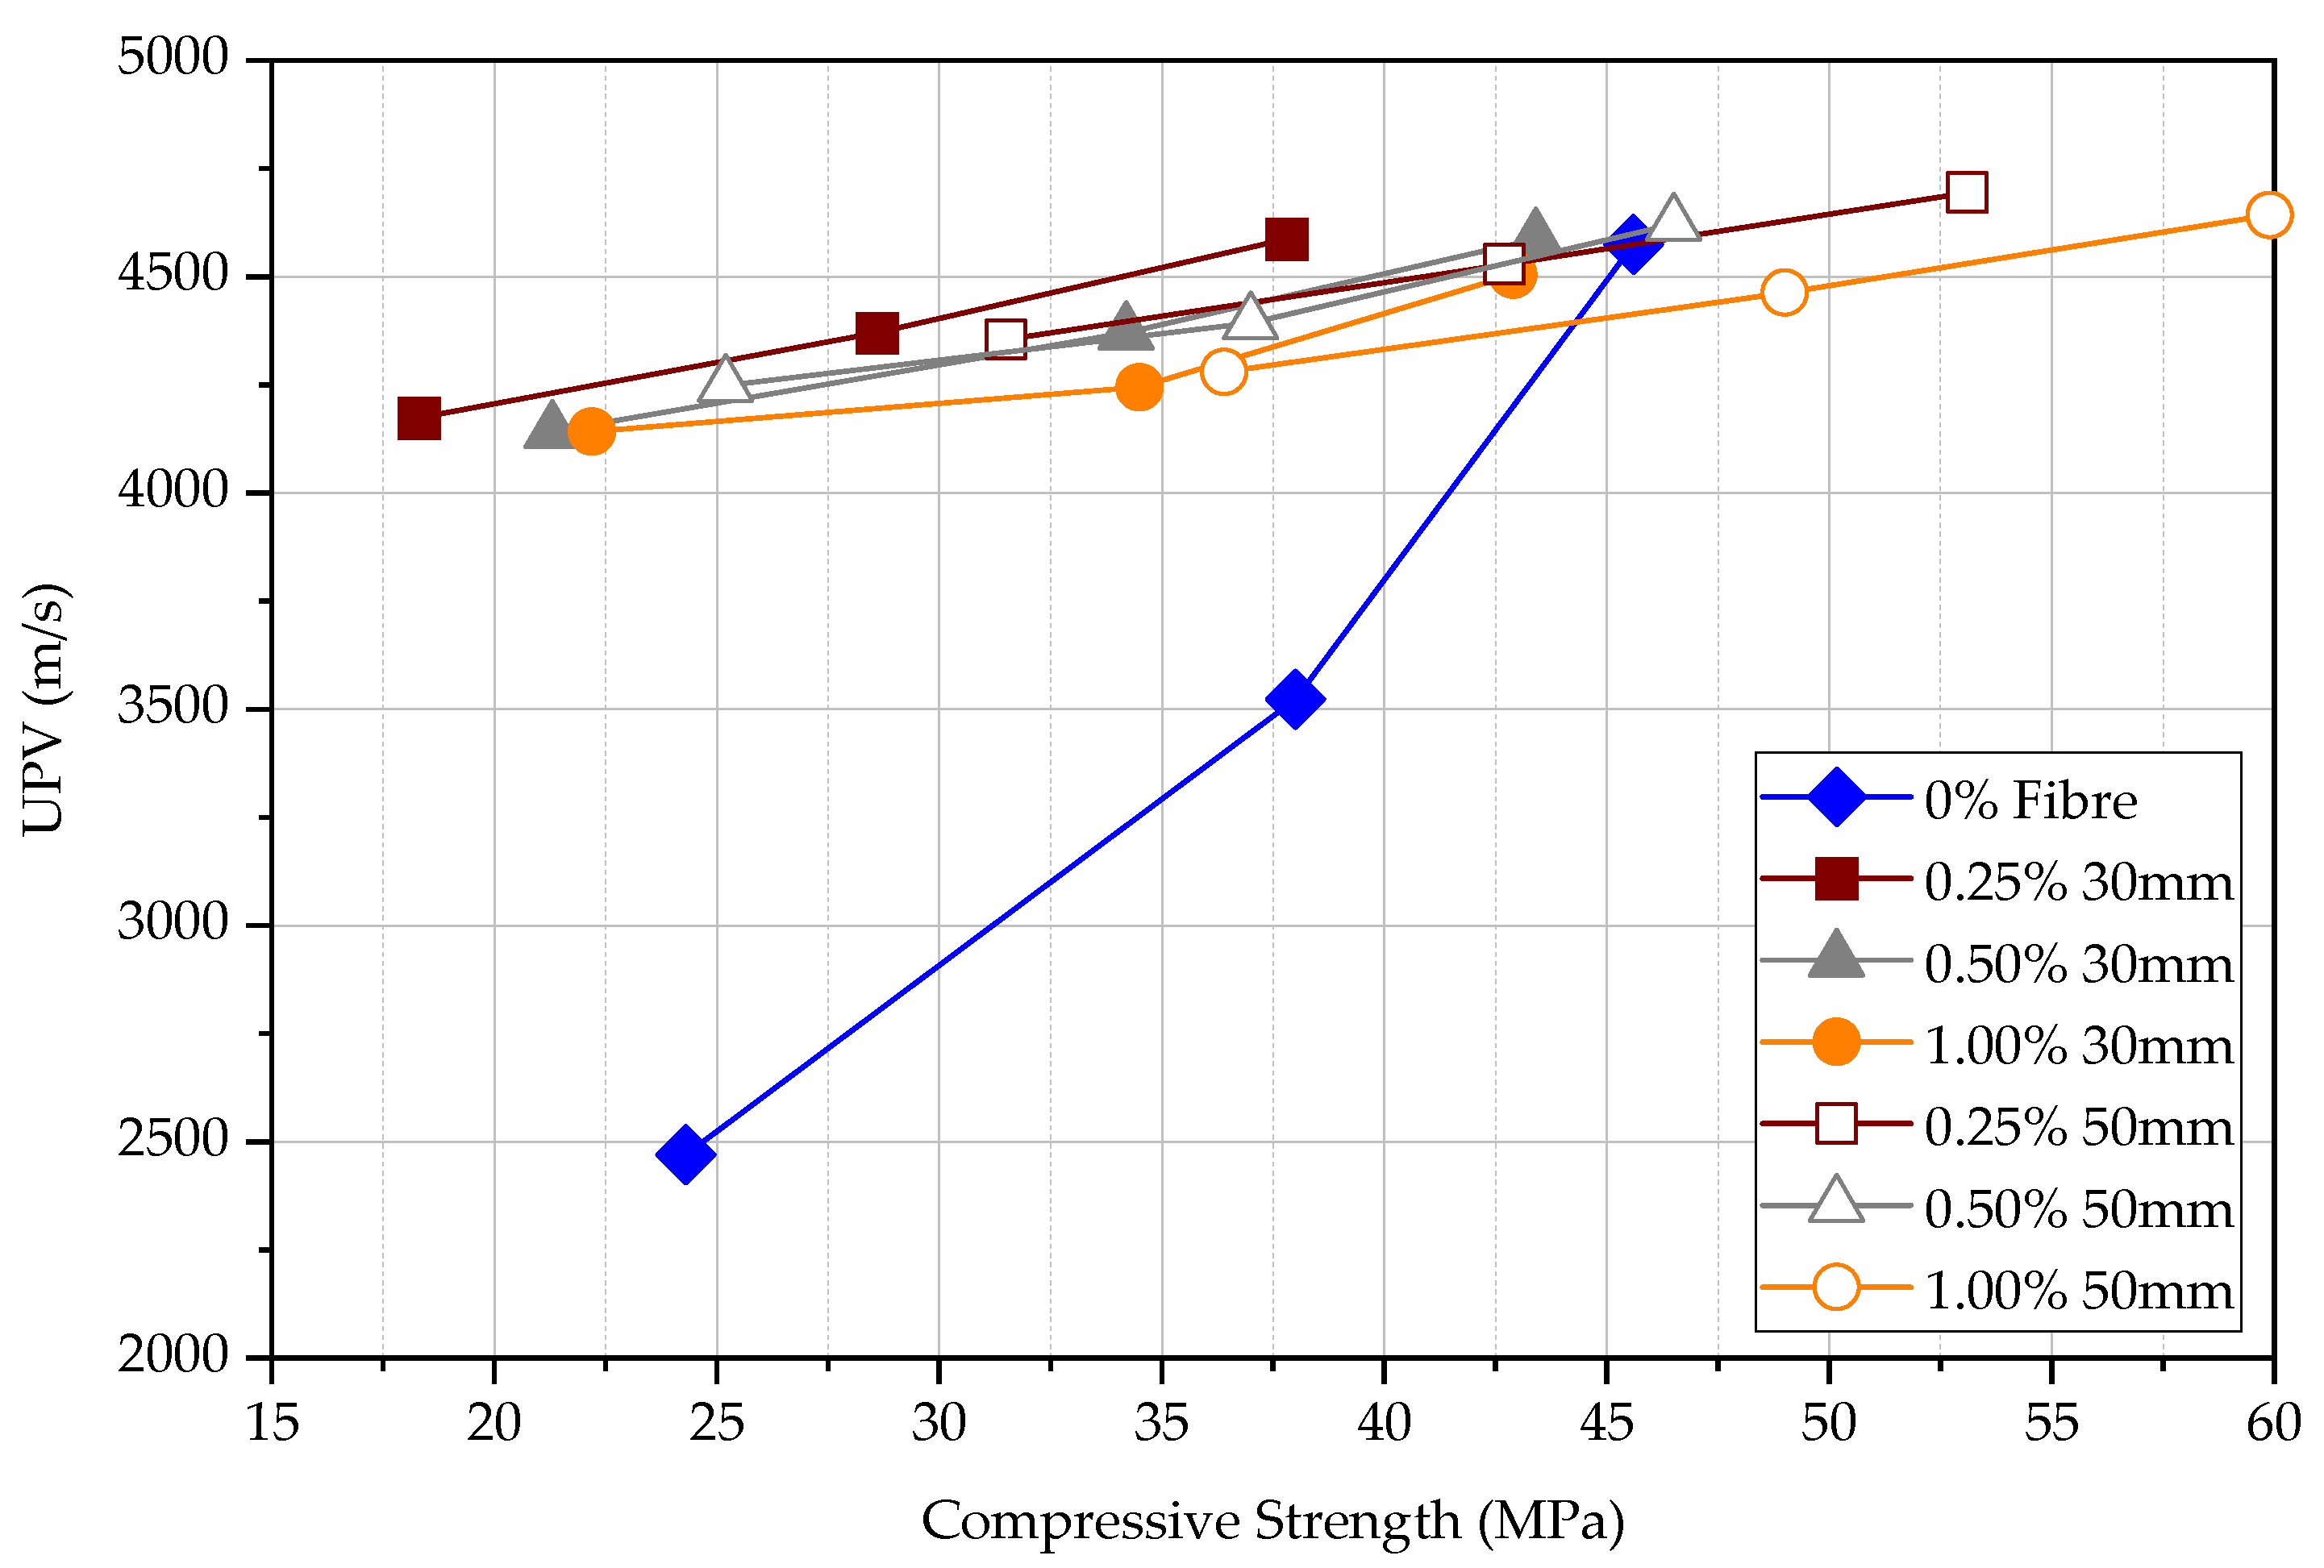
- The volume fraction of steel fibres seems ineffective in increasing the UPV. However, longer steel fibres can slightly increase the UPV measurements. The UPV in specimens with 50 mm long fibres is larger by 5.7%, 3.8%, and 2.0% at the age of 3, 7, and 28 days, respectively, in comparison to the specimens with 30 mm long fibres. This implies that the fibre content does not affect the measured UPV in matured concrete.
- (3)
- The UPV and rate of strength gain in FRC have a significant difference at an early age of concrete. Both UPV and compressive strength increase when the fibre content increases without changing the fibre length. For the same fibre content, 50 mm FRC shows a higher UPV value and compressive strength than FRC with 30 mm fibre.
- (4)
- The sequence of UPV from largest to smallest is direct UPV, semi-direct UPV, and indirect UPV, respectively. The direct UPV is approximately two times that of indirect UPV. The accuracy of semi-direct UPV is relatively lower.
- (5)
- The ratio between surface velocity and direct velocity can be used to determine the dynamic modulus of elasticity and Poisson’s ratio of the concrete. If the fibre content increases, the dynamic elastic modulus increases, and the Poisson’s ratio decrease for the same length of steel fibre. The modulus of elasticity is higher for the 50 mm steel FRC than the 30 mm steel FRC at the same percentage of steel fibre.
Author Contributions
Funding
Institutional Review Board Statement
Informed Consent Statement
Data Availability Statement
Acknowledgments
Conflicts of Interest
Appendix A

| Sieve Size (mm) | Actual Weight Retained (kg) | Percentage of Weight Retained (%) | Cumulative Percentage Retained (%) | Cumulative Percentage Passing (%) |
|---|---|---|---|---|
| Coarse Aggregates | ||||
| 0 | 0 | 0 | 100 | |
| 14 | 0.005 | 0.25 | 0.25 | 99.75 |
| 10 | 0.315 | 15.63 | 15.88 | 84.12 |
| 6.3 | 0.995 | 48.88 | 64.76 | 35.24 |
| 5 | 0.39 | 19.35 | 84.11 | 15.89 |
| 3.35 | 0.265 | 13.15 | 97.26 | 2.74 |
| 2.36 | 0.04 | 1.99 | 99.25 | 0.75 |
| Pan | 0.015 | 0.7 | 99.99 | 0 |
| Fine Aggregates | ||||
| 2.36 | 0.22 | 11 | 11 | 89 |
| 1.18 | 0.405 | 20.25 | 31.25 | 68.75 |
| 0.6 | 0.475 | 23.75 | 55 | 45 |
| 0.425 | 0.255 | 12.75 | 67.75 | 32.25 |
| 0.3 | 0.205 | 10.25 | 78 | 22 |
| 0.212 | 0.18 | 9 | 87 | 13 |
| Pan | 0.25 | 12.5 | 99.5 | 0 |
| Stage Item | Reference or Calculation | Values | ||
|---|---|---|---|---|
| 1 | 1.1 Characteristic strength | Specified | 35 N/mm2 at 28 days | |
| Proportion defective 5% | ||||
| 1.2 Standard deviation | Figure 3 | No data 8 N/mm2 | ||
| 1.3 Margin | C1 or specified | (k = 1.64) 1.64*8 = 13.12 N/mm2 | ||
| ……. N/mm2 | ||||
| 1.4 Target mean strength | C2 | 35 + 13.12 = 47.12 N/mm2 | ||
| 1.5 Cement strength class | specified | 42.5 | ||
| 1.6 Aggregate type: coarse Aggregate type: fine | Crushed | |||
| Uncrushed | ||||
| 1.7 Free-water/cement ratio | Table 2, Figure 4 | 0.47 | Use the lower values 0.45 | |
| 1.8 Maximum free-water/cement ratio | Specified | 0.45 | ||
| 2 | 2.1 Slump or Vebe time | Specified | Slump 30–180 mm2 | |
| 2.2 Maimum aggregate size | Specified | 15 mm | ||
| 2.3 Free-water content | Table 3 | 219 kg/m3 | ||
| 3 | 3.1 Cement content | C3 | 219/0.45 = 487 kg/m3 | |
| 3.2 Maximum cement content | Specified | ……. kg/m3 | ||
| 3.3 Minimum cement content | Specified | 290 kg/m3 Use 3.1 if ≤3.2 Use 3.3 if >3.1 422 kg/m3 | ||
| 3.4 Modified free-water/cement ratio | ………………………………… | |||
| 4 | 4.1 Relative density of aggregate (SSD) | 2.5 Known | ||
| 4.2 Concrete density | Figure 5 | 2275 kg/m3 | ||
| 4.3 Total aggregate content | C4 | 2275 − 487 − 219 = 1569 kg/m3 | ||
| 5 | 5.1 Grading of fine aggregate | Percentage passing 600 μm sieve: 45% | ||
| 5.2 Proportion of fine aggregate | Figure 6 | 48% | ||
| 5.3 Fine aggregate content | C5 | 1569*0.48 = 753 kg/m3 | ||
| 5.4 Coarse aggregate content | 1569 – 753 = 816 kg/m3 | |||
| 5.5 Water content | Fine aggregate | (1.85 – 1.795)/1.85 = 3% 22.6 kg water | ||
| Coarse aggregate | (2.9 – 2.775)/2.9 = 1.4% 11.42 kg water | |||
References
- Sattarifard, A.R.; Ahmadi, M.; Dalvand, A.; Sattarifard, A.R. Fresh and hardened-state properties of hybrid fiber–reinforced high-strength self-compacting cementitious composites. Constr. Build. Mater. 2022, 318, 125874. [Google Scholar] [CrossRef]
- Carrillo, J.; Ramirez, J.; Lizarazo-Marriaga, J. Modulus of elasticity and Poisson’s ratio of fiber-reinforced concrete in Colombia from ultrasonic pulse velocities. J. Build. Eng. 2019, 23, 18–26. [Google Scholar] [CrossRef]
- Kumar, P.; Monteiro, P. Concrete Microstructure, Properties and Materials, 4th ed.; McGraw-Hill Education: New York, NY, USA, 2014. [Google Scholar]
- Najm, H.M.; Nanayakkara, O.; Ahmad, M.; Sabri Sabri, M.M. Mechanical Properties, Crack Width, and Propagation of Waste Ceramic Concrete Subjected to Elevated Temperatures: A Comprehensive Study. Materials 2022, 15, 2371. [Google Scholar] [CrossRef] [PubMed]
- Najm, H.M.; Nanayakkara, O.; Ahmad, M.; Sabri Sabri, M.M. Colour Change of Sustainable Concrete Containing Waste Ceramic and Hybrid Fibre: Effect of Temperature. Materials 2022, 15, 2174. [Google Scholar] [CrossRef] [PubMed]
- Abbass, W.; Khan, M.; Mourad, S. Evaluation of mechanical properties of steel fiber reinforced concrete with different strengths of concrete. Constr. Build. Mater. 2018, 168, 556–569. [Google Scholar] [CrossRef]
- Parra-Montesinos, G. High-performance fiber-reinforced cement composites: An alternative for seismic design of structures. ACI Struct. J. 2005, 102, 668–675. [Google Scholar]
- Facconi, L.; Amin, A.; Minelli, F.; Plizzari, G. A unified approach for determining the strength of FRC beams subjected to torsion–Part II: Analytical modeling. Struct. Concr. 2021, 22, 3780–3797. [Google Scholar] [CrossRef]
- Hassan, A.; Jones, S. Non-destructive testing of ultra-high performance fibre reinforced concrete (UHPFRC): A feasibility study for using ultrasonic and resonant frequency testing techniques. Constr. Build. Mater. 2012, 35, 361–367. [Google Scholar] [CrossRef]
- Zhang, Y.; Aslani, F.; Lehane, B. Compressive strength of rubberized concrete: Regression and GA-BPNN approaches using ultrasonic pulse velocity. Constr. Build. Mater. 2021, 307, 124951. [Google Scholar] [CrossRef]
- Mohammed, B.S.; Azmi, N.J.; Abdullahi, M. Evaluation of rubbercrete based on ultrasonic pulse velocity and rebound hammer tests. Constr. Build. Mater. 2011, 25, 1388–1397. [Google Scholar] [CrossRef]
- Hamidian, M.; Shariati, M.; Arabnejad, M.M.K.; Sinaei, H. Assessment of high strength and light weight aggregate concrete properties using ultrasonic pulse velocity technique. Int. J. Phys. Sci. 2011, 6, 5261–5266. [Google Scholar]
- Saha, A.K.; Majhi, S.; Sarker, P.K.; Mukherjee, A.; Siddika, A.; Aslani, F.; Zhuge, Y. Non-destructive prediction of strength of concrete made by lightweight recycled aggregates and nickel slag. J. Build. Eng. 2021, 33, 101614. [Google Scholar] [CrossRef]
- Kumar, S.; Rai, B. Pulse velocity–strength and elasticity relationship of high volume fly ash induced self-compacting concrete. J. Struct. Integr. Maint. 2019, 4, 216–229. [Google Scholar] [CrossRef]
- Shariq, M.; Prasad, J.; Masood, A. Studies in ultrasonic pulse velocity of concrete containing GGBFS. Constr. Build. Mater. 2013, 40, 944–950. [Google Scholar] [CrossRef]
- de Oliveira Dias, A.R.; Amancio, F.A.; de Carvalho Rafael, M.F.; Cabral, A.E.B. Study of propagation of ultrasonic pulses in concrete exposed at high temperatures. Procedia Struct. Integr. 2018, 11, 84–90. [Google Scholar] [CrossRef]
- Lencis, U.; Udris, A.; Korjakins, A. Frost influence on the ultrasonic pulse velocity in concrete at early phases of hydration process. Case Stud. Constr. Mater. 2021, 15, e00614. [Google Scholar] [CrossRef]
- Blitz, J.; Simpson, G. Ultrasonic Methods of Non-Destructive Testing; Chapman & Hall: London, UK, 1996. [Google Scholar]
- Malhotra, V.; Carino, N. Non-Destructive Testing of Concrete, 2nd ed.; CRC Press: New York, NY, USA, 2004. [Google Scholar]
- Mohod, M.V. Performance of steel fiber reinforced concrete. Int. J. Eng. Sci. 2012, 1, 1–4. [Google Scholar]
- Saleem, M. Study to detect bond degradation in reinforced concrete beams using ultrasonic pulse velocity test method. Struct. Eng. Mech. Int. J. 2017, 644, 427–436. [Google Scholar]
- Thorpe, J. Simplified Version of The Recommended Practice for Evaluation of Strength Test-Results. Aci. Mater. J. 1988, 85, 272–279. [Google Scholar]
- Haktanır, T.; Altun, F.; Karahan, O.; Arı, K.; Bekmezci, M. Indirect Determination of In-Situ Compressive Strength of Concrete as a Function of Ultrasonic Pulse Velocity. In International Symposium on Structural and Earthquake Engineering 2002; Middle East Technical University: Ankara, Turkey, 2002. [Google Scholar]
- The Engineering Toolbox. Poisson’s Ratio. The Engineering Toolbox. Available online: http://www.engineeringtoolbox.com/poissons-ratio-d_1224.html (accessed on 1 January 2017).
- Clayton, D.; Franklin, R.E.; Erntroy, H.C. Design of Normal Concrete Mixes; Department of the Environment: Watford, UK, 1988. [Google Scholar]


| Fibre Material | Length (mm) | Diameter (mm) | Aspect Ratio (l/d) | Specific Gravity | Modulus (GPa) |
|---|---|---|---|---|---|
| Steel | 30 | 0.3 | 100 | 7.85 | 200 |
| Steel | 50 | 0.5 | 100 | 7.85 | 200 |
| Quantities | Cement (kg) | Water (kg or L) | Fine Aggregate (kg) | Coarse Aggregate (kg) |
|---|---|---|---|---|
| Materials (saturated) | 487 | 219 | 753 | 816 |
| Materials (dry) | 487 | 253 | 730 | 804 |
| Specimen Type | Dimensions (mm) | Number |
|---|---|---|
| Cube | 63 | |
| Beam 1 | 2 | |
| Beam 2 | 2 | |
| Beam 3 | 2 | |
| Beam 4 | 2 | |
| Beam 5 | 7 |
| Average Rebound | Quality of Concrete |
|---|---|
| >40 | Very good |
| 30–40 | Good |
| 20–30 | Fair |
| <20 | Poor and/or delaminated |
| 0 | Very poor and/or delaminated |
| UPV (m/s) | Concrete Quality |
|---|---|
| >4500 | Excellent |
| 3500 to 4500 | Good |
| 3000 to 3500 | Medium |
| <3000 | Doubtful |
| Transducer Frequency (kHz) | Pulse Velocity in Concrete (m/s) | ||
|---|---|---|---|
| Vc = 3500 | Vc = 4000 | Vc = 4500 | |
| Minimum Permissible Lateral Specimen Dimension (mm) | |||
| 24 | 146 | 167 | 188 |
| 54 | 65 | 74 | 83 |
| 82 | 43 | 49 | 55 |
| 150 | 23 | 27 | 30 |
| Time (Days) | Fibre Content and Length for 100 mm Path Length | ||||||
|---|---|---|---|---|---|---|---|
| 0% | 0.25% 30 mm | 0.50% 30 mm | 1.00% 30 mm | 0.25% 50 mm | 0.50% 50 mm | 1.00% 50 mm | |
| 3 | 2192 | 2610 | 2736 | 3014 | 2962 | 2959 | 2240 |
| 7 | 2347 | 2285 | 2230 | 2250 | 2131 | 2345 | 2880 |
| 28 | 2539 | 2584 | 2932 | 4087 | 3333 | 3431 | 3574 |
| Fibre content and length for 200 mm path length (m/s) | |||||||
| Time (days) | 0% | 0.25% 30 mm | 0.50% 30 mm | 1.00% 30 mm | 0.25% 50 mm | 0.50% 50 mm | 1.00% 50 mm |
| 3 | 2380 | 2747 | 2828 | 2436 | 2680 | 2424 | 2380 |
| 7 | 1908 | 2244 | 2304 | 1833 | 1913 | 2103 | 2765 |
| 28 | 2754 | 2906 | 3164 | 3498 | 3909 | 4073 | 2987 |
| Time (Days) | Variation of UPV (m/s) | ||||||
|---|---|---|---|---|---|---|---|
| 0% | 0.25% 30 mm | 0.50% 30 mm | 1.00% 30 mm | 0.25% 50 mm | 0.50% 50 mm | 1.00% 50 mm | |
| 3 | 8.58 | 5.25 | 3.36 | −19.18 | −9.52 | −18.08 | 6.25 |
| 7 | −18.7 | −1.79 | 3.32 | −18.53 | −10.23 | −10.32 | −3.99 |
| 28 | 8.47 | 12.46 | 7.91 | −14.41 | 17.28 | 18.71 | −16.42 |
| Age (Days) | (m/s) | (m/s) | Modulus of Elasticity, (GPa) | Poisson’s Ratio, v | |
|---|---|---|---|---|---|
| 3 | 2471 | 2028 | 1.218 | 15.14 | 0.062 |
| 7 | 3523 | 2144 | 1.643 | 28.10 | 0.195 |
| 28 | 4574 | 2558 | 1.788 | 45.20 | 0.229 |
| Age (Days) | Fibre Content (%) | (m/s) | (m/s) | Modulus of Elasticity, (GPa) | Poisson’s Ratio, | |
|---|---|---|---|---|---|---|
| 3 | 0.25 | 4194 | 2380 | 1.762 | 38.34 | 0.223 |
| 7 | 4364 | 1908 | 2.287 | 34.10 | 0.312 | |
| 28 | 4541 | 2754 | 1.649 | 46.59 | 0.197 | |
| 3 | 0.50 | 4173 | 2747 | 1.519 | 40.79 | 0.163 |
| 7 | 4370 | 2244 | 1.947 | 39.00 | 0.260 | |
| 28 | 4387 | 2906 | 1.510 | 45.20 | 0.160 | |
| 3 | 1.00 | 4142 | 2828 | 1.465 | 40.72 | 0.147 |
| 7 | 4244 | 2304 | 1.842 | 38.20 | 0.240 | |
| 28 | 4504 | 3164 | 1.424 | 48.61 | 0.134 |
| Age (Days) | Fibre Content (%) | (m/s) | (m/s) | Modulus of Elasticity, (GPa) | Poisson’s Ratio, | |
|---|---|---|---|---|---|---|
| 3 | 0.25 | 4355 | 2436 | 1.788 | 40.98 | 0.229 |
| 7 | 4528 | 1833 | 2.470 | 34.02 | 0.335 | |
| 28 | 4694 | 3174 | 1.479 | 52.14 | 0.151 | |
| 3 | 0.50 | 4248 | 2959 | 1.436 | 43.13 | 0.138 |
| 7 | 4393 | 1913 | 2.296 | 34.38 | 0.314 | |
| 28 | 4641 | 3431 | 1.353 | 52.36 | 0.111 | |
| 3 | 1.00 | 4280 | 2424 | 1.766 | 39.88 | 0.224 |
| 7 | 4463 | 2103 | 2.122 | 38.05 | 0.290 | |
| 28 | 4642 | 3573 | 1.299 | 52.86 | 0.092 |
Publisher’s Note: MDPI stays neutral with regard to jurisdictional claims in published maps and institutional affiliations. |
© 2022 by the authors. Licensee MDPI, Basel, Switzerland. This article is an open access article distributed under the terms and conditions of the Creative Commons Attribution (CC BY) license (https://creativecommons.org/licenses/by/4.0/).
Share and Cite
Najm, H.M.; Nanayakkara, O.; Sabri, M.M.S. Destructive and Non-Destructive Evaluation of Fibre-Reinforced Concrete: A Comprehensive Study of Mechanical Properties. Materials 2022, 15, 4432. https://doi.org/10.3390/ma15134432
Najm HM, Nanayakkara O, Sabri MMS. Destructive and Non-Destructive Evaluation of Fibre-Reinforced Concrete: A Comprehensive Study of Mechanical Properties. Materials. 2022; 15(13):4432. https://doi.org/10.3390/ma15134432
Chicago/Turabian StyleNajm, Hadee Mohammed, Ominda Nanayakkara, and Mohanad Muayad Sabri Sabri. 2022. "Destructive and Non-Destructive Evaluation of Fibre-Reinforced Concrete: A Comprehensive Study of Mechanical Properties" Materials 15, no. 13: 4432. https://doi.org/10.3390/ma15134432
APA StyleNajm, H. M., Nanayakkara, O., & Sabri, M. M. S. (2022). Destructive and Non-Destructive Evaluation of Fibre-Reinforced Concrete: A Comprehensive Study of Mechanical Properties. Materials, 15(13), 4432. https://doi.org/10.3390/ma15134432