
Optimal Design of Ferronickel Slag Alkali-Activated Material for High Thermal Load Applications Developed by Design of Experiment


Abstract
1. Introduction
2. Materials and Methods
2.1. Raw Materials
2.2. Sample Preparation
2.3. Heat Treatment
2.4. Testing of Mechanical Properties
2.5. XRD Method
2.6. Design of Experimental Matrix
2.7. Life Cycle Assessment (LCA) Method
3. Results and Discussion
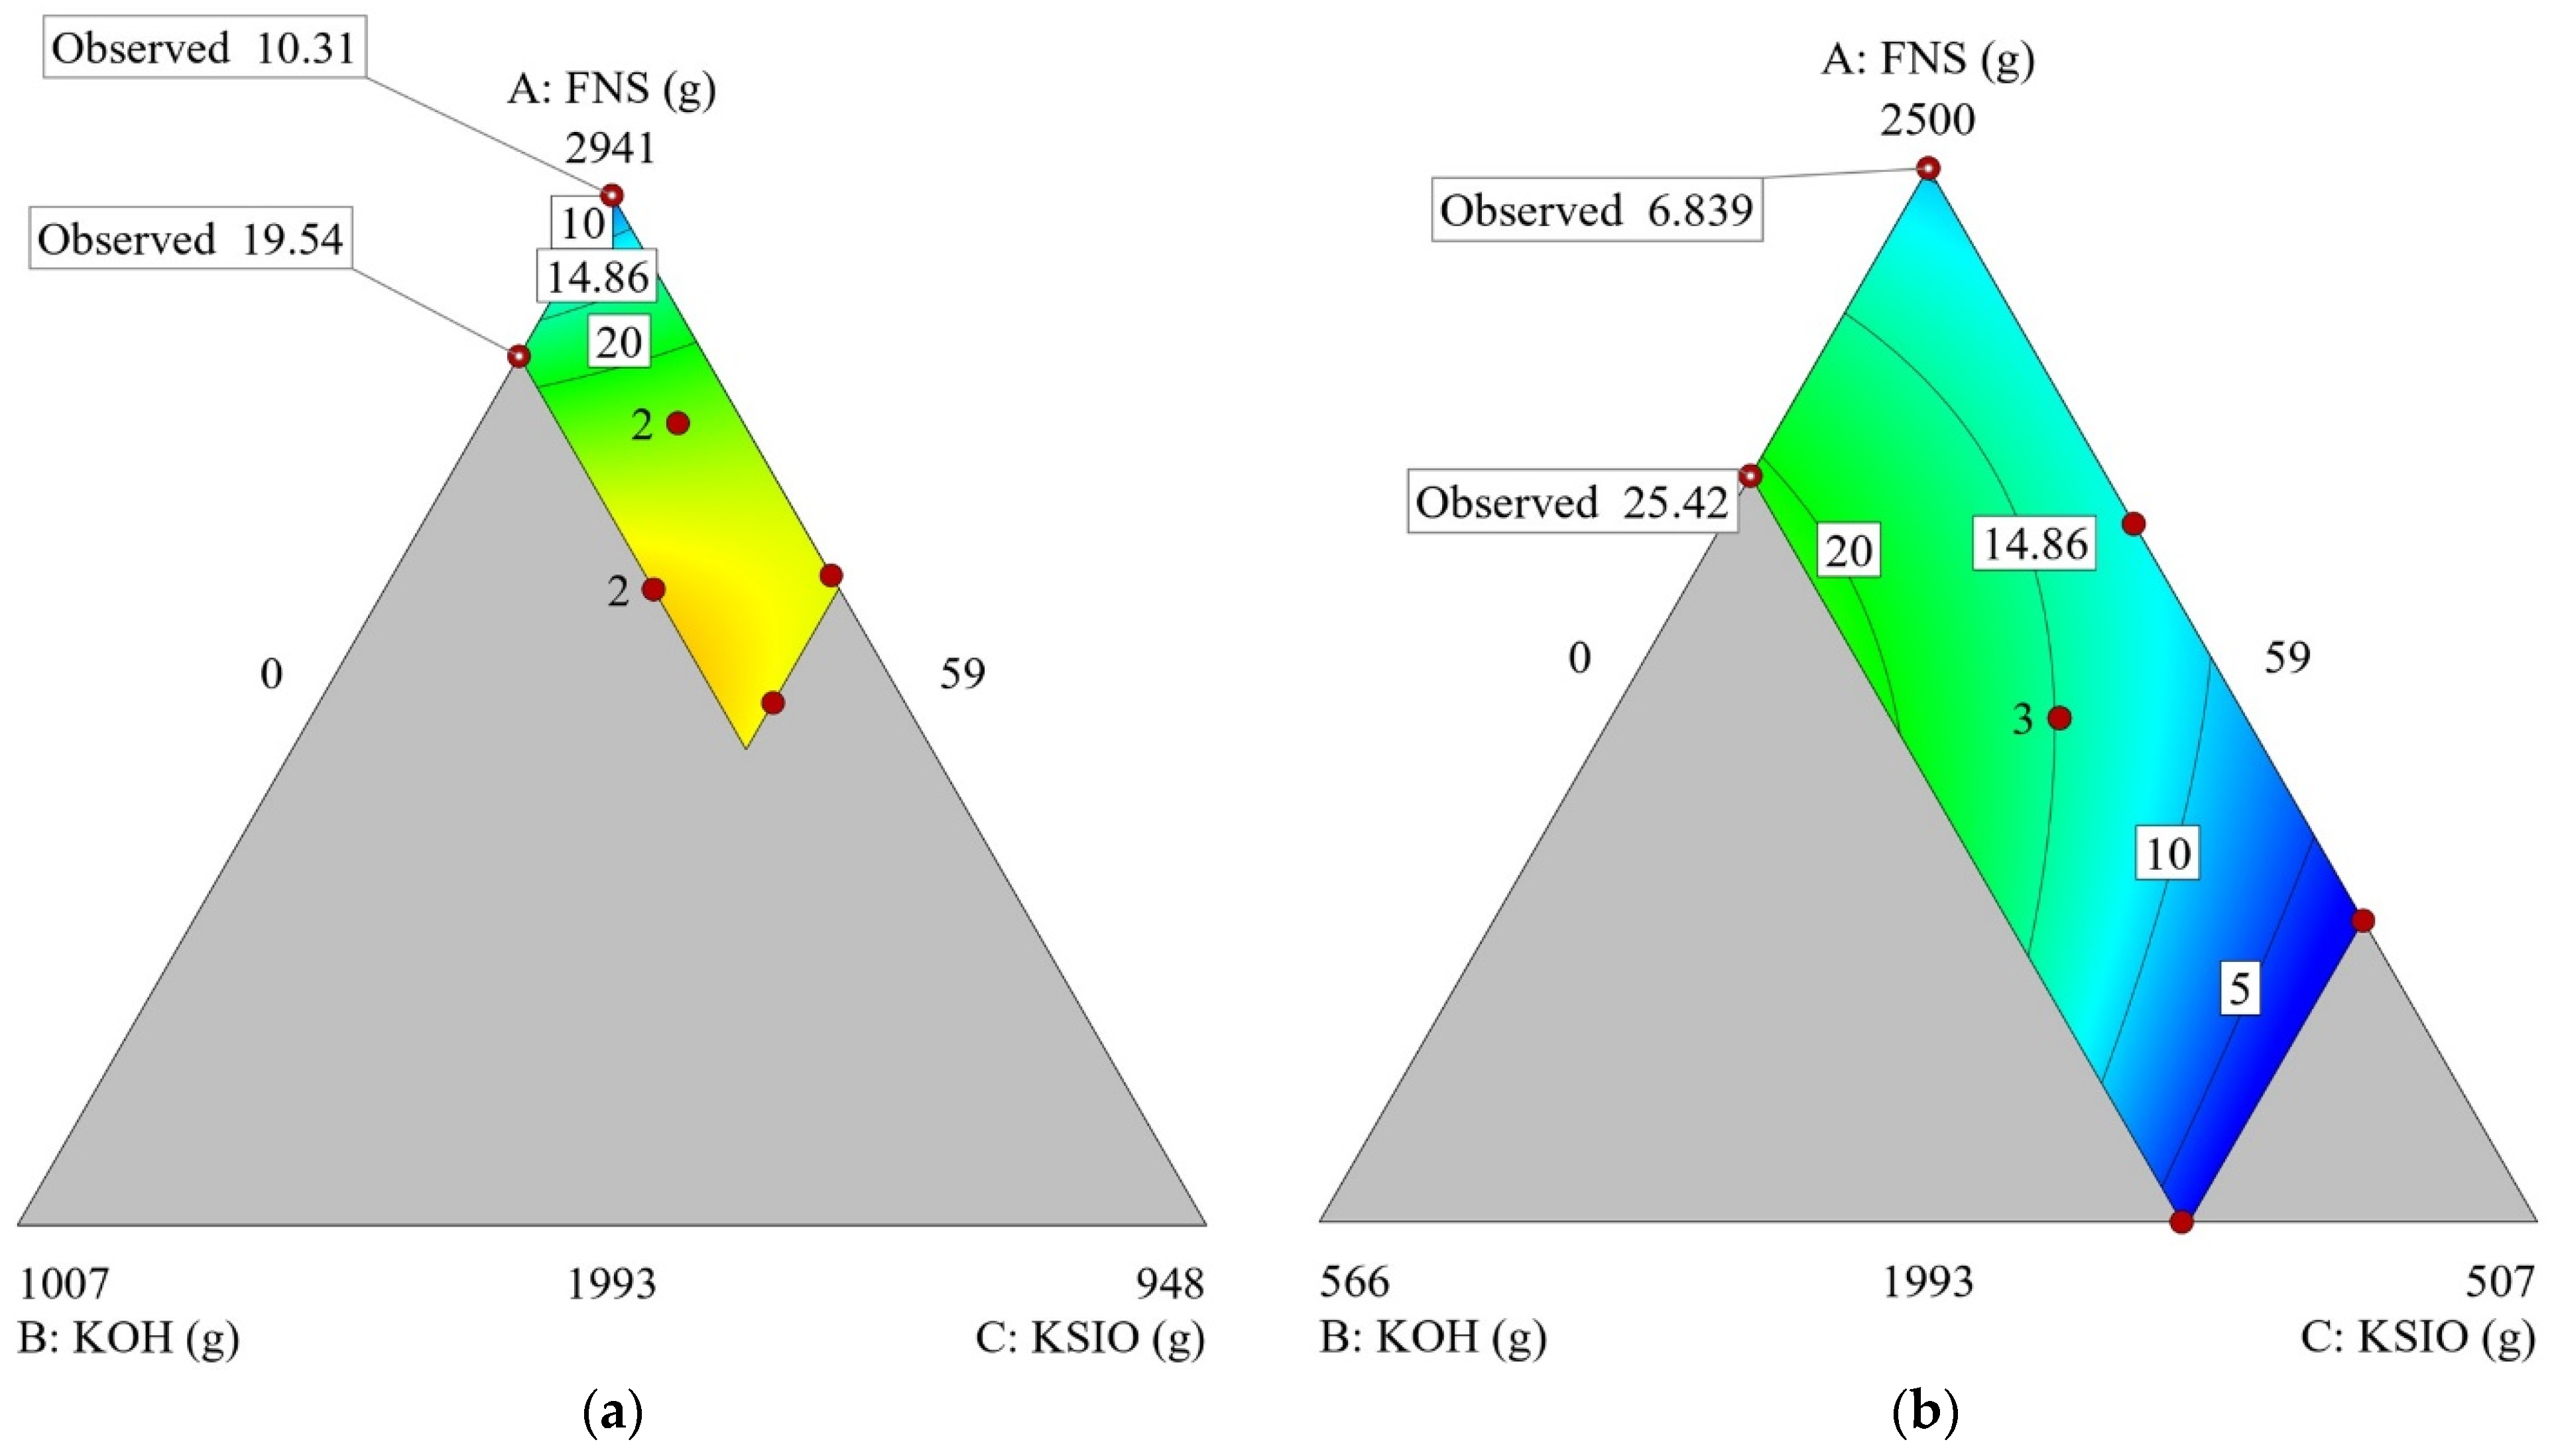
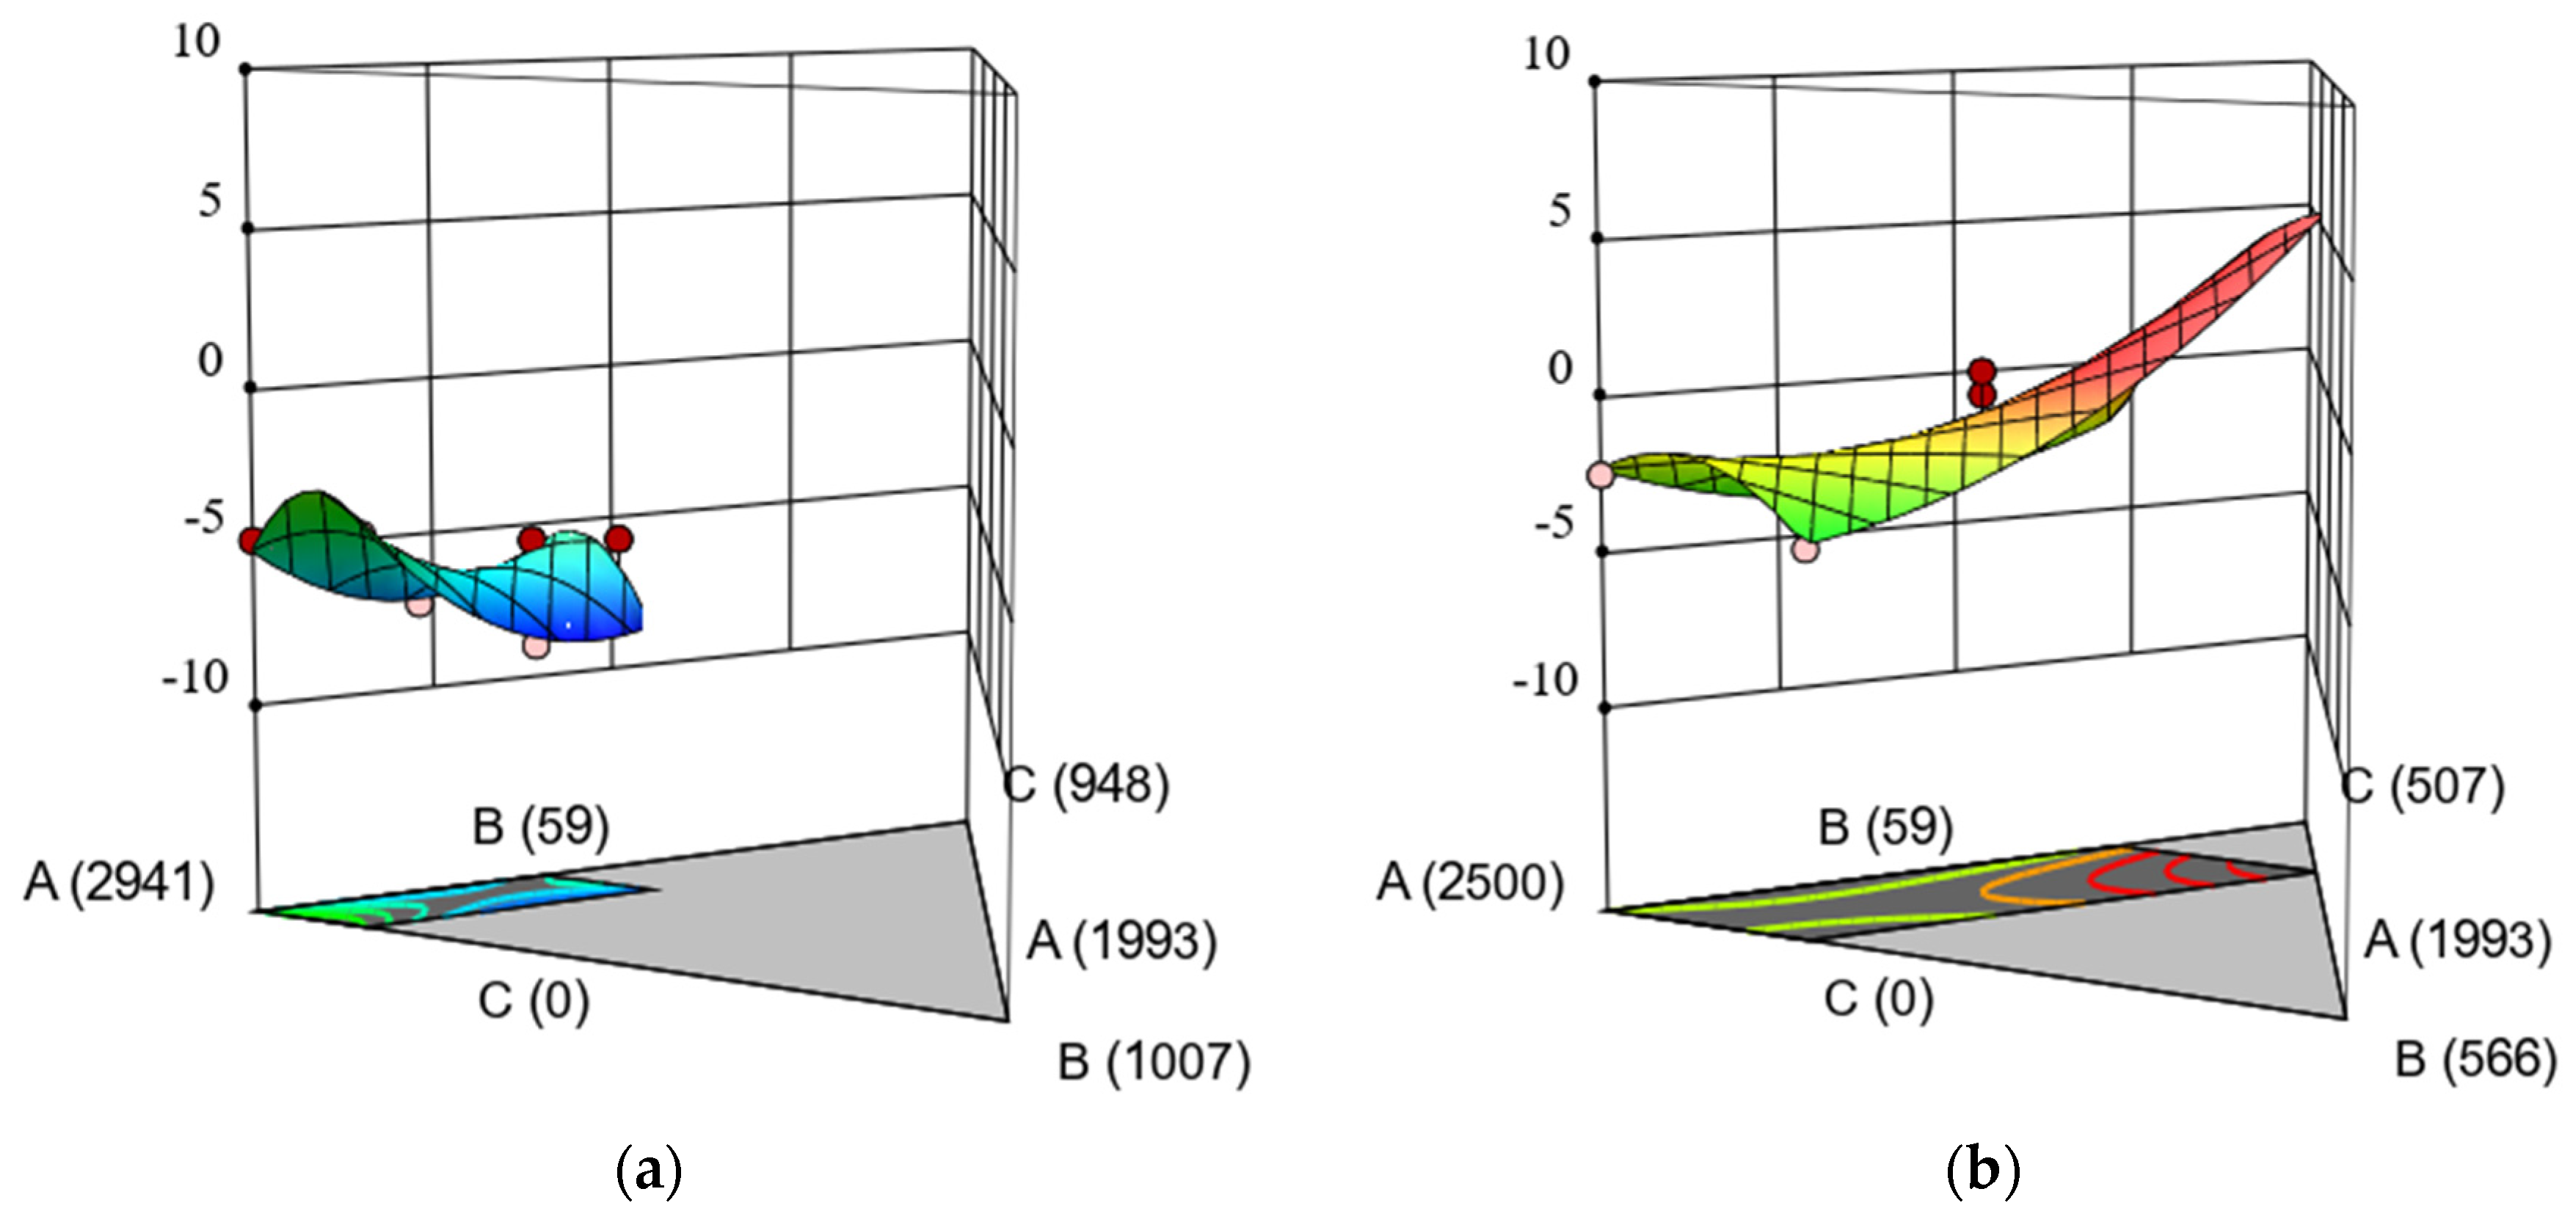
3.1. Derivation of Models
3.2. Optimal Paste Mix
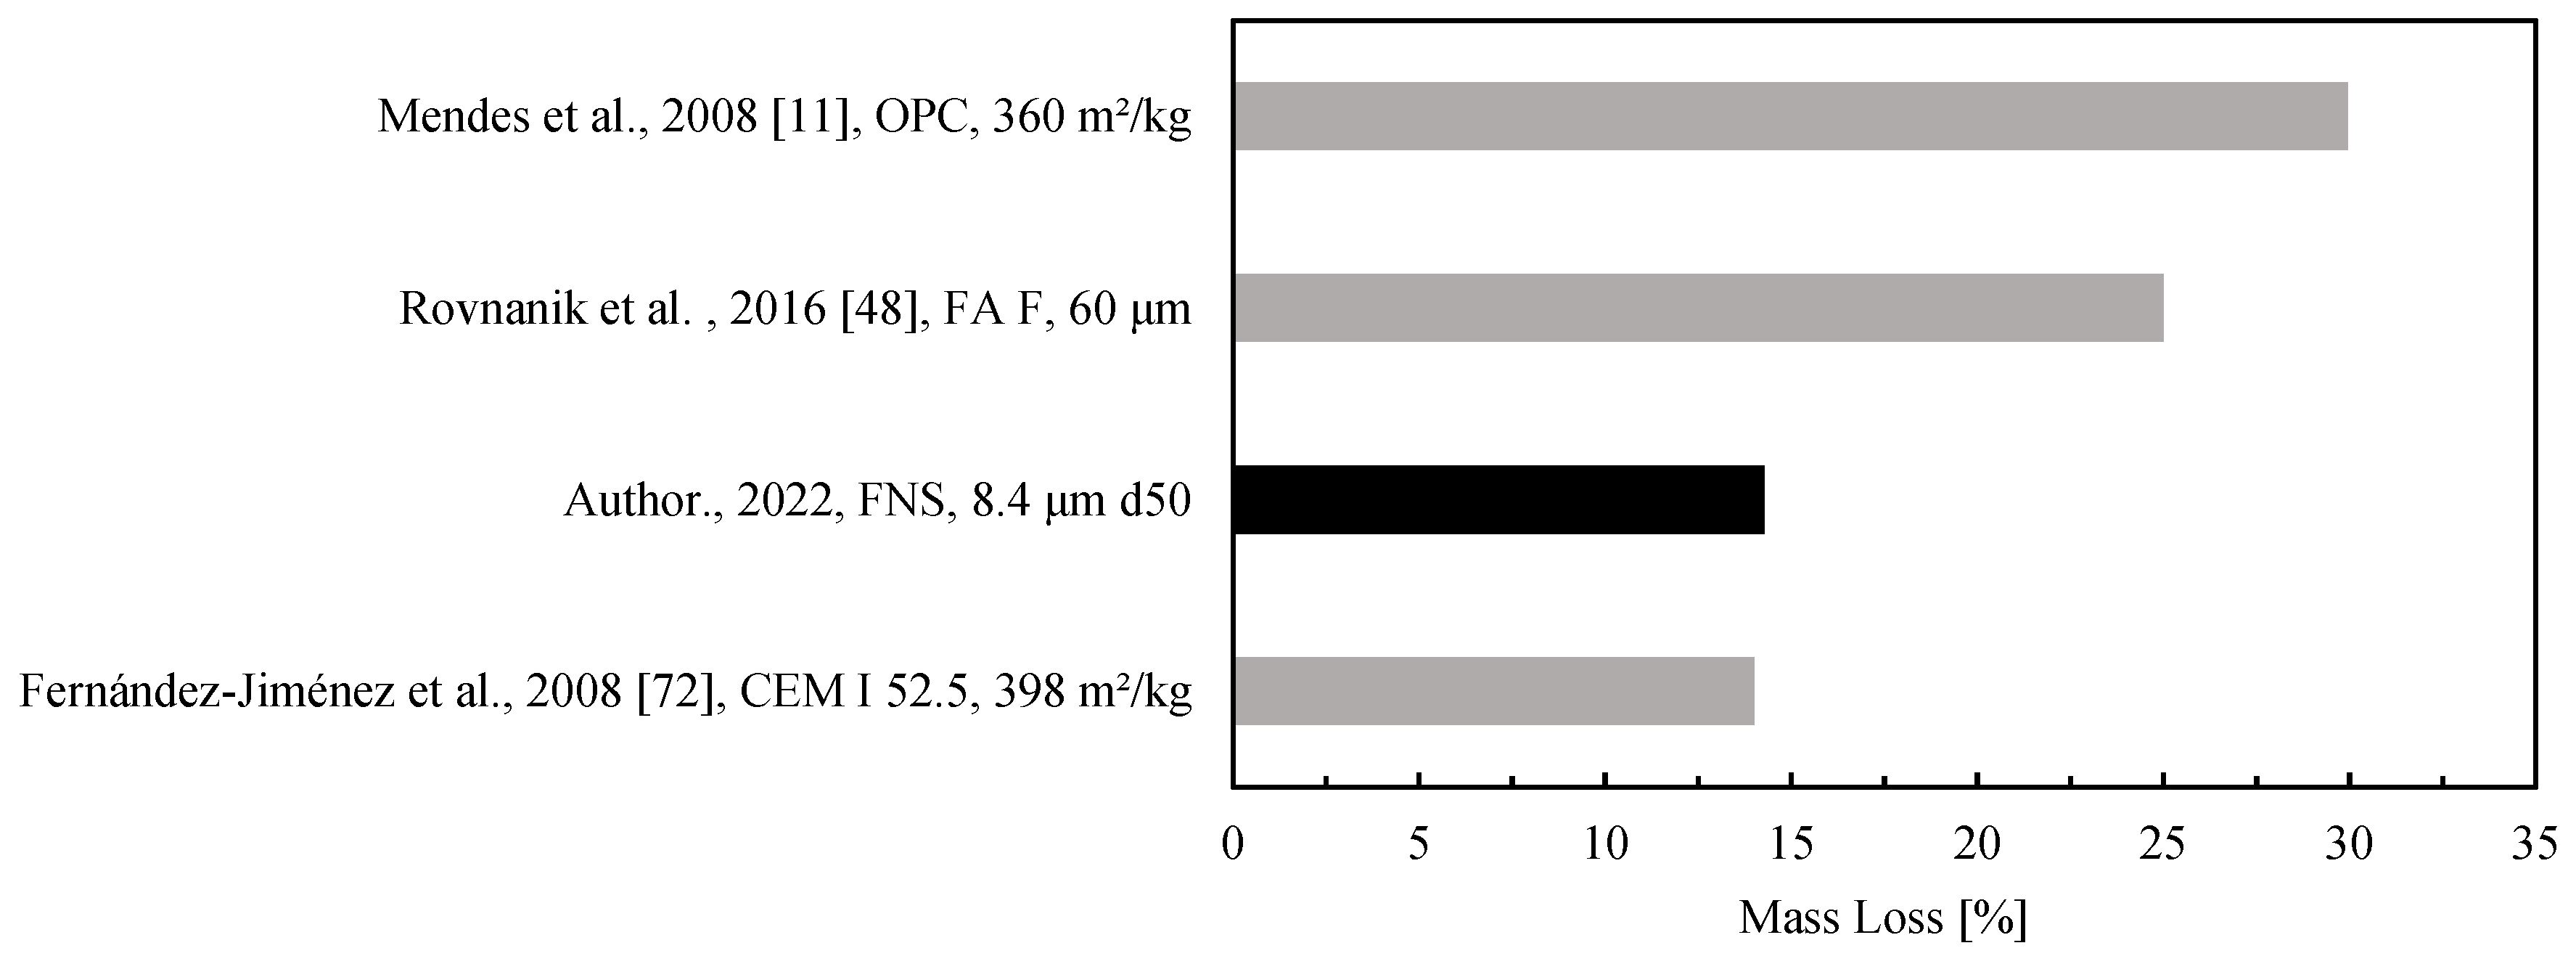
3.3. Mass Loss
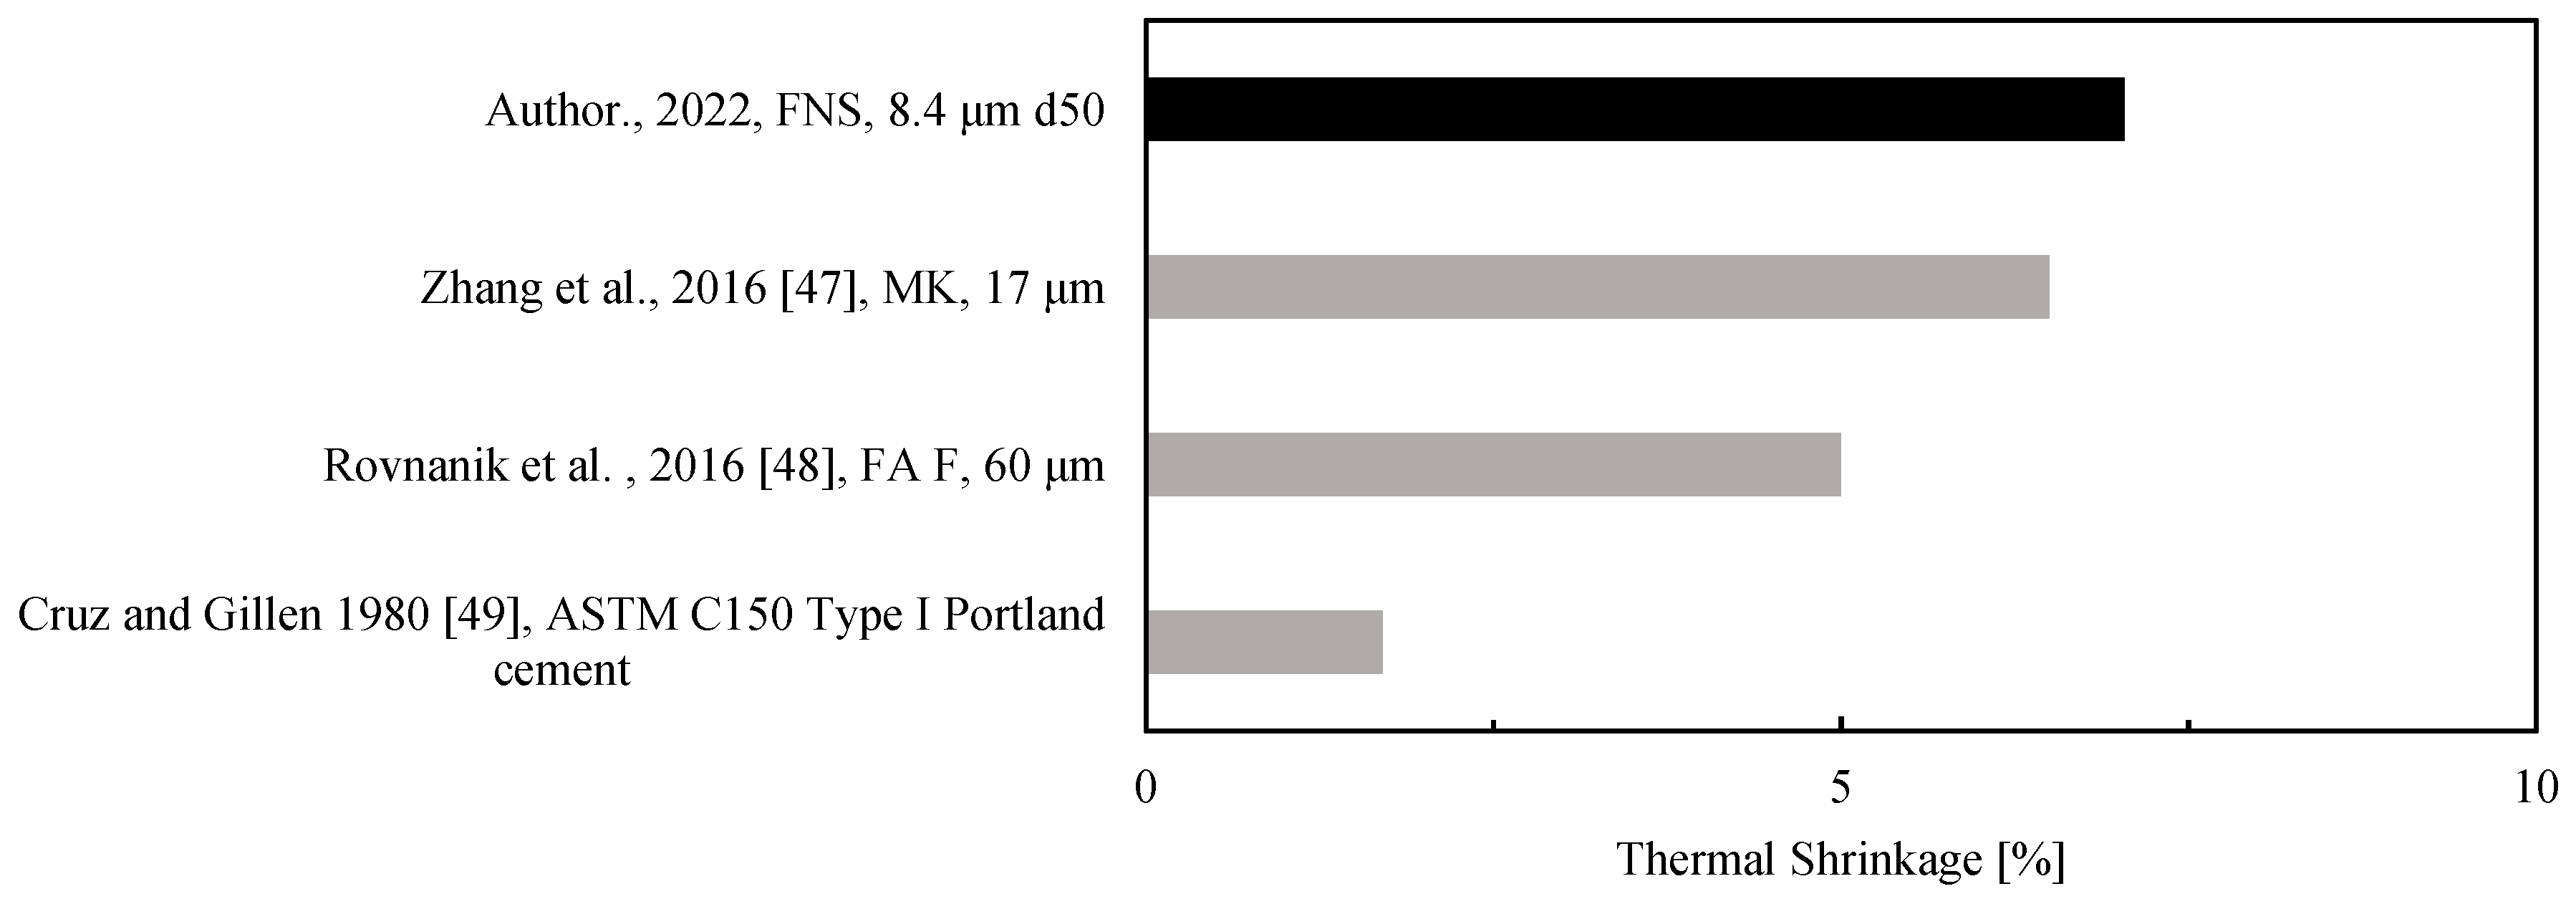
3.4. Thermal Shrinkage/Expansion
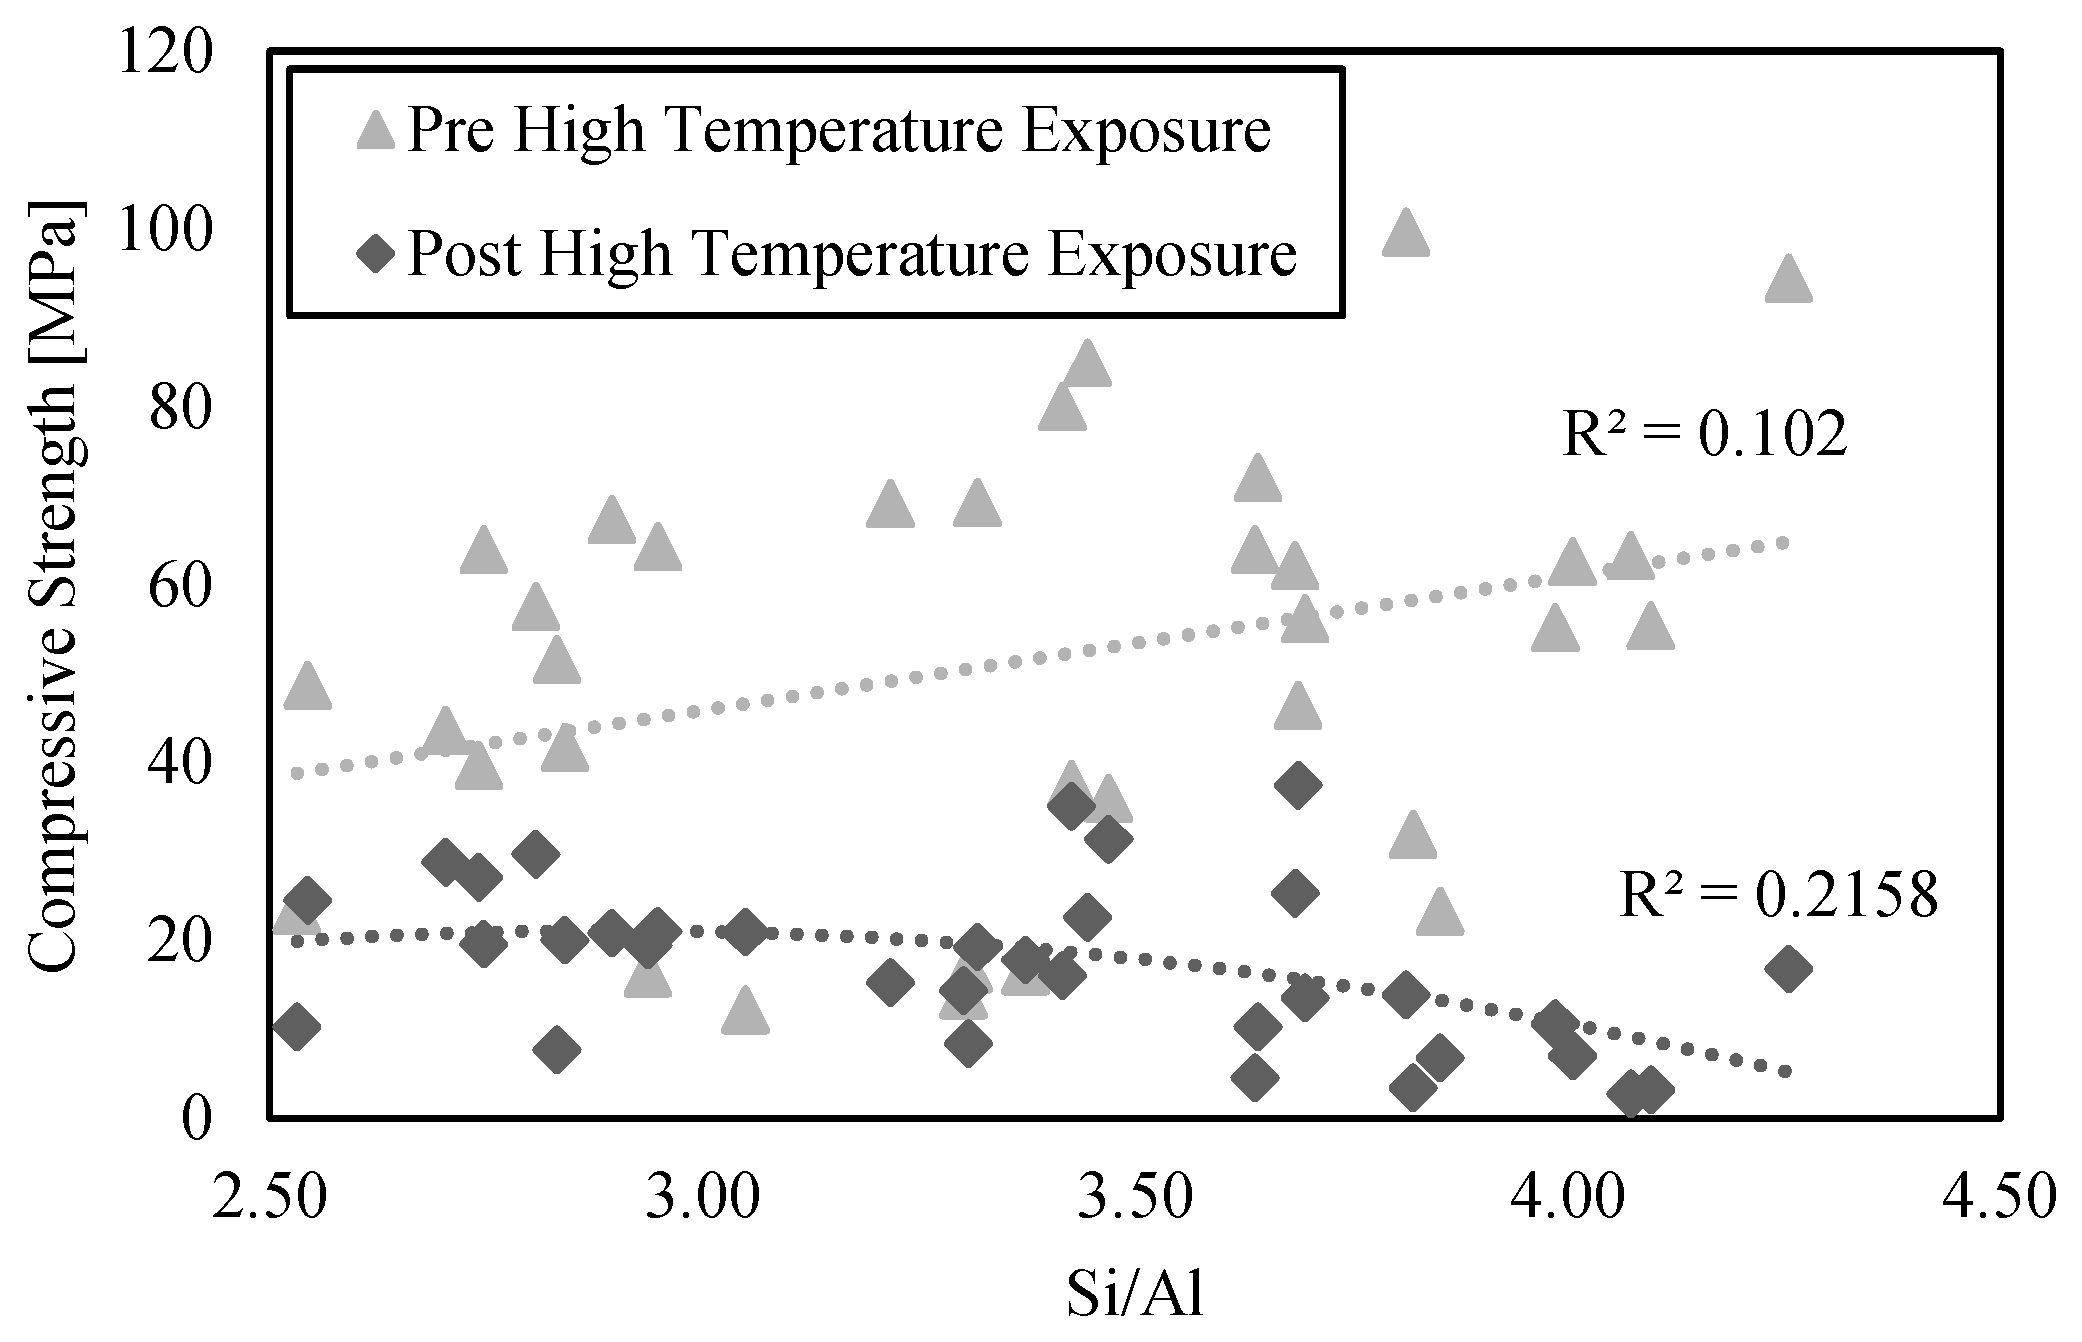
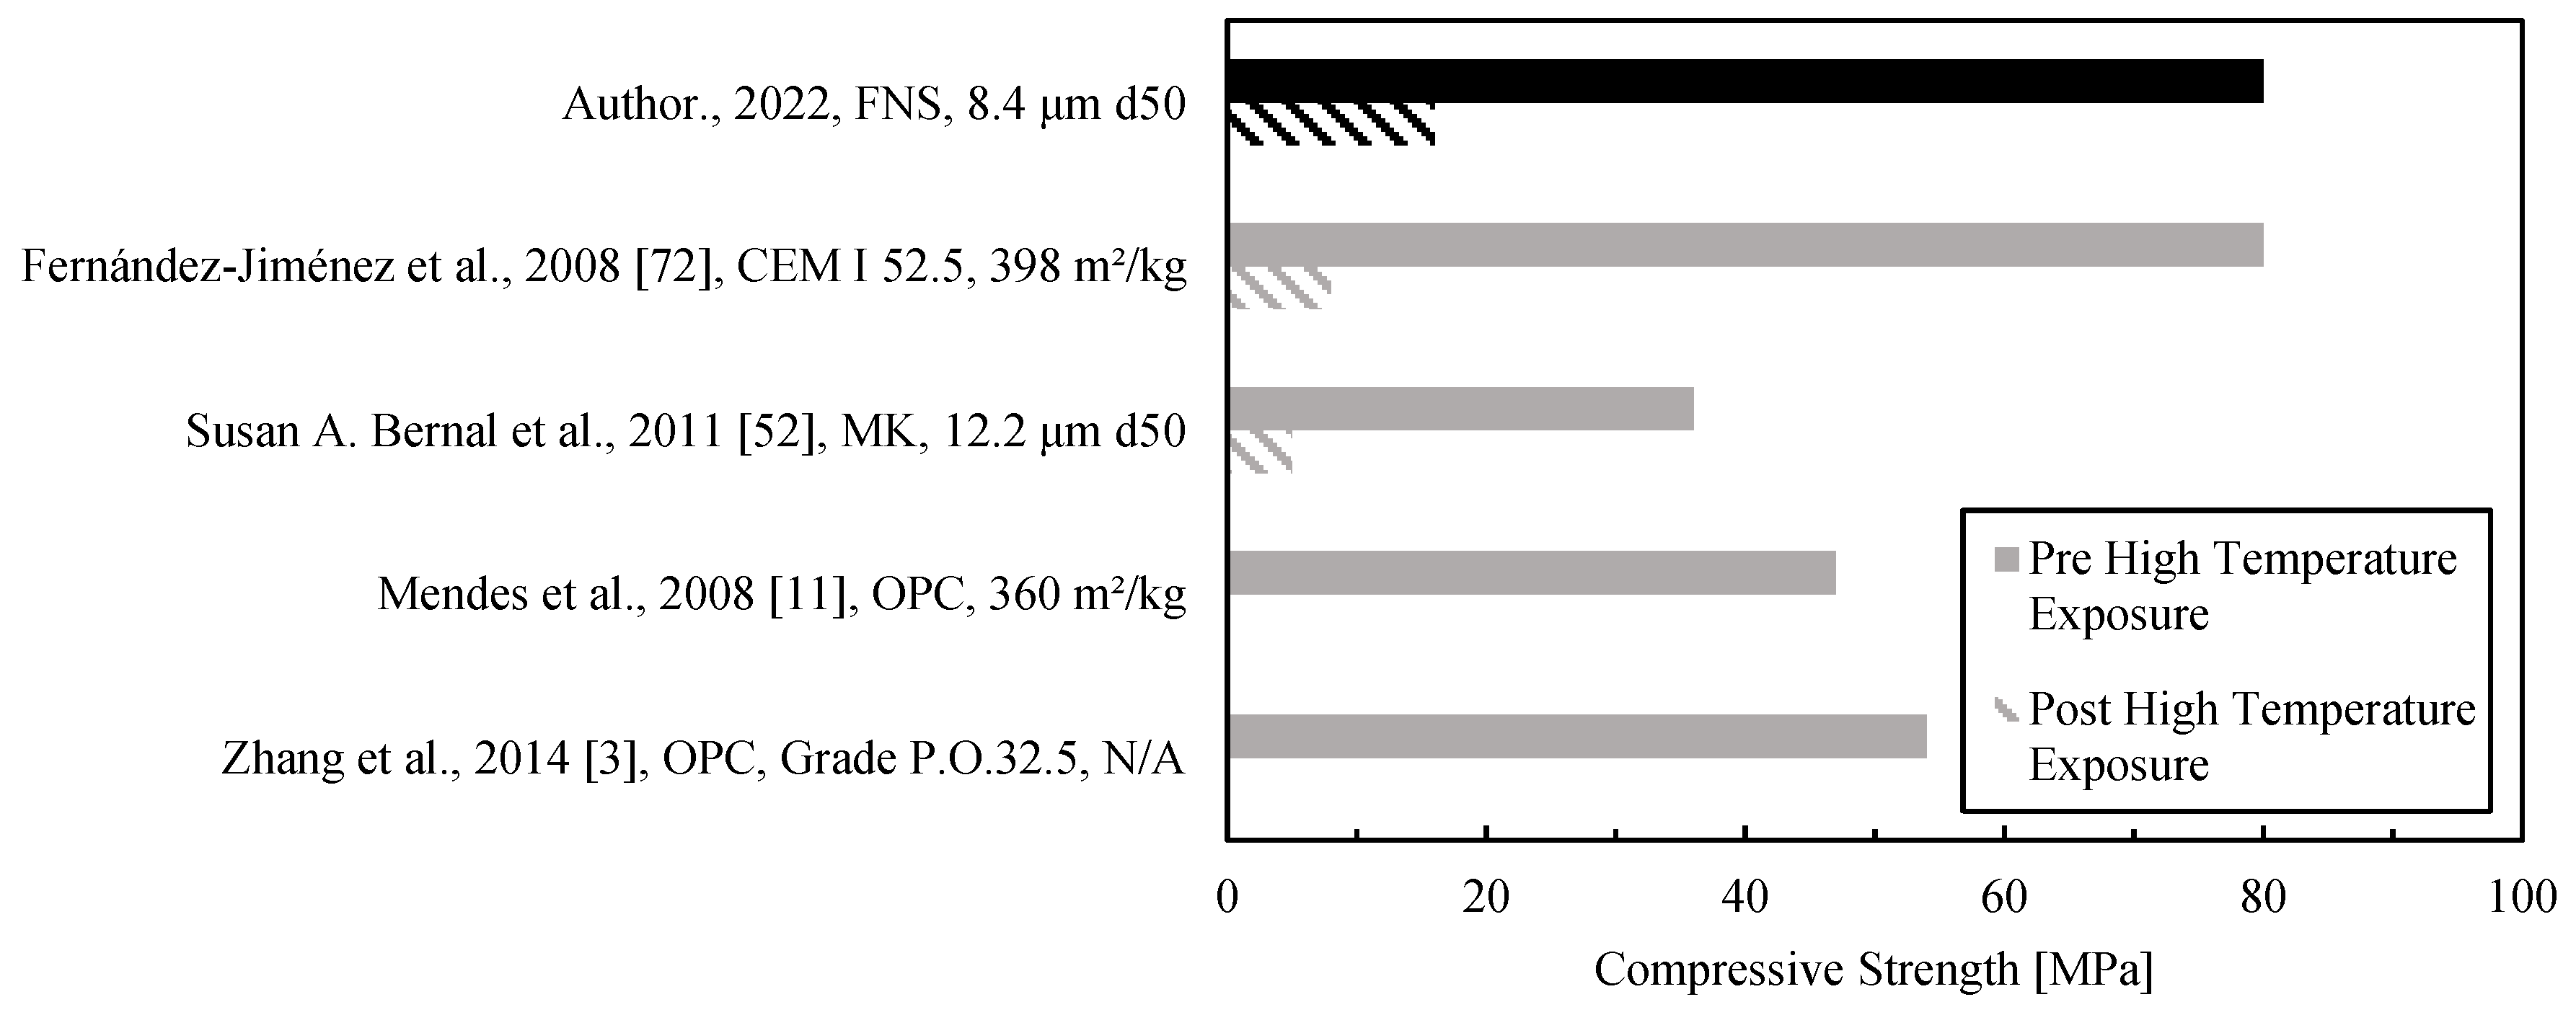
3.5. Compressive Strength
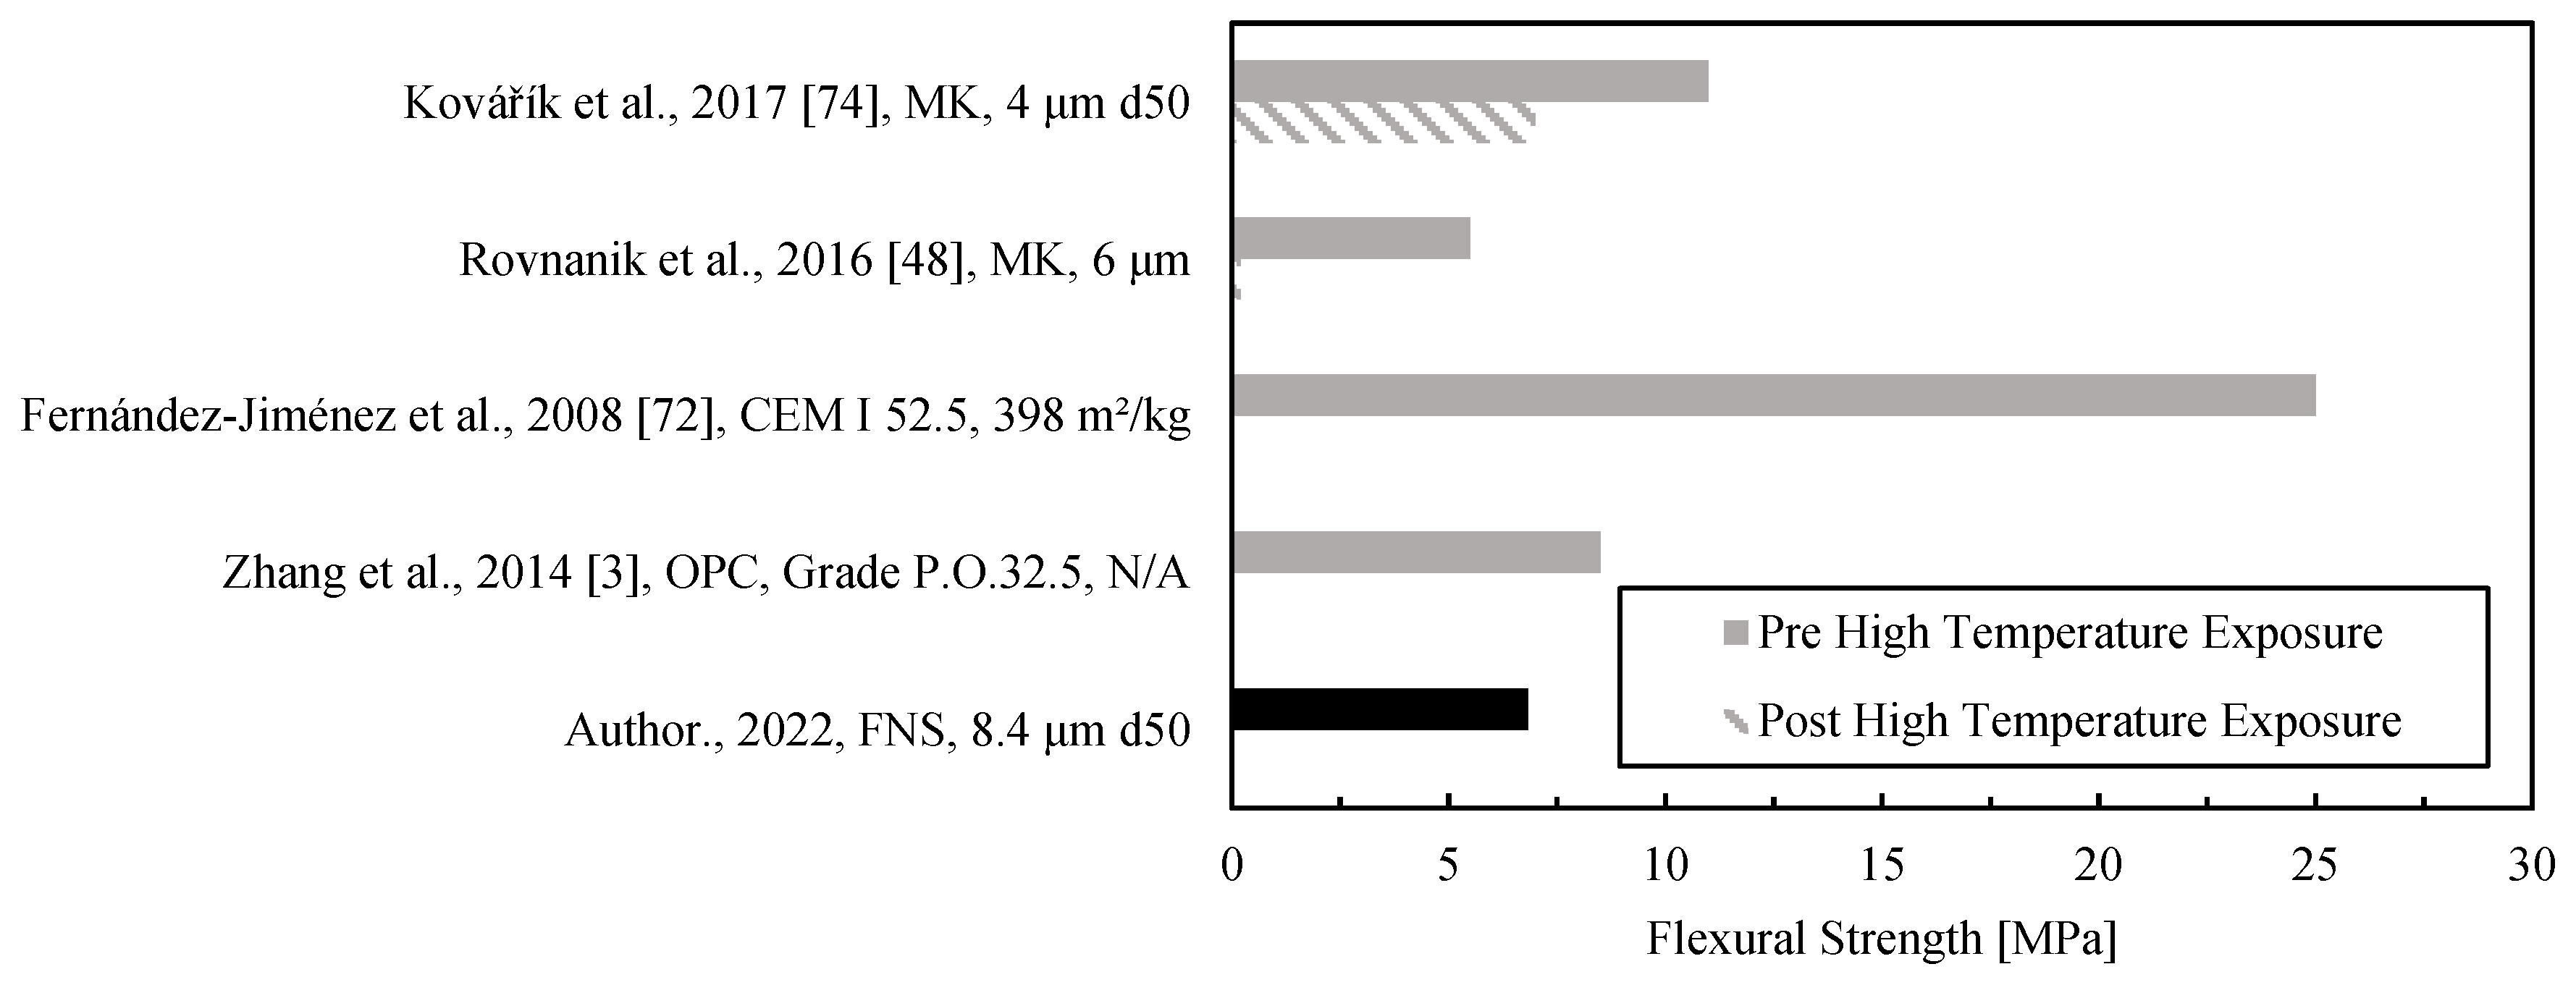
3.6. Flexural Strength
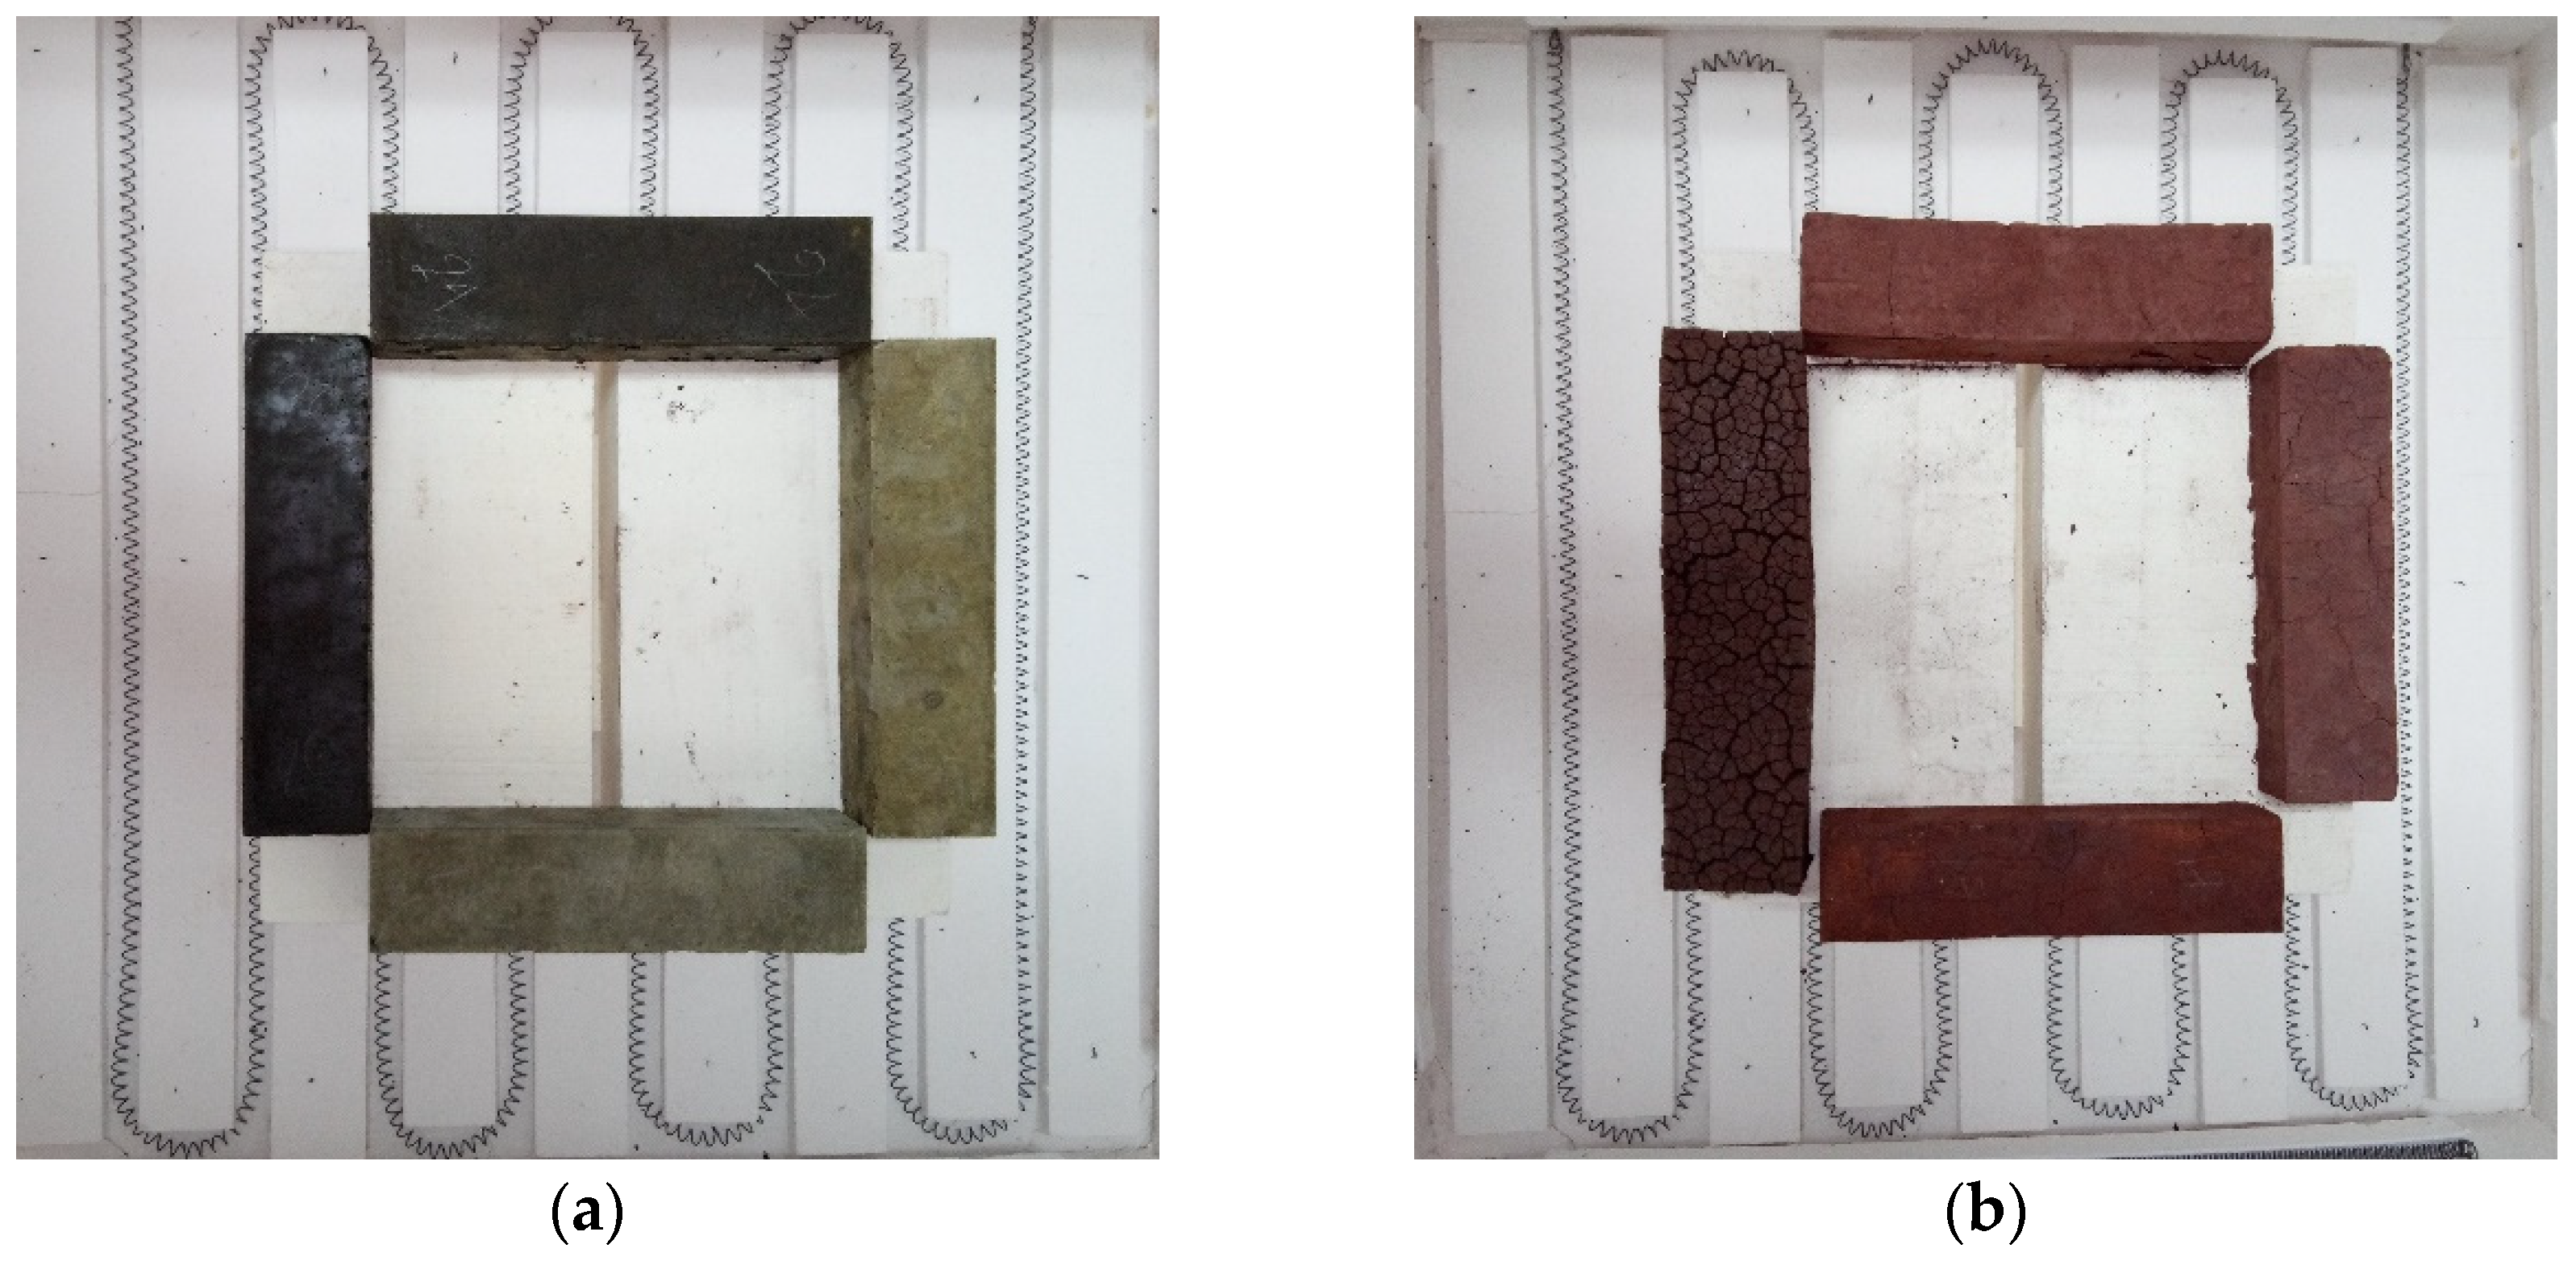
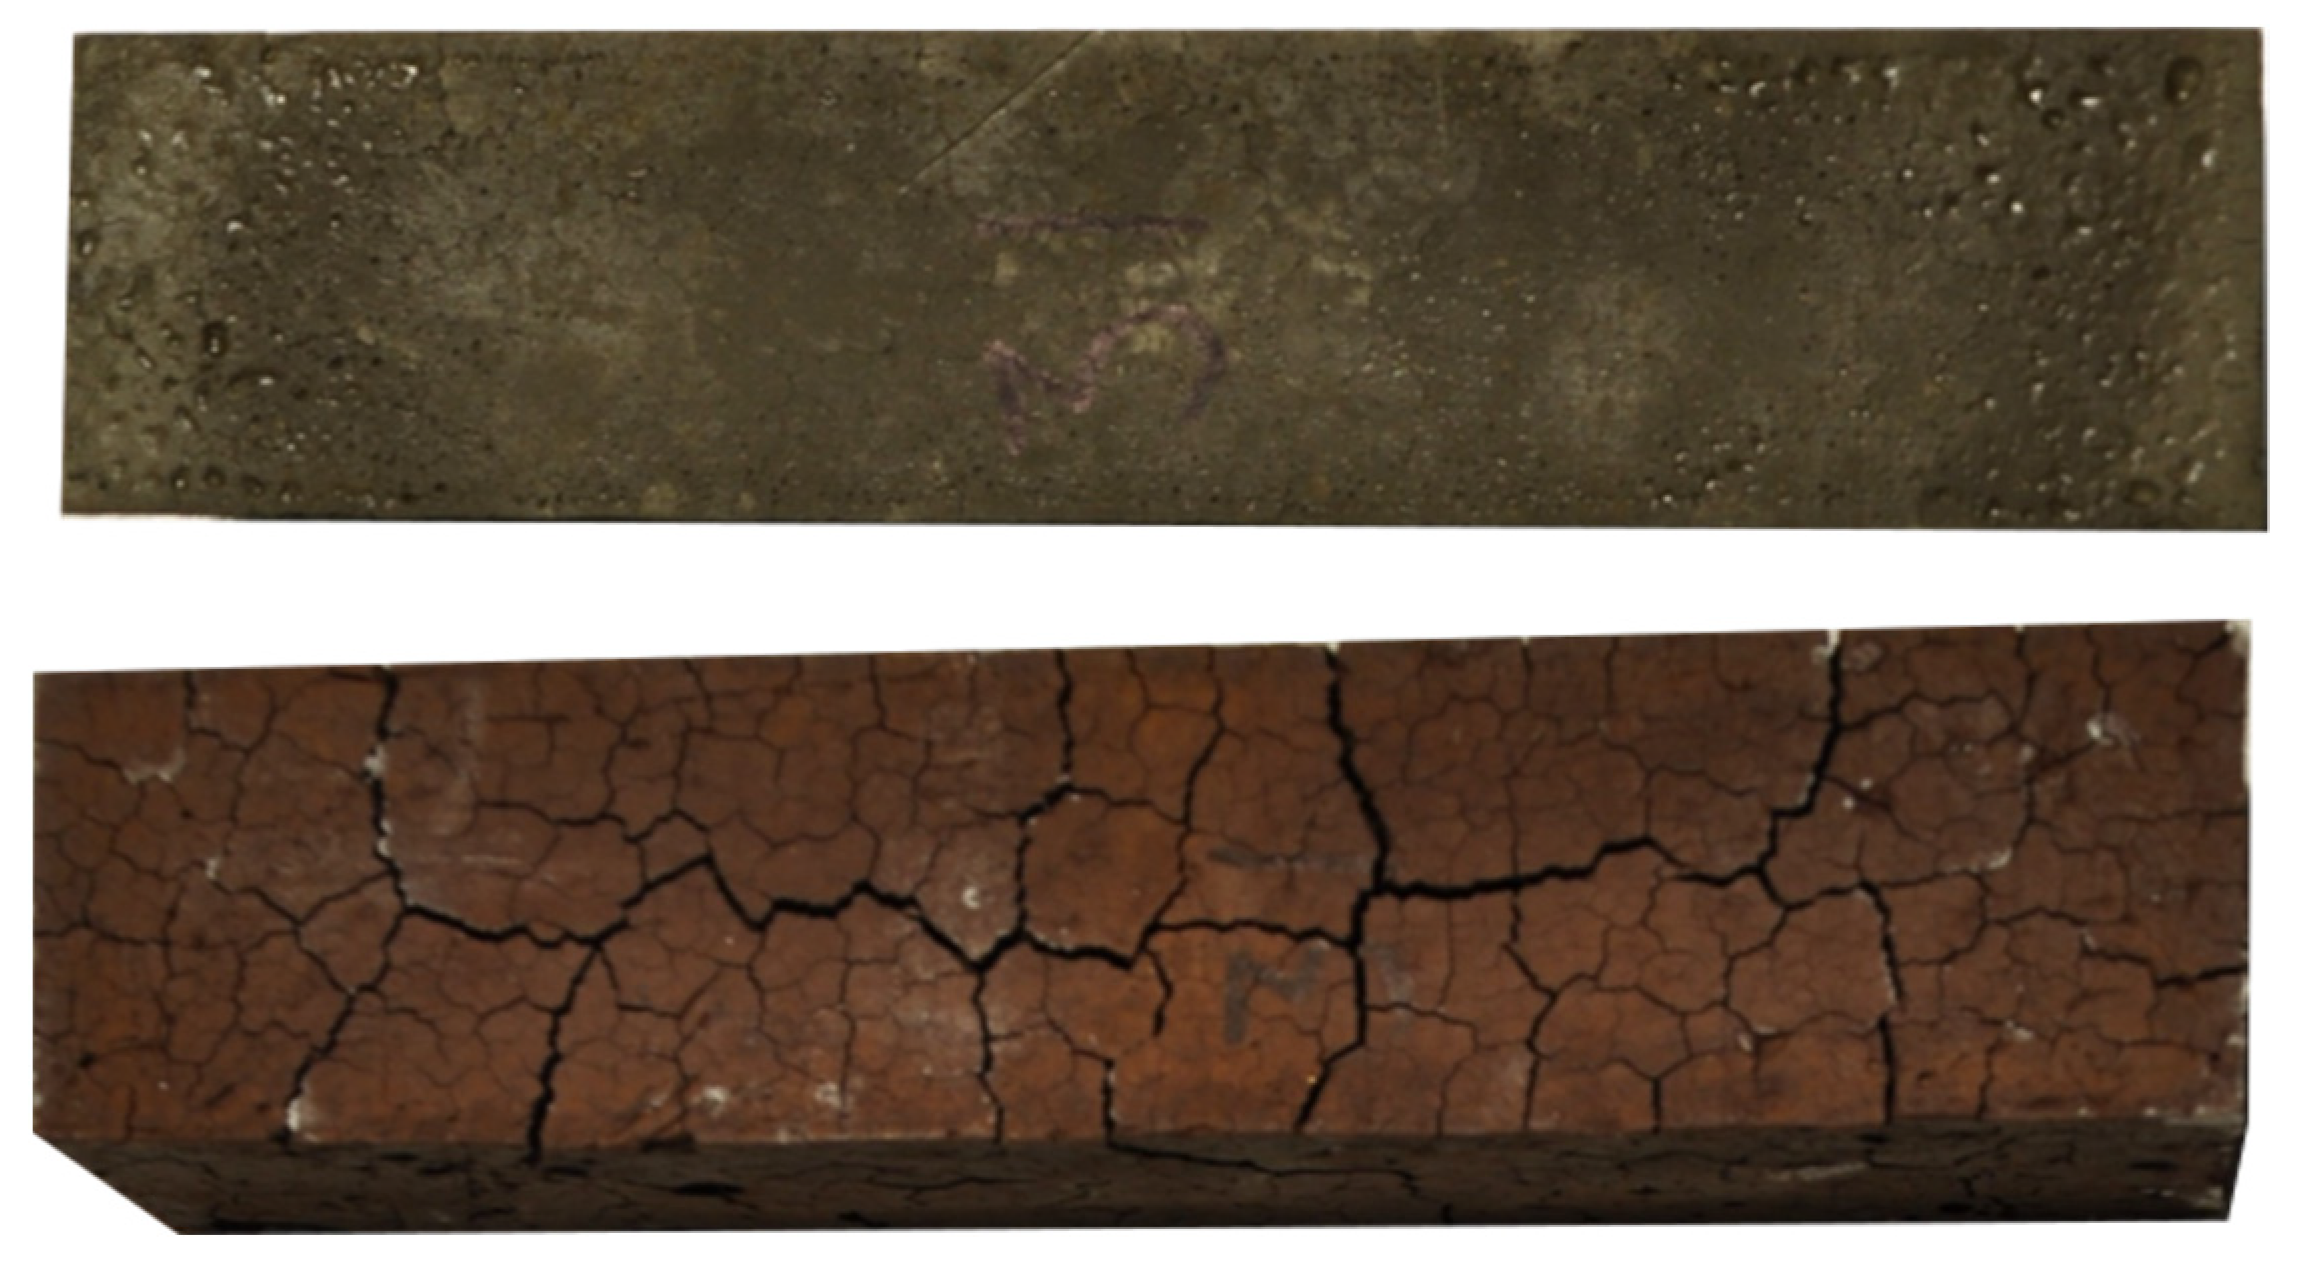
3.7. Appearance
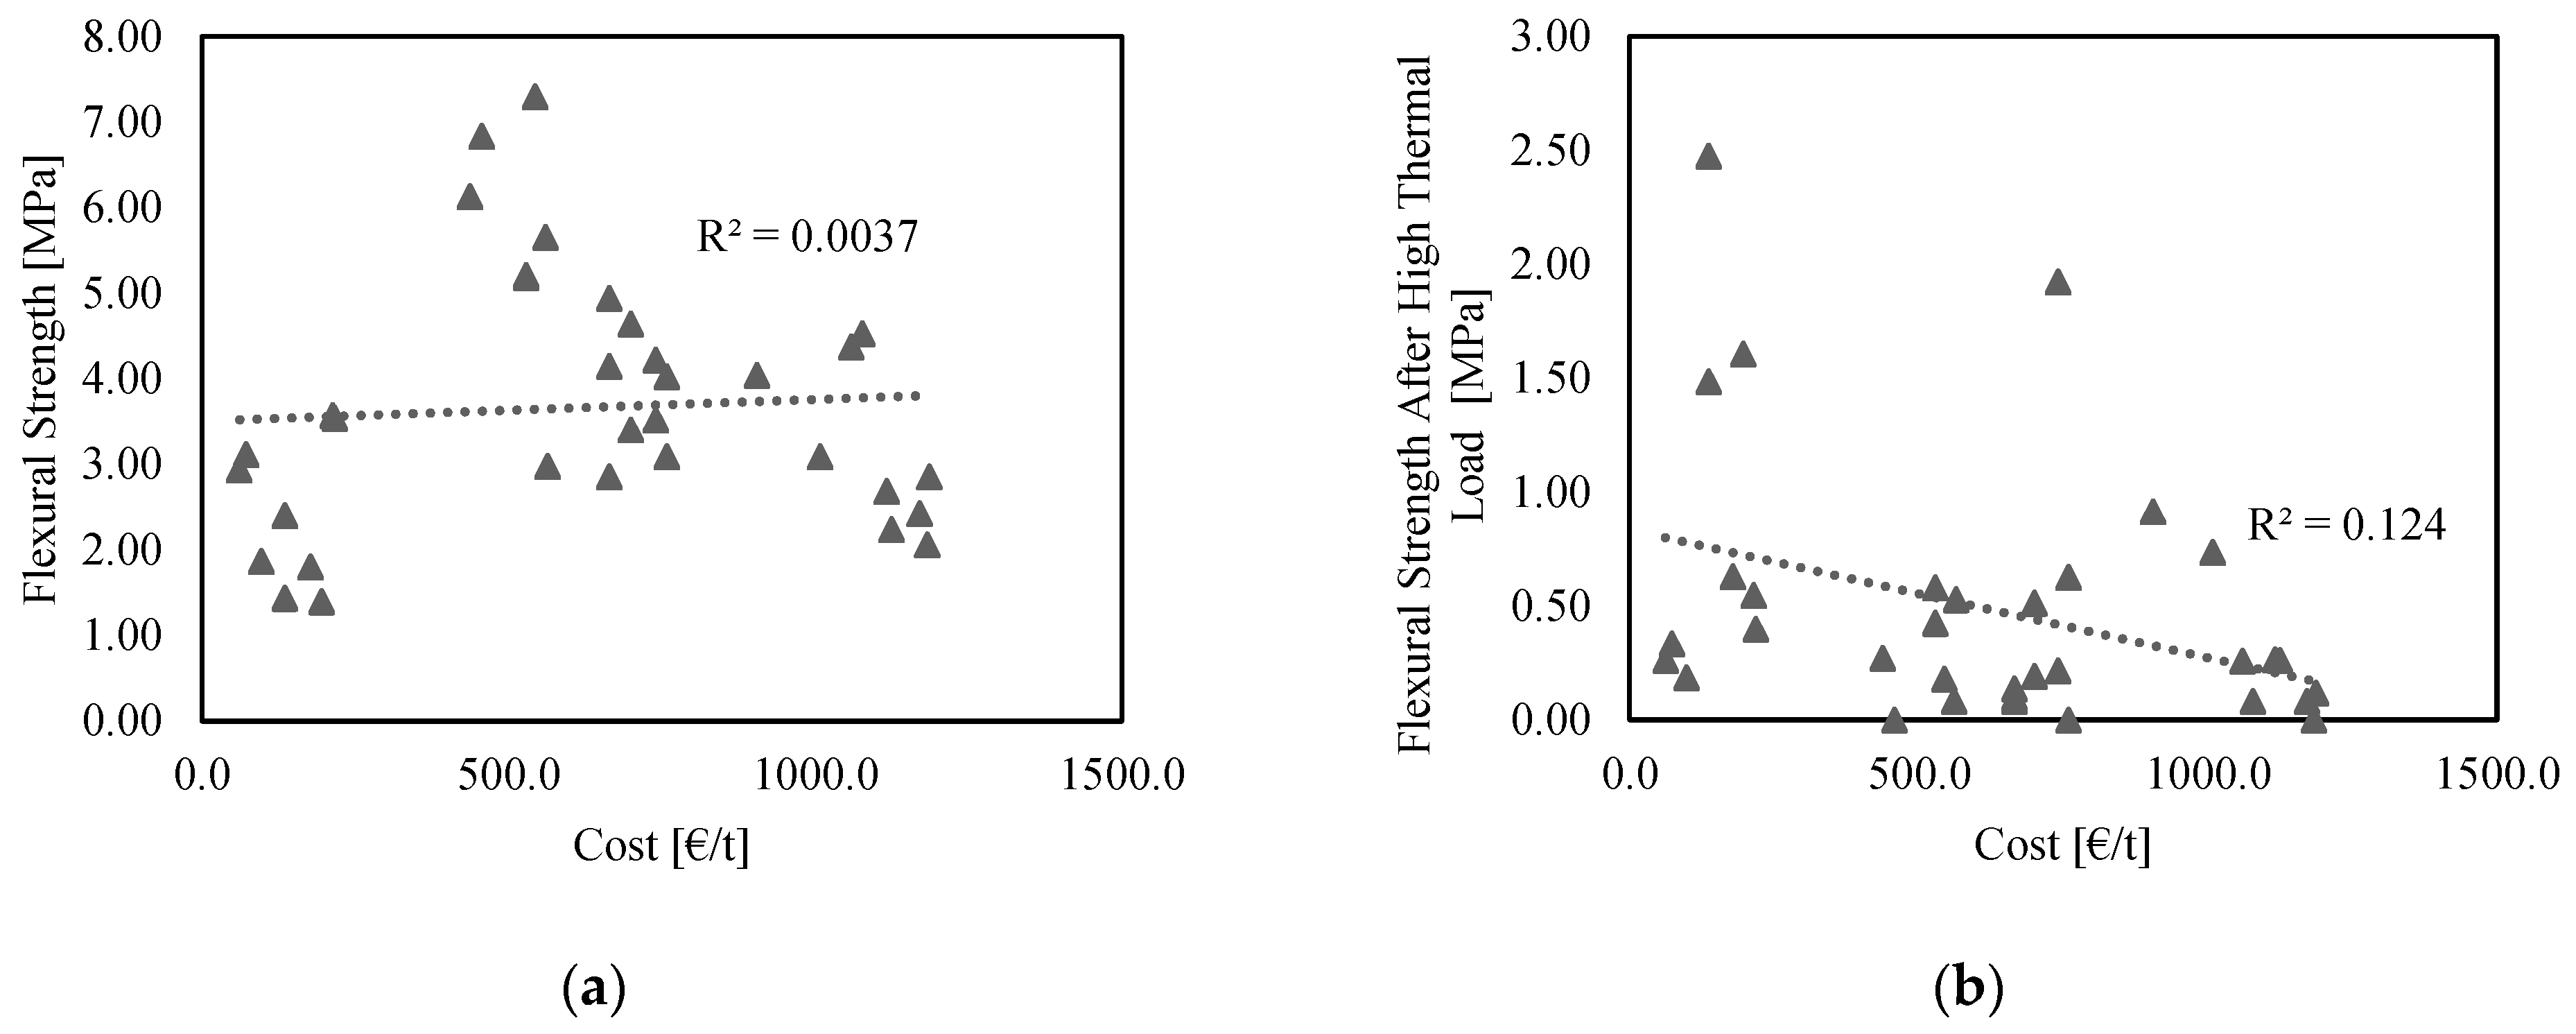
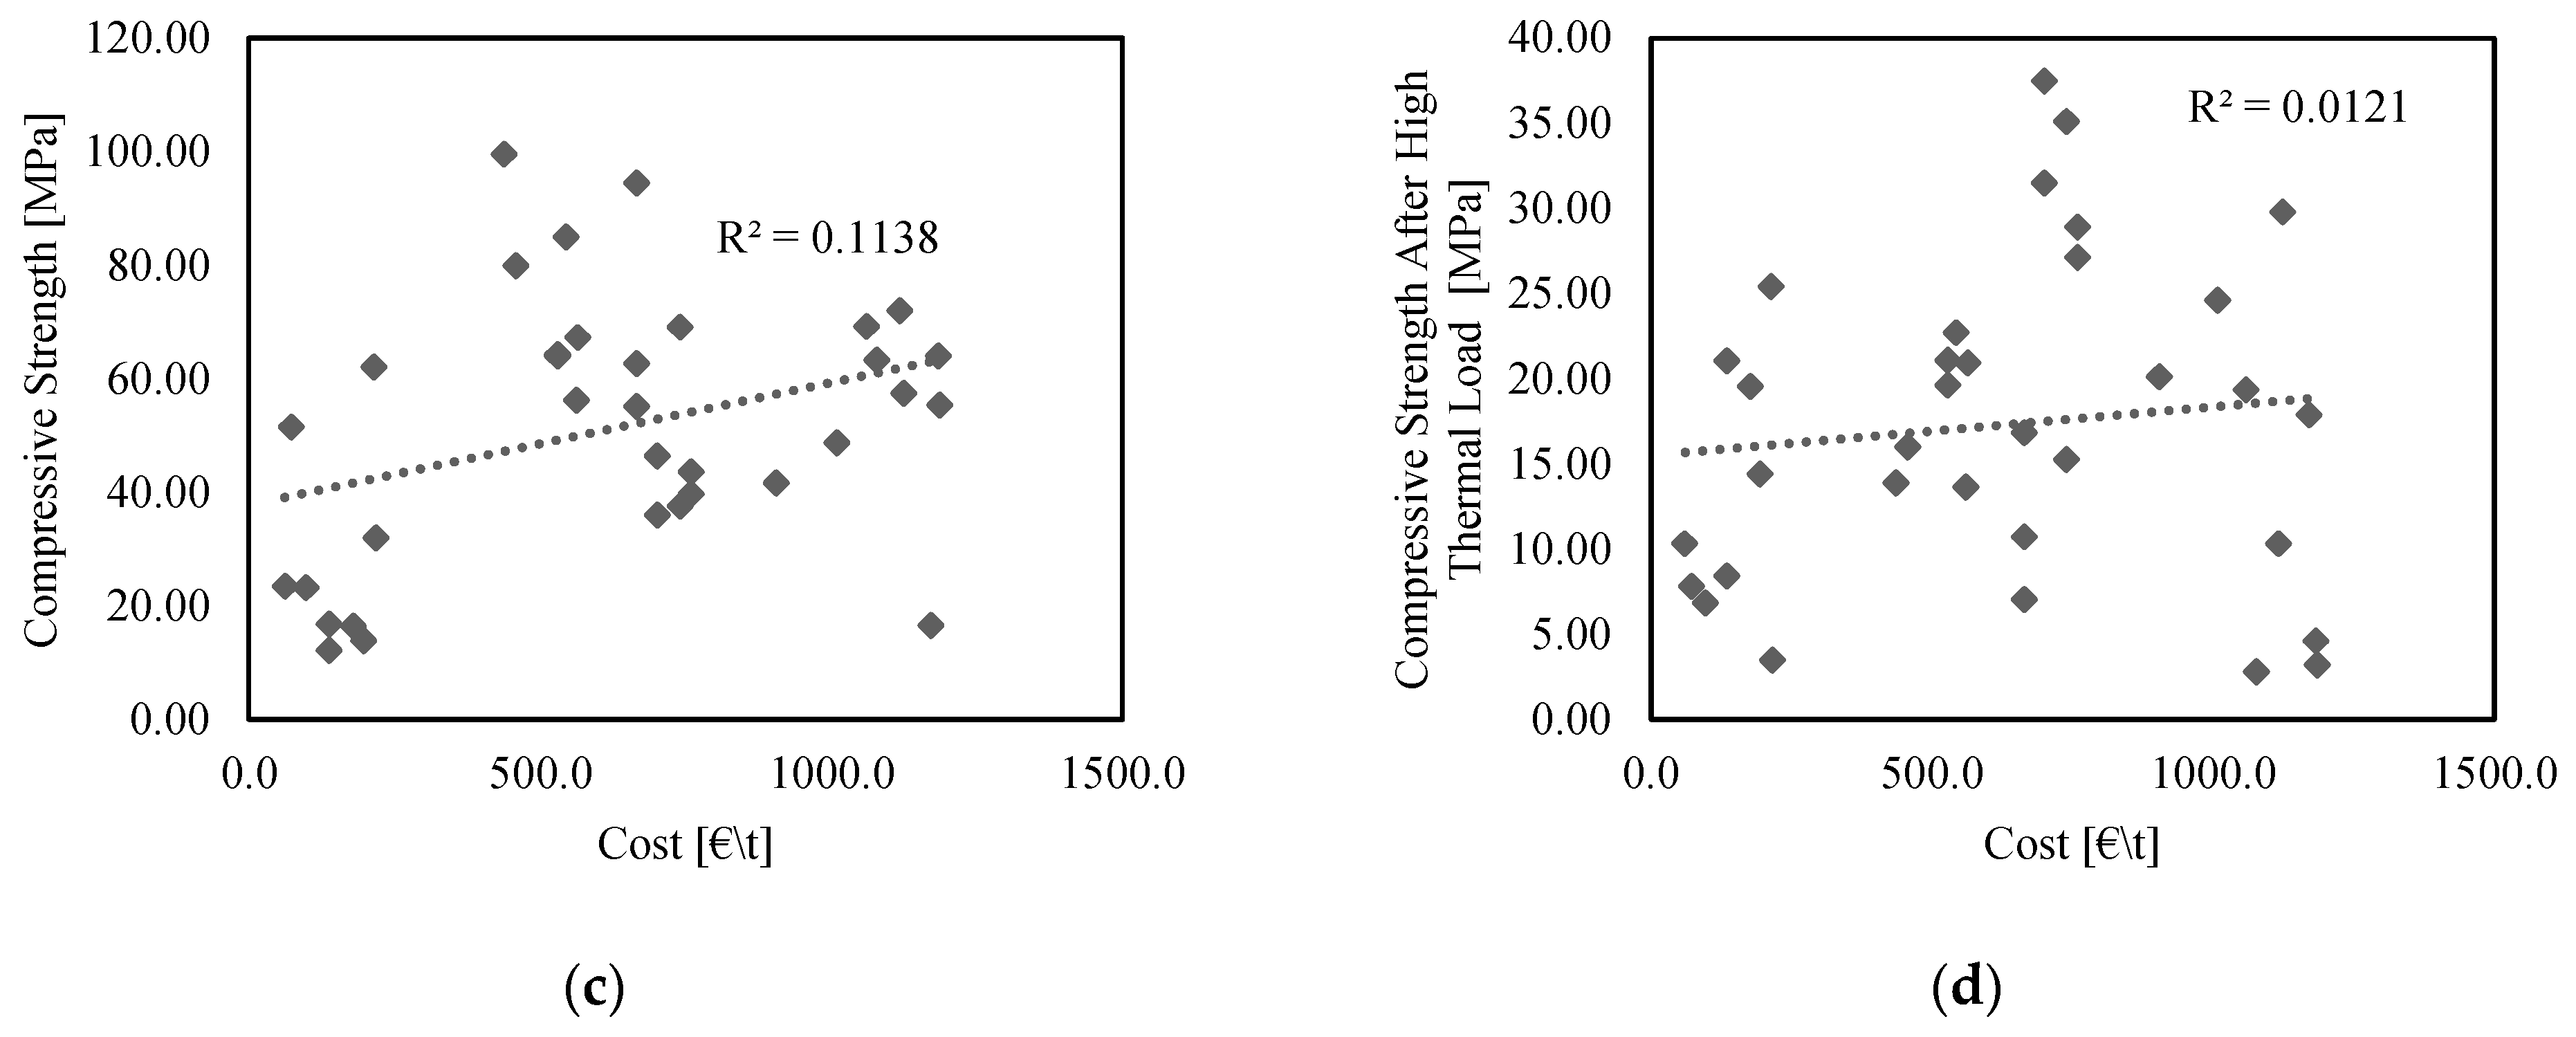
3.8. Cost
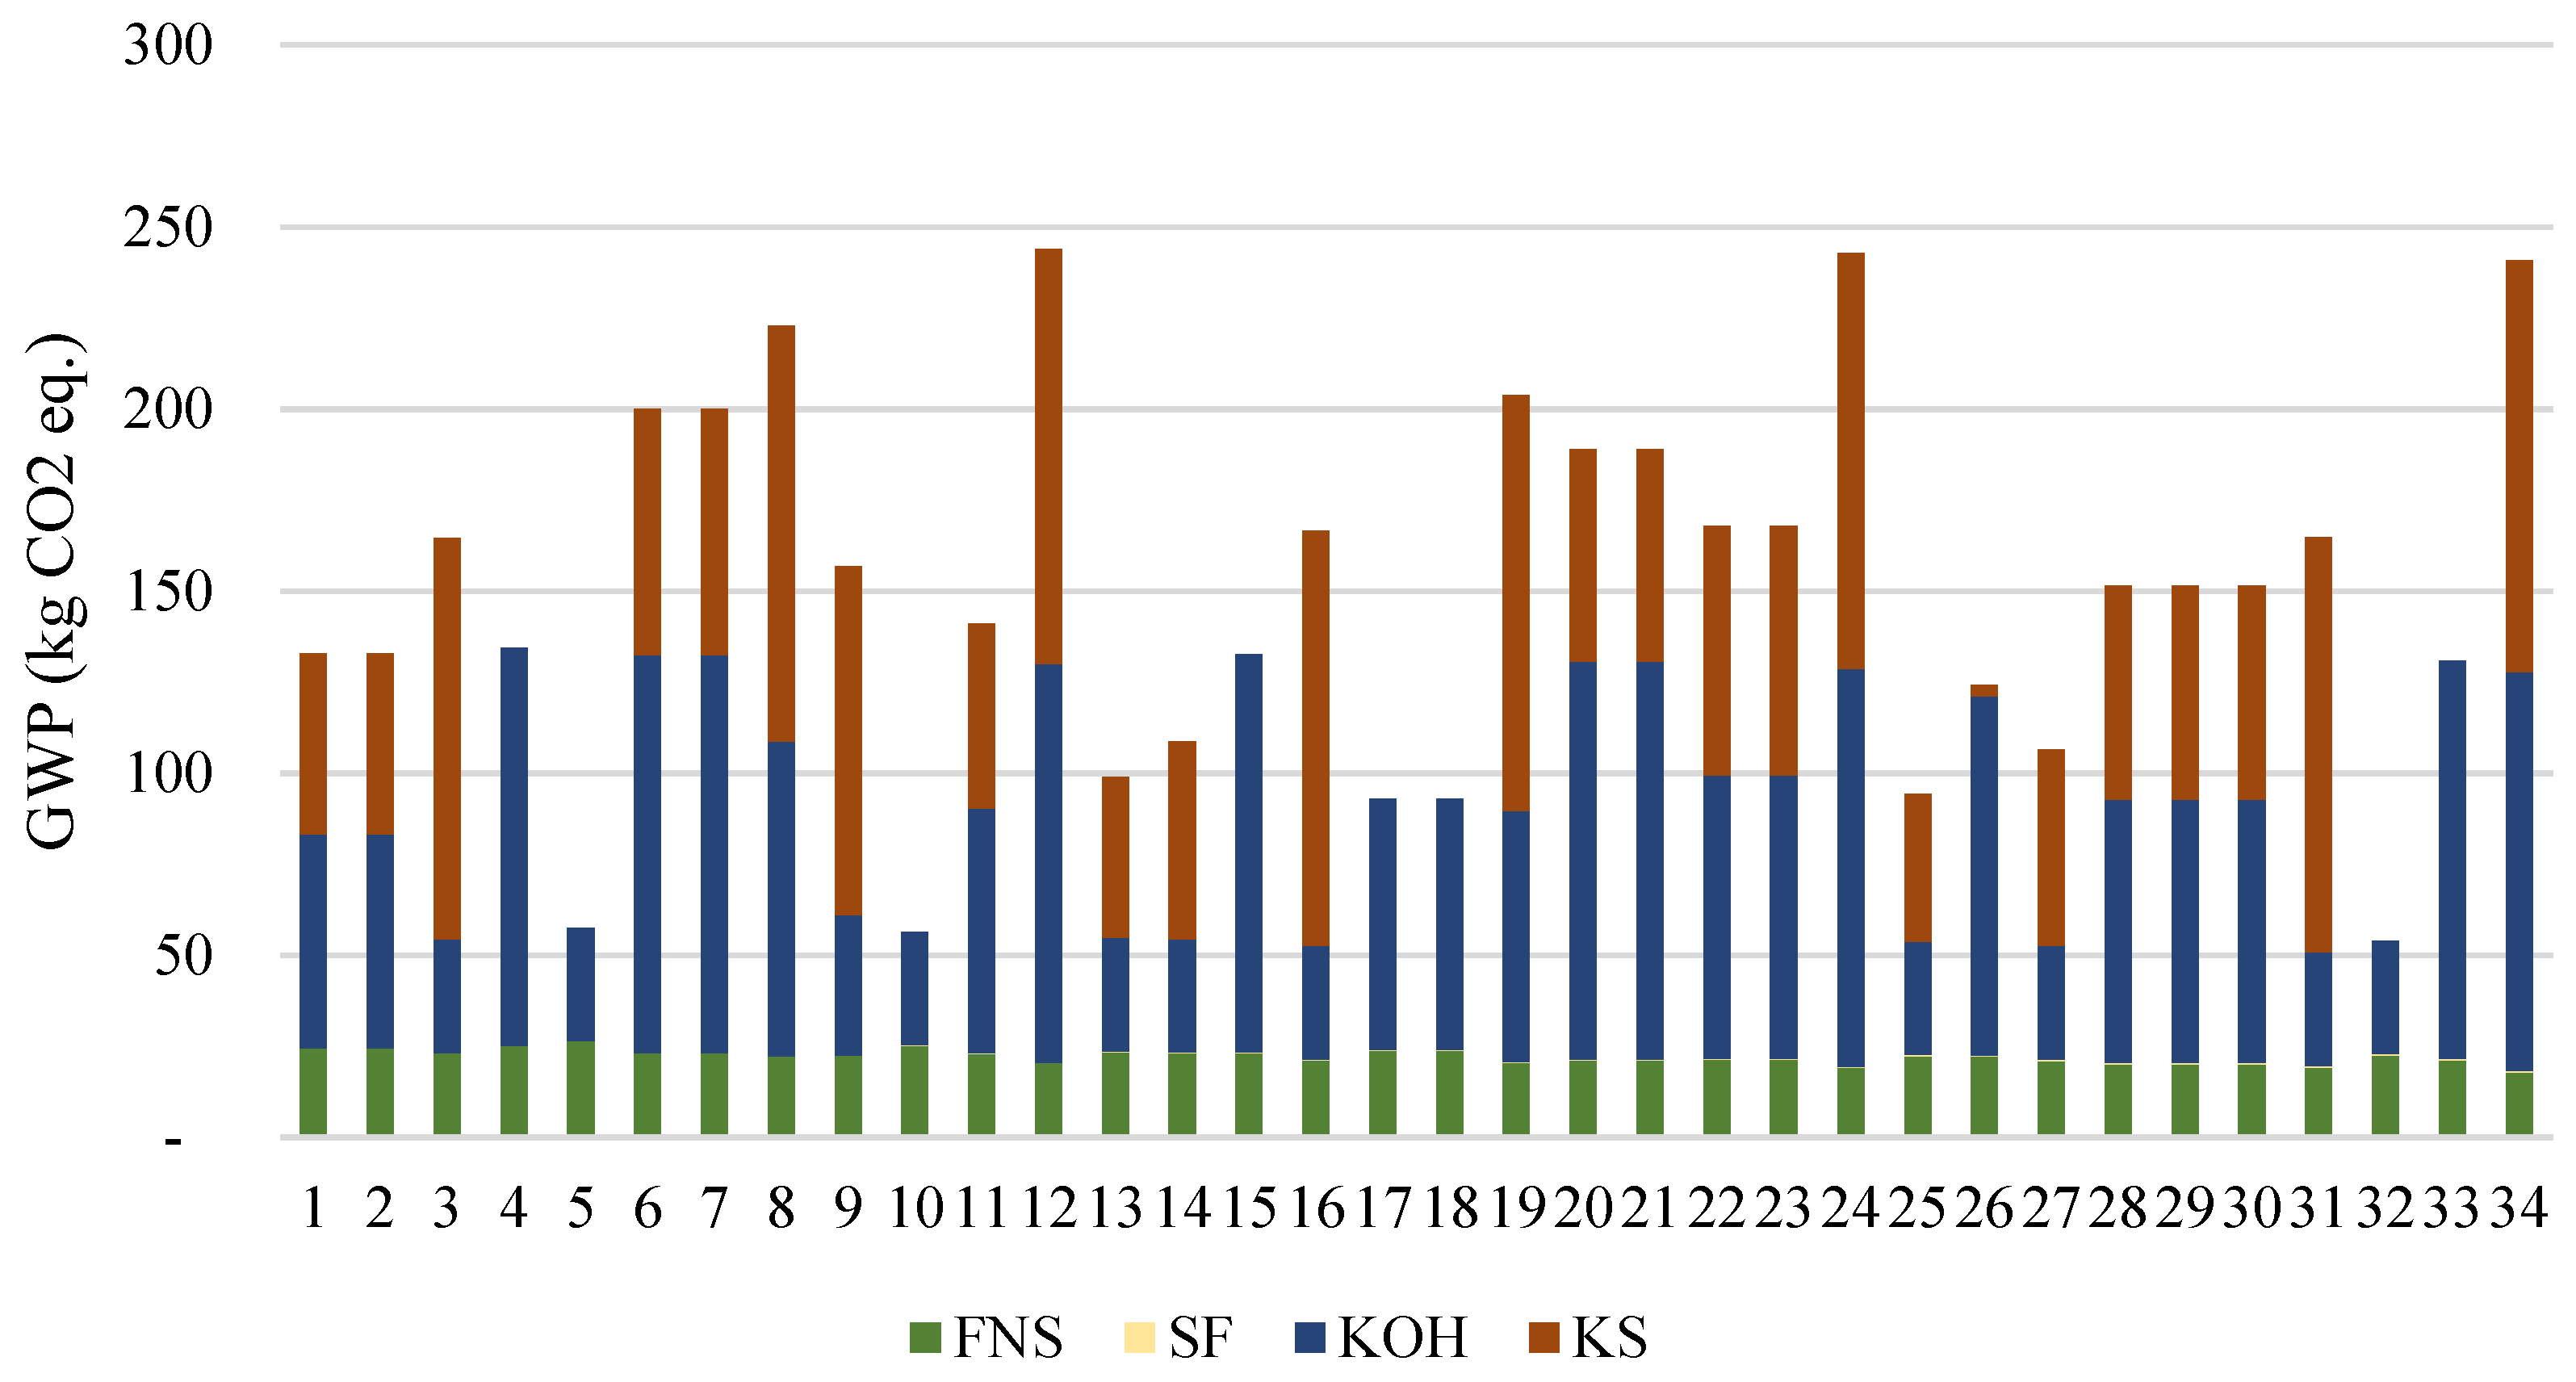
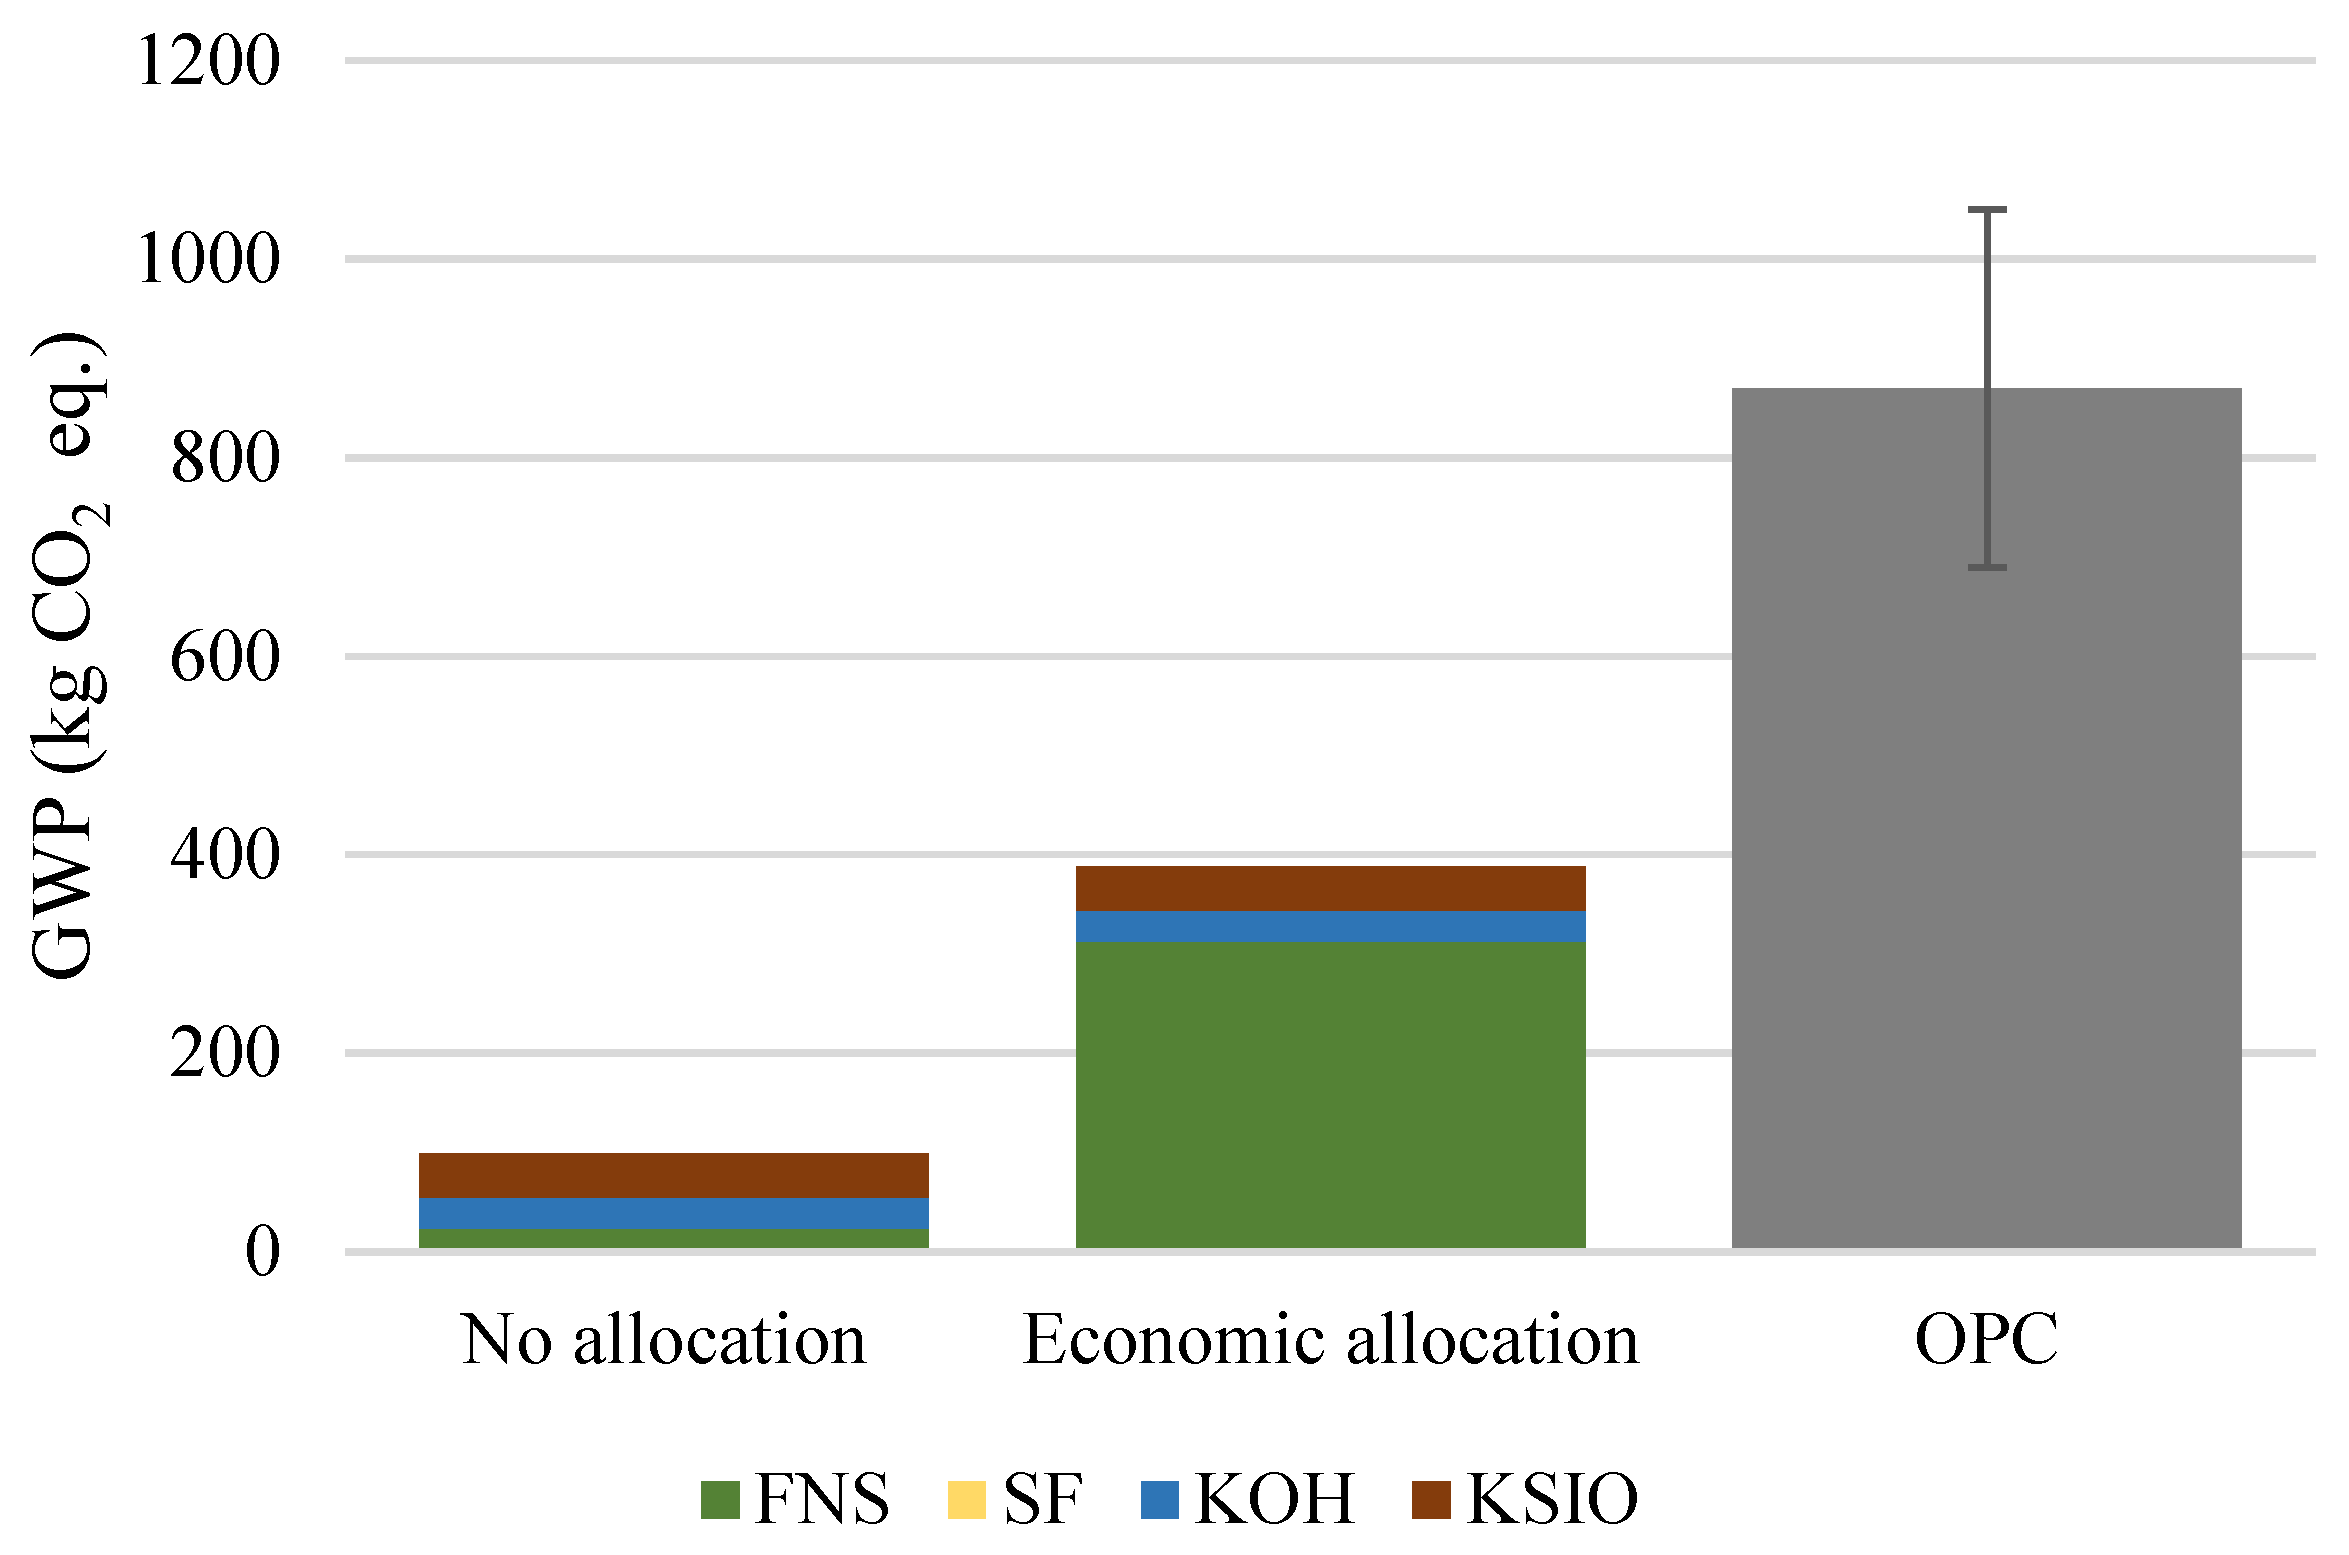
3.9. Life Cycle Analysis
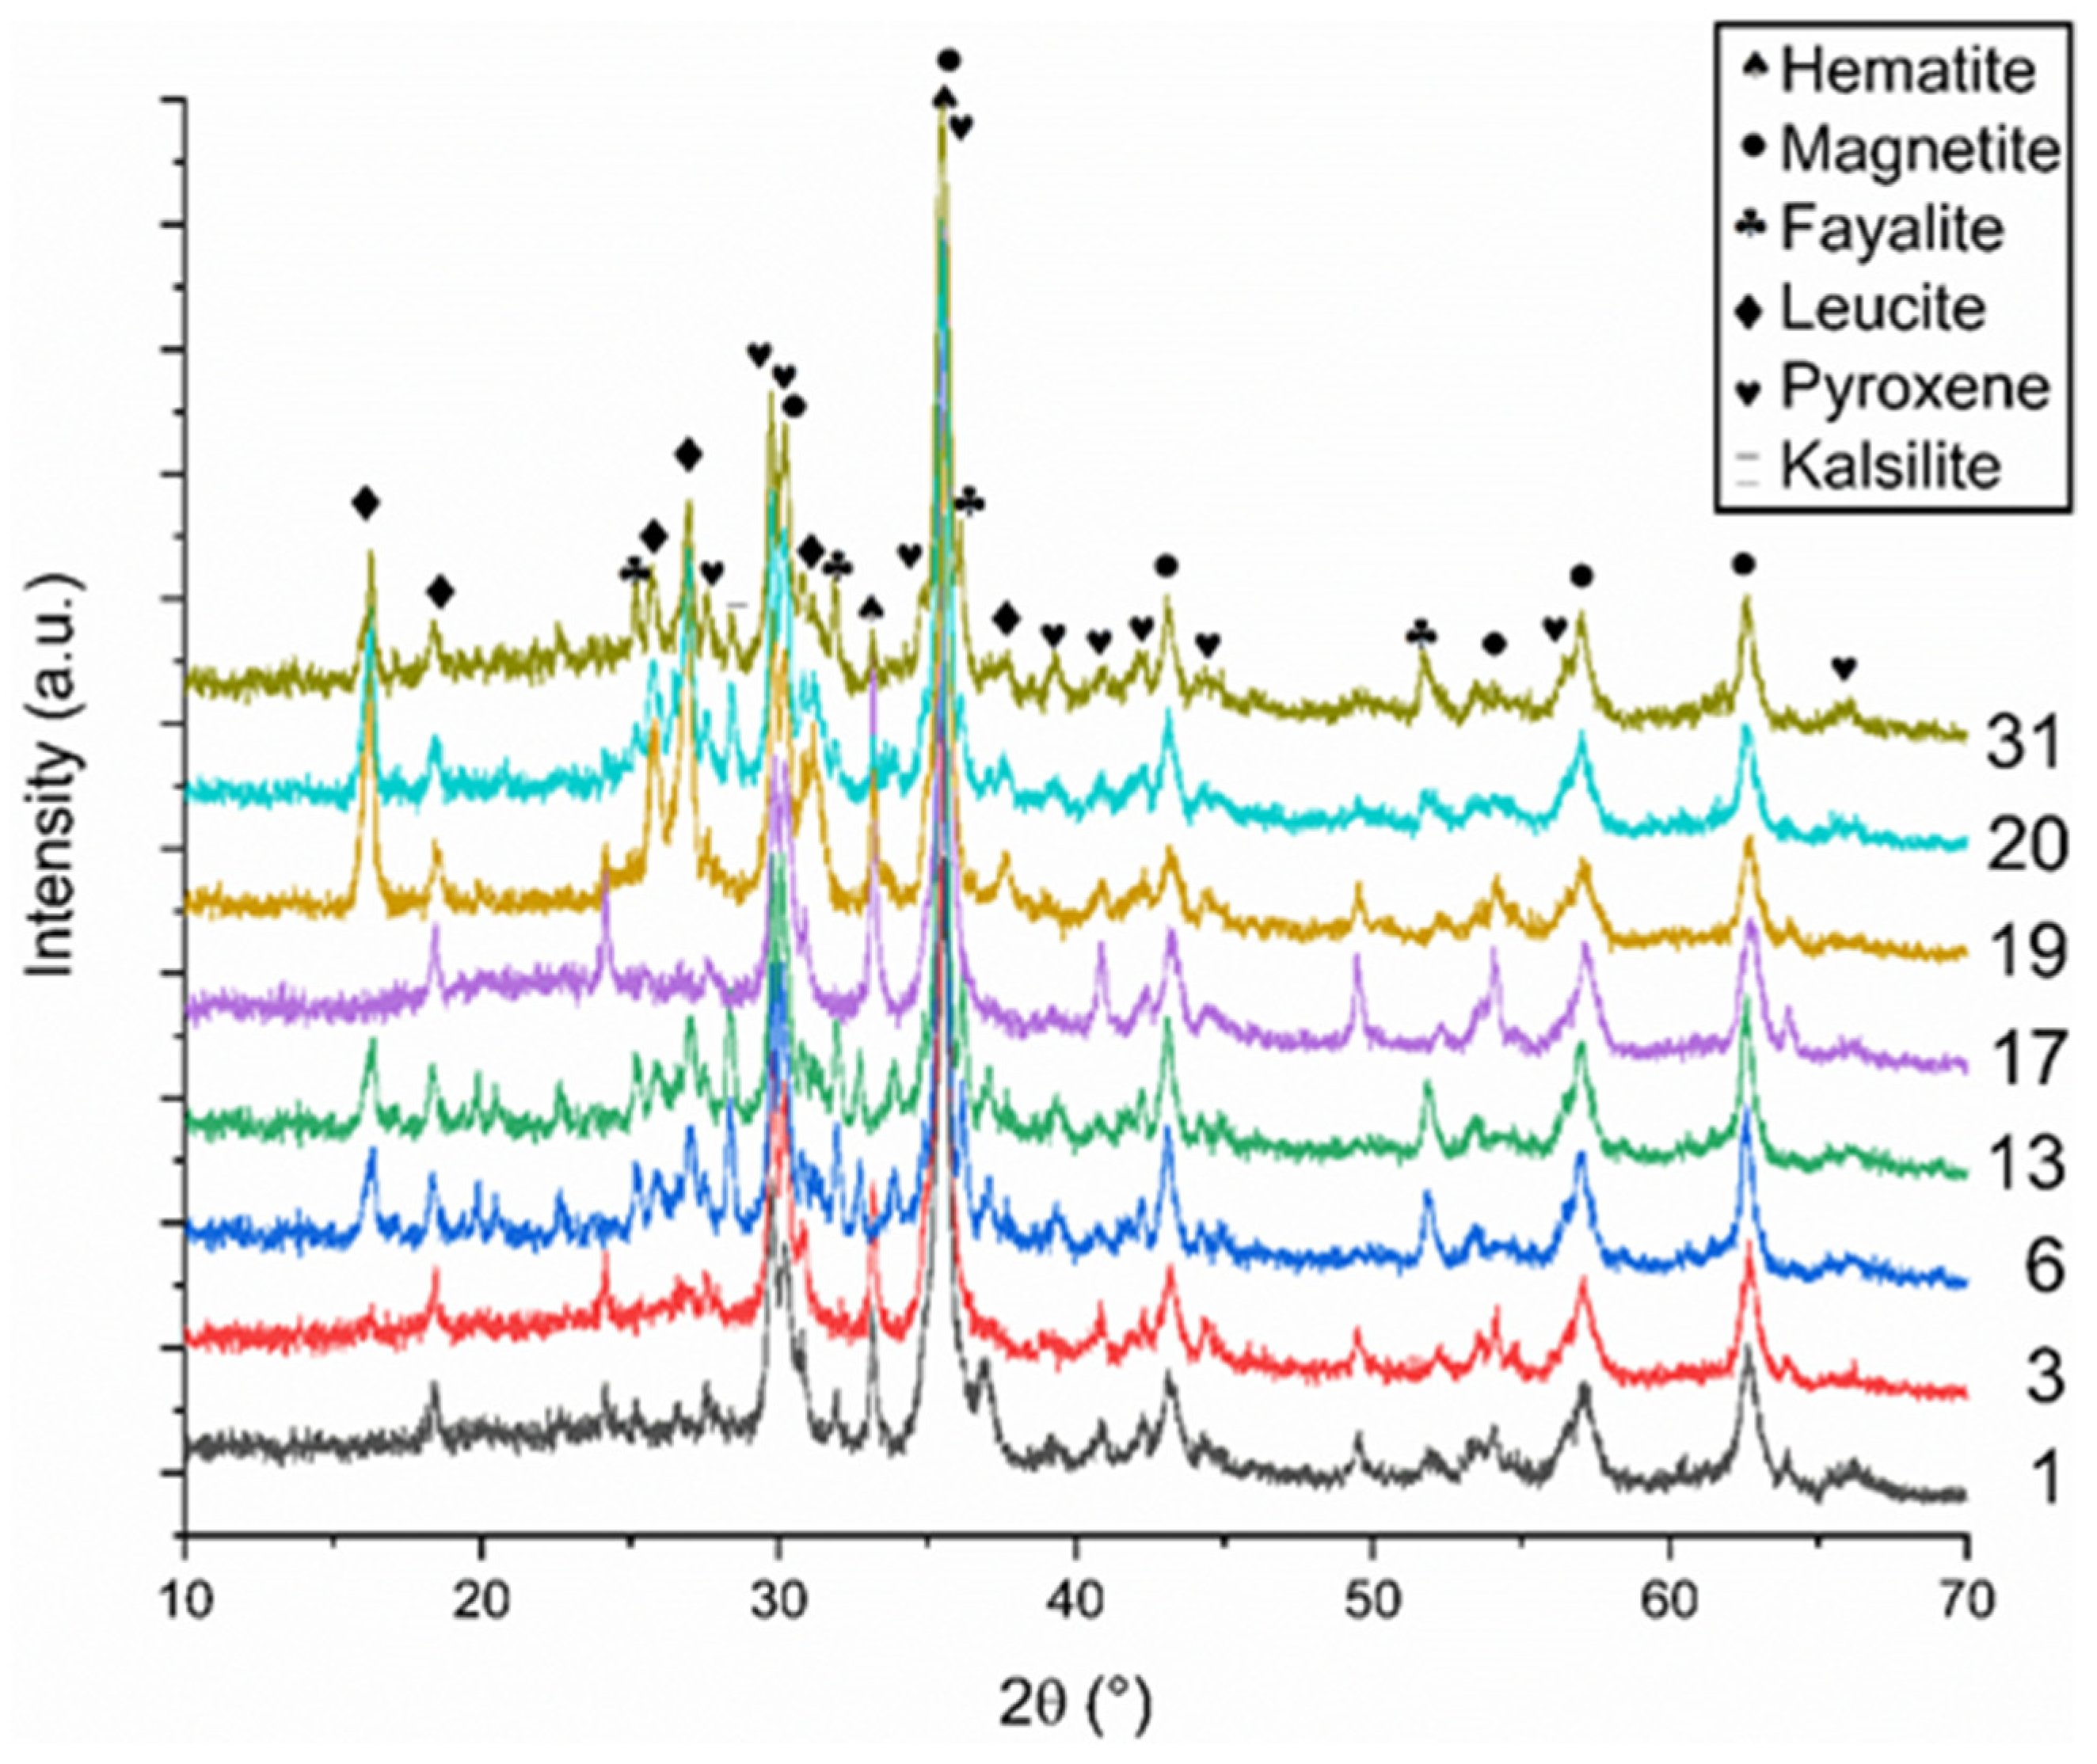
3.10. XRD
4. Conclusions
Author Contributions
Funding
Institutional Review Board Statement
Informed Consent Statement
Data Availability Statement
Acknowledgments
Conflicts of Interest
References
- Mehta, P.K. High-performance, high-volume fly ash concrete for sustainable development. In Proceedings of the International Workshop on Sustainable Development and Concrete Technology, Beijing, China, 20–21 May 2004; pp. 3–14. [Google Scholar]
- Scrivener, K.L.; Kirkpatrick, R.J. Innovation in use and research on cementitious material. Cem. Concr. Res. 2008, 38, 128–136. [Google Scholar] [CrossRef]
- Zhang, H.Y.; Kodur, V.; Qi, S.L.; Cao, L.; Wu, B. Development of metakaolin-fly ash based geopolymers for fire resistance applications. Constr. Build. Mater. 2014, 55, 38–45. [Google Scholar] [CrossRef]
- Shi, C.; Krivenko, P.V.; Roy, D. Alkali-Activated Cements and Concretes; Taylor & Francis: New York, NY, USA, 2006. [Google Scholar]
- Davidovits, J. Global warming impact on the cement and aggregates industries. World Resour. Rev. 1994, 6, 263–278. [Google Scholar]
- Vickers, L.; van Riessen, A.; Rickard, W. Fire-Resistant Geopolymers: Role of Fibres and Fillers to Enhance Thermal Properties; SpringerBriefs in Materials: Berlin/Heidelberg, Germany, 2015; pp. 17–18. ISBN 9789812873101. Available online: http://link.springer.com/content/pdf/10.1007/978-981-287-311-8.pdf (accessed on 10 March 2022).
- Li, L.; Shi, L.; Wang, Q.; Liu, Y.; Dong, J.; Zhang, H.; Zhang, G. A review on the recovery of fire-damaged concrete with post-fire-curing. Constr. Build. Mater. 2020, 237, 117564. [Google Scholar] [CrossRef]
- Taylor, H.F. Cement Chemistry, 2nd ed.; Thomas Telford Publishing: London, UK, 1997. [Google Scholar]
- Hewlett, P.C. Lea’s Chemistry of Cement and Concrete; Elsevier: Amsterdam, The Netherlands, 2003; ISBN 9780750662567. [Google Scholar]
- Fernández-Jiménez, A.; Pastor, J.Y.; Martín, A.; Palomo, A. High-temperature resistance in alkali-activated cement. J. Am. Ceram. Soc. 2010, 93, 3411–3417. [Google Scholar] [CrossRef]
- Mendes, A.; Sanjayan, J.; Collins, F. Phase transformations and mechanical strength of OPC/Slag pastes submitted to high temperatures. Mater. Struct. Constr. 2008, 41, 345–350. [Google Scholar] [CrossRef]
- Kong, D.L.Y.; Sanjayan, J.G.; Sagoe-Crentsil, K. Factors affecting the performance of metakaolin geopolymers exposed to elevated temperatures. J. Mater. Sci. 2008, 43, 824–831. [Google Scholar] [CrossRef]
- Kong, D.L.Y.; Sanjayan, J.G. Damage behavior of geopolymer composites exposed to elevated temperatures. Cem. Concr. Compos. 2008, 30, 986–991. [Google Scholar] [CrossRef]
- Martin, A.; Pastor, J.Y.; Palomo, A.; Fernández Jiménez, A. Mechanical behaviour at high temperature of alkali-activated aluminosilicates (geopolymers). Constr. Build. Mater. 2015, 93, 1188–1196. [Google Scholar] [CrossRef]
- Zevgolis, E.N. Ferronickel Slag Uses and Environment Ferronickel Slag: Uses and Environment. 2017. Available online: https://www.researchgate.net/publication/320960603_Ferronickel_Slag_Uses_and_Environment (accessed on 30 March 2022).
- Larco General Mining & Metallurgical Co., S.A. Research and Development. 2022. Available online: http://www.larco.gr/rnd.php (accessed on 30 March 2022).
- Maragkos, I.; Giannopoulou, I.P.; Panias, D. Synthesis of ferronickel slag-based geopolymers. Miner. Eng. 2009, 22, 196–203. [Google Scholar] [CrossRef]
- Komnitsas, K.; Zaharaki, D.; Perdikatsis, V. Geopolymerisation of low calcium ferronickel slags. J. Mater. Sci. 2007, 42, 3073–3082. [Google Scholar] [CrossRef]
- Mo, L.; Zhang, F.; Deng, M.; Jin, F.; Al-Tabbaa, A.; Wang, A. Accelerated carbonation and performance of concrete made with steel slag as binding materials and aggregates. Cem. Concr. Compos. 2017, 83, 138–145. [Google Scholar] [CrossRef]
- Rosales, J.; Cabrera, M.; Agrela, F. Effect of stainless steel slag waste as a replacement for cement in mortars. Mechanical and statistical study. Constr. Build. Mater. 2017, 142, 444–458. [Google Scholar] [CrossRef]
- Pasetto, M.; Baliello, A.; Giacomello, G.; Pasquini, E. Sustainable solutions for road pavements: A multi-scale characterization of warm mix asphalts containing steel slags. J. Clean. Prod. 2017, 166, 835–843. [Google Scholar] [CrossRef]
- Gee, C.; Ramsey, M.H.; Maskall, J.; Thornton, I. Mineralogy and weathering processes in historical smelting slags and their effect on the mobilisation of lead. J. Geochemical. Explor. 1997, 58, 249–257. [Google Scholar] [CrossRef]
- Sakkas, K.; Nomikos, P.; Sofianos, A.; Panias, D. Utilisation of FeNi-Slag for the production of inorganic polymeric materials for construction or for passive fire protection. Waste Biomass Valorization 2014, 5, 403–410. [Google Scholar] [CrossRef]
- Davidovits, J. Fire proof geopolymeric cements. In Proceedings of the Geopolymere ’99 2nd International Conference on Geopolymer, Saint-Quentin, France, 30 June–2 July 1999; pp. 165–170. [Google Scholar]
- Pacheco-Torgal, F.; Abdollahnejad, Z.; Camões, A.F.; Jamshidi, M.; Ding, Y. Durability of alkali-activated binders: A clear advantage over Portland cement or an unproven issue? Constr. Build. Mater. 2012, 30, 400–405. [Google Scholar] [CrossRef]
- Komnitsas, K.; Bartzas, G.; Karmali, V.; Petrakis, E.; Kurylak, W.; Pietek, G.; Kanasiewicz, J. Assessment of alkali activation potential of a Polish ferronickel slag. Sustainability 2019, 11, 1863. [Google Scholar] [CrossRef]
- Komnitsas, K.; Zaharaki, D.; Bartzas, G. Effect of sulphate and nitrate anions on heavy metal immobilisation in ferronickel slag geopolymers. Appl. Clay Sci. 2013, 73, 103–109. [Google Scholar] [CrossRef]
- Mohd Basri, M.S.; Mustapha, F.; Mazlan, N.; Ishak, M.R. Fire retardant performance of rice husk ash-based geopolymer coated mild steel–A factorial design and microstructure analysis. Mater. Sci. Forum. 2016, 841, 48–54. [Google Scholar] [CrossRef]
- Komnitsas, K.; Zaharaki, D.; Perdikatsis, V. Effect of synthesis parameters on the compressive strength of low-calcium ferronickel slag inorganic polymers. J. Hazard. Mater. 2009, 161, 760–768. [Google Scholar] [CrossRef] [PubMed]
- Kovalchuk, G.; Krivenko, P.V. Producing fire- and heat-resistant geopolymers. Geopolym. Struct. Process. Prop. Ind. Appl. 2009, 227–266. [Google Scholar] [CrossRef]
- van Oss, H. Slag—Iron and Steel, U.S. Geological Survey Minerals Yearbook—2002; USGS: Reston, VA, USA, 2003.
- Carabba, L.; Manzi, S.; Rambaldi, E.; Ridolfi, G.; Bignozzi, M.C. High-temperature behaviour of alkali-activated composites based on fly ash and recycled refractory particles. J. Ceram. Sci. Technol. 2017, 8, 377–387. [Google Scholar] [CrossRef]
- Li, O.H.; Yun-ming, L.; Cheng-yong, H.; Bayuaji, R.; Mustafa, M.; Bakri, A.; Loong, F.K.; Jin, T.S.; Teng, N.H.; Nabiałek, M.; et al. Evaluation of the Effect of Silica Fume on Amorphous Fly Ash Geopolymers Exposed to Elevated Temperature. Magnetochemistry 2021, 7, 9. [Google Scholar] [CrossRef]
- Vickers, L.; Rickard, W.D.A.; Van Riessen, A. Strategies to control the high temperature shrinkage of fly ash based geopolymers. Thermochim. Acta 2014, 580, 20–27. [Google Scholar] [CrossRef]
- An, E.M.; Cho, Y.H.; Chon, C.M.; Lee, D.G.; Lee, S. Synthesizing and assessing fire-resistant geopolymer from rejected fly ash. J. Korean Ceram. Soc. 2015, 52, 253–263. [Google Scholar] [CrossRef][Green Version]
- Kohout, J.; Koutn, P.; Kohoutov, E. Effect of K/Al Molar Ratio on the Thermo-Mechanical Properties of Metakaolinite-Based Geopolymer Composites. Polymers 2021, 13, 3754. [Google Scholar] [CrossRef]
- Phan, L. Fire Performance of High-Strength Concrete: A Report of the State-of-the-Art; National Institute of Standards and Tchnology: Gaithersburg, MD, USA, 1996.
- Coelho, A.A. TOPAS-Academic; A Computer Programme for Rietveld Analysis. 2004. Available online: https://onlinelibrary.wiley.com/iucr/doi/10.1107/S1600576718000183 (accessed on 10 March 2022).
- StatEase, Inc. Optimality Criteria. 2022. Available online: https://www.statease.com/docs/v11/contents/advanced-topics/optimality-criteria/ (accessed on 9 May 2022).
- Bakker, J. Energy Use of Fine Grinding in Mineral Processing. J. Metal. Mater. Trans. E. 2014, 1, 8–19. [Google Scholar] [CrossRef]
- Duxson, P.; Lukey, G.C.; Van Deventer, J.S.J. Physical evolution of Na-geopolymer derived from metakaolin up to 1000 °C. J. Mater. Sci. 2007, 42, 3044–3054. [Google Scholar] [CrossRef]
- He, R.; Dai, N.; Wang, Z. Thermal and Mechanical Properties of Geopolymers Exposed to High Temperature: A Literature Review. Adv. Civ. Eng. 2020, 2020, 1–17. [Google Scholar] [CrossRef]
- Nath, S.K.; Kumar, S. Role of particle fineness on engineering properties and microstructure of fly ash derived geopolymer. Constr. Build. Mater. 2020, 233, 117294. [Google Scholar] [CrossRef]
- Rakhimova, N.R.; Rakhimov, R.Z.; Morozov, V.P.; Gaifullin, A.R.; Potapova, L.I.; Gubaidullina, A.M.; Osin, Y.N. Marl-based geopolymers incorporated with limestone: A feasibility study. J. Non. Cryst. Solids 2018, 492, 1–10. [Google Scholar] [CrossRef]
- Rashad, A.M.; Ouda, A.S. An investigation on alkali-activated fly ash pastes modified with quartz powder subjected to elevated temperatures. Constr. Build. Mater. 2016, 122, 417–425. [Google Scholar] [CrossRef]
- Duan, P.; Yan, C.; Zhou, W.; Luo, W.; Shen, C. An investigation of the microstructure and durability of a fluidized bed fly ash-metakaolin geopolymer after heat and acid exposure. Mater. Des. 2015, 74, 125–137. [Google Scholar] [CrossRef]
- Zhang, H.Y.; Kodur, V.; Wu, B.; Cao, L.; Qi, S.L. Comparative Thermal and Mechanical Performance of Geopolymers derived from Metakaolin and Fly Ash. J. Mater. Civ. Eng. 2016, 28, 04015092. [Google Scholar] [CrossRef]
- Rovnaník, P.; Šafránková, K. Thermal behaviour of metakaolin/fly ash geopolymers with chamotte aggregate. Materials 2016, 9, 535. [Google Scholar] [CrossRef]
- Cruz, C.R.; Gillen, M. Thermal expansion of Portland cement paste, mortar and concrete at high temperatures. Fire Mater. 1980, 4, 66–70. [Google Scholar] [CrossRef]
- Rickard, W.D.A.; Van Riessen, A.; Walls, P. Thermal character of geopolymers synthesized from class F Fly ash containing high concentrations of iron and α-quartz. Int. J. Appl. Ceram. Technol. 2010, 7, 81–88. [Google Scholar] [CrossRef]
- Provis, J.L.; Van Deventer, J.S.J. Geopolymers: Structures, Processing, Properties and Industrial Applications; Woodhead Publishing: Sawston, UK, 2009; ISBN 9781845694494. [Google Scholar]
- Bernal, S.A.; Rodríguez, E.D.; Mejía De Gutiérrez, R.; Gordillo, M.; Provis, J.L. Mechanical and thermal characterisation of geopolymers based on silicate-activated metakaolin/slag blends. J. Mater. Sci. 2011, 46, 5477–5486. [Google Scholar] [CrossRef]
- Bakharev, T. Thermal behaviour of geopolymers prepared using class F fly ash and elevated temperature curing. Cem. Concr. Res. 2006, 36, 1134–1147. [Google Scholar] [CrossRef]
- Duxson, P.; Lukey, G.C.; van Deventer, J.S.J. The thermal evolution of metakaolin geopolymers: Part 2–Phase stability and structural development. J. Non. Cryst. Solids 2007, 353, 2186–2200. [Google Scholar] [CrossRef]
- de Jong, B.H.W.S.; Brown, G.E. Polymerization of silicate and aluminate tetrahedra in glasses, melts, and aqueous solutions-I. Electronic structure of H6Si2O7, H6AlSiO71–, and H6Al2O72–. Geochim. Cosmochim. Acta 1980, 44, 491–511. [Google Scholar] [CrossRef]
- Bernal, S.A.; Mejía de Gutiérrez, R.; Ruiz, F.; Quiñones, H.; Provis, J.L. Desempeño a temperaturas altas de morteros y hormigones basados en mezclas de escoria/metacaolín activadas alcalinamente. Mater. Constr. 2012, 62, 471–488. [Google Scholar] [CrossRef]
- Escalante García, J.I.; Campos-Venegas, K.; Gorokhovsky, A.; Fernández, A. Cementitious composites of pulverised fuel ash and blast furnace slag activated by sodium silicate: Effect of Na2O concentration and modulus. Adv. Appl. Ceram. 2006, 105, 201–208. [Google Scholar] [CrossRef]
- Duran Atiş, C.; Bilim, C.; Çelik, Ö.; Karahan, O. Influence of activator on the strength and drying shrinkage of alkali-activated slag mortar. Constr. Build. Mater. 2009, 23, 548–555. [Google Scholar] [CrossRef]
- Yang, K.-H.; Song, J.-K. Workability Loss and Compressive Strength Development of Cementless Mortars Activated by Combination of Sodium Silicate and Sodium Hydroxide. J. Mater. Civ. Eng. 2009, 21, 119–127. [Google Scholar] [CrossRef]
- Panias, D.; Giannopoulou, I.P.; Perraki, T. Effect of synthesis parameters on the mechanical properties of fly ash-based geopolymers. Colloids Surfaces. A Physicochem. Eng. Asp. 2007, 301, 246–254. [Google Scholar] [CrossRef]
- Panias, D.; Giannopoulou, I. The Geopolymerization Technology for the Utilization of Mining and Metallurgical Solid Wastes. In Proceedings of the European Metallurgical Conference, Dusseldorf, Germany, 11–14 June 2007. [Google Scholar]
- Rickard, W.D.A.; Gluth, G.J.G.; Pistol, K. In-situ thermo-mechanical testing of fly ash geopolymer concretes made with quartz and expanded clay aggregates. Cem. Concr. Res. 2016, 80, 33–43. [Google Scholar] [CrossRef]
- Zhang, H.Y.; Qiu, G.H.; Kodur, V.; Yuan, Z.S. Spalling behavior of metakaolin-fly ash based geopolymer concrete under elevated temperature exposure. Cem. Concr. Compos. 2020, 106, 103483. [Google Scholar] [CrossRef]
- Yang, Z.; Mocadlo, R.; Zhao, M.; Sisson, R.D.; Tao, M.; Liang, J. Preparation of a geopolymer from red mud slurry and class F fly ash and its behavior at elevated temperatures. Constr. Build. Mater. 2019, 221, 308–317. [Google Scholar] [CrossRef]
- Luhar, S.; Chaudhary, S.; Luhar, I. Thermal resistance of fly ash based rubberized geopolymer concrete. J. Build. Eng. 2018, 19, 420–428. [Google Scholar] [CrossRef]
- Chen-Tan, N.W.; Van Riessen, A.; Ly, C.V.; Southam, D.C. Determining the reactivity of a fly ash for production of geopolymer. J. Am. Ceram. Soc. 2009, 92, 881–887. [Google Scholar] [CrossRef]
- Rickard, W.D.A.; Williams, R.; Temuujin, J.; van Riessen, A. Assessing the suitability of three Australian fly ashes as an aluminosilicate source for geopolymers in high temperature applications. Mater. Sci. Eng. A 2011, 528, 3390–3397. [Google Scholar] [CrossRef]
- Barbosa, V.F.F.; MacKenzie, K.J.D. Thermal behaviour of inorganic geopolymers and composites derived from sodium polysialate. Mater. Res. Bull. 2003, 38, 319–331. [Google Scholar] [CrossRef]
- Krivenko, P.V.; Kovalchuk, G.Y. Directed synthesis of alkaline aluminosilicate minerals in a geocement matrix. J. Mater. Sci. 2007, 42, 2944–2952. [Google Scholar] [CrossRef]
- Rashad, A.M.; Zeedan, S.R. The effect of activator concentration on the residual strength of alkali-activated fly ash pastes subjected to thermal load. Constr. Build. Mater. 2011, 25, 3098–3107. [Google Scholar] [CrossRef]
- Sivasakthi, M.; Jeyalakshmi, R.; Rajamane, N.P.; Jose, R. Thermal and structural micro analysis of micro silica blended fly ash based geopolymer composites. J. Non. Cryst. Solids 2018, 499, 117–130. [Google Scholar] [CrossRef]
- Fernández-Jiménez, A.; Palomo, A.; Pastor, J.Y.; Martín, A. New cementitious materials based on alkali-activated fly ash: Performance at high temperatures. J. Am. Ceram. Soc. 2008, 91, 3308–3314. [Google Scholar] [CrossRef]
- Duxson, P.; Provis, J.L.; Lukey, G.C.; Mallicoat, S.W.; Kriven, W.M.; Van Deventer, J.S.J. Understanding the relationship between geopolymer composition, microstructure and mechanical properties. Colloids Surfaces. A Physicochem. Eng. Asp. 2005, 269, 47–58. [Google Scholar] [CrossRef]
- Kovářík, T.; Rieger, D.; Kadlec, J.; Křenek, T.; Kullová, L.; Pola, M.; Bělský, P.; Franče, P.; Říha, J. Thermomechanical properties of particle-reinforced geopolymer composite with various aggregate gradation of fine ceramic filler. Constr. Build. Mater. 2017, 143, 599–606. [Google Scholar] [CrossRef]
- Vázquez-Acosta, F.; Torres-Martínez, L.M.; López-González, W.; Ibarra-Rodríguez, J. Influence of iron content on the color of the C 3A-Fe 2O 3 system synthesized under different conditions of temperature, atmosphere and cooling. Ceram. Int. 2012, 38, 3261–3272. [Google Scholar] [CrossRef]
- Eramet Group Combined General Shareholders’ Meeting, 28 May 2021; Volume 2020, pp. 2019–2021. Available online: https://www.eramet.com/en/investors/general-meeting-2021 (accessed on 20 March 2022).
- Anderson, J.; Moncaster, A. Embodied carbon of concrete in buildings, Part 1: Analysis of published EPD. Build. Cities 2020, 1, 198–217. [Google Scholar] [CrossRef]
- Marangoni, M.; Arnout, L.; Machiels, L.; Pandelaers, L.; Bernardo, E.; Colombo, P.; Pontikes, Y.; Jantzen, C. Porous, Sintered Glass-Ceramics from Inorganic Polymers Based on Fayalite Slag. J. Am. Ceram. Soc. 2016, 99, 1985–1991. [Google Scholar] [CrossRef]


| Composition | SiO2 | Al2O3 | CaO | Fe2O3 | MgO | Na2O | P2O5 | K2O | TiO2 | MnO | LOI |
|---|---|---|---|---|---|---|---|---|---|---|---|
| Ferronickel | 36.9 | 3.61 | 4.18 | 32.8 | 7.41 | 0.15 | 0.02 | 0.48 | 0.19 | 0.00 | 0.00 |
| Silica fume | 88.9 | 0.73 | 0.34 | 1.01 | 0.63 | 0.71 | 0.03 | 1.50 | 0.00 | 0.12 | 6.82 |
| Material | Code | Cost (Euro/t) | CO2-eq. (kg/t) | Energy Consumption (MWh/t) | Mixture Boundaries by Weight (%) | |
|---|---|---|---|---|---|---|
| Lower Bound | Upper Bound | |||||
| FNS | A | 31 * | 26.9 ** | 0.06 | 66.4 | 98.0 |
| KOH | B | 5000 | 945.9 | 3.9 | 2.0 | 6.9 |
| KS | C | 17,089 | 1585.3 | 0.3 | 0.0 | 12.1 |
| SF | D | 5500 | 3.1 | 0 *** | 0.0 | 14.7 |
| Mix Number | Build Type | Space Type | FNS (kg) | SF (kg) | KOH (kg) | KS (kg) |
|---|---|---|---|---|---|---|
| 1 | Model | Plane | 910.47 | 0.00 | 37.05 | 52.48 |
| 2 | Replicate | Plane | 910.47 | 0.00 | 37.05 | 52.48 |
| 3 | Model | Edge | 863.76 | 0.00 | 19.67 | 116.57 |
| 4 | Model | Vertex | 931.00 | 0.00 | 69.00 | 0.00 |
| 5 | Model | Vertex | 980.33 | 0.00 | 19.67 | 0.00 |
| 6 | Model | Edge | 859.48 | 0.00 | 69.00 | 71.52 |
| 7 | Replicate | Edge | 859.48 | 0.00 | 69.00 | 71.52 |
| 8 | Model | Edge | 824.68 | 0.00 | 54.65 | 120.67 |
| 9 | Lack of Fit | Interior | 832.50 | 41.97 | 24.27 | 101.26 |
| 10 | Lack of Fit | Edge | 934.59 | 45.74 | 19.67 | 0.00 |
| 11 | Model | Interior | 853.25 | 50.57 | 42.43 | 53.75 |
| 12 | Model | Edge | 758.46 | 51.87 | 69.00 | 120.67 |
| 13 | Model | Plane | 870.22 | 63.30 | 19.67 | 46.81 |
| 14 | Model | Plane | 857.41 | 65.56 | 19.67 | 57.37 |
| 15 | Model | Edge | 859.96 | 71.04 | 69.00 | 0.00 |
| 16 | Model | Edge | 786.66 | 73.01 | 19.67 | 120.67 |
| 17 | Model | Plane | 882.18 | 74.32 | 43.50 | 0.00 |
| 18 | Model | Plane | 882.18 | 74.32 | 43.50 | 0.00 |
| 19 | Replicate | Plane | 760.28 | 75.48 | 43.57 | 120.67 |
| 20 | Model | Plane | 782.08 | 87.29 | 69.00 | 61.64 |
| 21 | Model | Plane | 782.08 | 87.29 | 69.00 | 61.64 |
| 22 | Center | Center | 790.43 | 88.10 | 49.17 | 72.30 |
| 23 | Replicate | Center | 790.43 | 88.10 | 49.17 | 72.30 |
| 24 | Lack of Fit | Edge | 709.50 | 100.83 | 69.00 | 120.67 |
| 25 | Lack of Fit | Plane | 826.96 | 110.46 | 19.67 | 42.91 |
| 26 | Lack of Fit | Interior | 823.59 | 110.80 | 62.17 | 3.44 |
| 27 | Model | Edge | 776.29 | 147.00 | 19.67 | 57.04 |
| 28 | Model | Plane | 745.16 | 147.00 | 45.53 | 62.32 |
| 29 | Model | Plane | 745.16 | 147.00 | 45.53 | 62.32 |
| 30 | Replicate | Plane | 745.16 | 147.00 | 45.53 | 62.32 |
| 31 | Model | Vertex | 712.67 | 147.00 | 19.67 | 120.67 |
| 32 | Model | Vertex | 833.33 | 147.00 | 19.67 | 0.00 |
| 33 | Model | Vertex | 784.00 | 147.00 | 69.00 | 0.00 |
| 34 | Model | Vertex | 664.33 | 147.00 | 69.00 | 119.67 |
| Mix Number | Spread (mm) | Mass Loss (%) | Shrinkage/Expansion (%) | Flexural Strength (MPa) | Compressive Strength (MPa) | Cost (€/t) | ||
|---|---|---|---|---|---|---|---|---|
| HTL * | Unheated | HTL | Unheated | |||||
| 1 | 300 | 14.6% | −6.0% | 0.58 | 5.18 | 19.61 | 64.02 | 528.7 |
| 2 | 300 | 14.6% | −7.0% | 0.43 | 5.21 | 21.09 | 64.31 | 528.7 |
| 3 | 300 | 15.0% | −5.5% | 0.74 | 3.09 | 24.60 | 48.76 | 1008.2 |
| 4 | 170 | 13.0% | −4.2% | 0.63 | 1.80 | 19.54 | 16.44 | 178.0 |
| 5 | 100 | 12.7% | −4.8% | 0.26 | 2.93 | 10.31 | 23.49 | 61.3 |
| 6 | 300 | 17.5% | −8.3% | 0.63 | 4.03 | 28.90 | 43.64 | 758.9 |
| 7 | 300 | 15.8% | −7.50% | 0.00 | 3.09 | 27.12 | 39.76 | 758.9 |
| 8 | 300 | 13.7% | −5.26% | 0.26 | 2.24 | 29.78 | 57.56 | 1124.2 |
| 9 | 300 | 16.2% | −7.48% | 0.92 | 4.04 | 20.13 | 41.71 | 905.1 |
| 10 | 160 | 12.5% | −6.75% | 0.34 | 3.11 | 7.80 | 51.58 | 72.6 |
| 11 | 300 | 16.6% | −6.03% | 0.53 | 2.98 | 20.91 | 67.37 | 564.3 |
| 12 | 300 | 17.1% | −5.71% | 0.08 | 2.42 | 17.87 | 16.66 | 1171.0 |
| 13 | 280 | 14.3% | −7.04% | 0.00 | 6.83 | 16.00 | 80.00 | 457.2 |
| 14 | 290 | 15.4% | −6.27% | 0.18 | 7.30 | 22.71 | 85.00 | 543.5 |
| 15 | 200 | 13.9% | −5.00% | 1.61 | 1.39 | 14.42 | 13.88 | 195.6 |
| 16 | 300 | 16.4% | −6.00% | 0.26 | 4.38 | 19.36 | 69.27 | 1059.5 |
| 17 | 170 | 13.2% | −4.73% | 1.48 | 2.40 | 8.41 | 16.80 | 136.1 |
| 18 | 190 | 12.8% | −3.25% | 2.48 | 1.44 | 21.04 | 12.28 | 136.1 |
| 19 | 300 | 13.9% | 0.27 | 2.68 | 10.30 | 72.06 | 1116.7 | |
| 20 | 300 | 16.2% | −6.25% | 0.19 | 4.64 | 37.48 | 46.43 | 700.3 |
| 21 | 300 | 16.3% | −5.24% | 0.52 | 3.40 | 31.47 | 36.02 | 700.3 |
| 22 | 300 | 15.0% | 0.22 | 4.22 | 15.24 | 69.11 | 740.2 | |
| 23 | 300 | 16.3% | −6.27% | 1.92 | 3.51 | 35.10 | 37.60 | 740.2 |
| 24 | 300 | 13.7% | 0.00 | 2.06 | 4.62 | 64.00 | 1183.1 | |
| 25 | 250 | 16.9% | −6.27% | 0.27 | 6.13 | 13.88 | 99.61 | 437.1 |
| 26 | 190 | 13.7% | −6.50% | 0.40 | 3.54 | 3.50 | 32.00 | 217.2 |
| 27 | 260 | 16.4% | −4.50% | 0.08 | 5.65 | 13.62 | 56.25 | 560.9 |
| 28 | 300 | 16.1% | 0.08 | 4.15 | 7.05 | 62.67 | 665.0 | |
| 29 | 300 | 17.0% | −0.25% | 0.10 | 4.94 | 10.71 | 55.20 | 665.0 |
| 30 | 300 | 14.2% | 0.50% | 0.14 | 2.85 | 16.82 | 94.51 | 665.0 |
| 31 | 300 | 17.2% | 0.08 | 4.53 | 2.79 | 63.34 | 1077.8 | |
| 32 | 140 | 13.9% | −2.49% | 0.19 | 1.86 | 6.84 | 23.33 | 97.6 |
| 33 | 210 | 16.1% | −4.25% | 0.55 | 3.57 | 25.42 | 62.16 | 214.4 |
| 34 | 300 | 14.8% | 0.12 | 2.85 | 3.21 | 55.46 | 1186.4 | |
| Response | A | B | C | D | AB | AC | AD | BC | BD | CD | ABC | BCD |
|---|---|---|---|---|---|---|---|---|---|---|---|---|
| Mass loss (%) | 0.0043846 | 0.4764324 | −0.116051 | 0.0108843 | −0.000168 | 5.033 × 10⁻⁵ | −0.000158 | −0.000187 | 4.122 × 10⁻⁵ | |||
| Shrinkage/expansion (%) | −0.002897 | −0.715021 | 0.1377021 | 0.1209094 | 0.0002632 | −5.24 × 10⁻⁵ | −4.49 × 10⁻⁵ | 0.0001457 | 0.0001736 | −0.000122 | 5.288 × 10⁻⁷ | |
| Flexural strength unheated (MPa) | 0.0018497 | 0.256696 | −0.327099 | −0.005653 | −9.83 × 10⁻⁵ | 0.0001257 | 0.0010853 | −4.1 × 10⁻⁵ | 0.0001593 | −4.32 × 10⁻⁷ | −6.74 × 10⁻⁷ | |
| Flexural strength heated (MPa) | 0.0002595 | 0.0012419 | −0.001349 | −0.000349 | ||||||||
| Compressive strength unheated (MPa) | 0.0108865 | −0.085398 | −0.394636 | 0.0828144 | 0.0002072 | |||||||
| Compressive strength heated (MPa) | 0.0006383 | 0.0750318 | −0.416928 | 0.0082899 |
| Response | Mean | Std. Dev. | C.V. % | R2 | Adjusted R2 | Predicted R2 | Adequate Precision |
|---|---|---|---|---|---|---|---|
| Mass loss (%) | 15.09 | 0.98 | 6.51 | 0.67 | 0.56 | 0.31 | 9.93 |
| Shrinkage/expansion (%) | −5.30 | 1.04 | 19.61 | 0.83 | 0.73 | 0.61 | 11.06 |
| Flexural strength unheated (MPa) | 3.66 | 0.74 | 20.22 | 0.82 | 0.75 | 0.63 | 11.99 |
| Flexural strength heated (MPa) | 0.49 | 0.55 | 113.25 | 0.17 | 0.09 | −0.01 | 5.28 |
| Compressive strength unheated (MPa) | 51.24 | 19.28 | 37.63 | 0.39 | 0.31 | 0.18 | 8.14 |
| Compressive strength heated (MPa) | 17.28 | 6.46 | 37.35 | 0.58 | 0.52 | 0.46 | 11.46 |
| Response | FNS (kg) | SF (kg) | KOH (kg) | KS (kg) | Mass Loss (%) | Shrinkage (%) | Flexural Strength Unheated (MPa) | Compressive Strength Heated (MPa) | Compressive Strength Unheated (MPa) | Cost (€/t) |
|---|---|---|---|---|---|---|---|---|---|---|
| Predicted | 870.33 | 63.30 | 19.67 | 46.67 | 15.62 | −7.66 | 6.28 | 16.93 | 59.65 | 456 |
| Measured (Mix 13) | 870.22 | 63.30 | 19.67 | 46.81 | 14.28 | −7.04 | 6.83 | 16.00 | 80.00 | 457 |
| Difference (%) | −0.01 | 0.00 | 0.00 | 0.31 | −8.58 | −8.09 | 8.81 | −5.49 | 34.12 | 0.22 |
Publisher’s Note: MDPI stays neutral with regard to jurisdictional claims in published maps and institutional affiliations. |
© 2022 by the authors. Licensee MDPI, Basel, Switzerland. This article is an open access article distributed under the terms and conditions of the Creative Commons Attribution (CC BY) license (https://creativecommons.org/licenses/by/4.0/).
Share and Cite
Arce, A.; Komkova, A.; Van De Sande, J.; Papanicolaou, C.G.; Triantafillou, T.C. Optimal Design of Ferronickel Slag Alkali-Activated Material for High Thermal Load Applications Developed by Design of Experiment. Materials 2022, 15, 4379. https://doi.org/10.3390/ma15134379
Arce A, Komkova A, Van De Sande J, Papanicolaou CG, Triantafillou TC. Optimal Design of Ferronickel Slag Alkali-Activated Material for High Thermal Load Applications Developed by Design of Experiment. Materials. 2022; 15(13):4379. https://doi.org/10.3390/ma15134379
Chicago/Turabian StyleArce, Andres, Anastasija Komkova, Jorn Van De Sande, Catherine G. Papanicolaou, and Thanasis C. Triantafillou. 2022. "Optimal Design of Ferronickel Slag Alkali-Activated Material for High Thermal Load Applications Developed by Design of Experiment" Materials 15, no. 13: 4379. https://doi.org/10.3390/ma15134379
APA StyleArce, A., Komkova, A., Van De Sande, J., Papanicolaou, C. G., & Triantafillou, T. C. (2022). Optimal Design of Ferronickel Slag Alkali-Activated Material for High Thermal Load Applications Developed by Design of Experiment. Materials, 15(13), 4379. https://doi.org/10.3390/ma15134379