Article

Gallic Acid-Functionalized, TiO2-Based Nanomaterial—Preparation, Physicochemical and Biological Properties

by
Pawel Bakun
1,2,*,
Beata Czarczynska-Goslinska
3,
Dariusz T. Mlynarczyk
1,
Marika Musielak
2,4,
Kinga Mylkie
5,
Jolanta Dlugaszewska
6,
Tomasz Koczorowski
1,
Wiktoria M. Suchorska
4,
Marta Ziegler-Borowska
5,
Tomasz Goslinski
1,* and
Rafal Krakowiak
1,2
1
Chair and Department of Chemical Technology of Drugs, Poznan University of Medical Sciences, Grunwaldzka 6, 60-780 Poznan, Poland
2
Doctoral School, Poznan University of Medical Sciences, Bukowska 70, 60-812 Poznan, Poland
3
Chair and Department of Pharmaceutical Technology, Poznan University of Medical Sciences, Grunwaldzka 6, 60-780 Poznan, Poland
4
Department of Electroradiology, Poznan University of Medical Sciences, Garbary 15, 61-866 Poznan, Poland
5
Faculty of Chemistry, Nicolaus Copernicus University in Torun, Gagarina 7, 87-100 Torun, Poland
6
Chair and Department of Genetics and Pharmaceutical Microbiology, Poznan University of Medical Sciences, Swiecickiego 4, 60-781 Poznan, Poland
*
Authors to whom correspondence should be addressed.
Materials 2022, 15(12), 4177; https://doi.org/10.3390/ma15124177
Submission received: 23 May 2022 / Revised: 6 June 2022 / Accepted: 8 June 2022 / Published: 13 June 2022
(This article belongs to the Special Issue Nanostructured Materials for Biomedical Applications)

Abstract

:
Wound healing and skin tissue regeneration remain the most critical challenges faced by medical professionals. Titanium(IV) oxide-based materials were proposed as components of pharmaceutical formulations for the treatment of difficult-to-heal wounds and unsightly scarring. A gallic acid-functionalized TiO2 nanomaterial (TiO2-GA) was obtained using the self-assembly technique and characterized using the following methods: scanning electron microscopy (SEM), transmission electron microscopy (TEM), nanoparticle tracking analysis (NTA), X-ray powder diffraction (XRPD), infrared spectroscopy (IR), Raman spectroscopy and thermogravimetry (TG). Additionally, physicochemical and biological tests (DPPH assay, Microtox® acute toxicity test, MTT assay) were performed to assess antioxidant properties as well as to determine the cytotoxicity of the novel material against eukaryotic (MRC-5 pd19 fibroblasts) and prokaryotic (Staphylococcus aureus, Escherichia coli, Candida albicans, Aliivibrio fischeri) cells. To determine the photocytotoxicity of the material, specific tests were carried out with and without exposure to visible light lamps (425 nm). Following the results, the TiO2-GA material could be considered an additive to dressings and rinsing suspensions for the treatment of difficult-to-heal wounds that are at risk of bacterial infections.

1. Introduction

Wound healing has historically been a challenging problem in medicine. Damaged tissue is at risk of possible infection, which may lead to severe complications, including gangrene and amputations, in extreme cases [1]. Even today, mistreated wounds can be a cause of morbidity and mortality [2]. A wound can be formed either by an internal pathological process or by external influence, i.e., mechanical disruption of the skin. Wounds can range from a simple fractioning of skin to deeper tissue damage: subcutaneous tissue, muscles, tendons and ligaments, vessels, nerves and even bones [3]. Apart from acute wounds, many hard-to-heal chronic wounds are formed as a result of direct or indirect damage of the cutaneous coverage, including arterial, venous, diabetic and pressure ulcers [4]. Several factors contribute to the wound-healing process, such as multiple cell populations, growth factors or inflammation mediators, etc. [5,6]. The mechanism of physiological wound healing can be divided into four partially overlapping stages: (i) coagulation and haemostasis; (ii) inflammation; (iii) proliferation; and (iv) wound remodeling with scar tissue formation [3]. Each of these stages can be strongly supported by a specific treatment.
The conventional treatment of a wound is based on aseptic wound care (debridement) and standard cotton dressing materials such as gauze and bandages. However, nowadays, wound healing treatment is being developed by the introduction of advanced materials based on, e.g., silver nanoparticles [7] and new therapeutic approaches such as hyperbaric therapy [8], which are often used to support wound healing. Many advanced materials designed to tackle the problem of wound healing have recently been studied, including various biopolymers such as alginate, chitosan, hyaluronan, pectin and gelatin [9]. Moreover, the performance of titanium(IV) oxide nanoparticles incorporated in gellan gum in wound healing has been assessed [10].
Titanium(IV) oxide (titania, TiO2) is a white inorganic compound that occurs in nature in three crystal forms: (a) anatase, (b) rutile and (c) brookite. The first two polymorphic forms of TiO2 can be easily prepared and reveal good photoactivity, and thus broad potential applicability [11]. The main features determining the wide interest in these materials are high photostability and photocatalytic activity, low toxicity and cost [12]. However, the optical response of TiO2 in the UV light range is accompanied by fast recombination of the generated electron-hole pairs, thus constituting a significant limitation, which can be overcome by surface modification of titania [13,14]. The photocatalytic activity of titania in the visible light range can be achieved by doping with metal oxides or by surface modifications with various sensitizers, including graphene, carbon nanotubes and porphyrinoids [13,15,16,17]. Titania revealed many potential applications in pharmacy and medicine due to its photocatalytic properties and oxidizing activity [18,19]. For example, it was evaluated in new treatments of skin diseases, such as acne and atopic dermatitis [20], and has also been used as a antimicrobial agent. For example, Gupta et al. assessed TiO2 and Ag-TiO2 in terms of their antibacterial properties against Escherichia coli, Pseudomonas aeruginosa and Staphylococcus aureus [21]. Moreover, the antibacterial activity against E. coli was studied by Wanag et al. with the use of TiO2 modified by reduced graphene oxide irradiated by artificial solar light [22]. Both studies mentioned showed a significant reduction in bacteria after treatment with TiO2-based materials.
Herein, we present the preparation and physicochemical characterization of a nanocomposite material consisting of TiO2 and gallic acid (3,4,5-trihydroxybenzoic acid, GA). It is worth noting that GA is a phenolic acid naturally occurring in many fruits and medicinal plants, which can be isolated using various chromatographic methods from different plant species such as Quercus spp. and Punica spp. However, commercially available gallic acid is produced by the hydrolysis of tannic acid using tannase—a glycoprotein esterase [23]. Gallic acid is commonly applied in the food and pharmaceutical industries. In medical applications, it reveals diverse health-promoting effects as an antioxidant and an anti-inflammatory agent, as well as it also possesses antineoplastic properties. Recently, some reports on its therapeutic activities in gastrointestinal, neuropsychological, metabolic and cardiovascular disorders, as well as its antibacterial activities, have been published [24,25]. Significantly, GA is a strong antioxidant used for in vitro wound healing studies, in which accelerated cell migration (keratinocytes and fibroblasts) was observed [26]. It is important to note that gallic acid-modified nanomaterials, such as gold [27] and magnetite nanoparticles, were studied for their antibacterial activity [28]. To our knowledge, the combination of titanium oxide nanoparticles with gallic acid has not yet been investigated in the context of wound healing. Herein, we present a broad study on gallic acid-modified titania nanoparticles. The novel hybrid material was assessed in terms of its antioxidant, antimicrobial and cytotoxic activities, revealing potential applications as a component for the treatment of hard-to-heal wounds.

2. Materials and Methods

2.1. Preparation of TiO2-GA Nanomaterial

All the reagents and solvents used in this study were purchased from commercial suppliers (Sigma-Aldrich, St. Louis, MI, USA, Fluorochem, Glossop, UK) and were used without additional purification. TiO2-GA was prepared by stirring Aeroxide P25 titanium(IV) oxide nanoparticles (200 mg) with 3,4,5-trihydroxybenzoic acid (200 mg) in methanol (40 mL) at room temperature for 24 h without access to light. Next, the suspension was centrifuged (1 h, 5800 rpm, MPW-352 centrifuge). The supernatant was discarded, and the beige precipitate was resuspended in methanol and dried under reduced pressure at ambient temperature. The nanomaterial was stored at room temperature in darkness and with limited access to air.

2.2. Physicochemical Characterization of the Material

X-ray diffraction (XRD) analysis was performed using a Pro Philips X’PERT diffractometer (Amsterdam, The Netherlands) with an X’Celerator Scientific detector (CuKα1, wavelength 1.54056 Å, 2Theta angle range 5–90°, scan step size 0.020°). Thermogravimetric analysis (TG) was performed using a Netzsch Jupiter STA 449 F5 Thermoanalyzer with an autosampler coupled with a Bruker Optik FT-IR spectrometer Vertex 70 V (Billerica, MA, USA). ATR-FTIR spectra were recorded with the Perkin Elmer ATR-FTIR Spectrum Two spectrometer (Waltham, MA, USA), using the ATR solids attachment with a diamond crystal. Raman spectra were recorded with the Senterra confocal Raman microscope by Bruker Optik. SEM images were taken using a 1430 VP microscope by LEO Electron Microscopy Ltd. TEM images were taken using a FEI Europe Tecnai F20 X-Twin microscope with atomic resolution. The hydrodynamic diameter of the nanoparticles was measured using the Malvern Panalytical NanoSight LM10 particle size analyzer (Malvern, UK). UV-Vis spectra were recorded on a Jasco V-770 spectrophotometer. An ASAP 2420 apparatus (Norcross, GA, USA) was used to analyze the BET surface area (absorptive: nitrogen, temperature: 77.350 K).

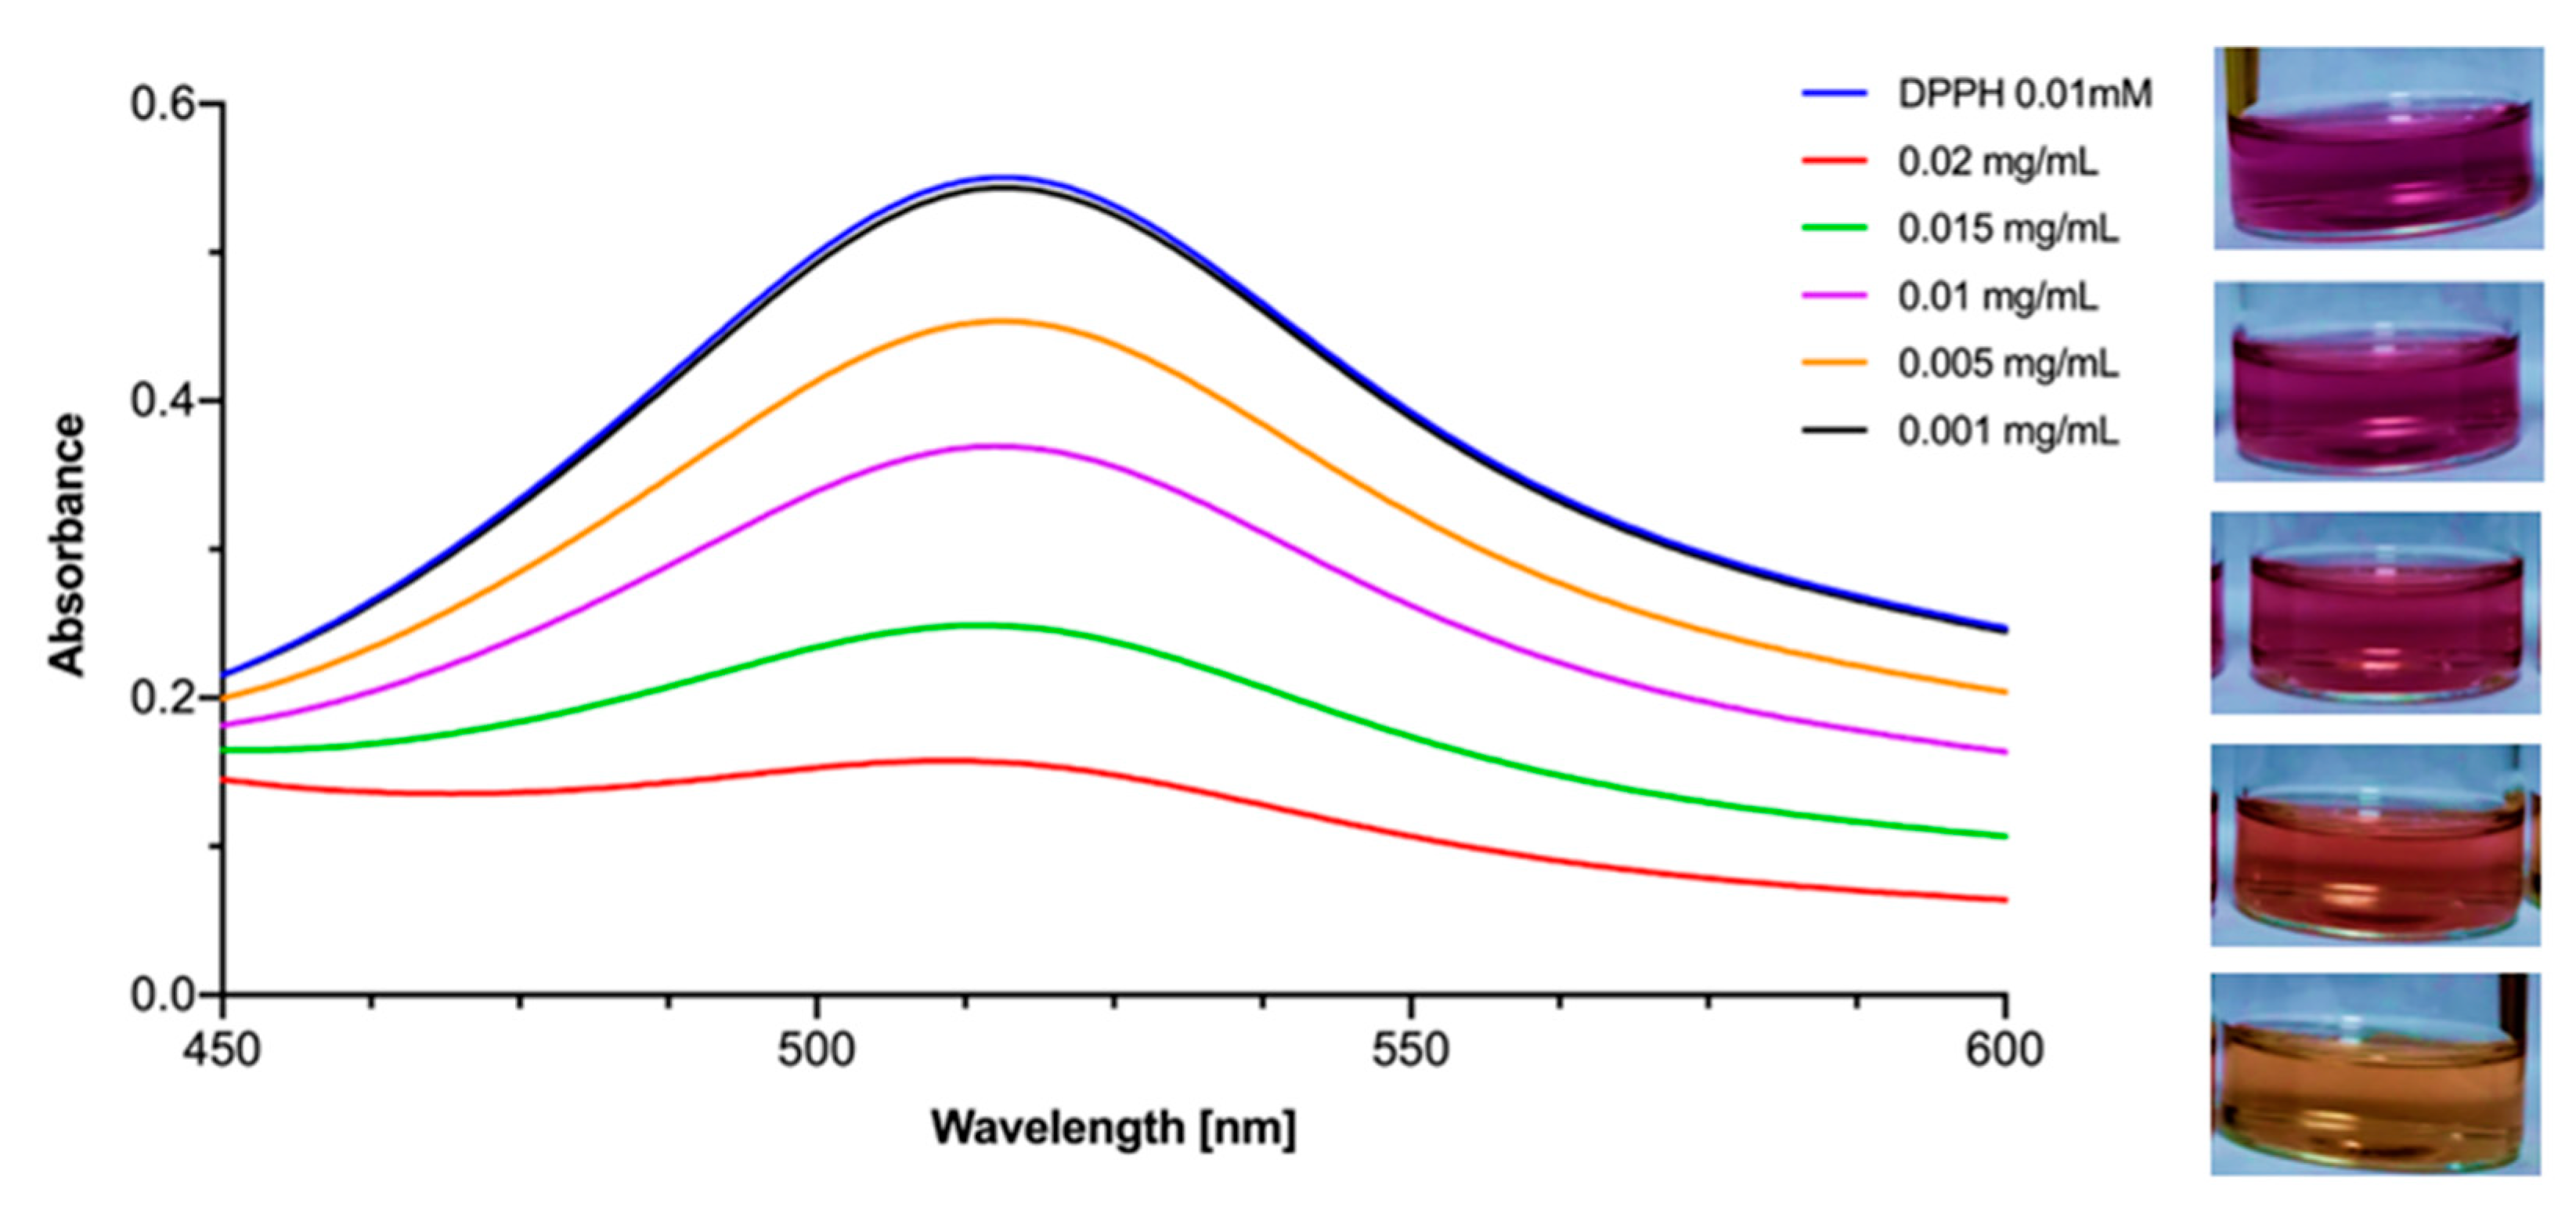
2.3. DPPH Antioxidant Assay

The DPPH assay was performed according to protocols available in the literature [28,29]. Briefly, 0.2 mM (200 µM) DPPH solution was prepared by dissolving 7.91 mg DPPH (2,2-diphenyl-1-picrylhydrazyl) in 100 mL of methanol. During the test, 3 mL of DPPH solution (0.2 mM) and 1 mL of the solution containing the appropriate amount of the tested substance were mixed. In this way, the molar concentration of DPPH of approximately 0.05 mM (50 µM) was obtained, which corresponded to the UV-Vis absorbance (517 nm) at approximately 0.6. The preparation of samples was performed under dim light. After 30 min of incubation in the dark, absorbance measurements were taken. All the experiments were performed in duplicate. In the case of TiO2 and TiO2-GA, sonication (10 s in Chemland ultrasonic cleaner, 180 W) was used to homogenize the sample to maintain the reproducibility of the results. In the case of TiO2 and TiO2-GA, the materials were separated from the solution using syringe filtration (PureLand 0.22 µm Nylon Syringe Filters, Chemland, Stargard, Poland) right before UV-Vis measurements. The radical scavenging activity was calculated using the equation below:
I   ( % ) = ( Ac As ) Ac × 100  
  • I (%)—the percentage of inhibition.
  • As—the absorbance of the compounds.
  • Ac—the absorbance of the DPPH solution (control).
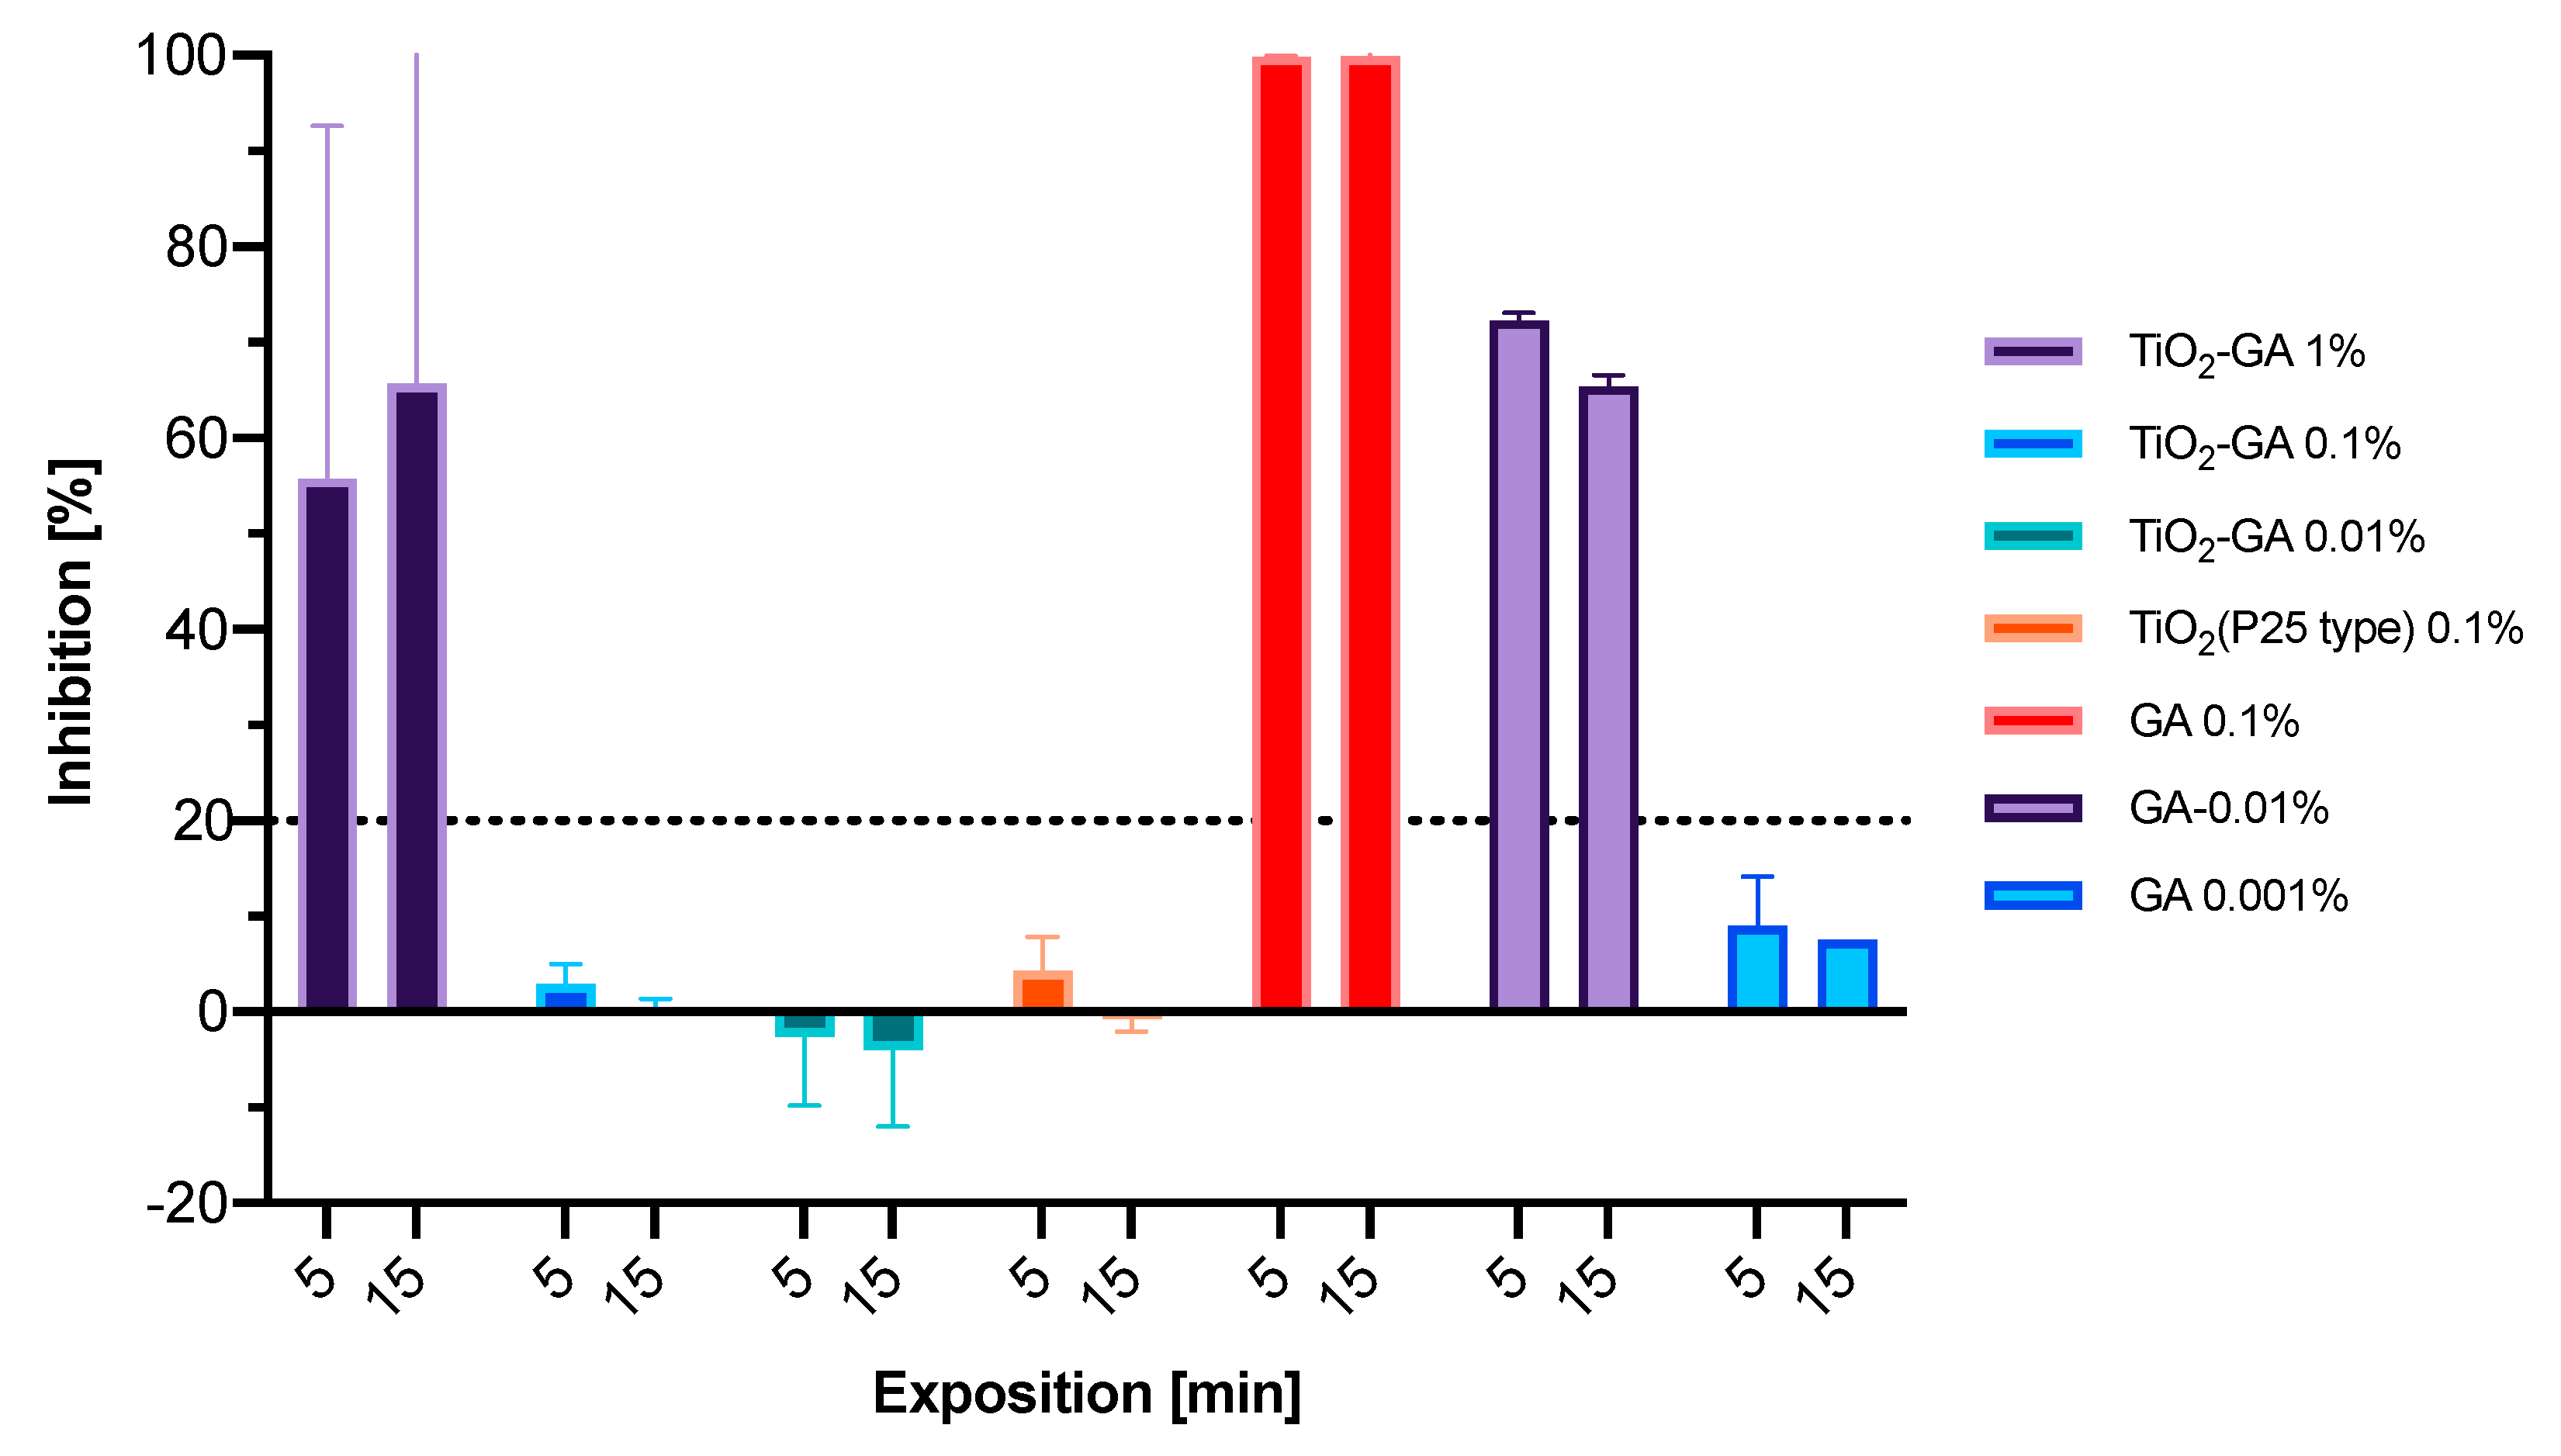
To determine the IC50 value (concentration required to achieve 50% inhibition of the DPPH radical) of the materials, the I (%) was plotted against different concentrations of the materials (TiO2-GA, TiO2) or reference compounds (GA, EGCG, curcumin, ascorbic acid). The IC50 was calculated from the linear equation obtained with the least-squares method.

2.4. Microtox Assay

An acute toxicity test was performed on a Modern Water Microtox Model 500 (Modern Water, Cambridge, UK) equipped with Modern Water MicrotoxOmni 4.2 software (Modern Water, Cambridge, UK) following the procedure provided by the supplier. The change in the bioluminescence of the bacterial suspension was monitored upon the addition of the sample suspension. A decrease in cell viability was calculated based on the decrease in bioluminescence detected in comparison to the negative control. For all the experiments, the material suspensions of appropriate concentrations were prepared using deionized water, followed by sonication and vortexing to obtain uniform dispersions at the time of testing.

2.5. Microbial Strains and Cultivation

Microbial strains of Staphylococcus aureus ATCC 25923, Escherichia coli ATCC 25922 and Candida albicans ATCC 10231 were used. All strains were stored in Microbank cryogenic vials at −70 ± 10 °C. Before each experiment, bacterial and fungal subcultures were prepared on Tryptone Soya Agar (TSA; OXOID, Basingstoke, UK) or Sabouraud Dextrose Agar (SDA; OXOID, UK), respectively. They were grown at 36 ± 1 °C for 18–24 h, and then a single colony from the plate was inoculated in Brain–Heart Infusion Broth (BHI; OXOID, UK) or Sabouraud Dextrose Liquid Medium (SDLM; OXOID, UK), respectively, and incubated aerobically at 36 ± 1 °C for 18–24 h. Next, microbial cells were centrifuged (3000 rpm for 15 min at 4 °C), resuspended in 0.9% NaCl (pH = 7.0) and diluted with 0.9% NaCl to a final concentration of ca. 107 colony-forming units (CFU) per mL. This suspension was further used in the experiments.
N values of microbial cells in CFU/mL were calculated according to the formula below. Afterward, to improve the clarity of the data, the N values were logarithmized.
N = (   c V × ( n 1 + 0.1 × n 2 ) × d 1 )  
  • N—number of CFU/mL.
  •   c —sum of colonies on counted plates.
  • V—inoculated volume [mL].
  • n1—number of plates from the first calculated dilution.
  • n2—number of plates from the second calculated dilution.
  • d1—dilution factor corresponding to the first dilution taken into account.

2.6. Photocytotoxicity Assessment against Bacteria and Fungi

Antimicrobial activity parameters (MIC and MBC) of the tested materials against S. aureus ATCC 25923, E. coli ATCC 25922 and C. albicans ATCC 10231 were initially determined using the broth microdilution method [30]. In the next experiment, the same three microorganisms were involved in order to provide basic information about the light-induced antimicrobial activity of the tested materials against different types of microorganisms such as Gram-positive bacteria, Gram-negative bacteria and fungus, respectively. To each well of the microtiter plate was added: (a) an aliquot of 150 μL of microbial suspension in sodium chloride solution (isotonic 0.9% NaCl) containing approximately 107 CFU/mL and (b) 150 µL of a suspension containing photosensitizer (TiO2 or TiO2-GA) at the concentration of 2 mg/mL (Table 1). The control sample contained 150 µL of 0.9% NaCl instead of the photosensitizer suspension. The suspension of the microbes with the photosensitizer was incubated for 20 min at room temperature. After that, the microtiter plates with samples were irradiated for 2 h with homemade LED lamps emitting light of either λmax = 365 nm or λmax = 425 nm from the distance of 1 cm. After this time, volumes of 1 µL and 50 µL from the undiluted samples were seeded on an appropriate solid growth medium (Tryptone Soya Agar, Sabouraud Dextrose Agar, Oxoid Ltd., Basingstoke, UK). After incubation (36 ± 1 °C for 24 h), the number of colonies was counted, and the number of bacteria surviving the treatment was determined. The results were expressed as log CFU/mL.
In order to determine the optimal conditions in the photocytotoxicity study, the experiment with S. aureus was carried out. Approximately 107 CFU/mL of microorganisms suspended in 150 µL of 0.9% NaCl and 150 µL of photosensitizer (TiO2-GA) suspension (2 mg/mL) were added to the wells of the microtiter plate (Table 2). The negative control sample contained 150 µL of 0.9% NaCl instead of the photosensitizer suspension. Preincubation time was set to 20 min. Microtiter plates with samples were irradiated from 10 to 120 min with 425 nm light from 1 cm. The light dose was measured with RD 0.2/2 radiometer (Optel) at 70 mW/cm2. After the mentioned time, the samples were 1:10 serially diluted, and 50 µL from the undiluted sample and 100 µL from each dilution were seeded on an appropriate solid growth medium (Tryptone Soya Agar, Oxoid Ltd. UK). Plates were incubated at 36 ± 1 °C for 24 h. After this time, the visible colonies were counted, and for convenience, the results were expressed as log CFU/mL. The experiment was conducted with and without access to light. The experiment was performed in duplicate.

2.7. Cell Culture

MRC-5 pd19 cells were cultured under standard conditions, at 37 °C, in an atmosphere enriched with 5% CO2, saturated with a water vapor incubator (Binder, Tuttlingen, Germany). The basic culture medium was Dulbecco’s Modified Eagle’s Medium (DMEM) (Biowest, Nauille, France) supplemented with 10% fetal bovine serum (FBS) (Biowest, Nauille, France) with the addition of 2 mM L-glutamine and 5% non-essential amino acid solution. Cell culture, which reached 80–90% confluence, was passaged every 3–4 days. All experiments were carried out in sterile conditions under a biosafety cabinet with laminar airflow (Telstar, Madrid, Spain).

2.8. MTT Assay

MRC-5 pd19 cells were seeded onto 96-well flat-bottomed plates at a concentration of 10,000 cells/well. TiO2, TiO2-GA or GA was suspended/dissolved in the completed culture medium at the final concentrations of 0.01%, 0.10% and 1.00% at the final volumes of 200 µL per well. After 24 h, each of the reagents was added to the cells. Control cells were not treated with synthesized reagents; they were incubated with completed cell culture medium. The incubation of cells with TiO2, TiO2-GA or GA lasted 24 or 48 h. Then, the medium was discarded, and the new medium containing MTT (3-(4,5-dimethylthiazol-2-yl)-2,5-diphenyltetrazolium bromide) (Affymetrix, Cleveland, OH, USA) at a final concentration of 0.5 mg/mL was added to the cell culture. Cells were incubated for 2.5 h in cell culture conditions. Next, the medium was removed, and 100 µL of DMSO (Thermo Scientific, Waltham, MA, USA) was added to dissolve the formed formazan crystals. The absorbance was read with a Multiskan plate reader at 570 nm, background 655 nm (Thermo Scientific, Waltham, MA, USA). The experiment was performed in triplicate.

3. Results and Discussions

3.1. Synthesis and Characterization of TiO2-GA Nanomaterial

The TiO2-GA nanomaterial was prepared using the chemical deposition method with the excess of gallic acid on TiO2 [11,28,31,32,33]. Gallic acid contains hydroxyl and carboxyl groups that can coordinate with titania’s surface hydroxyl groups.

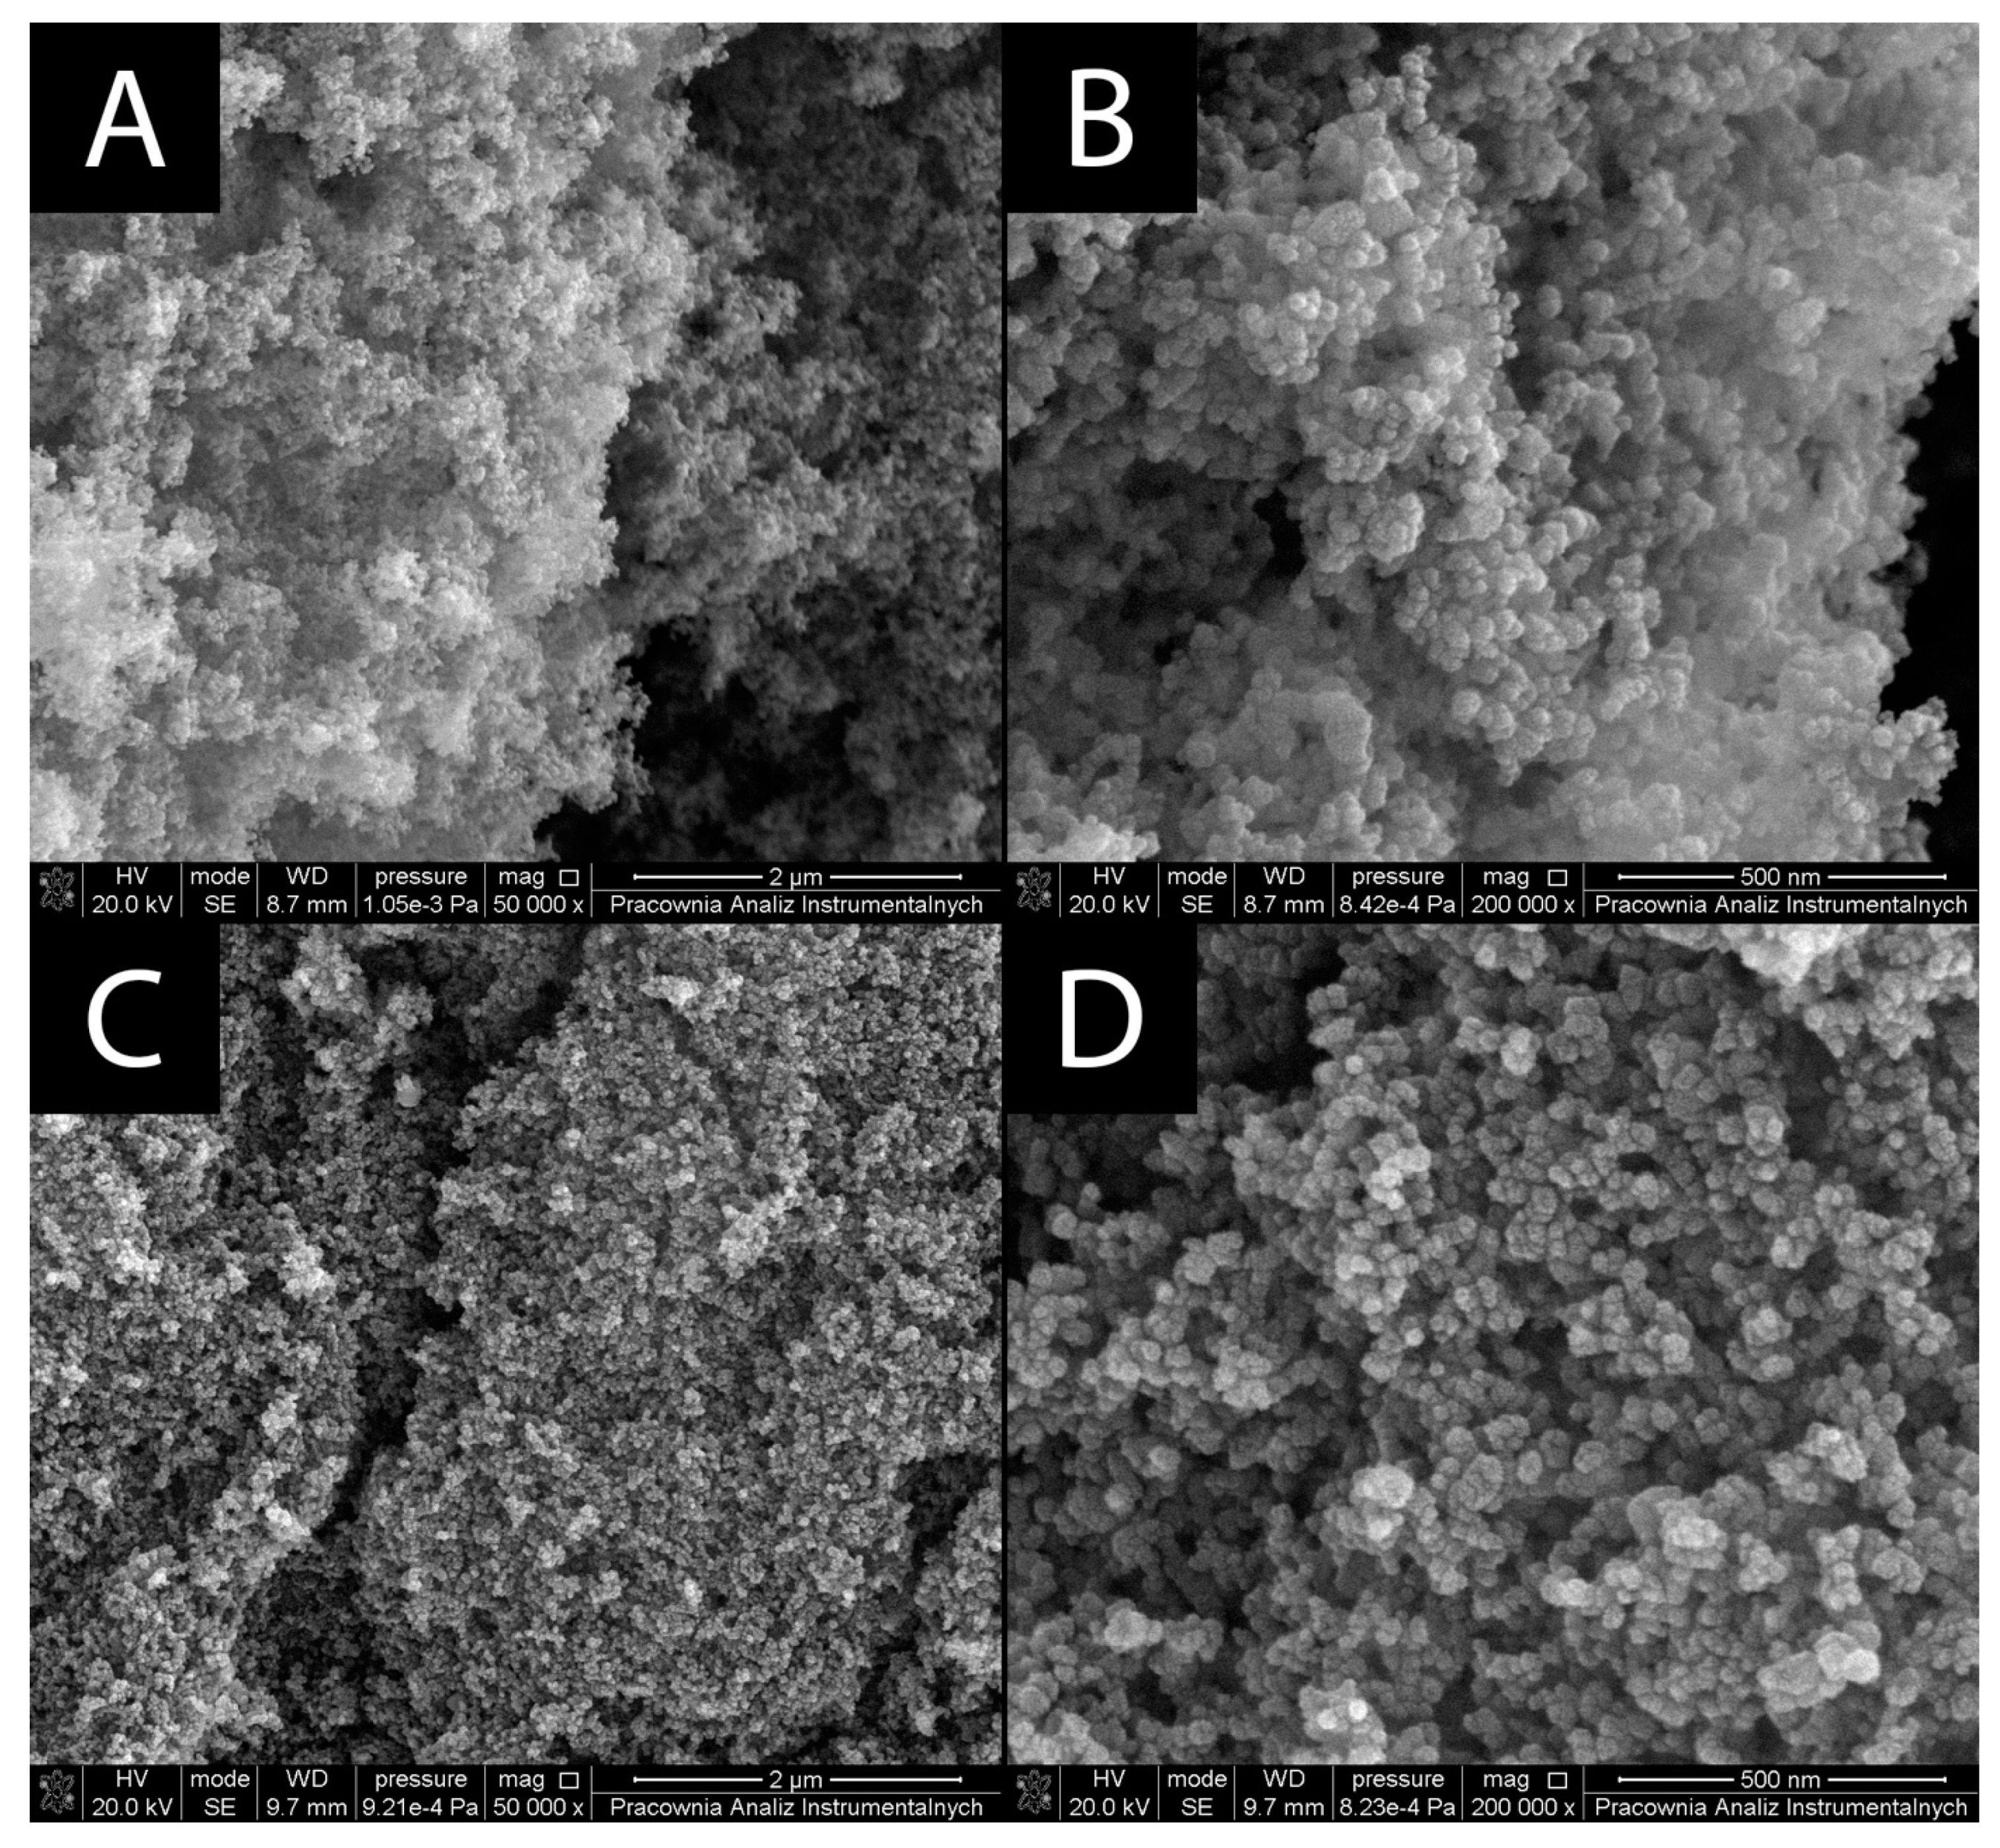
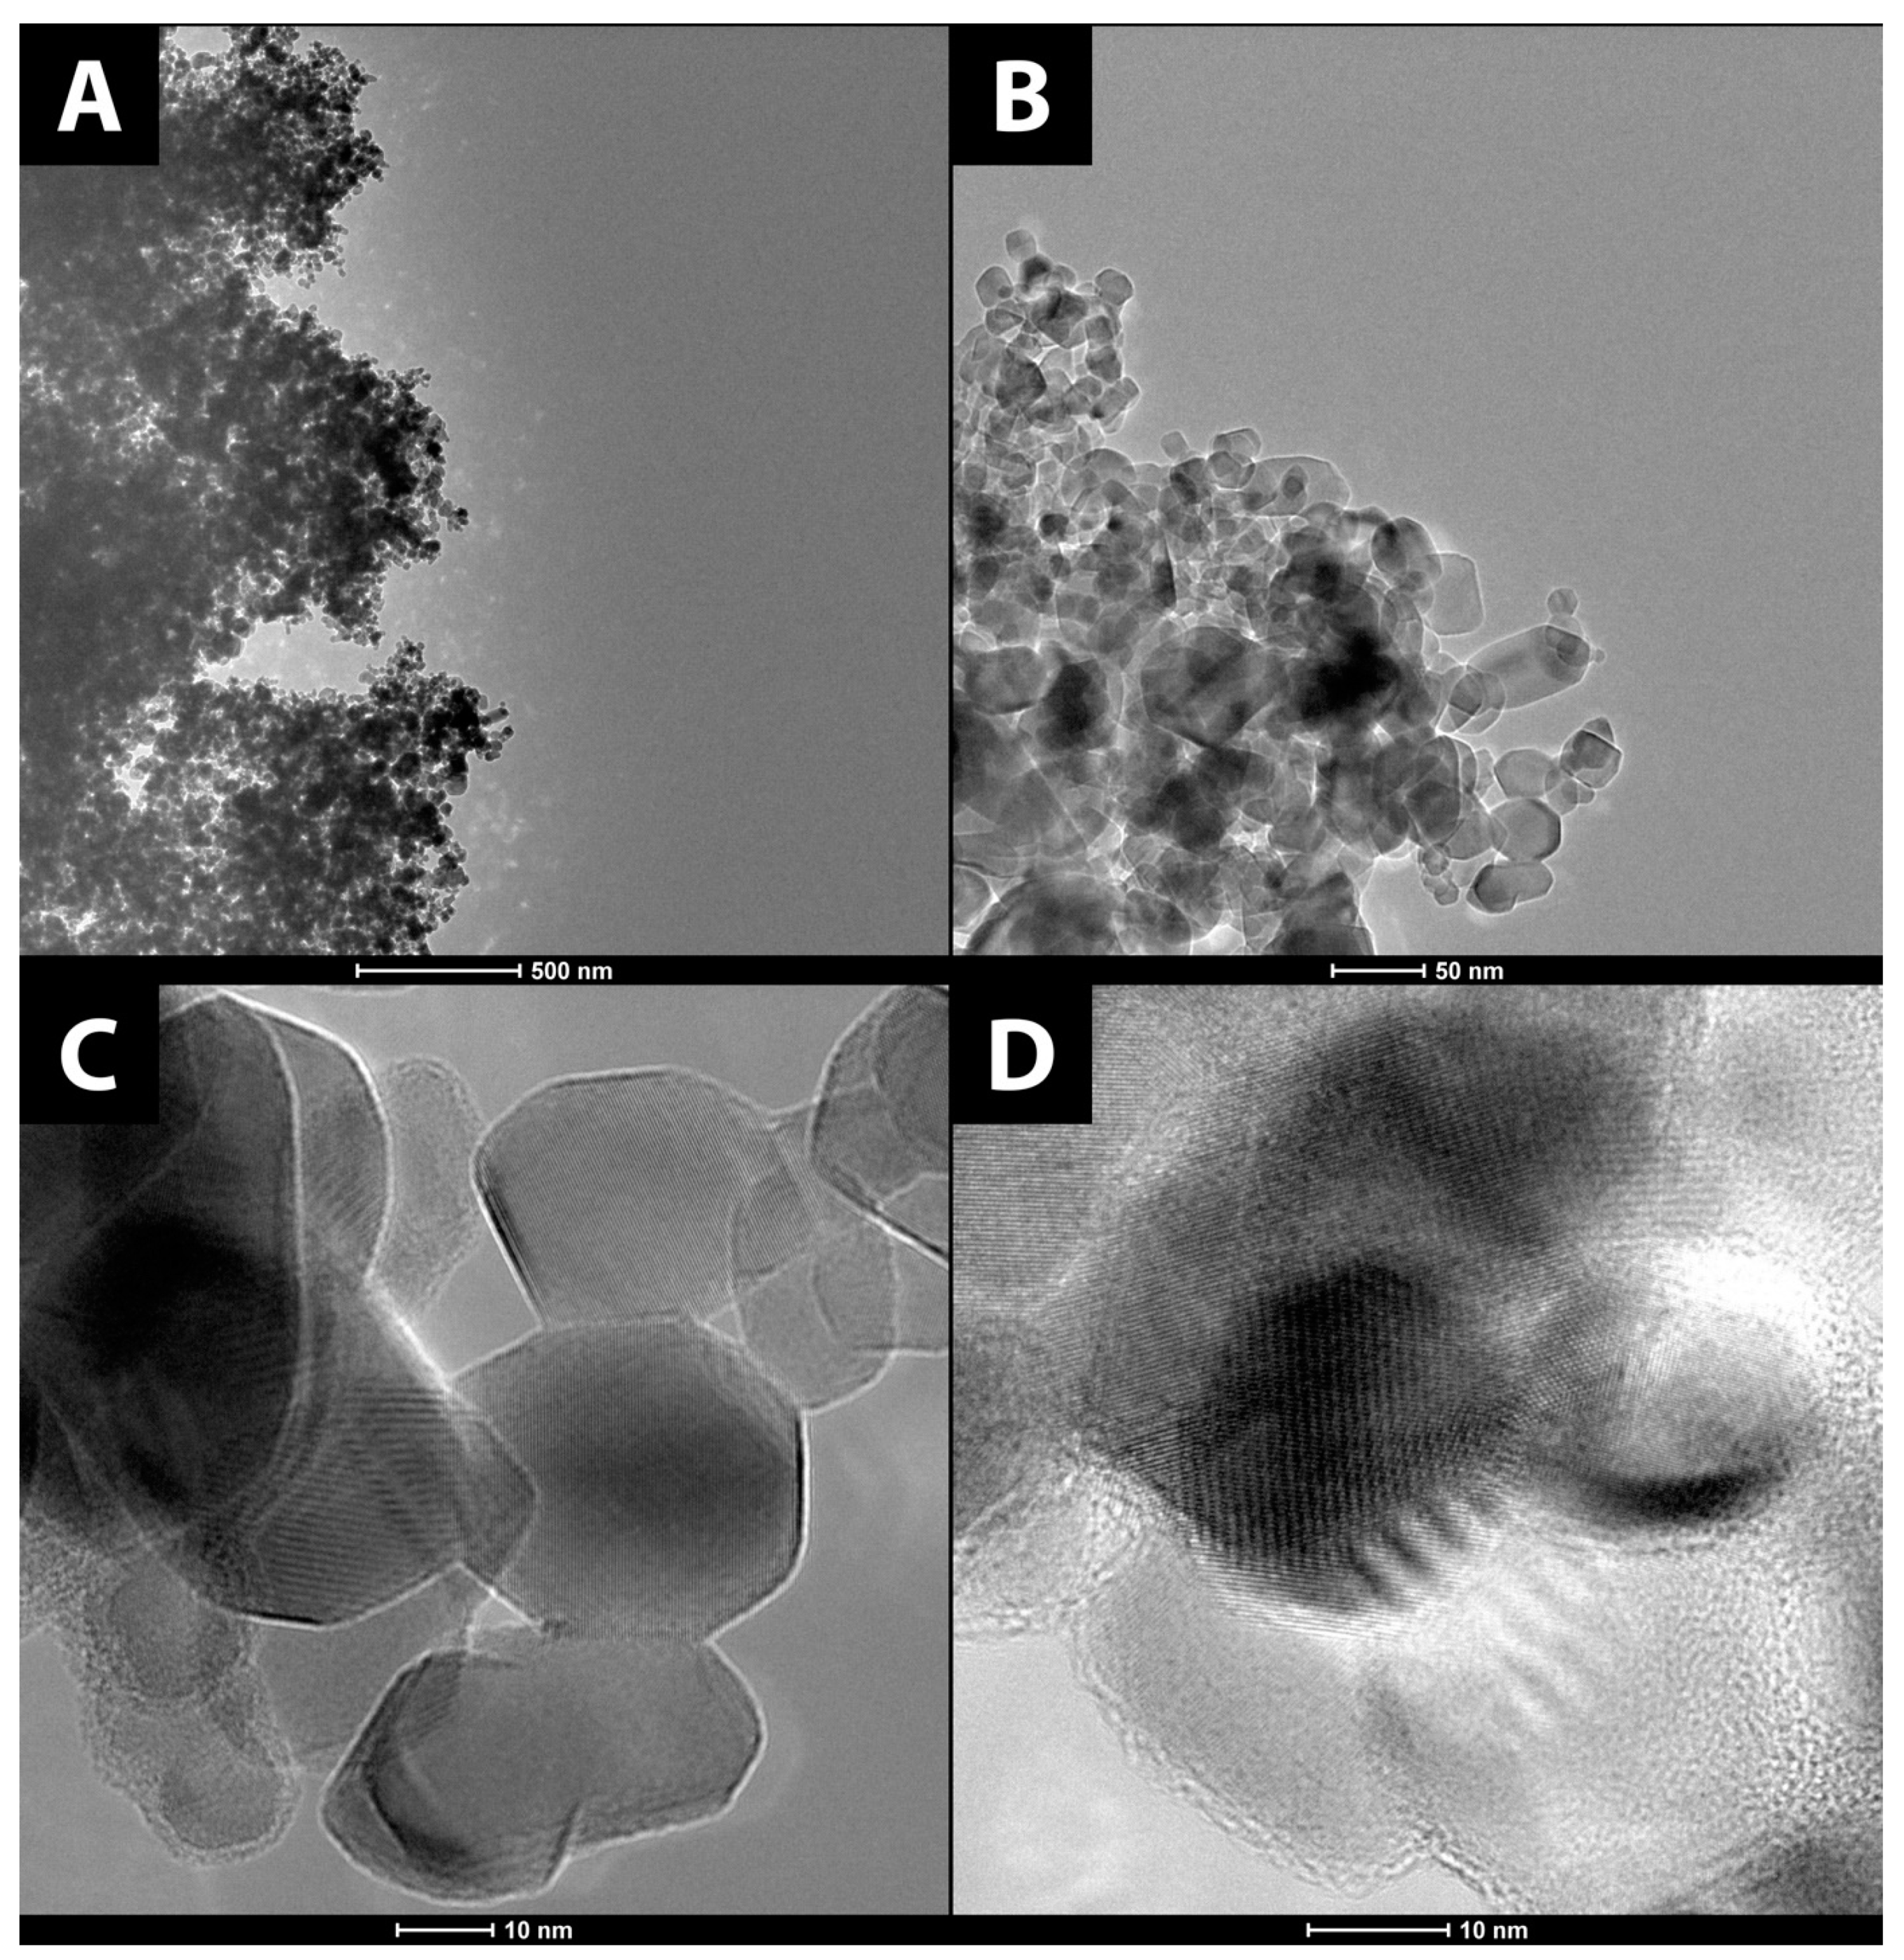
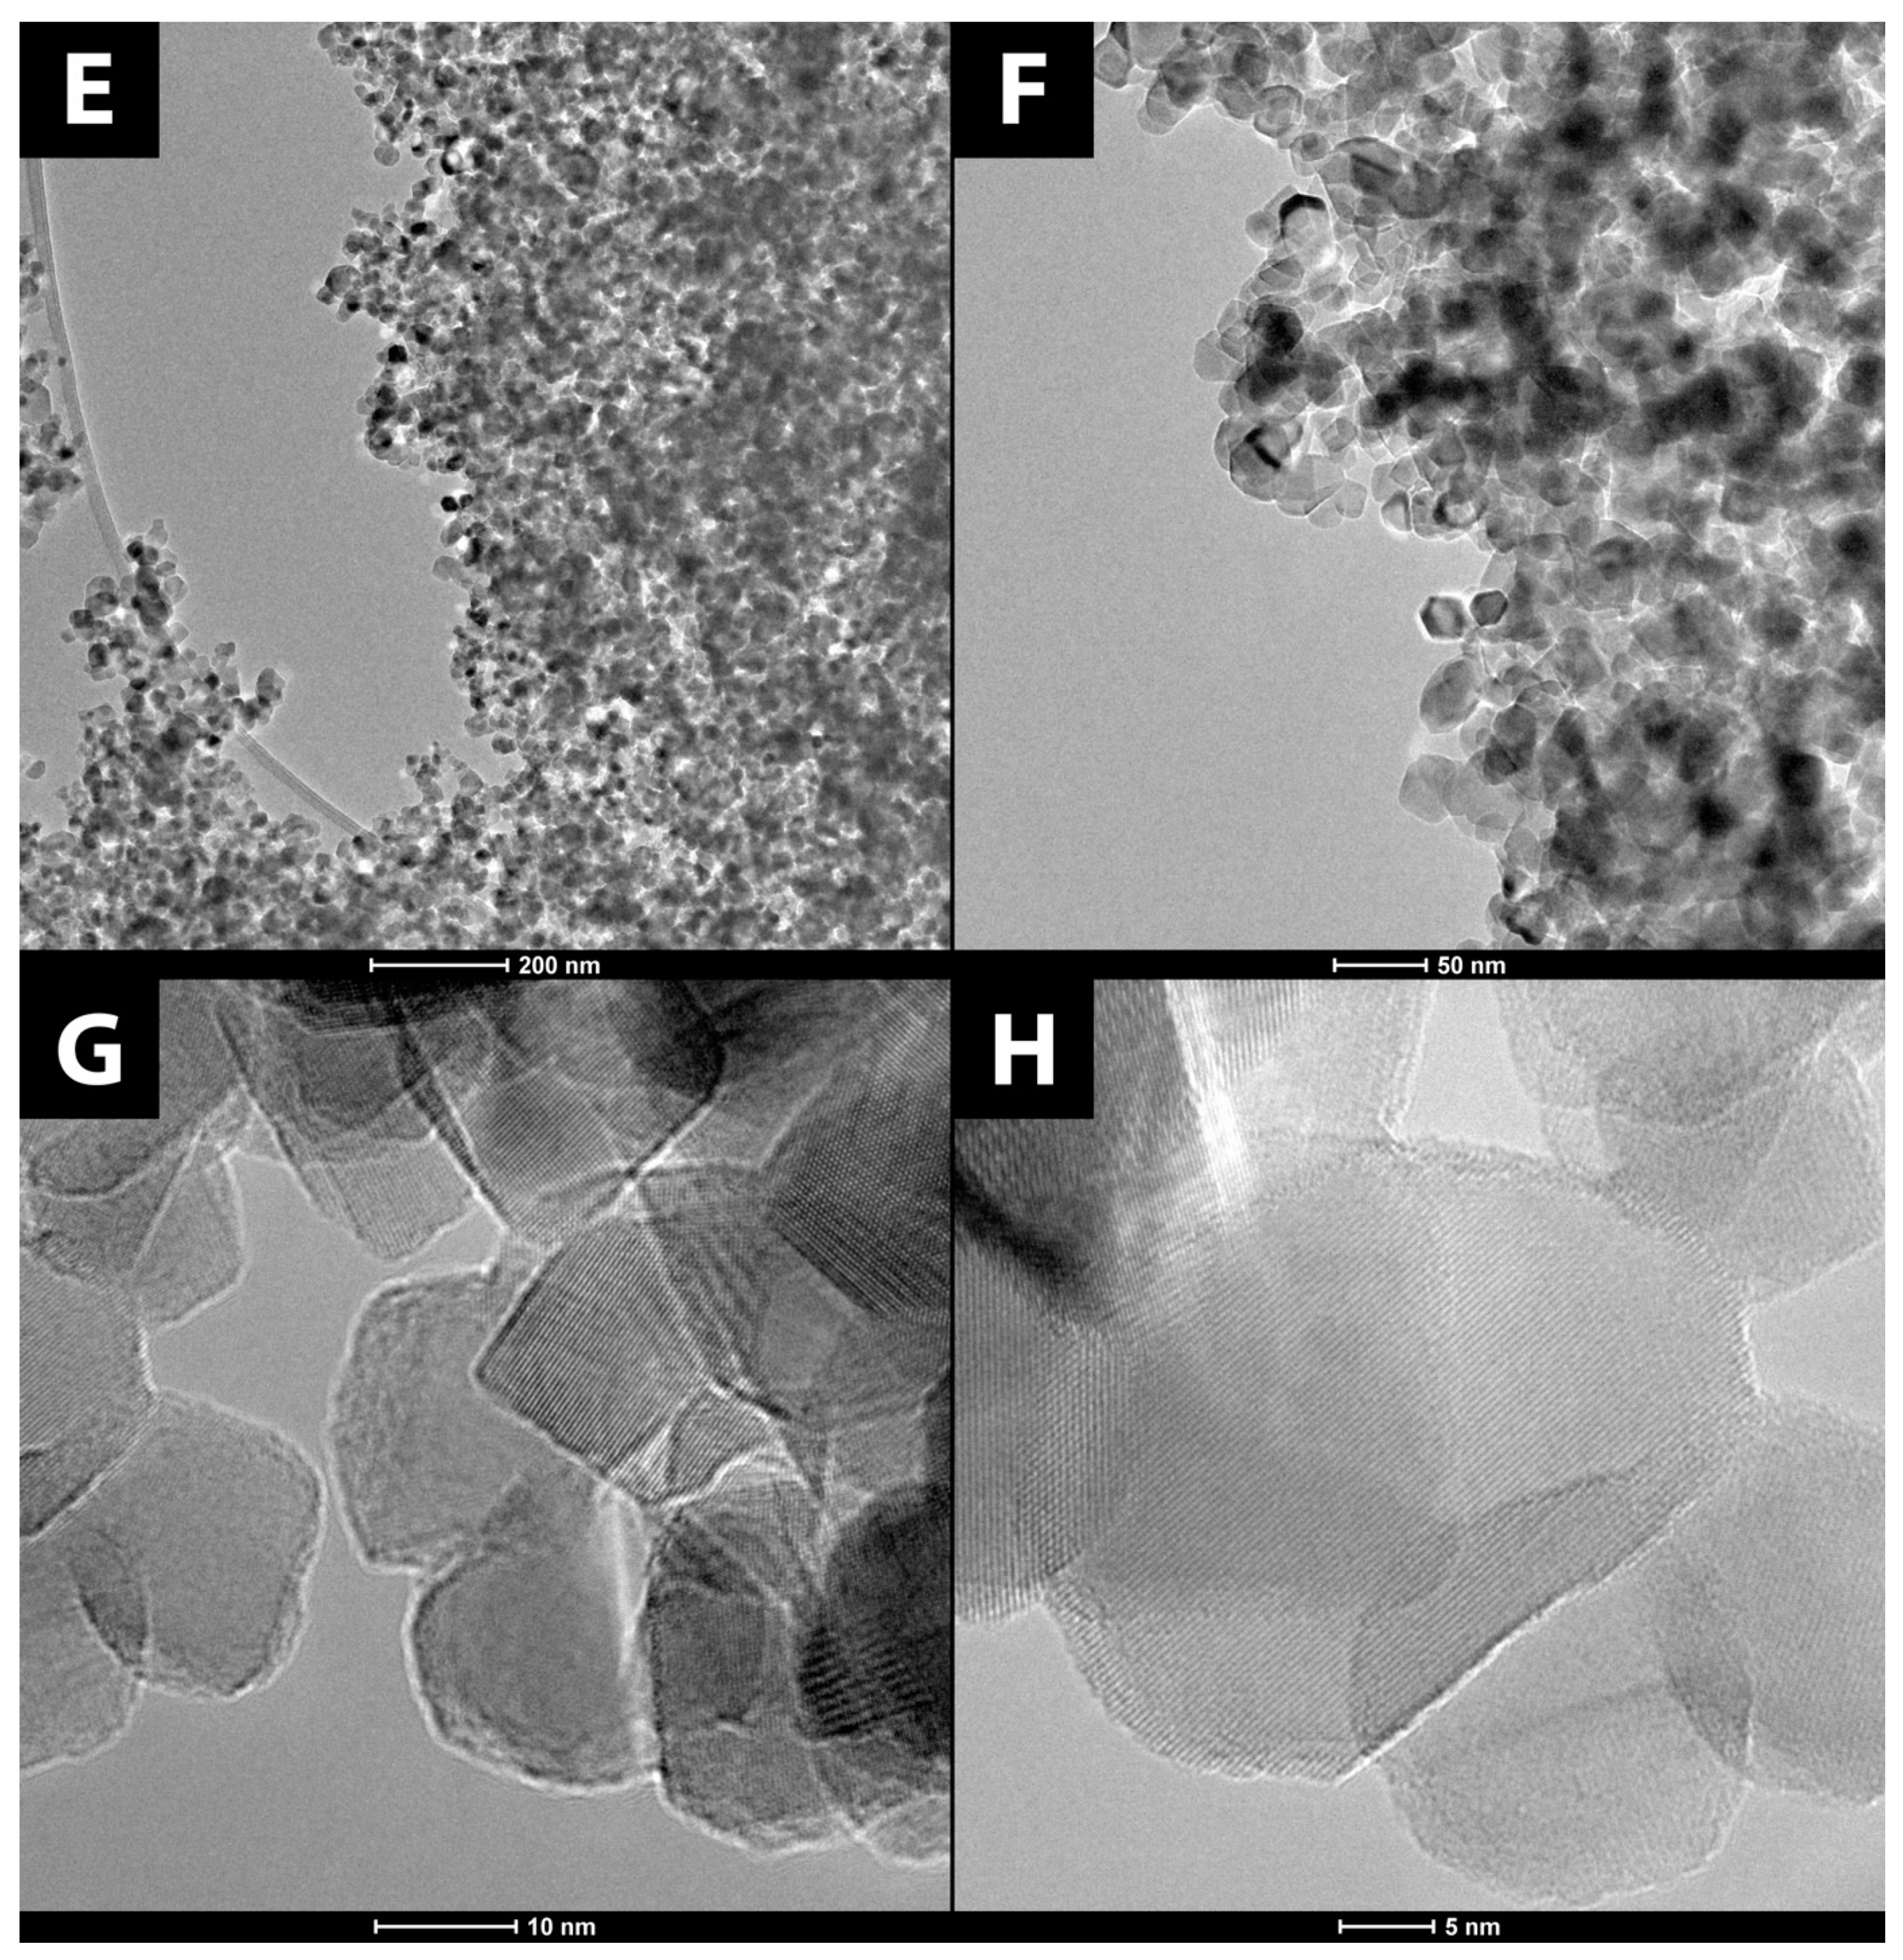
3.1.1. Surface Morphology

The surface morphology of the prepared nanomaterials was characterized by SEM (Figure 1). A very characteristic feature is a high tendency for aggregation of TiO2 and TiO2-GA. In both cases, the aggregates appear to be over 200 nm in size. The shape of the particles appears to be semispherical.
In addition to SEM, HR-TEM images were also taken (see Figure 2), confirming the previous observations regarding aggregation [34]. HR-TEM allowed for capturing images with much higher resolutions and magnifications than SEM. The micrographs reveal slight deviations from the declared grain size of 20 nm for some of the particles, possibly as a consequence of shape irregularities. The particles were found to be monodisperse. Anatase particles appear to be semispherical in shape, whereas rutile is hexagonal with some irregularities. Images taken with higher magnification reveal lattice fringes characteristic for polycrystalline material such as anatase and rutile, which were used in this study. Individual grain sizes were measured, revealing that the particles are around 20 nm in size, which falls in line with the size declared by the manufacturer (21 nm). The material was also characterized using nanoparticle tracking analysis (NTA).
Further application of the HR-TEM technique allowed for capturing selected-area diffraction (SAED) patterns shown in Figure 3. Reflections specific to anatase and rutile [35] are presented on the diffractograms and correspond with the reflections observed in the X-ray powder diffraction (XRPD) measurements.

3.1.2. Nanoparticle Tracking Analysis

Both materials, bare TiO2 and TiO2-GA, were analyzed using the NanoSight® LM10 apparatus, which allowed for determination of the hydrodynamic diameter of the particles (Table 3). The measurements were conducted in distilled water and reflected actual particle sizes in an aqueous environment. The mean size of TiO2 nanoparticles equals 255.7 nm with a standard deviation (SD) of 74.5 nm. Functionalization of TiO2 with gallic acid seems to reduce the tendency to form aggregates, as the mean size for TiO2-GA nanoparticles was notably lower (218.0 nm, SD 74.9 nm). Polydispersity indices (PDI) calculated for both materials were lower than 0.2, which confirms their monodisperse nature [36].

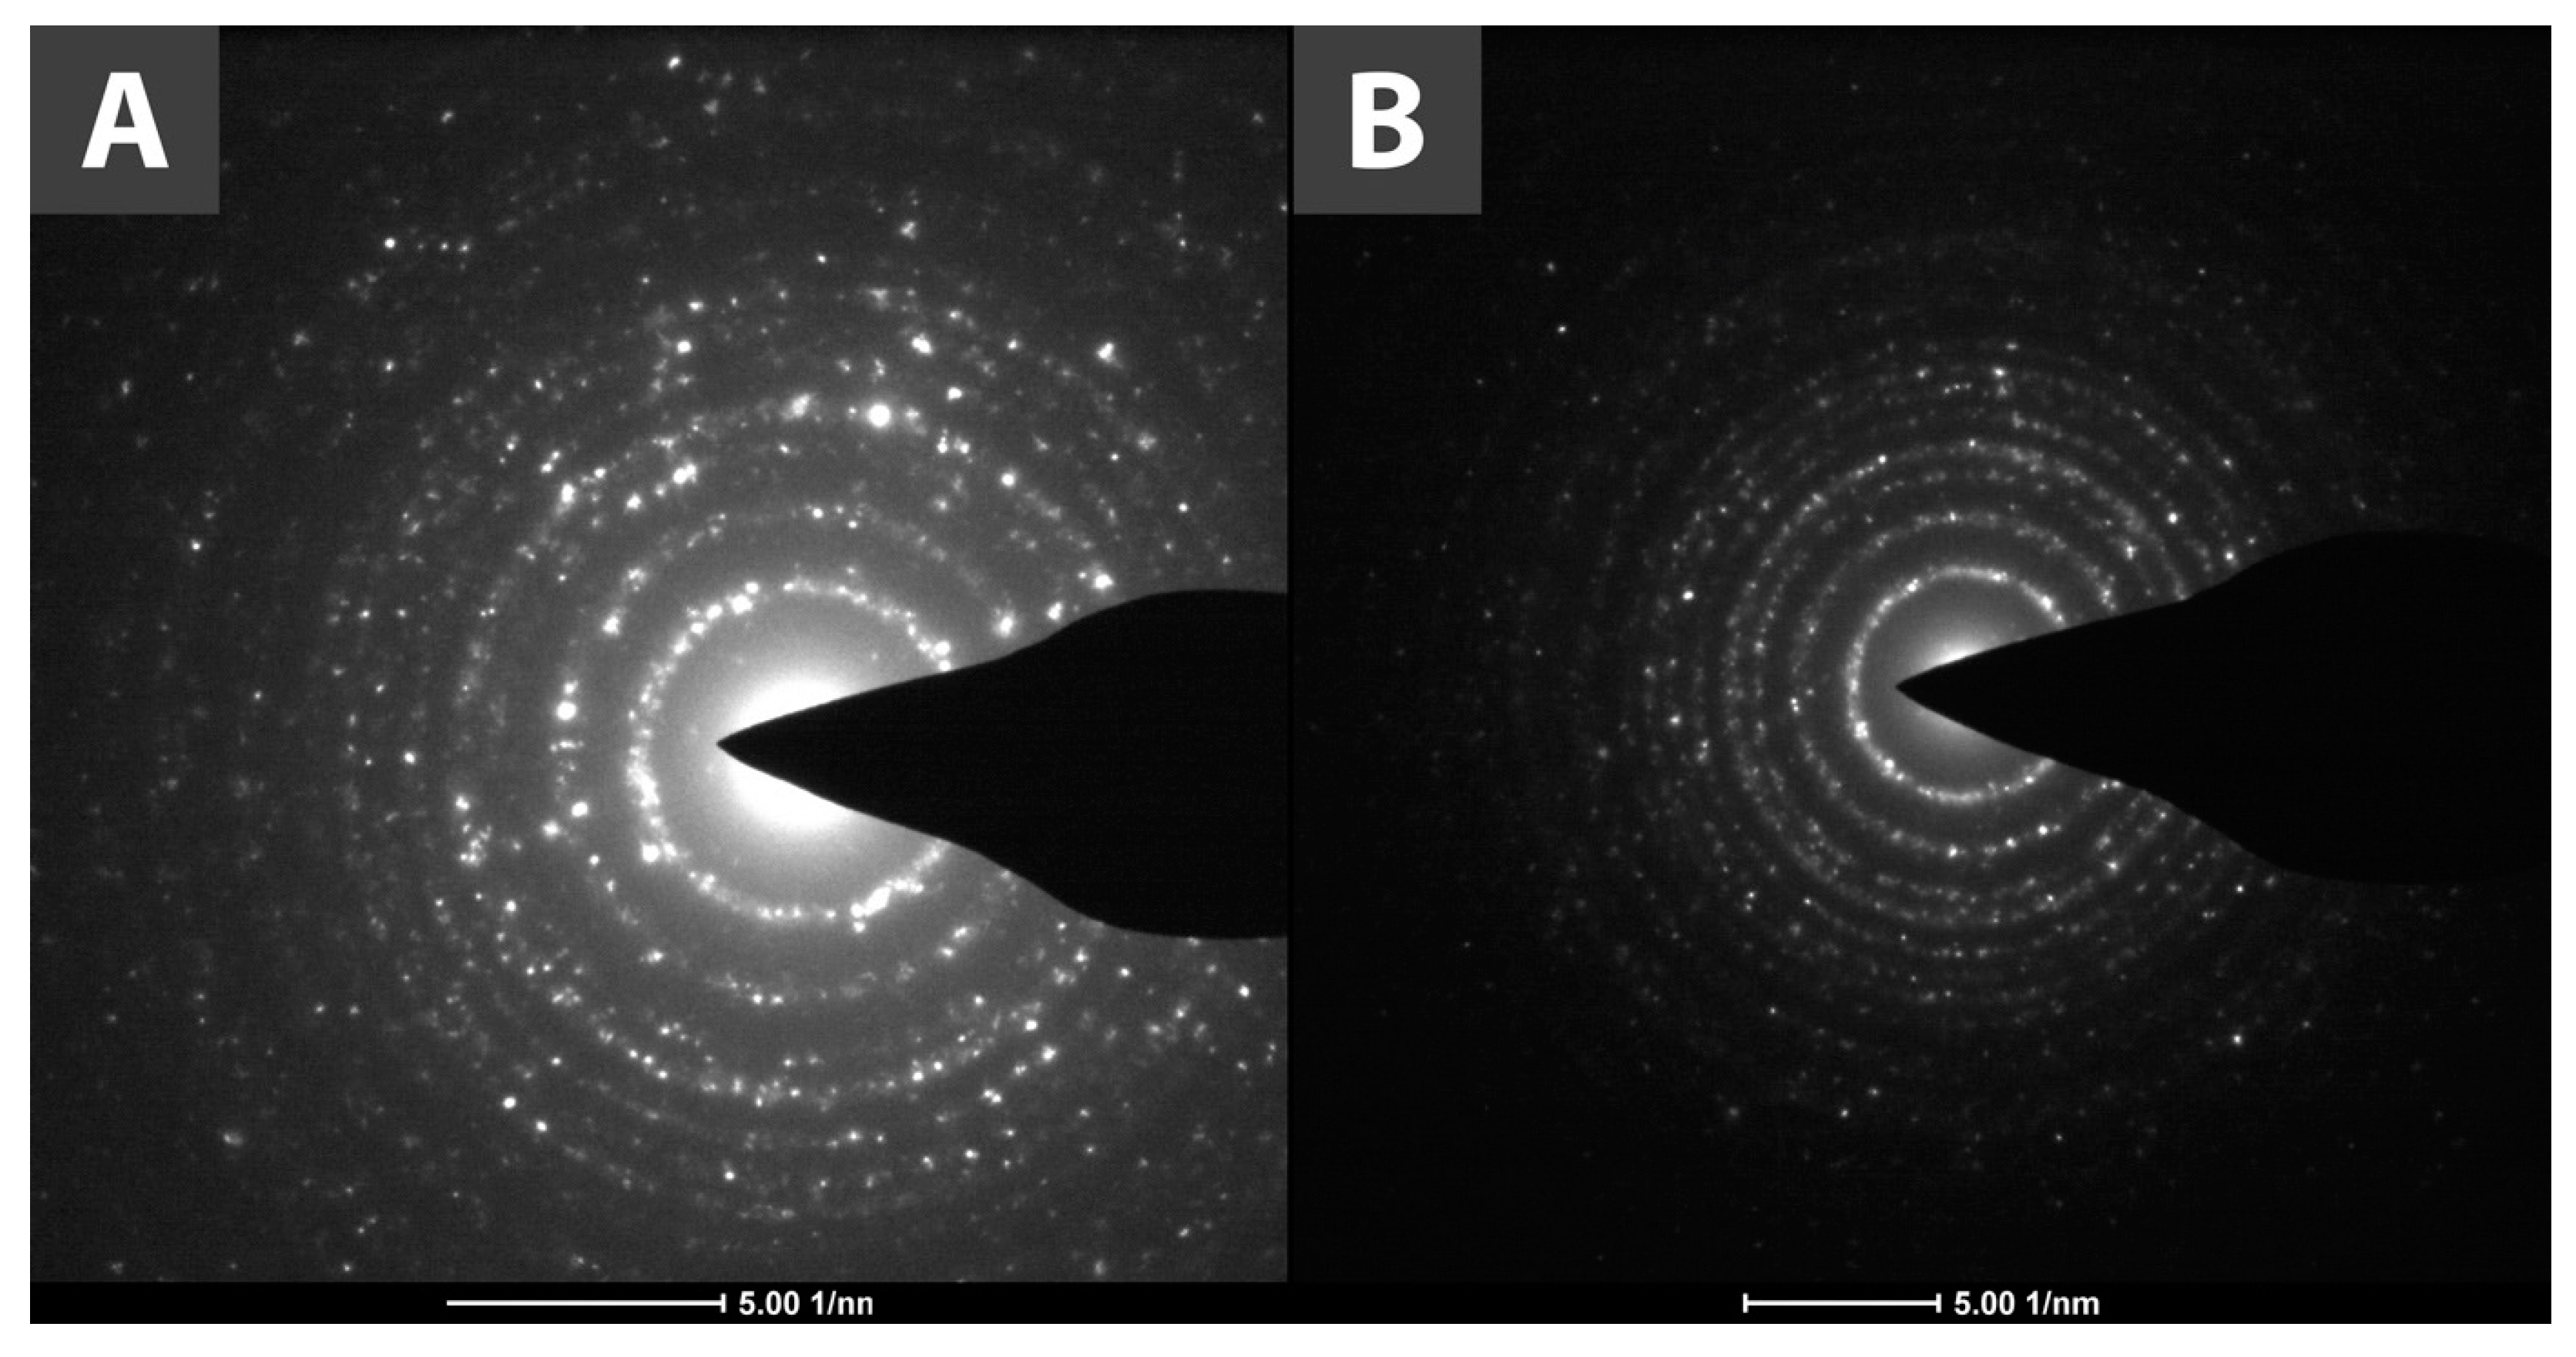
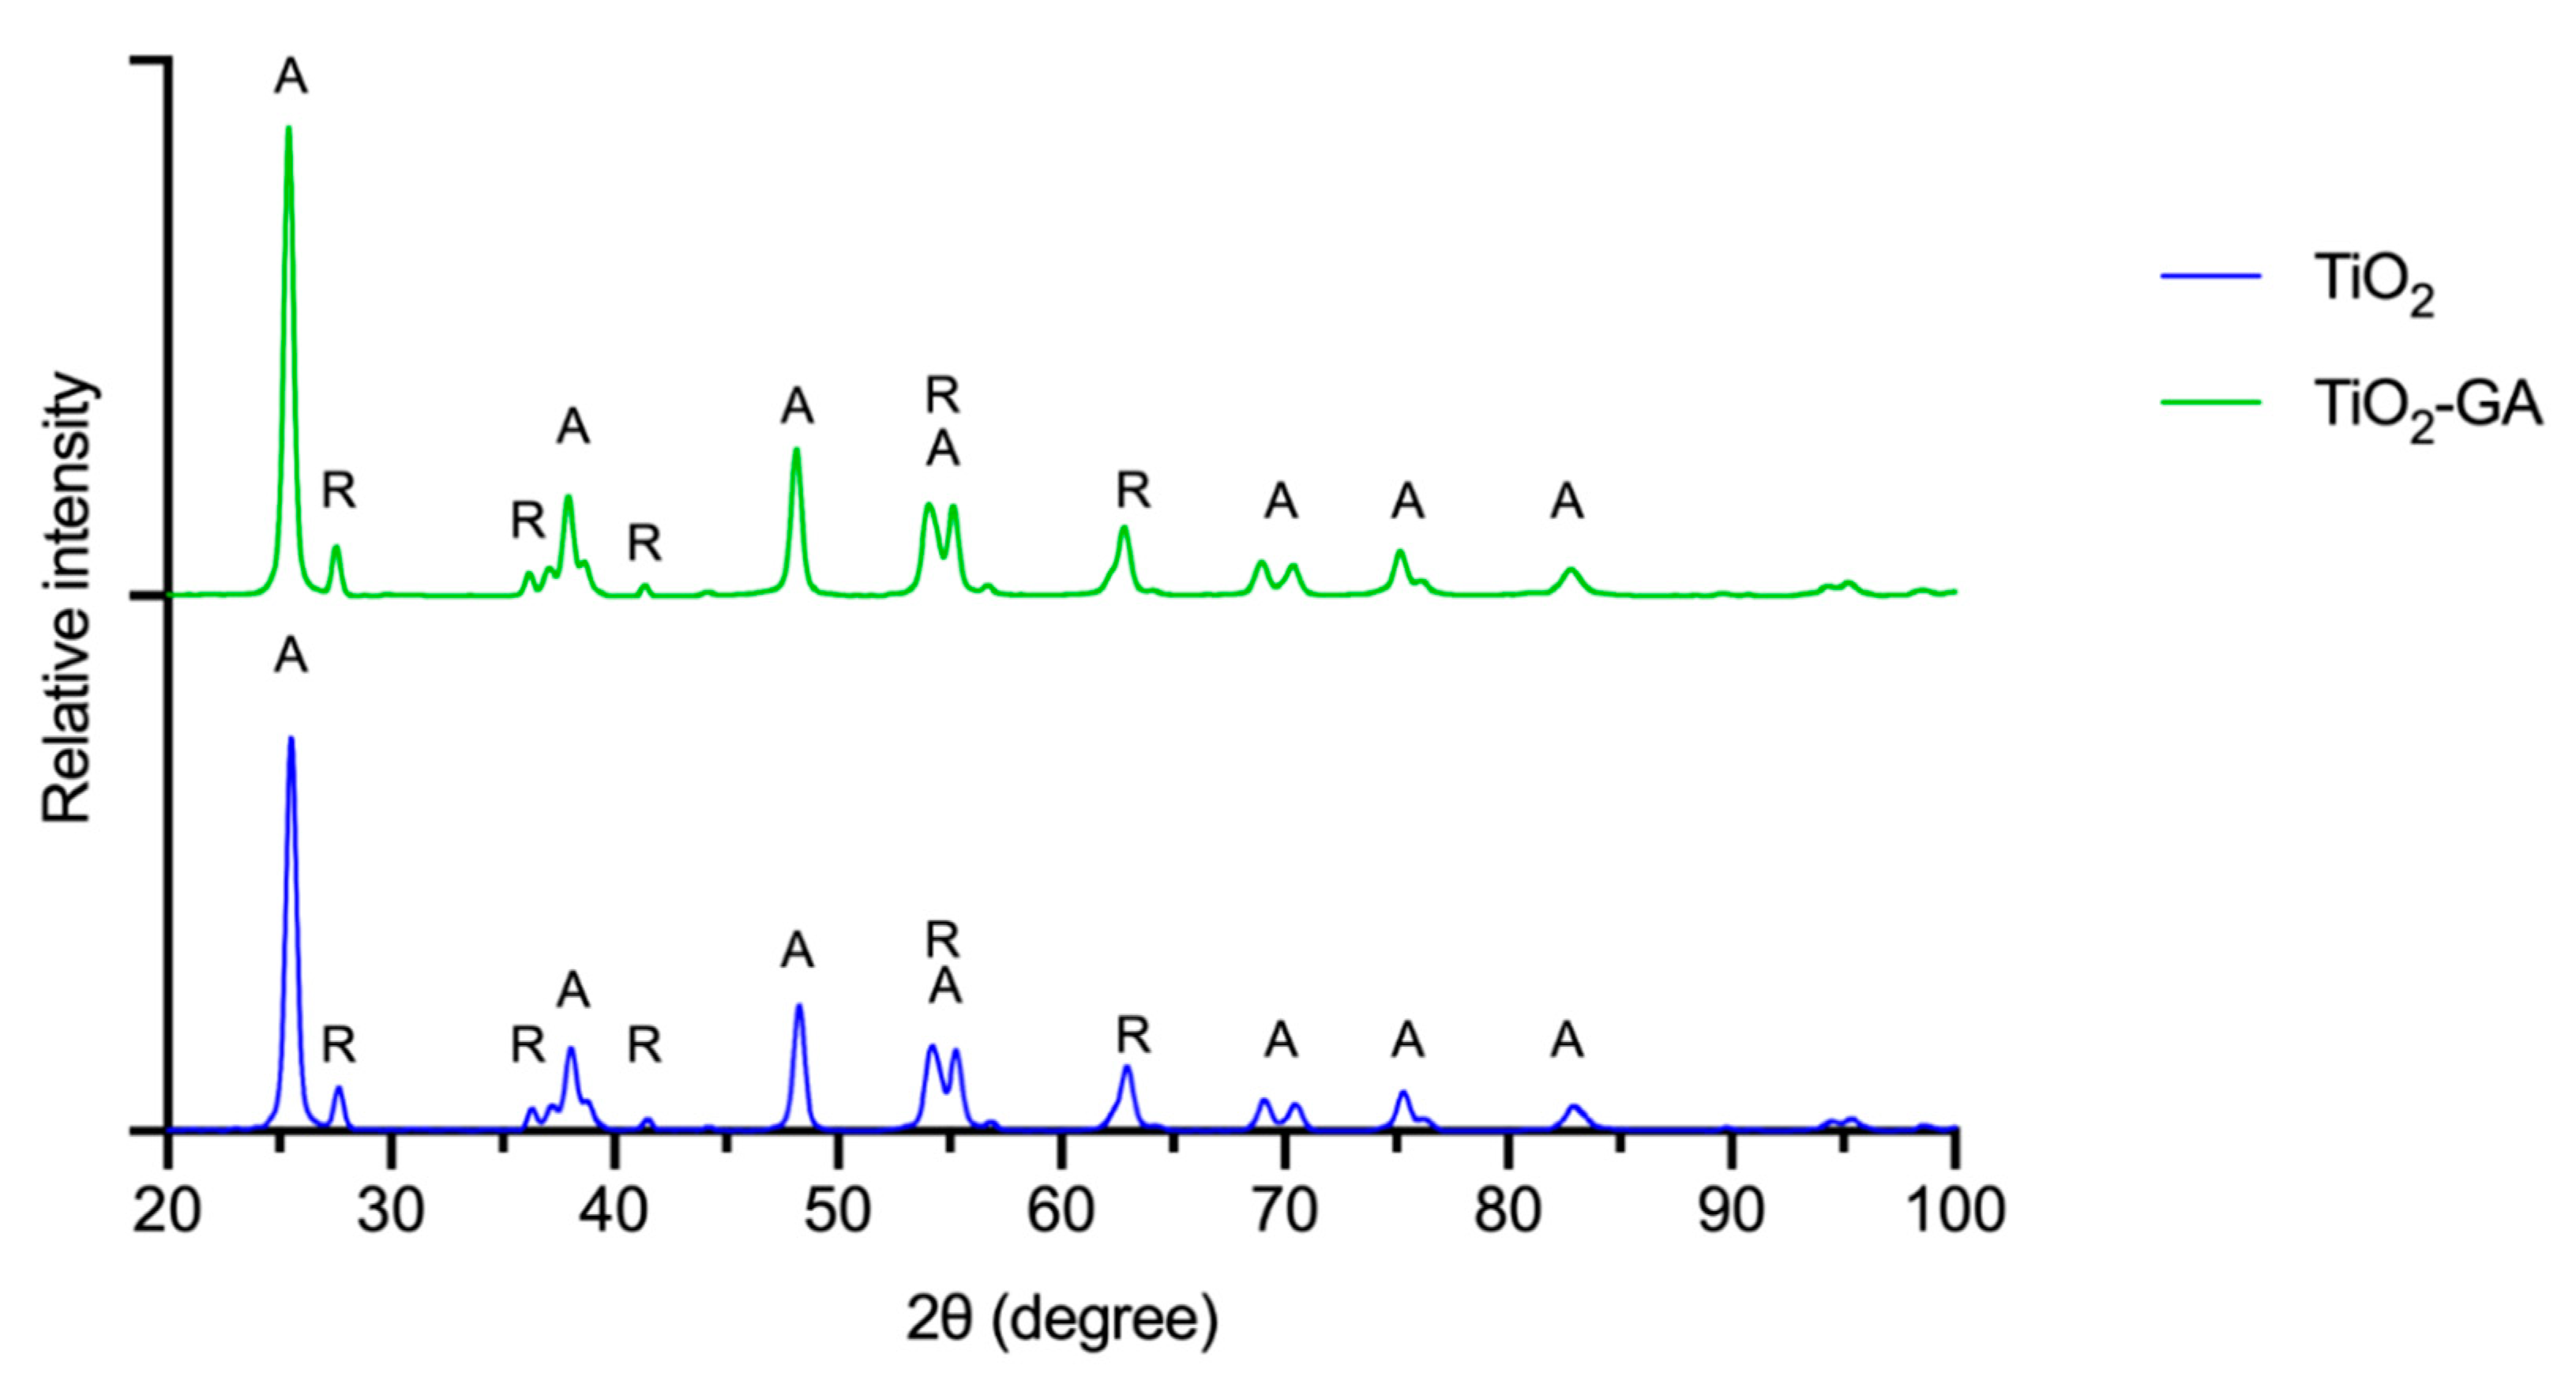
3.1.3. XRPD Analysis

The crystallinity of the materials was analyzed with XRPD (Figure 4). The obtained XRPD patterns show reflections characteristic for anatase (JCPDS card no. 21-1272) at 25.53, 38.06, 48.27, 54.22, 55.29, 69.11, 70.48, 75.31 and 82.93°, with additional reflections at 27.67, 36.31, 41.47, 54.22 and 62.94° coming from the admixture of rutile (JCPDS card no. 21-1276) present in bare TiO2 [37]. No reflections for GA were observed. As such, it can be concluded that the functionalization of titania with GA had no impact on the crystalline structure of TiO2 within the hybrid material.

3.1.4. Infrared Spectroscopy

In the ATR-FTIR spectrum of GA, characteristic bands for O-H and C=O groups were noted (3500 and 1800–1600 cm−1). Bare TiO2 and TiO2-GA were also subjected to ATR-FTIR spectroscopy measurements (Figure 5). Both materials revealed bands specific to Ti-O bond vibrational mode at 643.74 cm−1 and a band at 416.99 cm−1 from Ti-O-Ti bridging stretching mode [38]. At 1630 cm−1, a band coming from O-H bending vibrations of chemisorbed water was noted. The broadband in the range between 3500–3000 cm−1 comes from O-H stretching vibrations, and this band is more pronounced in TiO2-GA due to the abundance of hydroxyl groups within the hybrid material. Additionally, in the spectrum of TiO2-GA, two new bands at 3836.14 and 3699.18 cm−1 were noted, which are not present in TiO2, and were assigned to hydroxyl groups O-H stretching vibrations of GA. For TiO2-GA, the bands noted within the 1600–1400 cm−1 range belong to the aromatic ring of GA, whereas the bands appearing within the 1800–1600 cm−1 and 1400–1000 cm−1 ranges result from the hydroxyl and carboxyl groups’ presence.

3.1.5. Raman Spectroscopy

Both materials, bare TiO2 and TiO2-GA, were analyzed with Raman spectroscopy (Figure 6). An analysis of the spectra revealed the presence of signals characteristic for anatase and rutile TiO2 at the following wavelengths: 144.0, 396.18, 516.56 and 638.07 cm−1 [39]. In the case of the TiO2-GA spectrum, additional bands specific for GA were also noted at 1364.9, 1502.1 and 1609 cm−1 [40]. The TiO2-GA spectrum showed a notably higher baseline, which could result from the sample heating up.

3.1.6. Thermogravimetric Analysis

Thermal analysis of TiO2 (Table 4) revealed 1.04% mass change within the range of 29–222 °C. The first stage was associated with the evaporation of surface water, as well as condensation and evaporation of adsorbed hydroxyl groups [41]. Interestingly, the second stage, which began at 389 °C and continued up to the end temperature of 800 °C, showed 0.89% mass gain. As the analysis was performed in the air atmosphere, this effect was associated with oxidation reactions occurring at the material surface at higher temperatures. This effect was observed for bare TiO2 and TiO2-GA.
The first stage of GA thermal analysis started at 73 °C and lasted until 100 °C, which is associated with the evaporation of adsorbed water molecules, resulting in a mass loss of 3.02%. The second stage fell into the range of 248–301 °C, where thermal degradation of GA itself begins and, in this stage, 61.45% of the mass was lost. The third stage occurred in the range of 301–357 °C, resulting in a mass deficit of 12.75%. The last, fourth, stage occurred in the range of 357–597 °C and resulted in 22.23% mass loss. GA was entirely degraded within the tested temperature range.
Similar to TiO2, for TiO2-GA, the first stage was attributed to the desorption of surface water and hydroxyl groups within the range of 29–205 °C and resulted in 0.92% mass loss. The next stage was associated with the degradation of GA and appeared in the range of 205–398 °C, resulting in a total 2.15% mass deficit in this stage. The third stage was observed from 457 °C to 800 °C, where 0.51% mass gain was noted.

3.2. Antioxidant Activity

The antioxidant properties of the tested nanomaterial were determined using the DPPH assay [29]. During this assay, a change in the color of the methanolic DPPH (2,2-diphenyl-1-picrylhydrazyl) solution from deep violet to pale yellow is observed in the presence of an antioxidant. This occurs due to the action of the antioxidant agent, which causes the transformation of the stable DPPH violet radical into a pale yellow non-radical derivative (see Figure 7). To evaluate the antioxidant properties of TiO2, TiO2-GA and GA, serial dilutions of the materials were prepared, and the IC50 value was calculated. To put the obtained data in context, three common antioxidants were also tested: ascorbic acid (vitamin C), (–)-epigallocatechin 3-O-gallate (EGCG) and curcumin. The summarized results of the DPPH test are presented in Table 5. On the one hand, it was found that pristine TiO2 nanoparticles do not exert any antioxidant activity. On the other hand, GA is a strong antioxidant (IC50 equals 0.910 ± 0.002 mg/L). By combining both materials in TiO2-GA, the resulting composite retains most of the antioxidant properties of GA with IC50 at the level of 13.5 ± 0.3 mg/L. It is worth noting that the antioxidant properties of the nanomaterial do not differ a lot from those of reference antioxidants such as vitamin C, EGCG or curcumin.

3.3. Antimicrobial Activity

3.3.1. Microtox Acute Toxicity Evaluation

The Microtox acute toxicity test is routinely used to determine the ecotoxicity of solutions. In the test, the effect is related to the bioluminescence of the Aliivibrio fischeri bacteria, which emit light at 490 nm. The decrease in the bioluminescence caused by any substance or solution reflects the metabolism, and thus the cell viability [42]. However, as a biological factor used in this test, A. fischeri represents a Gram-negative bacteria, which could be considered in the preliminary evaluation of the antimicrobial properties of tested materials, compounds or plant extracts [43,44,45]. Due to the specificity of the test, the results may be biased, as the cell walls of the used bacteria are broken for more rapid screening. Therefore, the internalization of the compounds into the bacterial cells is omitted as compared to normal bacterial cells. Thus, the obtained results may not fully reflect the antibacterial activity, as the effect exerted on the intracellular targets is independent of the particle size.
The suspensions of TiO2-GA and TiO2 and solutions of GA were subjected to Microtox evaluation, the results of which are summarized in Figure 8. It was found that the functionalized titania exerted the same effect as pristine TiO2 nanoparticles. This was probably the result of the immobilization of GA on the surface of TiO2, which did not allow GA for easy interaction with the cellular components of the bacteria. Gallic acid alone was highly active, even in much lower concentrations. The “toxic” concentration (20% cell viability decrease, EC20) was calculated at 0.3347% for TiO2-GA and 0.0026% for GA alone, which indicates that the functionalized material is almost 131 times less active after 5 min exposure.

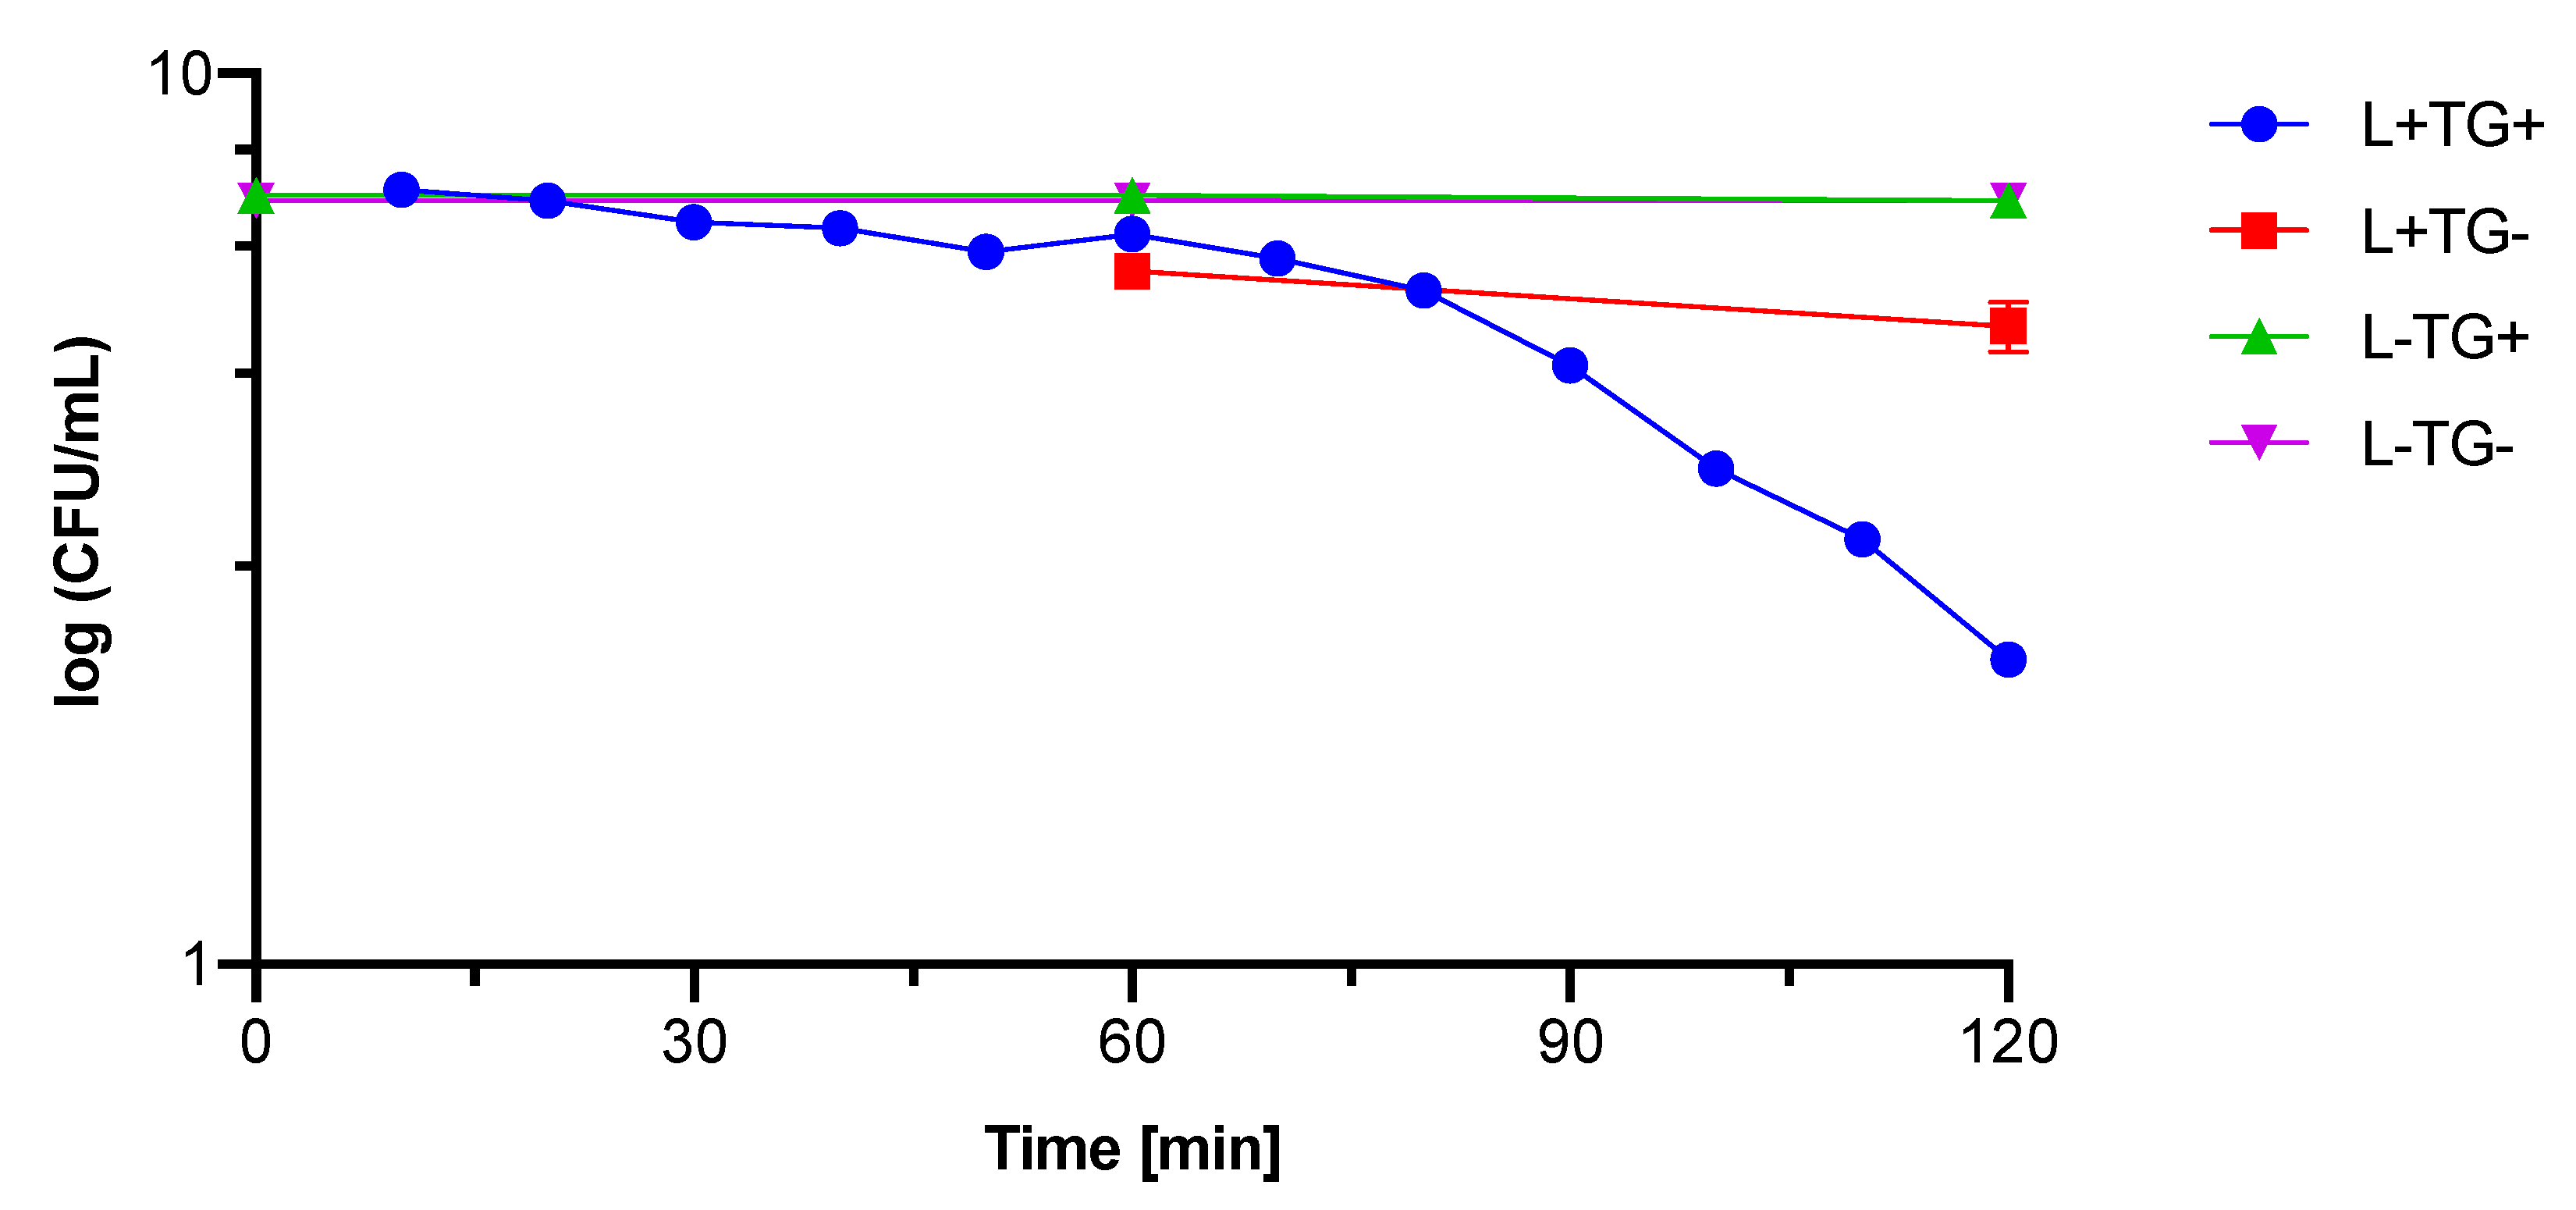
3.3.2. Photocytotoxicity against Bacteria and Fungi

The first experiment was performed to determine the antimicrobial activity (MIC and MBC values) of materials against Gram-positive bacteria S. aureus, Gram-negative bacteria E. coli and fungus C. albicans. According to the obtained results, neither TiO2 nor TiO2-GA revealed significant antimicrobial activity in the tested range of concentrations (data not shown). In the second experiment, the photocytoxicity of materials on the above-indicated microorganisms was assessed in two different irradiation conditions at 365 nm and 425 nm (Table 6). In this experiment, no phototoxicity was noted towards C. albicans. In the case of E. coli and S. aureus, a reduction in viable cells was observed. The maximum reduction in E. coli growth was achieved using TiO2-GA and lamp irradiation at 425 nm, which allowed for reaching approx. 4.1 log CFU/mL. At the same time, it was observed that light alone reduced the number of viable bacteria by about 1.2 log CFU/mL. At 425 nm, the sample containing TiO2 showed much less activity, equal to about 2.1 log CFU/mL. Interestingly, the reduction in survival of the E. coli strain after exposure to 365 nm light generated the opposite results. Namely, the sample with bare TiO2 reduced the number of viable bacteria by about 1.3 log CFU/mL, and the sample with TiO2-GA did not reveal any effect.
In the case of S. aureus, the results turned out to be more expressive. The reduction in the viable bacteria exposed to TiO2-GA and light at 425 nm was approximately 4.2 log CFU/mL. The effect of TiO2 alone was not significant after exposition to the light of this length. At the wavelength of 365 nm, the observed reduction in S. aureus survival after incubation with TiO2 was about 3.1 log CFU/mL, whereas TiO2-GA did not show any effect.
As the best effect was observed in the case of S. aureus, the following experiment aiming to determine the time necessary for the above-described phototoxic effect to take place was designed. The selected experimental parameters were: S. aureus, TiO2-GA 1 mg/mL, 425 nm light.
In the third experiment, the survival of S. aureus was assessed in presence of TiO2-GA (1 mg/mL) at 425 nm light (Figure 9). The exposure of S. aureus to those conditions resulted in the reduction of its survival by 5 log CFU/mL after 120 min of irradiation. The light alone reduced the viability of bacteria by 2 log CFU/mL after 120 min of irradiation. No dark toxicity—the toxicity of the nanomaterial itself, without irradiation—was observed during the experiment. The synergism of the combined action of light and nanomaterial started after 80 min of irradiation. The added value of irradiation with the simultaneous presence of the photosensitizer was estimated at 3 log CFU/mL.

3.4. Toxicity Assessment

The MTT viability test was performed to investigate the toxicity effect of TiO2-GA on human fibroblast cells (MRC-5 pd 19). The metabolic activity of MRC-5 pd 19 was analyzed as a percentage of cell viability, and TiO2-GA concentrations in the range of 0.01–1% at two time points, 24 and 48 h, were used. In the studied concentrations, gallic acid revealed significant cytotoxicity against human fibroblasts with IC50 values below 0.01% after 24 h of incubation. The level of metabolic activity decreased with the increasing concentration of TiO2-GA, which is presented in Figure 10. It is worth noting that the cytotoxicities of TiO2 and TiO2-GA are comparable.
Although titanium(IV) oxide is considered a safe food additive (E171) and is used in numerous preparations for medical and cosmetic applications, it is also necessary to decide whether its nano form is as safe for medical applications [18,46]. Potential TiO2 toxicity is known to induce the production of reactive oxygen species (ROS), thus resulting in oxidative stress through the cells [47] or apoptosis [48]. TiO2 has been widely studied on various cell lines, such as rat and human glial cells [48] or human osteoblast cell-like cells [49]. Some research groups [50] have analyzed the biocompatibility of TiO2 using its concentrations, such as those found in physiological body fluids, and investigated the effect of cell toxicity. It is difficult to form a straightforward conclusion about TiO2 biological effects because tested models differ greatly, and the concentrations of TiO2 were differentiated. Apart from biological issues, technical ones should be considered, as TiO2 is a hydrophobic substance. Therefore, it is challenging to study the reagent, which is insoluble in culture media.
As the herein presented hybrid material consists of TiO2 and GA, some methods need to be optimized in future experiments. A promising direction for further research will be such functionalization of TiO2, which will increase the stability of the formed suspensions and reduce the aggregation of nanoparticles. Defining the “biocompatibility index” [51] to assess the suitability of TiO2-GA as an antiseptic agent was also planned. Unfortunately, fibroblast cells were detaching from the wall of the bottle after 40 min of irradiation in conditions corresponding to those used for bacteria (2 h of irradiation with a 425 nm lamp), which made taking measurements impossible. The described effect on fibroblasts is most likely caused by oxidative stress [52,53]. In future studies, it would be advantageous to modify the material further to strengthen the antibacterial photocytotoxic effect after irradiation with visible light. This can probably be achieved by using other compounds for surface functionalization or thanks to doping of the titanium oxide itself. Irradiation with blue light, despite its antibacterial action, should be avoided due to its unfavorable influence on fibroblasts.

4. Conclusions

In the herein presented study, a nanomaterial based on titanium oxide functionalized with gallic acid was obtained and characterized. The level of gallic acid absorption on the surface of titanium oxide was estimated at 2.5% based on thermogravimetry results. The Microtox assay revealed a lack of ecotoxicity of TiO2-GA at concentrations up to 0.1%. The DPPH assay showed a significant increase in the antioxidant properties of TiO2-GA (IC50 = 13.5 ± 0.3 mg/L) compared to titanium(IV) oxide, which had no antioxidant effect. Interestingly, the value assigned to the nanomaterial corresponds to other popular antioxidants such as curcumin or vitamin C (IC50~2–4 mg/L). The phototoxic effect of the nanomaterial against S. aureus, E. coli and C. albicans was thoroughly studied, with the most significant reduction in bacterial survival by 5 log CFU/mL noted for S. aureus irradiated with 425 nm light (~70 mW/cm2). The MTT test was performed to determine the toxicity of the nanomaterial to human fibroblast cells. In the tested concentrations (0.01–1%), gallic acid presented significant cytotoxicity against human fibroblasts, with IC50 values below 0.01% after 24 h of incubation, whereas the cytotoxicities of TiO2 and TiO2-GA were comparable.
TiO2-GA presented a bimodal effect in this way, that in the presence of blue light, it revealed antibacterial properties, whereas in the dark, it demonstrated antioxidant properties. This prompted us to conclude that TiO2-GA could be an additive to dressings and rinsing suspensions for treating difficult-to-heal wounds. Gallic acid as a tanning agent has an astringent effect—it binds to skin proteins, causing their inactivation. The low content of GA in the TiO2-GA nanomaterial may result in the normalization of the healing processes by slowing it down and remodeling existing but damaged fibers. Moreover, there are reports that TiO2 can improve wound healing by adsorbing proteins on the surface and reducing inflammation. As a result, the material can reduce the formation of keloids and improve the wound appearance after fusion [54,55]. To sum up, the research carried out on TiO2-GA indicates that it could be considered a new and valuable additive in the treatment of difficult-to-heal wounds, but further research is necessary to fully understand the mechanisms and phenomena behind the presented activity.

Author Contributions

Conceptualization: P.B., B.C.-G., R.K., M.Z.-B. and T.G.; Investigation: P.B., R.K., B.C.-G., D.T.M., M.M. and J.D.; Resources: P.B., R.K., B.C.-G., M.M., J.D., W.M.S. and T.K.; Writing—original draft preparation: P.B., D.T.M., M.M., K.M., J.D., T.K., M.Z.-B., W.M.S. and R.K.; Writing—review and editing: P.B., M.Z.-B., J.D., T.K., B.C.-G., W.M.S., R.K. and T.G.; Visualization: P.B., D.T.M. and R.K.; Supervision: T.G.; Project administration: P.B.; Funding acquisition: P.B. All authors have read and agreed to the published version of the manuscript.

Funding

Research was financed from a small research grant from the Poznan University of Medical Sciences statutory funding for young researchers—doctoral students (grant number SDUM-GB36/03/21).

Institutional Review Board Statement

Not applicable.

Informed Consent Statement

Not applicable.

Data Availability Statement

Not applicable.

Conflicts of Interest

The authors declare no conflict of interest. The funders had no role in the design of the study; in the collection, analyses or interpretation of data; in the writing of the manuscript; or in the decision to publish the results.

References

  1. Broughton, G.; Janis, J.E.; Attinger, C.E. A Brief History of Wound Care. Plast. Reconstr. Surg. 2006, 117, 6S–11S. [Google Scholar] [CrossRef] [Green Version]
  2. Zarchi, K.; Martinussen, T.; Jemec, G.B.E. Wound Healing and All-Cause Mortality in 958 Wound Patients Treated in Home Care: Healing and Mortality in Wound Patients. Wound Rep. Reg. 2015, 23, 753–758. [Google Scholar] [CrossRef]
  3. Velnar, T.; Bailey, T.; Smrkolj, V. The Wound Healing Process: An Overview of the Cellular and Molecular Mechanisms. J. Int. Med. Res. 2009, 37, 1528–1542. [Google Scholar] [CrossRef]
  4. Frykberg, R.G.; Banks, J. Challenges in the Treatment of Chronic Wounds. Adv. Wound Care 2015, 4, 560–582. [Google Scholar] [CrossRef] [Green Version]
  5. Broughton, G.; Janis, J.E.; Attinger, C.E. Wound Healing: An Overview. Plast. Reconstr. Surg. 2006, 117, 1–32. [Google Scholar] [CrossRef]
  6. Enoch, S.; Leaper, D.J. Basic Science of Wound Healing. Surg. Oxf. 2005, 23, 37–42. [Google Scholar] [CrossRef]
  7. Rigo, C.; Ferroni, L.; Tocco, I.; Roman, M.; Munivrana, I.; Gardin, C.; Cairns, W.; Vindigni, V.; Azzena, B.; Barbante, C.; et al. Active Silver Nanoparticles for Wound Healing. Int. J. Mol. Sci. 2013, 14, 4817–4840. [Google Scholar] [CrossRef] [Green Version]
  8. Hunter, S.; Langemo, D.K.; Anderson, J.; Hanson, D.; Thompson, P. Hyperbaric Oxygen Therapy for Chronic Wounds. Adv. Ski. Wound Care 2010, 23, 116–119. [Google Scholar] [CrossRef]
  9. Smith, A.M.; Moxon, S.; Morris, G.A. Biopolymers as Wound Healing Materials. In Wound Healing Biomaterials; Elsevier: Amsterdam, The Netherlands, 2016; pp. 261–287. ISBN 978-1-78242-456-7. [Google Scholar]
  10. Ismail, N.A.; Amin, K.A.M.; Majid, F.A.A.; Razali, M.H. Gellan Gum Incorporating Titanium Dioxide Nanoparticles Biofilm as Wound Dressing: Physicochemical, Mechanical, Antibacterial Properties and Wound Healing Studies. Mater. Sci. Eng. C 2019, 103, 109770. [Google Scholar] [CrossRef]
  11. Rouquerol, J.; Sing, K.S.W.; Llewellyn, P. Adsorption by Metal Oxides. In Adsorption by Powders and Porous Solids; Elsevier: Amsterdam, The Netherlands, 2014; pp. 393–465. ISBN 978-0-08-097035-6. [Google Scholar]
  12. Fujishima, A.; Rao, T.N.; Tryk, D.A. Titanium Dioxide Photocatalysis. J. Photochem. Photobiol. C Photochem. Rev. 2000, 1, 1–21. [Google Scholar] [CrossRef]
  13. Ahmed, S.N.; Haider, W. Heterogeneous Photocatalysis and Its Potential Applications in Water and Wastewater Treatment: A Review. Nanotechnology 2018, 29, 342001. [Google Scholar] [CrossRef] [Green Version]
  14. Lin, Y.; Mehrvar, M. Photocatalytic Treatment of an Actual Confectionery Wastewater Using Ag/TiO2/Fe2O3: Optimization of Photocatalytic Reactions Using Surface Response Methodology. Catalysts 2018, 8, 409. [Google Scholar] [CrossRef] [Green Version]
  15. Krakowiak, R.; Musial, J.; Frankowski, R.; Spychala, M.; Mielcarek, J.; Dobosz, B.; Krzyminiewski, R.; Sikorski, M.; Bendzinska-Berus, W.; Tykarska, E.; et al. Phthalocyanine-Grafted Titania Nanoparticles for Photodegradation of Ibuprofen. Catalysts 2020, 10, 1328. [Google Scholar] [CrossRef]
  16. Krakowiak, R.; Musial, J.; Bakun, P.; Spychała, M.; Czarczynska-Goslinska, B.; Mlynarczyk, D.T.; Koczorowski, T.; Sobotta, L.; Stanisz, B.; Goslinski, T. Titanium Dioxide-Based Photocatalysts for Degradation of Emerging Contaminants Including Pharmaceutical Pollutants. Appl. Sci. 2021, 11, 8674. [Google Scholar] [CrossRef]
  17. Zhuang, H.-F.; Lin, C.-J.; Lai, Y.-K.; Sun, L.; Li, J. Some Critical Structure Factors of Titanium Oxide Nanotube Array in Its Photocatalytic Activity. Environ. Sci. Technol. 2007, 41, 4735–4740. [Google Scholar] [CrossRef]
  18. Musial, J.; Krakowiak, R.; Mlynarczyk, D.T.; Goslinski, T.; Stanisz, B.J. Titanium Dioxide Nanoparticles in Food and Personal Care Products—What Do We Know about Their Safety? Nanomaterials 2020, 10, 1110. [Google Scholar] [CrossRef]
  19. Ziental, D.; Czarczynska-Goslinska, B.; Mlynarczyk, D.T.; Glowacka-Sobotta, A.; Stanisz, B.; Goslinski, T.; Sobotta, L. Titanium Dioxide Nanoparticles: Prospects and Applications in Medicine. Nanomaterials 2020, 10, 387. [Google Scholar] [CrossRef] [Green Version]
  20. Wiesenthal, A.; Hunter, L.; Wang, S.; Wickliffe, J.; Wilkerson, M. Nanoparticles: Small and Mighty: Nanoparticles. Int. J. Dermatol. 2011, 50, 247–254. [Google Scholar] [CrossRef]
  21. Gupta, K.; Singh, R.P.; Pandey, A.; Pandey, A. Photocatalytic Antibacterial Performance of TiO2 and Ag-Doped TiO2 against S. Aureus. P. Aeruginosa and E. coli. Beilstein J. Nanotechnol. 2013, 4, 345–351. [Google Scholar] [CrossRef] [Green Version]
  22. Wanag, A.; Rokicka, P.; Kusiak-Nejman, E.; Kapica-Kozar, J.; Wrobel, R.J.; Markowska-Szczupak, A.; Morawski, A.W. Antibacterial Properties of TiO2 Modified with Reduced Graphene Oxide. Ecotoxicol. Environ. Saf. 2018, 147, 788–793. [Google Scholar] [CrossRef]
  23. Kahkeshani, N.; Farzaei, F.; Fotouhi, M.; Alavi, S.S.; Bahramsoltani, R.; Naseri, R.; Momtaz, S.; Abbasabadi, Z.; Rahimi, R.; Farzaei, M.H.; et al. Pharmacological Effects of Gallic Acid in Health and Disease: A Mechanistic Review. Iran. J. Basic Med. Sci. 2019, 22, 225–237. [Google Scholar] [CrossRef]
  24. Lima, V.N.; Oliveira-Tintino, C.D.M.; Santos, E.S.; Morais, L.P.; Tintino, S.R.; Freitas, T.S.; Geraldo, Y.S.; Pereira, R.L.S.; Cruz, R.P.; Menezes, I.R.A.; et al. Antimicrobial and Enhancement of the Antibiotic Activity by Phenolic Compounds: Gallic Acid, Caffeic Acid and Pyrogallol. Microb. Pathog. 2016, 99, 56–61. [Google Scholar] [CrossRef]
  25. Wang, Q.; de Oliveira, E.F.; Alborzi, S.; Bastarrachea, L.J.; Tikekar, R.V. On Mechanism behind UV-A Light Enhanced Antibacterial Activity of Gallic Acid and Propyl Gallate against Escherichia coli O157:H7. Sci. Rep. 2017, 7, 8325. [Google Scholar] [CrossRef] [Green Version]
  26. Yang, D.; Moh, S.; Son, D.; You, S.; Kinyua, A.; Ko, C.; Song, M.; Yeo, J.; Choi, Y.-H.; Kim, K. Gallic Acid Promotes Wound Healing in Normal and Hyperglucidic Conditions. Molecules 2016, 21, 899. [Google Scholar] [CrossRef] [Green Version]
  27. Kim, D.-Y.; Kim, M.; Shinde, S.; Sung, J.-S.; Ghodake, G. Cytotoxicity and Antibacterial Assessment of Gallic Acid Capped Gold Nanoparticles. Colloids Surf. B Biointerfaces 2017, 149, 162–167. [Google Scholar] [CrossRef]
  28. Shah, S.T.; A Yehya, W.; Saad, O.; Simarani, K.; Chowdhury, Z.; Alhadi, A.; Al-Ani, L. Surface Functionalization of Iron Oxide Nanoparticles with Gallic Acid as Potential Antioxidant and Antimicrobial Agents. Nanomaterials 2017, 7, 306. [Google Scholar] [CrossRef]
  29. Sharma, O.P.; Bhat, T.K. DPPH Antioxidant Assay Revisited. Food Chem. 2009, 113, 1202–1205. [Google Scholar] [CrossRef]
  30. Długaszewska, J.; Antczak, M.; Kaczmarek, I.; Jankowiak, R.; Buszkiewicz, M.; Herkowiak, M.; Michalak, K.; Kukuła, H.; Ratajczak, M. In Vitro Biofilm Formation and Antibiotic Susceptibility of Pseudomonas Aeruginosa Isolated from Airways of Patients with Cystic Fibrosis. JMS 2016, 85, 245–253. [Google Scholar] [CrossRef]
  31. Birinci, Y.; Niazi, J.H.; Aktay-Çetin, O.; Basaga, H. Quercetin in the Form of a Nano-Antioxidant (QTiO2) Provides Stabilization of Quercetin and Maximizes Its Antioxidant Capacity in the Mouse Fibroblast Model. Enzym. Microb. Technol. 2020, 138, 109559. [Google Scholar] [CrossRef]
  32. León, A.; Reuquen, P.; Garín, C.; Segura, R.; Vargas, P.; Zapata, P.; Orihuela, P. FTIR and Raman Characterization of TiO2 Nanoparticles Coated with Polyethylene Glycol as Carrier for 2-Methoxyestradiol. Appl. Sci. 2017, 7, 49. [Google Scholar] [CrossRef]
  33. Wu, C.-Y.; Tu, K.-J.; Deng, J.-P.; Lo, Y.-S.; Wu, C.-H. Markedly Enhanced Surface Hydroxyl Groups of TiO2 Nanoparticles with Superior Water-Dispersibility for Photocatalysis. Materials 2017, 10, 566. [Google Scholar] [CrossRef] [PubMed]
  34. Ohno, T.; Sarukawa, K.; Tokieda, K.; Matsumura, M. Morphology of a TiO2 Photocatalyst (Degussa, P-25) Consisting of Anatase and Rutile Crystalline Phases. J. Catal. 2001, 203, 82–86. [Google Scholar] [CrossRef]
  35. Boutinguiza, M.; Rodríguez-González, B.; del Val, J.; Comesaña, R.; Lusquiños, F.; Pou, J. Laser-Assisted Production of Spherical TiO2 Nanoparticles in Water. Nanotechnology 2011, 22, 195606. [Google Scholar] [CrossRef]
  36. Danaei, M.; Dehghankhold, M.; Ataei, S.; Hasanzadeh Davarani, F.; Javanmard, R.; Dokhani, A.; Khorasani, S.; Mozafari, M. Impact of Particle Size and Polydispersity Index on the Clinical Applications of Lipidic Nanocarrier Systems. Pharmaceutics 2018, 10, 57. [Google Scholar] [CrossRef] [Green Version]
  37. He, J.; Du, Y.; Bai, Y.; An, J.; Cai, X.; Chen, Y.; Wang, P.; Yang, X.; Feng, Q. Facile Formation of Anatase/Rutile TiO2 Nanocomposites with Enhanced Photocatalytic Activity. Molecules 2019, 24, 2996. [Google Scholar] [CrossRef] [PubMed] [Green Version]
  38. Yu, J.-G.; Yu, H.-G.; Cheng, B.; Zhao, X.-J.; Yu, J.C.; Ho, W.-K. The Effect of Calcination Temperature on the Surface Microstructure and Photocatalytic Activity of TiO2 Thin Films Prepared by Liquid Phase Deposition. J. Phys. Chem. B 2003, 107, 13871–13879. [Google Scholar] [CrossRef]
  39. Ma, W.; Lu, Z.; Zhang, M. Investigation of Structural Transformations in Nanophase Titanium Dioxide by Raman Spectroscopy. Appl. Phys. A Mater. Sci. Process. 1998, 66, 621–627. [Google Scholar] [CrossRef]
  40. Huguenin, J.; Ould Saad Hamady, S.; Bourson, P. Monitoring Deprotonation of Gallic Acid by Raman Spectroscopy: Monitoring Deprotonation of Gallic Acid by Raman Spectroscopy. J. Raman Spectrosc. 2015, 46, 1062–1066. [Google Scholar] [CrossRef]
  41. Li, X.W.; Song, R.G.; Jiang, Y.; Wang, C.; Jiang, D. Surface Modification of TiO2 Nanoparticles and Its Effect on the Properties of Fluoropolymer/TiO2 Nanocomposite Coatings. Appl. Surf. Sci. 2013, 276, 761–768. [Google Scholar] [CrossRef]
  42. Qureshi, A.A.; Bulich, A.A.; Isenberg, D.L. Microtox * Toxicity Test Systems—Where They Stand Today. In Microscale Testing in Aquatic Toxicology; Wells, P.G., Lee, K., Blaise, C., Eds.; CRC Press: Boca Raton, FL, USA, 2018; pp. 185–199. ISBN 978-0-203-74719-3. [Google Scholar]
  43. Cai, M.; Sugumaran, M.; Robinson, W.E. The Crosslinking and Antimicrobial Properties of Tunichrome. Comp. Biochem. Physiol. Part B Biochem. Mol. Biol. 2008, 151, 110–117. [Google Scholar] [CrossRef]
  44. Jaszek, M.; Osińska-Jaroszuk, M.; Janusz, G.; Matuszewska, A.; Stefaniuk, D.; Sulej, J.; Polak, J.; Ruminowicz, M.; Grzywnowicz, K.; Jarosz-Wilkołazka, A. New Bioactive Fungal Molecules with High Antioxidant and Antimicrobial Capacity Isolated from Cerrena Unicolor Idiophasic Cultures. BioMed. Res. Int. 2013, 2013, 497492. [Google Scholar] [CrossRef] [PubMed] [Green Version]
  45. Okrągła, E.; Chraniuk, M.; Wolska, L. Microtox Test as a Tool to Assass Antimicrobial Properties of Herbal Infusions Used in Urinary Tract Infections. Acta Pol. Pharm. Drug Res. 2017, 74, 895–901. [Google Scholar]
  46. Jafari, S.; Mahyad, B.; Hashemzadeh, H.; Janfaza, S.; Gholikhani, T.; Tayebi, L. Biomedical Applications of TiO2 Nanostructures: Recent Advances. IJN 2020, 15, 3447–3470. [Google Scholar] [CrossRef] [PubMed]
  47. Hu, H.; Guo, Q.; Wang, C.; Ma, X.; He, H.; Oh, Y.; Feng, Y.; Wu, Q.; Gu, N. Titanium Dioxide Nanoparticles Increase Plasma Glucose via Reactive Oxygen Species-Induced Insulin Resistance in Mice: TiO2 Nanoparticle Increases Plasma Glucose. J. Appl. Toxicol. 2015, 35, 1122–1132. [Google Scholar] [CrossRef] [PubMed]
  48. Márquez-Ramírez, S.G.; Delgado-Buenrostro, N.L.; Chirino, Y.I.; Iglesias, G.G.; López-Marure, R. Titanium Dioxide Nanoparticles Inhibit Proliferation and Induce Morphological Changes and Apoptosis in Glial Cells. Toxicology 2012, 302, 146–156. [Google Scholar] [CrossRef] [PubMed]
  49. Chellappa, M.; Anjaneyulu, U.; Manivasagam, G.; Vijayalakshmi, U. Preparation and Evaluation of the Cytotoxic Nature of TiO2 Nanoparticles by Direct Contact Method. Int. J. Nanomed. 2015, 10, 31–41. [Google Scholar] [CrossRef] [PubMed] [Green Version]
  50. Bettencourt, A.; Gonçalves, L.M.; Gramacho, A.C.; Vieira, A.; Rolo, D.; Martins, C.; Assunção, R.; Alvito, P.; Silva, M.J.; Louro, H. Analysis of the Characteristics and Cytotoxicity of Titanium Dioxide Nanomaterials Following Simulated In Vitro Digestion. Nanomaterials 2020, 10, 1516. [Google Scholar] [CrossRef]
  51. Muller, G.; Kramer, A. Biocompatibility Index of Antiseptic Agents by Parallel Assessment of Antimicrobial Activity and Cellular Cytotoxicity. J. Antimicrob. Chemother. 2008, 61, 1281–1287. [Google Scholar] [CrossRef] [Green Version]
  52. Opländer, C.; Hidding, S.; Werners, F.B.; Born, M.; Pallua, N.; Suschek, C.V. Effects of Blue Light Irradiation on Human Dermal Fibroblasts. J. Photochem. Photobiol. B Biol. 2011, 103, 118–125. [Google Scholar] [CrossRef]
  53. Sha, B.; Gao, W.; Wang, S.; Xu, F.; Lu, T. Cytotoxicity of Titanium Dioxide Nanoparticles Differs in Four Liver Cells from Human and Rat. Compos. Part B Eng. 2011, 42, 2136–2144. [Google Scholar] [CrossRef]
  54. Seisenbaeva, G.A.; Fromell, K.; Vinogradov, V.V.; Terekhov, A.N.; Pakhomov, A.V.; Nilsson, B.; Ekdahl, K.N.; Vinogradov, V.V.; Kessler, V.G. Dispersion of TiO2 Nanoparticles Improves Burn Wound Healing and Tissue Regeneration through Specific Interaction with Blood Serum Proteins. Sci. Rep. 2017, 7, 15448. [Google Scholar] [CrossRef] [PubMed] [Green Version]
  55. Wang, X.; Liu, K.; Ruan, M.; Yang, J.; Gao, Z. Gallic Acid Inhibits Fibroblast Growth and Migration in Keloids through the AKT/ERK Signaling Pathway. Acta Biochim. Biophys. Sin. 2018, 50, 1114–1120. [Google Scholar] [CrossRef] [PubMed]
Figure 1. SEM images of prepared nanomaterials. (A,B) TiO2, (C,D) TiO2-GA.
Materials 15 04177 g001
Figure 2. TEM images of (AD) TiO2 and (EH) TiO2-GA.
Materials 15 04177 g002aMaterials 15 04177 g002b
Figure 3. SAED patterns of (A) TiO2 and (B) TiO2-GA.
Materials 15 04177 g003
Figure 4. XRPD patterns of TiO2 and TiO2-GA. Labels describe peaks belonging to anatase (A) and rutile (R).
Materials 15 04177 g004
Figure 5. ATR-FTIR spectra TiO2, TiO2-GA and gallic acid. (A) Full spectrum in the range of 4000–400 cm−1, (B) inset of the 4000–800 cm−1 range with relative absorbance below 0.1. (C) Spectrum of gallic acid in the range of 4000–400 cm−1.
Materials 15 04177 g005
Figure 6. Raman spectra of analyzed materials TiO2 and TiO2-GA. (A) Full spectrum in the range of 4000–0 cm−1, (B) presents inset in the range of 1800–150 cm−1 with relative intensity below 0.2.
Materials 15 04177 g006
Figure 7. Absorbance of DPPH during DPPH assay of TiO2-GA depending on the concentration of the latter and photographs of the DPPH solutions with the addition of different concentrations of TiO2-GA suspensions.
Materials 15 04177 g007
Figure 8. A. fischeri bioluminescence inhibition upon incubation with solutions/suspensions of the tested materials (mean values ± standard deviation). The dashed line represents the 20% threshold, the arbitrary value of compound toxicity. All experiments were performed in triplicate.
Materials 15 04177 g008
Figure 9. The inactivation of S. aureus with TiO2-GA and visible light (λ = 425 nm) irradiation in function of time. Where: L+ is the irradiated sample; L− is the non-irradiated sample (tested in the dark); TG+ is the sample with photosensitizer (TiO2-GA); TG−is the sample without photosensitizer.
Materials 15 04177 g009
Figure 10. MTT assay on MRC-5 pd 19 cell line (human fibroblasts) after 24 and 48 h incubation for TiO2-GA nanomaterial.
Materials 15 04177 g010
Table 1. Amounts of ingredients added to the wells of a microtiter plate during an experiment involving 3 strains of microorganisms.
L− T+L− TG+L− PS−L+ T+L+ TG+L+ PS−
107 CFU/mL microorganisms150 µL150 µL150 µL150 µL150 µL150 µL
0.9% NaCl 150 µL 150 µL
2 mg/mL
TiO2-GA (TG)
150 µL 150 µL
2 mg/mL
TiO2 (T)
150 µL 150 µL
Where: L+ is the irradiated sample; L− is the non-irradiated sample (tested in the dark); PS−is the sample without photosensitizer (neither TiO2-GA nor TiO2).
Table 2. Amounts of ingredients added to the wells of a microtiter plate during the experiment on S. aureus.
L− TG+L− PS–L+ TG+L+ PS−
Time points, min0, 60, 1200, 60, 12010, 20, 30, 40, 50, 60, 70, 80, 90, 100, 110, 12060, 120
107 CFU/mL microorganisms150 µL150 µL150 µL150 µL
0.9% NaCl 150 µL 150 µL
2 mg/mL
TiO2-GA (TG)
150 µL 150 µL
Where: L+ is the irradiated sample; L− is the non-irradiated sample (tested in the dark); PS− is the sample without photosensitizer.
Table 3. Nanoparticle size measurements with NTA and BET surface area.
NameMean [nm]SDPDISBET [m2/g]
TiO2255.774.50.08557
TiO2-GA218.074.90.11861
PDI was calculated according to formula (SD/Mean)2.
Table 4. Results of thermogravimetric analysis of TiO2 and TiO2-GA.
First StageSecond StageThird StageFourth StageResidue
Tp (°C)Tk (°C)Δm (%)Tp (°C)Tk (°C)Δm (%)Tp (°C)Tk (°C)Δm (%)Tp (°C)Tk (°C)Δm (%)(%)
TiO2292221.04389800−0.89 99.85
GA731003.0224830161.4530135712.7535759722.230.55
TiO2-GA292050.922053982.15457800−0.51 97.44
Tp—onset temperature, Tk—end temperature, ∆m—change of mass of the analyzed sample.
Table 5. IC50 values of the tested samples determined in the DPPH test.
Sample (Compound/Material)IC50 ± S.E.M. (mg/L)
TiO2>1000
TiO2-GA13.5 ± 0.3
GA0.910 ± 0.002
Vitamin C2.12 ± 0.03
EGCG1.027 ± 0.003
Curcumin4.43 ± 0.02
IC50—concentration required to achieve 50% inhibition of the DPPH radical; S.E.M.—standard error of the mean.
Table 6. Reduction in amount of viable microorganisms in log CFU/mL.
Light365 nm425 nm
NanomaterialTiO2TiO2-GATiO2TiO2-GA
C. albicansno effect
E. coli1.3 logno effect2.1 log4.1 log
S. aureus3.1 logno effect1.4 log4.2 log
Publisher’s Note: MDPI stays neutral with regard to jurisdictional claims in published maps and institutional affiliations.

