
Effect of Corrosive Medium and Surface Defect-Energy on Corrosion Behavior of Rolled ZK61M Alloy

Abstract
:1. Introduction
2. Methodology of Research
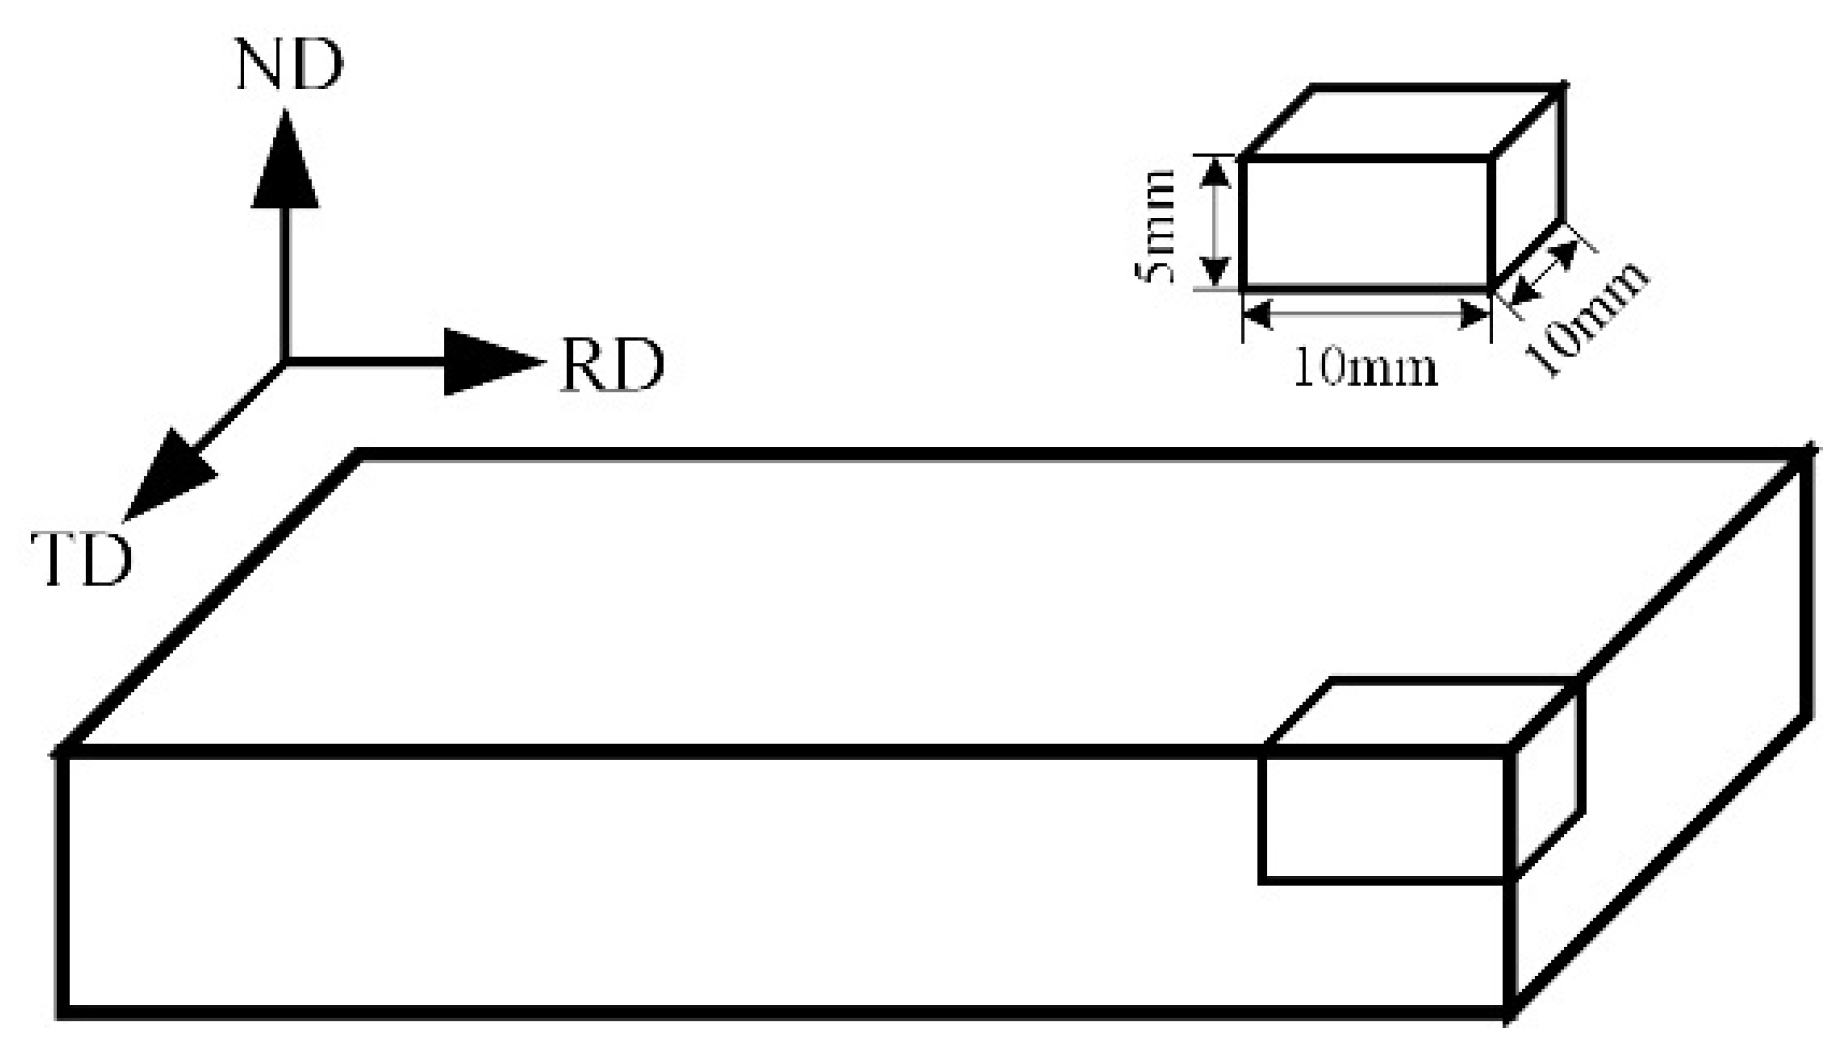
2.1. Workpiece Material
2.2. Corrosion Test
2.3. Electrochemical Analysis
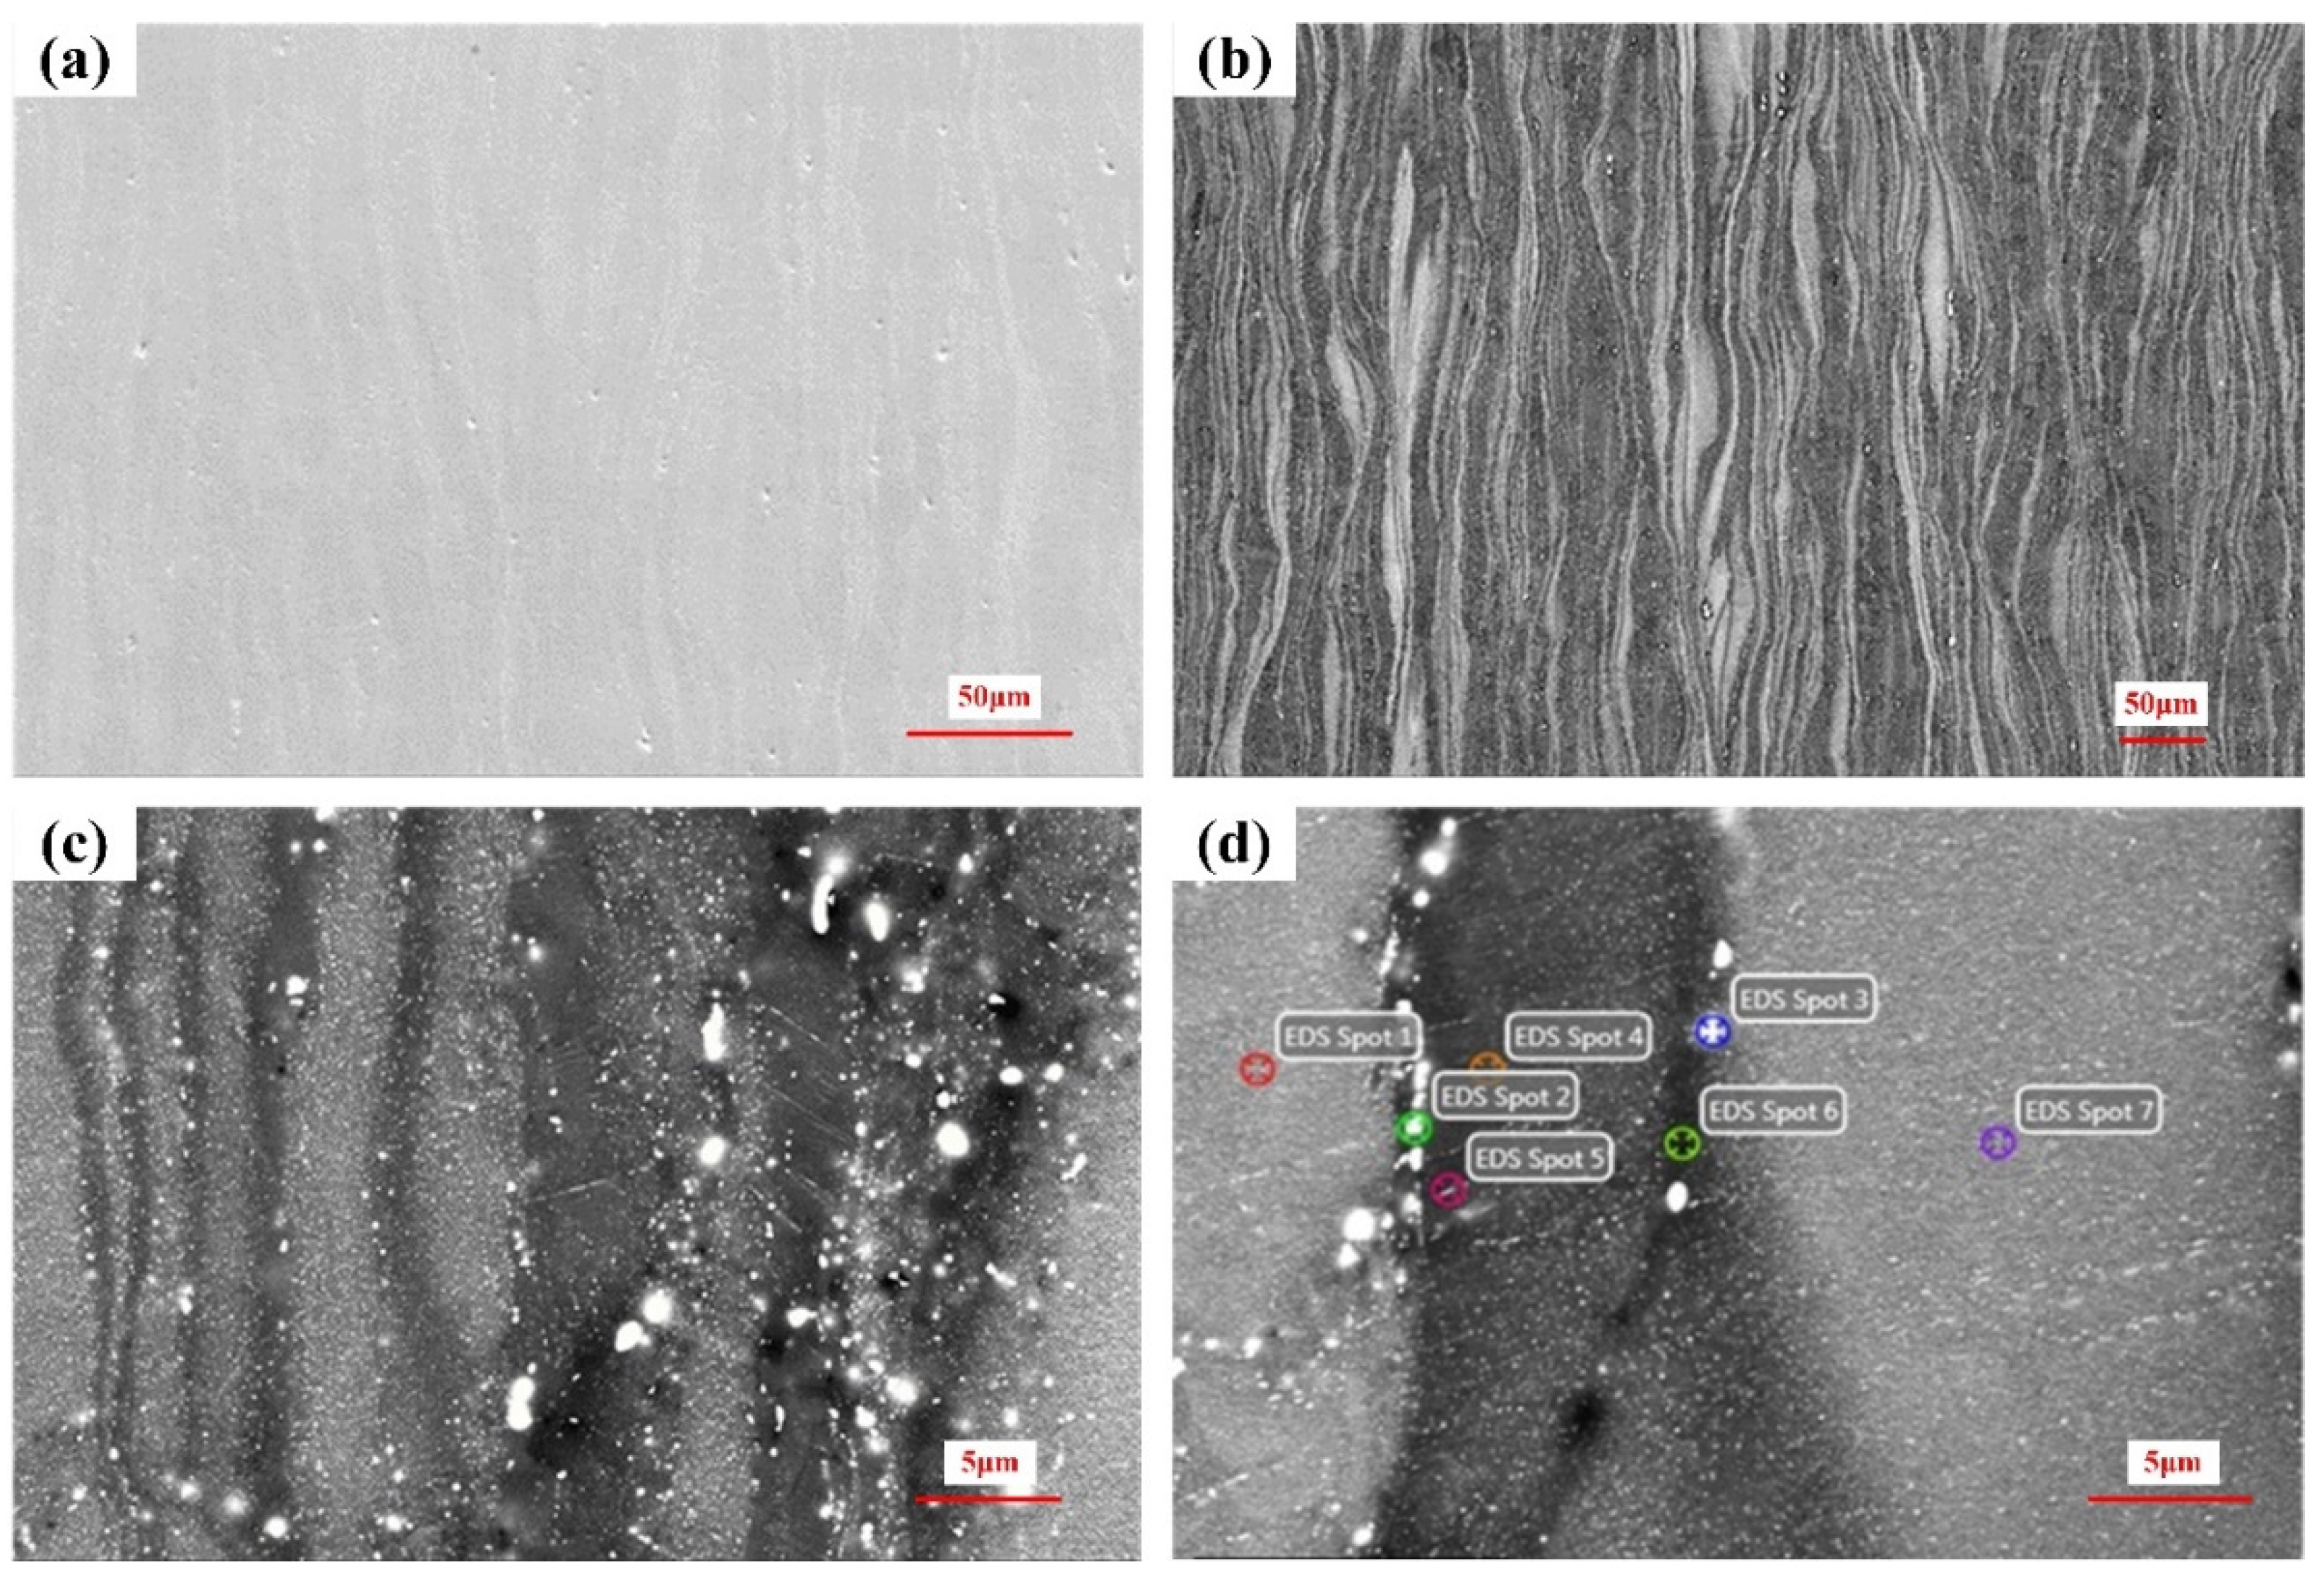
2.4. Microstructural Characterization
3. Results
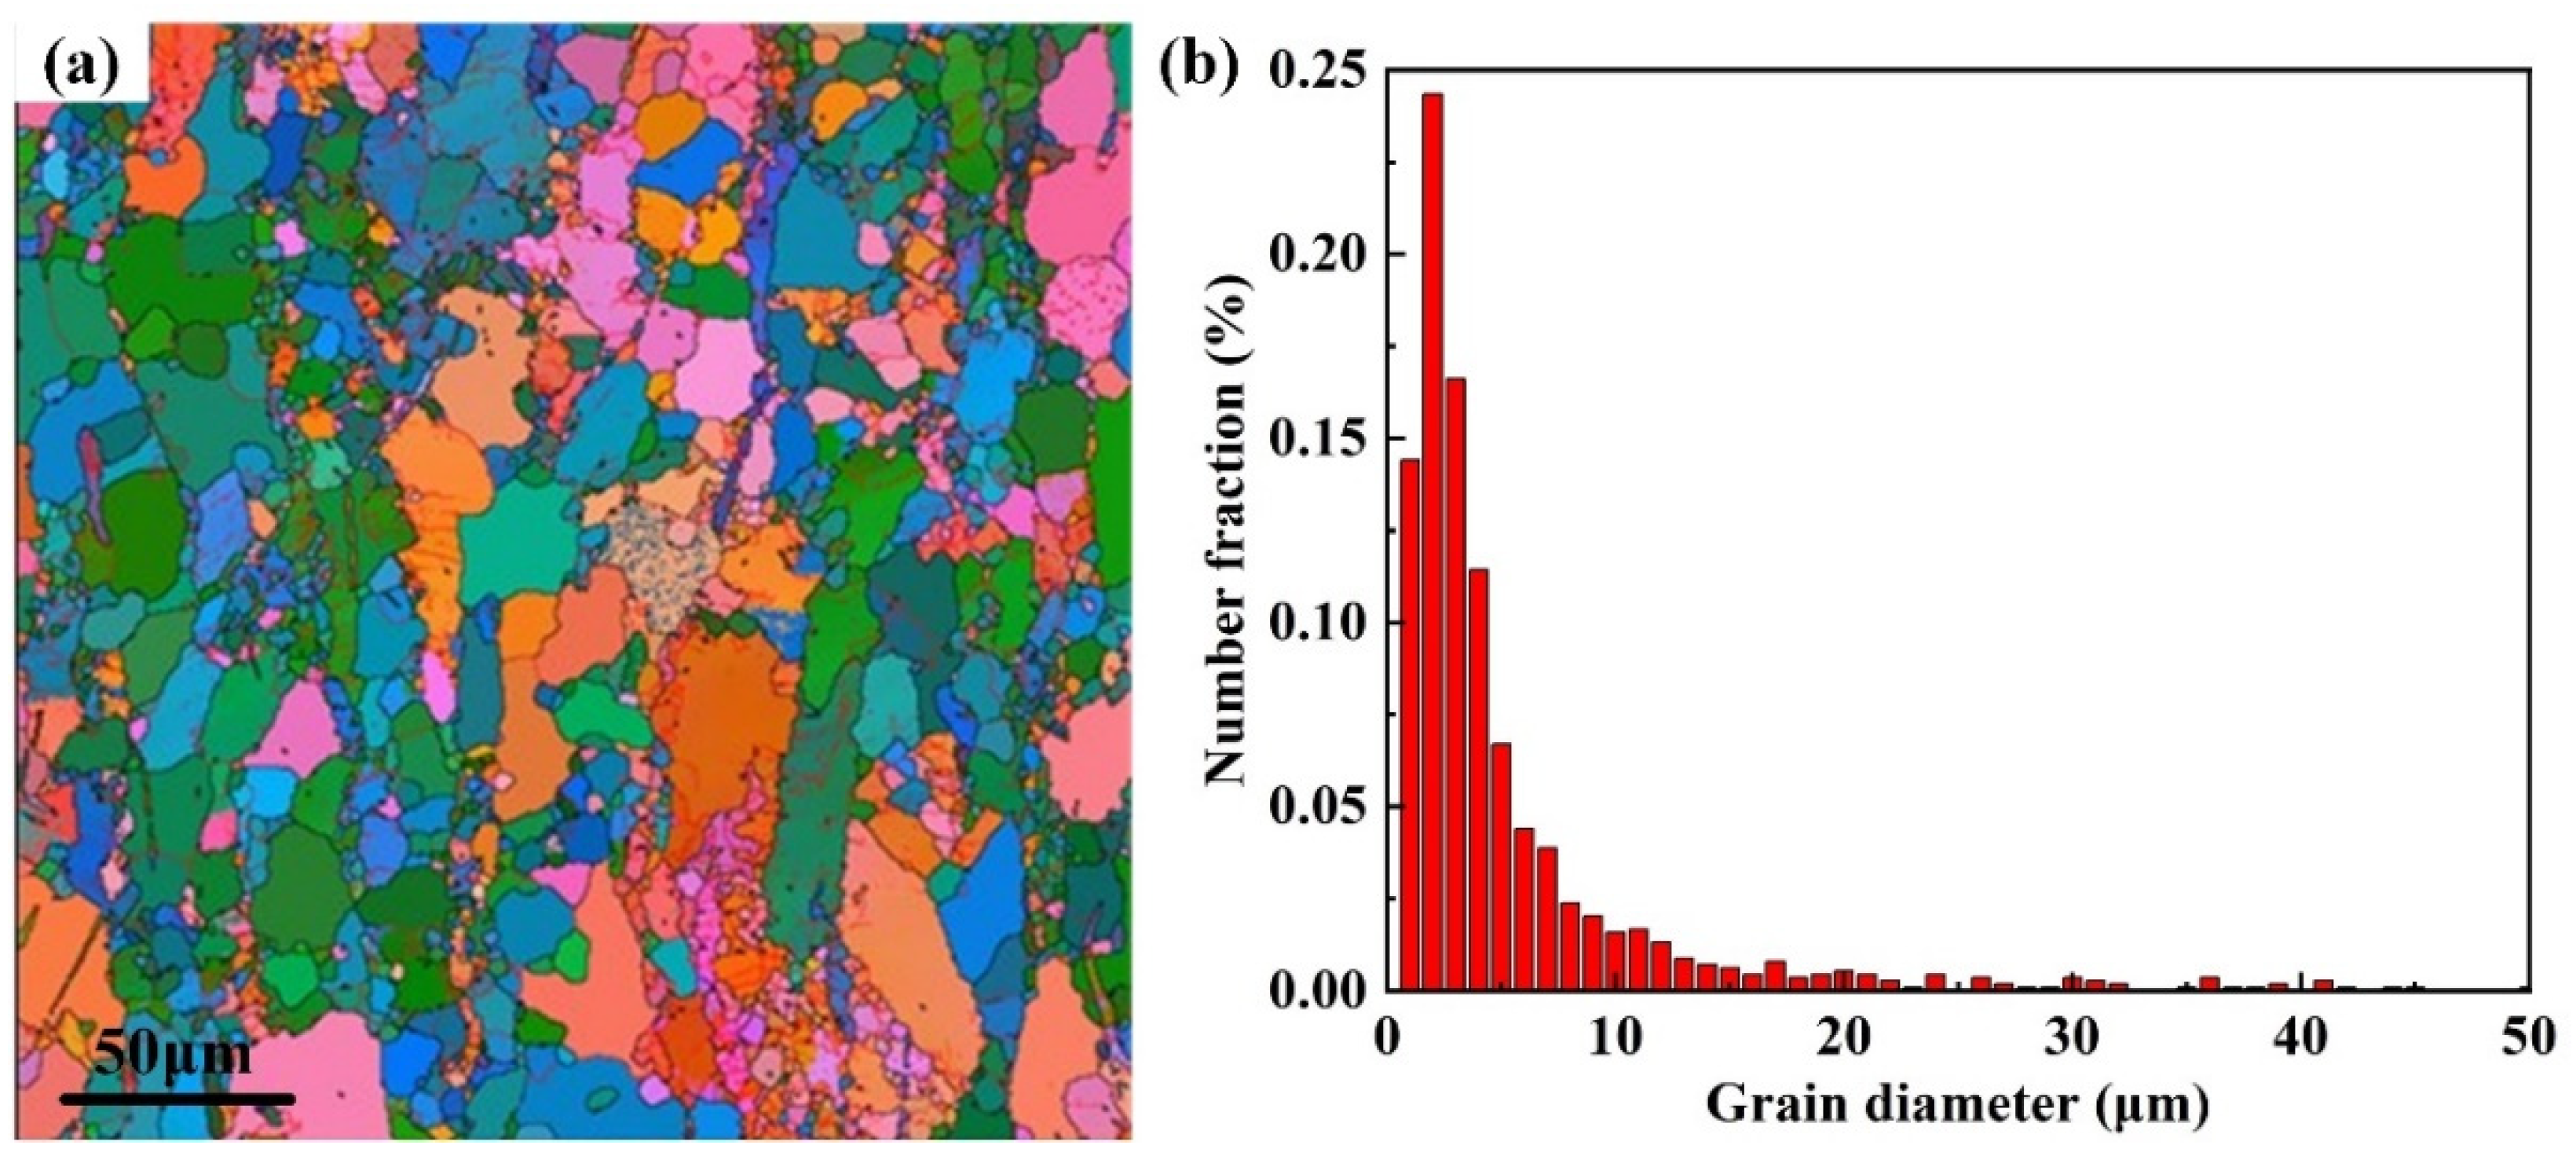
3.1. Microstructure
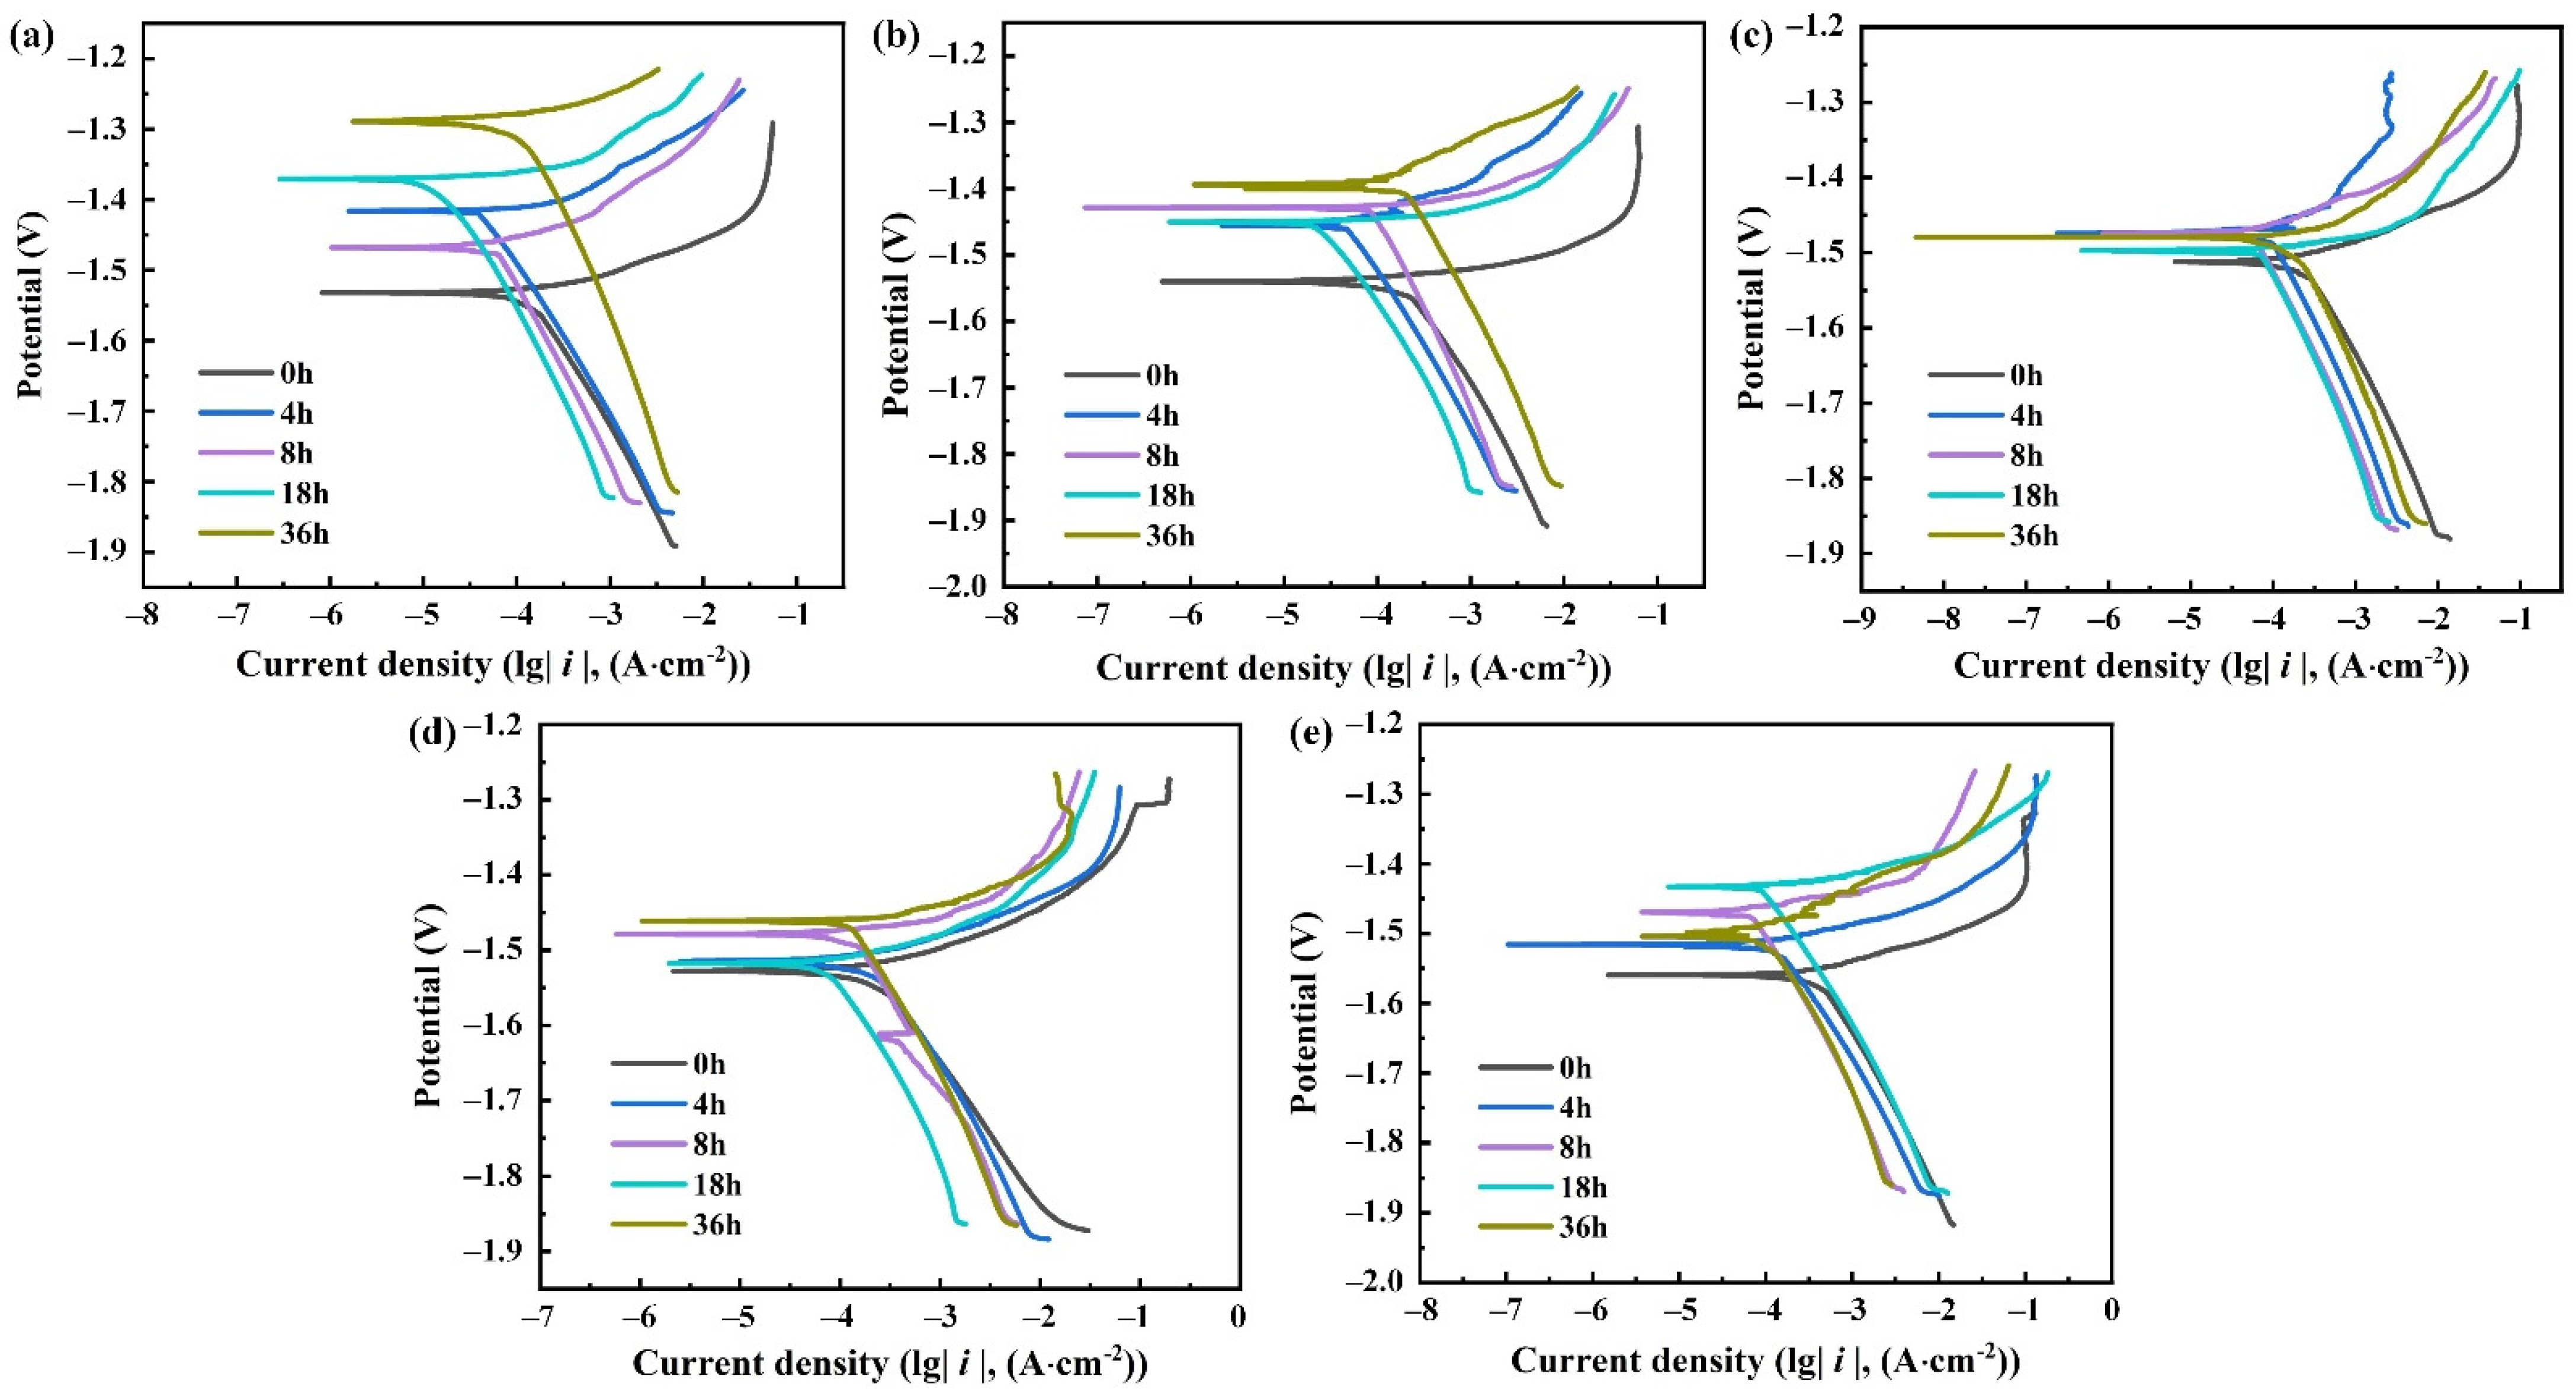
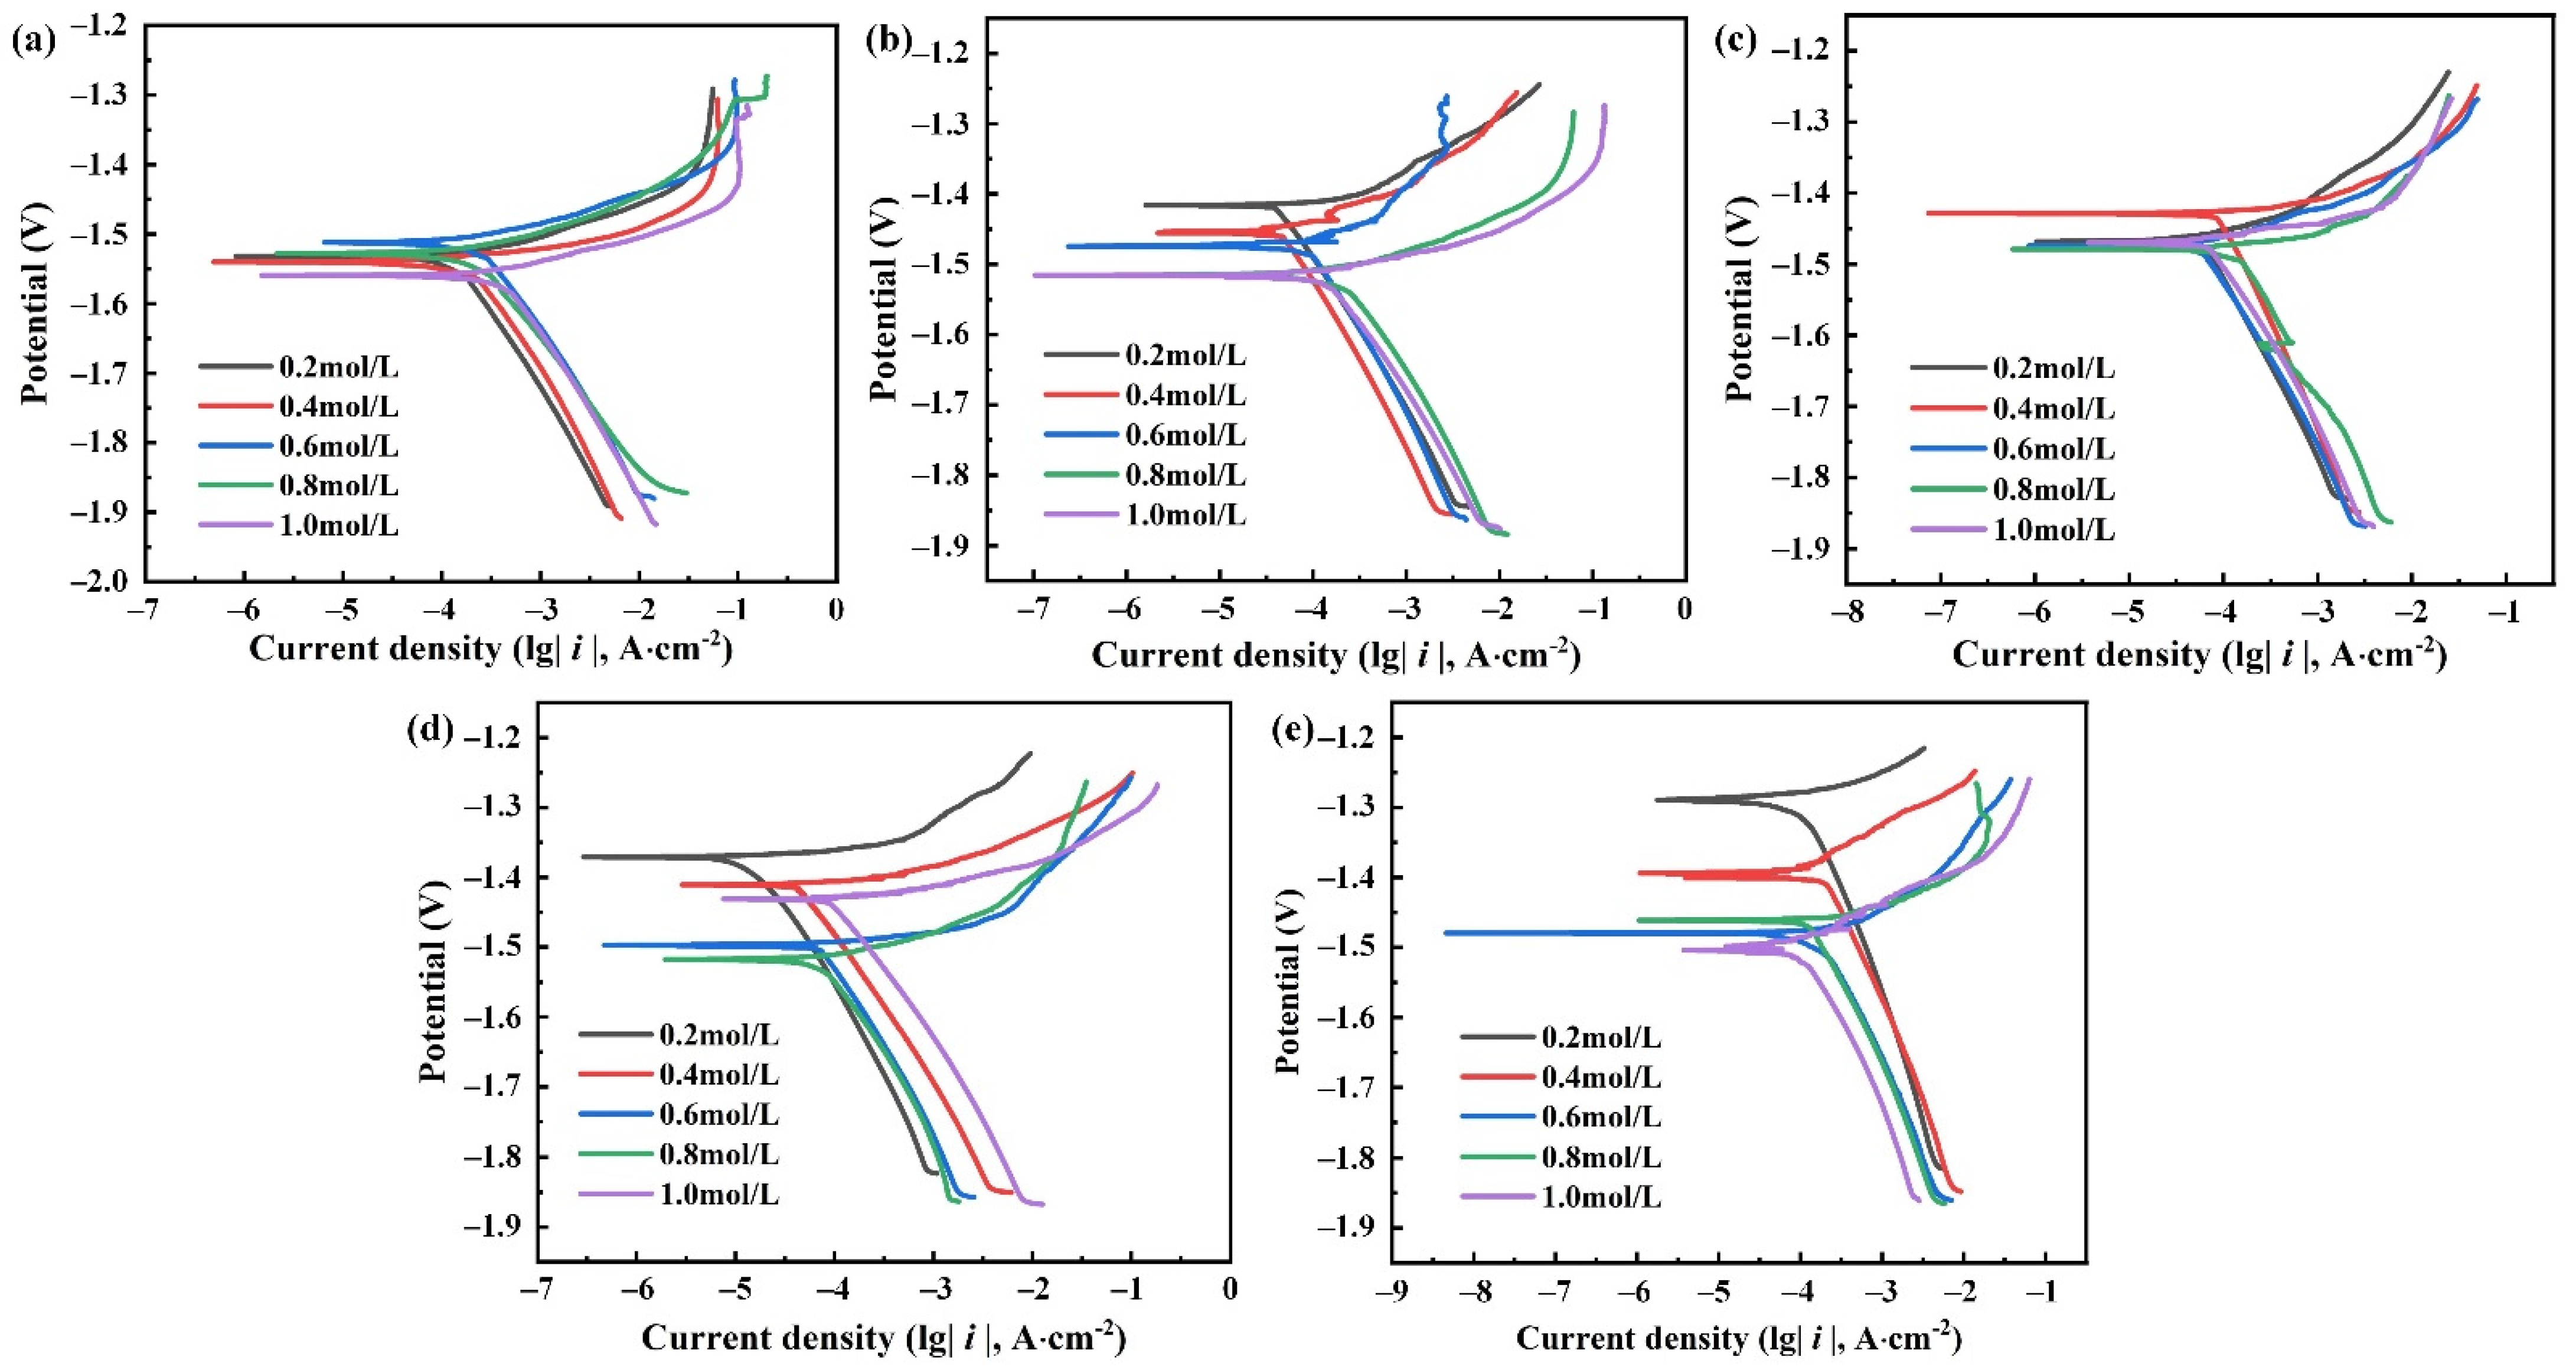
3.2. Polarization Curves
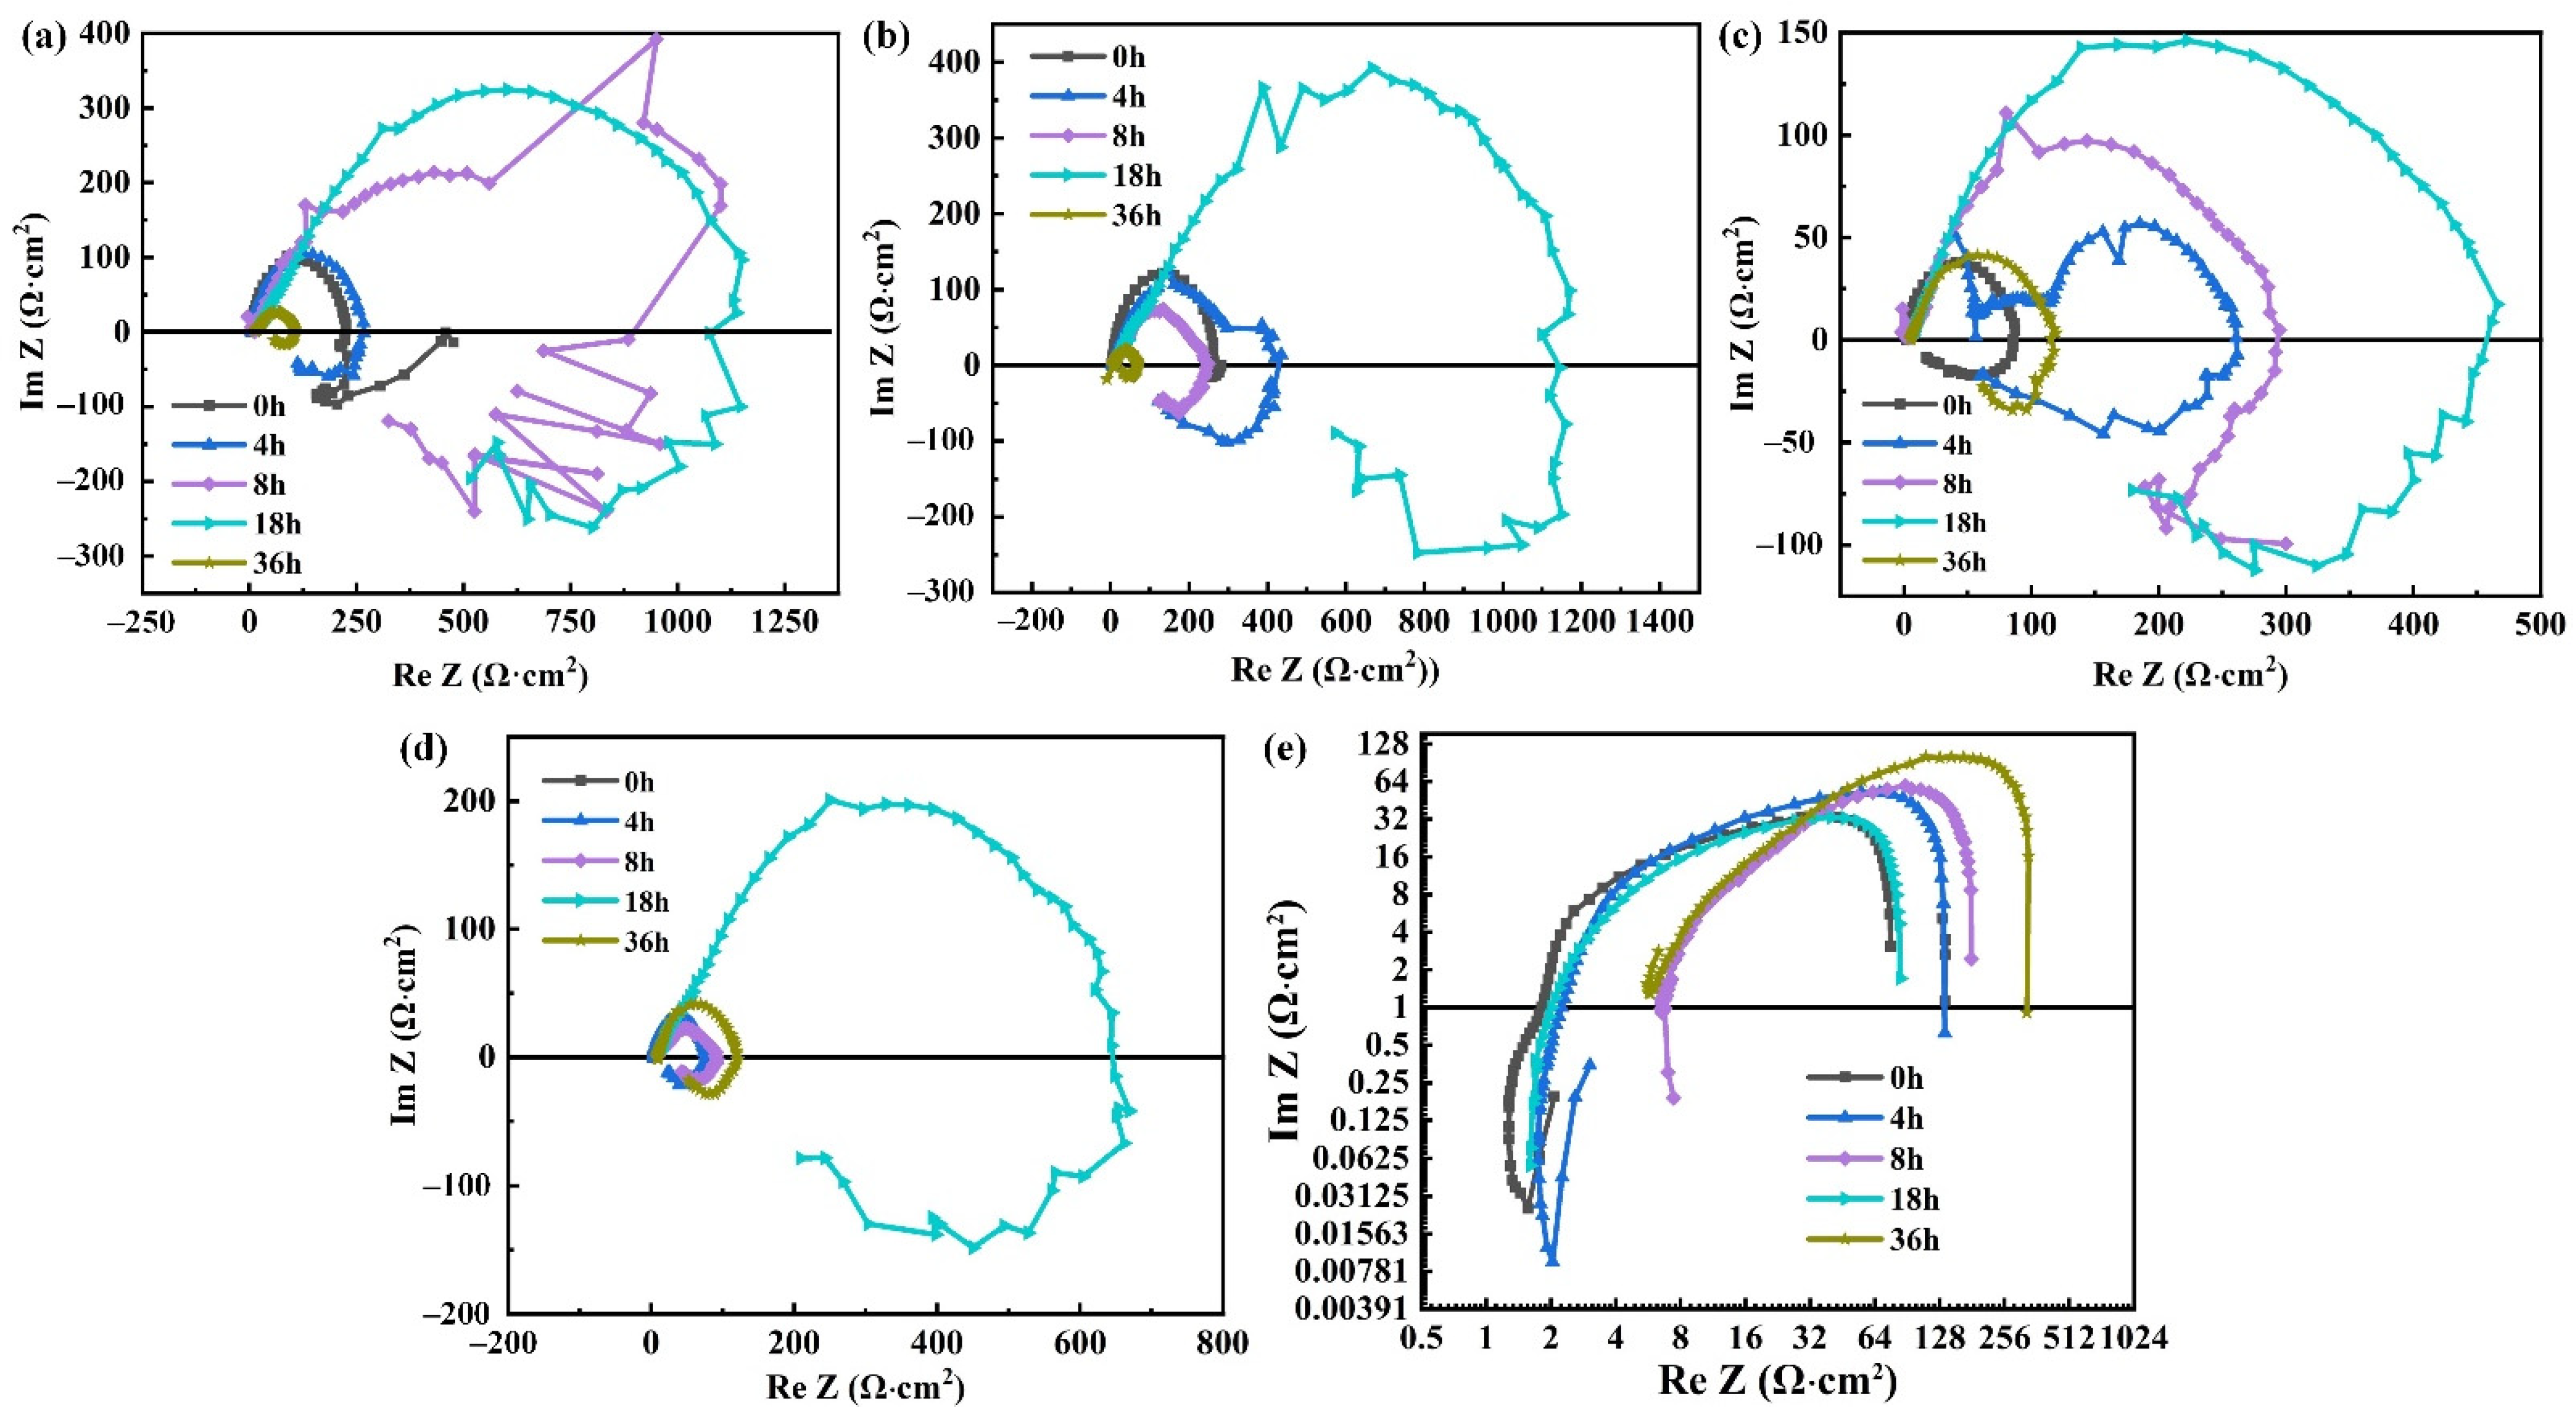
3.3. Electrochemical Impedance Spectroscopy
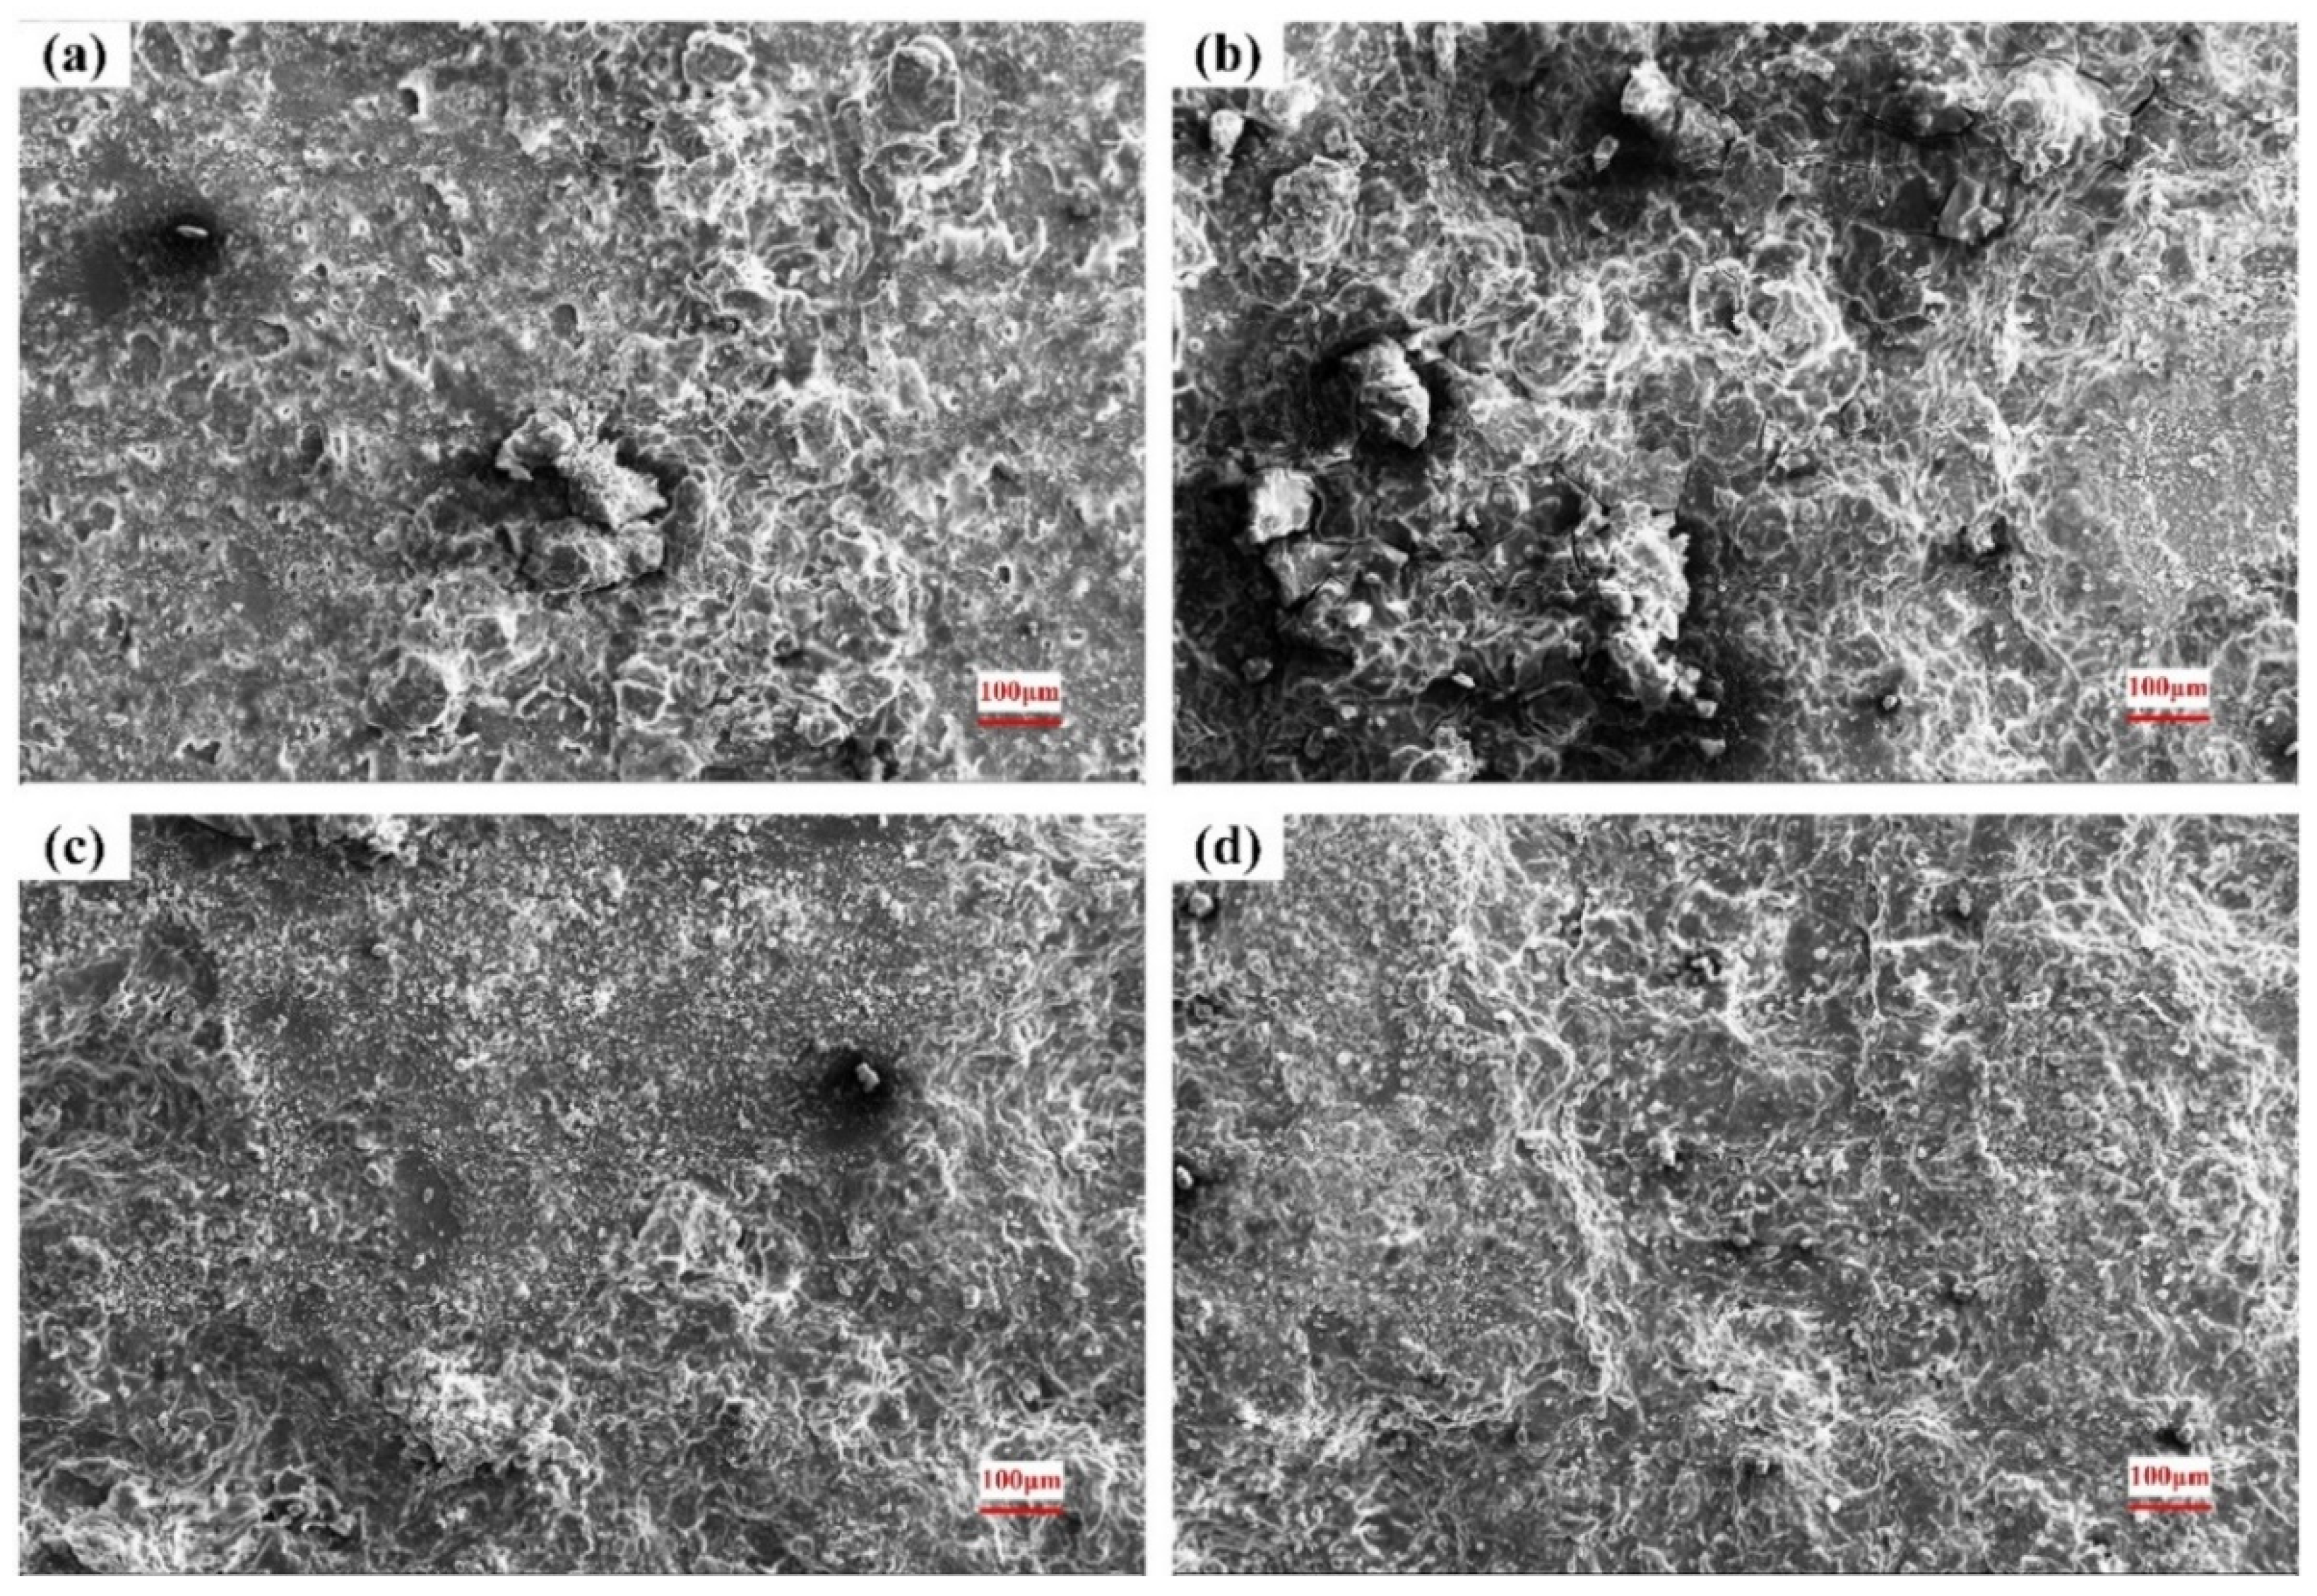
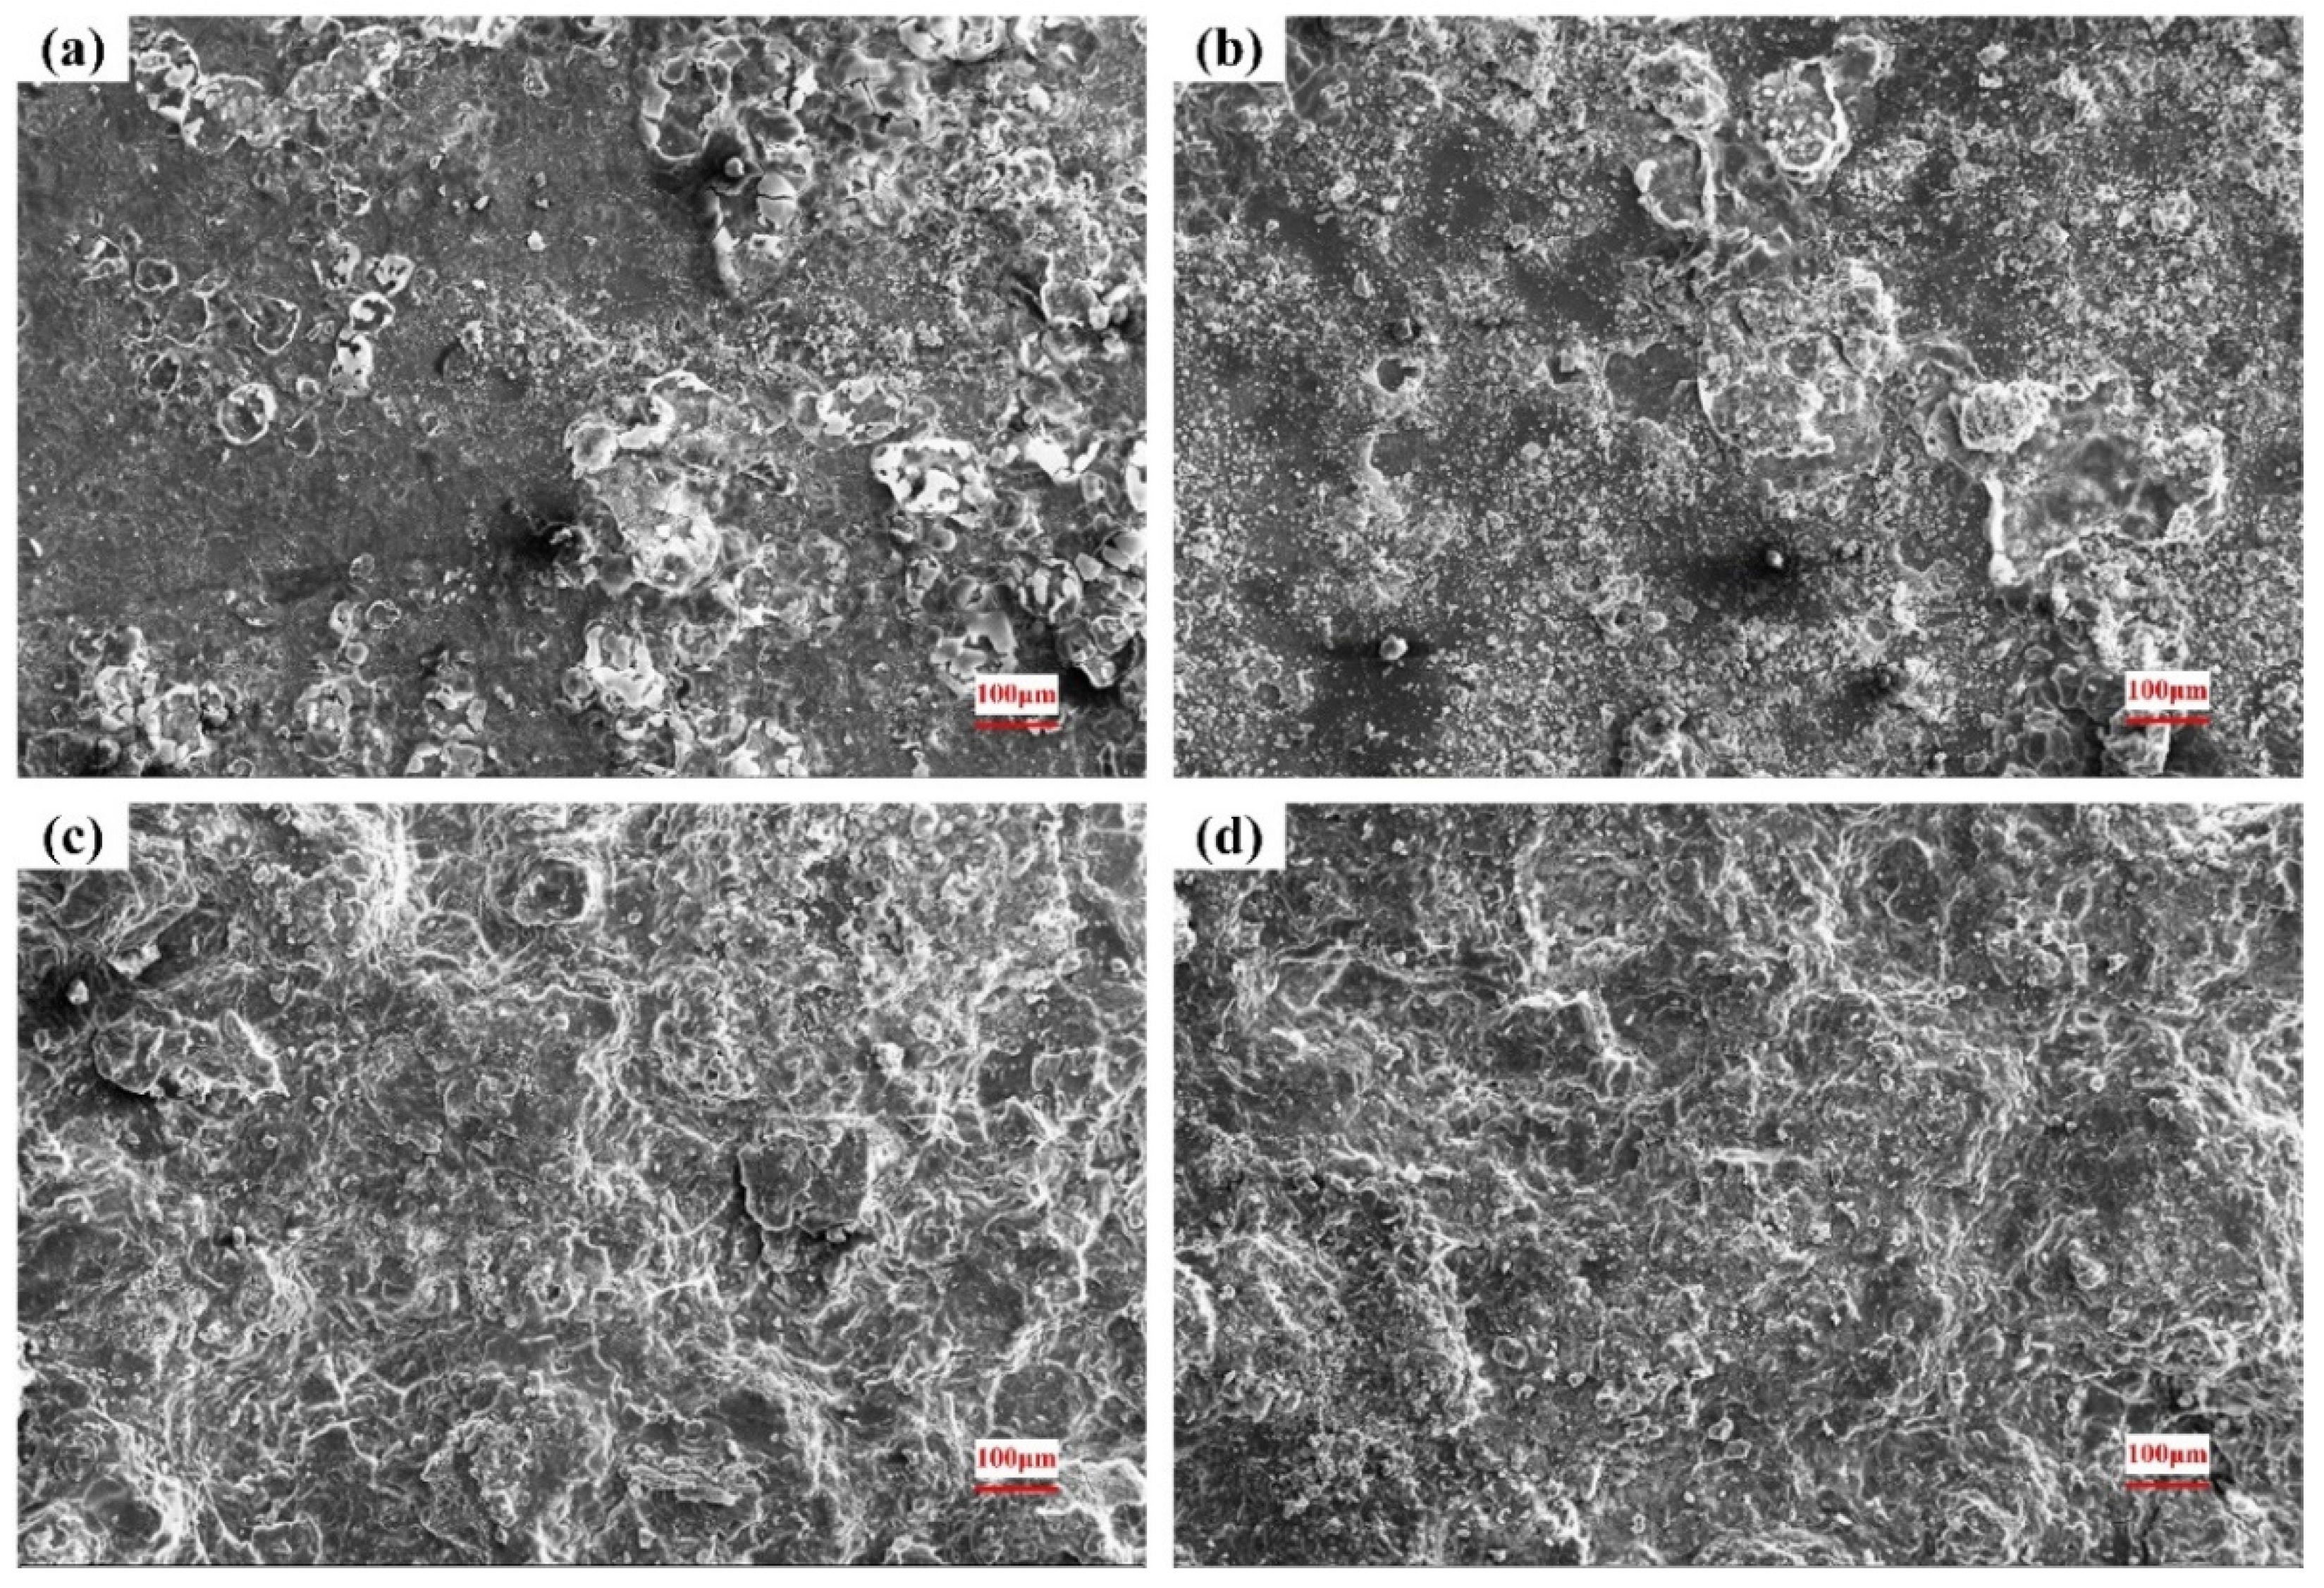
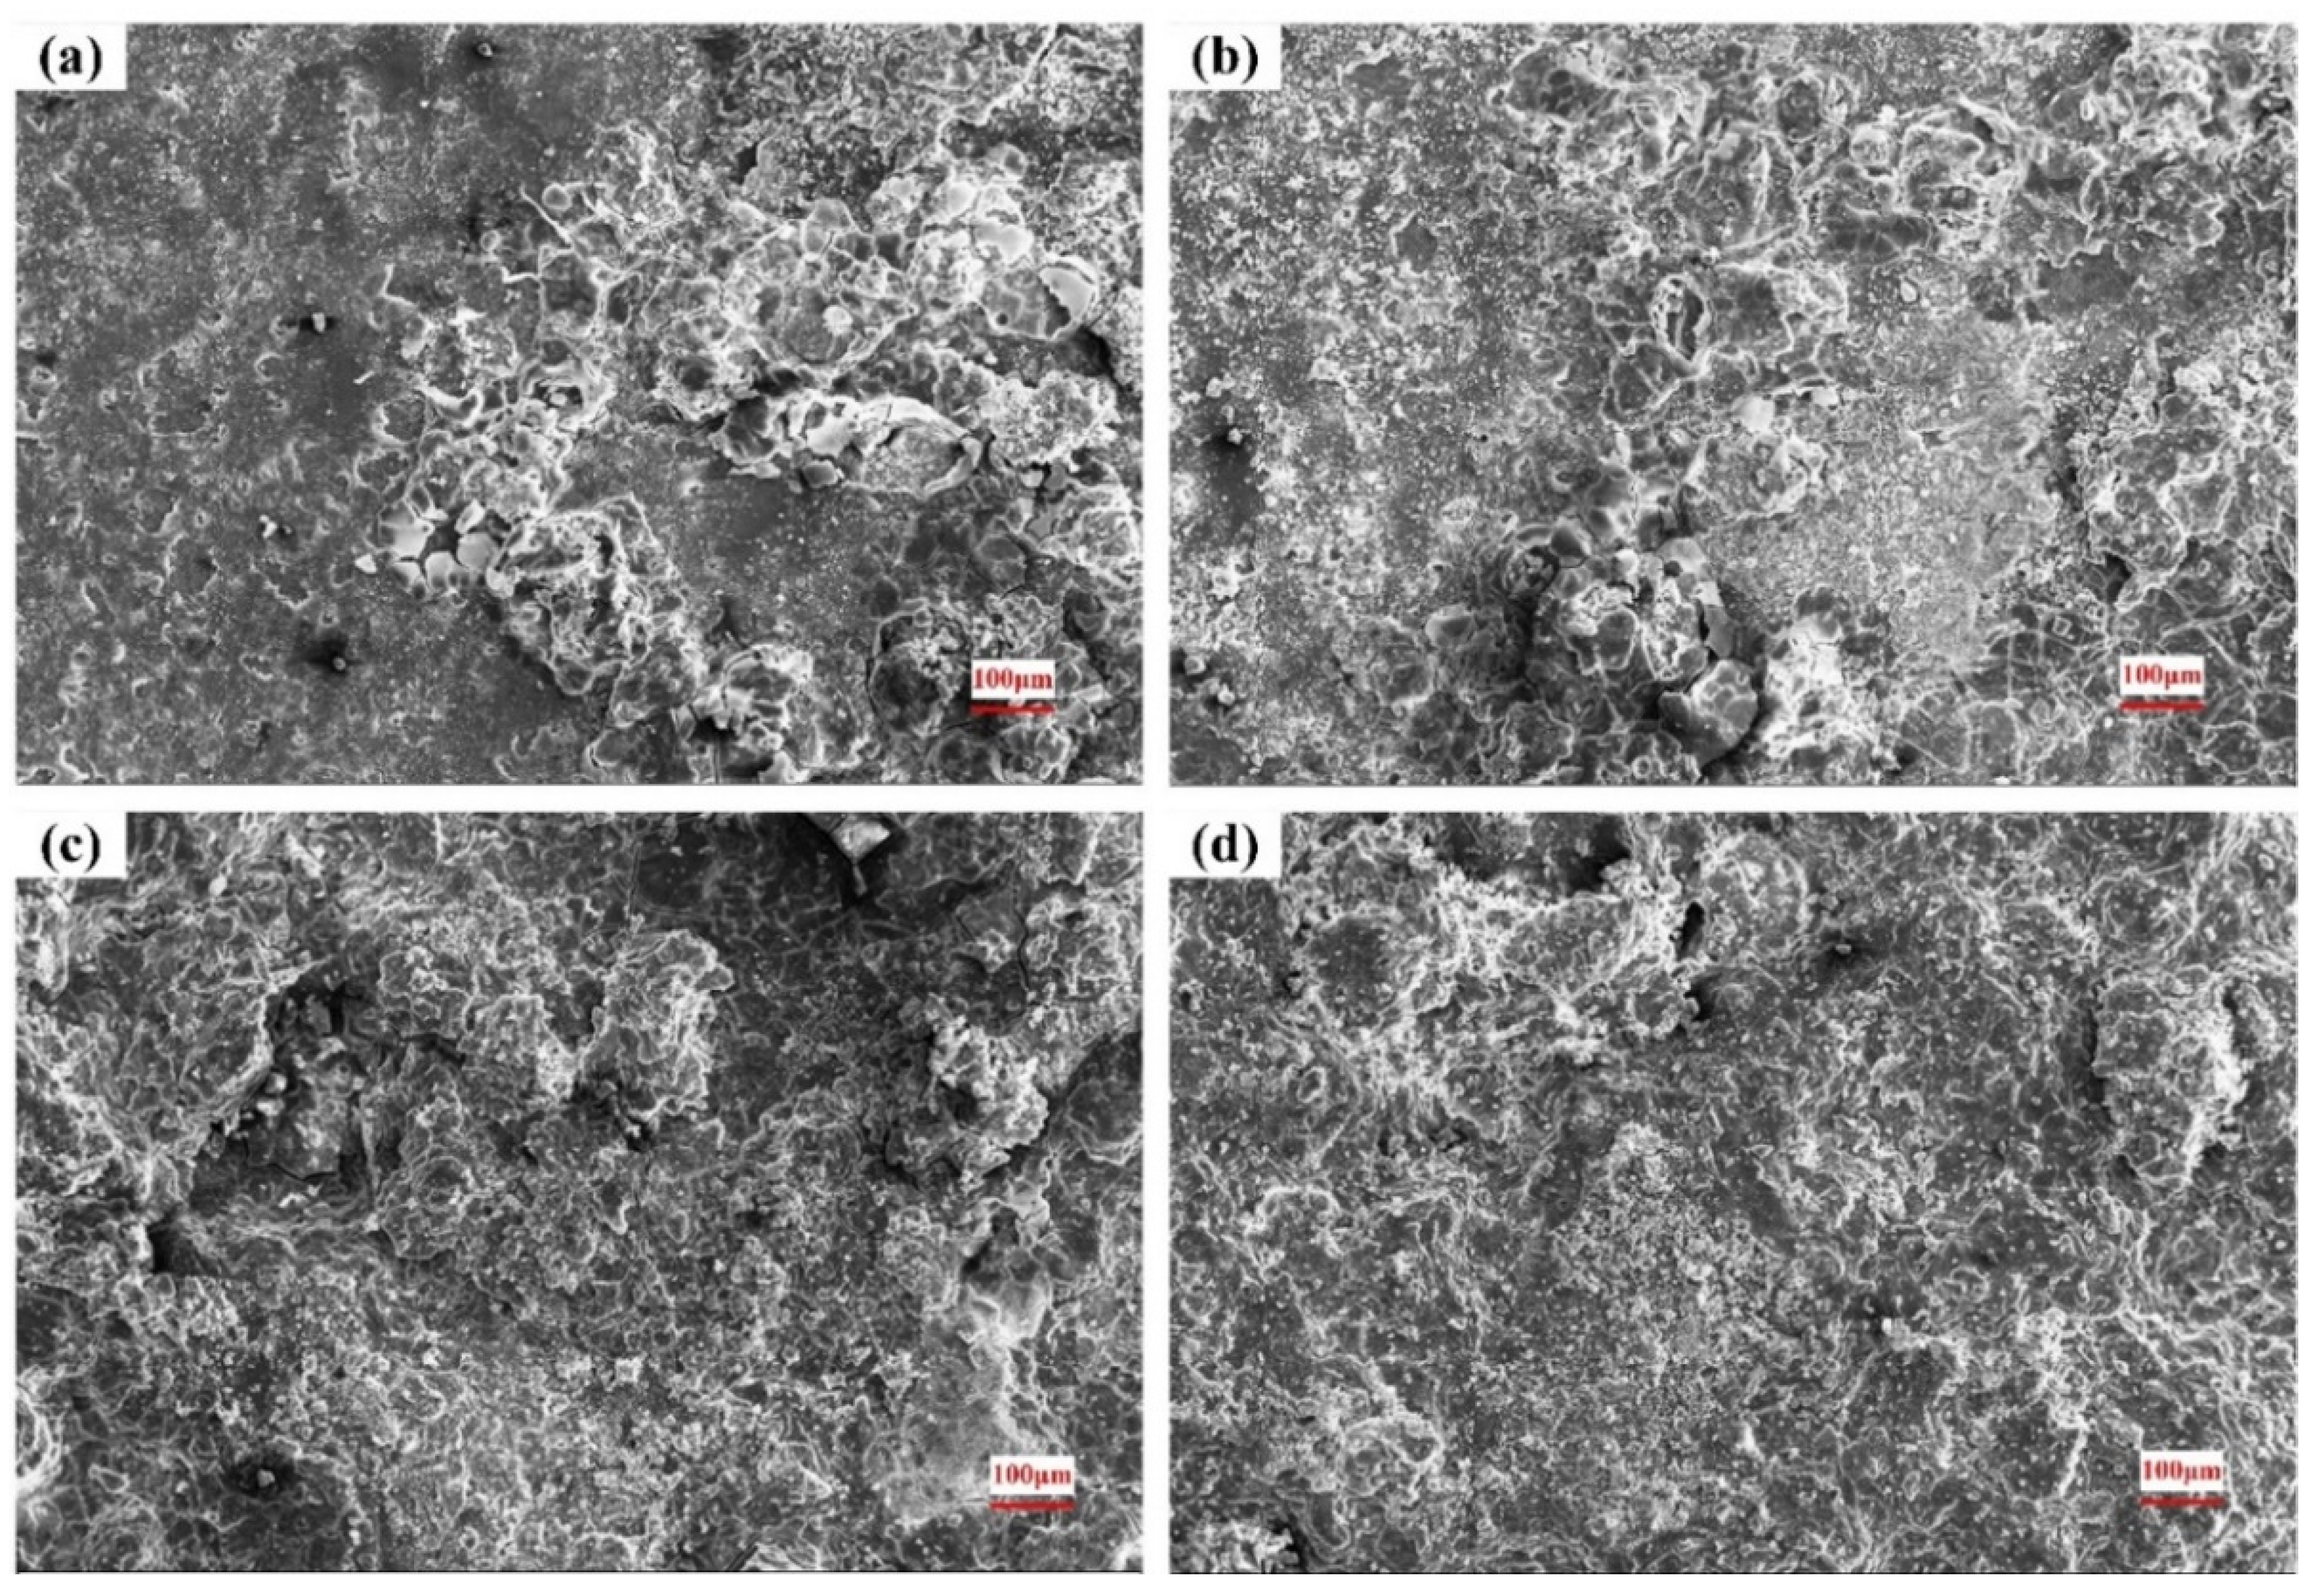
3.4. Surface of the Corroded Alloys
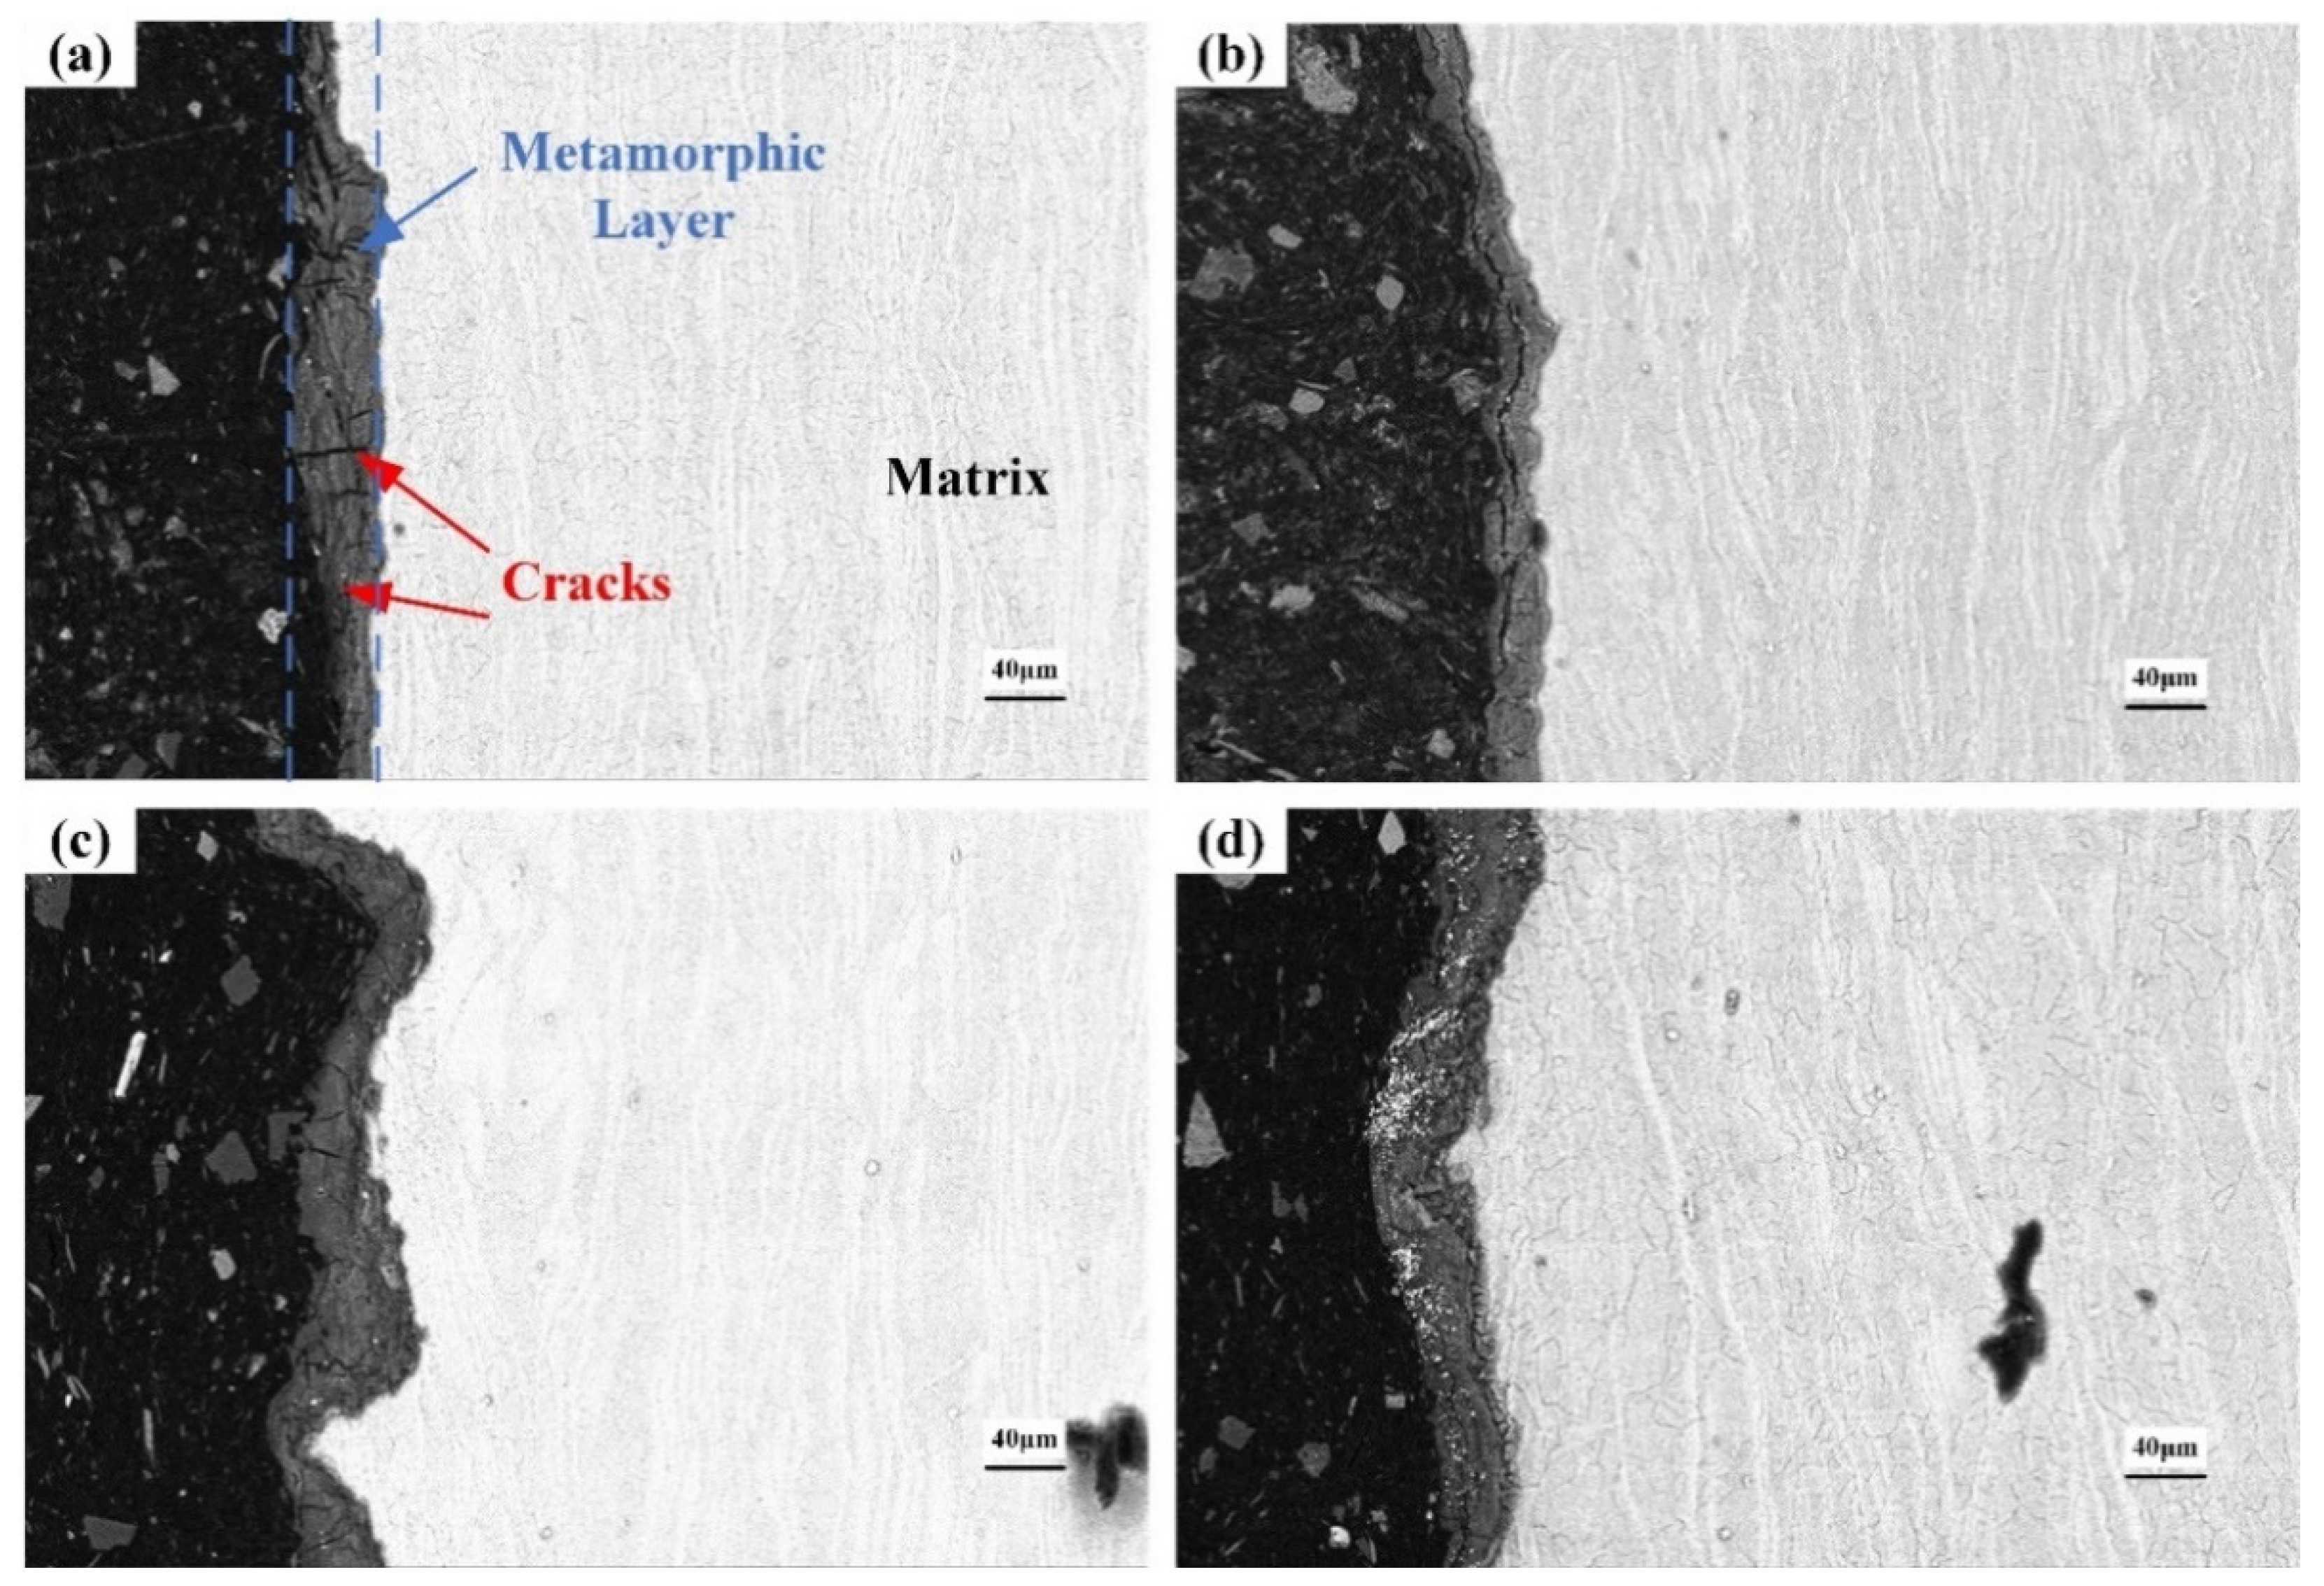
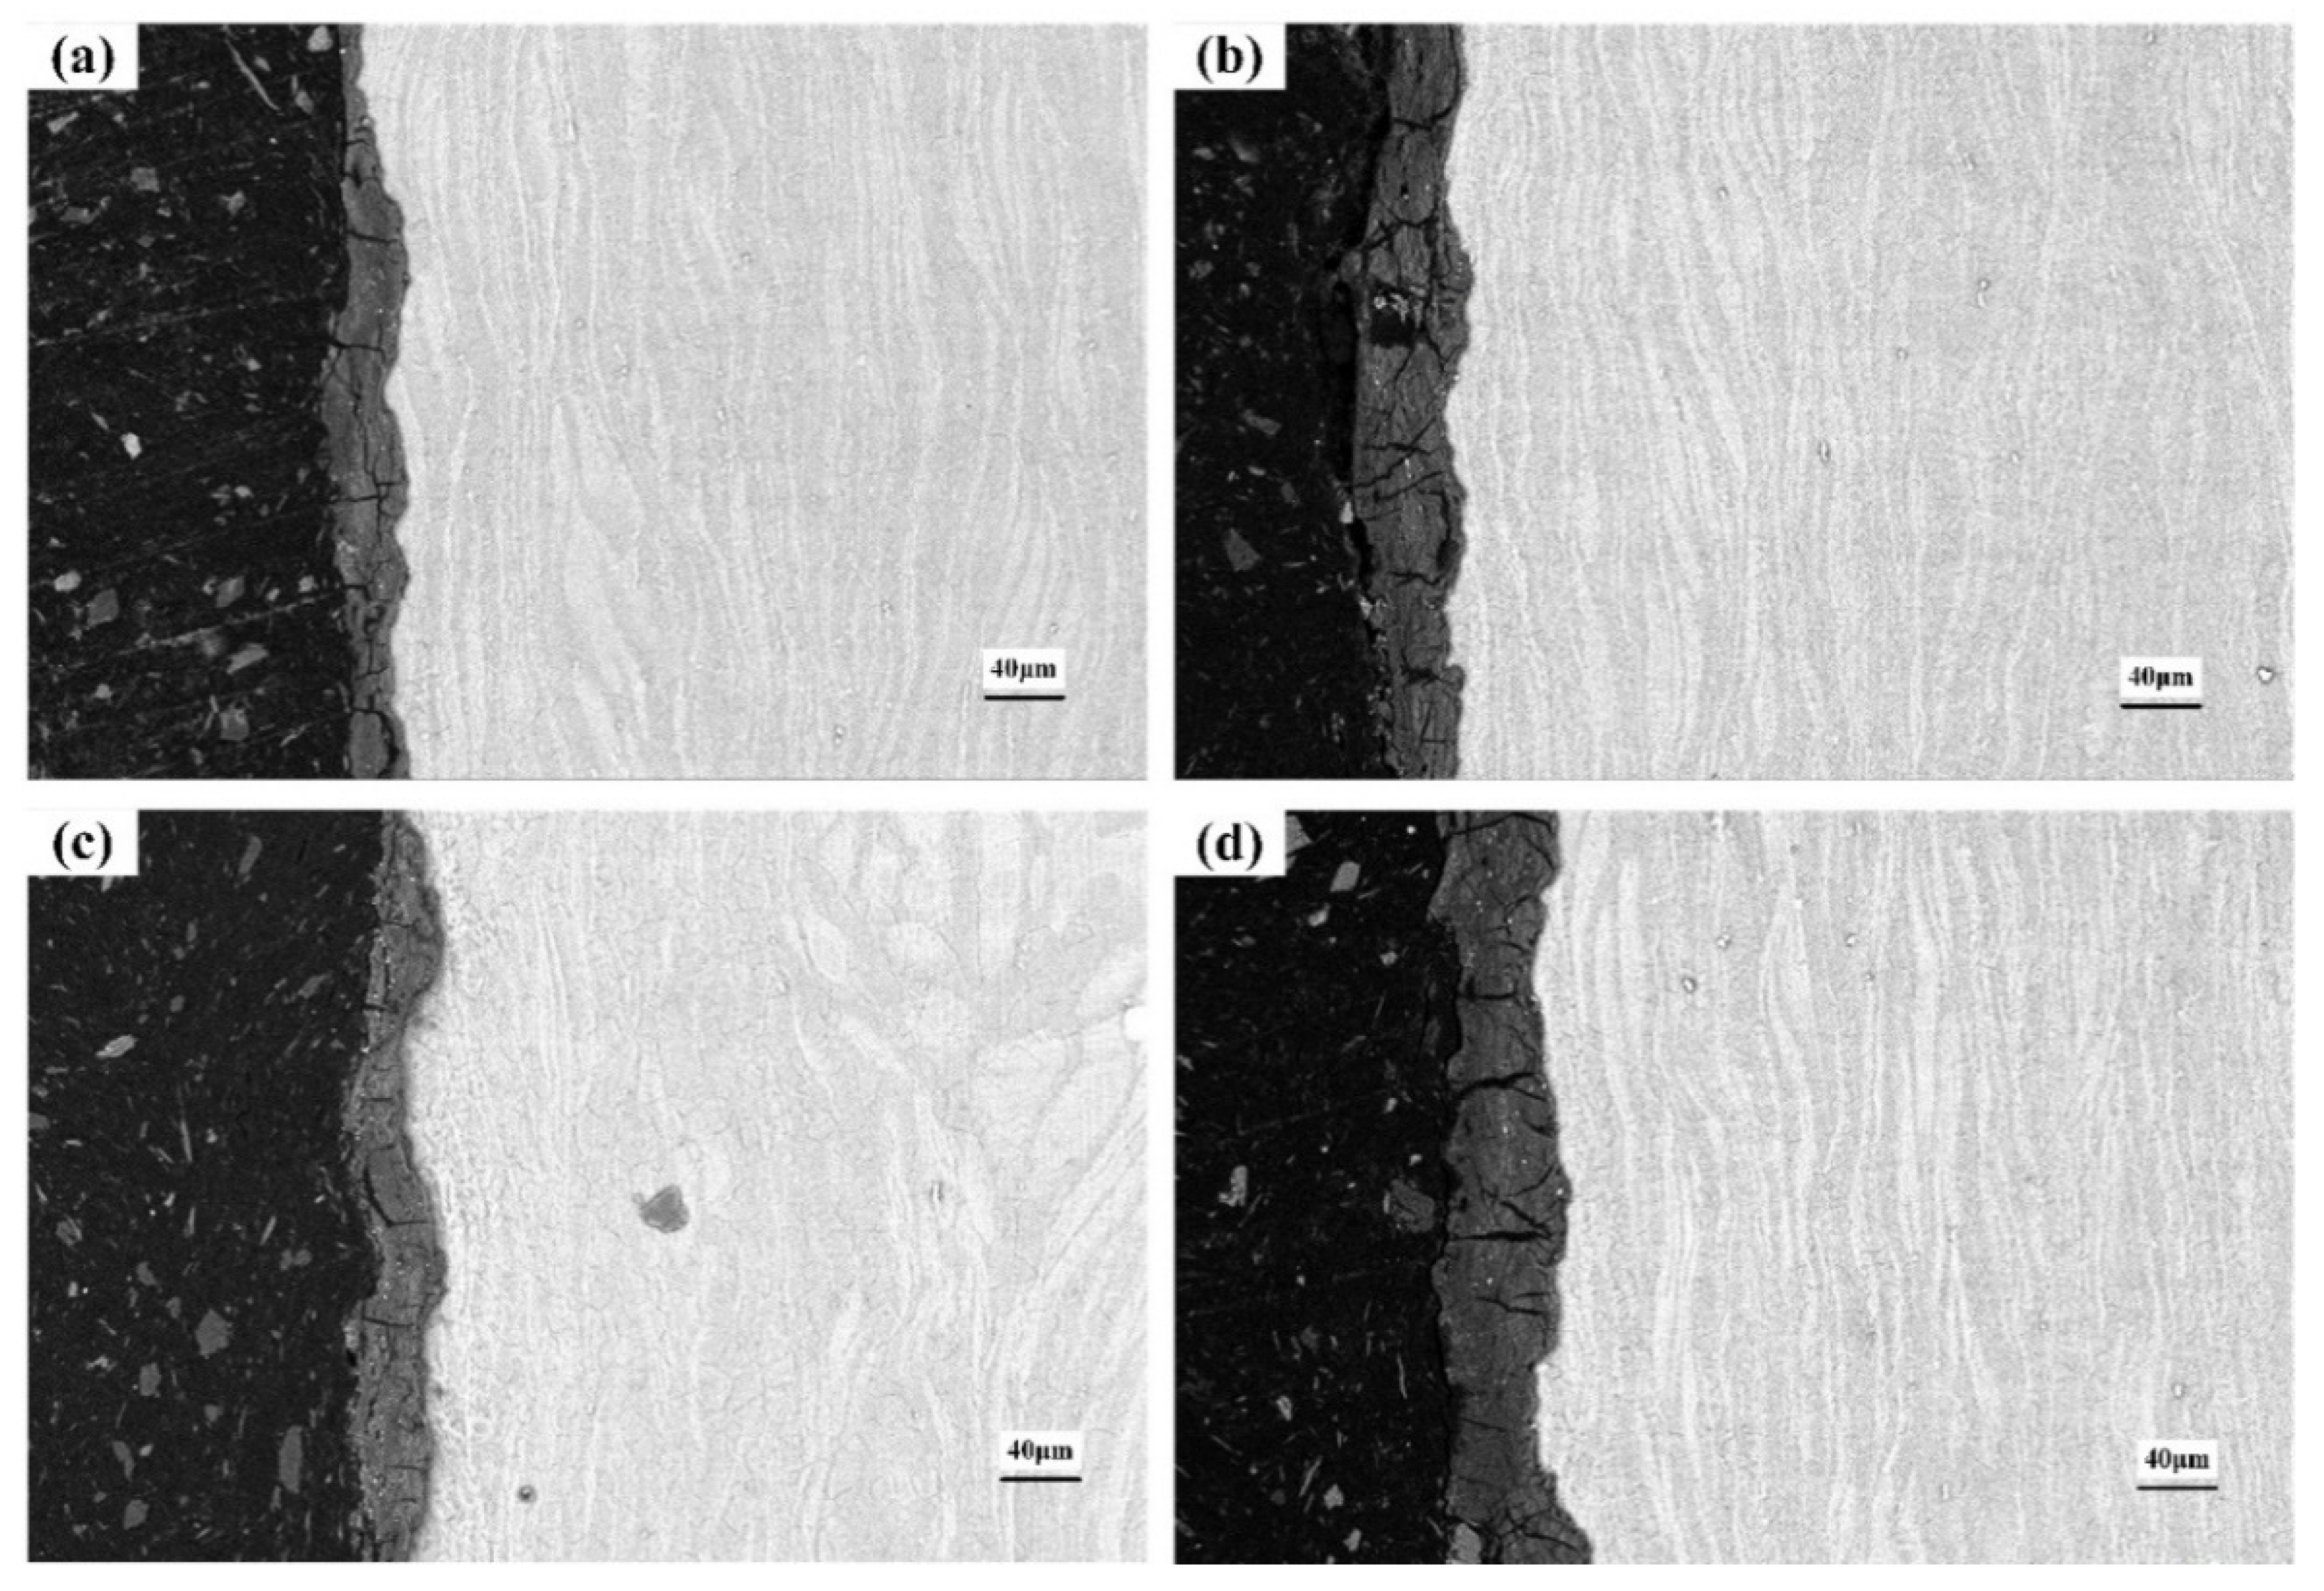
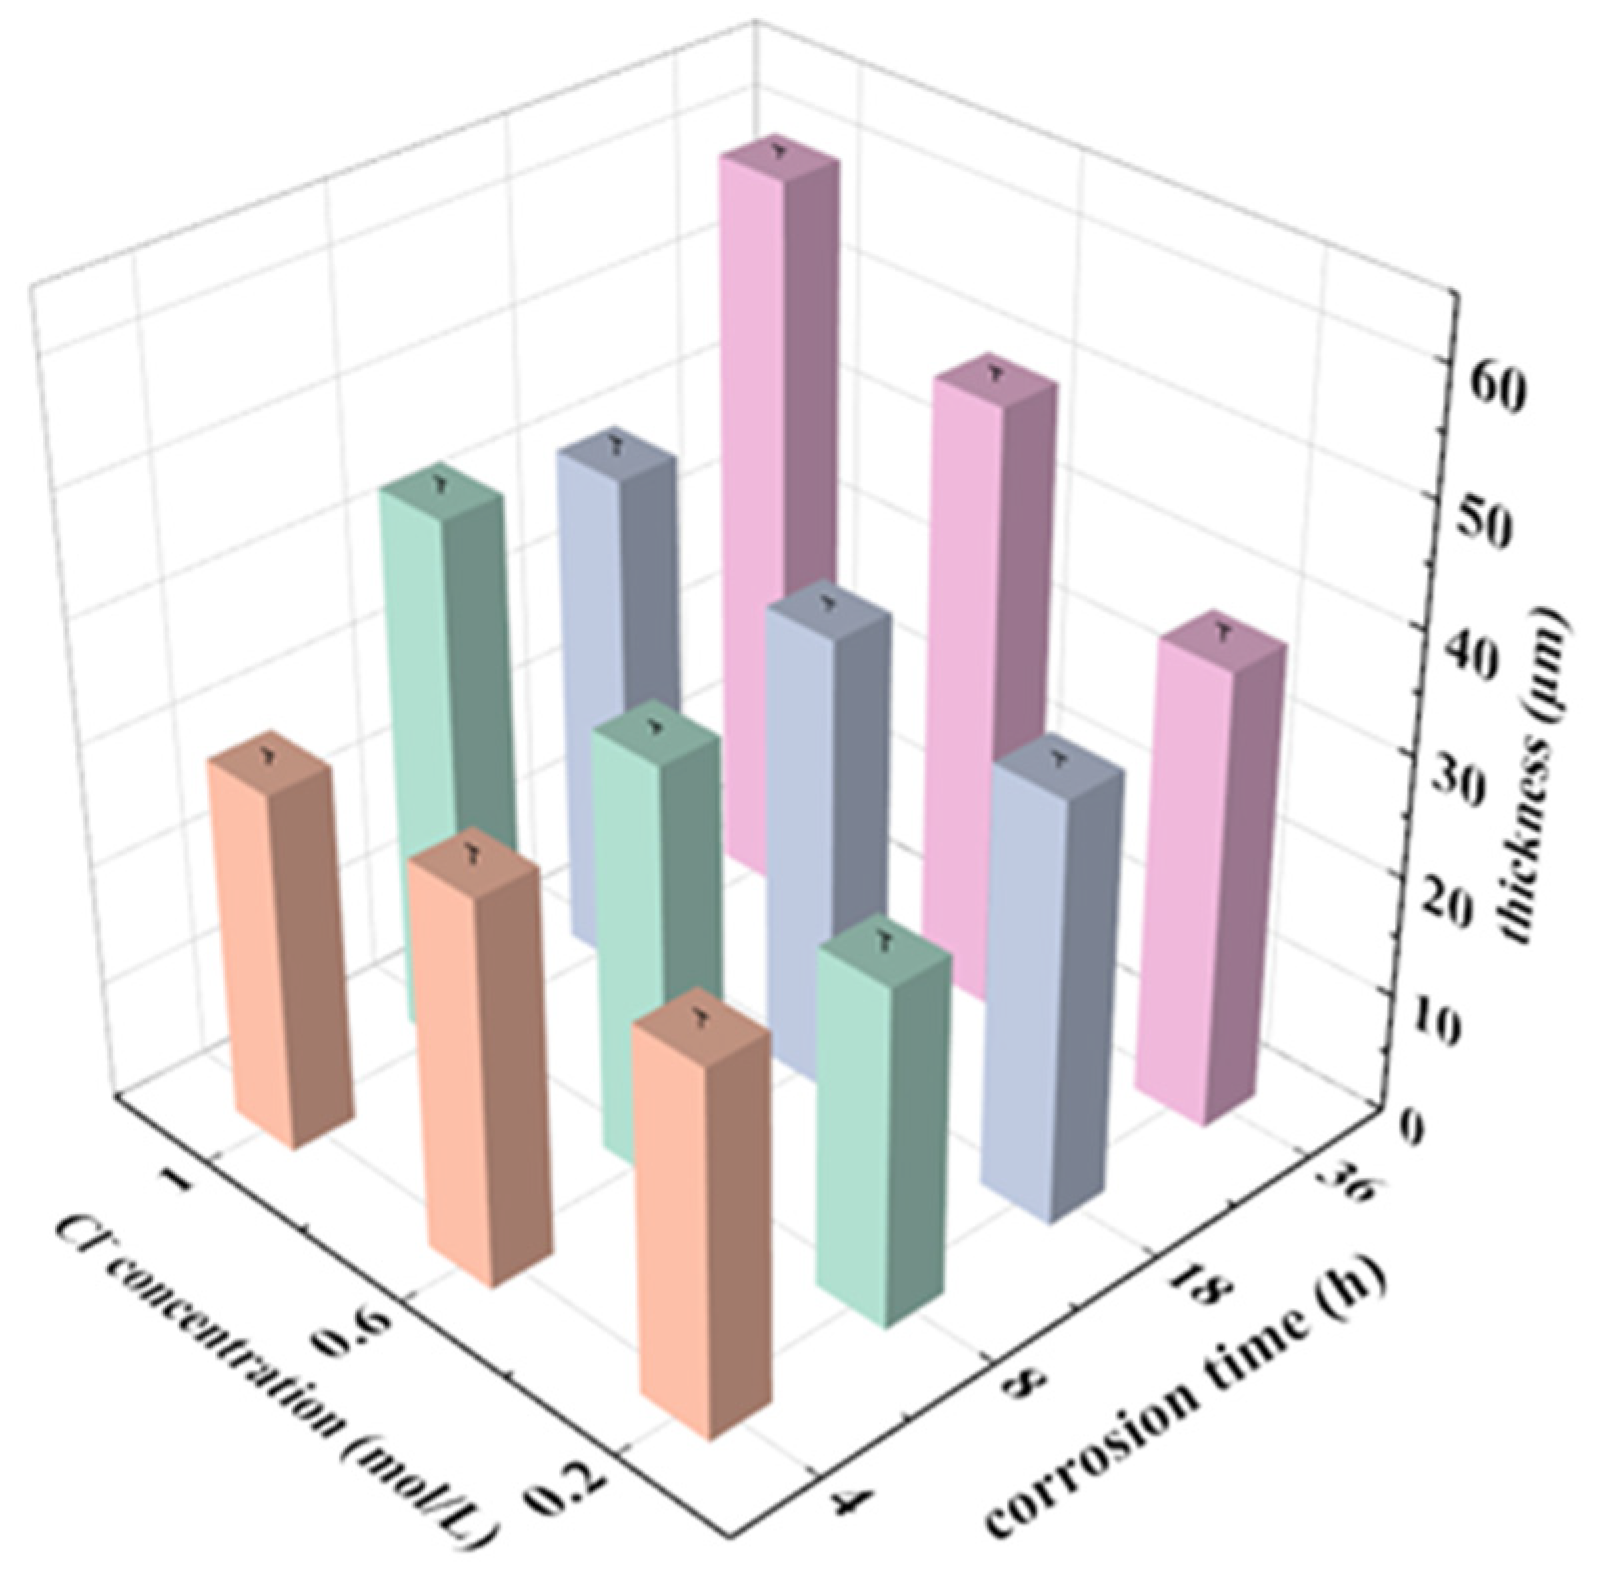
3.5. Cross-Section of the Corroded Alloys
4. Discussion
4.1. Corrosion Tendency
4.2. Corrosion Behavior and Mechanism
5. Conclusions
- (1)
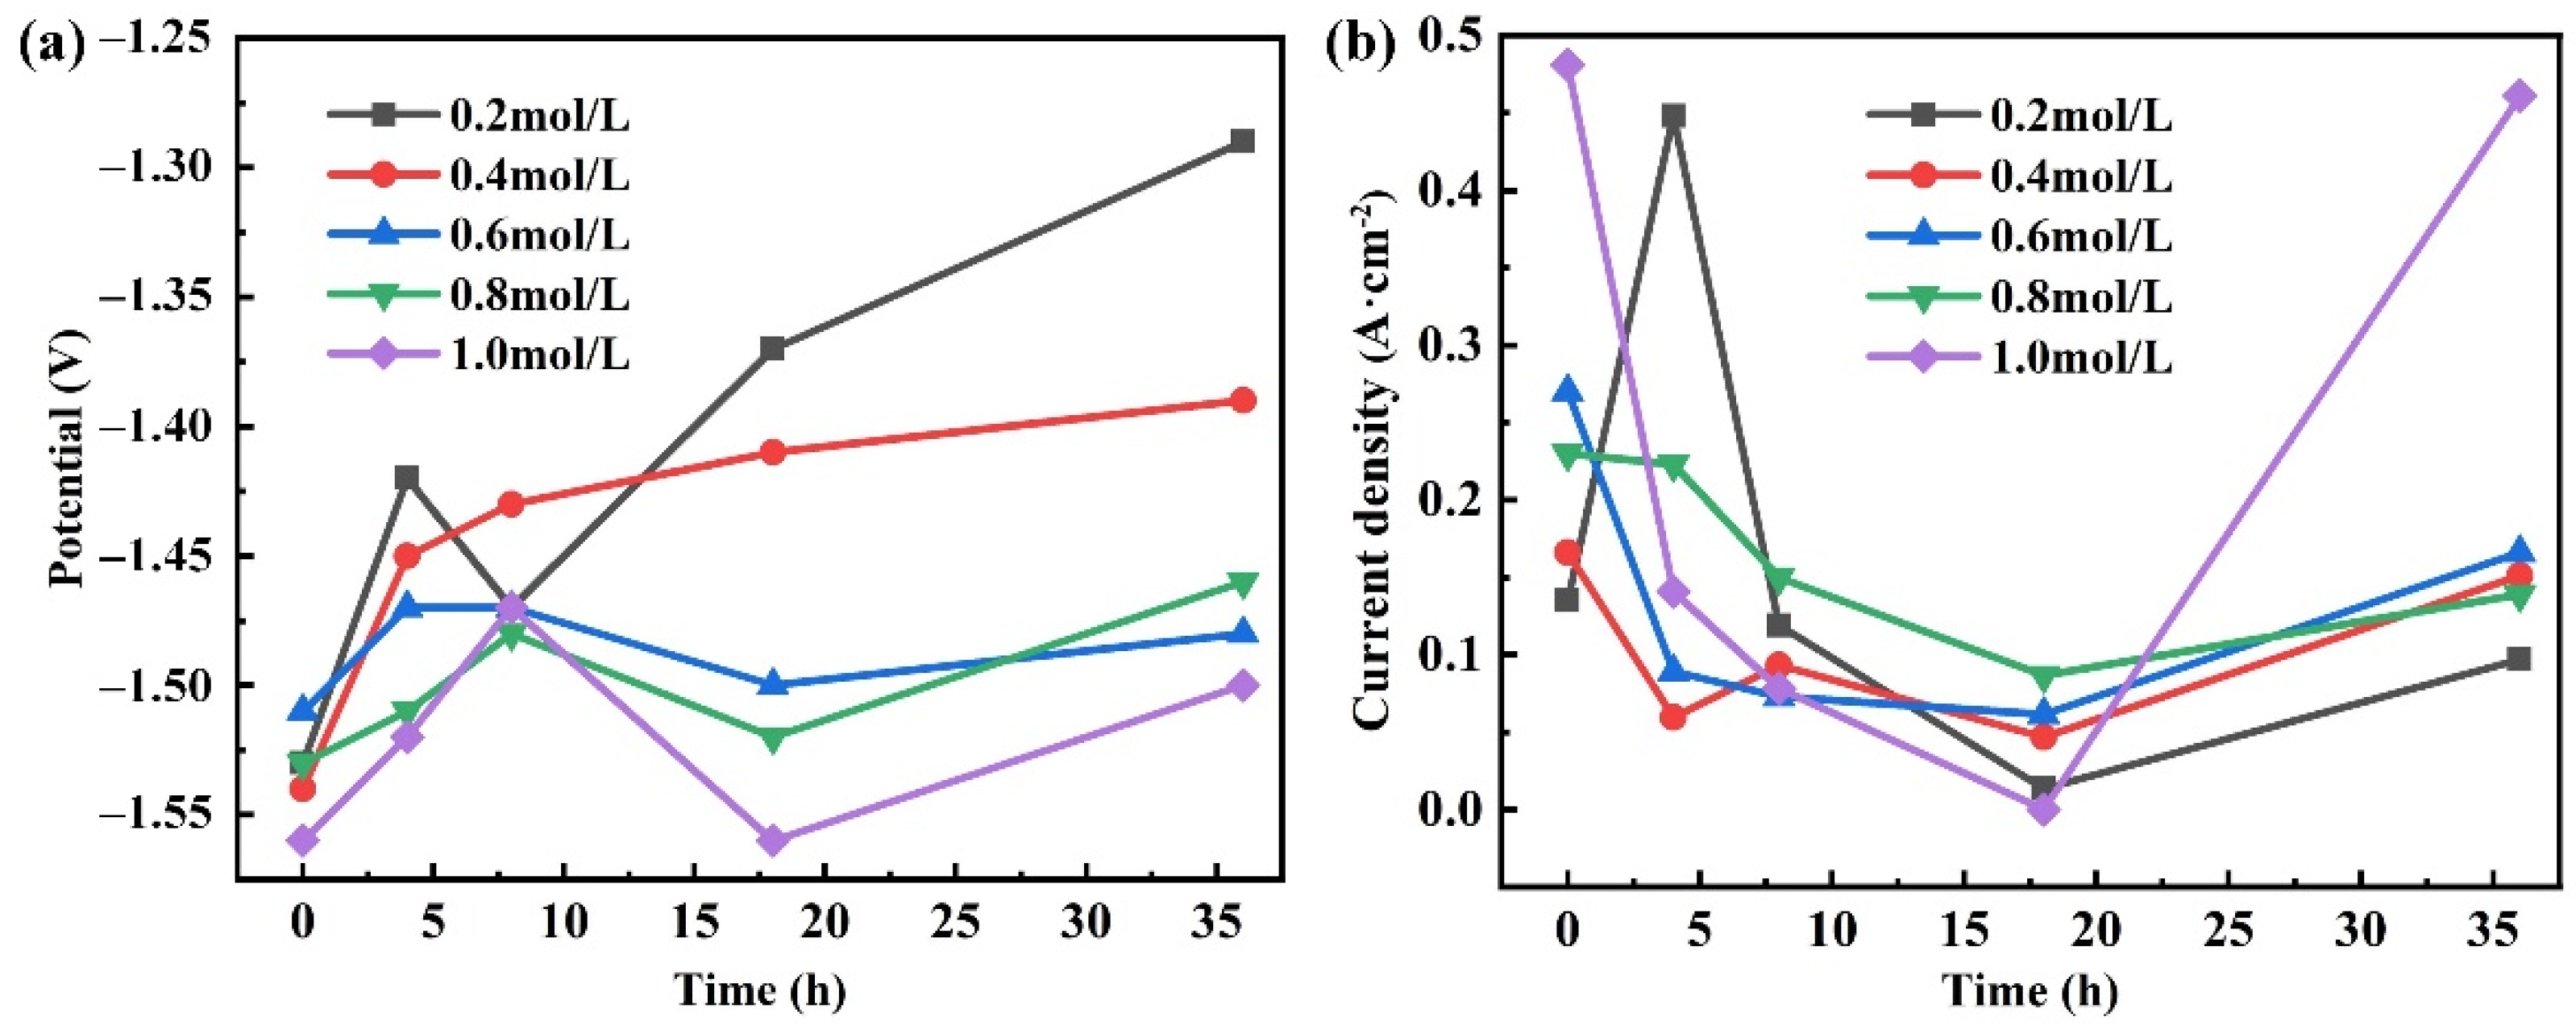
- With the increase of the concentration of corrosive medium and the number of material surface defects, the corrosion tendency becomes stronger.
- (2)
- The corrosion current density decreases and tends to be stable with the increase of duration due to the obstruction of the surface oxide film.
- (3)
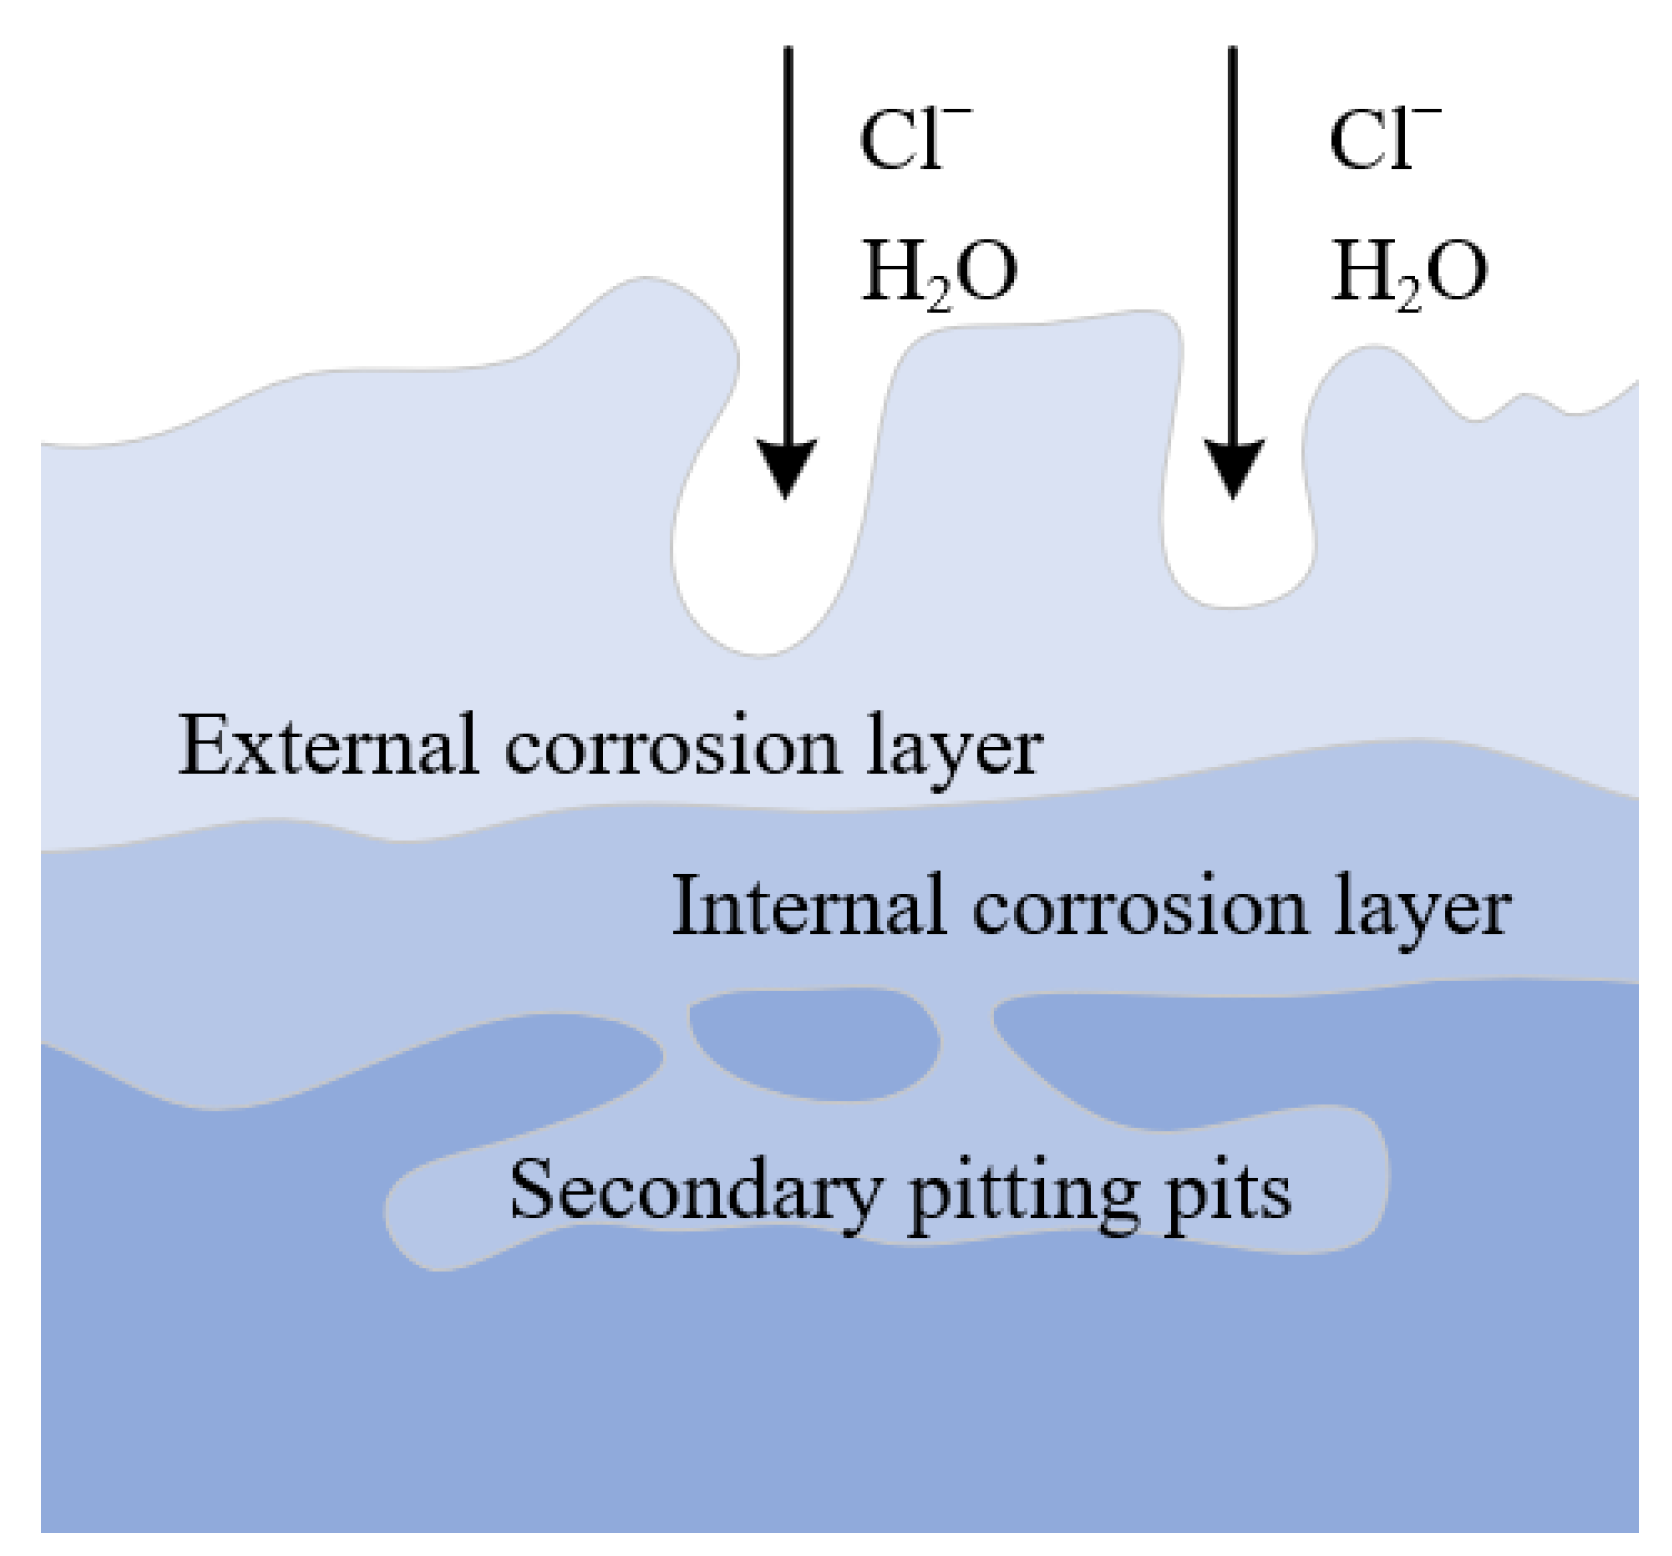
- Corrosion expands along grain boundaries and corrosion products fall off layer by layer along the rolled rheological layer.
- (4)
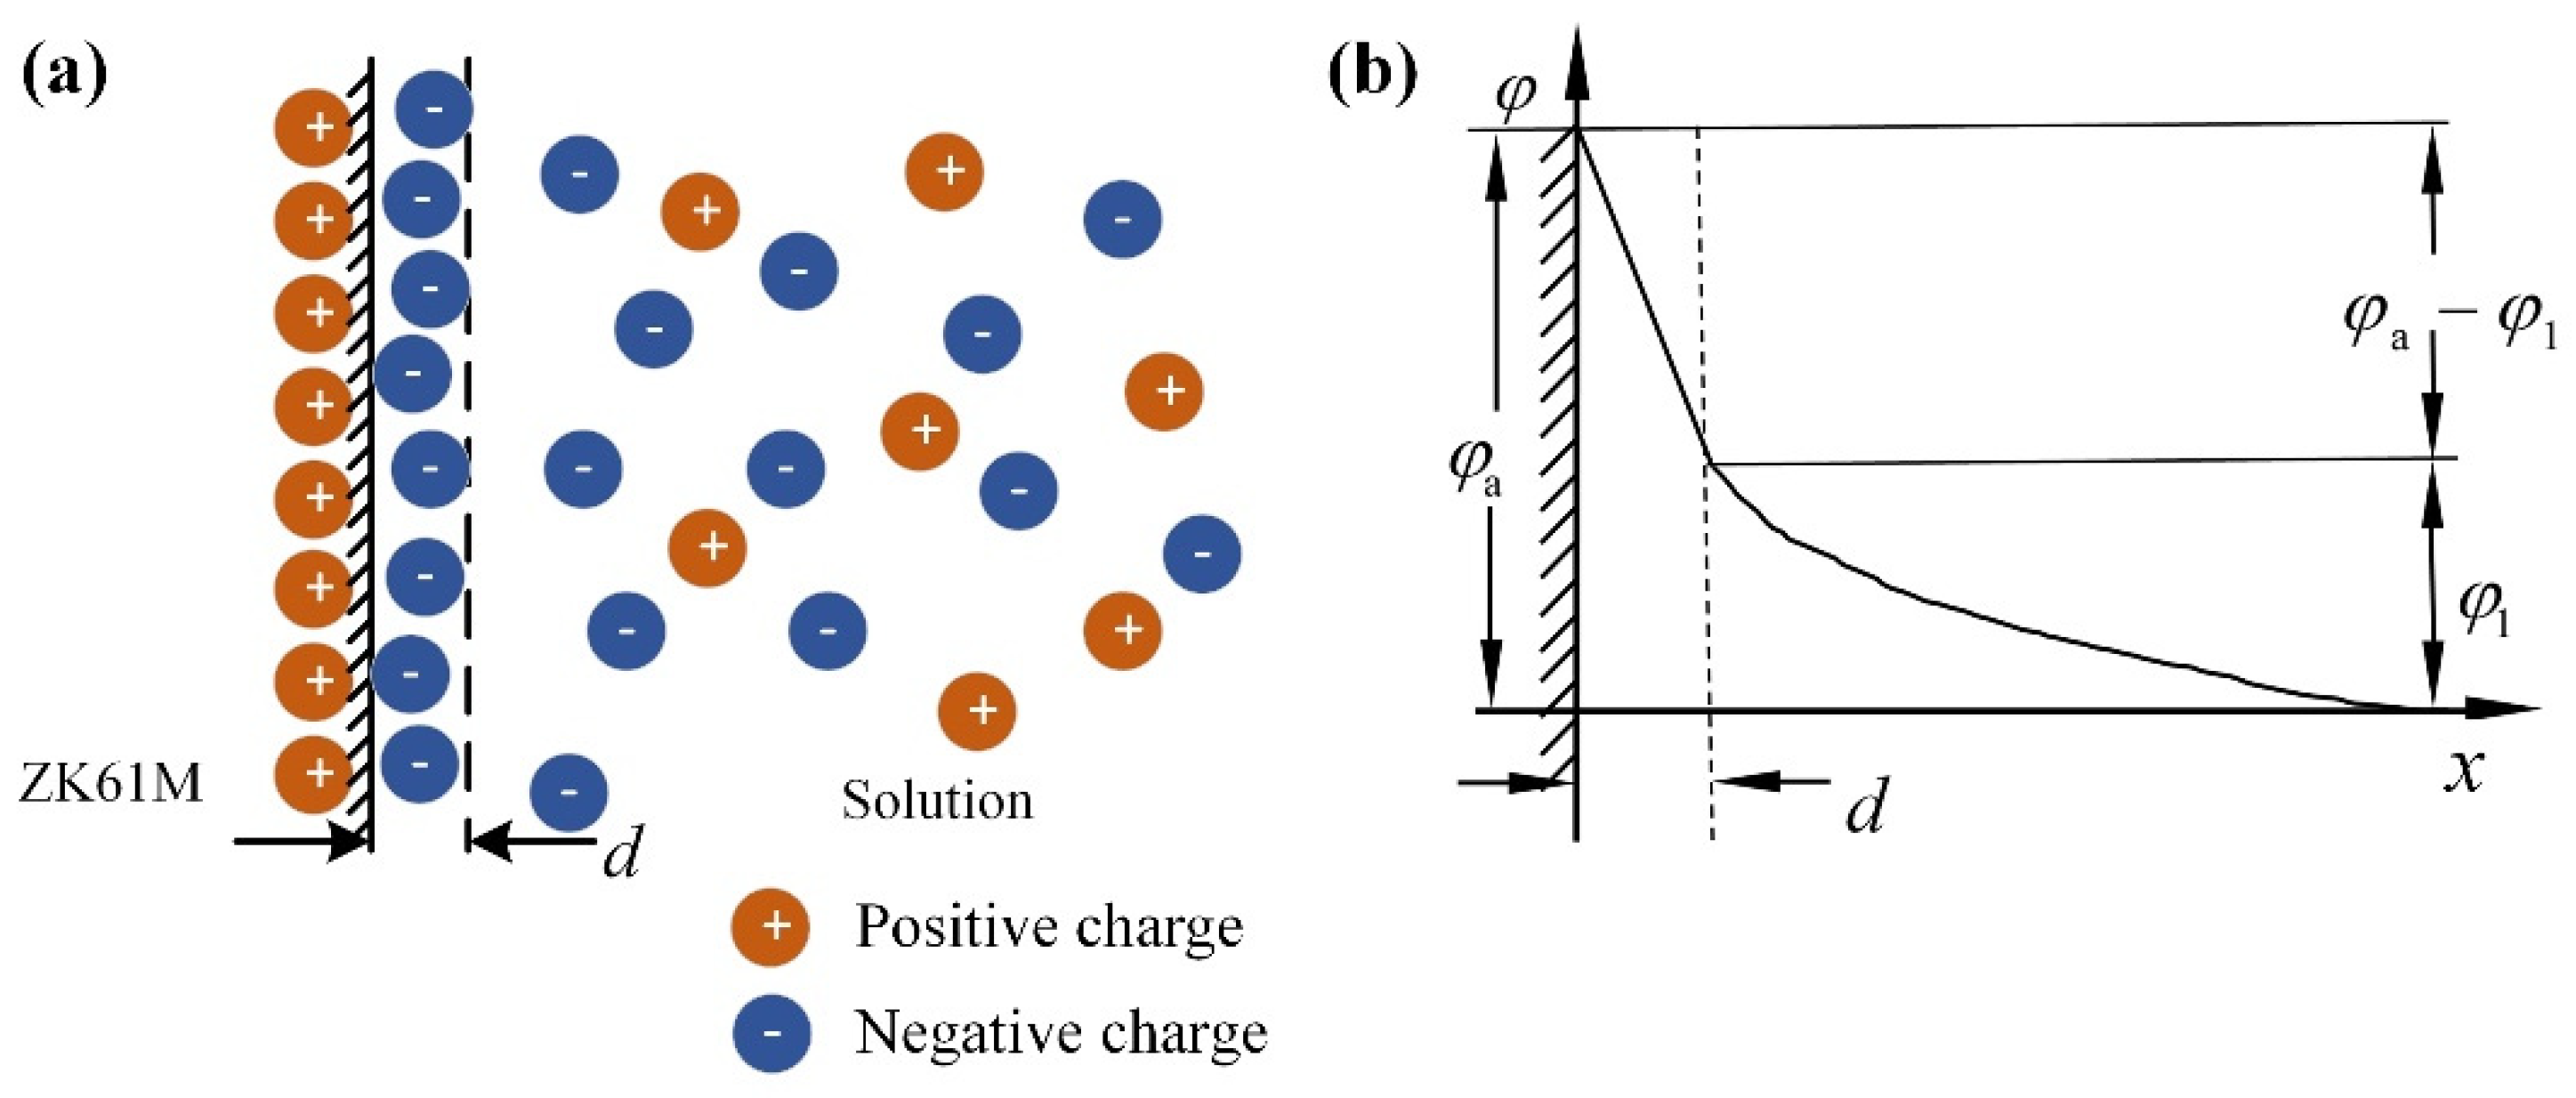
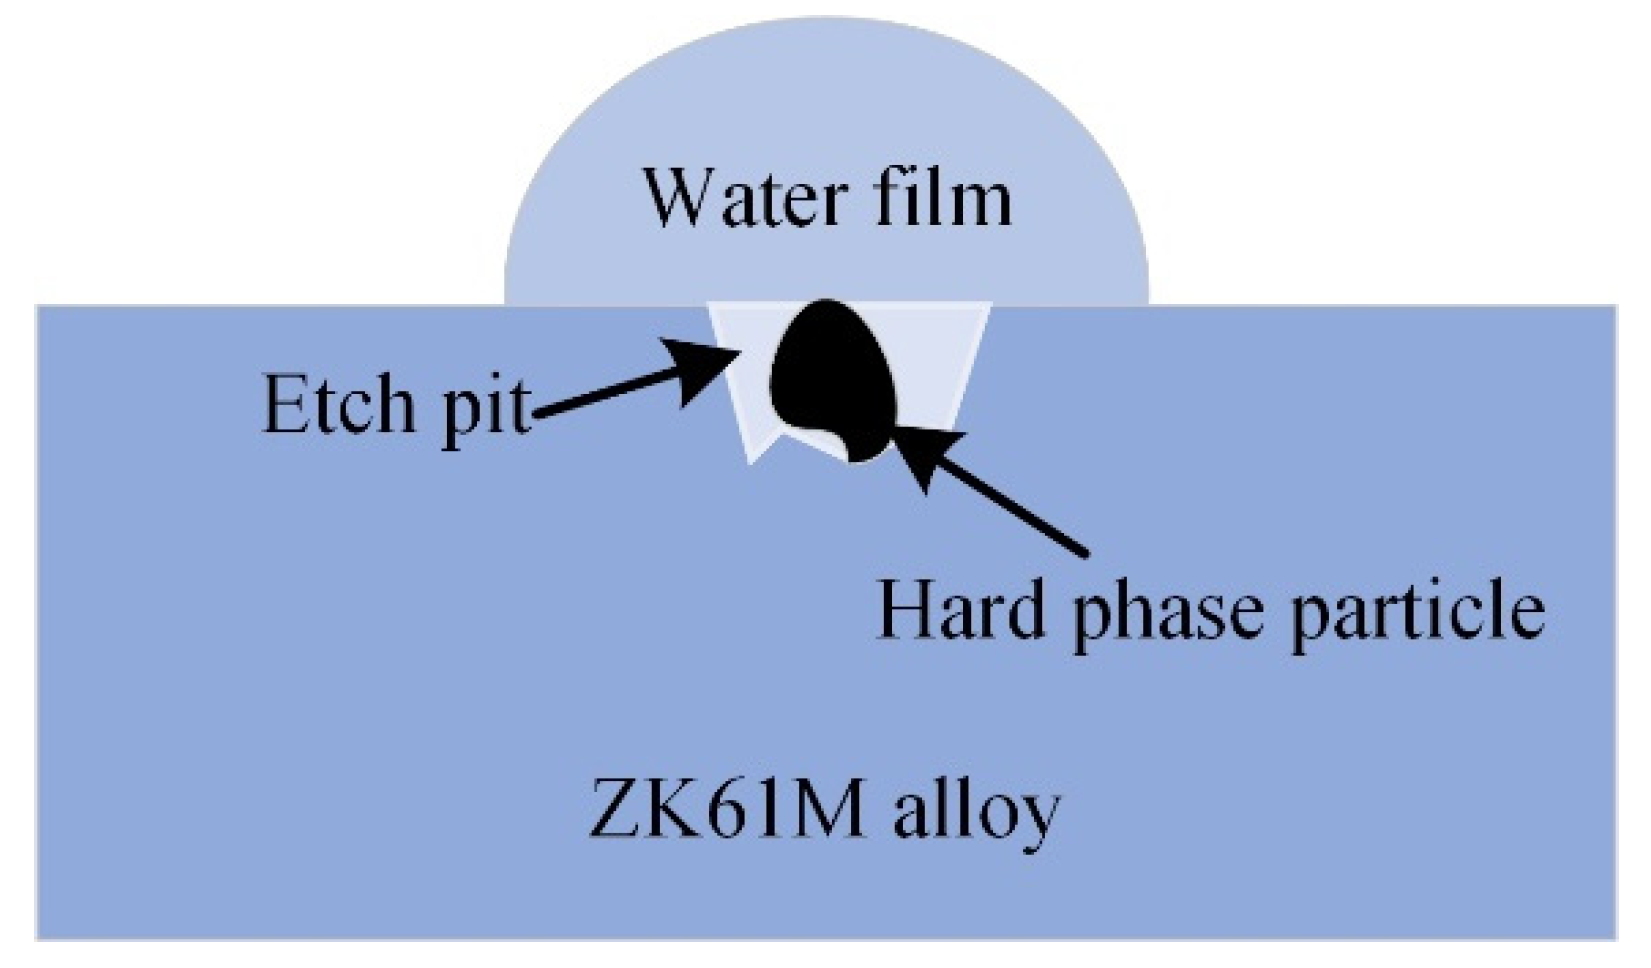
- The corrosion is initially pitting caused by micro galvanic corrosion at the surface defect, and gradually changes into uniform corrosion. The oxidation corrosion mechanism is the anodic dissolution.
Author Contributions
Funding
Institutional Review Board Statement
Informed Consent Statement
Data Availability Statement
Conflicts of Interest
References
- Joost, W.J.; Krajewski, P.E. Towards magnesium alloys for high-volume automotive applications. Scr. Mater. 2017, 128, 107–112. [Google Scholar] [CrossRef]
- Mordike, B.L.; Ebert, T. Magnesium: Properties—applications—potential. Mater. Sci. Eng. A 2001, 302, 37–45. [Google Scholar] [CrossRef]
- Pan, H.C.; Ren, Y.P.; Fu, H.; Zhao, H.; Wang, L.Q.; Meng, X.Y.; Qin, G.W. Recent developments in rare-earth free wrought magnesium alloys having high strength: A review. J. Alloy. Compd. 2016, 663, 321–331. [Google Scholar] [CrossRef]
- Wang, X.J.; Xu, D.K.; Wu, R.Z.; Chen, X.B.; Peng, Q.M.; Jin, L.; Xin, Y.C.; Zhang, Z.Q.; Liu, Y.; Chen, X.H.; et al. What is going on in magnesium alloys? J. Mater. Sci. Technol. 2018, 34, 245–247. [Google Scholar] [CrossRef]
- Li, Z.G.; Yang, H.F.; Liu, J.G. Comparative study on yield behavior and non-associated yield criteria of AZ31B and ZK61 M magnesium alloys. Mater. Sci. Eng. A-Struct. Mater. Prop. Microstruct. Process. 2019, 759, 329–345. [Google Scholar] [CrossRef]
- You, S.H.; Huang, Y.D.; Kainer, K.U.; Hort, N. Recent research and developments on wrought magnesium alloys. J. Magnes. Alloy. 2017, 5, 239–253. [Google Scholar] [CrossRef]
- Xu, T.C.; Yang, Y.; Peng, X.D.; Song, J.F.; Pan, F.S. Overview of advancement and development trend on magnesium alloy. J. Magnes. Alloy. 2019, 7, 536–544. [Google Scholar] [CrossRef]
- Atrens, A.; Song, G.L.; Liu, M.; Shi, Z.M.; Cao, F.Y.; Dargusch, M.S. Review of Recent Developments in the Field of Magnesium Corrosion. Adv. Eng. Mater. 2015, 17, 400–453. [Google Scholar] [CrossRef]
- Sezer, N.; Evis, Z.; Kayhan, S.M.; Tahmasebifar, A.; Koc, M. Review of magnesium-based biomaterials and their applications. J. Magnes. Alloy. 2018, 6, 23–43. [Google Scholar] [CrossRef]
- Zhao, M.C.; Liu, M.; Song, G.L.; Atrens, A. Influence of the beta-phase morphology on the corrosion of the Mg alloy AZ91. Corros. Sci. 2008, 50, 1939–1953. [Google Scholar] [CrossRef]
- Esmaily, M.; Svensson, J.E.; Fajardo, S.; Birbilis, N.; Frankel, G.S.; Virtanen, S.; Arrabal, R.; Thomas, S.; Johansson, L.G. Fundamentals and advances in magnesium alloy corrosion. Prog. Mater. Sci. 2017, 89, 92–193. [Google Scholar] [CrossRef]
- Ghali, E.; Dietzel, W.; Kainer, K.U. General and Localized Corrosion of Magnesium Alloys: A Critical Review. J. Mater. Eng. Perform. 2013, 22, 2875–2891. [Google Scholar] [CrossRef]
- Song, G.L.; Atrens, A. Understanding magnesium corrosion—A framework for improved alloy performance. Adv. Eng. Mater. 2003, 5, 837–858. [Google Scholar] [CrossRef]
- Liu, L.J.; Schlesinger, M. Corrosion of magnesium and its alloys. Corros. Sci. 2009, 51, 1733–1737. [Google Scholar] [CrossRef]
- Cui, Z.Y.; Li, X.G.; Xiao, K.; Dong, C.F. Atmospheric corrosion of field-exposed AZ31 magnesium in a tropical marine environment. Corros. Sci. 2013, 76, 243–256. [Google Scholar] [CrossRef]
- Xin, R.L.; Li, B.; Li, L.; Liu, Q. Influence of texture on corrosion rate of AZ31 Mg alloy in 3.5 wt.% NaCl. Mater. Des. 2011, 32, 4548–4552. [Google Scholar] [CrossRef]
- Nordlien, J.H.; Nisancioglu, K.; Ono, S.; Masuko, N. Morphology and structure of oxide films formed on MgAl alloys by exposure to air and water. J. Electrochem. Soc. 1996, 143, 2564–2572. [Google Scholar] [CrossRef]
- Montemor, M.F.; Simoes, A.M.; Ferreira, M.G.S.; Carmezim, M.J. Composition and corrosion resistance of cerium conversion films on the AZ31 magnesium alloy and its relation to the salt anion. Appl. Surf. Sci. 2008, 254, 1806–1814. [Google Scholar] [CrossRef]
- Cui, Z.; Zhang, Y.; Cheng, Y.; Gong, D.; Wang, W. Microstructure, mechanical, corrosion properties and cytotoxicity of beta-calcium polyphosphate reinforced ZK61 magnesium alloy composite by spark plasma sintering. Mater. Sci. Eng. C 2019, 99, 1035–1047. [Google Scholar] [CrossRef]
- Pu, Z.; Song, G.L.; Yang, S.; Outeiro, J.C.; Dillon, O.W., Jr.; Puleo, D.A.; Jawahir, I.S. Grain refined and basal textured surface produced by burnishing for improved corrosion performance of AZ31B Mg alloy. Corros. Sci. 2012, 57, 192–201. [Google Scholar] [CrossRef]
- Song, D.; Ma, A.B.; Jiang, J.H.; Lin, P.H.; Yang, D.H.; Fan, J.F. Corrosion behavior of equal-channel-angular-pressed pure magnesium in NaCl aqueous solution. Corros. Sci. 2010, 52, 481–490. [Google Scholar] [CrossRef]
- Fajardo, S.; Frankel, G.S. Effect of impurities on the enhanced catalytic activity for hydrogen evolution in high purity magnesium. Electrochim. Acta 2015, 165, 255–267. [Google Scholar] [CrossRef]
- Song, G.; Atrens, A.; St John, D.; Wu, X.; Nairn, J. The anodic dissolution of magnesium in chloride and sulphate solutions. Corros. Sci. 1997, 39, 1981–2004. [Google Scholar] [CrossRef]
- Song, G.L.; Atrens, A.; Dargusch, M. Influence of microstructure on the corrosion of diecast AZ91D. Corros. Sci. 1999, 41, 249–273. [Google Scholar] [CrossRef]
- Cowan, K.G.; Harrison, J.A. Dissolution of magnesium in Cl- and F- containing aqueous-solutions. Electrochim. Acta 1979, 24, 301–308. [Google Scholar] [CrossRef]
- Mathieu, S.; Rapin, C.; Steinmetz, J.; Steinmetz, P. A corrosion study of the main constituent phases of AZ91 magnesium alloys. Corros. Sci. 2003, 45, 2741–2755. [Google Scholar] [CrossRef]
- Petty, R.L.; Davidson, A.W.; Kleinberg, J. The anodic oxidation of magnesium metal—Evidence for the existence of unipositive magnesium. J. Am. Chem. Soc. 1954, 76, 363–366. [Google Scholar] [CrossRef]
- Makar, G.L.; Kruger, J. Corrosion studies of rapidly solidified magnesium alloys. J. Electrochem. Soc. 1990, 137, 414–421. [Google Scholar] [CrossRef]
- Tunold, R.; Holtan, H.; Haggberge, M.B.; Lasson, A.; Steenhansen, R. Corrosion of magnesium in aqueous-solution containing chloride-ions. Corros. Sci. 1977, 17, 353–365. [Google Scholar] [CrossRef]
- Abbott, T.B. Magnesium: Industrial and Research Developments Over the Last 15 Years. Corrosion 2015, 71, 120–127. [Google Scholar] [CrossRef]
- Maric, M.; Muransky, O.; Karatchevtseva, I.; Ungar, T.; Hester, J.; Studer, A.; Scales, N.; Ribarik, G.; Primig, S.; Hill, M.R. The effect of cold-rolling on the microstructure and corrosion behaviour of 316L alloy in FLiNaK molten salt. Corros. Sci. 2018, 142, 133–144. [Google Scholar] [CrossRef]
- Zhang, C.; Wu, L.; Liu, H.; Huang, G.S.; Jiang, B.; Atrens, A.; Pan, F.S. Microstructure and corrosion behavior of Mg-Sc binary alloys in 3.5 wt.% NaCl solution. Corros. Sci. 2020, 174, 12. [Google Scholar] [CrossRef]
- Deng, Z.F.; Zhang, Z.A.; Lai, Y.Q.; Liu, J.; Li, J.; Liu, Y.X. Electrochemical Impedance Spectroscopy Study of a Lithium/Sulfur Battery: Modeling and Analysis of Capacity Fading. J. Electrochem. Soc. 2013, 160, A553–A558. [Google Scholar] [CrossRef]
- Taheri, M.; Kish, J.R.; Birbilis, N.; Danaie, M.; McNally, E.A.; McDermid, J.R. Towards a Physical Description for the Origin of Enhanced Catalytic Activity of Corroding Magnesium Surfaces. Electrochim. Acta 2014, 116, 396–403. [Google Scholar] [CrossRef]
- Birbilis, N.; King, A.D.; Thomas, S.; Frankel, G.S.; Scully, J.R. Evidence for enhanced catalytic activity of magnesium arising from anodic dissolution. Electrochim. Acta 2014, 132, 277–283. [Google Scholar] [CrossRef]
- Thomaz, T.R.; Weber, C.R.; Pelegrini, T.; Dick, L.F.P.; Knornschild, G. The negative difference effect of magnesium and of the AZ91 alloy in chloride and stannate-containing solutions. Corros. Sci. 2010, 52, 2235–2243. [Google Scholar] [CrossRef]
- Zhang, Y.J.; Yan, C.W.; Wang, F.H.; Li, W.F. Electrochemical behavior of anodized Mg alloy AZ91D in chloride containing aqueous solution. Corros. Sci. 2005, 47, 2816–2831. [Google Scholar] [CrossRef]
- Mahidashti, Z.; Ramezanzadeh, B. Influence of lanthanum as additive and post-treatment on the corrosion protection properties and surface morphology of mild steel chemically treated by a cerium conversion coating. J. Rare Earths 2018, 36, 1112–1120. [Google Scholar] [CrossRef]
- Kalb, H.; Rzany, A.; Hensel, B. Impact of microgalvanic corrosion on the degradation morphology of WE43 and pure magnesium under exposure to simulated body fluid. Corros. Sci. 2012, 57, 122–130. [Google Scholar] [CrossRef]
- Man, C.; Dong, C.; Wang, L.; Kong, D.; Li, X. Long-term corrosion kinetics and mechanism of magnesium alloy AZ31 exposed to a dry tropical desert environment. Corros. Sci. 2020, 163, 108274. [Google Scholar] [CrossRef]


| Zn | Zr | Mn | Impurity | Mg |
|---|---|---|---|---|
| 5~6 | 0.8~1 | 0.05 | <0.01 | Bal. |
| Number | 1 | 2 | 3 | 4 | 5 | 6 | 7 | |
|---|---|---|---|---|---|---|---|---|
| Element | ||||||||
| Mg | 92.01 | 88.07 | 91.81 | 94.83 | 94.97 | 95.61 | 93.32 | |
| Zn | 7.31 | 10.69 | 8.09 | 5.06 | 4.96 | 4.32 | 7.17 | |
| Zr | 0.67 | 1.24 | 0.09 | 0.11 | 0.07 | 0.06 | 0.51 | |
Publisher’s Note: MDPI stays neutral with regard to jurisdictional claims in published maps and institutional affiliations. |
© 2022 by the authors. Licensee MDPI, Basel, Switzerland. This article is an open access article distributed under the terms and conditions of the Creative Commons Attribution (CC BY) license (https://creativecommons.org/licenses/by/4.0/).
Share and Cite
Sun, J.; Zhao, W.; Yan, P.; Chen, K.; Jiao, L.; Qiu, T.; Wang, X. Effect of Corrosive Medium and Surface Defect-Energy on Corrosion Behavior of Rolled ZK61M Alloy. Materials 2022, 15, 4091. https://doi.org/10.3390/ma15124091
Sun J, Zhao W, Yan P, Chen K, Jiao L, Qiu T, Wang X. Effect of Corrosive Medium and Surface Defect-Energy on Corrosion Behavior of Rolled ZK61M Alloy. Materials. 2022; 15(12):4091. https://doi.org/10.3390/ma15124091
Chicago/Turabian StyleSun, Jie, Wenxiang Zhao, Pei Yan, Kaijie Chen, Li Jiao, Tianyang Qiu, and Xibin Wang. 2022. "Effect of Corrosive Medium and Surface Defect-Energy on Corrosion Behavior of Rolled ZK61M Alloy" Materials 15, no. 12: 4091. https://doi.org/10.3390/ma15124091
APA StyleSun, J., Zhao, W., Yan, P., Chen, K., Jiao, L., Qiu, T., & Wang, X. (2022). Effect of Corrosive Medium and Surface Defect-Energy on Corrosion Behavior of Rolled ZK61M Alloy. Materials, 15(12), 4091. https://doi.org/10.3390/ma15124091