
Extraction of Metals from Polluted Soils by Bioleaching in Relation to Environmental Risk Assessment


Abstract
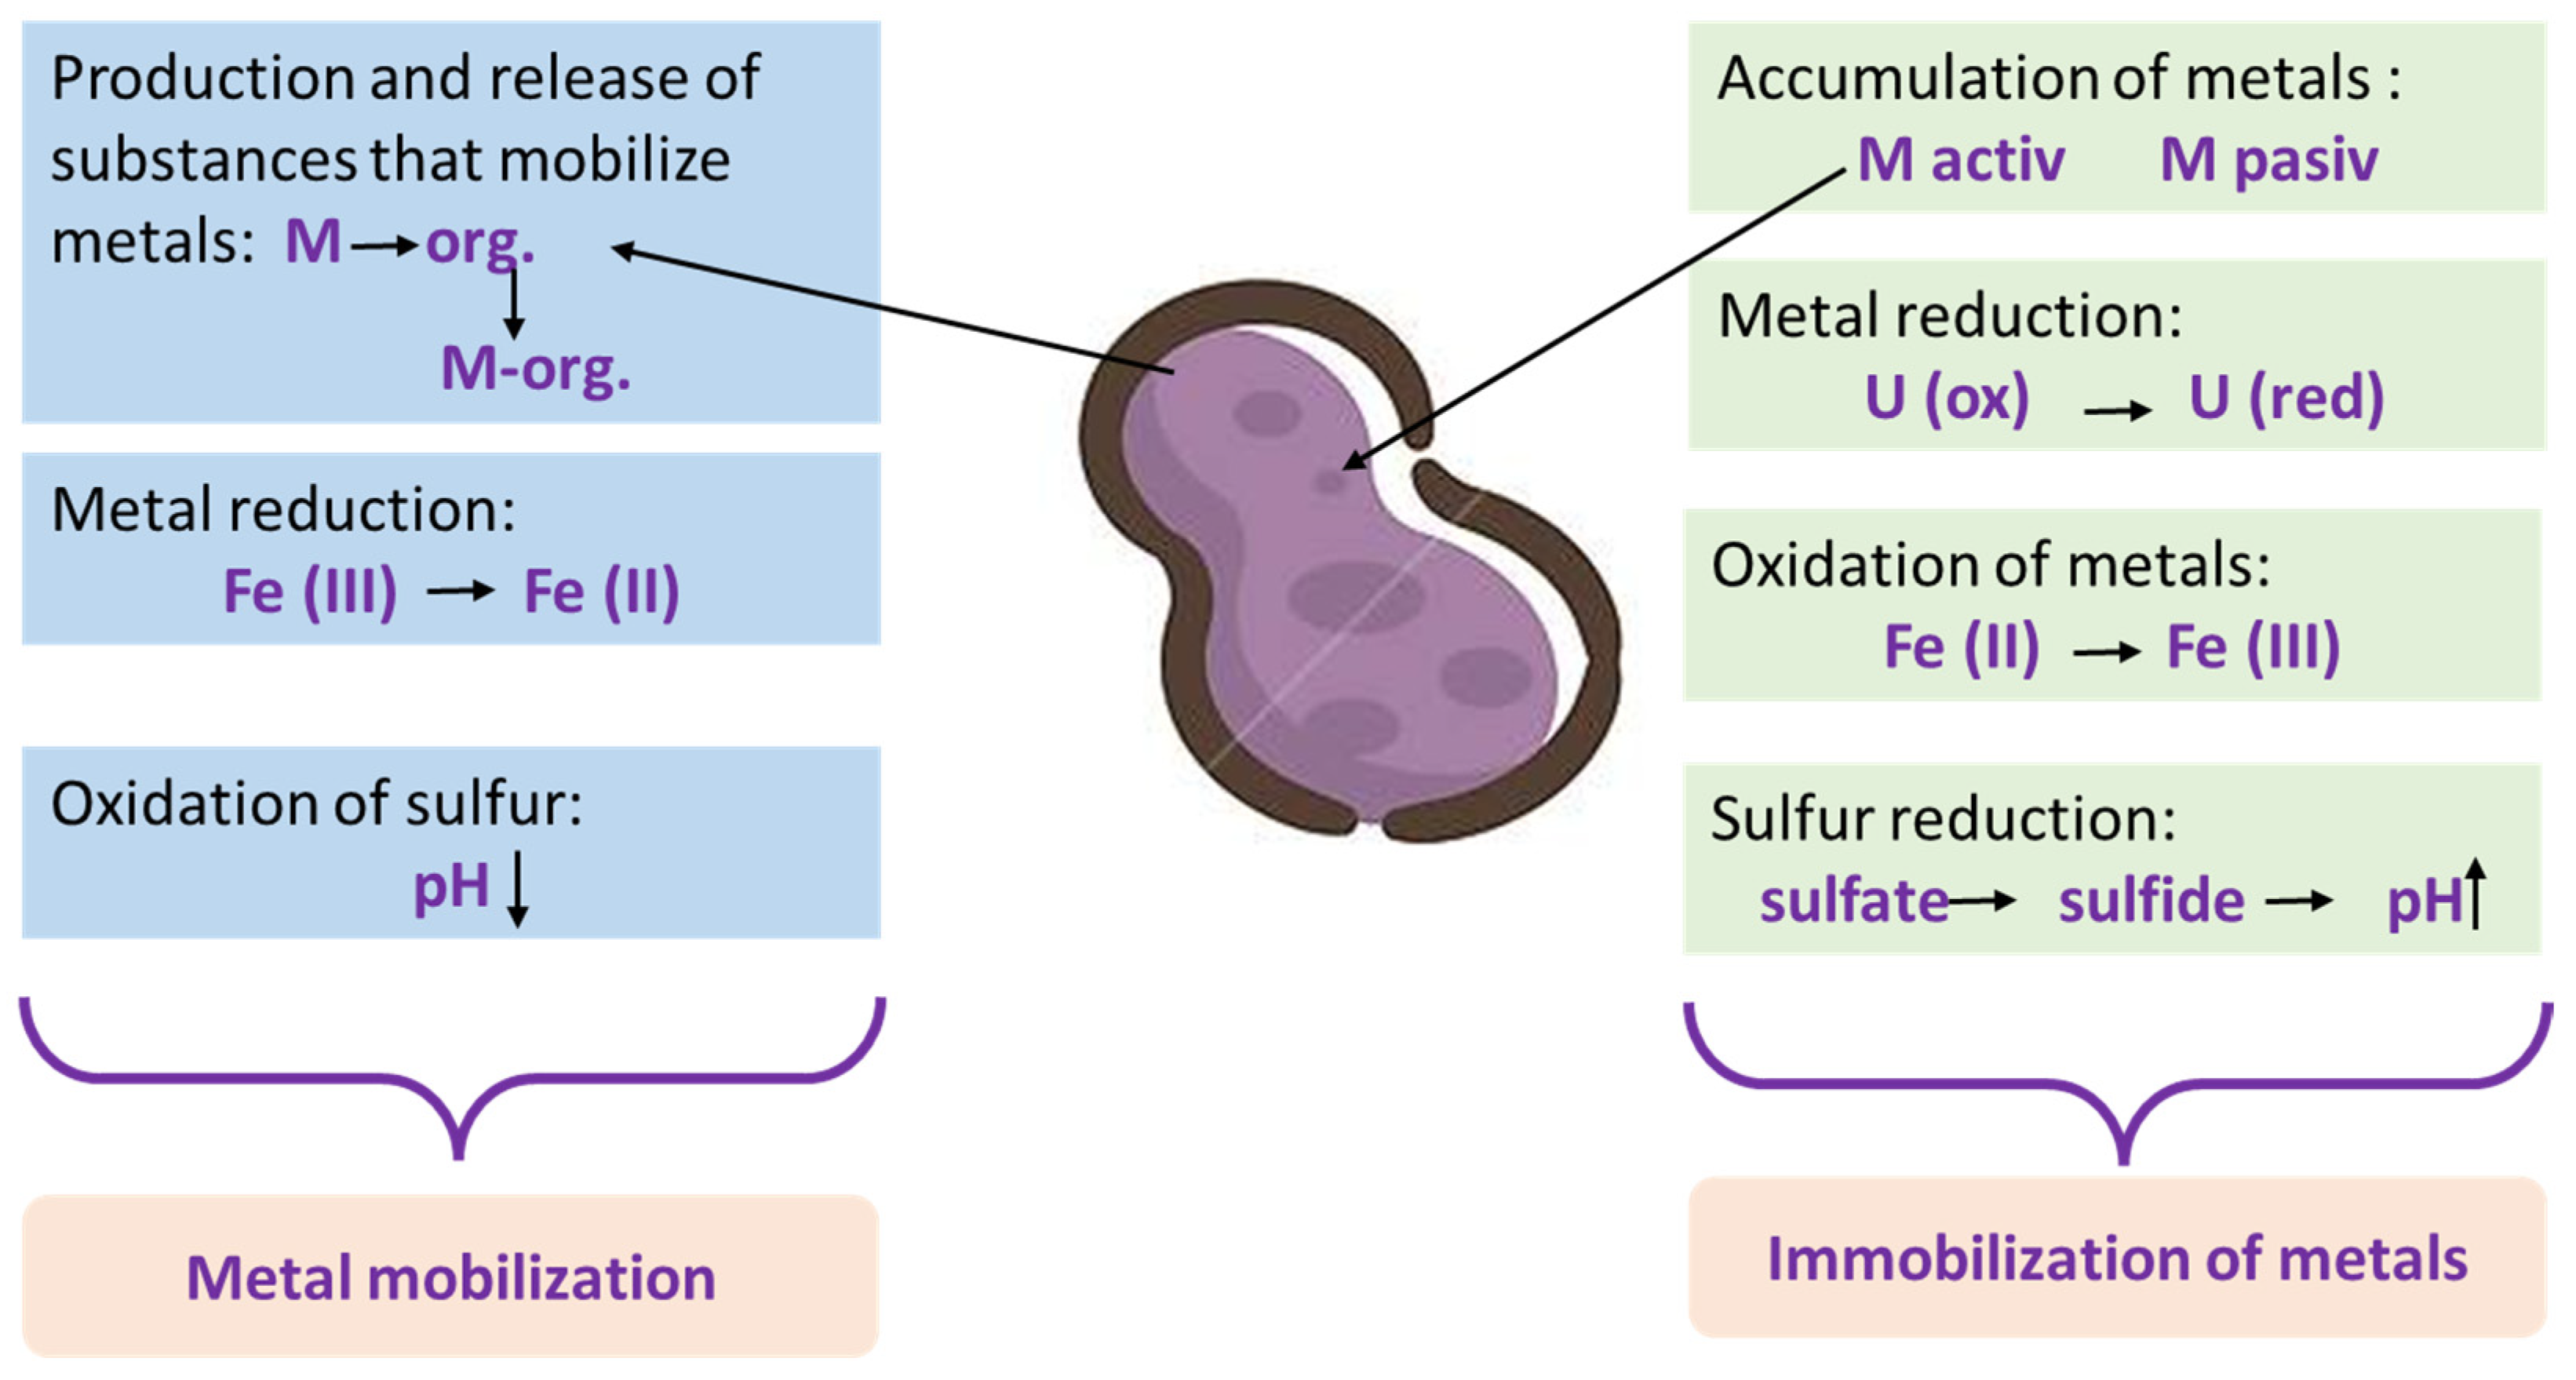
:1. Introduction
2. Materials and Methods
2.1. Soil Sampling
2.2. Soil Analysis
2.3. Bioleaching Process
2.4. Ecological Risk Assessment Methodology
- CAi—analyte concentration,
- CNi—background value (in the case of soil).
- Er—ecological risk index of the metal i,
- Cf—contamination factor of the metal i,
- Ci is the initial metals’ concentration (mg kg−1) of soil;
- Cf is the final concentration of metals (mg kg−1) in soil, after soil bioleaching treatment.
3. Results and Discussions
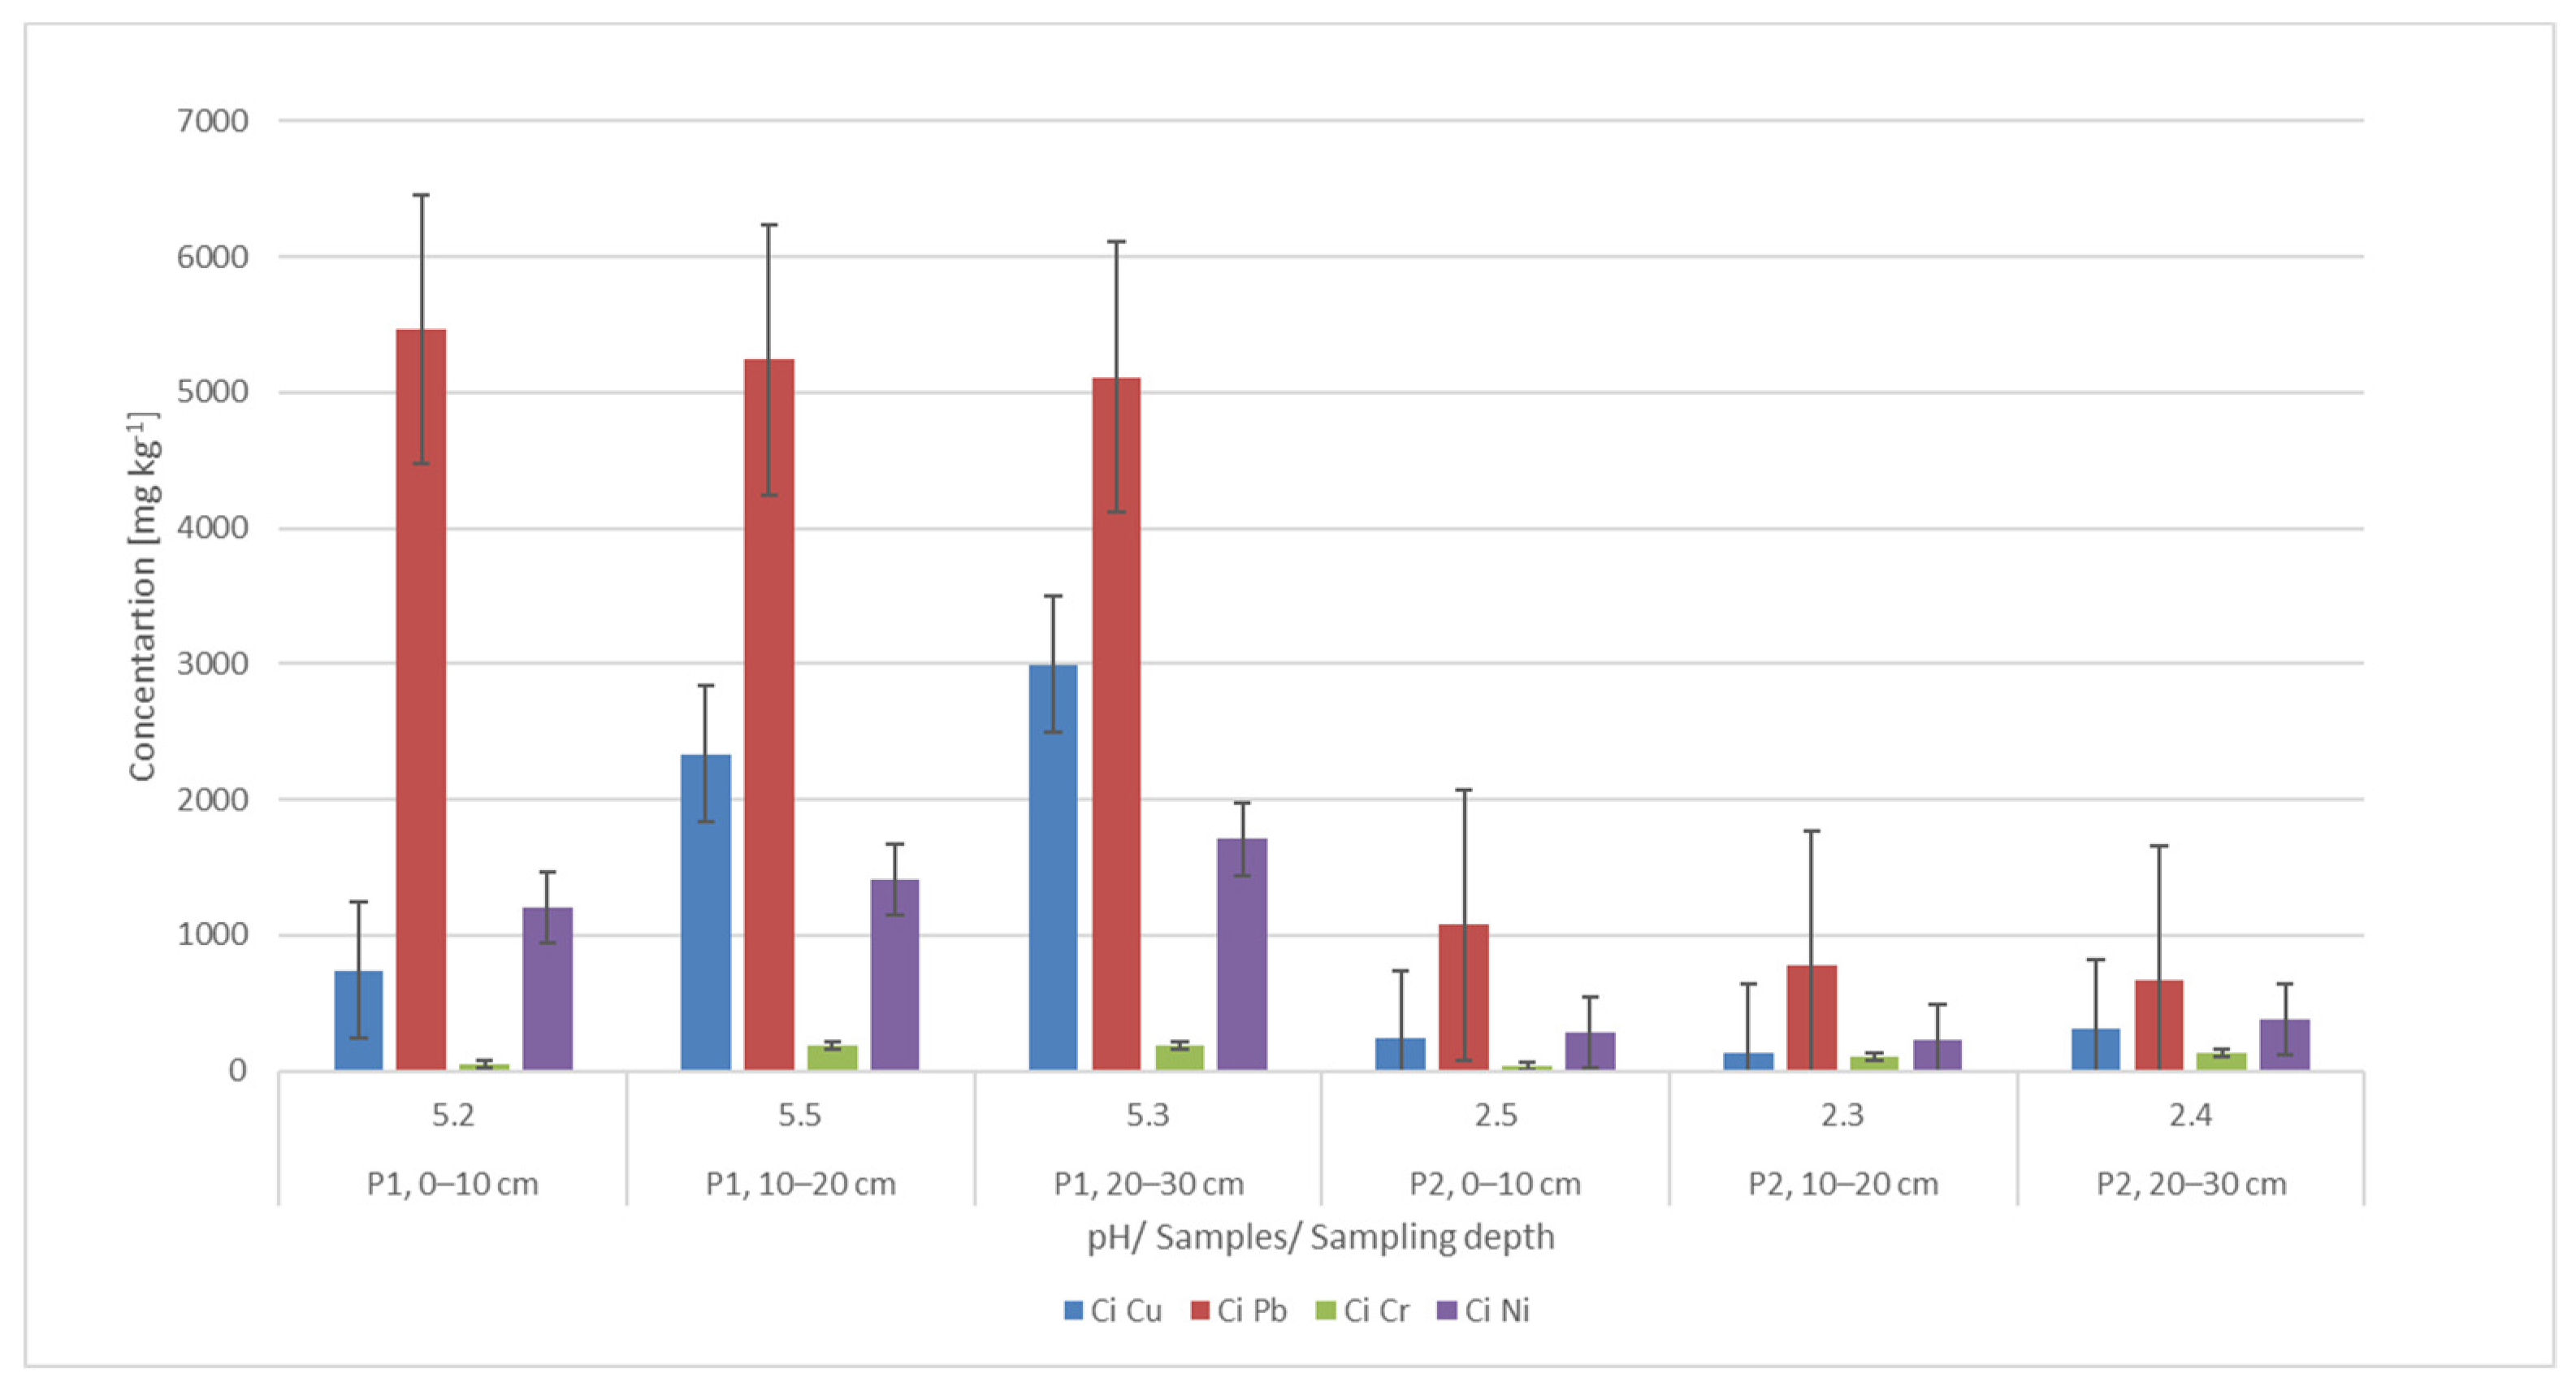
3.1. Analysis and Assessment of Ecological Risks for Initial Soil Samples
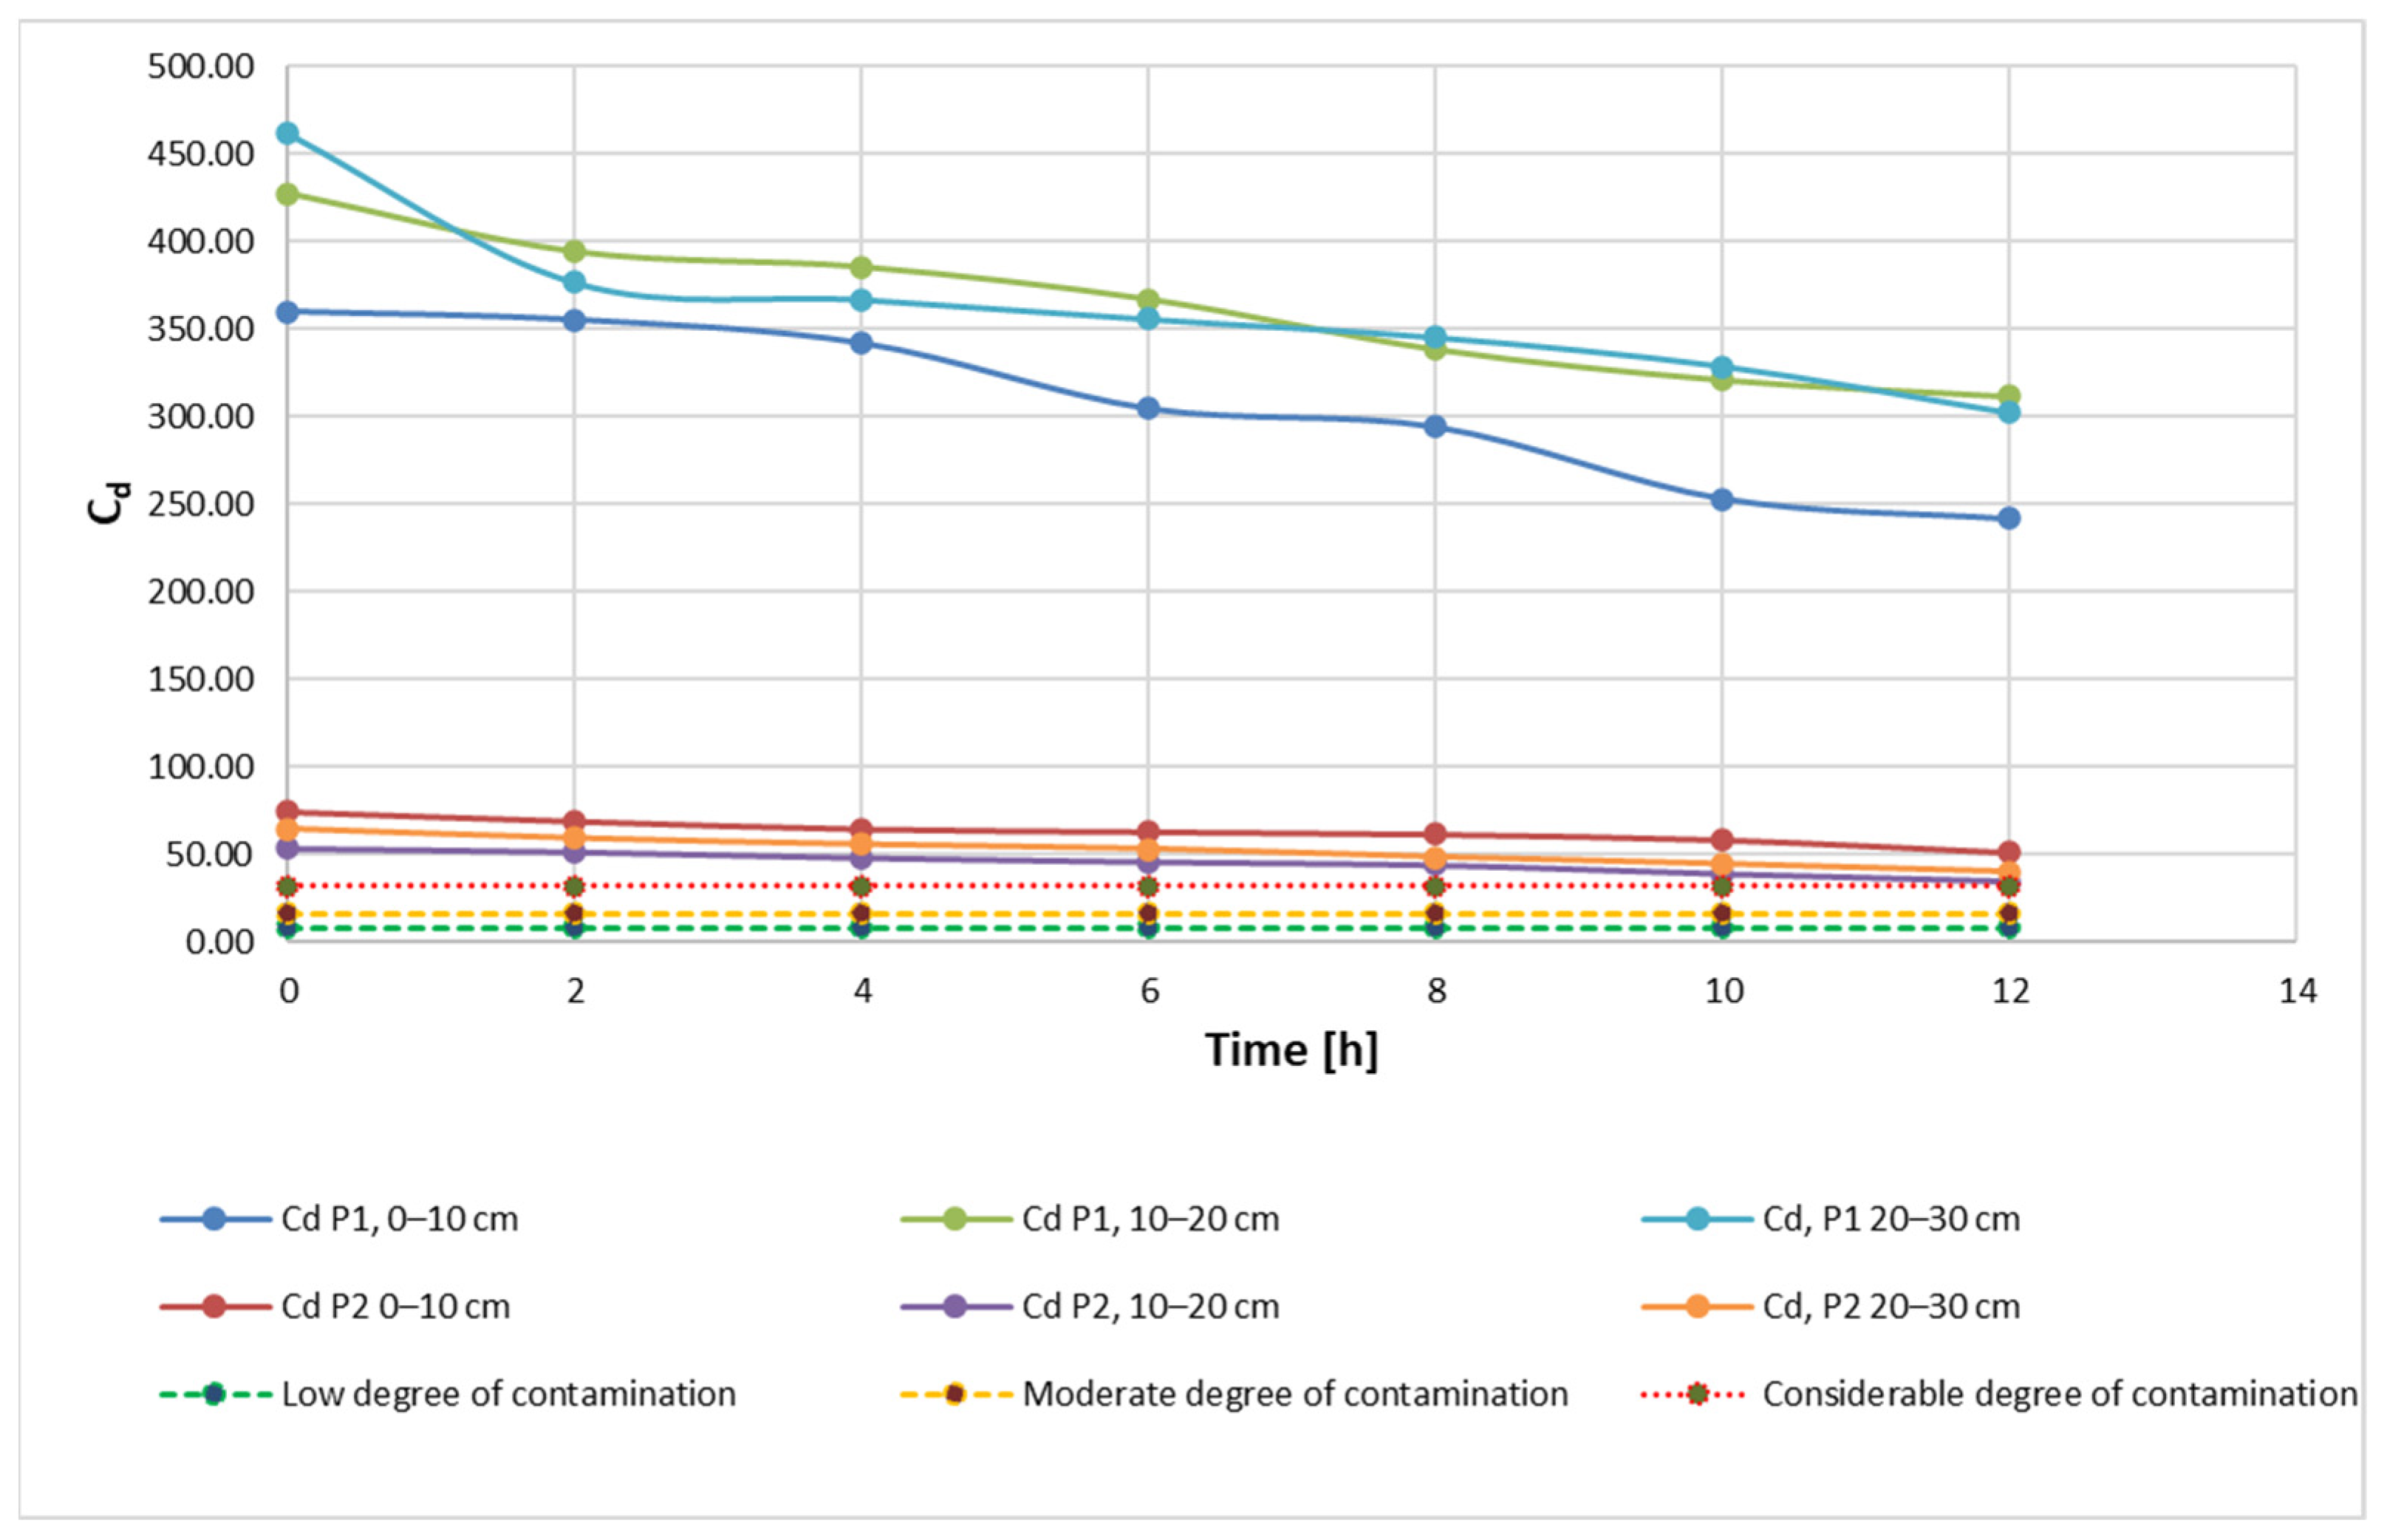
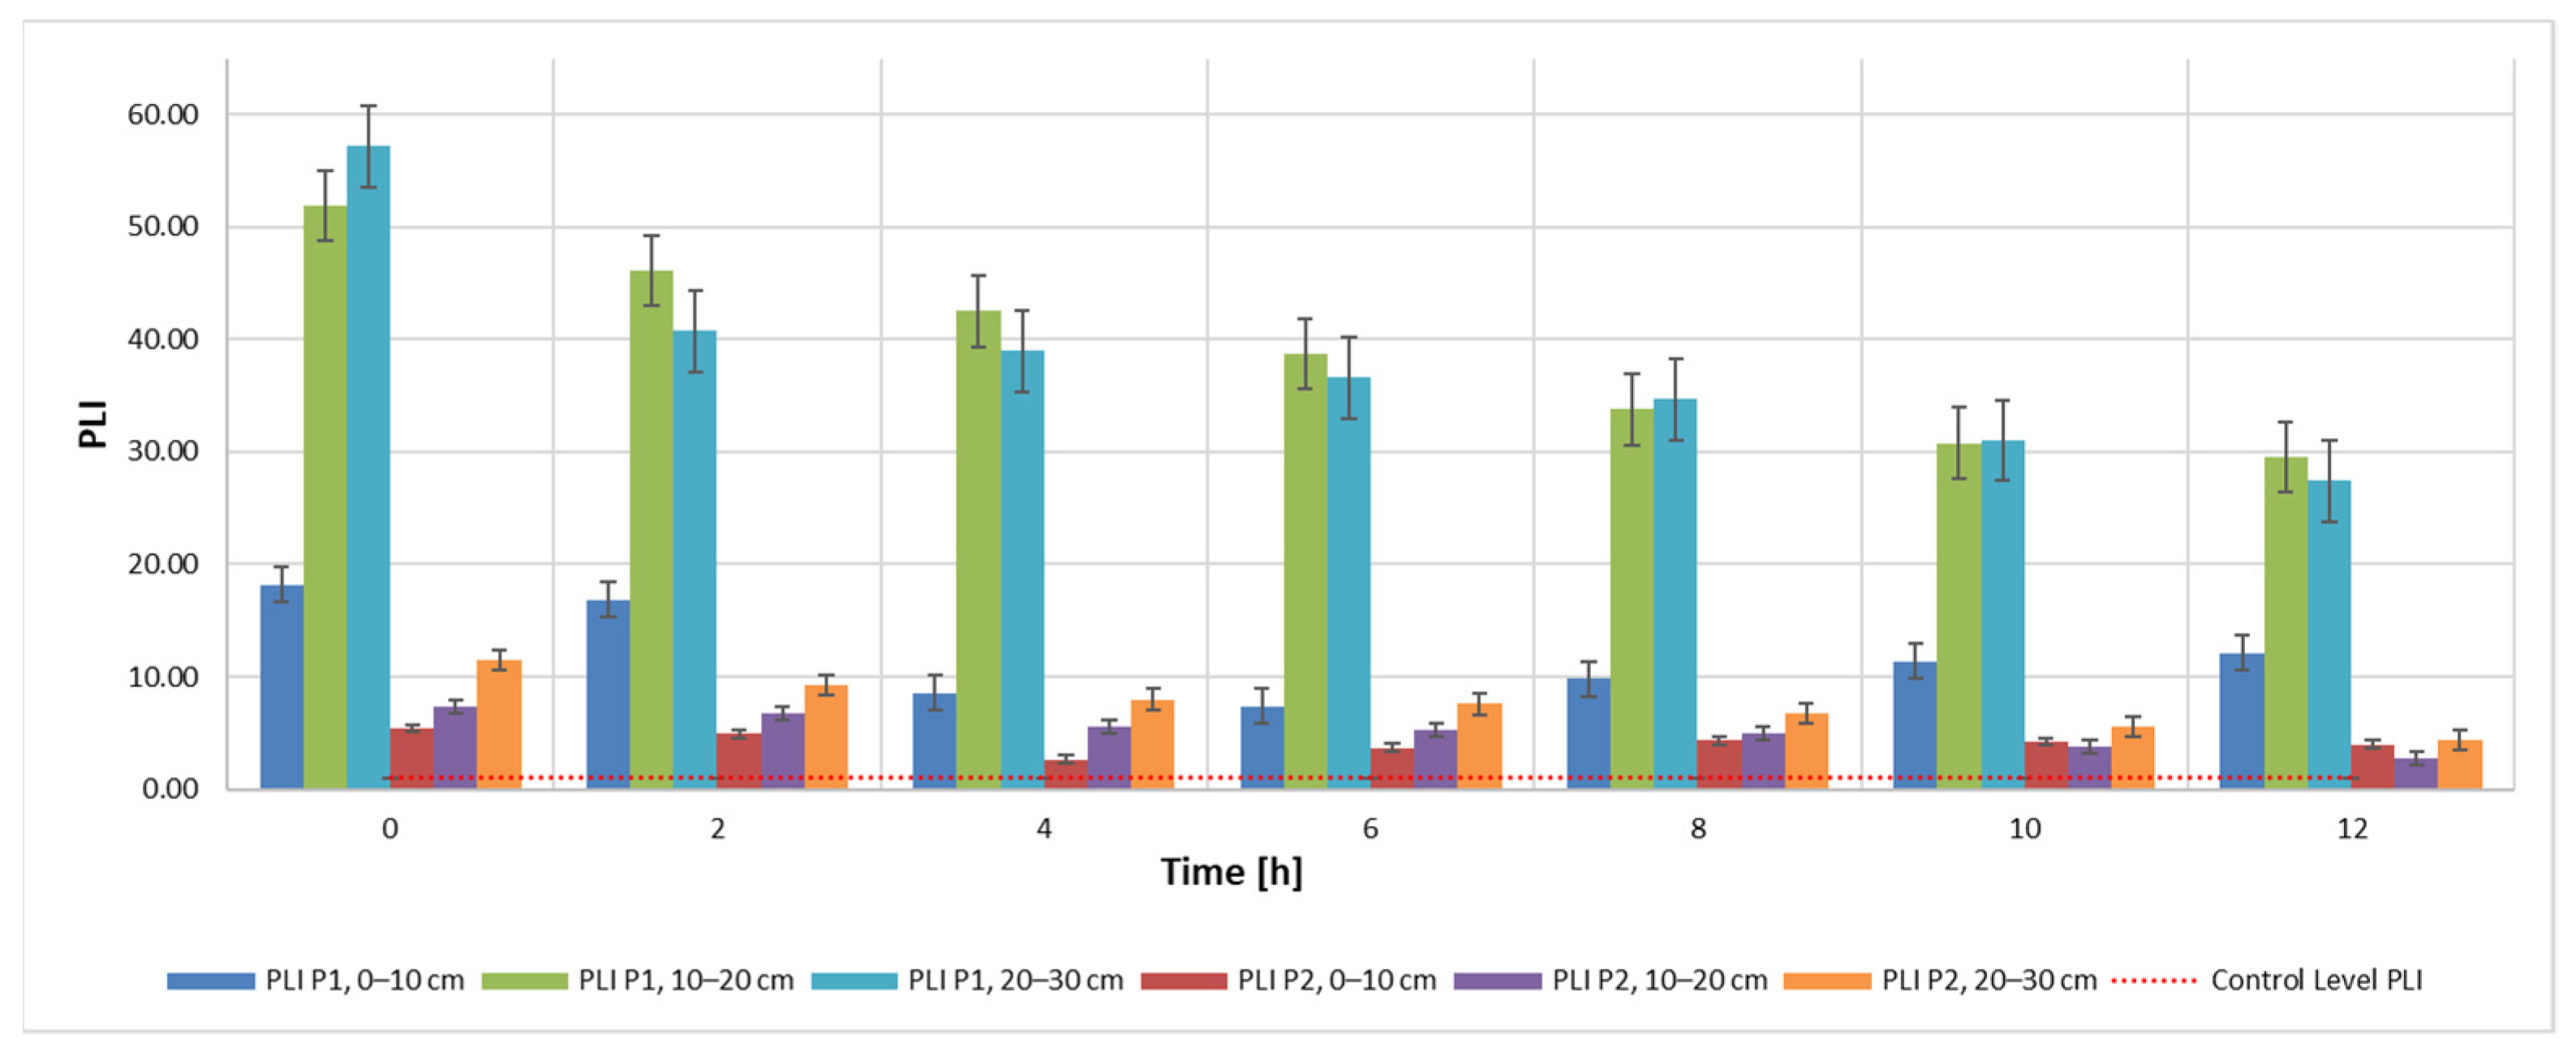
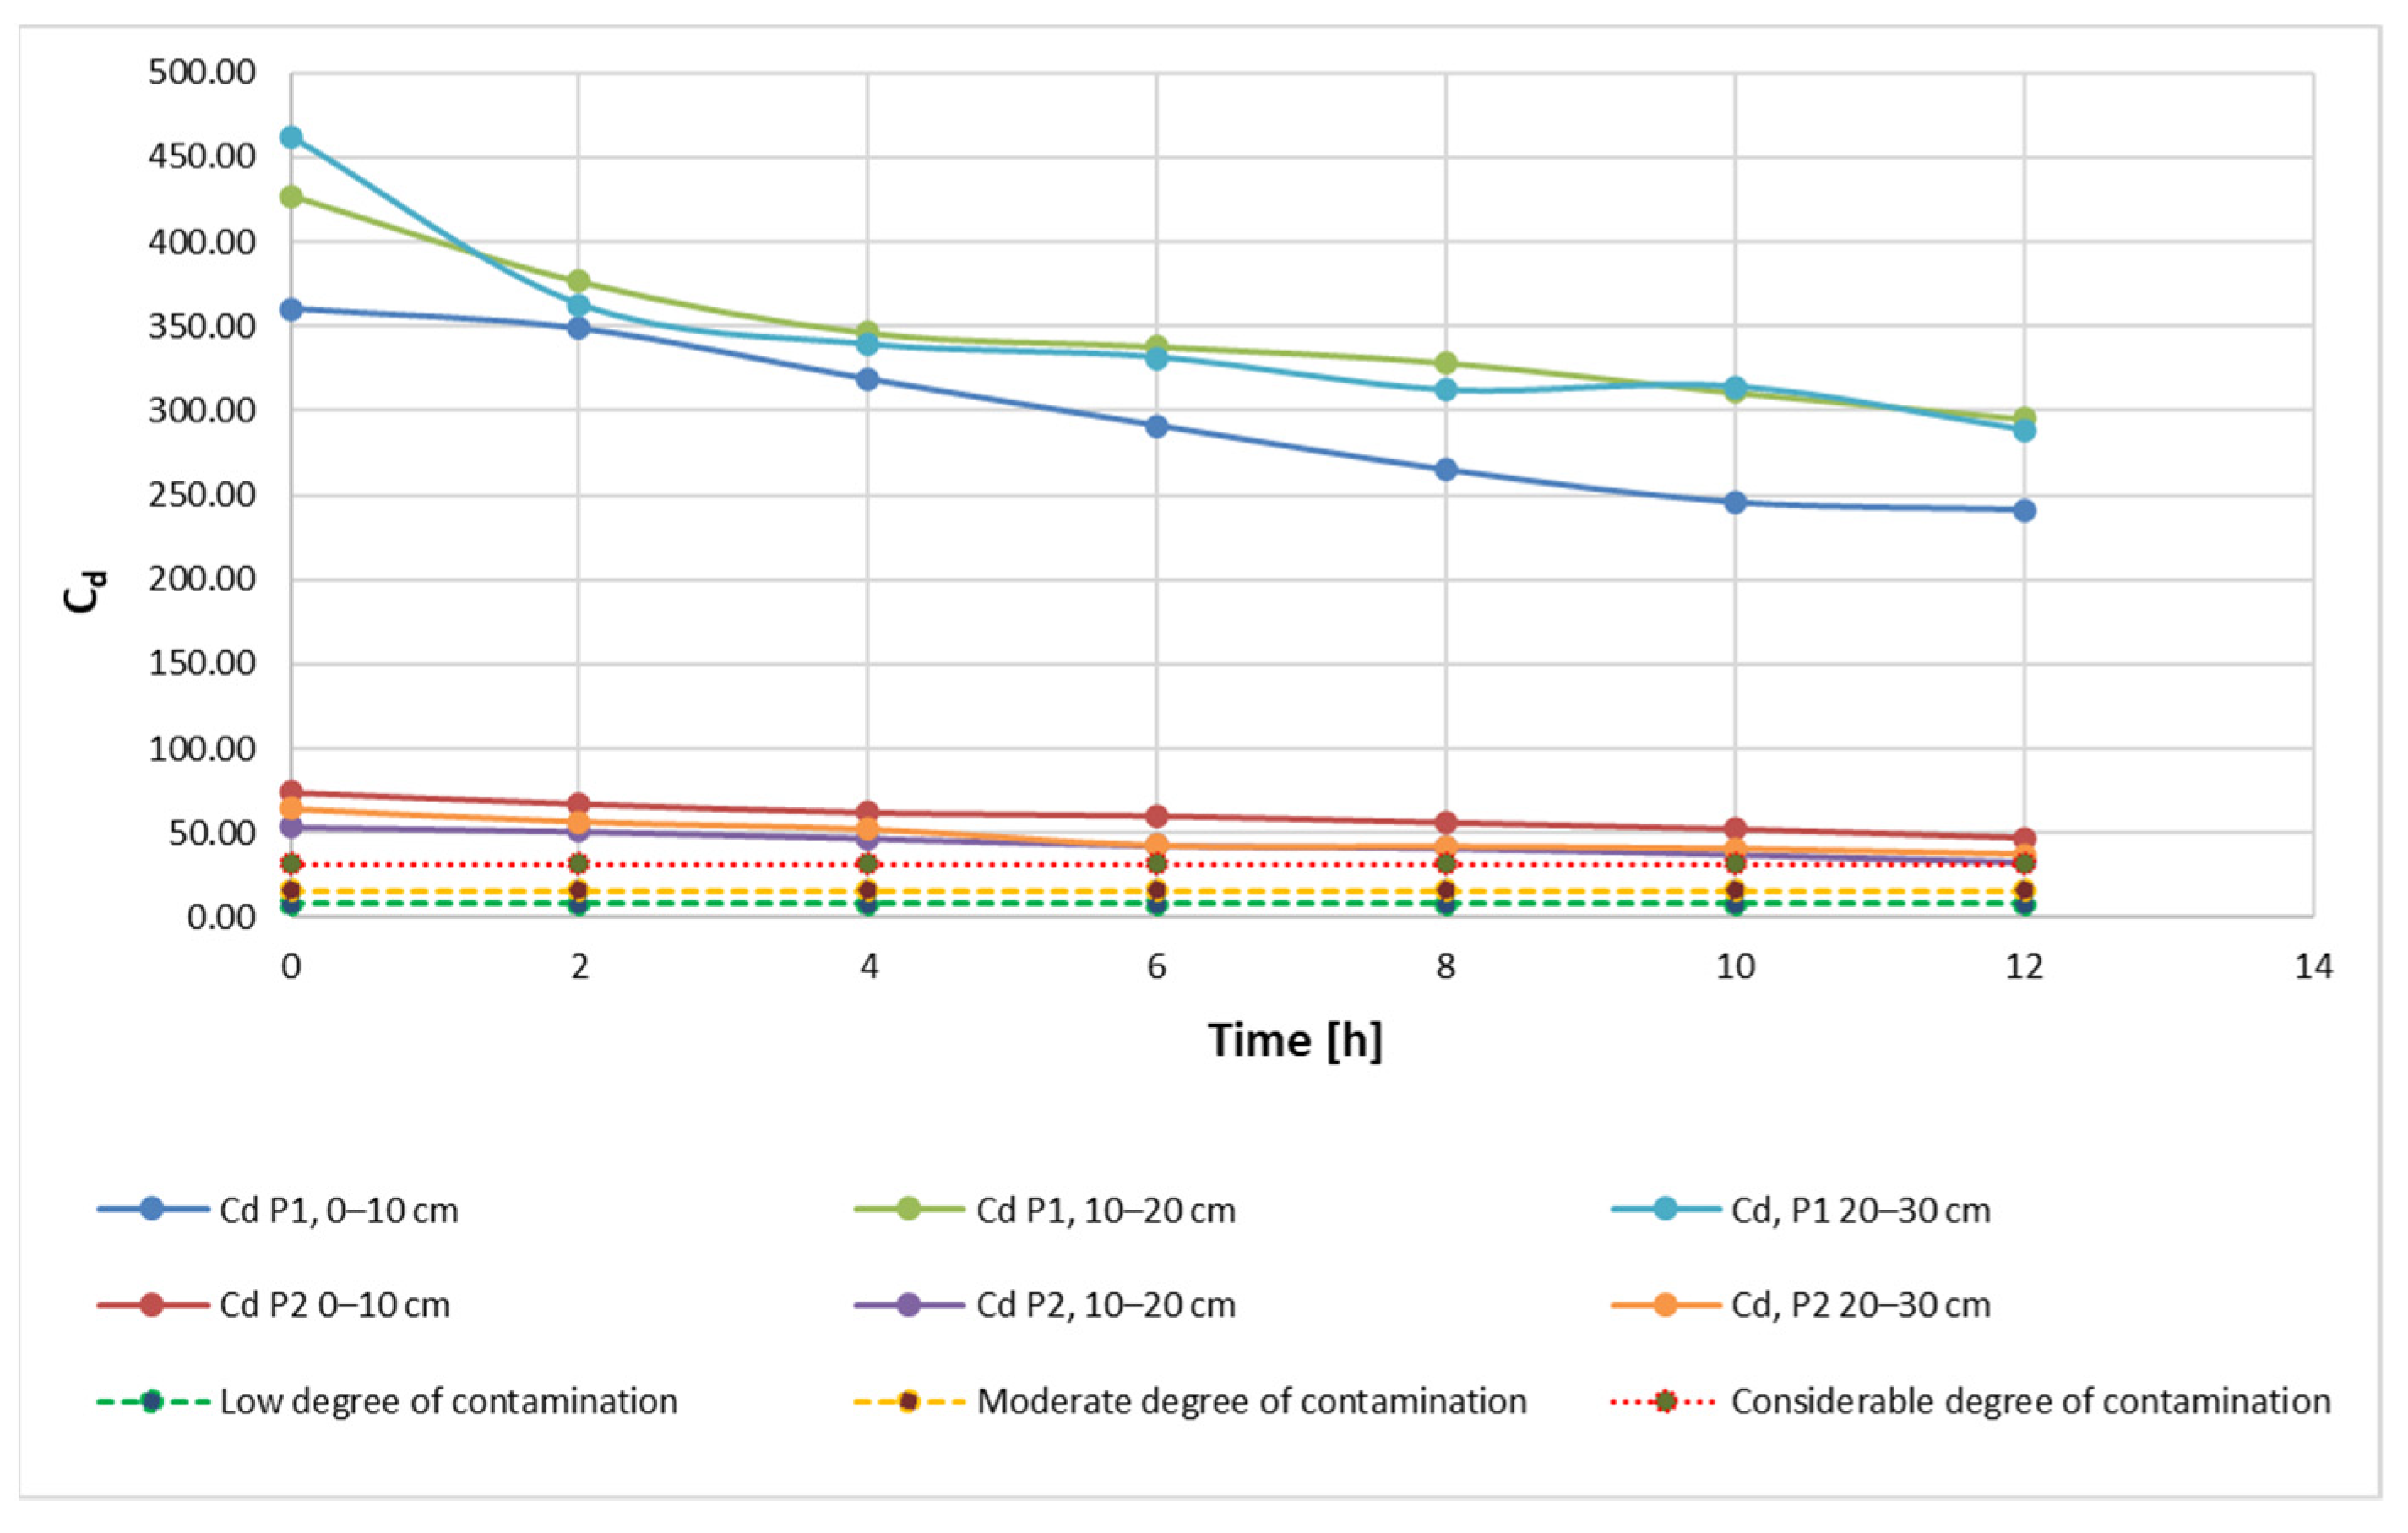
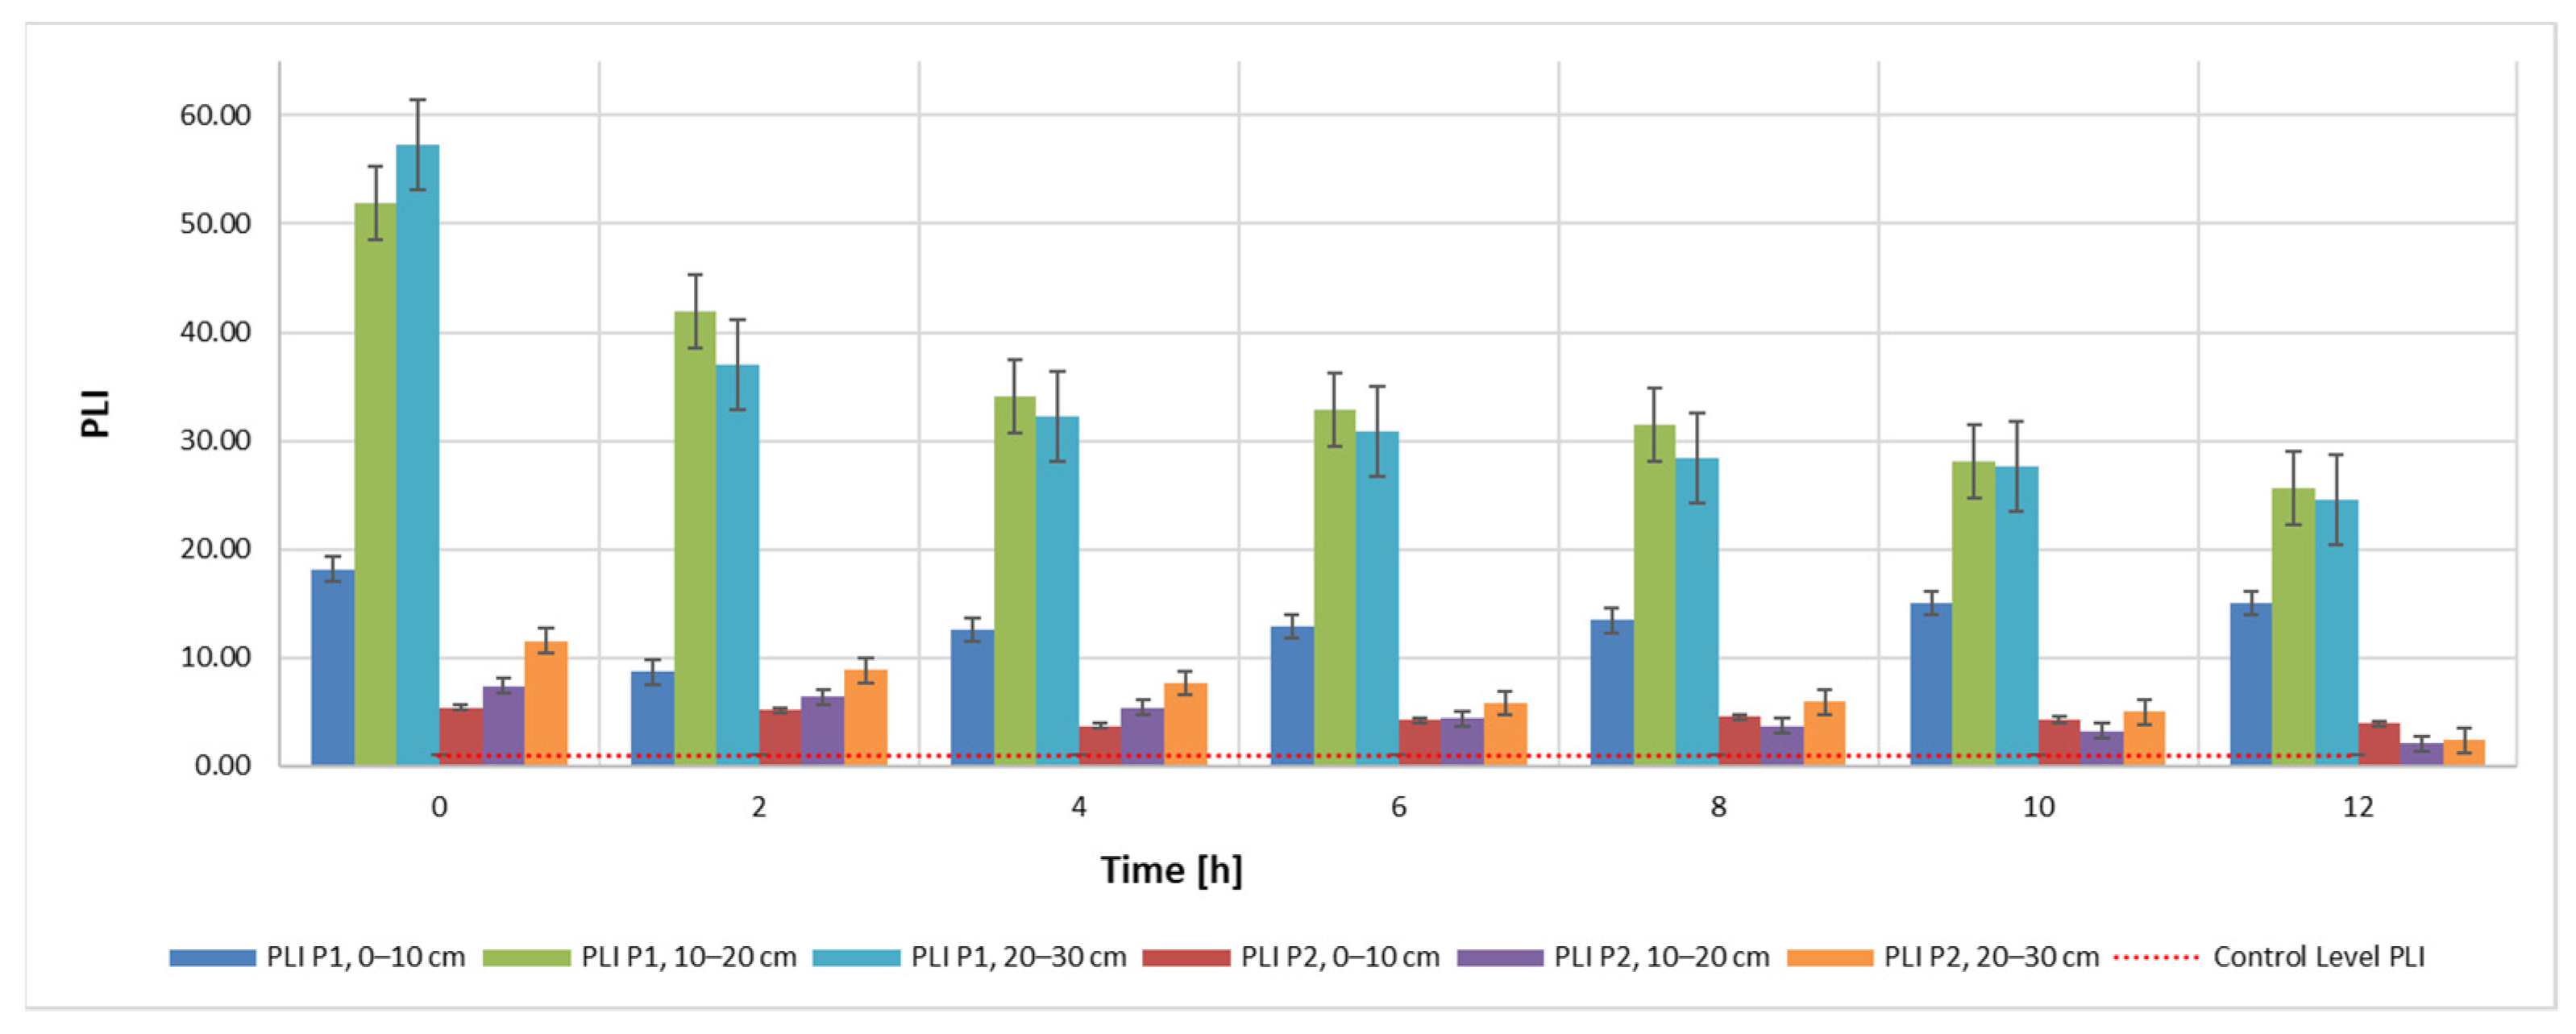
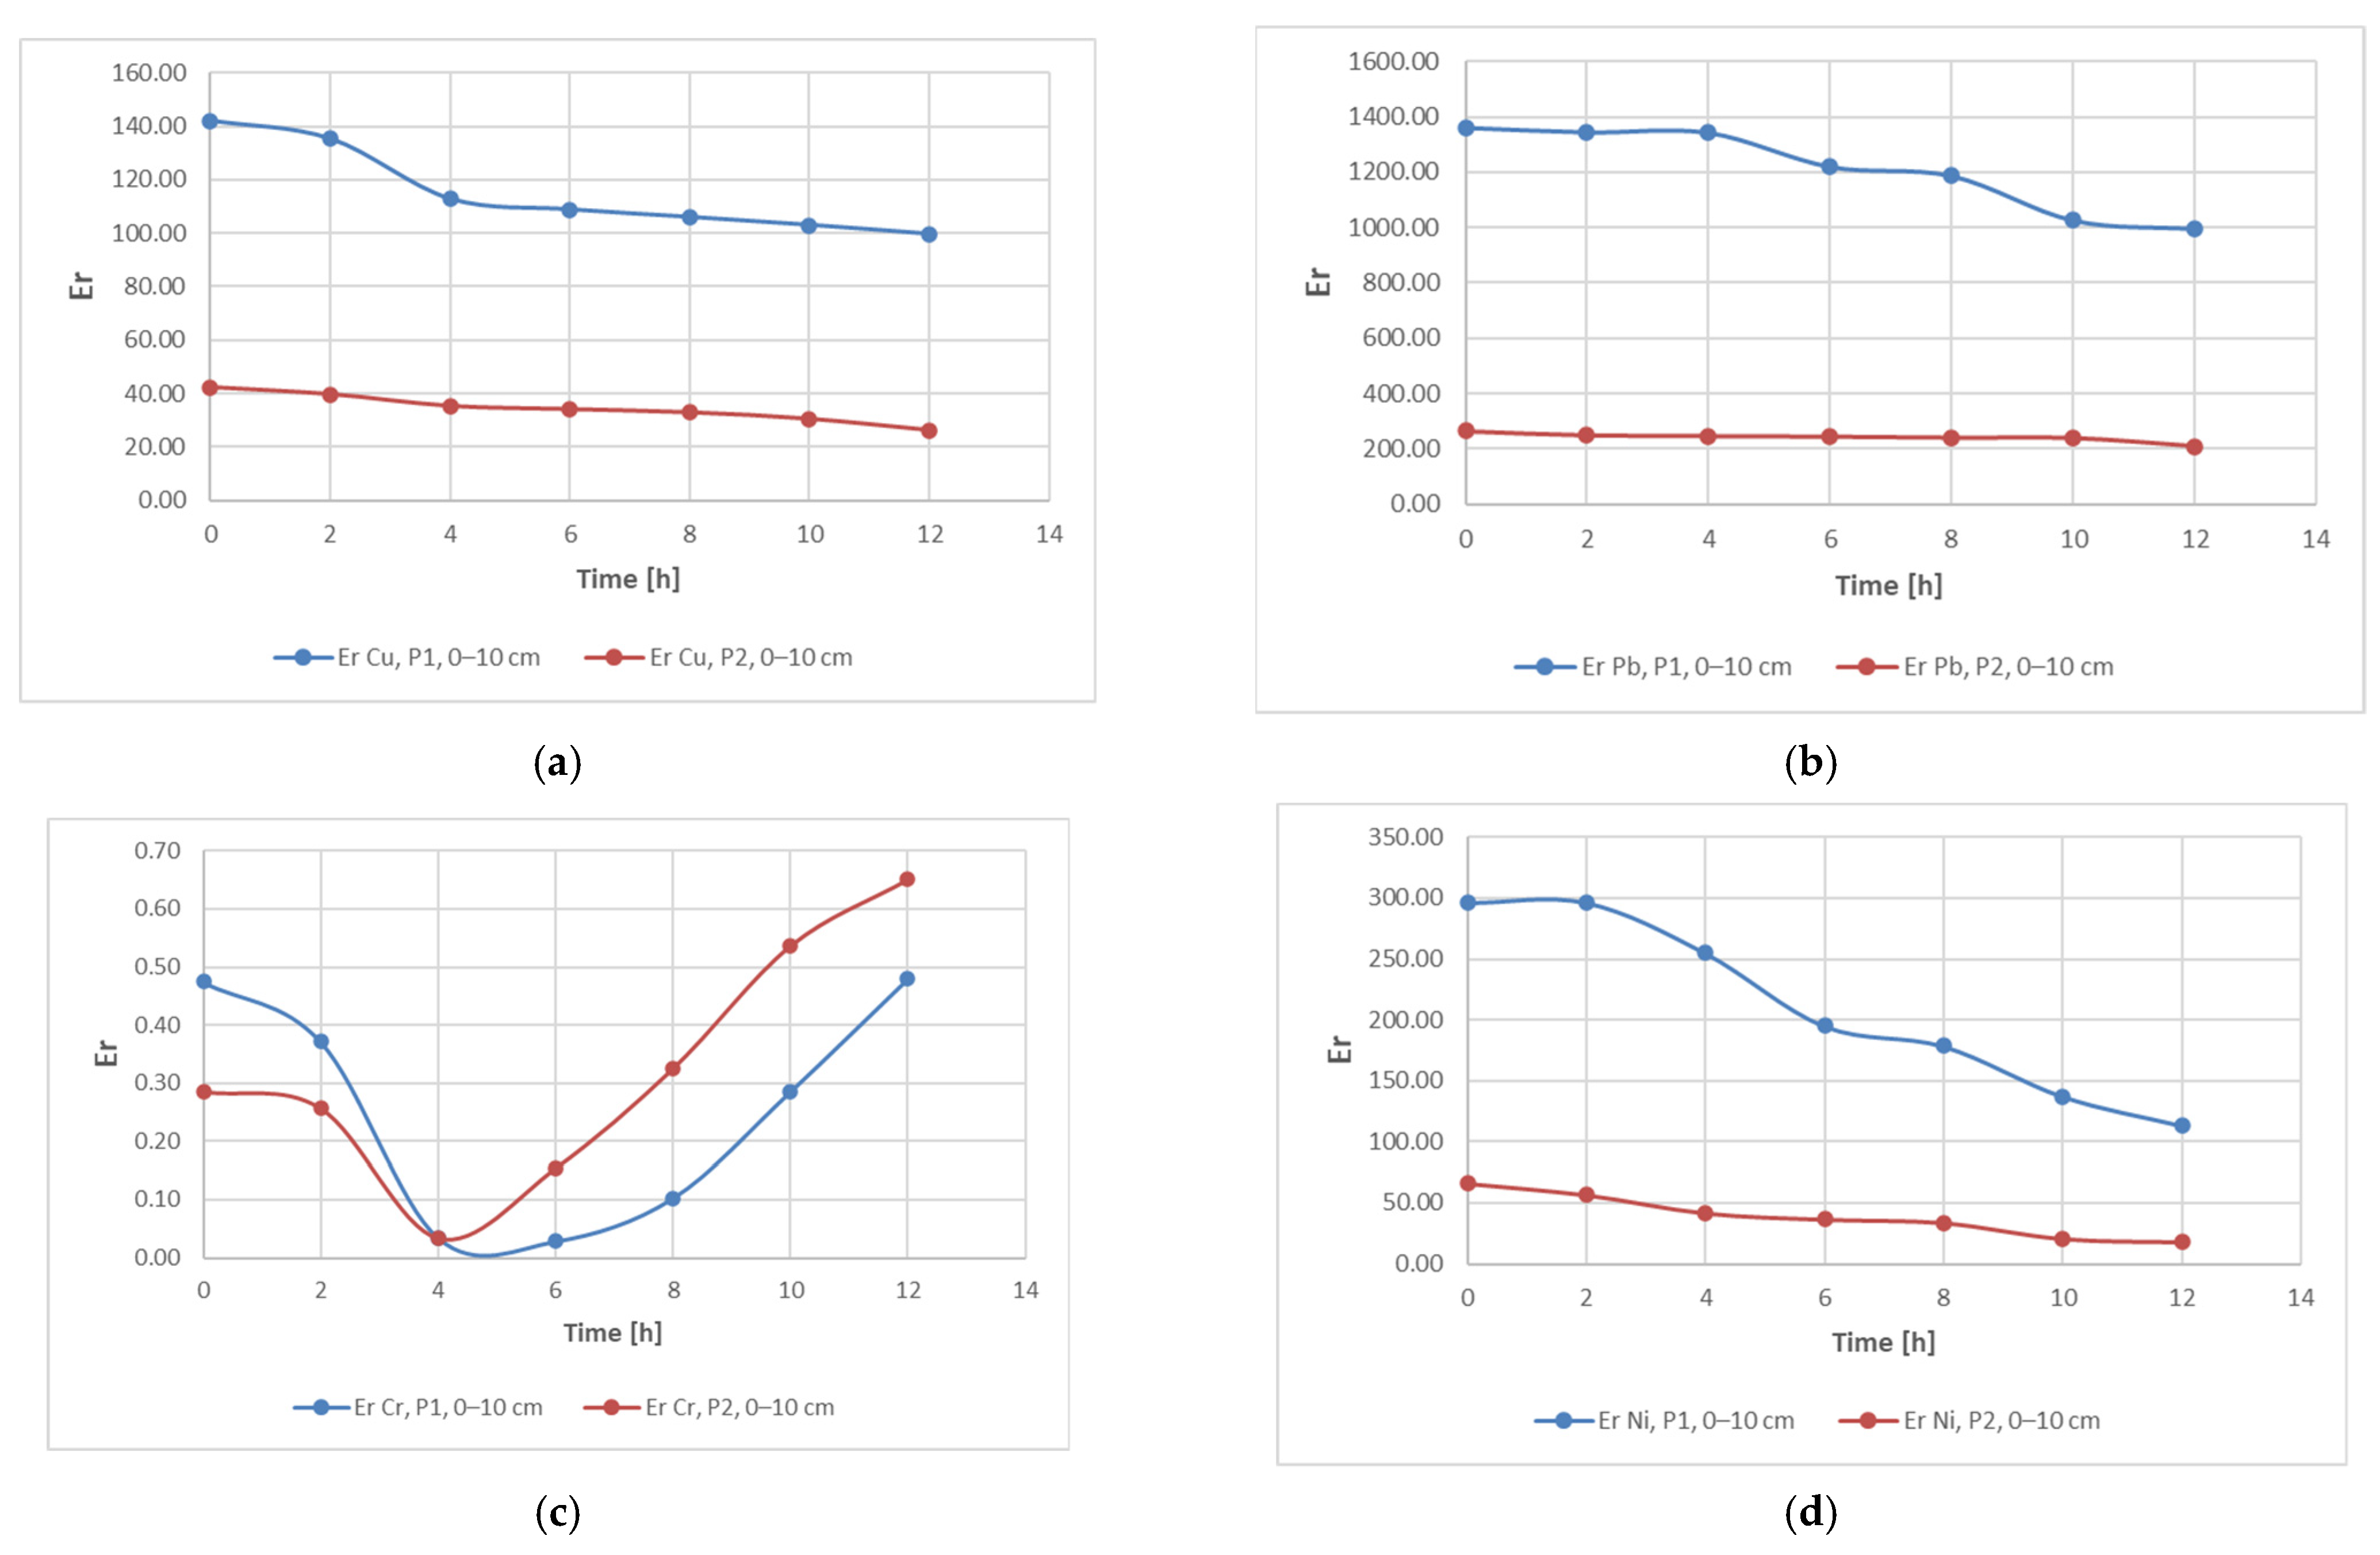
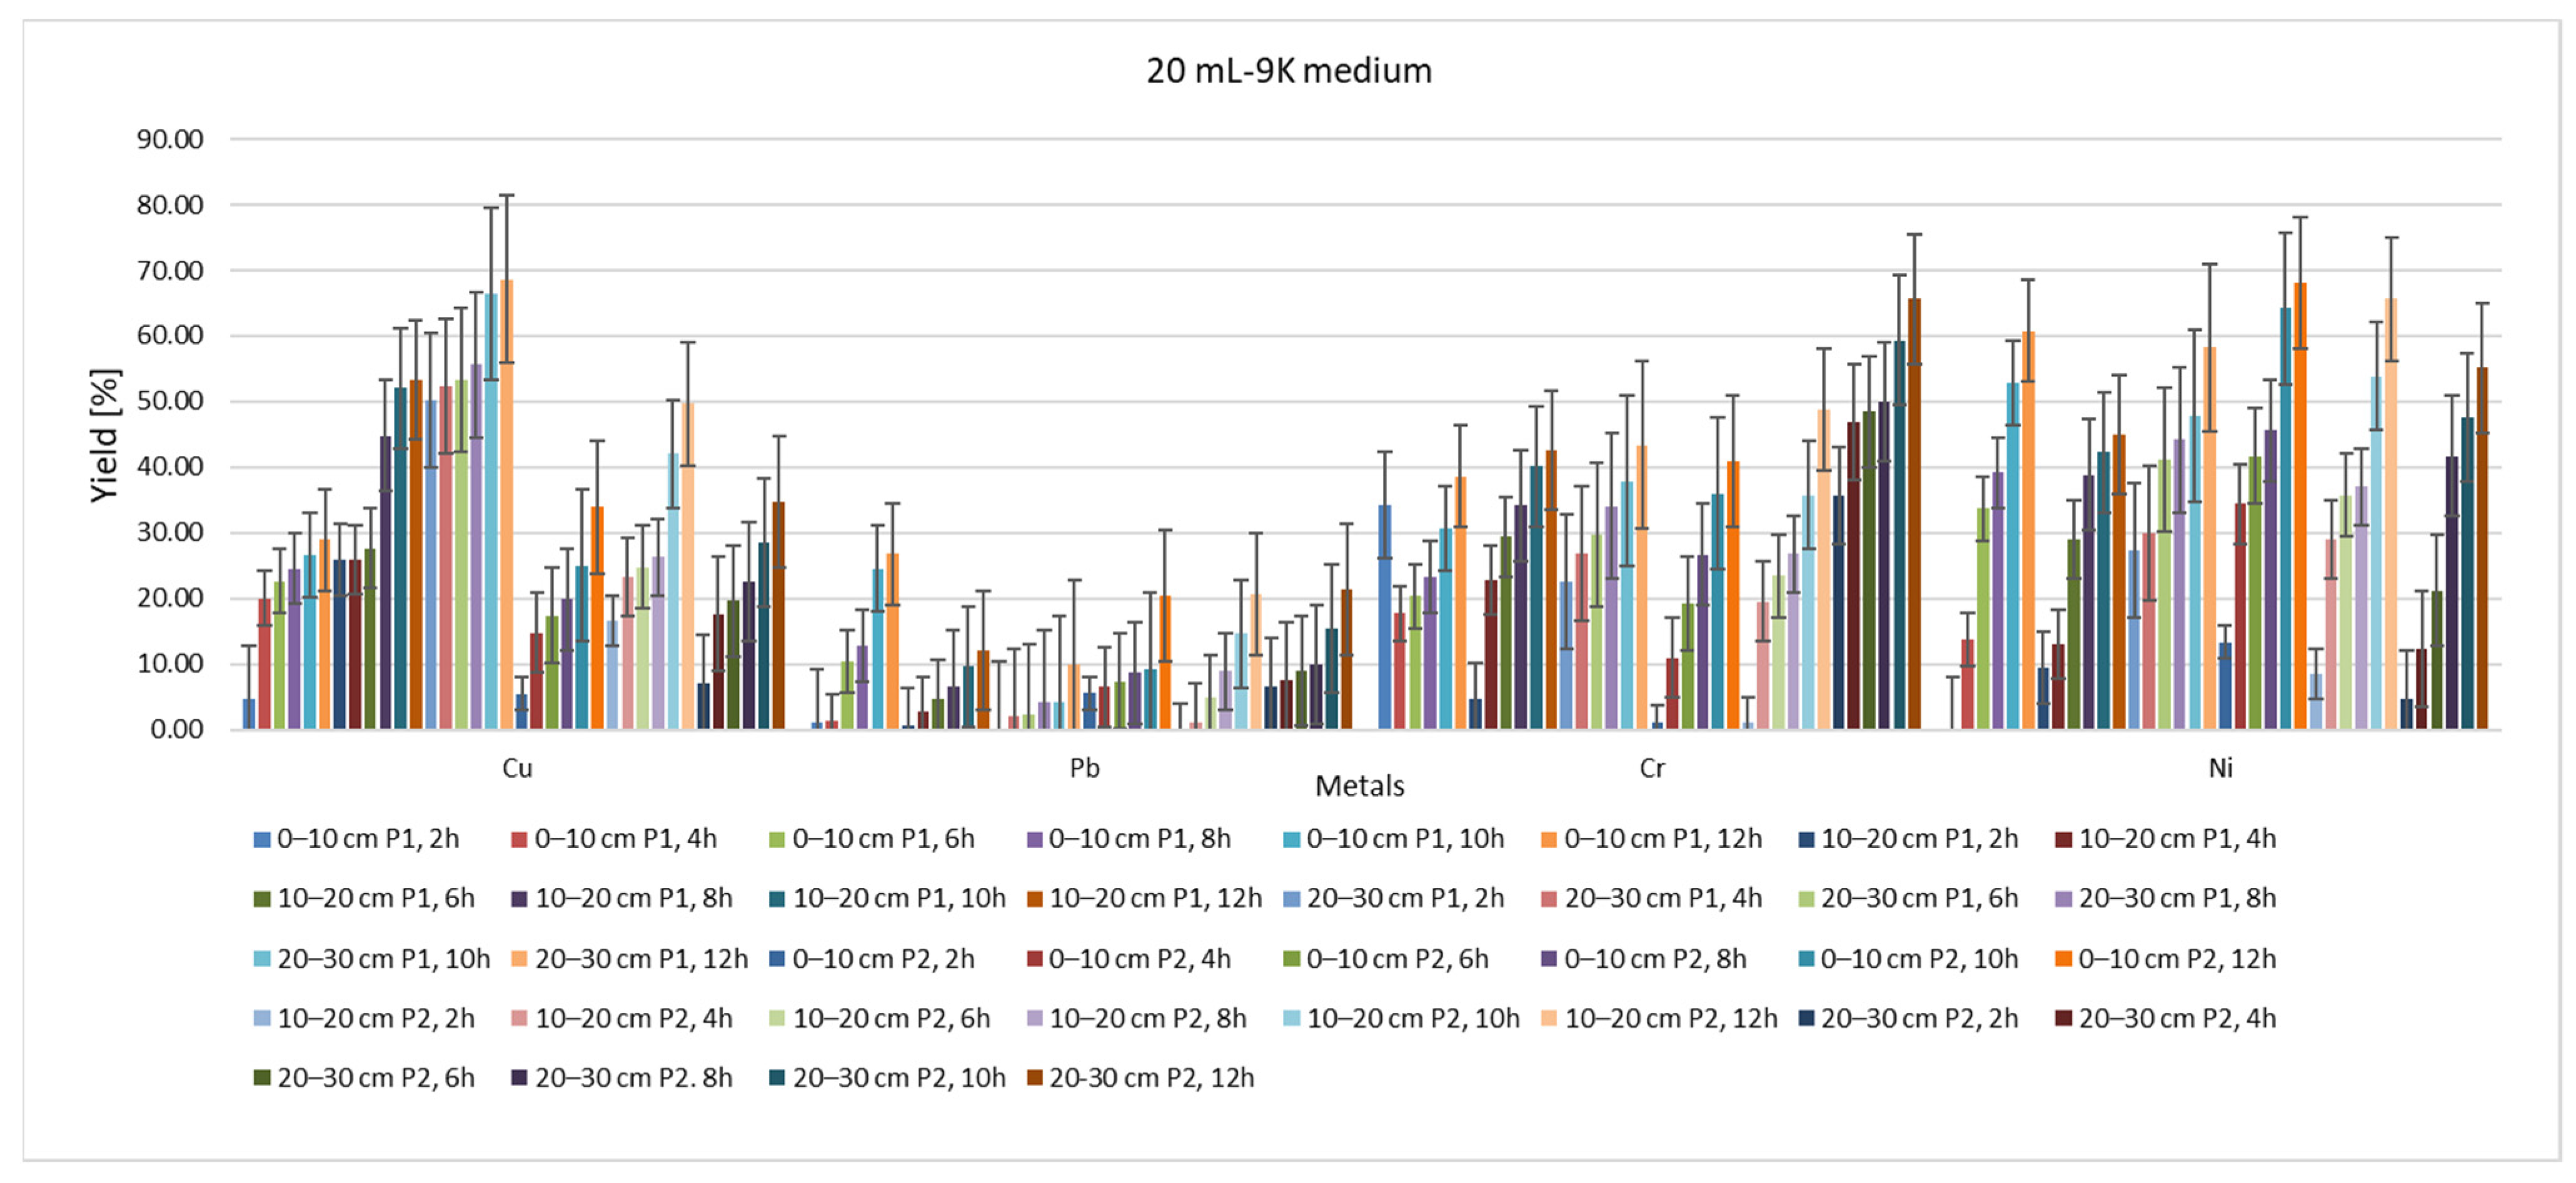
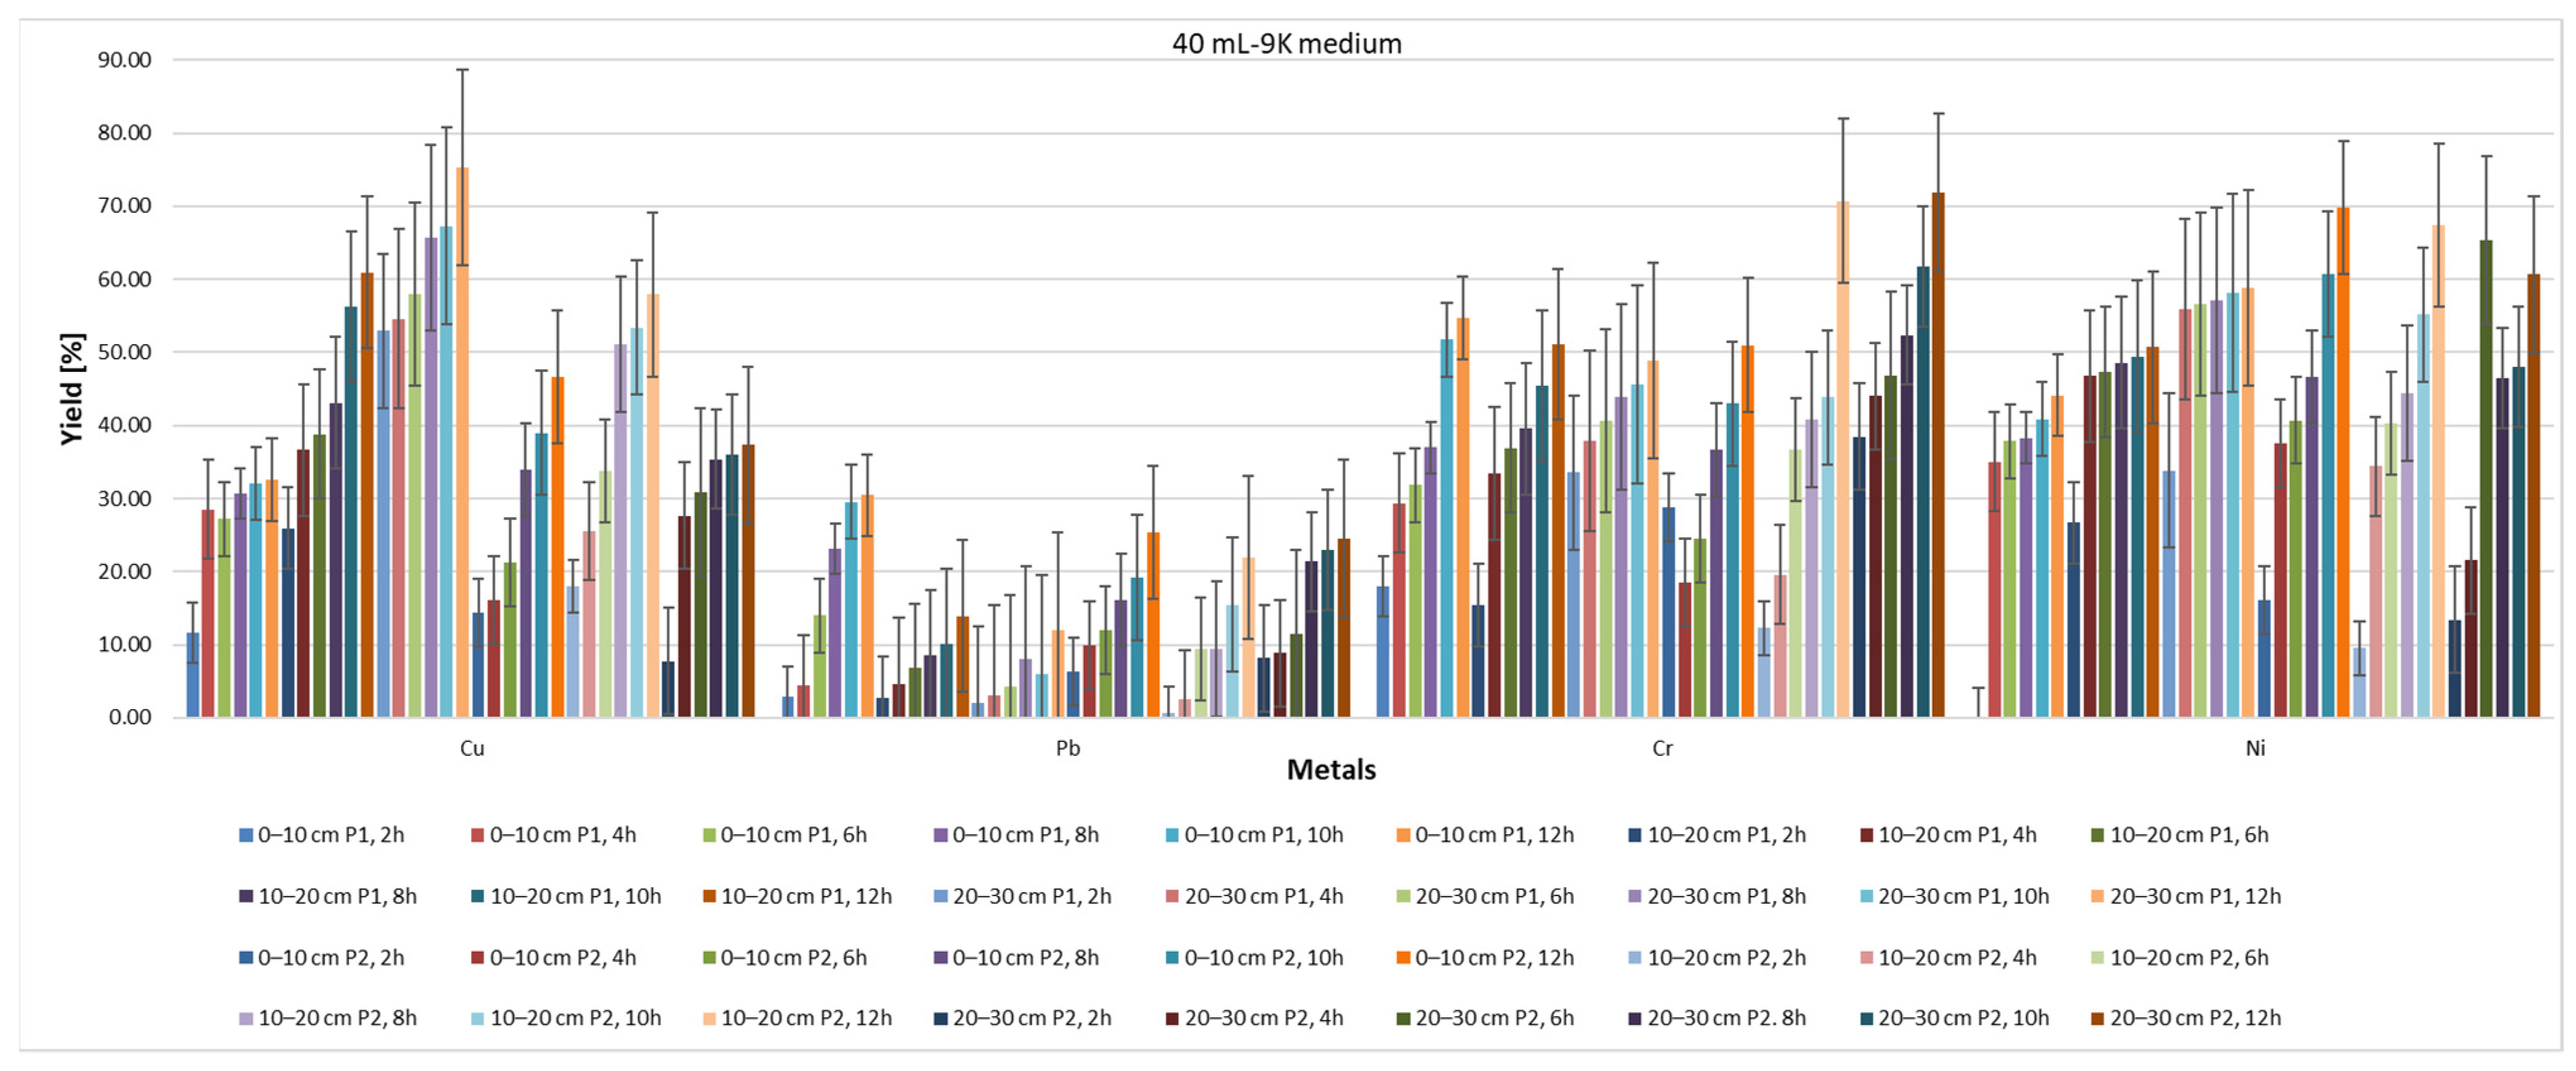
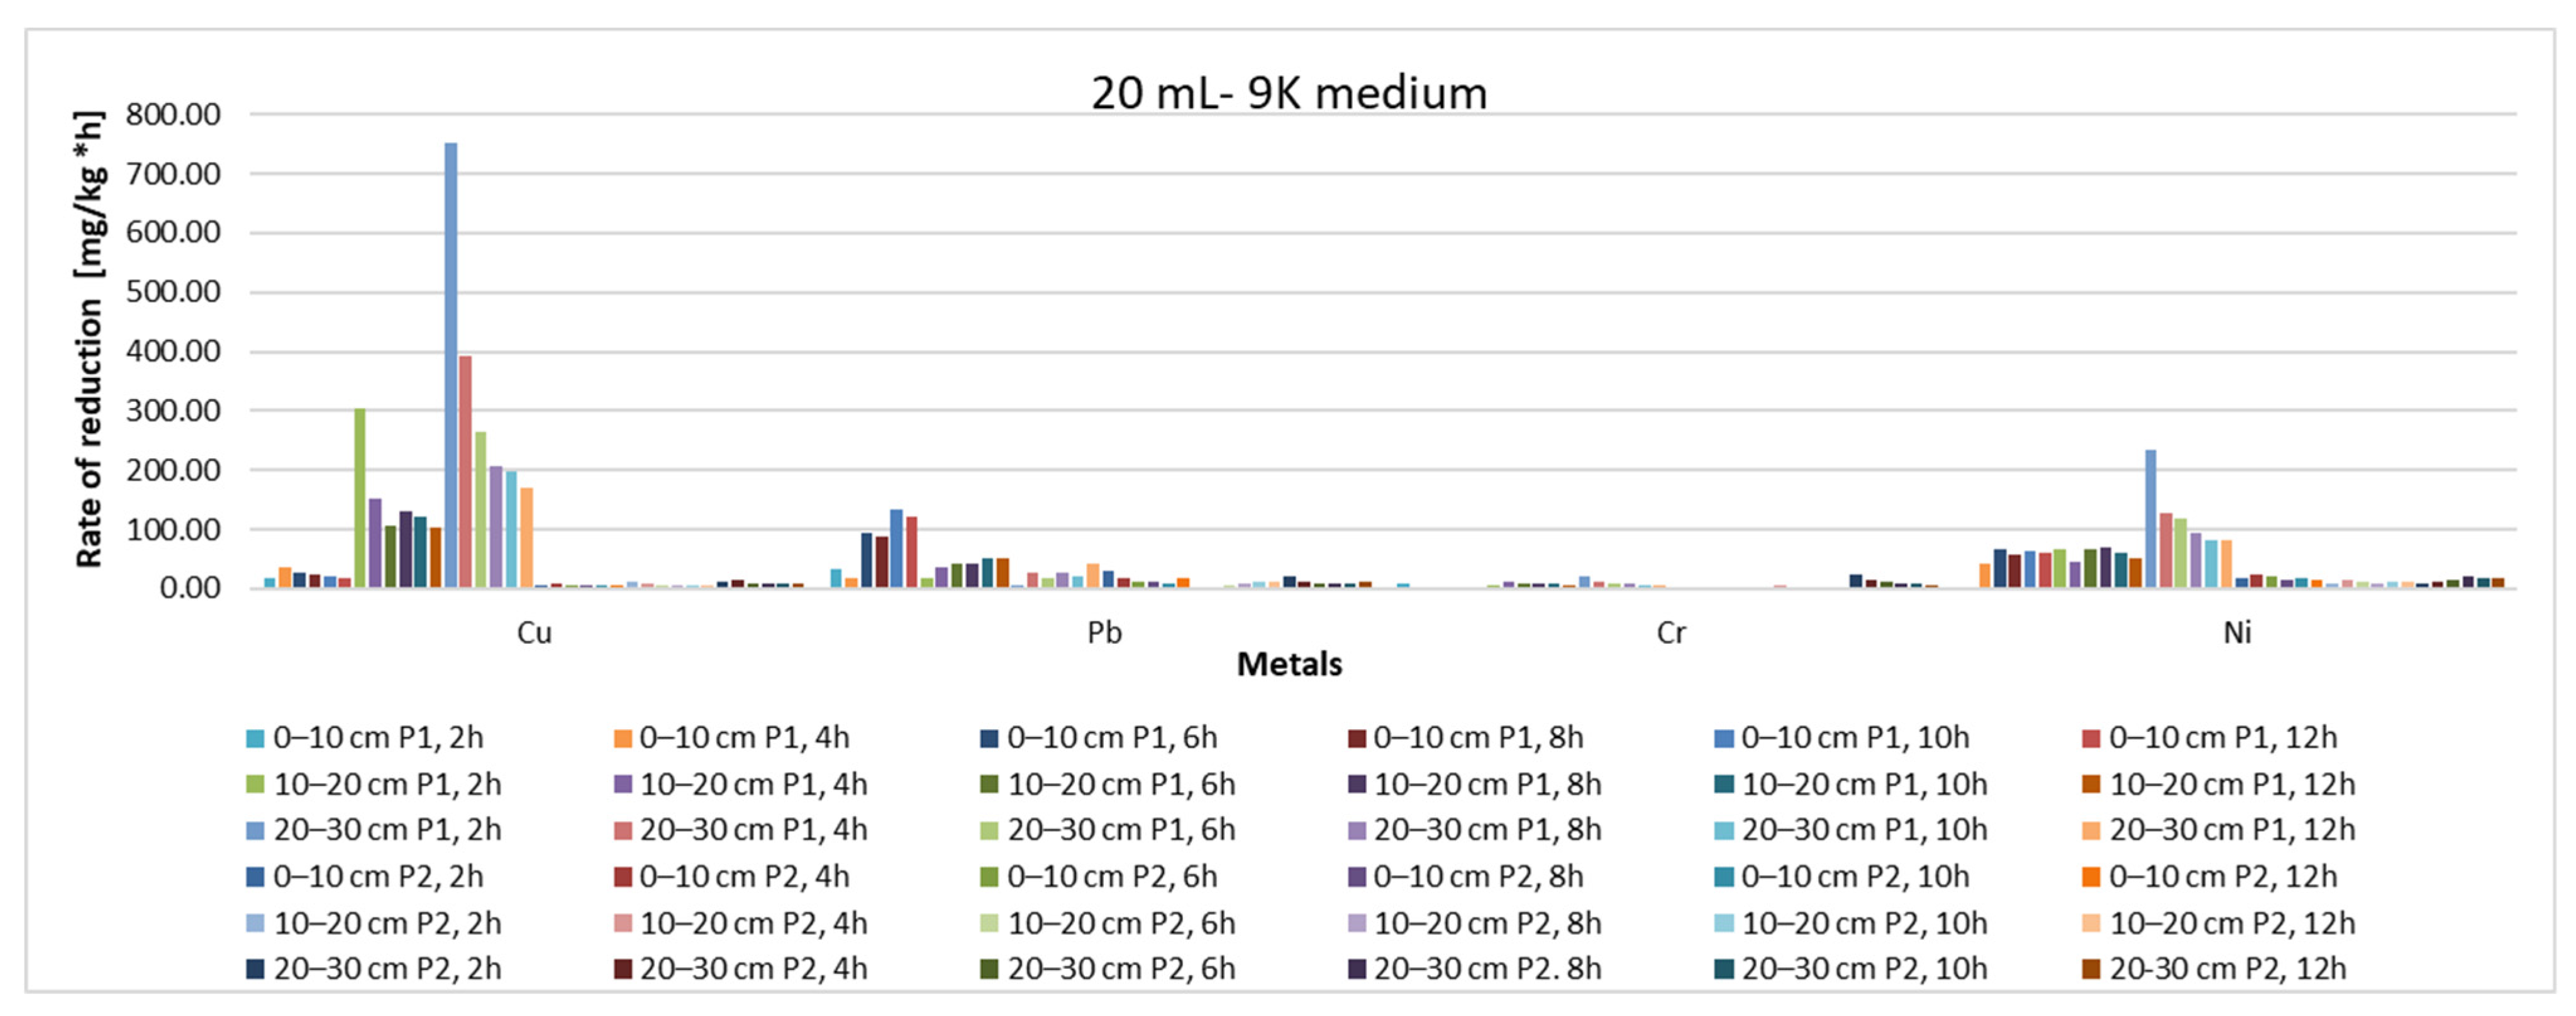
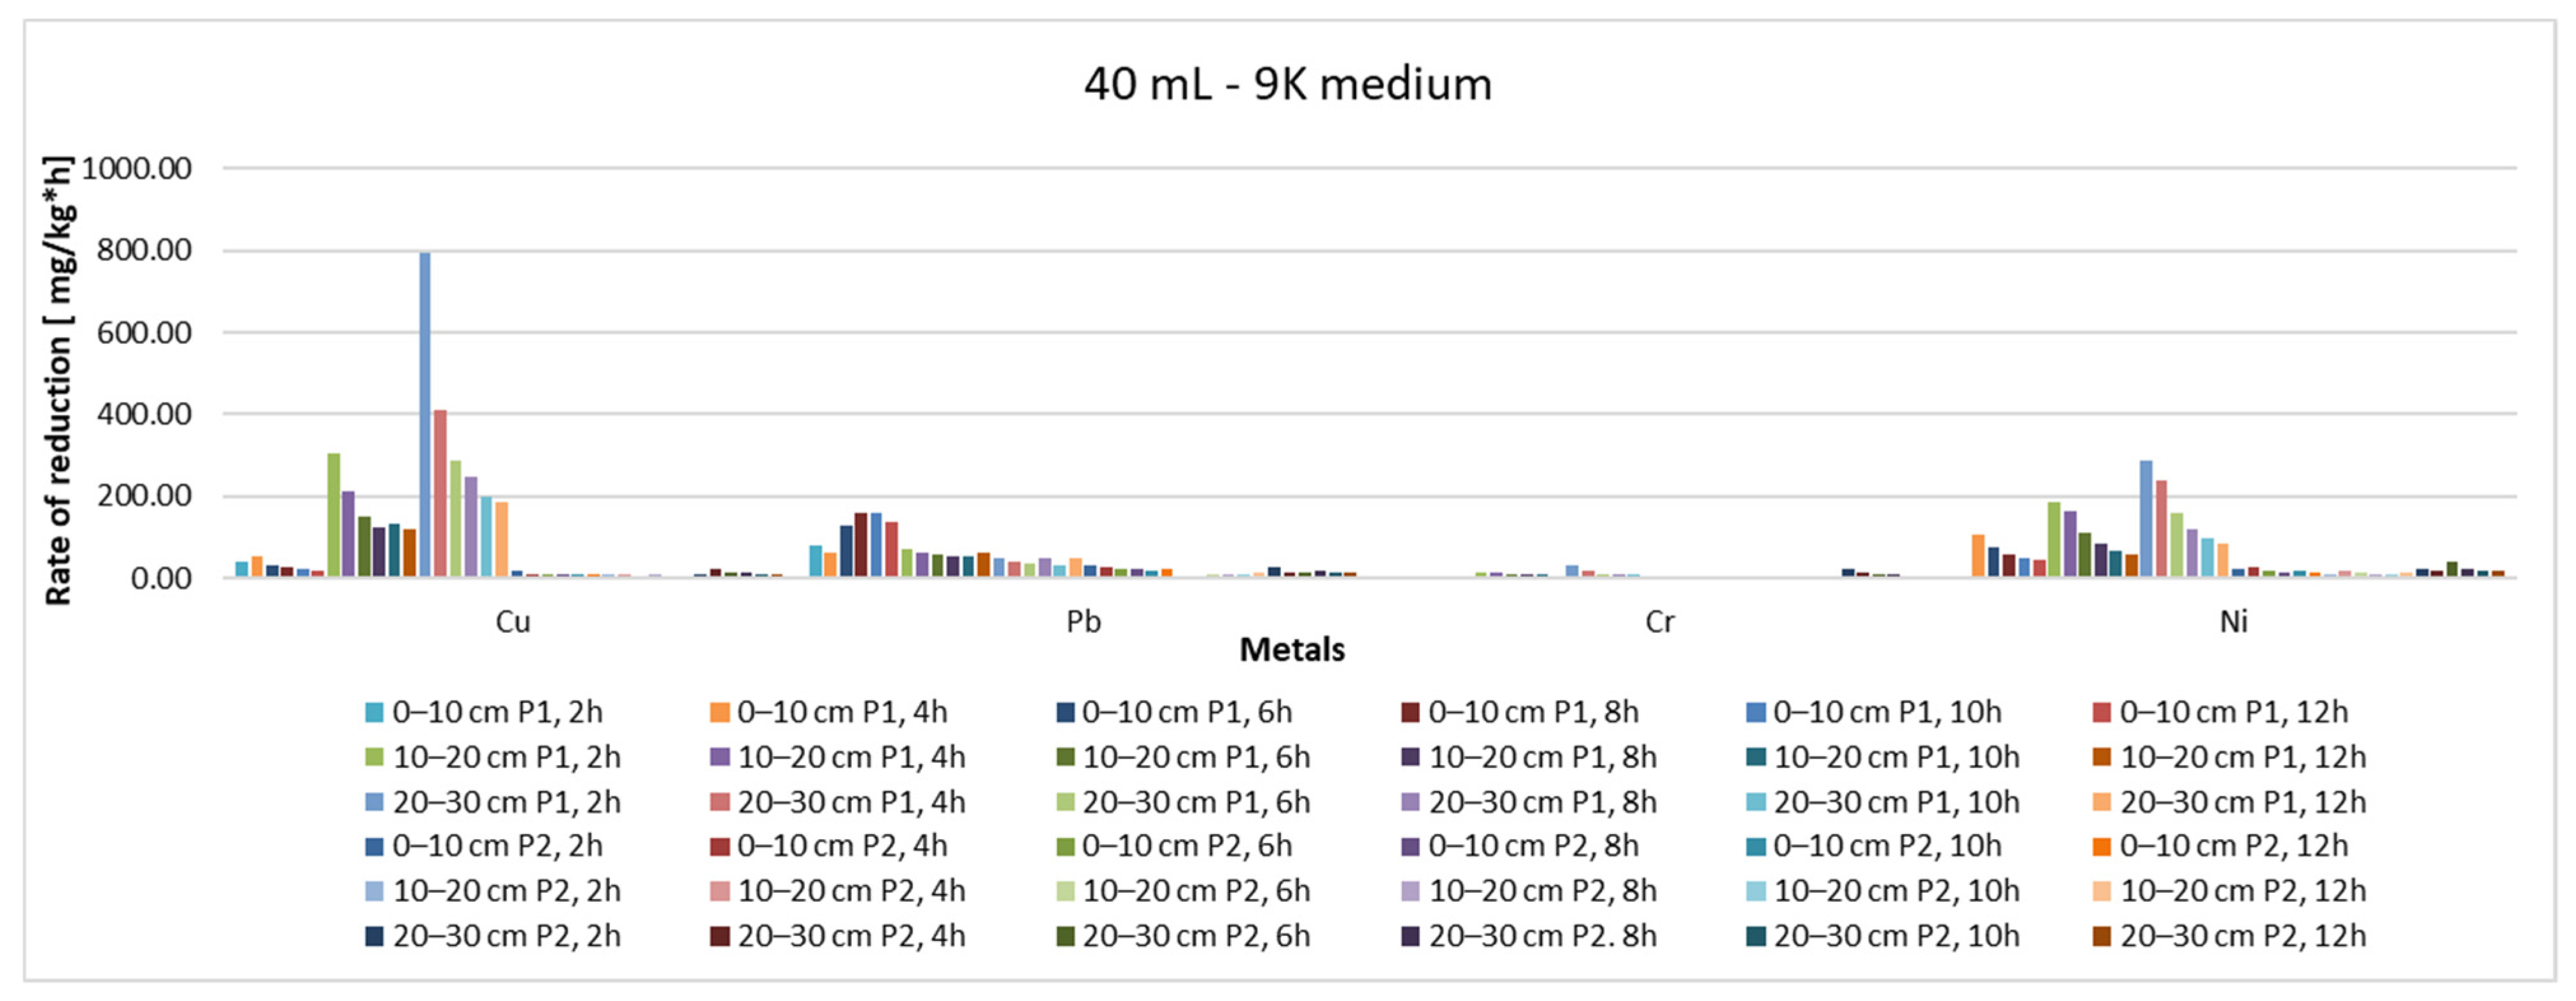
3.2. Environmental Risk Assessment during the Bioleaching Process
4. Conclusions
Author Contributions
Funding
Institutional Review Board Statement
Informed Consent Statement
Data Availability Statement
Conflicts of Interest
References
- Healthy Environments for Healthier Populations: Why Do They Matter, and What Can We Do? Licence: CC BYNC-SA 3.0 IGO., Printed in Geneva, Switzerland (WHO/CED/PHE/DO/19.01); World Health Organization: Geneva, Switzerland, 2019.
- Manisalidis, I.; Stavropoulou, E.; Stavropoulos, A.; Bezirtzoglou, E. Environmental and Health Impacts of Air Pollution: A Review. Front. Public Health 2020, 8, 14. [Google Scholar] [CrossRef] [PubMed] [Green Version]
- Dumitru, M.; Manea, A.; Ciobanu, C.; Dumitru, S.; Vrînceanu, N.; Calciu, I.; Tănase, V.; Pred, M.; Rîşnoveanu, I.; Mocanu, V.; et al. Monitoring the Quality of Soils in Romania; Institute for Soil Science Agro-Chemistry and Environment-ICPA: Bucureşti, Romania; Editura Sitech: Craiova, Romania, 2011; Available online: https://www.icpa.ro/proiecte/Proiecte%20nationale/monitoring/atlasICPA.pdf (accessed on 15 April 2022). (In Romanian)
- Briffa, J.; Sinagra, E.; Blundell, R. Heavy metal pollution in the environment and their toxicological effects on humans. Heliyon 2020, 6, e04691. [Google Scholar] [CrossRef] [PubMed]
- Akhtar, N.; Syakir Ishak, M.I.; Bhawani, S.A.; Umar, K. Various Natural and Anthropogenic Factors Responsible for Water Quality Degradation: A Review. Water 2021, 13, 2660. [Google Scholar] [CrossRef]
- Kumar, V.; Radziemska, M. Impact of physiochemical properties, microbes and biochar on bioavailability of toxic elements in the soil: A review. Environ. Geochem. Health 2021, 34811628. [Google Scholar] [CrossRef] [PubMed]
- Kumar, V.; Sharma, A.; Cerdà, A. Heavy Metals in the Environment: Impact, Assessment, and Remediation; Elsevier: Amsterdam, The Netherlands, 2020. [Google Scholar] [CrossRef]
- Weissmannová, H.D.; Pavlovský, J. Indices of soil contamination by heavy metals-Methodology of calculation for pollution assessment (minireview). Environ. Monit. Assess. 2017, 189, 616. [Google Scholar] [CrossRef] [PubMed]
- Ludusan, N. The effects of heavy metal accumulation in soils on the biotic component of the Zlatna Depression. Cadastre Rev. 2007, 7, 189–194. (In Romanian) [Google Scholar]
- Micle, V.; Neag, G. Soil and Groundwater Remediation Processes and Equipment; UT Press: Cluj-Napoca, Romania, 2009; ISBN 978-973-662-447-6. (In Romanian) [Google Scholar]
- Zeng, J.; Gou, M.; Tang, Y.Q.; Li, G.Y.; Sun, Z.Y.; Kida, K.J. Effective bioleaching of chromium in tannery sludge with an enriched sulfur-oxidizing bacterial community. Bioresour. Technol. 2016, 218, 859–866. [Google Scholar] [CrossRef]
- Zheng, C.H.; Huang, Y.J.; Guo, J.S.; Cai, R.Y.; Zheng, H.D.; Lin, C.; Chen, Q.G. Investigation of cleaner sulfide mineral oxidation technology: Simulation and evaluation of stirred bioreactors for gold-bioleaching process. J. Clean. Prod. 2018, 192, 364–375. [Google Scholar] [CrossRef]
- Liu, Y.-G.; Zhou, M.; Zeng, G.-M.; Wang, X.; Li, X.; Fan, T.; Xu, W.-H. Bioleaching of heavy metals from mine tailings by indigenous sulfur-oxidizing bacteria: Effects of substrate concentration. Bioresour. Technol. 2008, 99, 4124–4129. [Google Scholar] [CrossRef]
- Băbuţ, C.S.; Micle, V.; Potra, A.F. Reflection on Remediation of Heavy Metals Contaminated Soils Using Bioleaching. In Analele Universităţii Constantin Brâncuşi, Seria Inginerie; Universităţii Constantin Brâncuşi: Târgu Jiu, Romania, 2011; Volume 3, pp. 368–378. [Google Scholar]
- Jerez, C.A. Biomining Microorganisms: Molecular Aspects and Applications in Biotechnology and Bioremediation—Soil Biology. In Advances in Applied Bioremediation; Springer: Berlin/Heidelberg, Germany, 2009. [Google Scholar]
- Chen, X. Thriving at Low pH: Adaptation Mechanisms of Acidophiles. In Acidophiles—Fundamentals and Applications; Lin, J., Chen, L., Lin, J., Eds.; IntechOpen: London, UK, 2021; Available online: https://www.intechopen.com/chapters/75730 (accessed on 15 April 2022). [CrossRef]
- Barrie Johnson, D. Biodiversity and ecology of acidophilic microorganisms. FEMS Microbiol. Ecol. 1998, 27, 307–317. [Google Scholar] [CrossRef]
- Falagán, C.; Barrie Johnson, D. The significance of pH in dictating the relative toxicities of chloride and copper to acidophilic bacteria. Res. Microbiol. 2018, 169, 552–557. [Google Scholar] [CrossRef]
- Jayesh, D.-S.-D.-M. Bioleaching of Lateritic Nickel Ore Using Chemolithotrophic Microorganisms (Acidithiobacillus ferrooxidans); National Institute of Technology Rourkela: Rourkela, India, 2007. [Google Scholar]
- Chen, S.-Y.; Lin, J.-G. Bioleaching of heavy metals from contaminated sediment by indigenous sulfur-oxidizing bacteria in an air-lift bioreactor: Effects of sulfur concentration. Water Res. 2004, 38, 3205–3214. [Google Scholar] [CrossRef] [PubMed]
- Volke Sepúlveda, T.; Juan, A.; Velasco Trejo, J.A.; de la Rosa Pérez, D.A. Suelos Contaminados por Metales y Metaloides: Muestreo y Alternatives Para su Remediación; Secretaría de Medio Ambiente y Recursos Naturales; Instituto Nacional de Ecología: Mexico City, Mexico, 2005.
- Rawlings, D.E.; Kusano, T. Molecular genetics of Thiobacillus ferrooxidans. Microbiol. Rev. 1994, 58, 39–55. [Google Scholar] [CrossRef] [PubMed]
- Kowalska, J.B.; Mazurek, R.; Gasiorek, M.; Zaleski, T. Pollution indices as useful tools for the comprehensive evaluation of the degree of soil contamination—A review. Environ. Geochem. Health 2018, 40, 2395–2420. [Google Scholar] [CrossRef] [PubMed] [Green Version]
- Golia, E.E.; Papadimou, S.G.; Cavalaris, C.; Tsiropoulos, N.G. Level of Contamination Assessment of Potentially Toxic Elements in the Urban Soils of Volos City (Central Greece). Sustainability 2021, 13, 2029. [Google Scholar] [CrossRef]
- Muller, G. Index of geoaccumulation in sediments of the Rhine River. GeoJournal 1969, 2, 108–118. [Google Scholar]
- Hakanson, L. An ecological risk index for aquatic pollution control a sedimentological approach. Water Res. 1980, 14, 975–1001. [Google Scholar] [CrossRef]
- Islam, M.S.; Ahmed, M.K.; Al-Mamun, M.H. Metal speciation in soil and health risk due to vegetables consumption in Bangladesh. Environ. Monit. Assess. 2015, 187, 288–303. [Google Scholar] [CrossRef]
- Shaheen, S.M.; Shams, M.S.; Khalifa, M.R.; El-Daly, M.A.; Rinklebe, J. Various soil amendments and wastes affect the (im)mobilization and phytoavailability of potentially toxic elements in a sewage effluent irrigated sandy soil. Ecotoxicol. Environ. Saf. 2017, 142, 375–387. [Google Scholar] [CrossRef]
- Setia, R.; Dhaliwal, S.S.; Kumar, V.; Singh, R.; Dhir, N.; Surinder, S.; Kukal, S.S.; Pateriya, B. Assessment of metal contamination in sediments of a perennial river in India using pollution indices and multivariate statistics. Arab. J. Geosci. 2021, 14, 2190. [Google Scholar] [CrossRef]
- Ke, X.; Gui, S.; Huang, H.; Zhang, H.; Wang, C.; Guo, W. Ecological risk assessment and source identification for heavy metals in surface sediment from the Liaohe River protected area, China. Chemosphere 2017, 175, 473–481. [Google Scholar] [CrossRef] [PubMed]
- Rouchalova, D.; Rouchalova, K.; Janakova, I.; Cablik, V.; Janstova, S. Bioleaching of Iron, Copper, Lead, and Zinc from the Sludge Mining Sediment at Different Particle Sizes, pH, and Pulp Density Using Acidithiobacillus ferrooxidans. Minerals 2020, 10, 1013. [Google Scholar] [CrossRef]
- Groudev, S.N.; Georgiev, P.S.; Komnitsas, K. In Situ Bioremediation of a Soil Contaminated with Heavy Metals and Arsenic. In Proceedings of the Bioremediation of Inorganic Compounds: The Sixth International in Situ and On-Site Bioremediation Symposium, San Diego, CA, USA, 4–7 June 2001; Leeson, A., Peyton, B.M., Means, J.L., Magar, V.S., Eds.; Volume 6, pp. 97–103. [Google Scholar]
- Kamizela, T.; Worwag, M. Processing of Water Treatment Sludge by Bioleaching. Energies 2020, 13, 6539. [Google Scholar] [CrossRef]
- Peng, G.; Tian, G.; Liu, J.; Bao, Q.; Zang, L. Removal of heavy metals from sewage sludge with a combination of bioleaching and electrokinetic remediation technology. Desalination 2011, 271, 100–104. [Google Scholar] [CrossRef]
- Pathak, A.; Dastidar, M.G.; Sreekrishnan, T.R. Bioleaching of heavy metals from sewage sludge: A review. J. Environ. Manag. 2009, 90, 2343–2353. [Google Scholar] [CrossRef]
- Johnson, D.B. Biomining—biotechnologies for extracting and recovering metals from ores and waste materials. Curr. Opin. Biotechnol. 2014, 30, 24–31. [Google Scholar] [CrossRef]
- Kim, B.-J.; Koh, Y.-K.; Kwon, J.-S. Bioleaching of Pyrrhotite with Bacterial Adaptation and Biological Oxidation for Iron Recovery. Metals 2021, 11, 295. [Google Scholar] [CrossRef]
- Podder, P.; Zhang, Z.; Honaker, R.Q.; Free, M.L.; Sarswat, P.K. Evaluating and Enhancing Iron Removal via Filterable Iron Precipitates Formation during Coal-Waste Bioleaching. Eng 2021, 2, 632–642. [Google Scholar] [CrossRef]
- Duyusen, G.; Gorkem, A. Heavy metals partitioning in the sediments of Izmir Inner Bay. J. Environ. Sci. 2008, 20, 413–418. [Google Scholar] [CrossRef]
- Beolchini, F.; Dell’Anno, A.; Fonti, V.; Rocchetti, L.; Ubaldini, S.; Vegliò, F.; Danovaro, R. Bioleaching as a bioremediation strategy for dredged sediments polluted by heavy metals. In Proceedings of the 4th European Bioremediation Conference, Chania, Greece, 3–6 September 2008; pp. 1–5. [Google Scholar]
- Couillard, D.; Chartier, M.; Mercier, G. Study of the abduction of Cd, Cu, Mn and Zn by biological solubilization in the lacustrine sediments heavily contaminated. J. Water Sci. 1994, 7, 251–268. [Google Scholar]
- Zhou, Q.; Gao, J.; Li, Y.; Zhu, S.; He, L.; Nie, W.; Zhang, R. Bioleaching in batch tests for improving sludge dewaterability and metal removal using Acidithiobacillus ferrooxidans and Acidithiobacillus thiooxidans after cold acclimation. Water Sci. Et Technol. 2017, 76, 1347–1359. [Google Scholar] [CrossRef] [PubMed]
- Blais, J.F.; Tyagi, R.D.; Auclair, J.C. Bioleaching of metals from sewage sludge: Microorganisms and growth kinetics. Water Res. 1993, 27, 101–110. [Google Scholar] [CrossRef]
- Ivănuş, R.C.; Bică, G. Economic aspects the bioleaching of polluting waste containing copper. Studia Univ. "Vasile Goldiş" Ser. Econ. Sci. 2007, 12, 109–117. [Google Scholar]
- Ivănuş, R.C. Bioleaching Solubilization; Universitaria Press: Craiova, Romania, 2005. (In Romanian) [Google Scholar]
- Wang, J.; Qin, W.-Q.; Zhang, Y.-S.; Yang, C.-R.; Zhang, J.-W.; Nai, S.-S.; Shang, H.; Qiu, G.-Z. Bacterial leaching of chalcopyrite and bornite with native bioleaching microorganism. Trans. Nonferrous Met. Soc. China 2008, 18, 1468–1472. [Google Scholar] [CrossRef]
- Nakade, D.B. Biomining of Copper Using Halophilic Thiobacillus ferroxidans N-9. Adv. Life Sci. 2013, 2, 19–22. [Google Scholar]
- Conić, V.T.; Rajčić Vujasinović, M.M.; Trujić, V.K.; Cvetkovski, V.B. Copper, Zinc, and Iron Bioleaching from Polymetallic Sulphide Concentrate. Trans. Nonferrous Met. Soc. China 2014, 24, 3688–3695. [Google Scholar] [CrossRef]
- Li, Q.; Wang, C.; Li, B.; Sun, C.; Deng, F.; Song, C.; Wang, S. Isolation of Thiobacillus spp. and its application in the removal of heavy metals from activated sludge. Afr. J. Biotechnol. 2012, 11, 16336–16341. [Google Scholar]
- Chen, S.Y.; Chiu, Y.C.; Chang, P.L.; Lin, J.G. Assessment of recoverable forms of sulphur particles used in bioleaching of contaminated sediments. Water Res. 2003, 37, 450–458. [Google Scholar] [CrossRef]
- Chen, S.Y.; Lin, J.G. Influence of solid content on bioleaching of heavy metals from contaminated sediment by Thiobacillus spp. J. Chem. Technol. Biotechnol. 2000, 75, 649–656. [Google Scholar] [CrossRef]
- STAS 7184/1-84; Soils. Sampling for Pedological and Agrochemical Studies. ASRO: Bucharest, Romania, 1984. (In Romanian)
- SR ISO 11464:1998; Soil Quality. Pretreatment of Samples for Physico-Chemical Analysis. ASRO: Bucharest, Romania, 1998. (In Romanian)
- Sur, I.M.; Micle, V.; Polyak, E.T.; Gabor, T. Assessment of Soil Quality Status and the Ecological Risk in the Baia Mare, Romania Area. Sustainability 2022, 14, 3739. [Google Scholar] [CrossRef]
- Babau, A.M.C.; Micle, V.; Damian, G.E.; Sur, I.M. Sustainable Ecological Restoration of Sterile Dumps Using Robinia pseudoacacia. Sustainability 2021, 13, 14021. [Google Scholar] [CrossRef]
- Damian, G.E.; Micle, V.; Sur, I.M.; Chirila Babau, A.M. From environmental ethics to sustainable decision making: Assessment of potential ecological risk in soils around abandoned mining areas-case study “Larga de Sus mine” (Romania). J. Agric. Environ. Ethics 2019, 32, 27–49. [Google Scholar] [CrossRef]
- Silverman, M.P.; Lundgren, D.G. Studies on the chemoautotrophic iron bacterium Ferrobacillus ferrooxidans. I. An imnproved medium and a harvesting procedure for securing high cell yields. J. Bacteriol. 1959, 77, 642–647. [Google Scholar] [CrossRef] [PubMed] [Green Version]
- Levei, E.; Frentiu, T.; Ponta, M.; Tanaselia, C.; Borodi, G. Characterization and assessment of potential environmental risk of tailings stored in seven impoundments in the Aries river basin, Western Romania. Chem. Cent. J. 2013, 7, 5. [Google Scholar] [CrossRef] [PubMed] [Green Version]
- Saha, S.; Hazra, G.C.; Saha, B.; Mandal, B. Assessment of heavy metals contamination in different crops grown in long-term sewage-irrigated areas of Kolkata, West Bengal, India. Environ. Monit. Assess. 2015, 187, 4087. [Google Scholar] [CrossRef] [PubMed]
- Kabata-Pendias, A. Trace Elements in Soils and Plants, 4th ed.; CRC Press: Boca Raton, FL, USA, 2010. [Google Scholar] [CrossRef]
- Kükrer, S.; Şeker, S.S.; Murathan, Z.T.; Kutlu, B. Ecological risk assessment of heavy metals in surface sediments of northern littoral zone of Lake Cildir, Ardahan, Turkey. Environ. Monit. Assess. 2014, 186, 3847–3857. [Google Scholar] [CrossRef]
- Gong, Q.; Deng, J.; Xiang, Y.; Wang, Q.; Yang, L. Calculating Pollution Indices by Heavy Metals in Ecological Geochemistry Assessment and a Case Study in Parks of Beijing. J. China Univ. Geosci. 2008, 19, 230–241. [Google Scholar] [CrossRef]
- Yan, T.; Zhao, W.; Yu, X.; Li, H.; Gao, Z.; Ding, M.; Yue, J. Evaluating heavy metal pollution and potential risk of soil around a coal mining region of Tai’an City, China. Alex. Eng. J. 2022, 61, 2156–2165. [Google Scholar] [CrossRef]
- Bahemmat, M.; Farahbakhsh, M.; Kianirad, M. Humic Substances-enhanced Electroremediation of Heavy Metals Contaminated Soil. J. Hazard. Mater. 2016, 312, 307. [Google Scholar] [CrossRef]
- USEPA. Treatment Technologies for Site Cleanup; Annual Status Report; United States Environmental Protection Agency: Washington, DC, USA, 2007.
- Order No. 756 of 3 November 1997 for the Approval of the Regulation on Environmental Pollution Assessmen; Published in: Official Gazette No 303 bis of 6 November 1997; Ministry of Waters, Forests and Environmental Protection: Bucharest, Romania. Available online: http://legislatie.just.ro/Public/DetaliiDocumentAfis/151788 (accessed on 15 April 2022). (In Romanian).
- Qian, J.; Wei, L.; Liu, R.; Jiang, F.; Hao, X.; Chen, G.H. An exploratory study on the pathways of Cr (VI) reduction in sulfate-reducing up-flow anaerobic sludge bed (UASB) reactor. Sci. Rep. 2016, 6, 23694. [Google Scholar] [CrossRef] [Green Version]
- Chen, S.-Y.; Wang, S.-Y. Effects of Solid Content and Substrate Concentration on Bioleaching of Heavy Metals from Sewage Sludge Using Aspergillus niger. Metals 2019, 9, 994. [Google Scholar] [CrossRef] [Green Version]
- Elkina, Y.; Nechaeva, A.; Artykova, A.; Kolosoff, A.; Bugubaeva, A.; Melamud, V.; Mardanov, A.; Bulaev, A. Continuous Bioleaching of Arsenic-Containing Copper-Zinc Concentrate and Shift of Microbial Population under Various Conditions. Minerals 2022, 12, 592. [Google Scholar] [CrossRef]
- Kaur, P.; Sharma, S.; Albarakaty, F.M.; Kalia, A.; Hassan, M.M.; Abd-Elsalam, K.A. Biosorption and Bioleaching of Heavy Metals from Electronic Waste Varied with Microbial Genera. Sustainability 2022, 14, 935. [Google Scholar] [CrossRef]
- Rinklebe, J.; Antoniadis, V.; Shaheen, S.M.; Rosche, O.; Altermann, M. Health risk assessment of potentially toxic elements in soils along the Central Elbe River, Germany. Environ. Int. 2019, 126, 76–88. [Google Scholar] [CrossRef] [PubMed]
- Gabersek, M.; Gosar, M. Geochemistry of urban soil in the industrial town of Maribor, Slovenia. J. Geochem. Explor. 2018, 187, 141–154. [Google Scholar] [CrossRef]
- Antoniadis, V.; Golia, E.E.; Liu, Y.; Wang, S.; Shaheen, S.M.; Rinklebe, J. Soil and maize contamination by trace elements and associated health risk assessment in the industrial area of Volos, Greece. Environ. Int. 2019, 124, 79–88. [Google Scholar] [CrossRef]


| PARAMETERS | Cf—Contamination factor [8,27,28] | Cf < 1—Low contamination factor | |
| 1 ≤ Cf < 3—Moderate contamination factor | |||
| 3 ≤ Cf < 6—Considerable contamination factor | |||
| Cf ≥ 6—Very high contamination factor | |||
| Cd—Degree of Contamination [8,58] | Cd < 8—Low degree of contamination | ||
| 8 ≤ Cd ≤ 16—Moderate degree of contamination | |||
| 16 ≤ Cd ≤ 32—Considerable degree of contamination | |||
| Cd > 32—Very high degree of contamination | |||
| PLI—Pollution Load Index [27,28,59] | PLI < 1—Not polluted soil | ||
| PLI = 1—Soil with normal background level | |||
| PLI > 1—Polluted soil | |||
| Er—Ecological risk index [8,60] | Er < 40—Low ecological risk | ||
| 40 < Er ≤ 80—Moderate ecological risk | |||
| 80 < Er ≤ 160—Considerable ecological risk | |||
| 160 < Er ≤ 320—High ecological risk | |||
| Er > 320—Serious ecological risk | |||
| PERI—Potential Ecological Risk Index [8,61] | PERI < 150—Low ecological risk | ||
| 150 ≤ PERI < 300—Moderate ecological risk | |||
| 300 ≤ PERI < 600—High potential ecological risk | |||
| PERI ≥ 600—Significantly high ecological risk |
| Sample | Cf | Cd | PLI | ||||||
|---|---|---|---|---|---|---|---|---|---|
| Code | Sampling Depth [cm] | Time [h] | 9K Medium [mL] | Cu | Pb | Cr | Ni | ||
| P1 | 0–10 | Initial | - | 28.44 | 272.30 | 0.24 | 59.30 | 360.28 | 18.17 |
| Final (after 12 h) | 20 | 19.92 | 198.95 | 0.24 | 22.65 | 241.76 | 12.12 | ||
| 40 | 18.84 | 189.10 | 0.44 | 32.70 | 241.08 | 15.05 | |||
| 10–20 | Initial | - | 92.44 | 261.15 | 4.34 | 69.35 | 427.28 | 51.93 | |
| Final (after 12 h) | 20 | 42.60 | 229.60 | 2.07 | 37.70 | 311.97 | 29.56 | ||
| 40 | 35.52 | 224.60 | 1.61 | 33.70 | 295.43 | 25.67 | |||
| 20–30 | Initial | - | 118.84 | 254.65 | 4.20 | 84.40 | 462.09 | 57.23 | |
| Final (after 12 h) | 20 | 36.60 | 229.00 | 1.94 | 34.65 | 302.19 | 27.41 | ||
| 40 | 28.60 | 224.00 | 1.66 | 34.15 | 288.41 | 24.54 | |||
| P2 | 0–10 | Initial | - | 8.44 | 52.75 | 0.14 | 13.25 | 74.58 | 5.39 |
| Final (after 12 h) | 20 | 5.24 | 41.80 | 0.33 | 3.55 | 50.92 | 3.99 | ||
| 40 | 4.04 | 39.10 | 0.44 | 3.30 | 46.88 | 3.89 | |||
| 10–20 | Initial | - | 4.32 | 37.55 | 1.80 | 10.05 | 53.72 | 7.36 | |
| Final (after 12 h) | 20 | 1.68 | 29.60 | 0.43 | 2.80 | 34.51 | 2.79 | ||
| 40 | 1.24 | 29.10 | 0.18 | 2.60 | 33.12 | 2.03 | |||
| 20–30 | Initial | - | 11.44 | 32.25 | 2.66 | 18.05 | 64.40 | 11.53 | |
| Final (after 12 h) | 20 | 7.12 | 25.15 | 0.26 | 7.55 | 40.08 | 4.32 | ||
| 40 | 6.80 | 24.10 | 0.03 | 6.50 | 37.43 | 2.35 | |||
| Legend: |  Cf < 1—Low contamination factor Cf < 1—Low contamination factor  Cf: 1–3—Moderate contamination factor Cf: 1–3—Moderate contamination factor Cf: 3–6—Considerable contamination factor Cf: 3–6—Considerable contamination factor |  Cf ≥ 6—Very high contamination factor Cf ≥ 6—Very high contamination factor Cd > 32—Very high degree of contamination Cd > 32—Very high degree of contamination PLI > 1—Polluted soil PLI > 1—Polluted soil | |||||||
| Sample | Er | PERI | ||||||
|---|---|---|---|---|---|---|---|---|
| Code | Sampling Depth [cm] | Time [h] | 9K Medium [mL] | Cu | Pb | Cr | Ni | |
| P1 | 0–10 | Initial | - | 142.20 | 1361.50 | 0.47 | 296.50 | 1800.67 |
| Final (after 12 h) | 20 | 99.60 | 994.75 | 0.48 | 113.25 | 1208.08 | ||
| 40 | 94.20 | 945.50 | 0.88 | 163.50 | 1204.08 | |||
| 10–20 | Initial | - | 462.20 | 1305.75 | 8.69 | 346.75 | 2123.39 | |
| Final (after 12 h) | 20 | 213.00 | 1148.00 | 4.14 | 188.50 | 1553.64 | ||
| 40 | 177.60 | 1123.00 | 3.23 | 168.50 | 1472.33 | |||
| 20–30 | Initial | - | 594.20 | 1273.25 | 8.40 | 422.00 | 2297.85 | |
| Final (after 12 h) | 20 | 183.00 | 1145.00 | 3.89 | 173.25 | 1505.14 | ||
| 40 | 143.00 | 1120.00 | 3.31 | 170.75 | 1437.06 | |||
| P2 | 0–10 | Initial | - | 42.20 | 263.75 | 0.29 | 66.25 | 372.49 |
| Final (after 12 h) | 20 | 26.20 | 209.00 | 0.65 | 17.75 | 253.60 | ||
| 40 | 20.20 | 195.50 | 0.88 | 16.50 | 233.08 | |||
| 10–20 | Initial | - | 21.60 | 187.75 | 3.60 | 50.25 | 263.20 | |
| Final (after 12 h) | 20 | 8.40 | 148.00 | 0.87 | 14.00 | 171.27 | ||
| 40 | 6.20 | 145.50 | 0.36 | 13.00 | 165.06 | |||
| 20–30 | Initial | - | 57.20 | 161.25 | 5.31 | 90.25 | 314.01 | |
| Final (after 12 h) | 20 | 35.60 | 125.75 | 0.51 | 37.75 | 199.61 | ||
| 40 | 34.00 | 120.50 | 0.06 | 32.50 | 187.06 | |||
| Legend: |  Er < 40—Low ecological risk Er < 40—Low ecological risk Er: 40–80—Moderate ecological risk Er: 40–80—Moderate ecological risk Er: 80–160—Considerable ecological risk Er: 80–160—Considerable ecological risk Er: 160–320—High ecological risk Er: 160–320—High ecological risk Er > 320—Serious ecological risk Er > 320—Serious ecological risk |  PERI: 150–300—Moderate ecological risk PERI: 150–300—Moderate ecological risk PERI: 300–600—High potential ecological risk PERI: 300–600—High potential ecological risk PERI ≥ 600—Significantly high ecological risk PERI ≥ 600—Significantly high ecological risk | ||||||
| Code | Sampling Depth [cm] | Pollutant | Correlation Equation of Extraction Yield with Time | Correlation Index, R2 |
|---|---|---|---|---|
| 20 mL 9K medium | ||||
| P1 | 0–10 | Cu | y = 0.078x3 − 1.9413x2 + 16.186x − 20.154 | R2 = 0.9861 |
| Pb | y = −0.0512x3 + 1.1711x2 − 4.9763x + 6.7447 | R2 = 0.9707 | ||
| Cr | y = −0.0933x3 + 2.5869x2 − 19.709x + 63.356 | R2 = 0.9672 | ||
| Ni | y = 0.01x3 − 0.4502x2 + 10.728x − 20.287 | R2 = 0.9899 | ||
| 10–20 | Cu | y = −0.1323x3 + 2.9061x2 − 15.246x + 46.49 | R2 = 0.9751 | |
| Pb | y = −0.0002x3 + 0.0314x2 + 0.7325x − 0.8138 | R2 = 0.9982 | ||
| Cr | y = 0.0557x3 − 1.5327x2 + 15.658x − 20.428 | R2 = 0.9927 | ||
| Ni | y = −0.0779x3 + 1.3926x2 − 2.5333x + 8.6472 | R2 = 0.9811 | ||
| 20–30 | Cu | y = −0.0195x3 + 0.5892x2 − 3.0349x + 54.717 | R2 = 0.9442 | |
| Pb | y = 0.0309x3 − 0.5623x2 + 3.5127x − 4.8439 | R2 = 0.9667 | ||
| Cr | y = 0.0114x3 − 0.1962x2 + 2.8585x + 17.582 | R2 = 0.9985 | ||
| Ni | y = 0.0204x3 − 0.3889x2 + 5.0498x + 17.721 | R2 = 0.9679 | ||
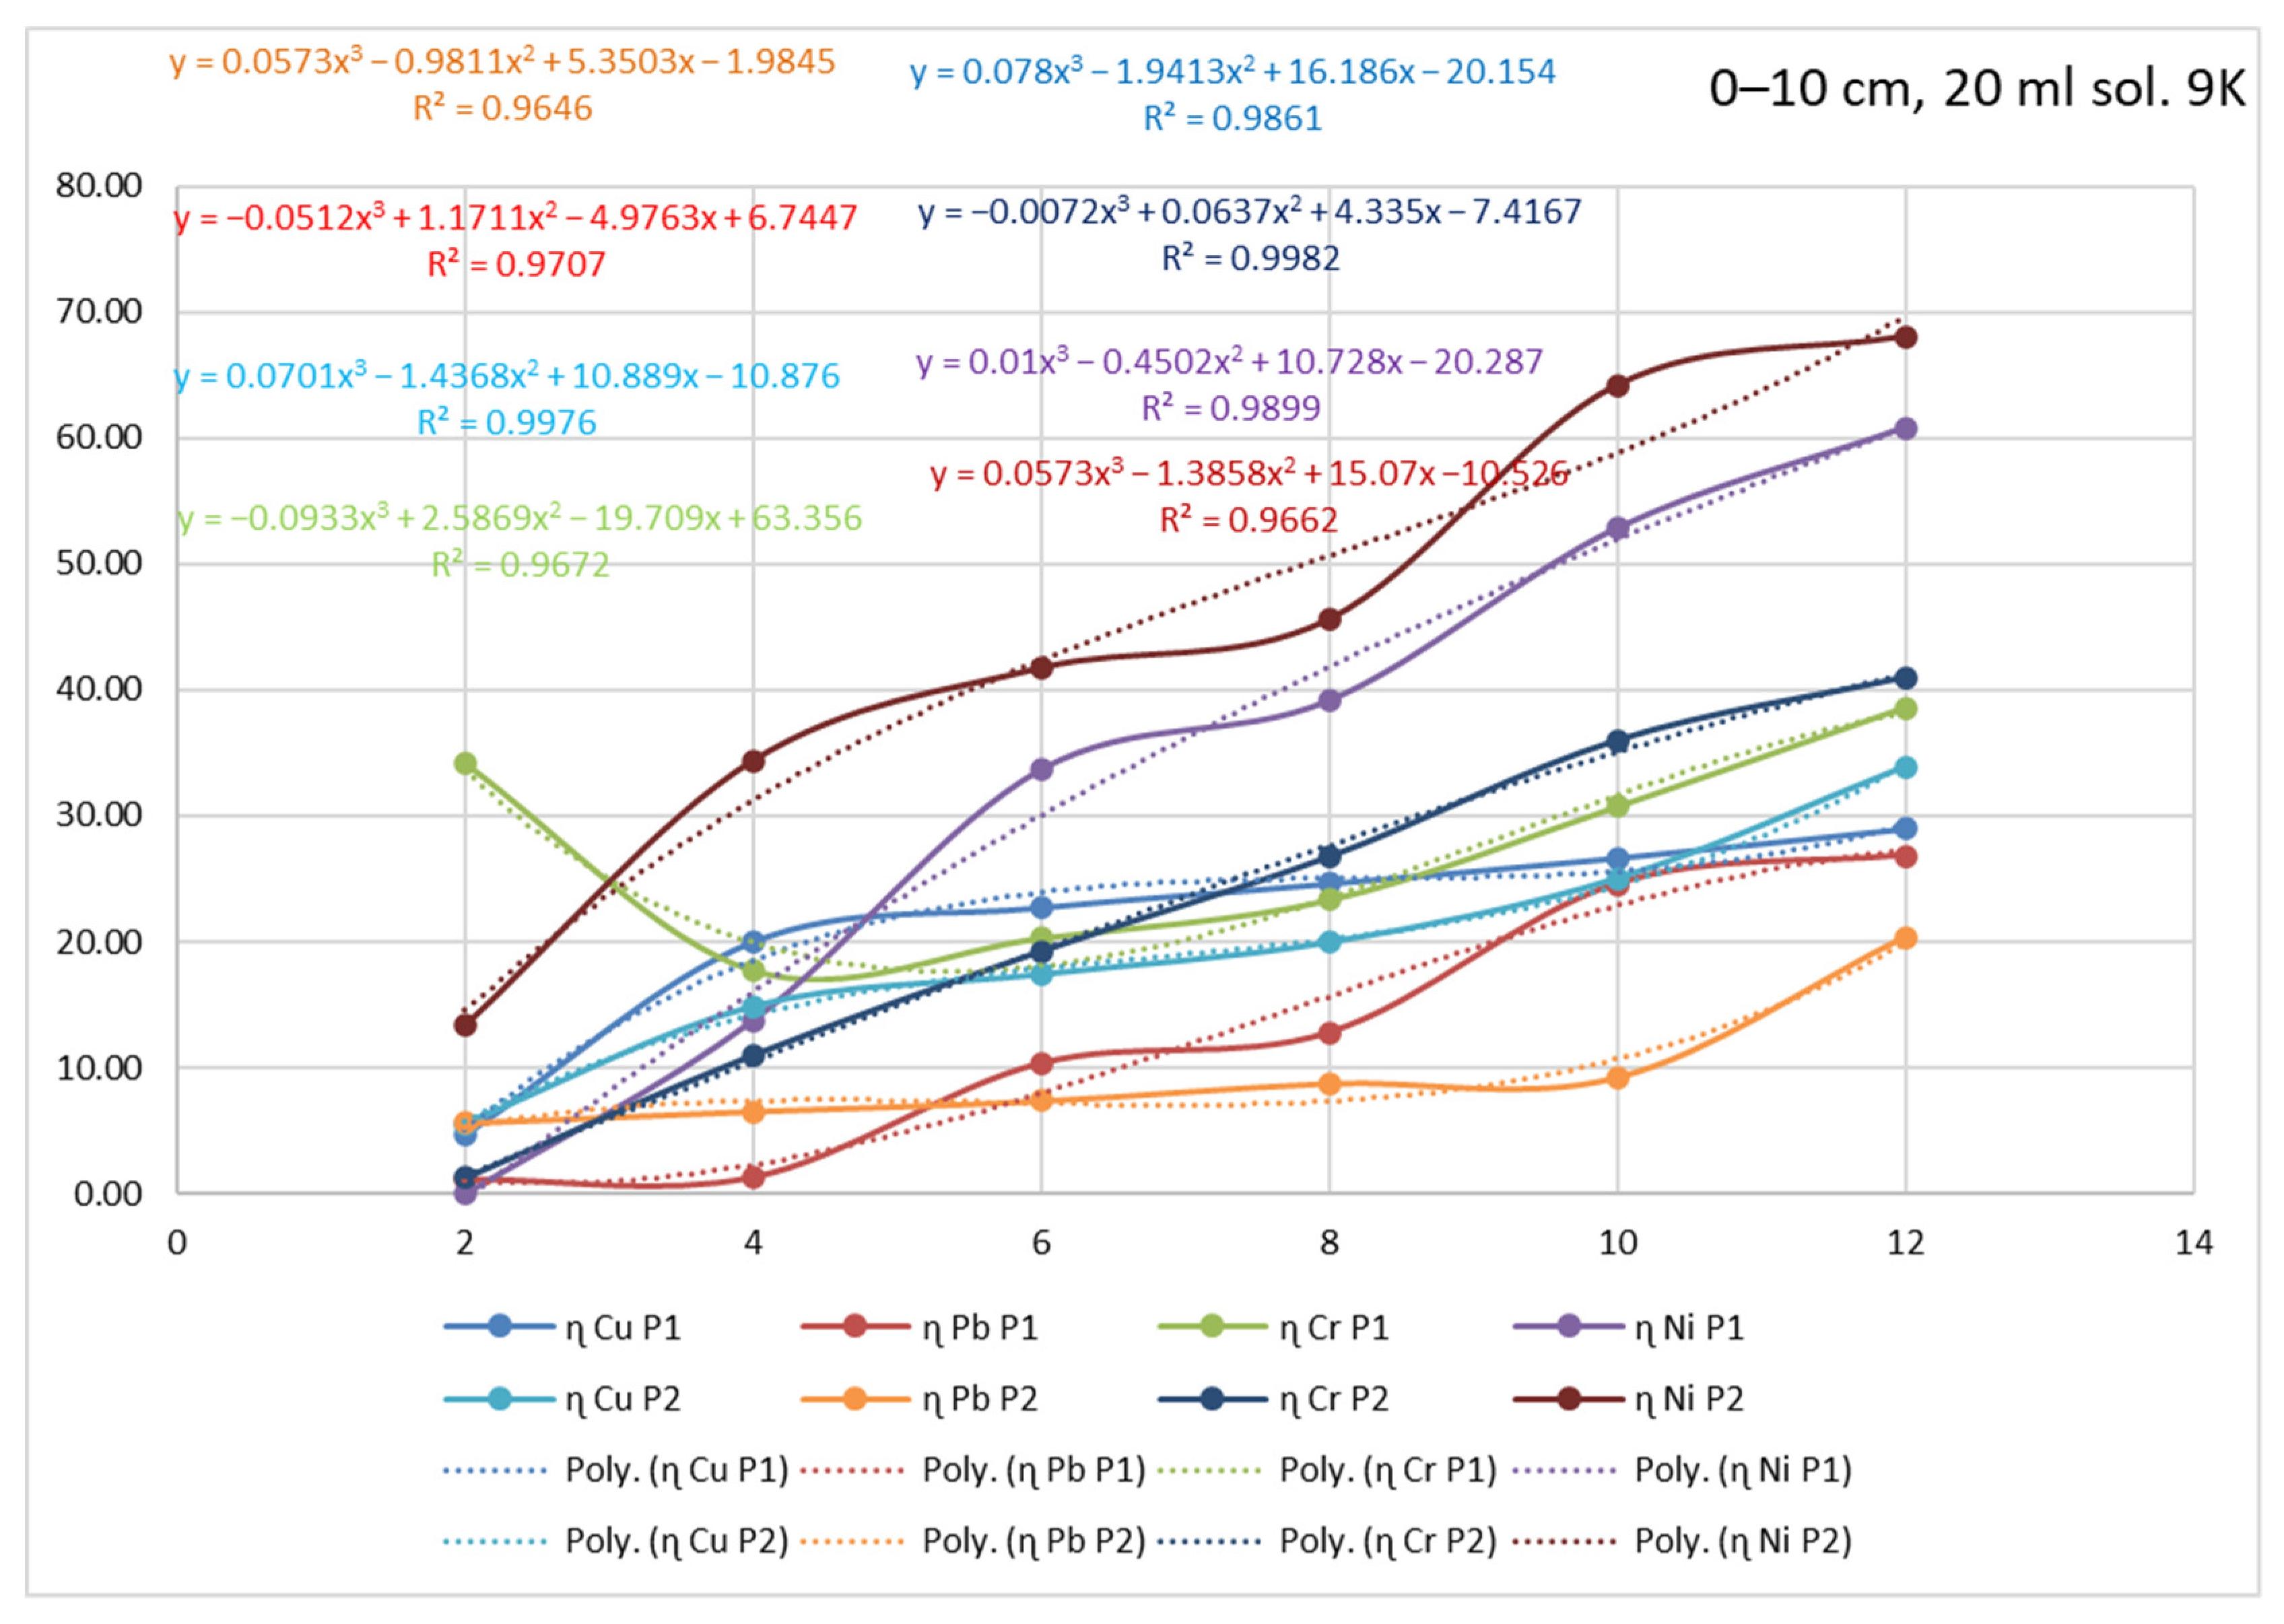
| P2 | 0–10 | Cu | y = 0.0701x3 − 1.4368x2 + 10.889x − 10.876 | R2 = 0.9976 |
| Pb | y = 0.0573x3 − 0.9811x2 + 5.3503x − 1.9845 | R2 = 0.9646 | ||
| Cr | y = −0.0072x3 + 0.0637x2 + 4.335x − 7.4167 | R2 = 0.9982 | ||
| Ni | y = 0.0573x3 − 1.3858x2 + 15.07x − 10.526 | R2 = 0.9662 | ||
| 10–20 | Cu | y = 0.0322x3 − 0.4043x2 + 3.4665x + 11.779 | R2 = 0.9548 | |
| Pb | y = −0.0095x3 + 0.3439x2 − 1.1457x + 1.1673 | R2 = 0.9989 | ||
| Cr | y = 0.129x3 − 2.7375x2 + 20.897x − 30.102 | R2 = 0.9934 | ||
| Ni | y = 0.122x3 − 2.5767x2 + 20.829x − 22.926 | R2 = 0.9794 | ||
| 20–30 | Cu | y = 0.0581x3 − 1.245x2 + 10.208x − 8.3601 | R2 = 0.9869 | |
| Pb | y = 0.019x3 − 0.2151x2 + 1.2339x + 4.9123 | R2 = 0.9924 | ||
| Cr | y = 0.0645x3 − 1.3256x2 + 10.484x + 20.104 | R2 = 0.9706 | ||
| Ni | y = −0.0881x3 + 1.7938x2 − 4.9839x + 8.3115 | R2 = 0.9875 | ||
| 40 mL 9K medium | ||||
| P1 | 0–10 | Cu | y = 0.0761x3 − 1.9138x2 + 15.763x − 11.866 | R2 = 0.9259 |
| Pb | y = −0.0866x3 + 1.7478x2 − 6.8215x + 10.062 | R2 = 0.9982 | ||
| Cr | y = 0.0075x3 − 0.1242x2 + 4.1427x + 11.239 | R2 = 0.9583 | ||
| Ni | y = 0.2053x3 − 5.0242x2 + 39.427x − 59.204 | R2 = 0.9726 | ||
| 10–20 | Cu | y = 0.0237x3 − 0.4359x2 + 5.534x + 17.352 | R2 = 0.9646 | |
| Pb | y = 0.0128x3 − 0.2366x2 + 2.2303x − 1.0236 | R2 = 0.9965 | ||
| Cr | y = 0.0966x3 − 2.2616x2 + 18.62x − 12.941 | R2 = 0.986 | ||
| Ni | y = 0.1115x3 − 2.7581x2 + 21.812x − 6.0412 | R2 = 0.9615 | ||
| 20–30 | Cu | y = −0.0089x3 + 0.2983x2 − 0.4406x + 52.492 | R2 = 0.9773 | |
| Pb | y = 0.0165x3 − 0.2933x2 + 2.2293x − 1.6559 | R2 = 0.8697 | ||
| Cr | y = 0.0114x3 − 0.2845x2 + 3.5453x + 27.473 | R2 = 0.9972 | ||
| Ni | y = 0.1245x3 − 3.0828x2 + 24.233x − 2.42 | R2 = 0.9588 | ||
| P2 | 0–10 | Cu | y = −0.0579x3 + 1.3477x2 − 5.7293x + 20.904 | R2 = 0.9894 |
| Pb | y = 0.0168x3 − 0.2763x2 + 2.8752x + 1.5814 | R2 = 0.9967 | ||
| Cr | y = −0.1264x3 + 3.0672x2 − 18.985x + 54.917 | R2 = 0.982 | ||
| Ni | y = 0.0954x3 − 2.084x2 + 18.132x − 11.345 | R2 = 0.9766 | ||
| 10–20 | Cu | y = −0.0748x3 + 1.3971x2 − 2.7604x + 18.546 | R2 = 0.9819 | |
| Pb | y = 0.018x3 − 0.288x2 + 3.0948x − 4.9287 | R2 = 0.9718 | ||
| Cr | y = 0.1227x3 − 2.3933x2 + 18.265x − 17.483 | R2 = 0.9607 | ||
| Ni | y = 0.1477x3 − 3.2954x2 + 26.529x − 30.769 | R2 = 0.9905 | ||
| 20–30 | Cu | y = 0.0826x3 − 2.1972x2 + 19.483x − 22.508 | R2 = 0.9825 | |
| Pb | y = −0.0656x3 + 1.3786x2 − 6.4111x + 16.04 | R2 = 0.9709 | ||
| Cr | y = 0.0245x3 − 0.2959x2 + 3.2722x + 33.177 | R2 = 0.9967 | ||
| Ni | y = 0.1461x3 − 3.7235x2 + 31.939x − 41.032 | R2 = 0.734 | ||
Publisher’s Note: MDPI stays neutral with regard to jurisdictional claims in published maps and institutional affiliations. |
© 2022 by the authors. Licensee MDPI, Basel, Switzerland. This article is an open access article distributed under the terms and conditions of the Creative Commons Attribution (CC BY) license (https://creativecommons.org/licenses/by/4.0/).
Share and Cite
Sur, I.M.; Micle, V.; Hegyi, A.; Lăzărescu, A.-V. Extraction of Metals from Polluted Soils by Bioleaching in Relation to Environmental Risk Assessment. Materials 2022, 15, 3973. https://doi.org/10.3390/ma15113973
Sur IM, Micle V, Hegyi A, Lăzărescu A-V. Extraction of Metals from Polluted Soils by Bioleaching in Relation to Environmental Risk Assessment. Materials. 2022; 15(11):3973. https://doi.org/10.3390/ma15113973
Chicago/Turabian StyleSur, Ioana Monica, Valer Micle, Andreea Hegyi, and Adrian-Victor Lăzărescu. 2022. "Extraction of Metals from Polluted Soils by Bioleaching in Relation to Environmental Risk Assessment" Materials 15, no. 11: 3973. https://doi.org/10.3390/ma15113973
APA StyleSur, I. M., Micle, V., Hegyi, A., & Lăzărescu, A.-V. (2022). Extraction of Metals from Polluted Soils by Bioleaching in Relation to Environmental Risk Assessment. Materials, 15(11), 3973. https://doi.org/10.3390/ma15113973