
Dynamic Mechanical Properties of TC11 Titanium Alloys Fabricated by Wire Arc Additive Manufacturing

Abstract
:1. Introduction
2. Materials and Methods
2.1. Materials
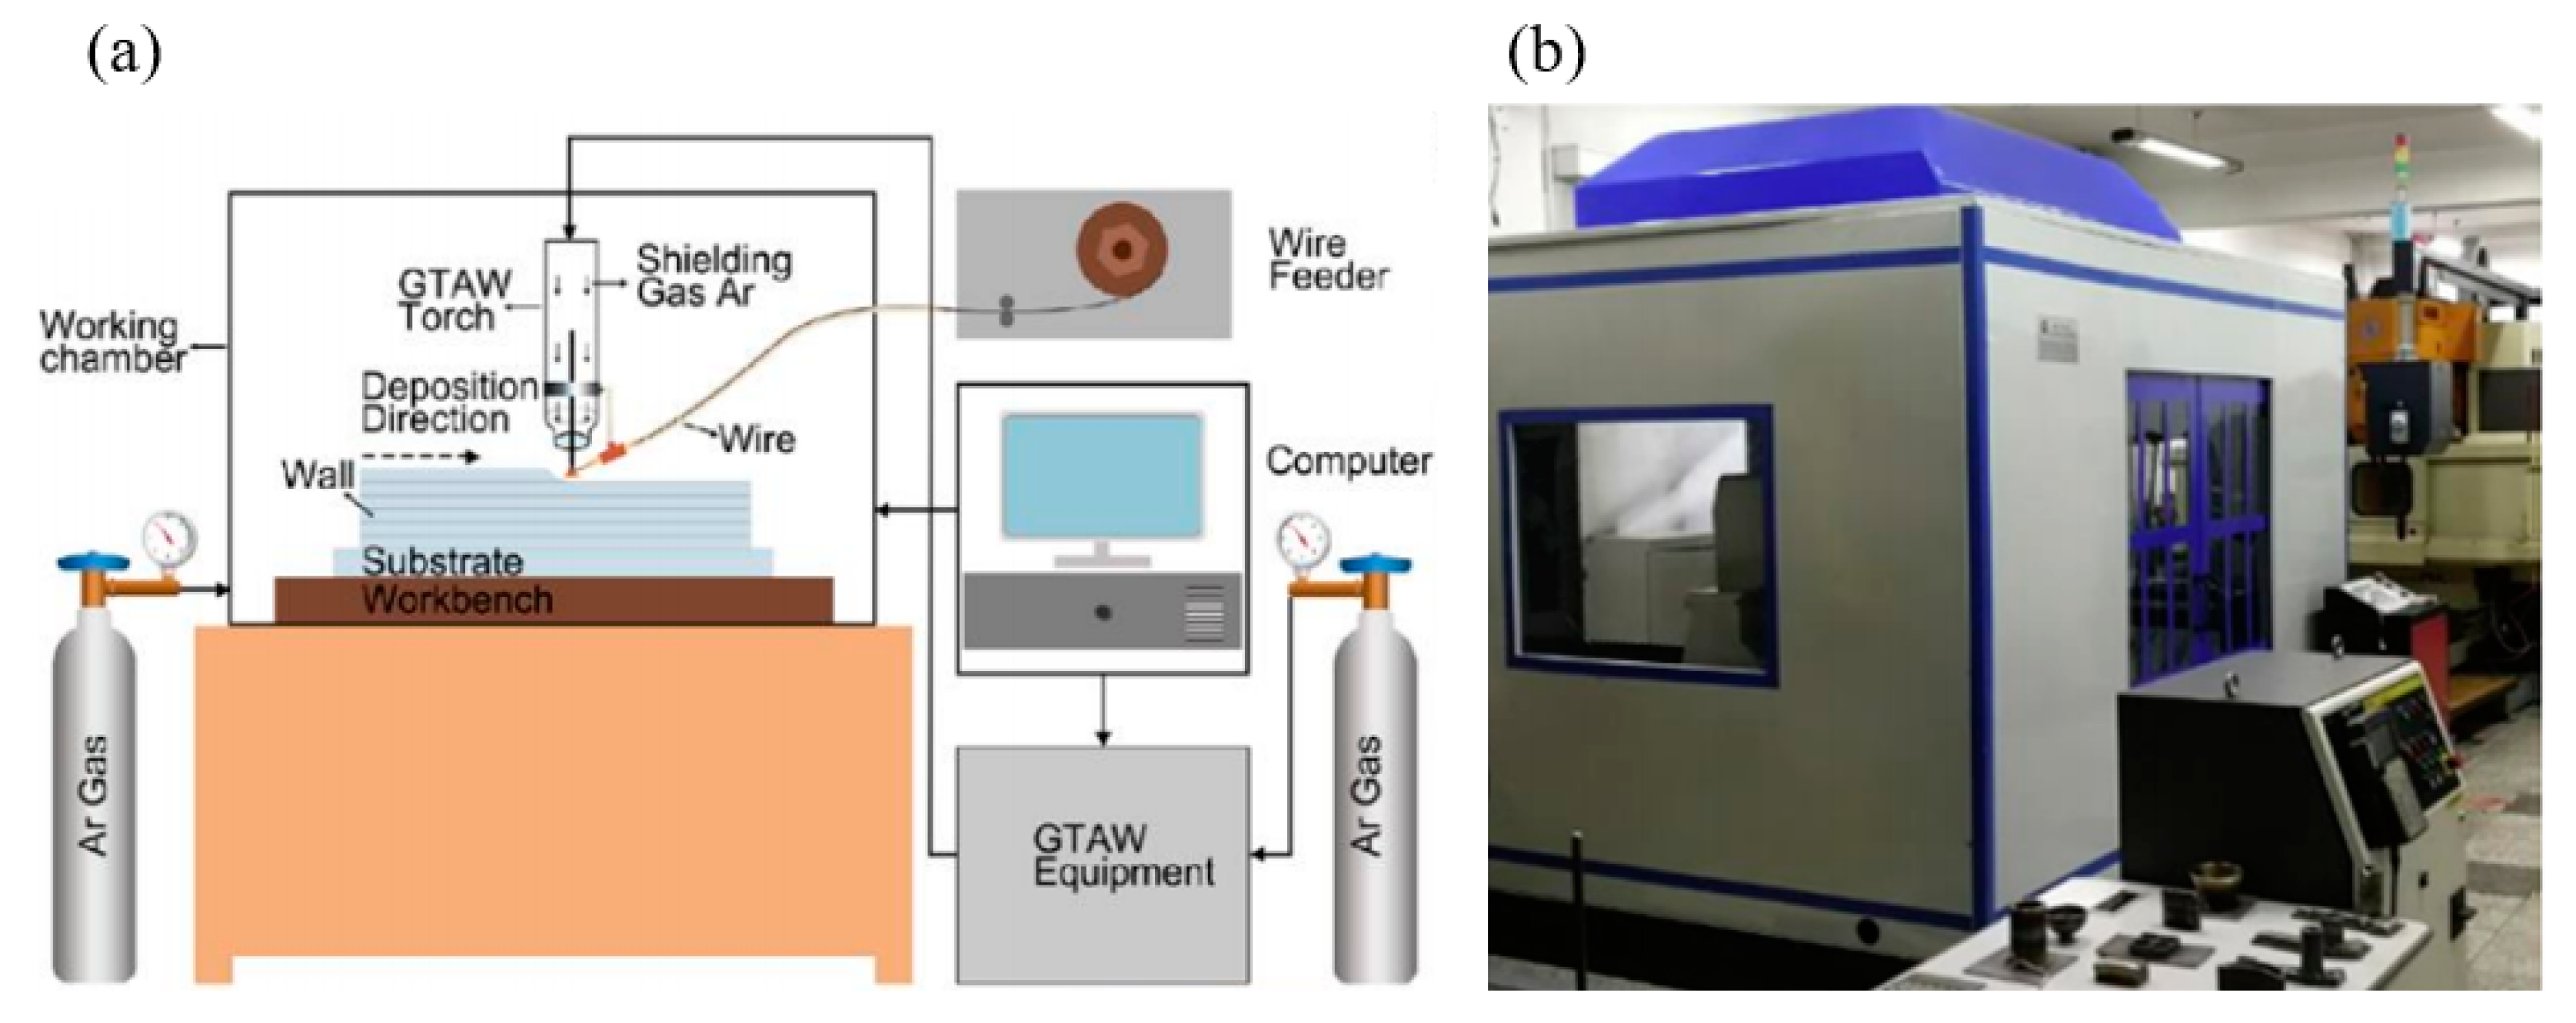
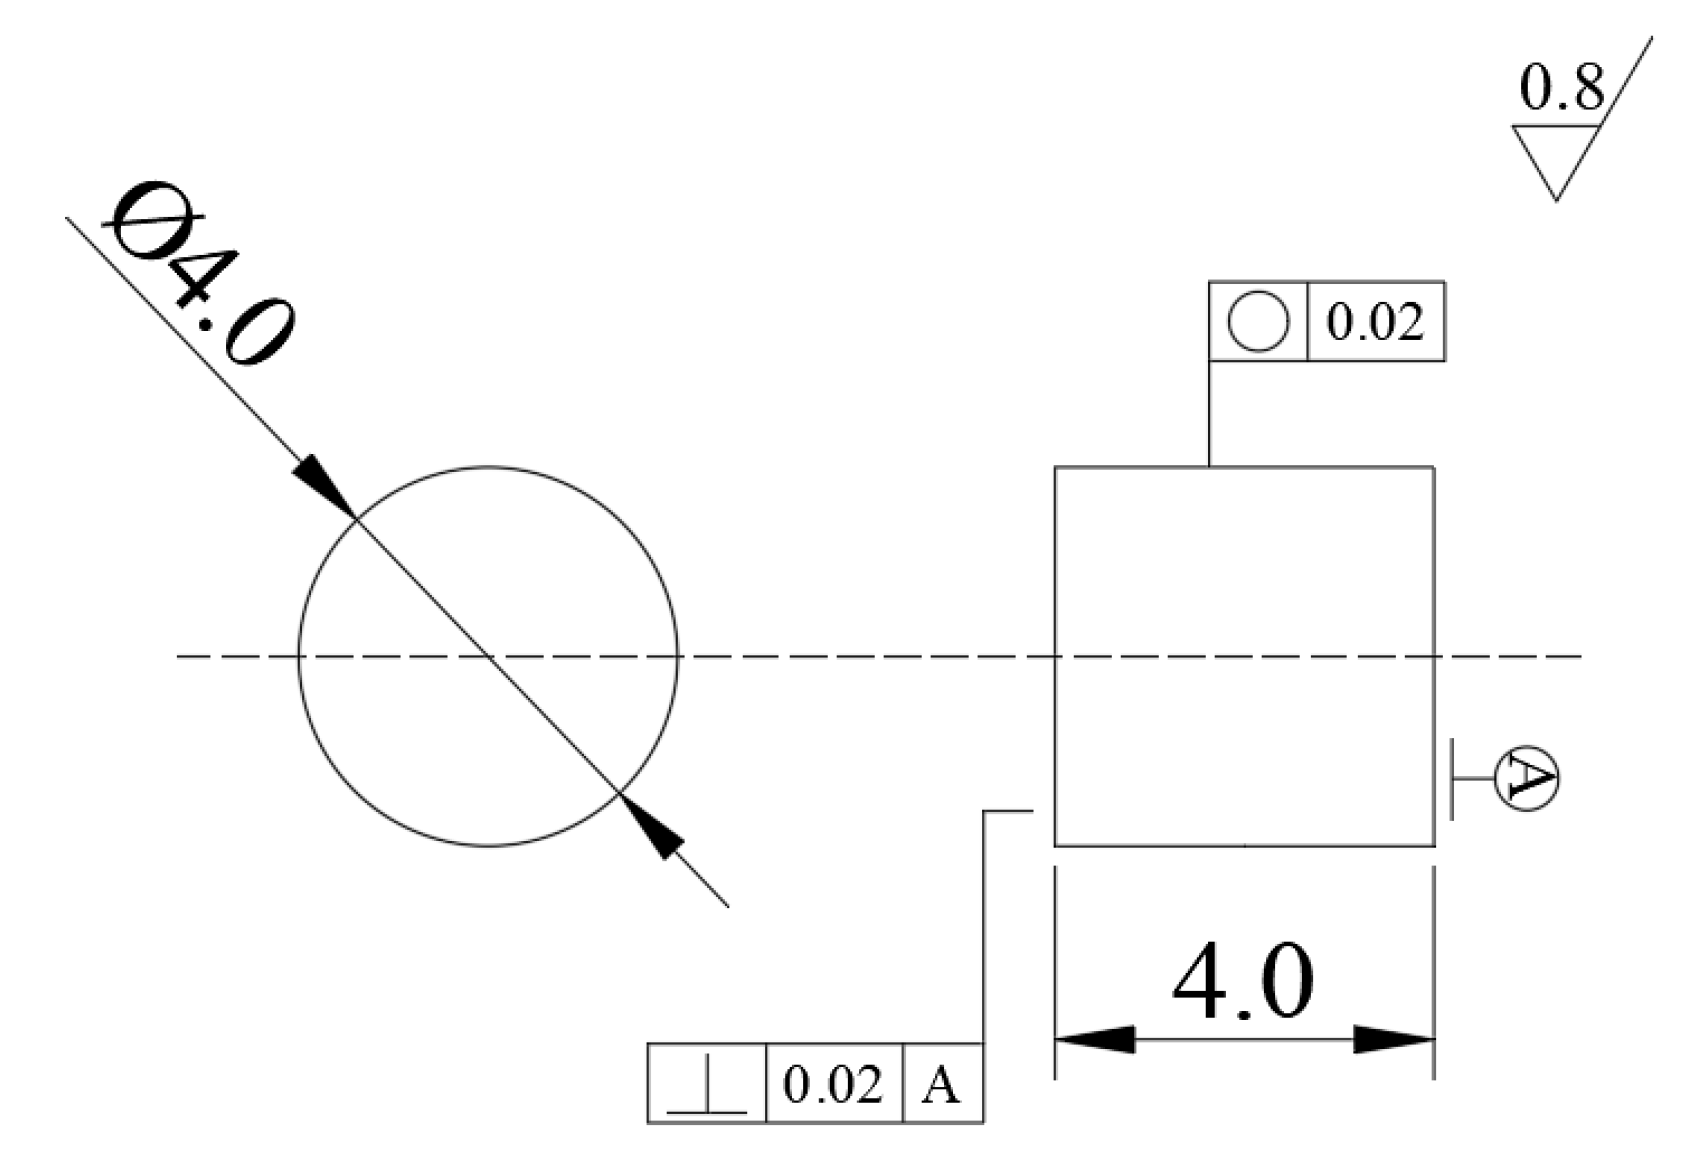
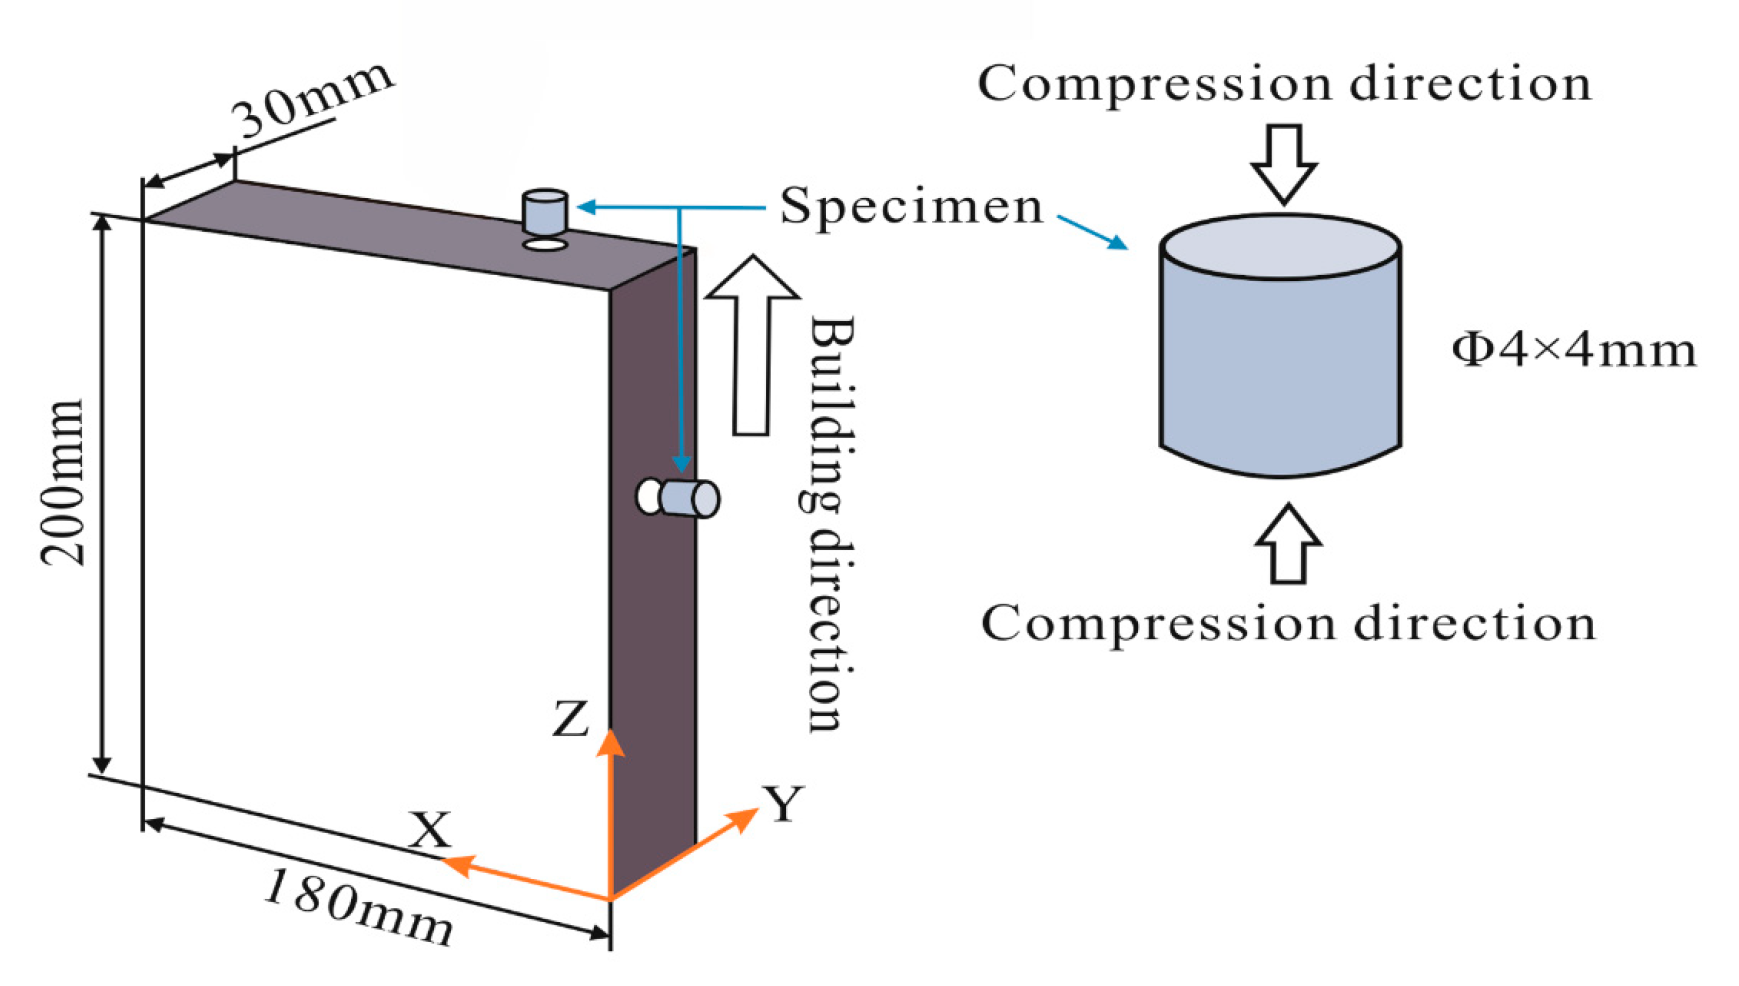
2.2. Methods
3. Results and Discussion
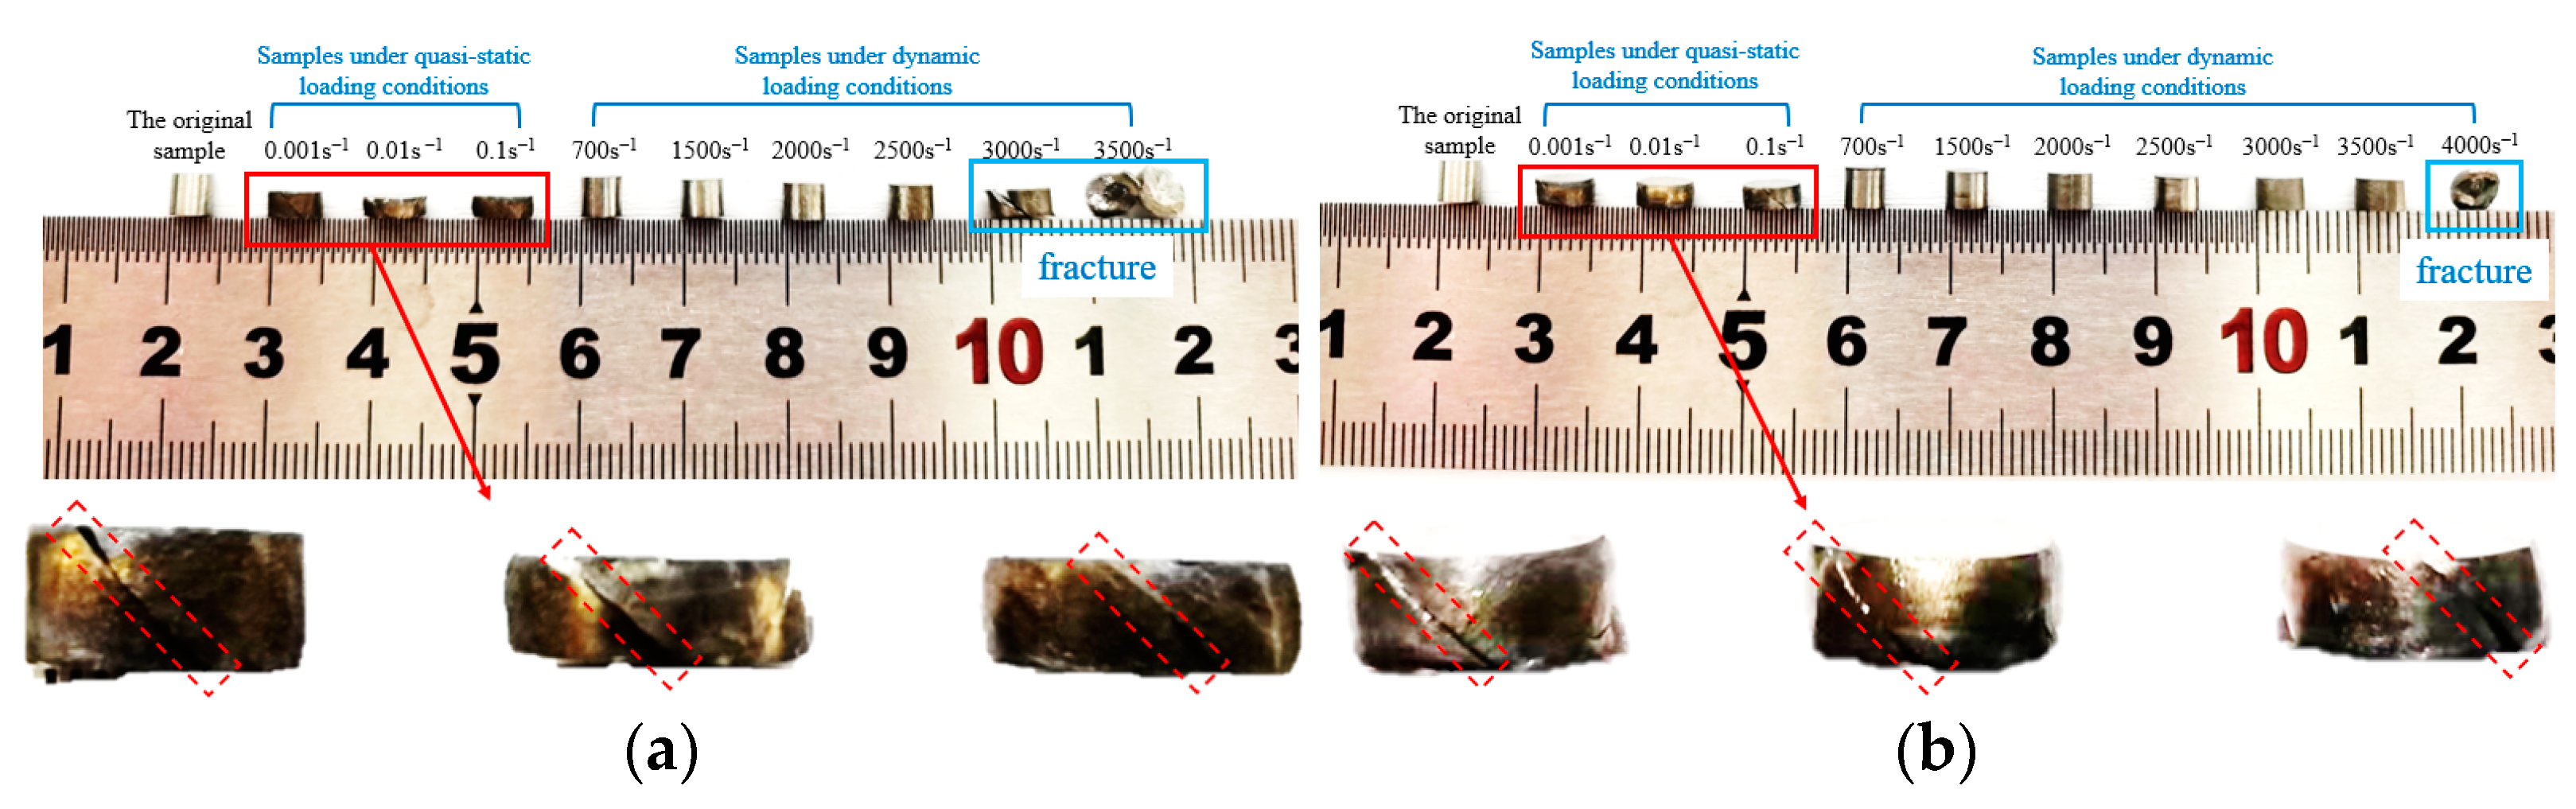
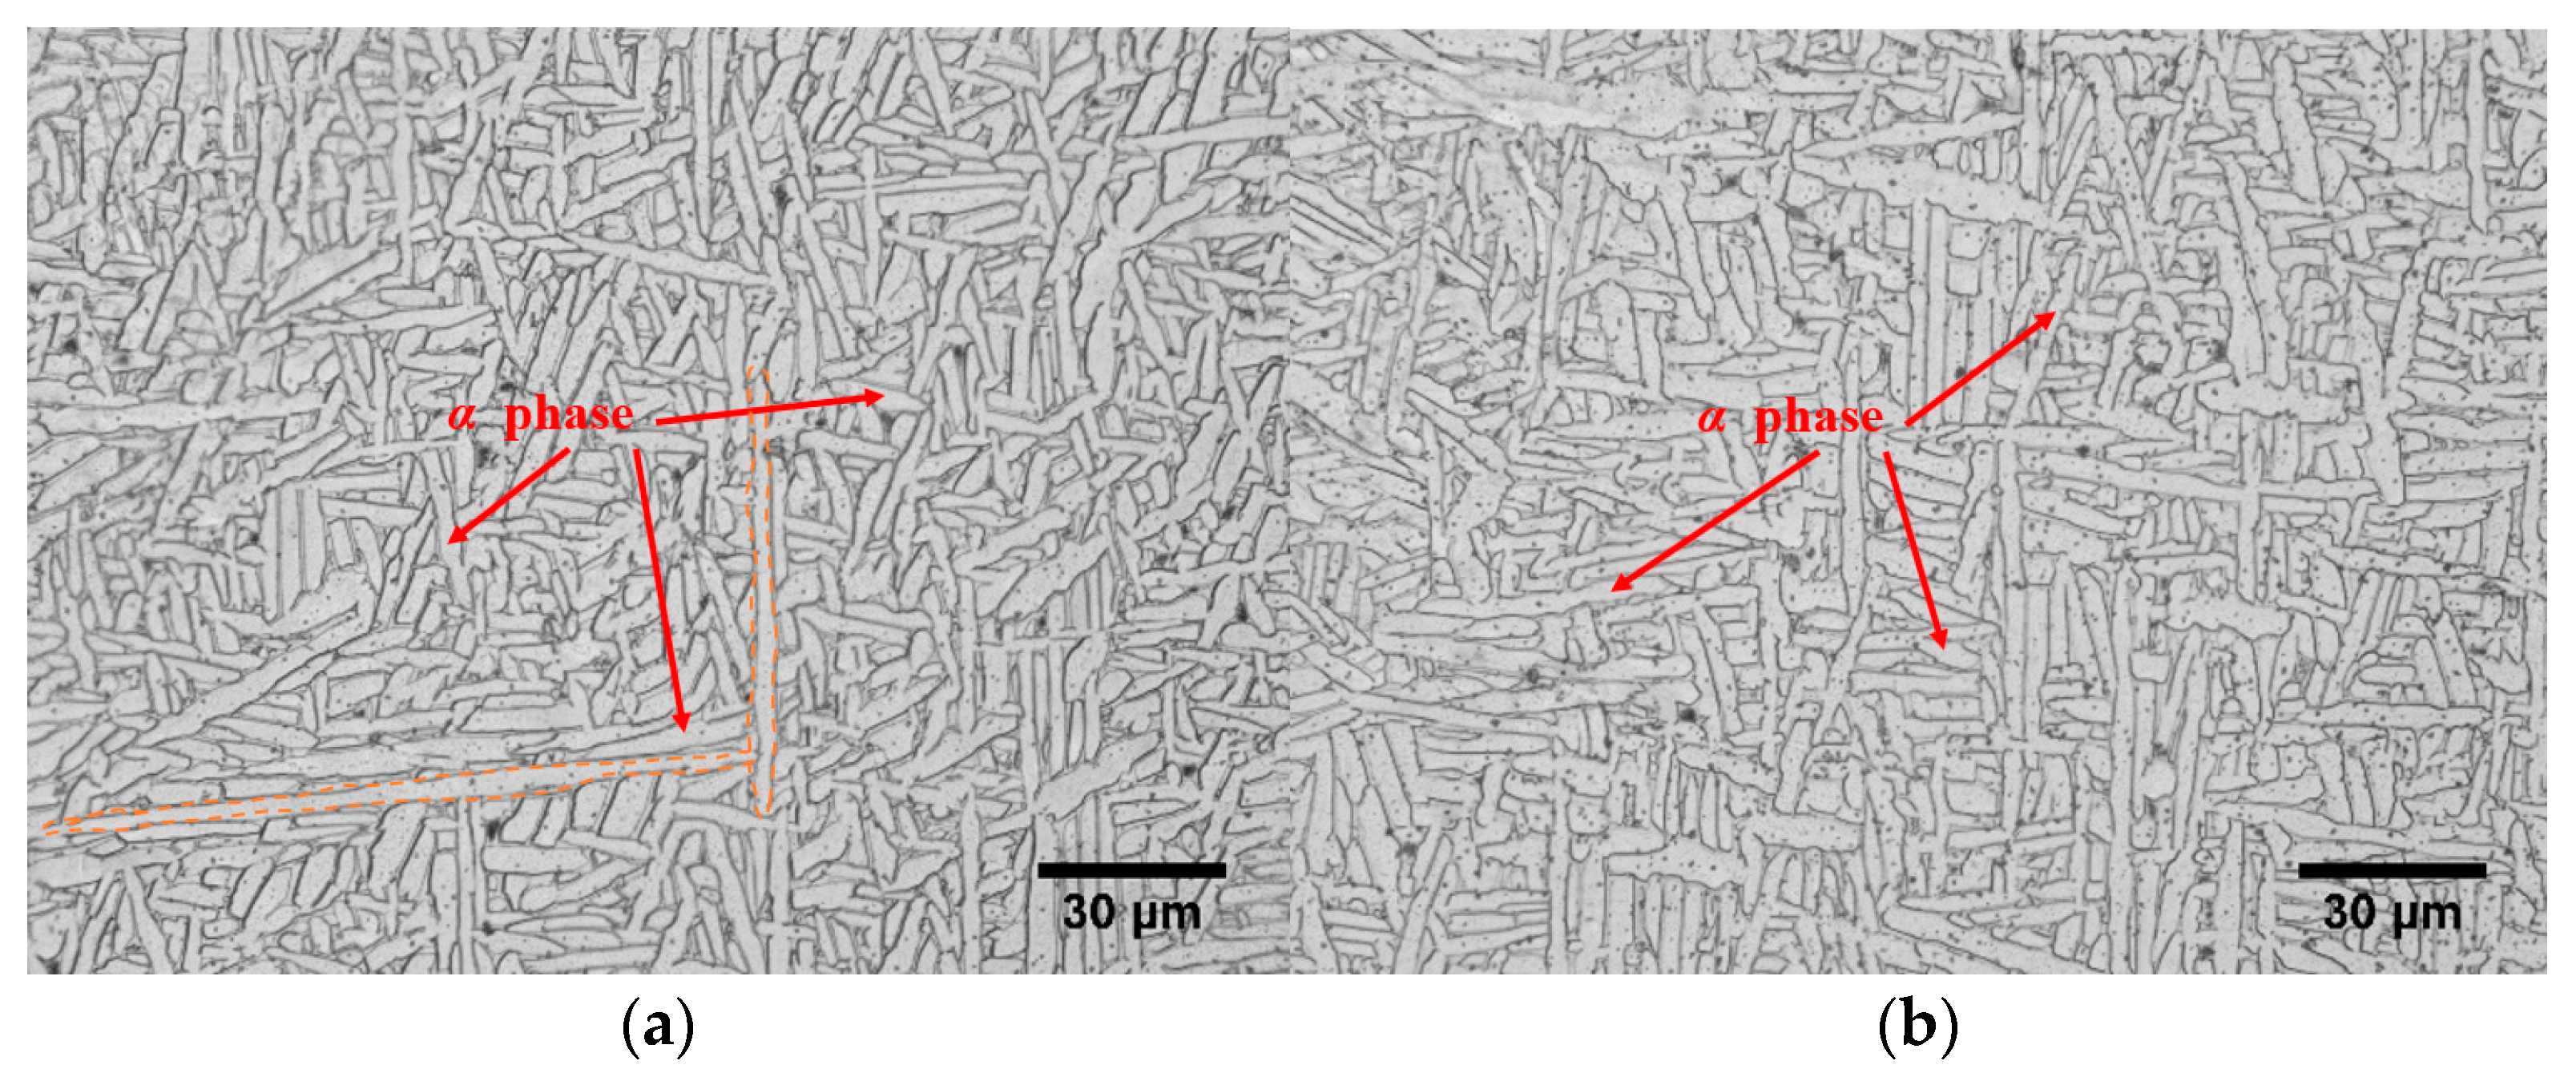
3.1. Deformation of Specimens
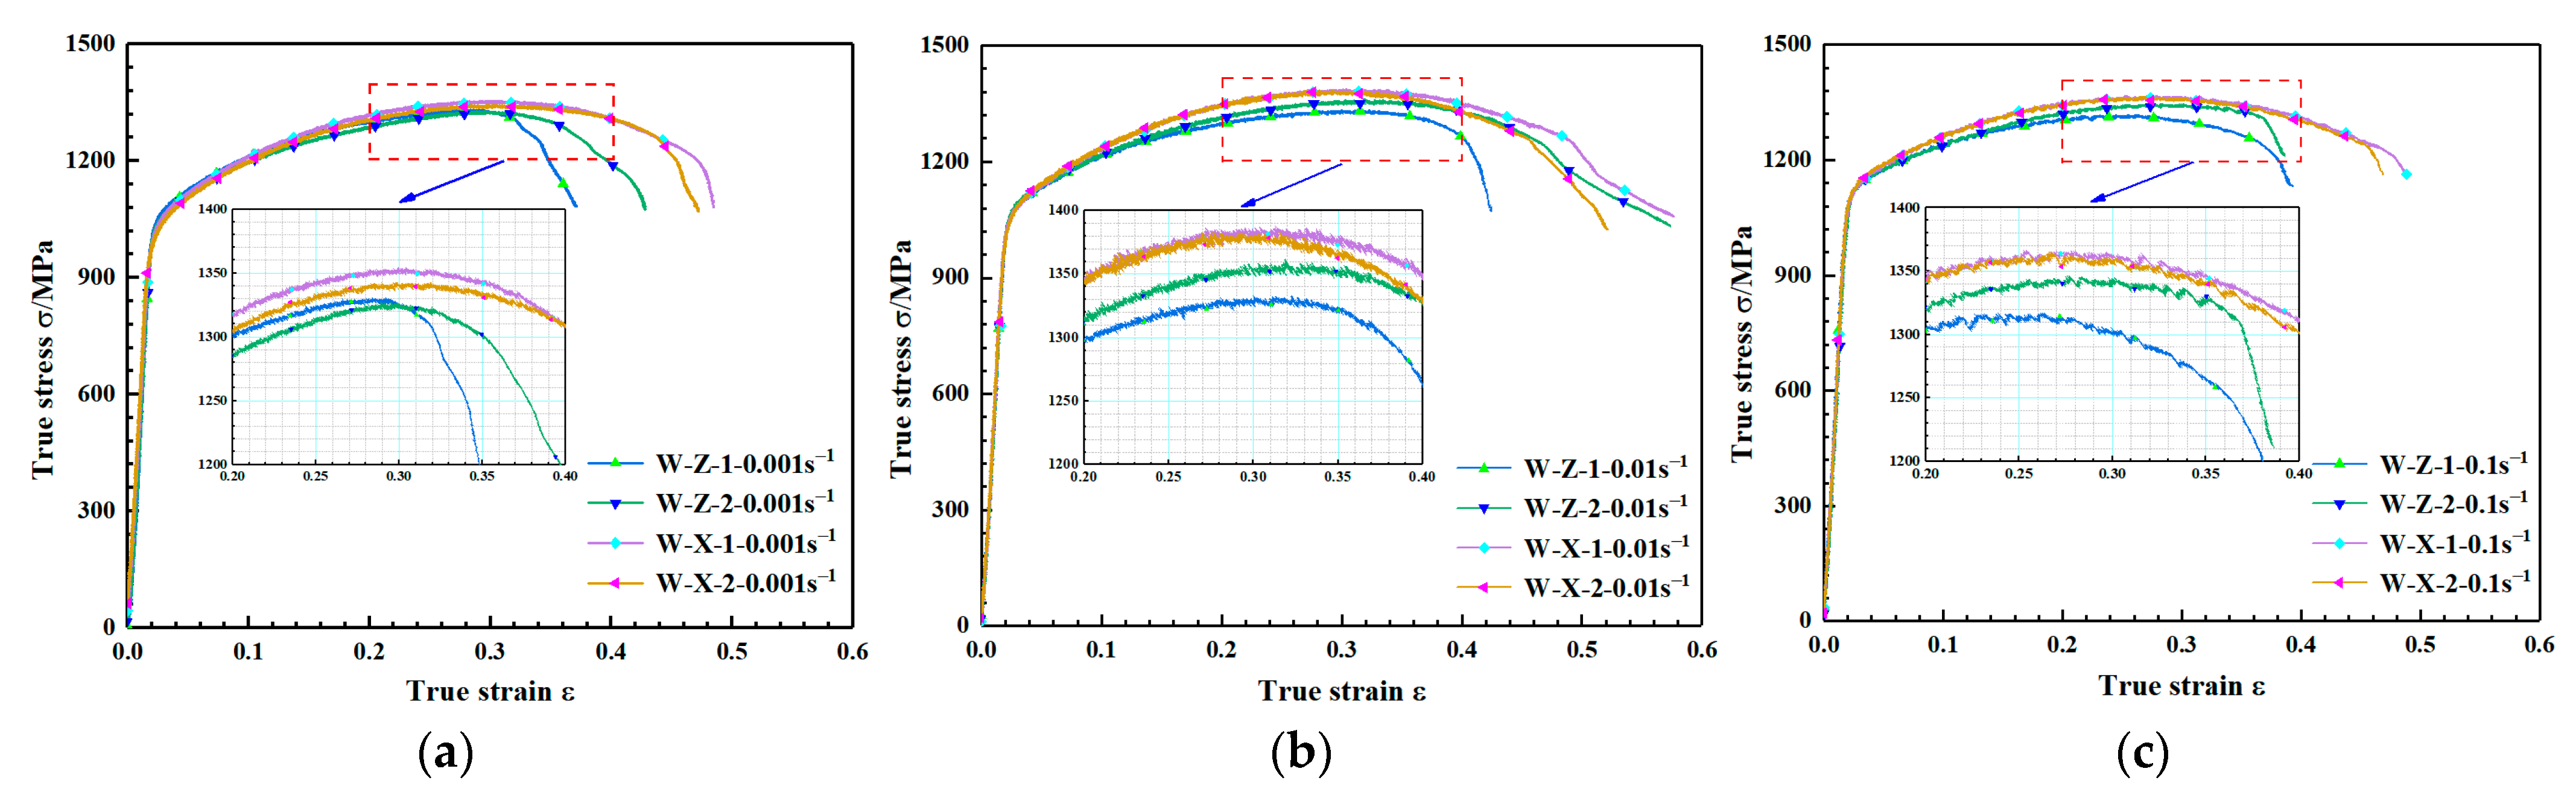
3.2. Analysis of Mechanical Properties in the Deposition and Scanning Directions
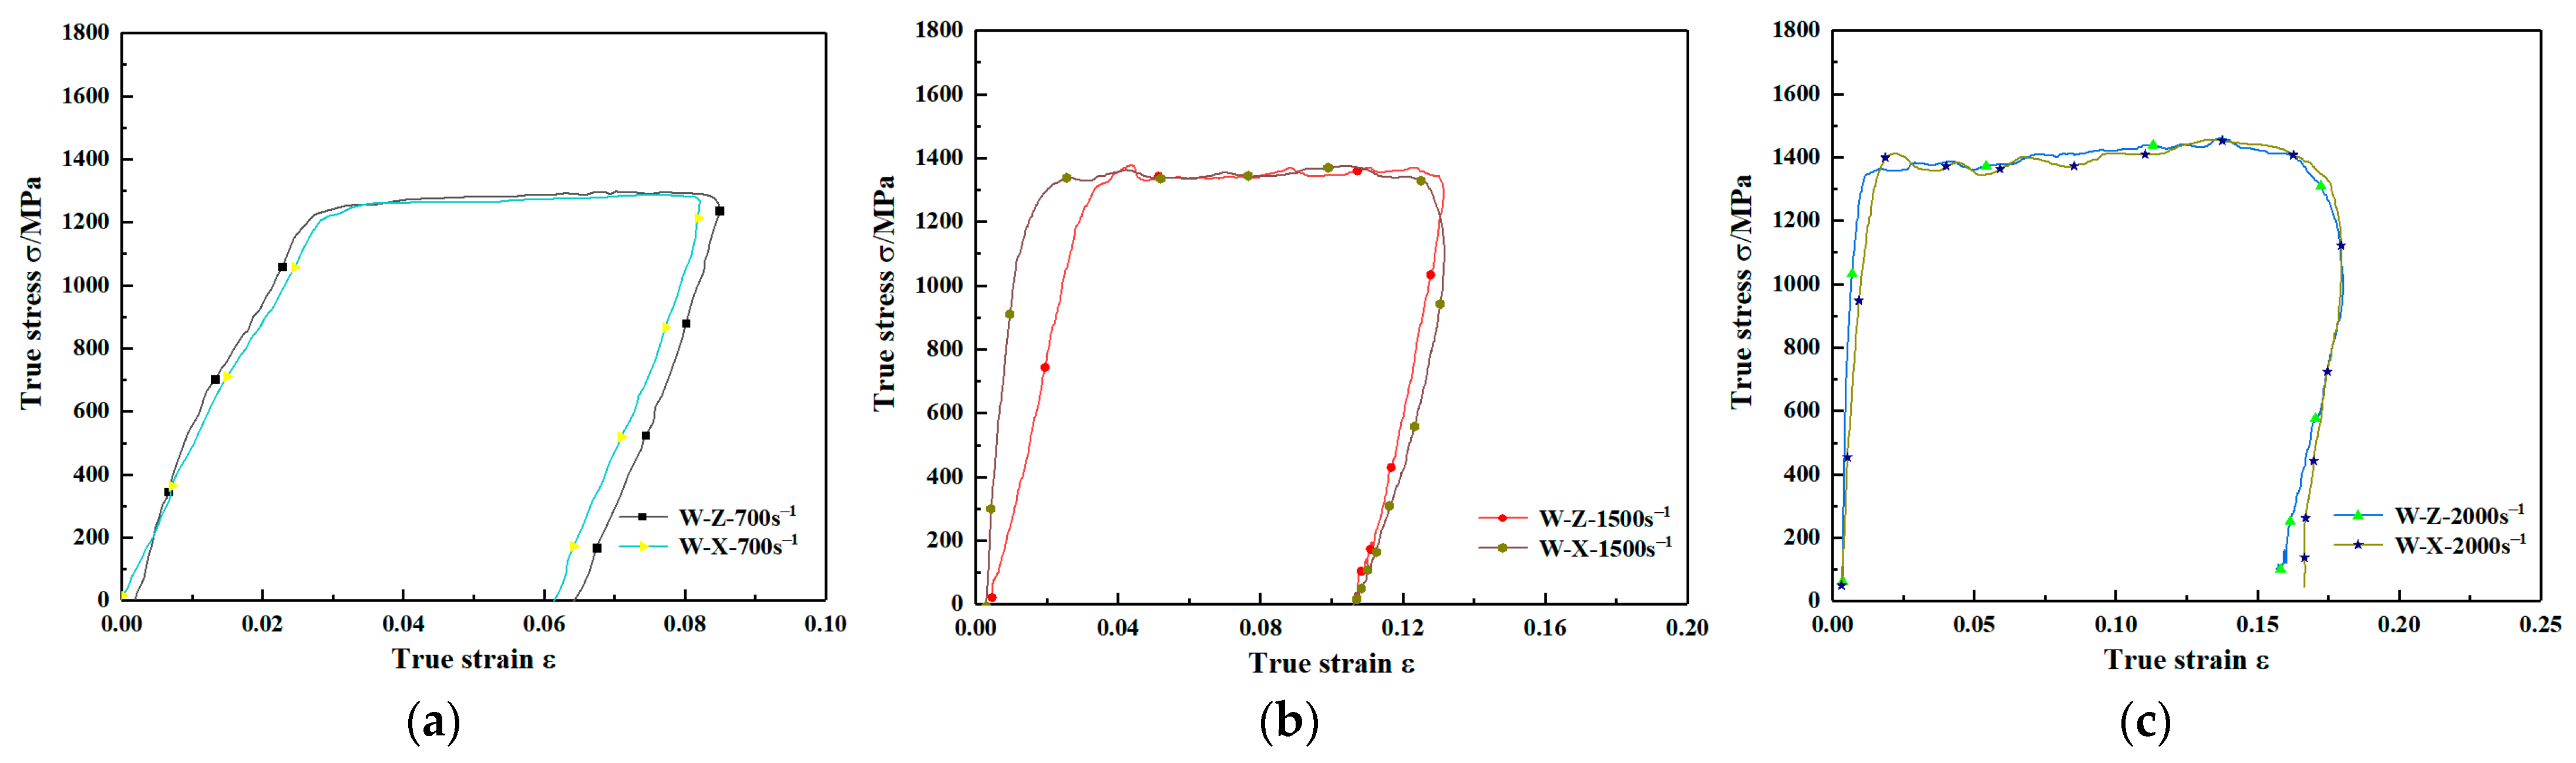
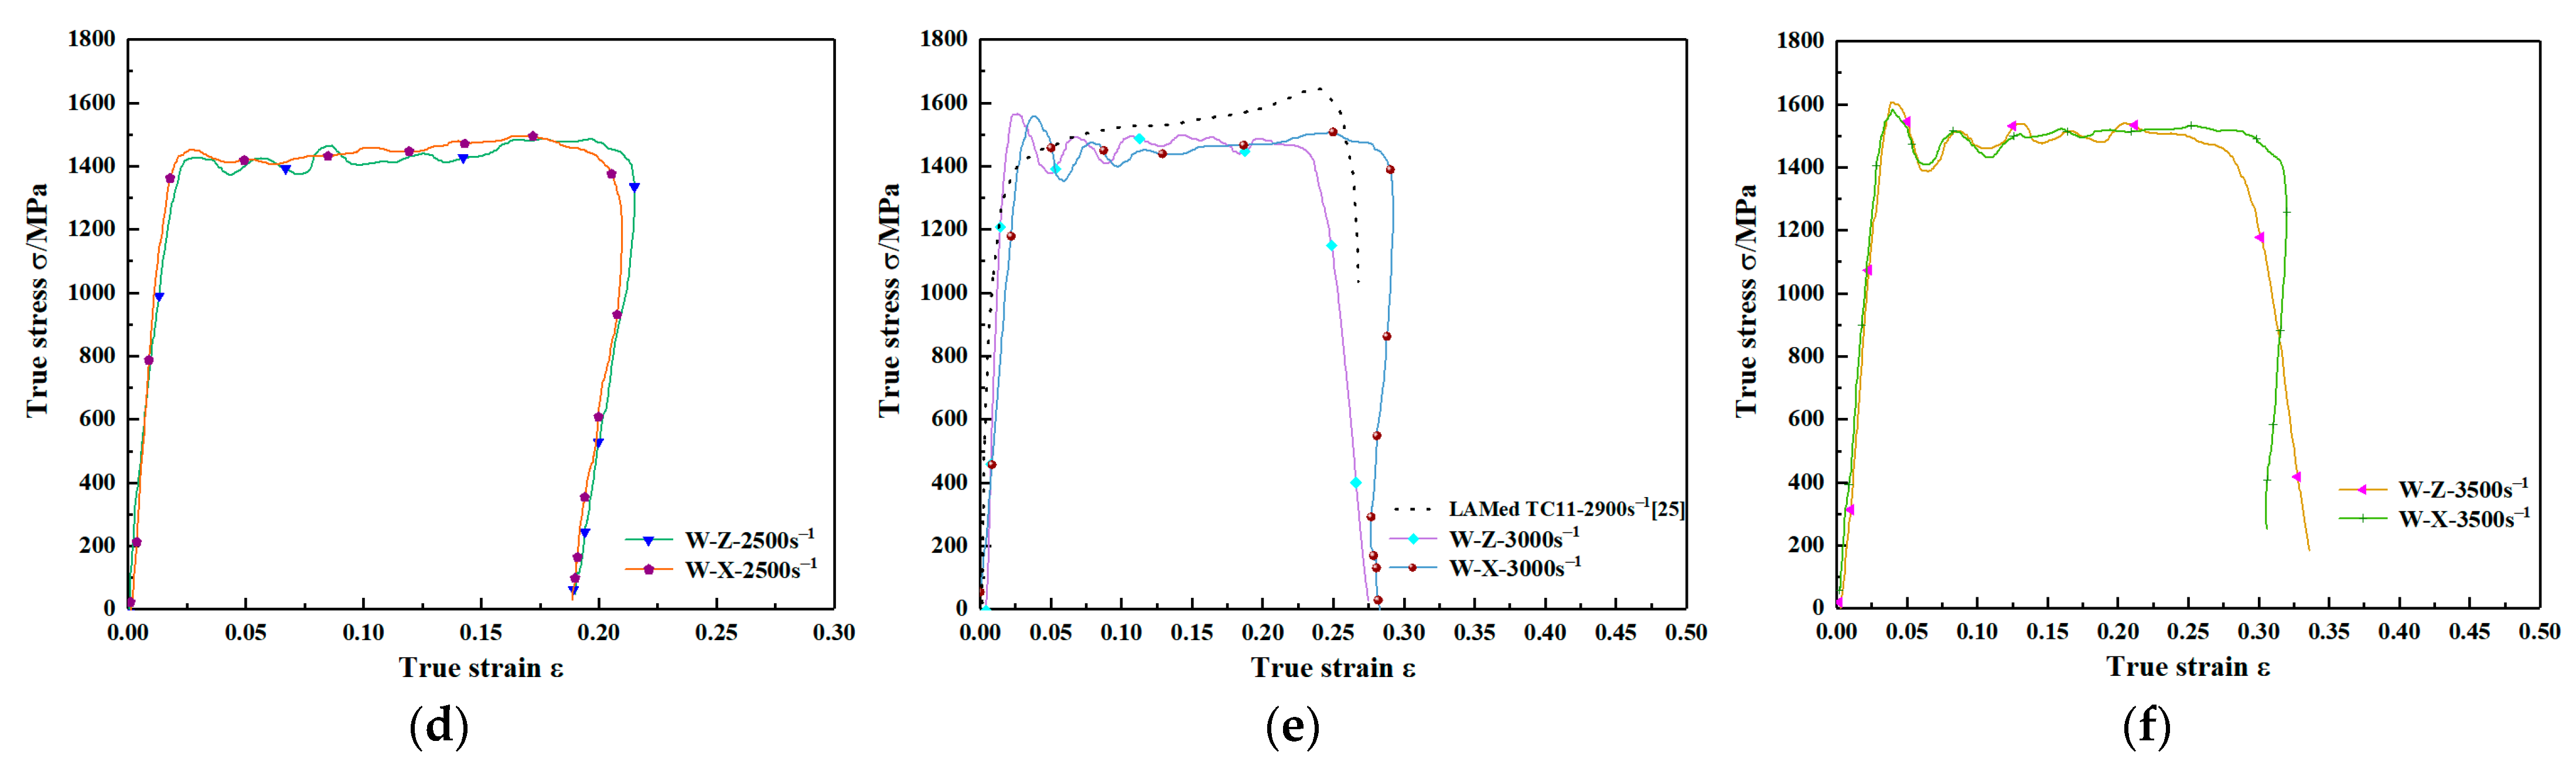
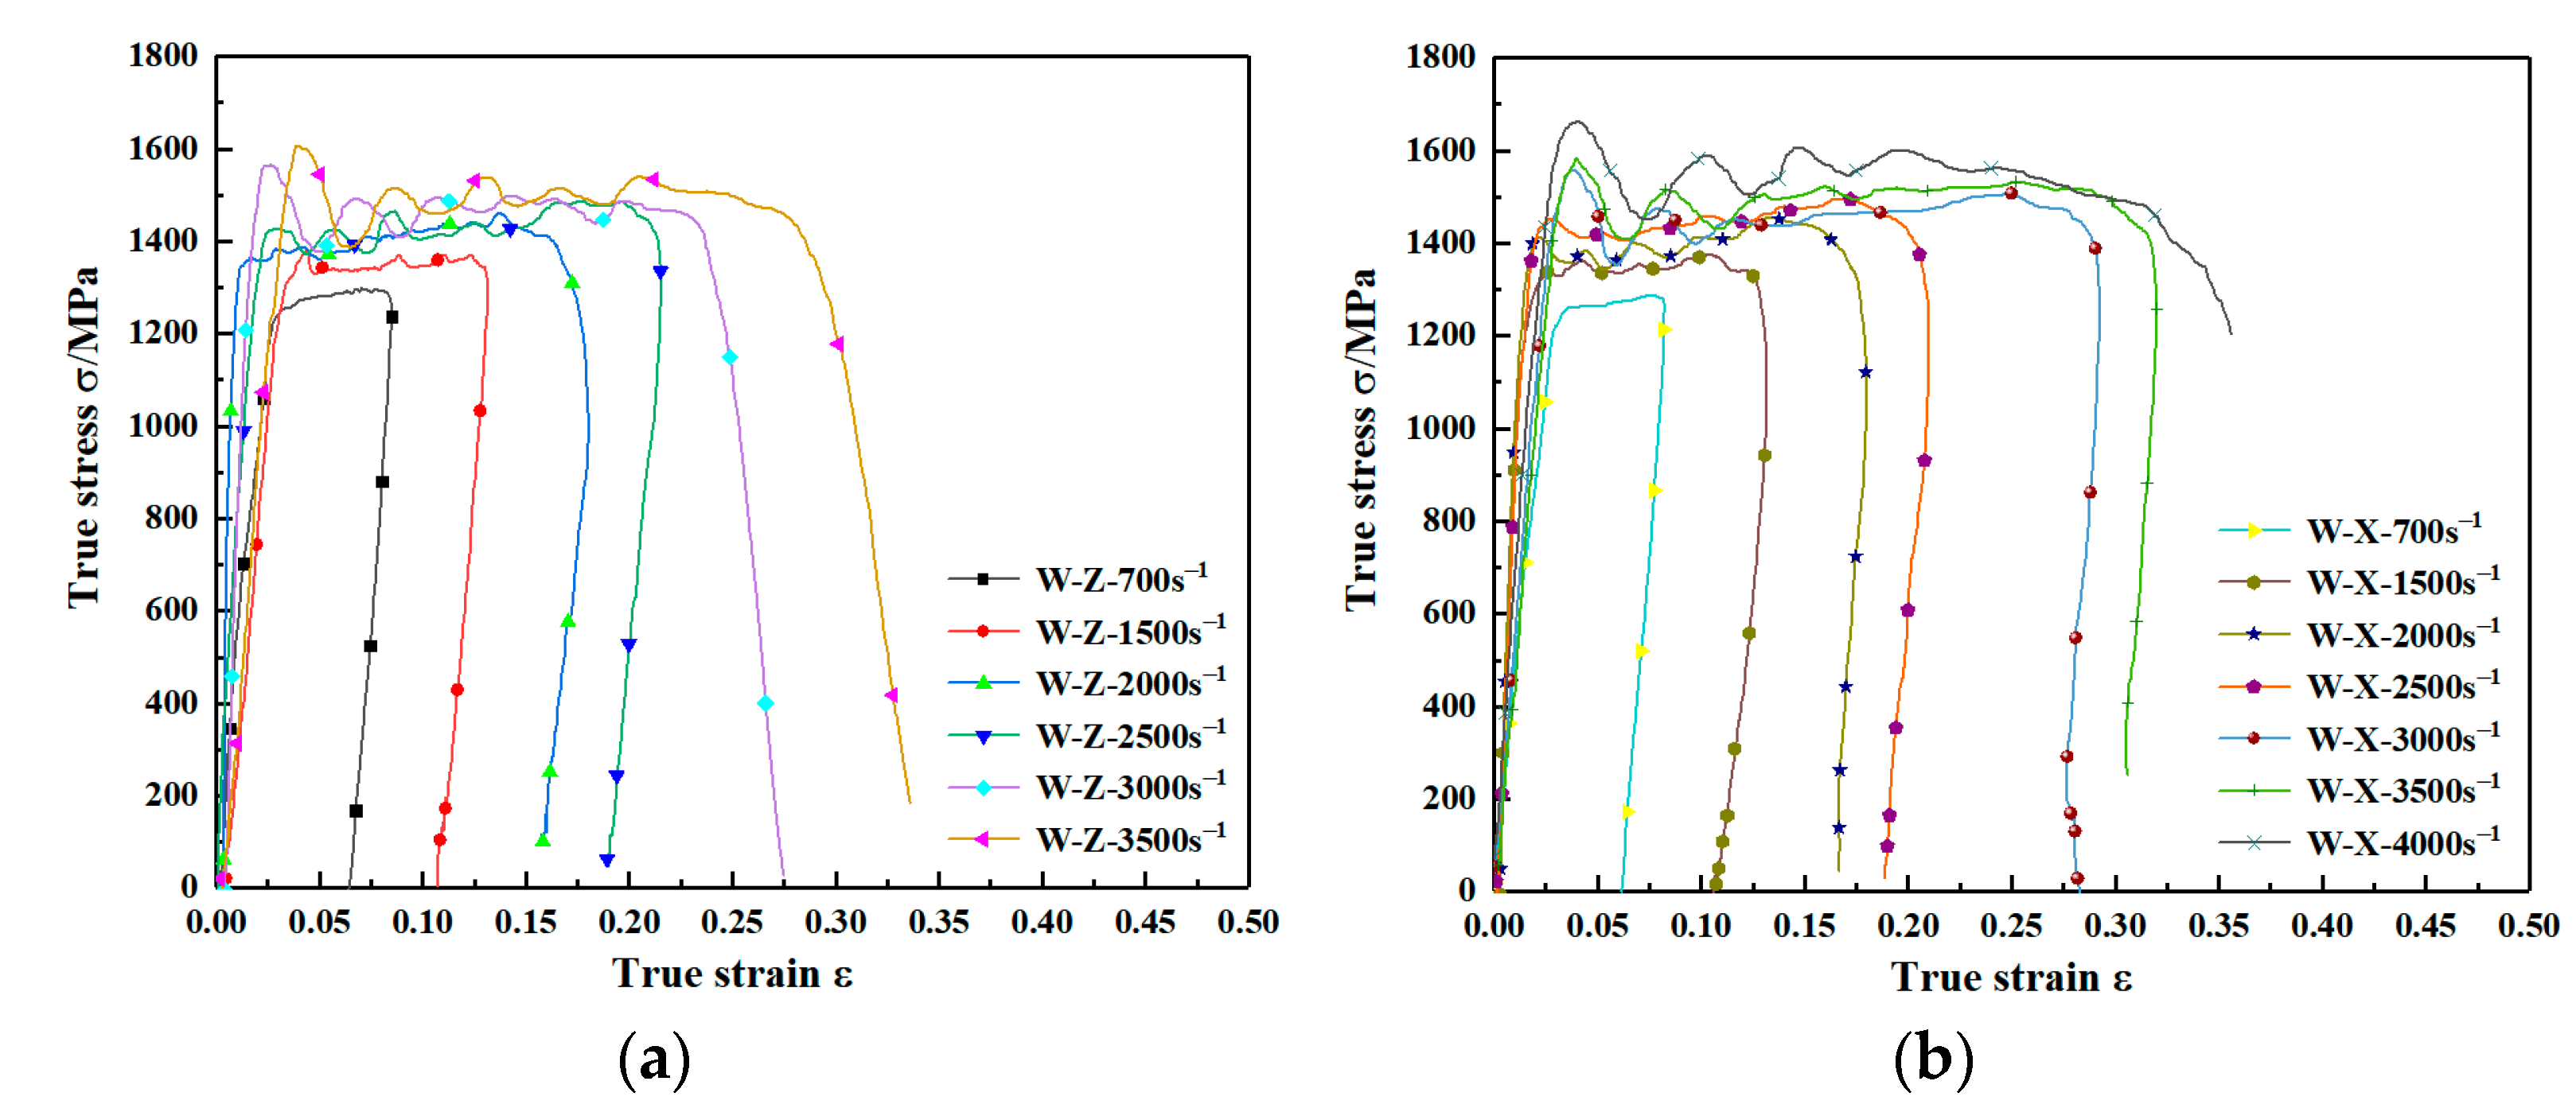
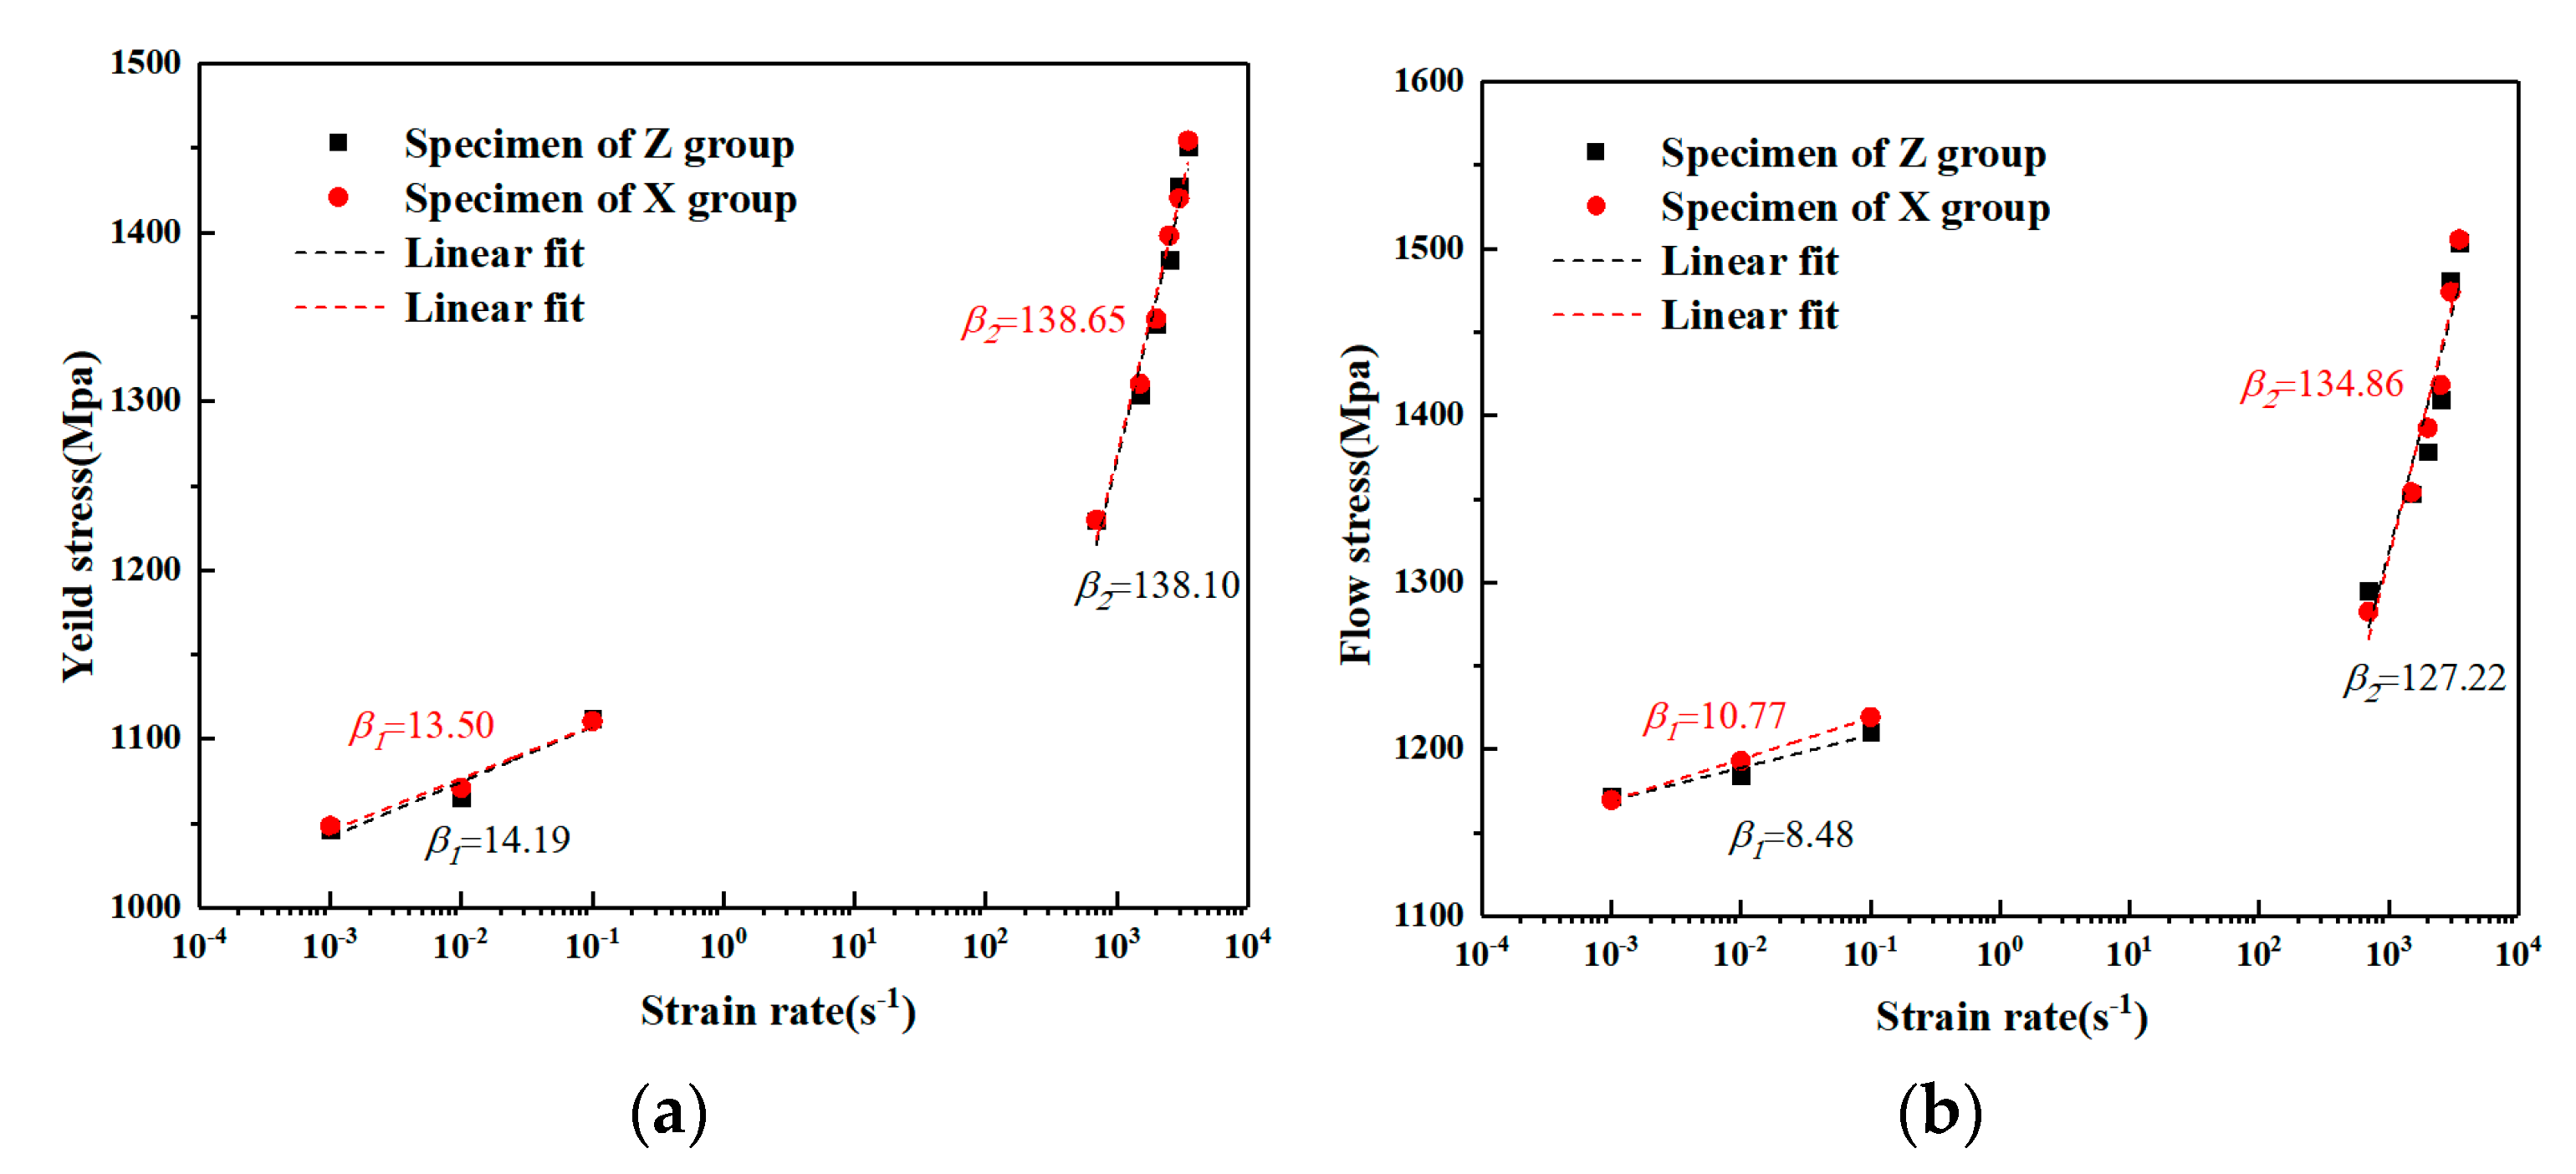
3.3. Effect of Strain Rate
3.4. Failure and Microstructural Evolution Analysis
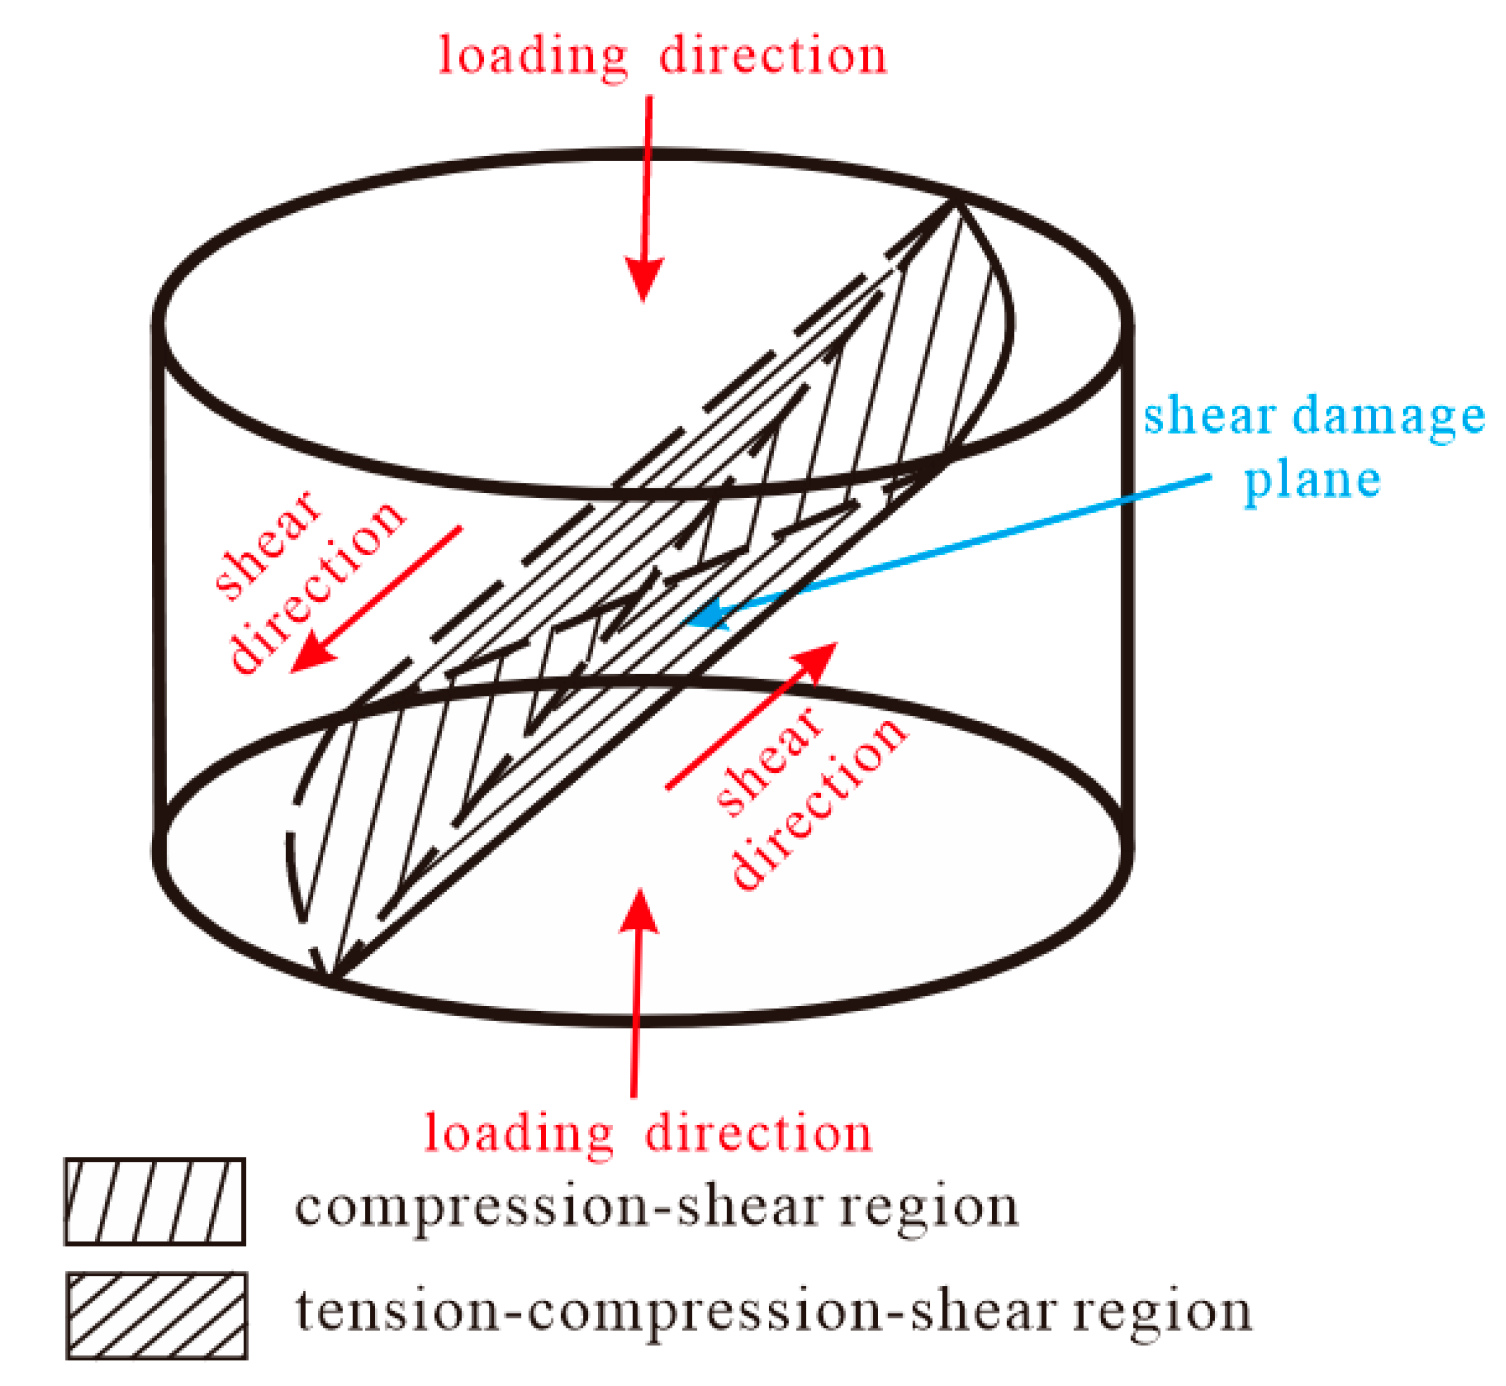
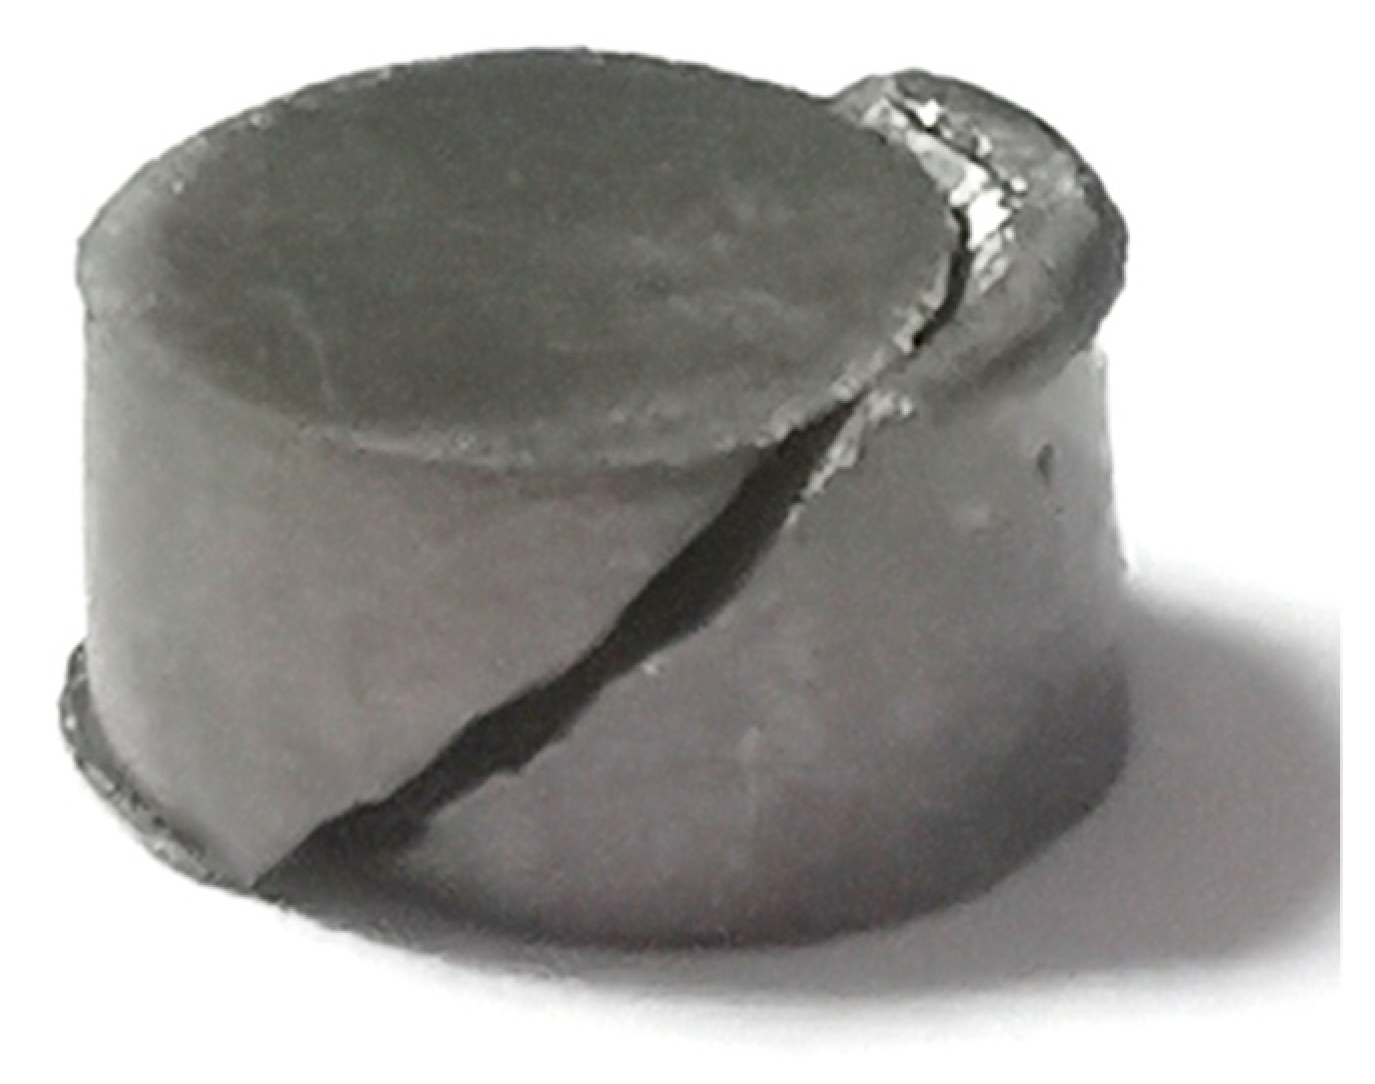
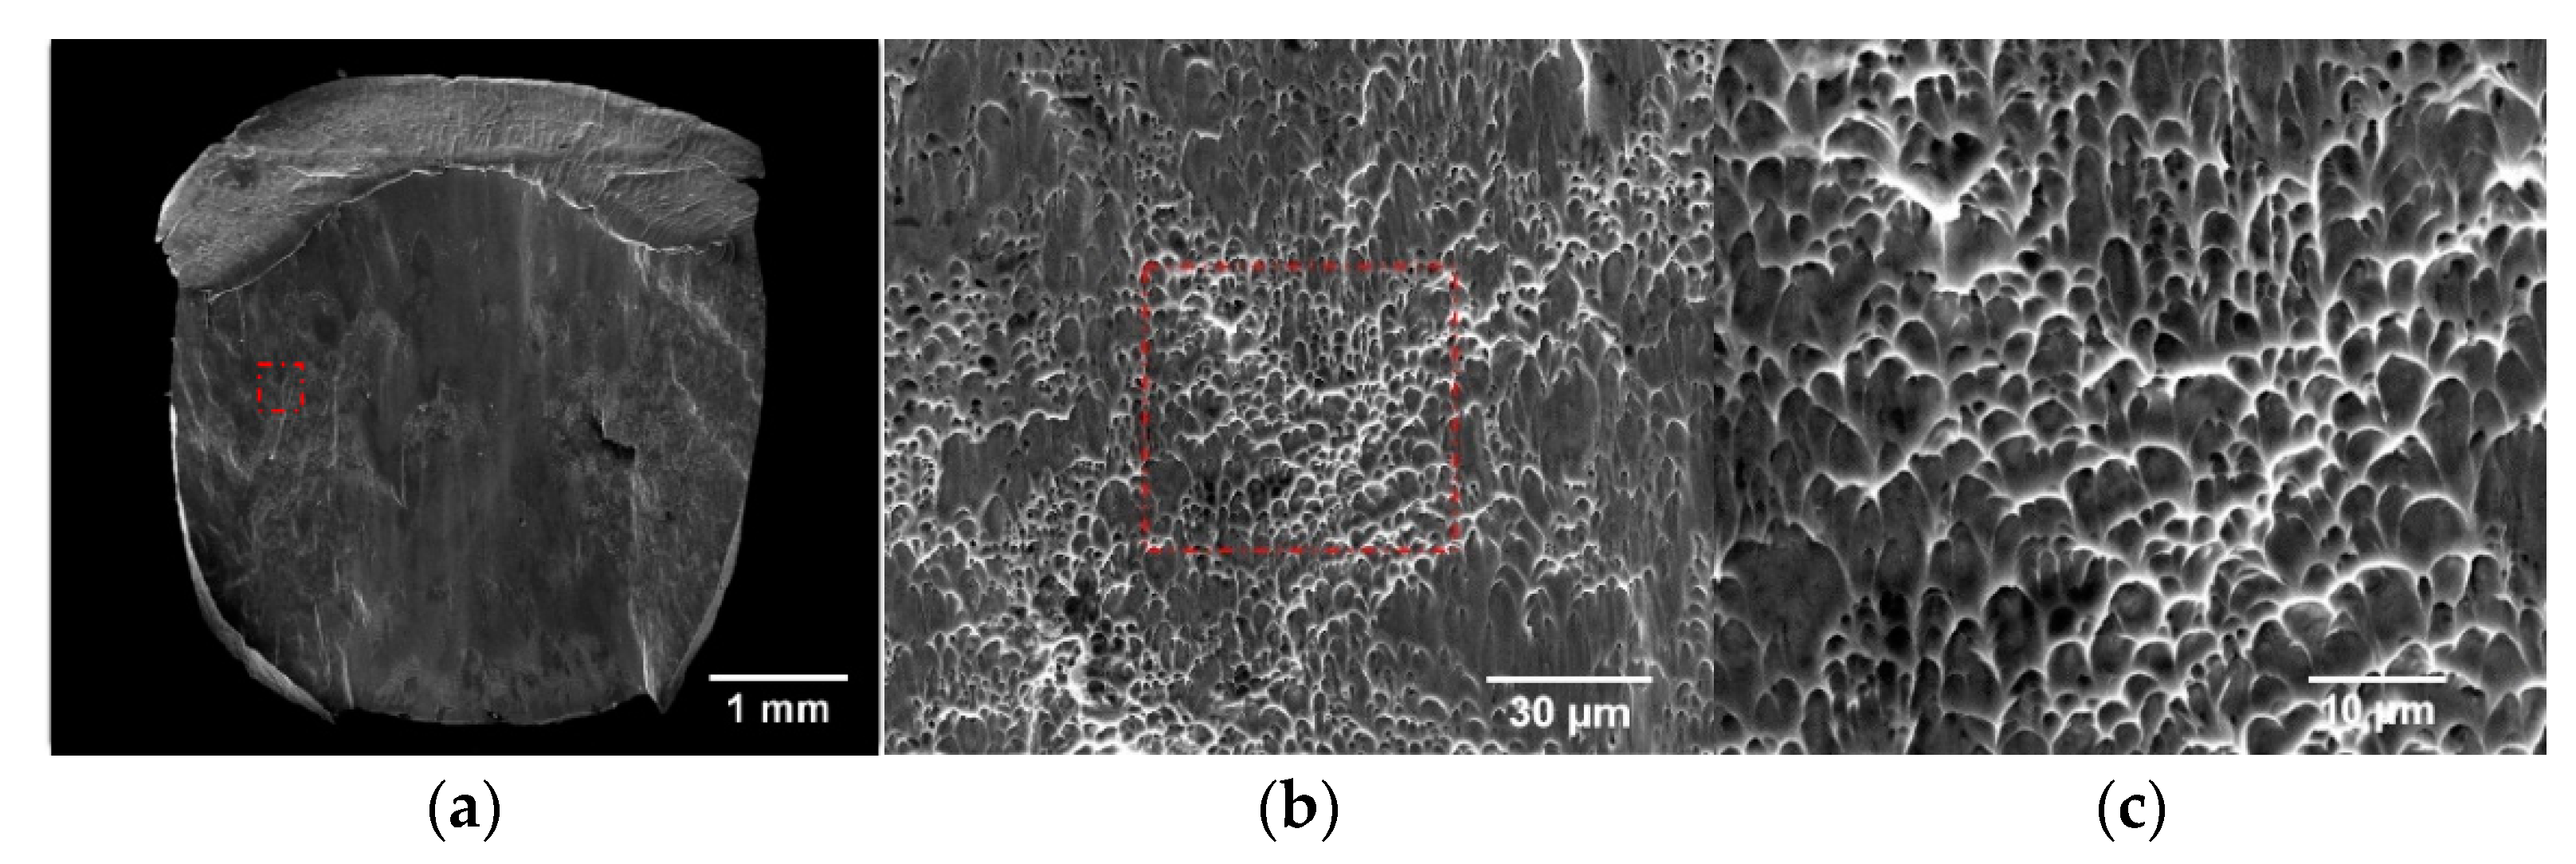
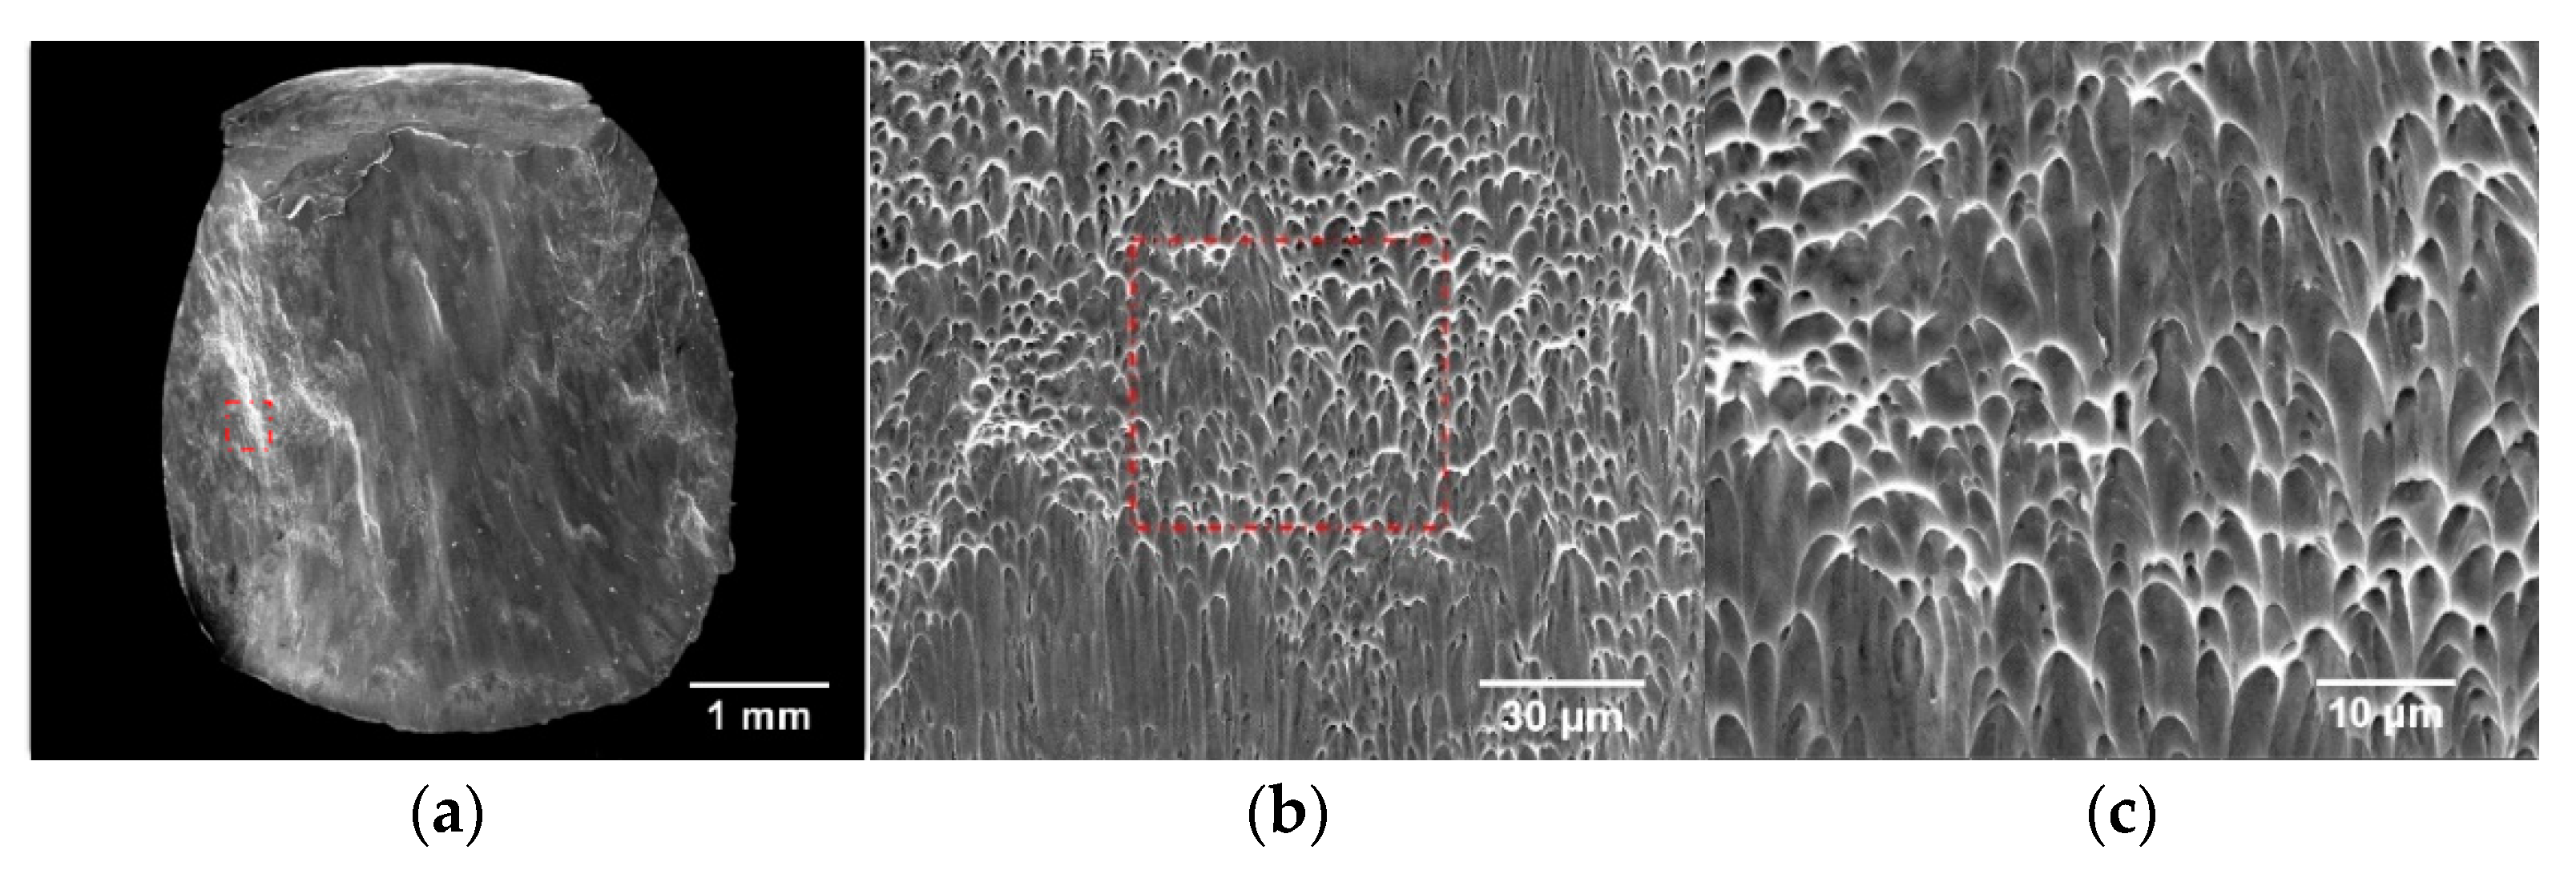
3.4.1. Macro-Failure Analysis
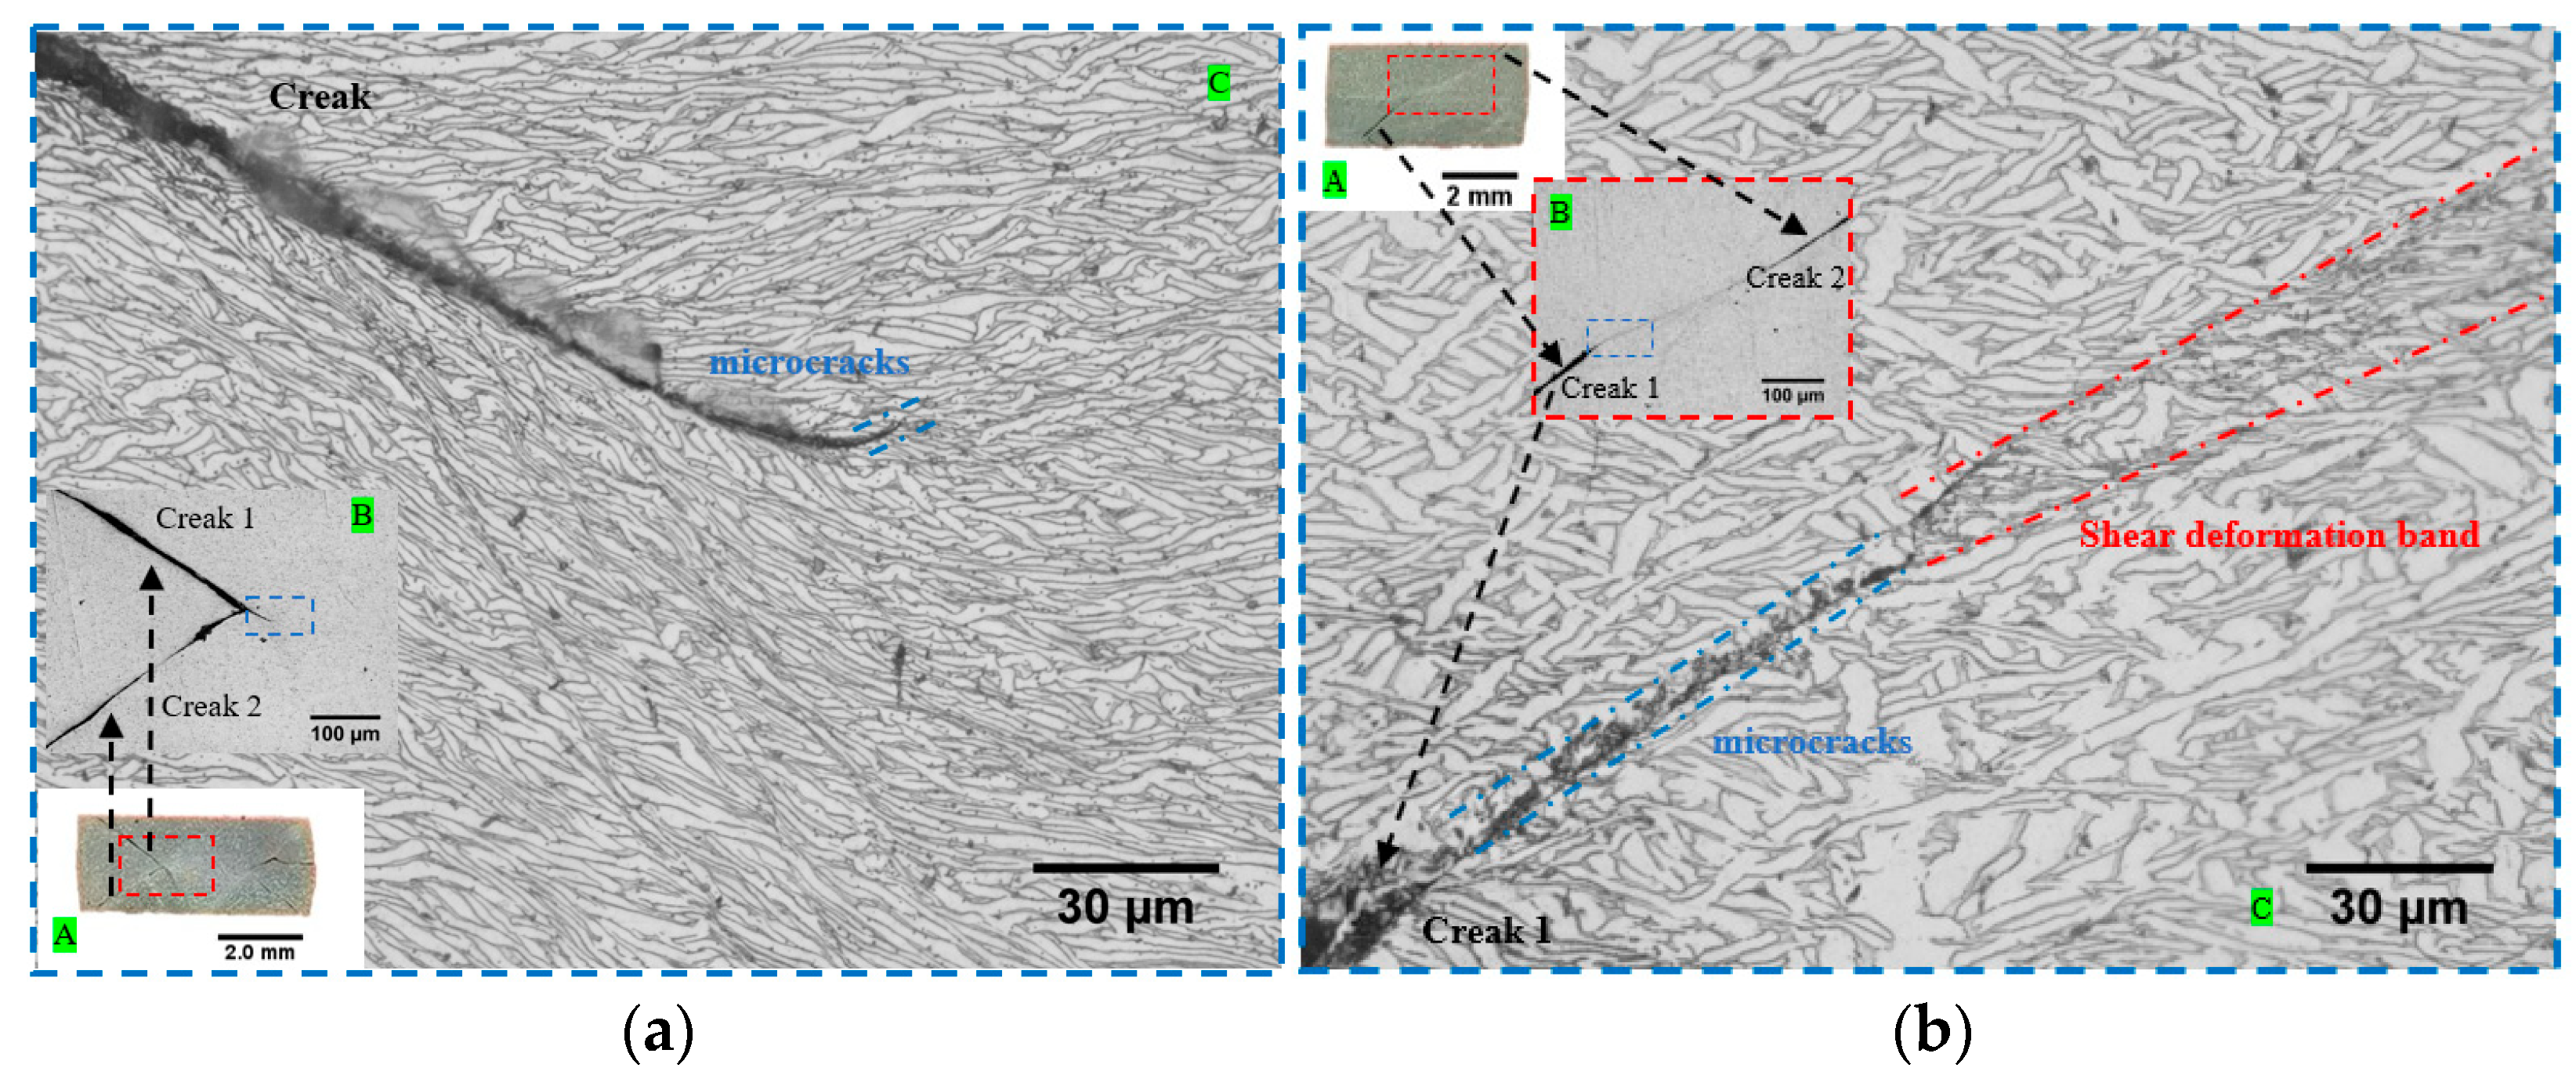
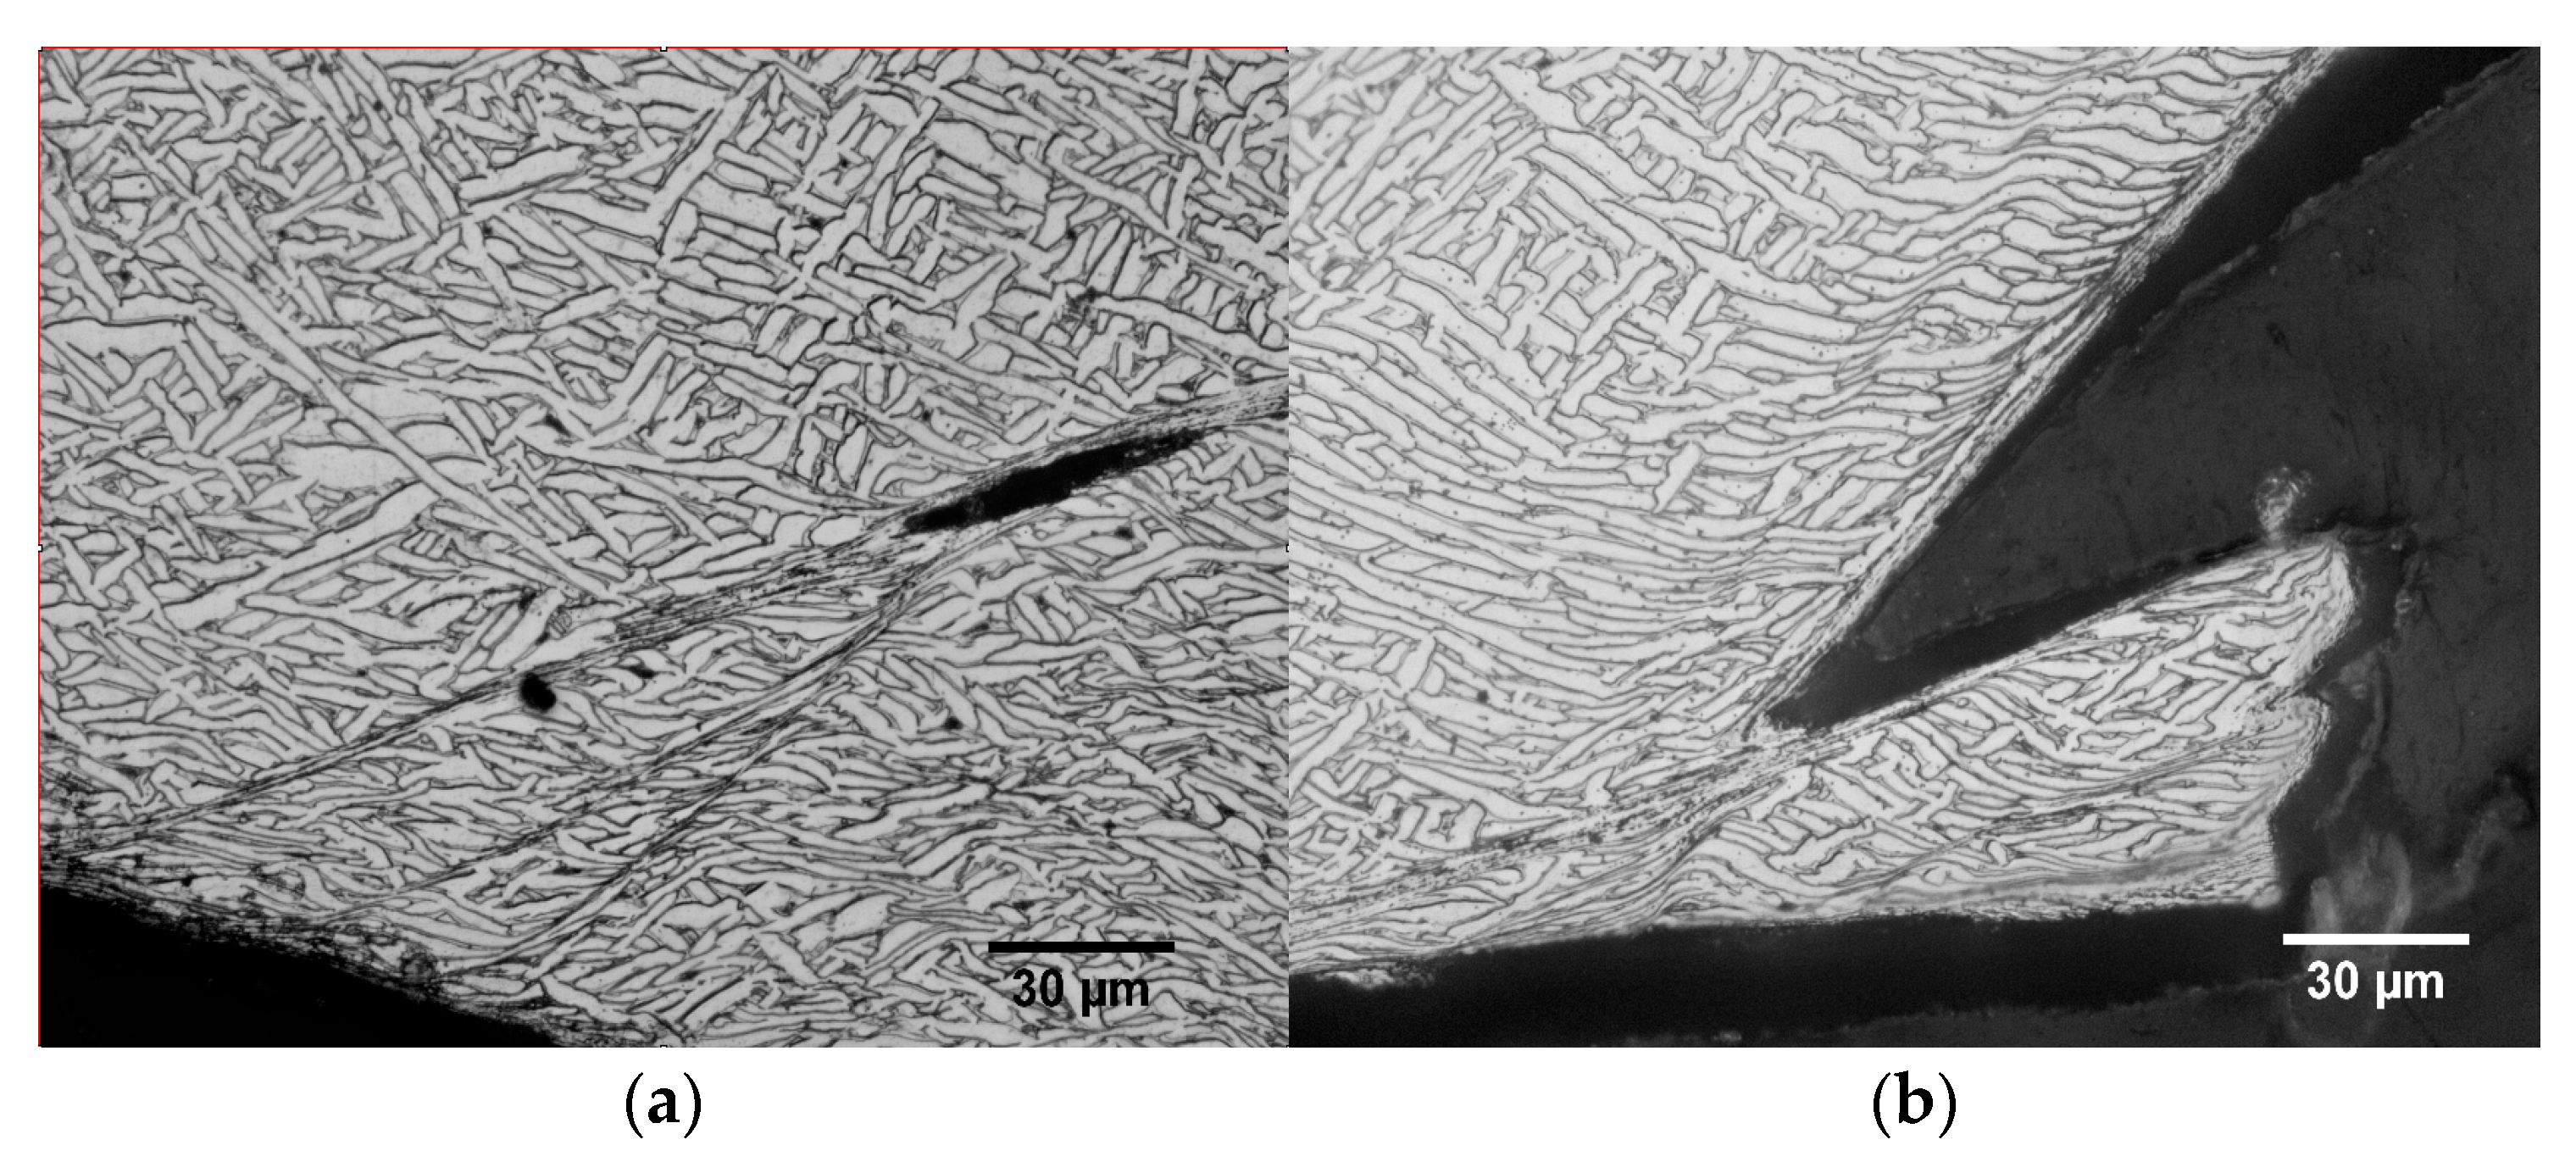
3.4.2. Micro-Failure Analysis
4. The Constitutive Analysis
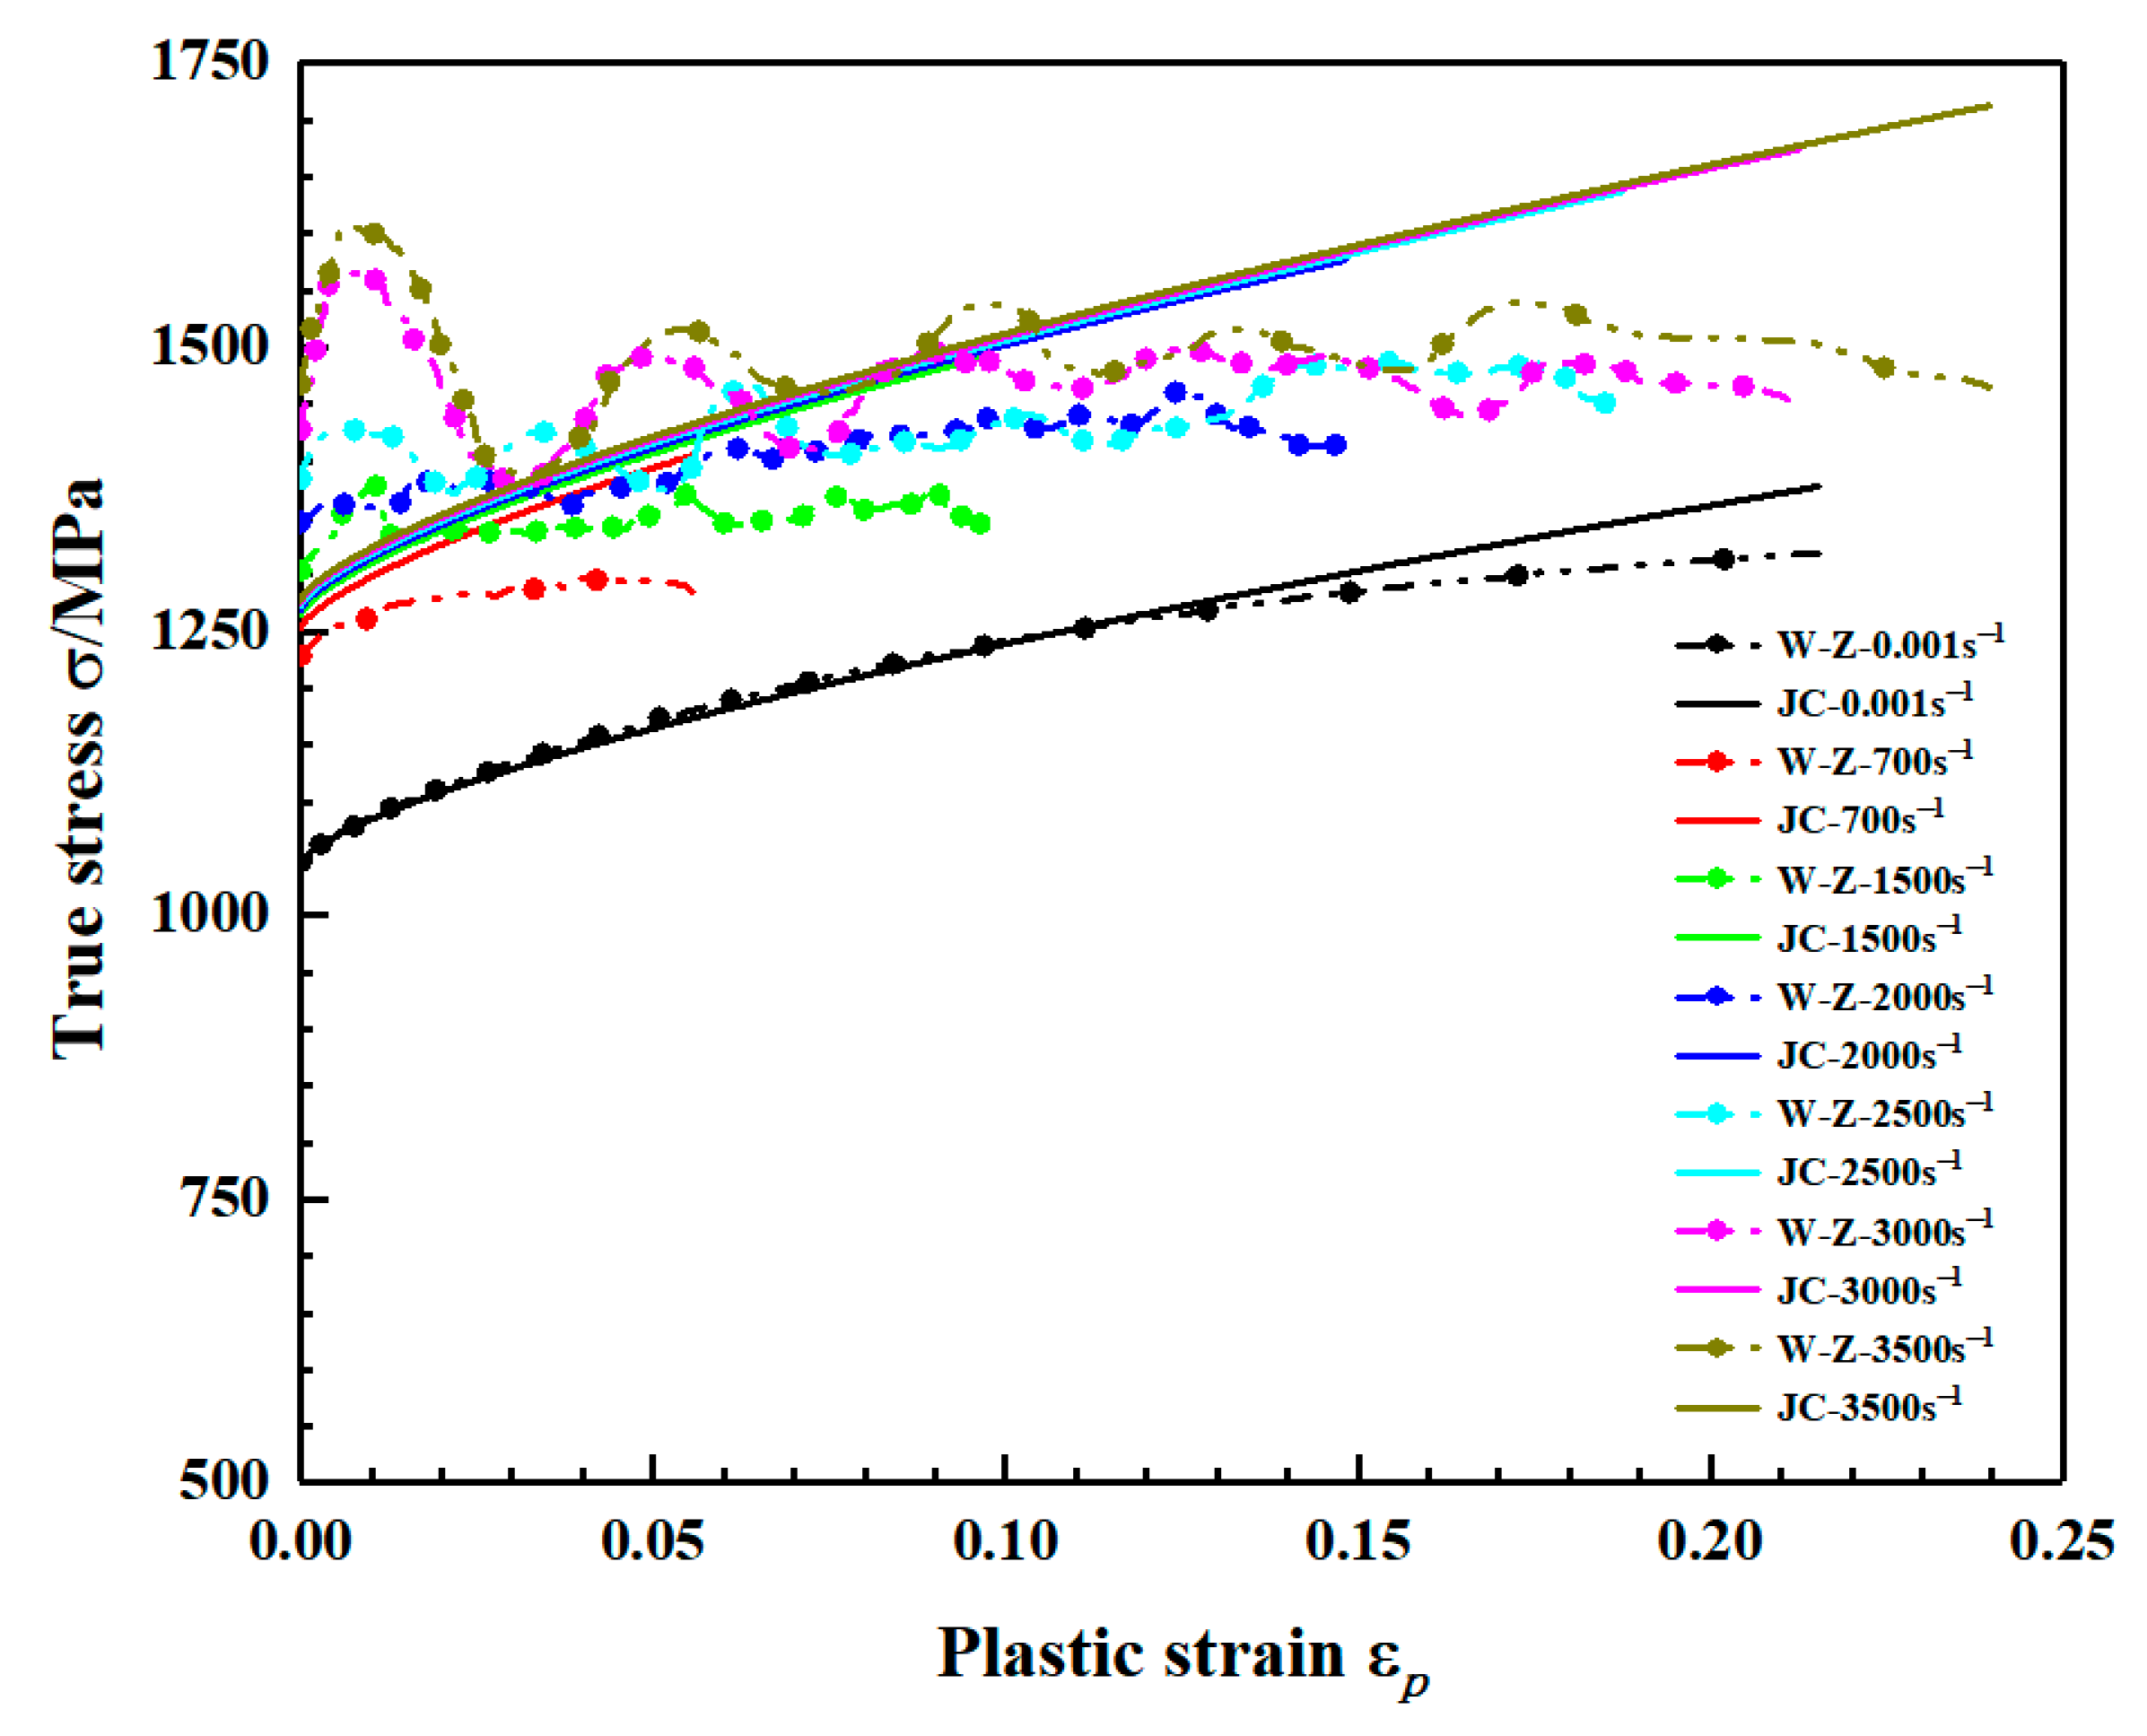
4.1. Parameter Fitting and Applicability Analysis
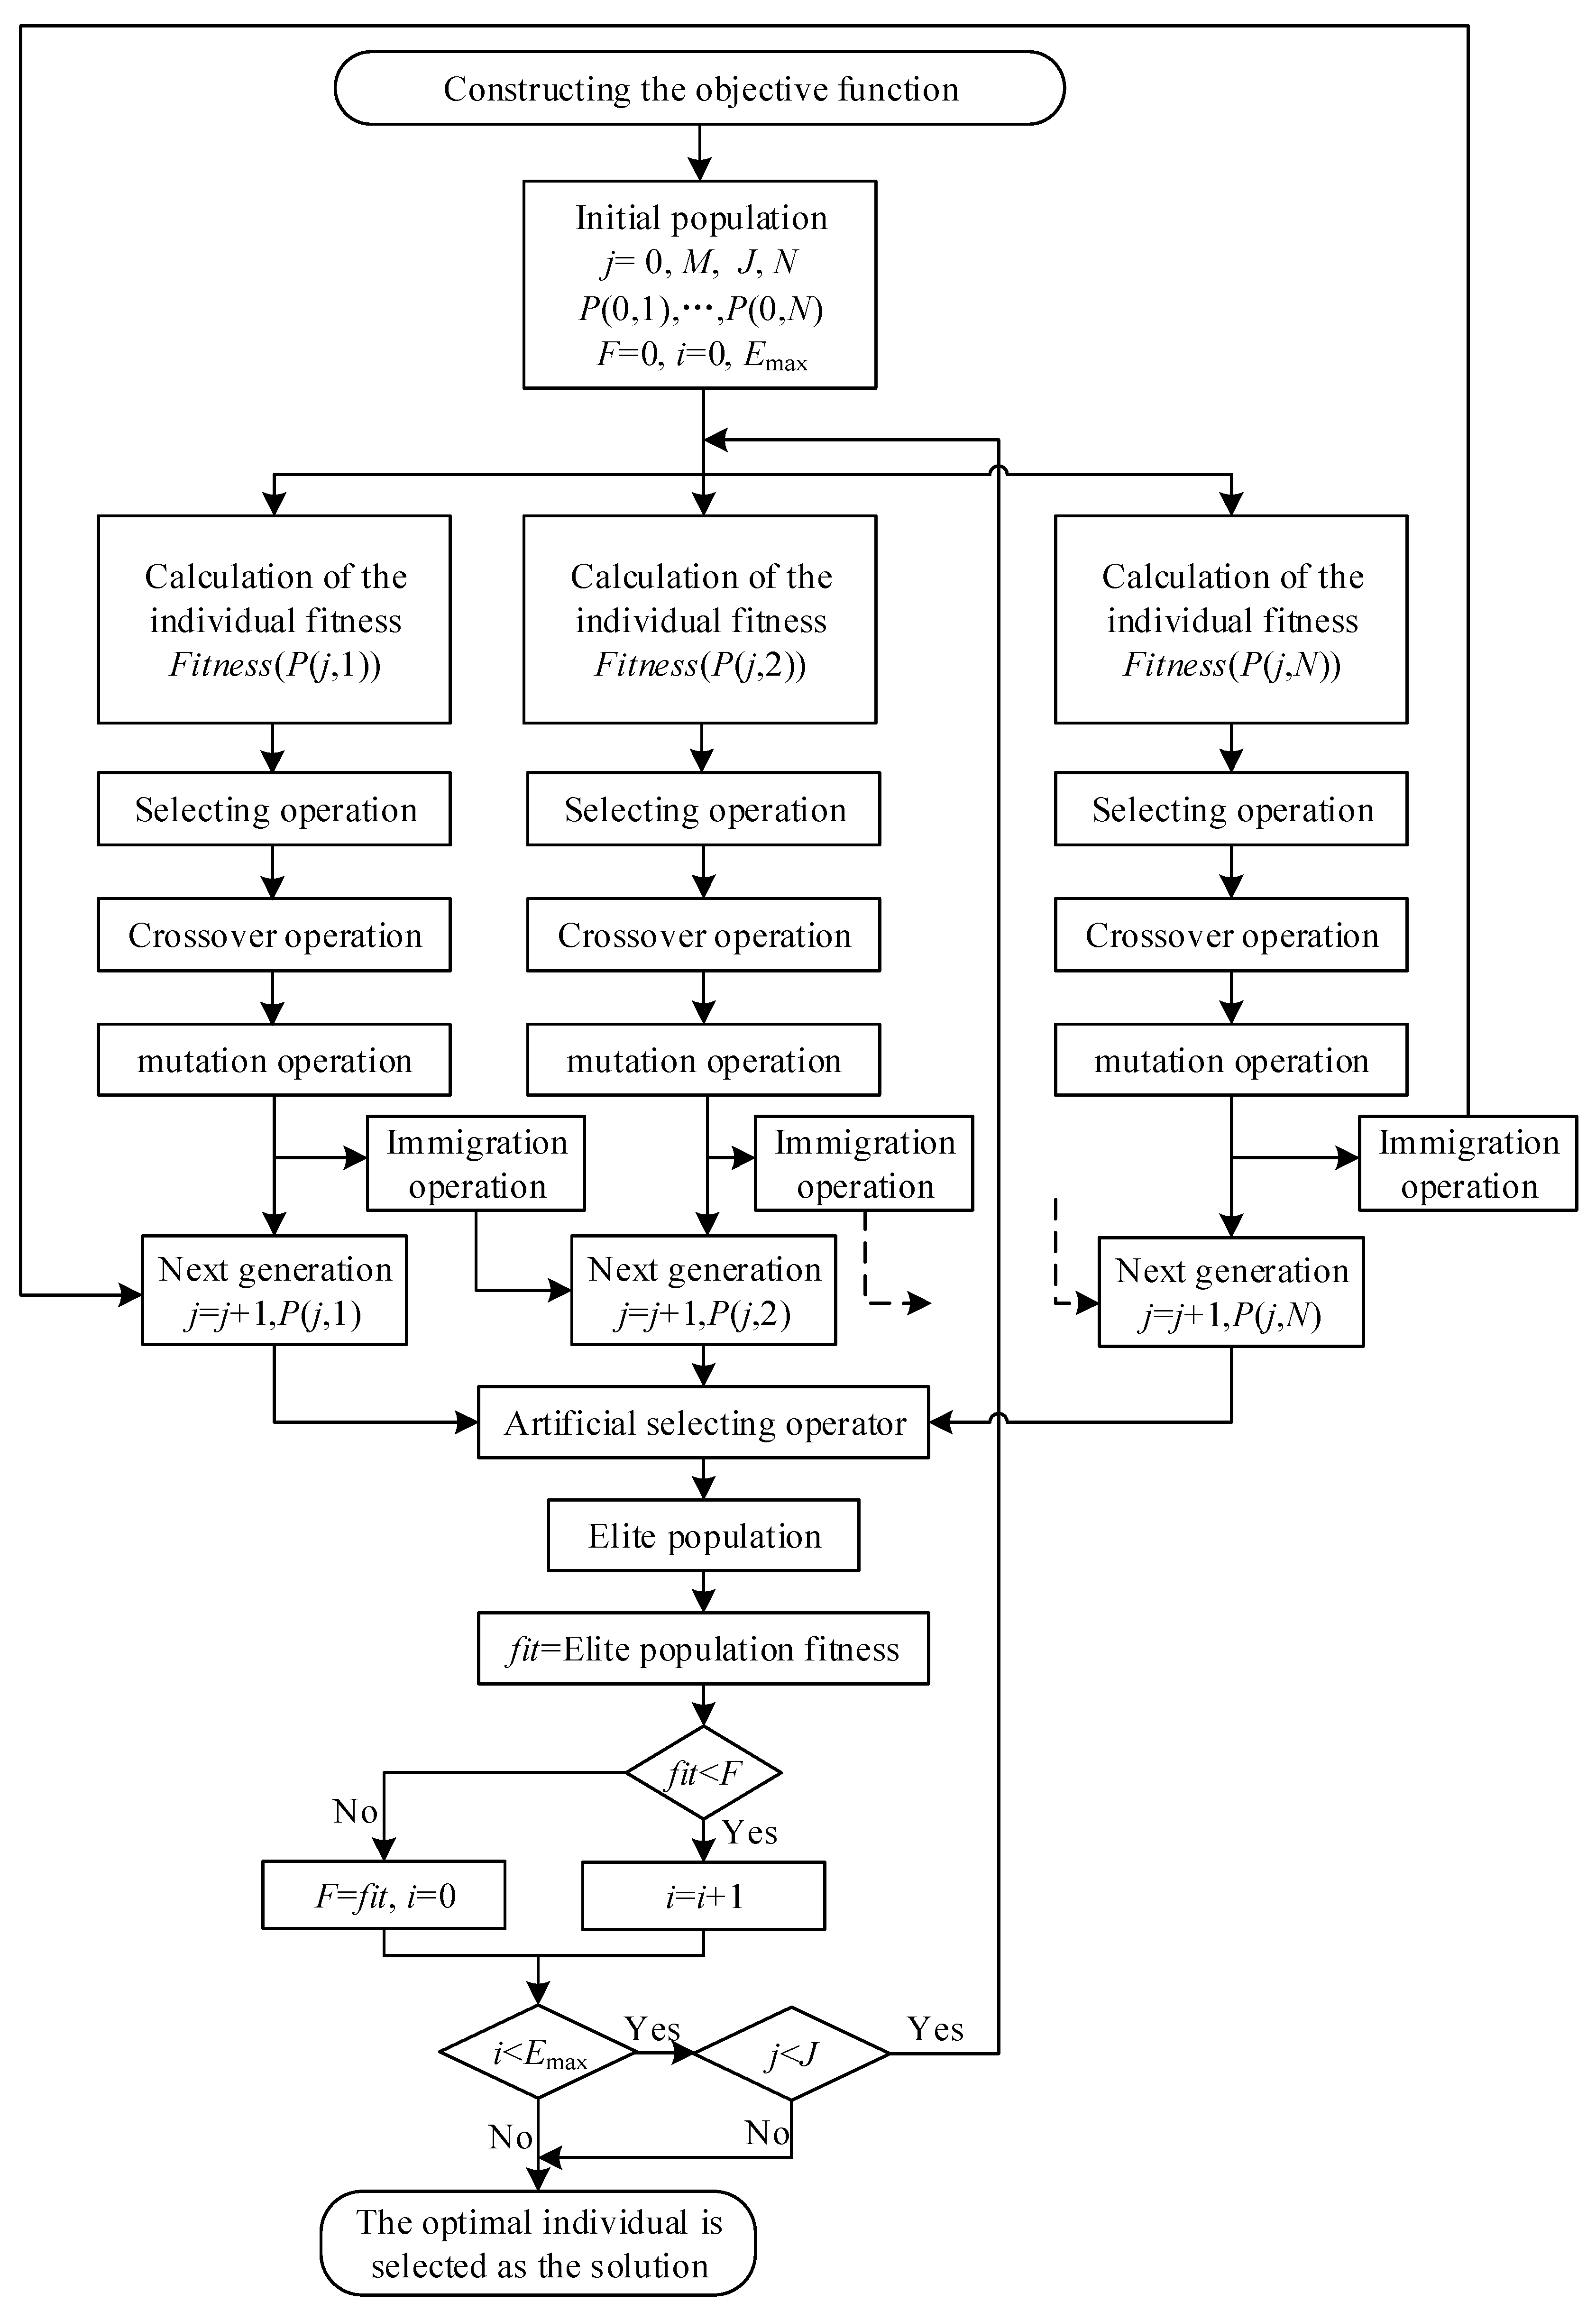
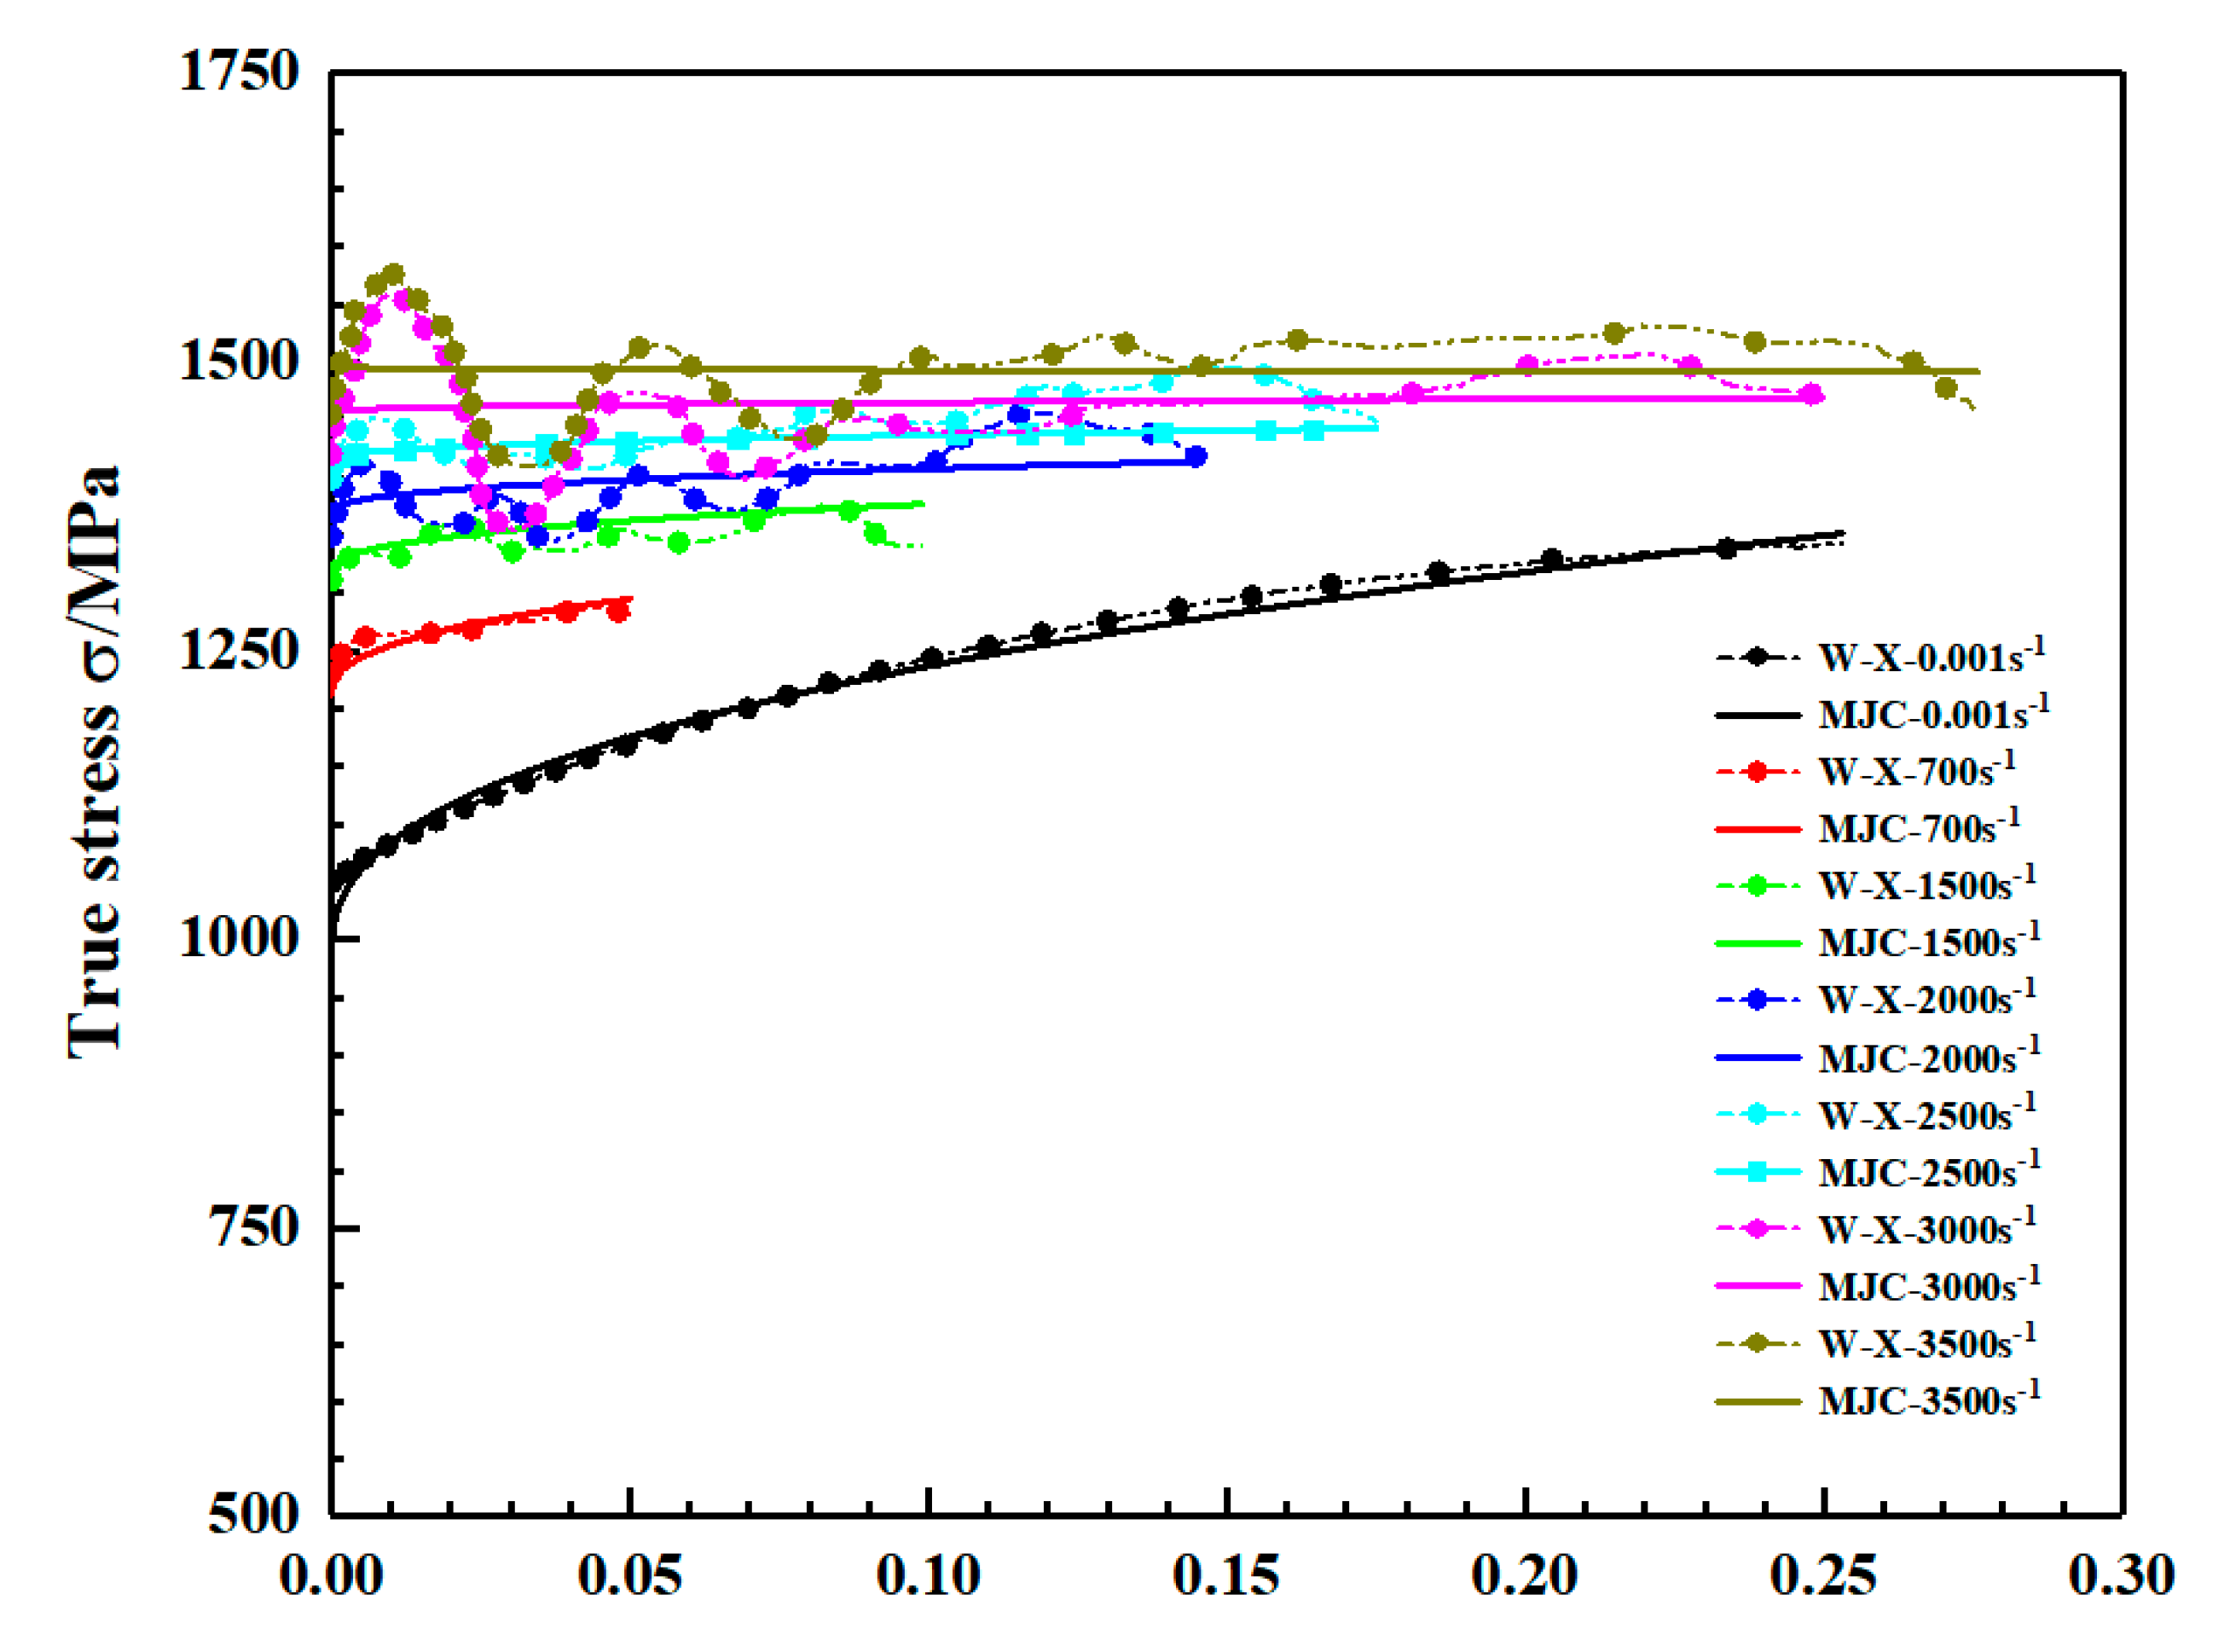
4.2. Model Modification and Parameter Fitting
5. Conclusions
Author Contributions
Funding
Institutional Review Board Statement
Informed Consent Statement
Data Availability Statement
Acknowledgments
Conflicts of Interest
References
- Williams, D.F. Titanium and titanium alloys. Biocompat. Clin. Implant. Mater. 1981. [Google Scholar] [CrossRef]
- Rafi, H.K.; Karthik, N.V.; Gong, H.; Starr, T.L.; Stucker, B.E. Microstructures and Mechanical Properties of Ti6Al4V Parts Fabricated by Selective Laser Melting and Electron Beam Melting. J. Mater. Eng. Perform. 2013, 22, 3872–3883. [Google Scholar] [CrossRef]
- Zhang, C.Q.; Xie, L.S.; Chen, M.H.; Shang, G.Q. Dynamic Mechanical Property and Plastic Constitutive Relation of TC4 DT Titanium Alloy under High Strain Rate. Chin. J. Nonferrous Met. 2015, 25, 323–329. [Google Scholar]
- Chen, R.; Tan, C.; You, Z.; Li, Z.; Zhang, S.; Nie, Z.; Yu, X.; Zhao, X. Effect of α phase on high-strain rate deformation behavior of laser melting deposited Ti-6.5Al-1Mo-1V-2Zr titanium alloy. Mater. Sci. Eng. A 2019, 750, 81–90. [Google Scholar] [CrossRef]
- Liu, S.; Shin, Y.C. Additive manufacturing of Ti6Al4V alloy: A review. Mater. Des. 2019, 164, 107552. [Google Scholar] [CrossRef]
- Jeffs, S.; Lancaster, R.; Davies, G.; Hole, W.; Roberts, B.; Stapleton, D.; Thomas, M.; Todd, I.; Baxter, G. Effect of Process Parameters and Build Orientation on Microstructure and Impact Energy of Electron Beam Powder Bed Fused Ti-6AL-4V. Materials 2021, 14, 5376. [Google Scholar] [CrossRef]
- Jamari, J.; Ammarullah, M.I.; Saad, A.P.M.; Syahrom, A.; Uddin, M.; van der Heide, E.; Basri, H. The Effect of Bottom Profile Dimples on the Femoral Head on Wear in Metal-on-Metal Total Hip Arthroplasty. J. Funct. Biomater. 2021, 12, 38. [Google Scholar] [CrossRef]
- Ammarullah, M.I.; Afif, I.Y.; Maula, M.I.; Winarni, T.I.; Tauviqirrahman, M.; Akbar, I.; Basri, H.; van der Heide, E.; Jamari, J. Tresca Stress Simulation of Metal-on-Metal Total Hip Arthroplasty during Normal Walking Activity. Materials 2021, 14, 7554. [Google Scholar] [CrossRef]
- Zhu, Y.; Tian, X.; Li, J.; Wang, H. The anisotropy of laser melting deposition additive manufacturing Ti–6.5Al–3.5Mo–1.5Zr–0.3Si titanium alloy. Mater. Des. 2015, 67, 538–542. [Google Scholar] [CrossRef]
- Zhu, Y.; Tian, X.; Li, J.; Wang, H. Microstructure evolution and layer bands of laser melting deposition Ti–6.5Al–3.5Mo–1.5Zr–0.3Si titanium alloy. J. Alloy. Compd. 2014, 616, 468–474. [Google Scholar] [CrossRef]
- Xie, L.; Liu, C.; Song, Y.; Guo, H.; Wang, Z.; Hua, L.; Wang, L.; Zhang, L.-C. Evaluation of microstructure variation of TC11 alloy after electroshocking treatment. J. Mater. Res. Technol. 2020, 9, 2455–2466. [Google Scholar] [CrossRef]
- Frazier, W.E. Metal Additive Manufacturing: A Review. J. Mater. Eng. Perform. 2014, 23, 1917–1928. [Google Scholar] [CrossRef]
- Xia, C.; Pan, Z.; Polden, J.; Li, H.; Xu, Y.; Chen, S.; Zhang, Y. A review on wire arc additive manufacturing: Monitoring, control and a framework of automated system. J. Manuf. Syst. 2020, 57, 31–45. [Google Scholar] [CrossRef]
- Köhler, M.; Fiebig, S.; Hensel, J.; Dilger, K. Wire and Arc Additive Manufacturing of Aluminum Components. Metals 2019, 9, 608. [Google Scholar] [CrossRef] [Green Version]
- Ding, D.; Pan, Z.; Cuiuri, D.; Li, H. Wire-feed additive manufacturing of metal components: Technologies, developments and future interests. Int. J. Adv. Manuf. Technol. 2015, 81, 465–481. [Google Scholar] [CrossRef]
- Chen, Y.; Yang, C.; Fan, C.; Zhuo, Y.; Lin, S.; Chen, C. Grain refinement of additive manufactured Ti-6.5Al-3.5Mo-1.5Zr-0.3Si titanium alloy by the addition of La2O3. Mater. Lett. 2020, 275, 128170. [Google Scholar] [CrossRef]
- Zong, Y.Y.; Shan, D.B.; Xu, M.; Lv, Y. Flow softening and microstructural evolution of TC11 titanium alloy during hot deformation. J. Mater. Processing Technol. 2009, 209, 1988–1994. [Google Scholar] [CrossRef]
- Wang, F.; Williams, S.; Colegrove, P. Microstructure and Mechanical Properties of Wire and Arc Additive Manufactured Ti-6Al-4V. Metall. Mater. Trans. Part A 2013, 44, 968–977. [Google Scholar] [CrossRef]
- Yan, X.; Shu, X.; Zhu, F.; Sun, K. A Comparative Study on Quasistatic Mechanical Properties of Four Kinds of Typical Microstructure of TC11 Titanium Alloy at Room Temperature. J. Yunnan Univ. China 2016, 38, 99–104. [Google Scholar]
- Huang, L.J.; Geng, L.; Li, A.B.; Cui, X.P.; Li, H.Z.; Wang, G.S. Characteristics of hot compression behavior of Ti–6.5Al–3.5Mo–1.5Zr–0.3Si alloy with an equiaxed microstructure. Mater. Sci. Eng. A 2009, 505, 136–143. [Google Scholar] [CrossRef]
- Chen, M.; Niu, Q.L.; An, Q.L.; Tang, S.W.; Li, P.N. Johnson-Cook Constitutive Equation for Titanium Alloy TC11. Key Eng. Mater. 2013, 589–590, 140–146. [Google Scholar] [CrossRef]
- Zhang, J.; Wang, Y.; Wang, Y. Experiment and Constitutive Model of Rate-dependent Behavior of Titanium Alloy TC11. Chin. J. Nonferrous Met. 2017, 27, 1369–1375. [Google Scholar]
- Zhou, Q.; Yan, Z.; Han, X.; Song, Q.; Liu, J.; Wang, F. Microstructure and Mechanical Properties of Laser Melting Deposited TC11 Titanium Alloys. Chin. J. Lasers 2018, 45, 67–74. [Google Scholar]
- Zhu, Y.; Li, J.; Tian, X.; Wang, H.; Liu, D. Microstructure and mechanical properties of hybrid fabricated Ti–6.5Al–3.5Mo–1.5Zr–0.3Si titanium alloy by laser additive manufacturing. Mater. Sci. Eng. A 2014, 607, 427–434. [Google Scholar] [CrossRef]
- Zong, X.; Li, Z.; Li, J.; Cheng, X.; Chen, R.; Tan, C.-W.; Wang, H.-M. High strain rate response of Ti-6.5Al-3.5Mo-1.5Zr-0.3Si titanium alloy fabricated by laser additive manufacturing. J. Alloy. Compd. 2019, 781, 47–55. [Google Scholar] [CrossRef]
- Wu, Q.; Lu, J.; Liu, C.; Shi, X.; Ma, Q.; Tang, S.; Fan, H.; Ma, S. Obtaining uniform deposition with variable wire feeding direction during wire-feed additive manufacturing. Mater. Manuf. Processes 2017, 32, 1881–1886. [Google Scholar] [CrossRef]
- Han, Y.; Xu, Z.; Dou, W.; Fan, C.; Hou, B.; He, X.; Liu, Y.; Huang, F. Pure mode II dynamic fracture characteristics and failure mechanism of Zr41. 2Ti13. 8Cu12. 5Ni10Be22. 5 bulk metallic glass. Mater. Sci. Eng. A 2022, 833, 142573. [Google Scholar] [CrossRef]
- Xu, Z.; Ding, X.; Zhang, W.; Huang, F. A novel method in dynamic shear testing of bulk materials using the traditional SHPB technique. Int. J. Impact Eng. 2017, 101, 90–104. [Google Scholar] [CrossRef]
- Xu, Z.; He, X.; Hu, H.; Tan, P.J.; Liu, Y.; Huang, F. Plastic behavior and failure mechanism of Ti-6Al-4V under quasi-static and dynamic shear loading. Int. J. Impact Eng. 2019, 130, 281–291. [Google Scholar] [CrossRef]
- Nemat-Nasser, S.; Isaacs, J.B.; Starrett, J.E. Hopkinson Techniques for Dynamic Recovery Experiments. Proc. R. Soc. A Math. Phys. Eng. Sci. 1991, 434, 371–391. [Google Scholar]
- Hu, S. Hopkinson Bar Pressing Technique. Ordnance Mater. Sci. Eng. China 1991, 11, 40–47. [Google Scholar]
- Lee, W.-S.; Lin, C.-F.; Liu, T.-J. Impact and fracture response of sintered 316 L stainless steel subjected to high strain rate loading. Mater. Charact. 2007, 58, 363–370. [Google Scholar] [CrossRef]
- Lee, W.S.; Chiou, S.T. The influence of loading rate on shear deformation behaviour of tungsten composite. Compos. Part B Eng. 1996, 27, 193–200. [Google Scholar] [CrossRef]
- Tang, C.; Zhu, J.; Zhou, H. Strain Rate Effect and Thermal Activation Theory on Yield Strength of Metallic Materials. J. Met. China 1995, 31, 248–253. [Google Scholar]
- Dannemann, K.A.; Chalivendra, V.B.; Song, B. Dynamic Behavior of Materials. Exp. Mech. 2012, 52, 117–118. [Google Scholar] [CrossRef] [Green Version]
- Wang, L.; Qiao, J.W.; Ma, S.G.; Jiao, Z.M.; Zhang, T.W.; Chen, G.; Zhao, D.; Zhang, Y.; Wang, Z.H. Mechanical response and deformation behavior of Al0.6CoCrFeNi high-entropy alloys upon dynamic loading. Mater. Sci. Eng. A 2018, 727, 208–213. [Google Scholar] [CrossRef]
- Hu, H.; Xu, Z.; Dou, W.; Huang, F. Effects of strain rate and stress state on mechanical properties of Ti-6Al-4V alloy. Int. J. Impact Eng. 2020, 145, 103689. [Google Scholar] [CrossRef]
- Liang, R.; Khan, A.S. A critical review of experimental results and constitutive models for BCC and FCC metals over a wide range of strain rates and temperatures. Int. J. Plast. 1999, 15, 963–980. [Google Scholar] [CrossRef]
- Xu, Z.; Huang, F. Comparison of constitutive models for FCC metals over wide temperature and strain rate ranges with application to pure copper. Int. J. Impact Eng. 2015, 79, 65–74. [Google Scholar] [CrossRef]
- Cui, H.; Song, P.; Gu, X.H.; Zhou, H.; Xing, B.Y.; Jiang, L.; Guo, R. Determination of the JWL Parameters of Detonation Products Using Adaptive Genetic Algorithm. Propellants Explos. Pyrotech. 2020, 45, 1920–1930. [Google Scholar] [CrossRef]
- Wang, C.; Xu, W.; Guo, Y. Calculation of JWL Equation of State Parameters Based on Genetic Algorithm and γ Equation of State. Acta Armamentarii China 2017, 38 (Suppl. S1), 167–173. [Google Scholar]
- Wen, J.; Liu, C.; Yao, H.; Wu, B. A nonlinear dynamic model and parameters identification method for predicting the shock pulse of rubber waveform generator. Int. J. Impact Eng. 2018, 120, 1–15. [Google Scholar] [CrossRef]
- Dastgiri, M.S.; Thakkar, R.; Shi, J.; Sarraf, I.S.; Green, D.E. Constitutive modelling of Usibor® 1500 sheets after intercritical quenching. IOP Conf. Ser. Mater. Sci. Eng. 2021, 1157, 12071. [Google Scholar] [CrossRef]
- Wang, Y.; Zeng, X.; Chen, H.; Yang, X.; Wang, F.; Zeng, L. Modified Johnson-Cook constitutive model of metallic materials under a wide range of temperatures and strain rates. Results Phys. 2021, 27, 104498. [Google Scholar] [CrossRef]
- Alshraideh, M.; Tahat, L. Multiple-Population Genetic Algorithm for Solving Min-Max Optimization Problems. Int. Rev. Comput. Softw. 2015, 10, 9–19. [Google Scholar] [CrossRef]
- Lin, Y. Solution of Inverse Kinematics for General Robot Manipulators Based on Multiple Population Genetic Algorithm. J. Mech. Eng. 2017, 53, 1–8. [Google Scholar] [CrossRef]


| Al | Mo | Zr | Si | Ti | Impurities |
|---|---|---|---|---|---|
| 5.8~7.0 | 2.8~3.8 | 0.8~2.0 | 0.2~0.35 | Residuals | ≤1.042 |
| Group | Strain Rate/s−1 | 0.001 | 0.01 | 0.1 | 700 | 1500 | 2000 | 2500 | 3000 | 3500 |
|---|---|---|---|---|---|---|---|---|---|---|
| Z | σs/MPa | 1046.76 | 1065.15 | 1112.13 | 1229.61 | 1303.74 | 1346.22 | 1384.05 | 1427.05 | 1450.76 |
| σ0.05/MPa | 1171.78 | 1184.38 | 1210.84 | 1294.83 | 1353.12 | 1378.41 | 1409.66 | 1480.81 | 1503.72 | |
| X | σs/MPa | 1048.48 | 1071.12 | 1110.64 | 1229.83 | 1310.56 | 1348.96 | 1398.30 | 1420.38 | 1454.56 |
| σ0.05/MPa | 1169.79 | 1193.14 | 1219.42 | 1282.55 | 1354.04 | 1392.66 | 1418.45 | 1474.01 | 1505.57 |
| Strain Rate/s−1 | 0.001 | 0.01 | 0.1 | 700 | 1500 | 2000 | 2500 | 3000 | 3500 | |
|---|---|---|---|---|---|---|---|---|---|---|
| Absolute Error | σs | −1.72 | −5.97 | 1.49 | −0.22 | −6.82 | −2.74 | −14.25 | 6.67 | −3.80 |
| σ0.05 | 1.99 | −8.76 | −8.58 | 12.28 | −0.92 | −14.25 | −8.97 | 6.80 | −1.85 | |
| Parameters | A/MPa | a | b | B/MPA | n | C2 | |
|---|---|---|---|---|---|---|---|
| Range of values | [400,1000] | [0,1] | [0,1] | [500,200] | [0,1] | [−1,1] | [0,1000] |
| A/MPa | a | b | B/MPA | n | C2 | |
|---|---|---|---|---|---|---|
| 441.63 | 1.14 × 10⁻⁵ | 0.2512 | 1605.9 | 0.4083 | −0.01225 | 130 |
Publisher’s Note: MDPI stays neutral with regard to jurisdictional claims in published maps and institutional affiliations. |
© 2022 by the authors. Licensee MDPI, Basel, Switzerland. This article is an open access article distributed under the terms and conditions of the Creative Commons Attribution (CC BY) license (https://creativecommons.org/licenses/by/4.0/).
Share and Cite
Tian, Z.; Wu, H.; Tan, C.; Dong, H.; Li, M.; Huang, F. Dynamic Mechanical Properties of TC11 Titanium Alloys Fabricated by Wire Arc Additive Manufacturing. Materials 2022, 15, 3917. https://doi.org/10.3390/ma15113917
Tian Z, Wu H, Tan C, Dong H, Li M, Huang F. Dynamic Mechanical Properties of TC11 Titanium Alloys Fabricated by Wire Arc Additive Manufacturing. Materials. 2022; 15(11):3917. https://doi.org/10.3390/ma15113917
Chicago/Turabian StyleTian, Ze, Haijun Wu, Chengwen Tan, Heng Dong, Meng Li, and Fenglei Huang. 2022. "Dynamic Mechanical Properties of TC11 Titanium Alloys Fabricated by Wire Arc Additive Manufacturing" Materials 15, no. 11: 3917. https://doi.org/10.3390/ma15113917
APA StyleTian, Z., Wu, H., Tan, C., Dong, H., Li, M., & Huang, F. (2022). Dynamic Mechanical Properties of TC11 Titanium Alloys Fabricated by Wire Arc Additive Manufacturing. Materials, 15(11), 3917. https://doi.org/10.3390/ma15113917