Article

Effect of TiO2 Nanoparticles on the Fresh Performance of 3D-Printed Cementitious Materials

1
Academic Coordination, Federal University of Santa Maria (UFSM), Cachoeira do Sul 96503-205, Brazil
2
Department of Structures and Civil Construction, Federal University of Santa Maria (UFSM), Santa Maria 97105-900, Brazil
3
Department of Civil Engineering, Federal University of Santa Catarina (UFSC), Florianópolis 88040-900, Brazil
*
Author to whom correspondence should be addressed.
Materials 2022, 15(11), 3896; https://doi.org/10.3390/ma15113896
Submission received: 27 April 2022 / Revised: 20 May 2022 / Accepted: 28 May 2022 / Published: 30 May 2022
(This article belongs to the Special Issue Concrete 3D Printing and Digitally-Aided Fabrication (Second Volume))

Abstract

:
3D printing (3DP) of cementitious materials shows several advantages compared to conventional construction methods, but it requires specific fresh-state properties. Nanomaterials have been used in cement-based materials to achieve specific fresh and hardened properties, being potential candidates for 3DP applications. However, there are no reports on using TiO2 nanoparticles (nano-TiO2) in 3DP cementitious composites. Thus, the current work aims to assess the effect of nano-TiO2 on the fresh performance of 3DP cementitious materials. For this purpose, nano-TiO2 was incorporated in pastes and mortars from 0 to 1.5 wt.%. Time-resolved hydration (in situ XRD) and rheological and printing-related properties (buildability and printability) were evaluated. Results showed that nano-TiO2 particles enhanced the cement hydration kinetics, leading to further ettringite formation up to 140 min compared to plain cement paste. Rheological measurements showed that the nano-TiO2 incorporation progressively increased the static and dynamic stress, viscosity, and structuration rate of pastes. Furthermore, nano-TiO2 improved the buildability of the composites, progressively increasing the maximum number of successive layers printed before failure from 11 (0 wt.% TiO2) to 64 (1.5 wt.% TiO2). By contrast, the nano-TiO2 addition reduced the printability (i.e., the printable period during which the sample was able to be molded by the 3D-printing process) from 140 min (0% TiO2) to 90 min (1.5% TiO2). Thus, incorporating “high” nano-TiO2 contents (e.g., >1 wt.%) was beneficial for buildability but would require a quicker 3DP process. The adoption of nano-TiO2 contents of around 0.75–1.00% may be an interesting choice since it reduced the printability of paste by 30 min compared with the control mix but allowed for printing 24 layers (118% higher than plain mortar).

1. Introduction

Three-dimensional printing (3DP) is a digital fabrication process that builds elements by the successive deposition of layers. This technology has been quickly evolving in the last years, reaching scales from a few micrometers for ceramics applications [1] to several meters for building purposes [2]. The use of 3DP in construction brings many advantages, such as increasing productivity, reducing execution errors, building complex shapes, and dismissing the use of formwork, as well as lesser working men [3]. In addition, sustainable binders such as geopolymer [4] and magnesium potassium phosphate cement [5,6] can be used to produce 3D-printed composites with reduced environmental impact.
One of the biggest challenges in 3DP of cementitious materials is to control the rheological properties of the material (i.e., fresh-state behavior). It is known that the rheology of fresh mortar and concrete is governed by the presence, type, and quantity of the constituents (water, binders, aggregates, chemical admixtures, fibers, etc.) [7]. In 3DP applications, fresh material must have relatively low viscosity and moderate yield stress [8]: a low viscosity allows the material to flow through pipes (for printer feeding), but a minimum viscosity is desired to ensure cohesiveness; the yield stress must be enough to provide a stiffness that resists the gravity-induced stress from the above layers [9].
Nanoparticles have been used in cement-based materials mainly to provide new properties (e.g., photocatalytic properties) [10,11,12] or improve the existing ones (e.g., increasing mechanical strength and durability) [13,14]. However, due to the very high specific surface area of nanoparticles, they can also be used to control the rheology of paste, mortar, and concrete. Marchon et al. [15] reported that clay nanoparticles could be used to improve the buildability (addressed in Section 2.3) of 3DP cementitious material by increasing its thixotropy; this improves the shape stability by promoting fresh-state stiffening after printing, while the flowability during printing is not negatively affected. Mendoza Reales et al. [16] also observed that the addition of nanoclay and nanosilica (by up to 1 wt.%) increased the thixotropy of 3DP cement paste. Similar behaviors were reported by Kawashima et al. [17] and Douba et al. [17]. Kruger et al. [18] observed that 1 wt.% of nanosilica increased the static yield stress of mortar by 44%, increasing the maximum printed height before collapsing from 540 to 590 mm. Sanjayan et al. [19] added 0.1–0.3 wt.% nanoclay in mortar, observing progressive increases in the yield stress (by up to 240%), viscosity (by up to 31%), thixotropic index (by up to 156%), and maximum number of printed layers (from 21 to 320) with the increase in the nanoclay content. Senff and co-authors evaluated the effect of nanosilica incorporation on the fresh properties of cement-based materials. The incorporation of up to 2.5 wt.% nanosilica in paste and mortar increased the yield stress (by 66%) and viscosity (by 4%) and decreased the setting time (by 60%) compared to plain cement paste [20]. When nanosilica was coupled with silica fume [21], the authors found that 5 wt.% silica fume addition did not significantly affect the yield stress and viscosity of the mix, while 1 wt.% nanosilica addition increased the viscosity of paste by about 160%; both additions increased the thixotropy of paste, in line with the other reports mentioned above. Nanosilica particles promote a refined pore network as well as longer C-S-H chains and a lower Ca/Si ratio [22]. Yang et al. [23] and Sikora et al. [24] respectively used calcium carbonate and silica nanoparticles to improve the fresh performance of 3DP mixes, discussed in Section 3.
TiO2 nanoparticles are often used in cement-based materials for photocatalytic purposes, as mentioned above [10,11,12]. In turn, the fresh-state performance of cementitious materials containing nano-TiO2 is much less addressed than materials containing other nanoparticles. Senff et al. [25,26] evaluated the influence of nano-TiO2 addition on the rheological behavior of cement paste and mortar. The yield stress and viscosity of pastes increased by 148% and 24%, respectively, when 1 wt.% nano-TiO2 was incorporated. Besides, nano-TiO2 increased the thixotropy of paste, visually assessed by the hysteresis loop but not quantified. Furthermore, mortar spread (related to yield stress) was reduced by up to 7.4% when 5.2 wt.% nano-TiO2 was incorporated. Joshaghani et al. [27] investigated the effect of TiO2, Al2O3, and Fe2O3 nanoparticles incorporation (0–5 wt.%) on the fresh properties of self-compacting concrete. The authors reported that the TiO2-containing concretes required 1.5 times more superplasticizer than plain concrete to reach the required slump flow. Besides, nano-TiO2 led to the highest admixture demand despite having the lowest specific surface area among the nanoparticles. Similarly, Jalal et al. [28] assessed the effect of TiO2 nanoparticles incorporation (0–5 wt.%) on the fresh performance of self-compacting concrete, observing that the increase in the nano-TiO2 content progressively reduced the slump flow (associated with yield stress) by up to 9% and increased the V-funnel time (associated with viscosity) by up to 24% compared to plain concrete.
Although some works investigated the effect of nano-TiO2 incorporation on the fresh properties of cementitious materials, this nanomaterial has not been used yet in 3DP mixes, to the best of our knowledge. Thus, the current work investigated the effect of incorporating TiO2 nanoparticles on the early hydration, rheology, and printability of cementitious composites. For this purpose, cementitious composites were produced with different nano-TiO2 contents, and their fresh performance was evaluated through in situ X-ray diffraction and time-resolved rheological and 3DP tests.

2. Materials and Methods
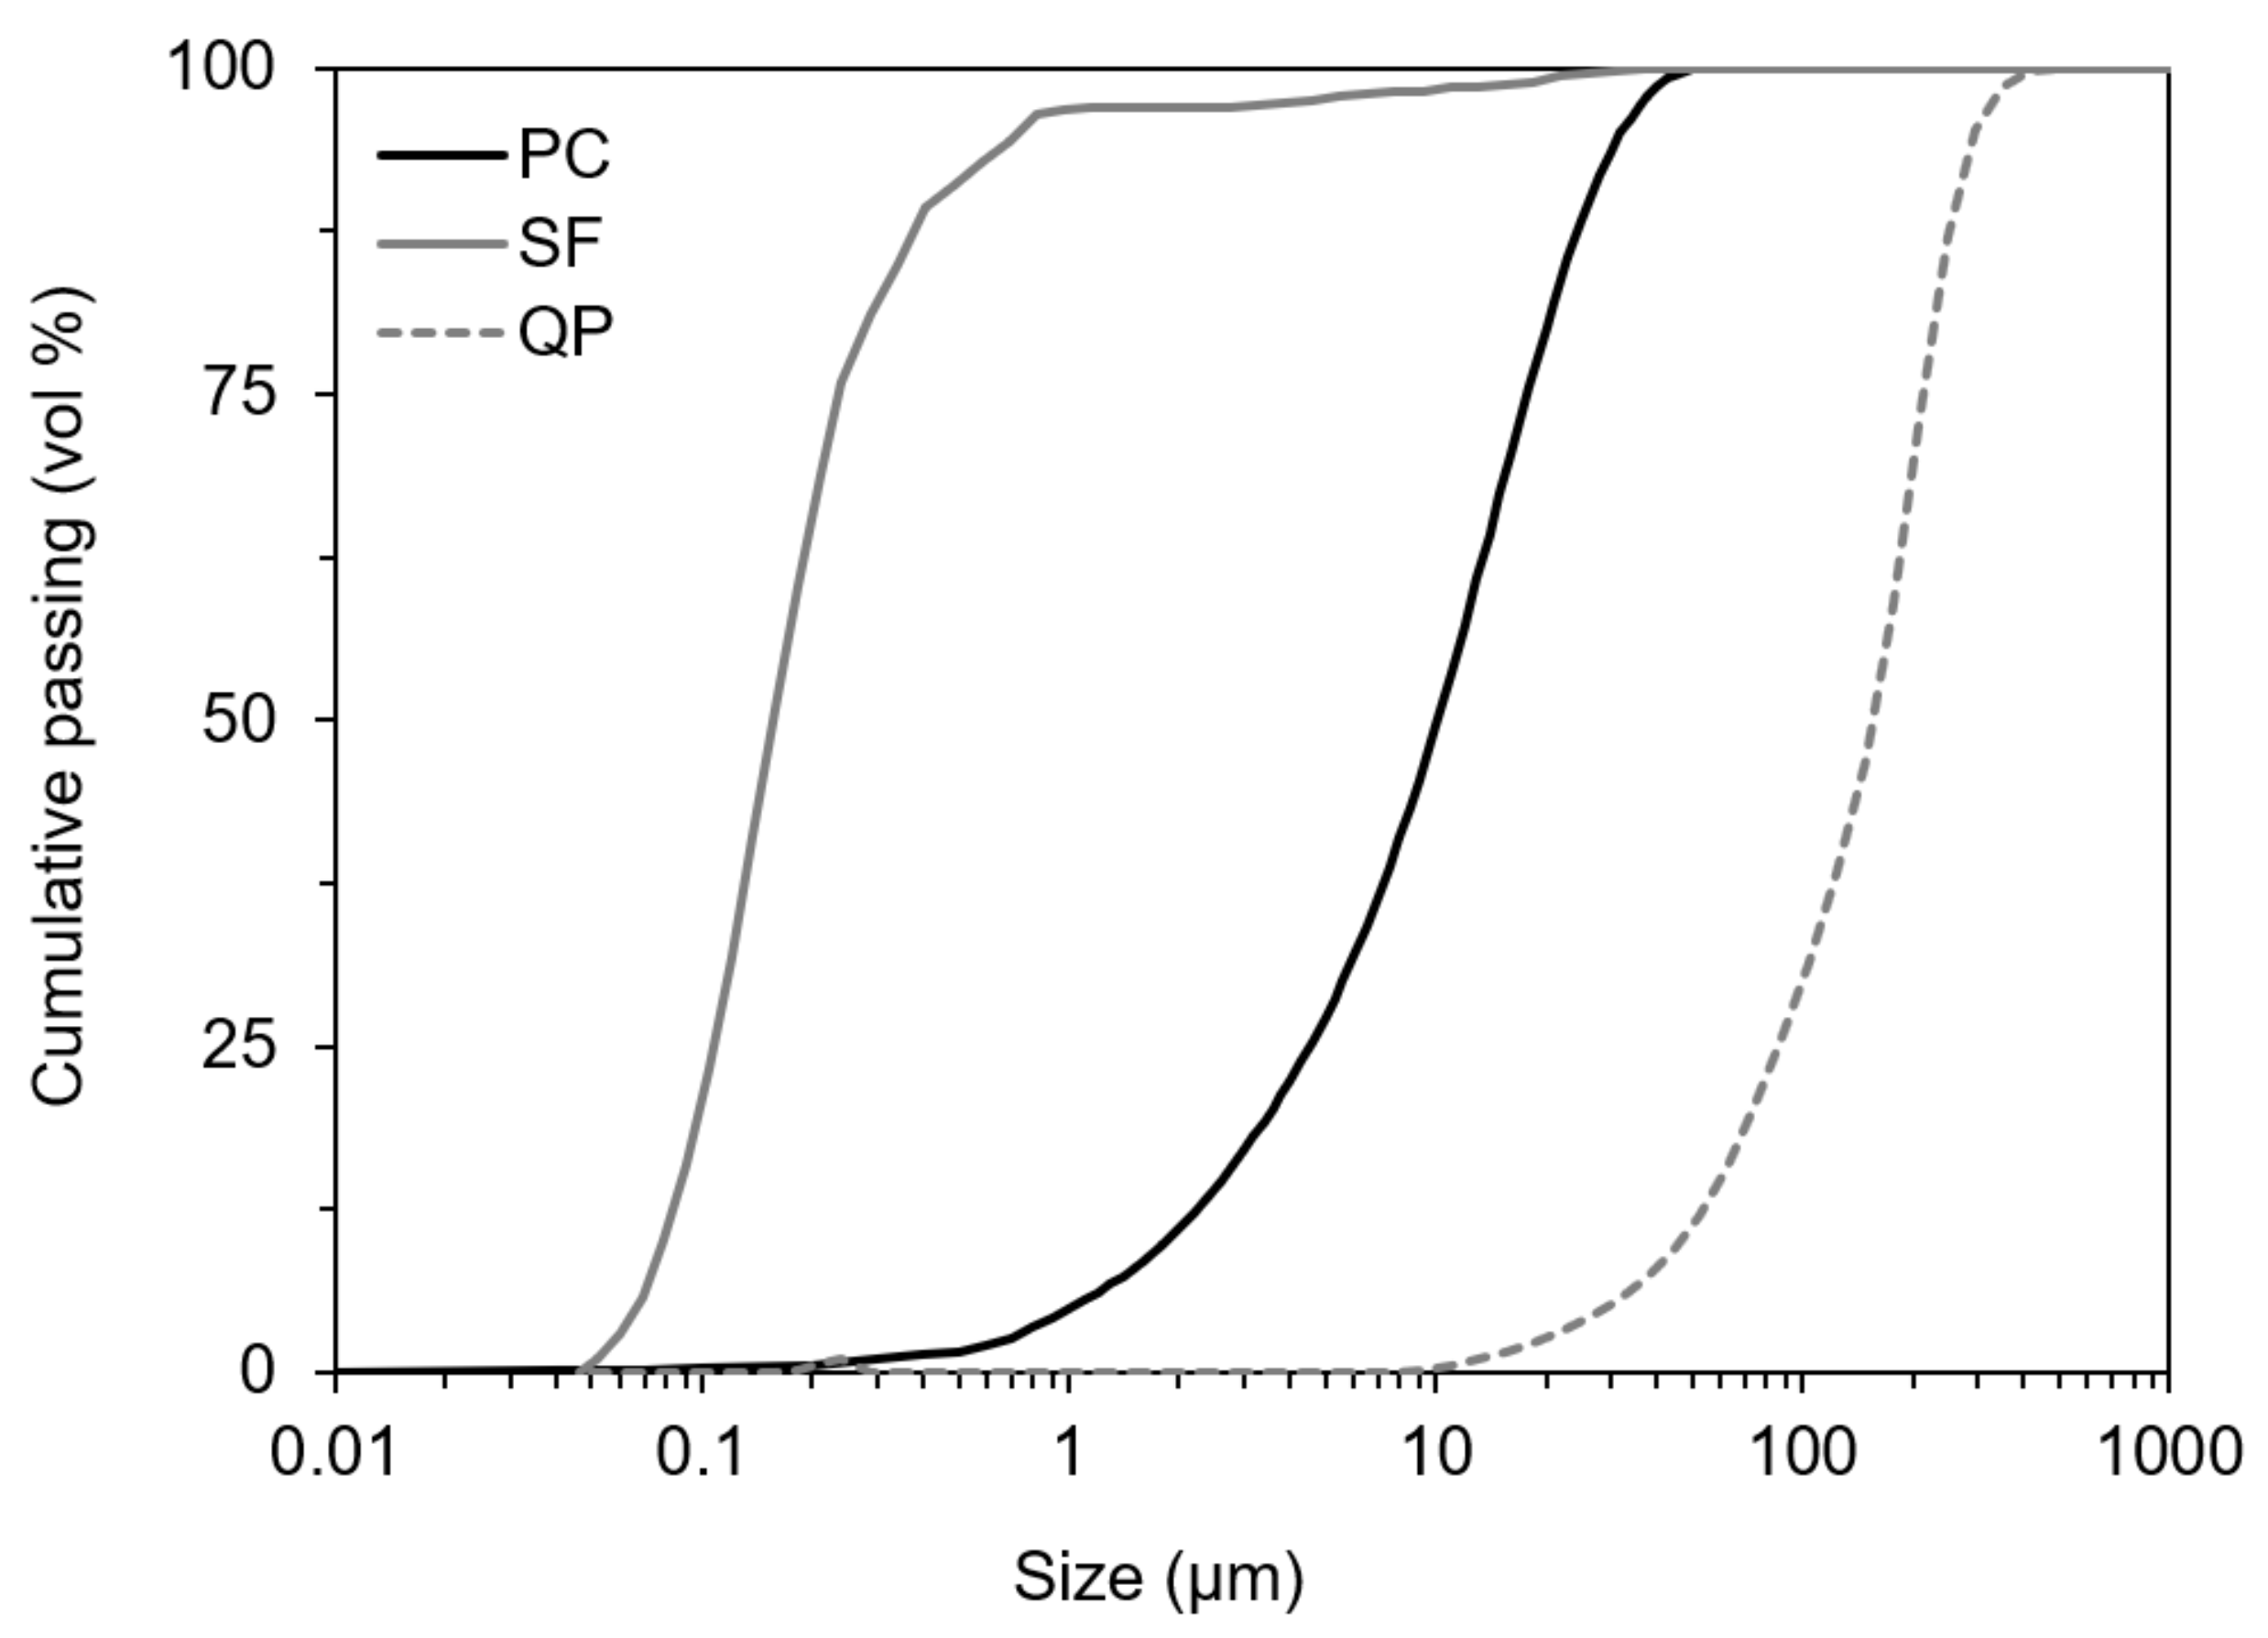
2.1. Materials

Commercial Portland cement (Itambé, Belo Horizonte, Brazil), silica fume 971U (Elkem, Oslo, Norway), and ground quartz (Brasilminas, Guarulhos, Brazil) were used for the preparation of the cementitious mortars. TiO2 nanopowder A-ZUOJ00133/36 (Tronox, Uerdingen, Germany) in the form of anatase was used, with a median diameter of 223 nm and BET specific surface area of 70.2 m2/g. Polycarboxylate-bases superplasticizer (SP) EXP CR 7105 (GCP, Alpharetta, GA, USA) was used, with a solid content of 20.9 wt.% and density of 1.05 g/cm3.
Figure 1 shows the particle size distribution (PSD) of the powder materials used determined by laser diffraction, and Table 1 shows the chemical and physical characteristics of the binder fraction determined by X-ray fluorescence (FRX) spectrometry. The mineralogical composition of the cement is presented in Table A1 (see Appendix A), determined by X-ray diffraction (XRD) and Rietveld analysis following Ref. [29].

2.2. Mix Proportions and Sample Preparation

A reference mortar was produced without nano-TiO2. Its mix proportion was based on 3DP mixes reported in the literature [18,30,31,32,33,34], adopting the following parameters (in weight basis): a water/binder (w/b) ratio of 0.3/1; a PC/SF ratio of 0.9/0.1, and a binder/quartz powder ratio of 1/1. Although the PSD of the quartz powder does not classify it as sand (see Section 2.1), the cementitious composites containing it were called “mortars” to distinguish them from the paste mixes without quartz described next. Then, nano-TiO2 was incorporated in cement replacement levels of 0.25, 0.50, 0.75, 1.00, and 1.50 wt.%. These contents were based on previous literature reports that incorporated nano-TiO2 in cement-based materials [35,36,37,38,39]. The SP content was adjusted for the reference mix to reach a proper printability and buildability (allowing to print at least 10 layers—see Section 2.3.2), and then was fixed for the other samples. A detailed composition of the mortars produced is presented in Table 2.
In addition, pastes (without quartz powder) were produced for the rheological and hydration tests. The addition of quartz powder in the content present in the mortars would make it difficult to quantify the minor phases of interest (e.g., ettringite) while it exceeded the maximum torque capacity of the rheometer in the rheological tests. The pastes were produced with the same proportions detailed in Table 2 except for the quartz powder.
Mortars were prepared in batches of 1 L in a planetary mixer with 5 L and 285 rpm capacity in a controlled room at 23 °C. The mixing procedure was as follows: (i) the dry materials (except for silica fume) were previously homogenized; (ii) the mixer was turned on, and the water + SP (previously mixed) were gradually added over 1 min; (iii) the silica fume was gradually added over 3 min; (iv) the mortar was mixed up to 10 min. Immediately after mixing, the printer container (“tube” in Figure 2) was filled with mortar.
Pastes were prepared in a high-shear capacity mixer in batches of 100 mL. After hand-mixing the dry materials, the powder and the water + SP solution (previously mixed) were added to the mixer container, and the sample was mixed at 10,000 rpm for 2 min.

2.3. Testing Methods

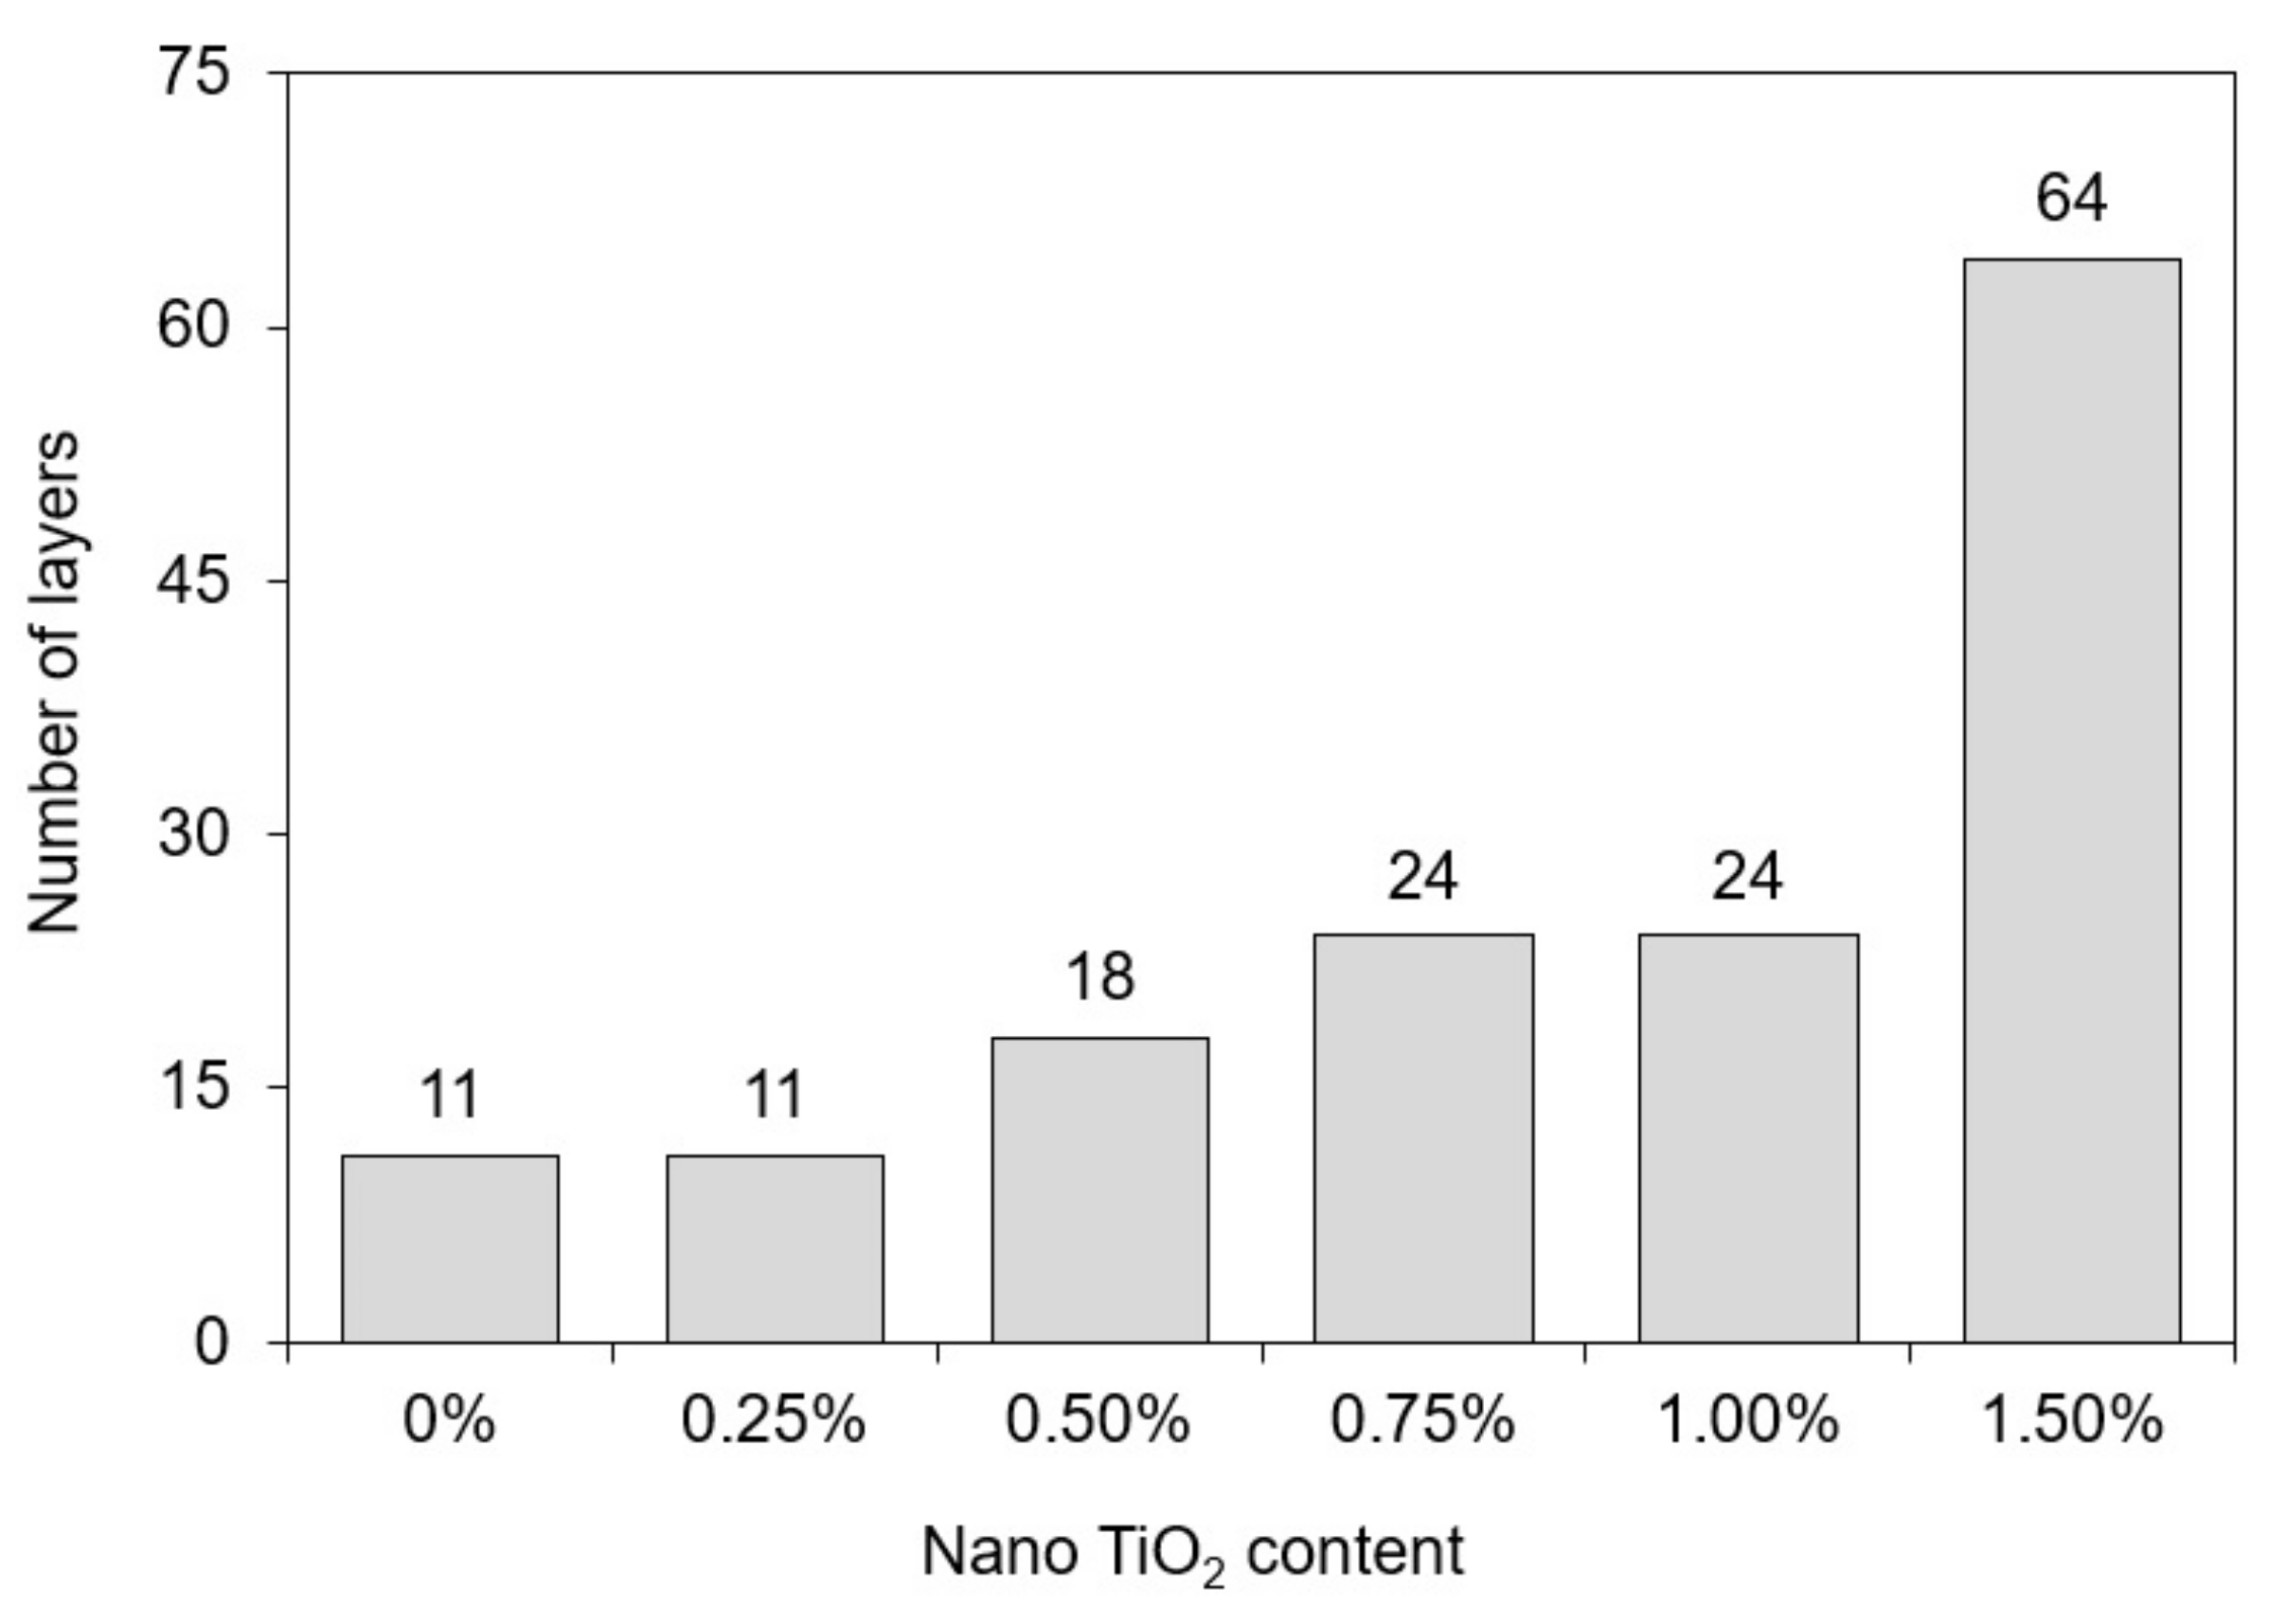
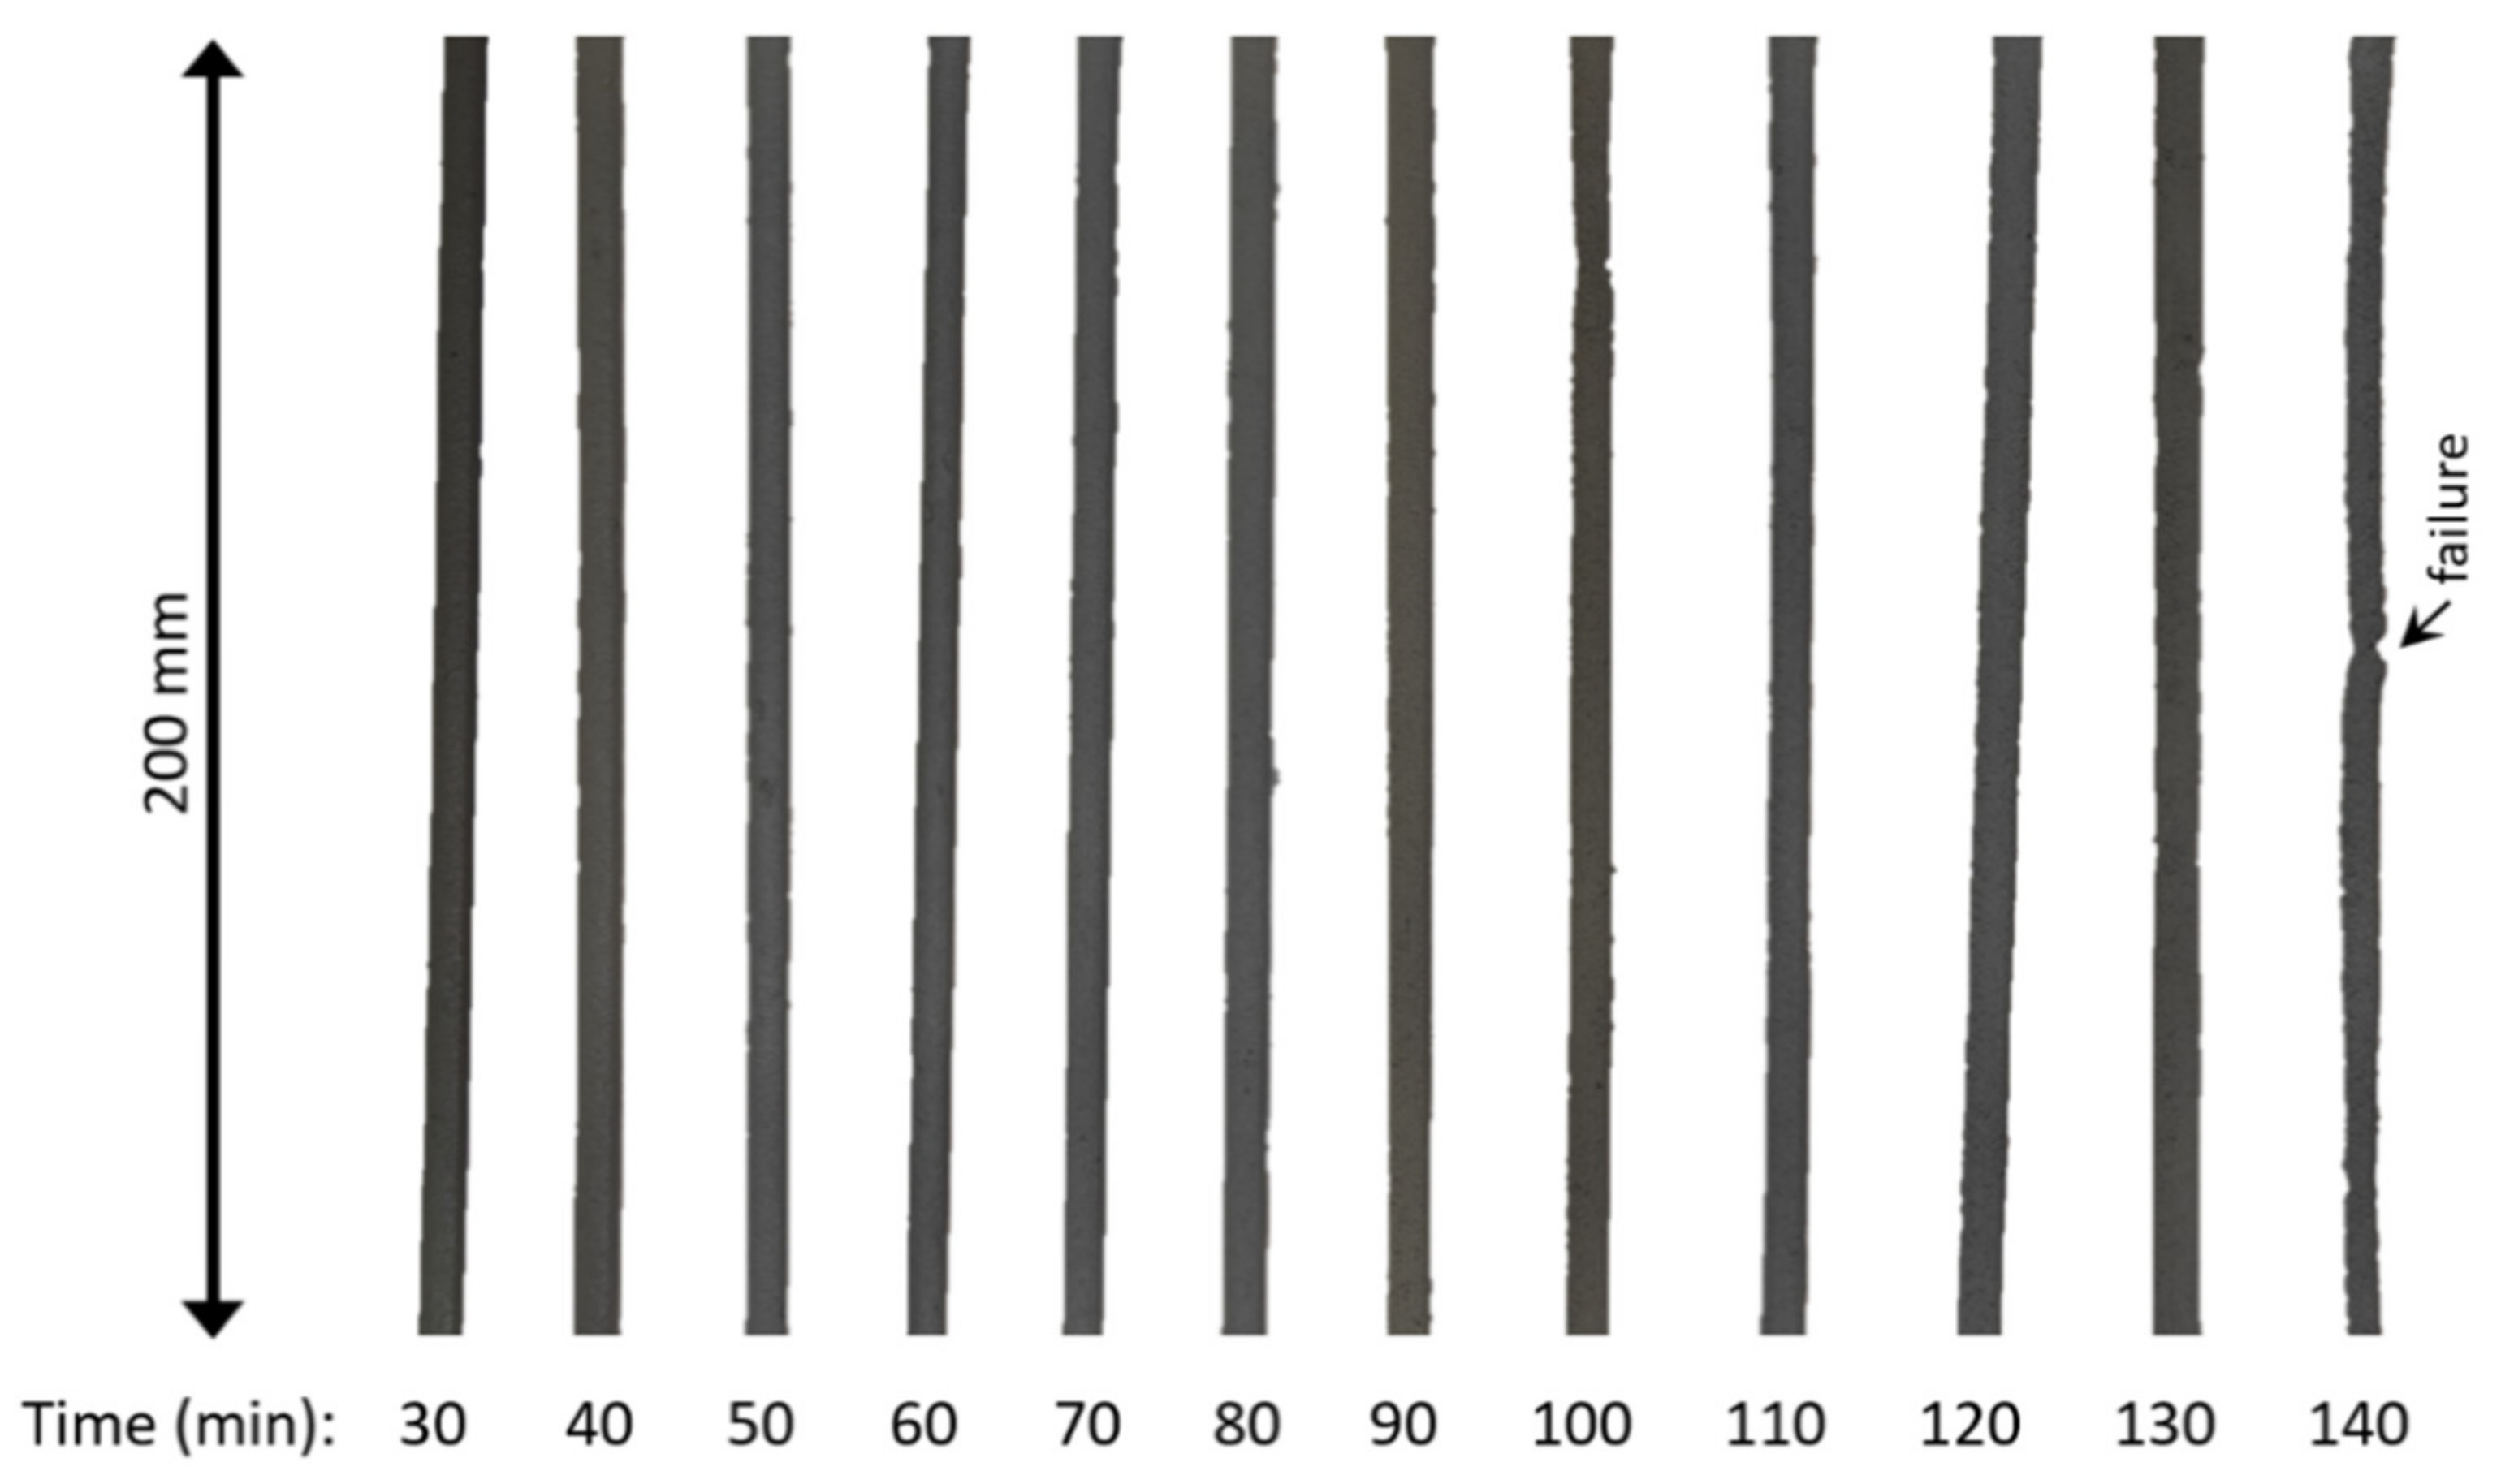
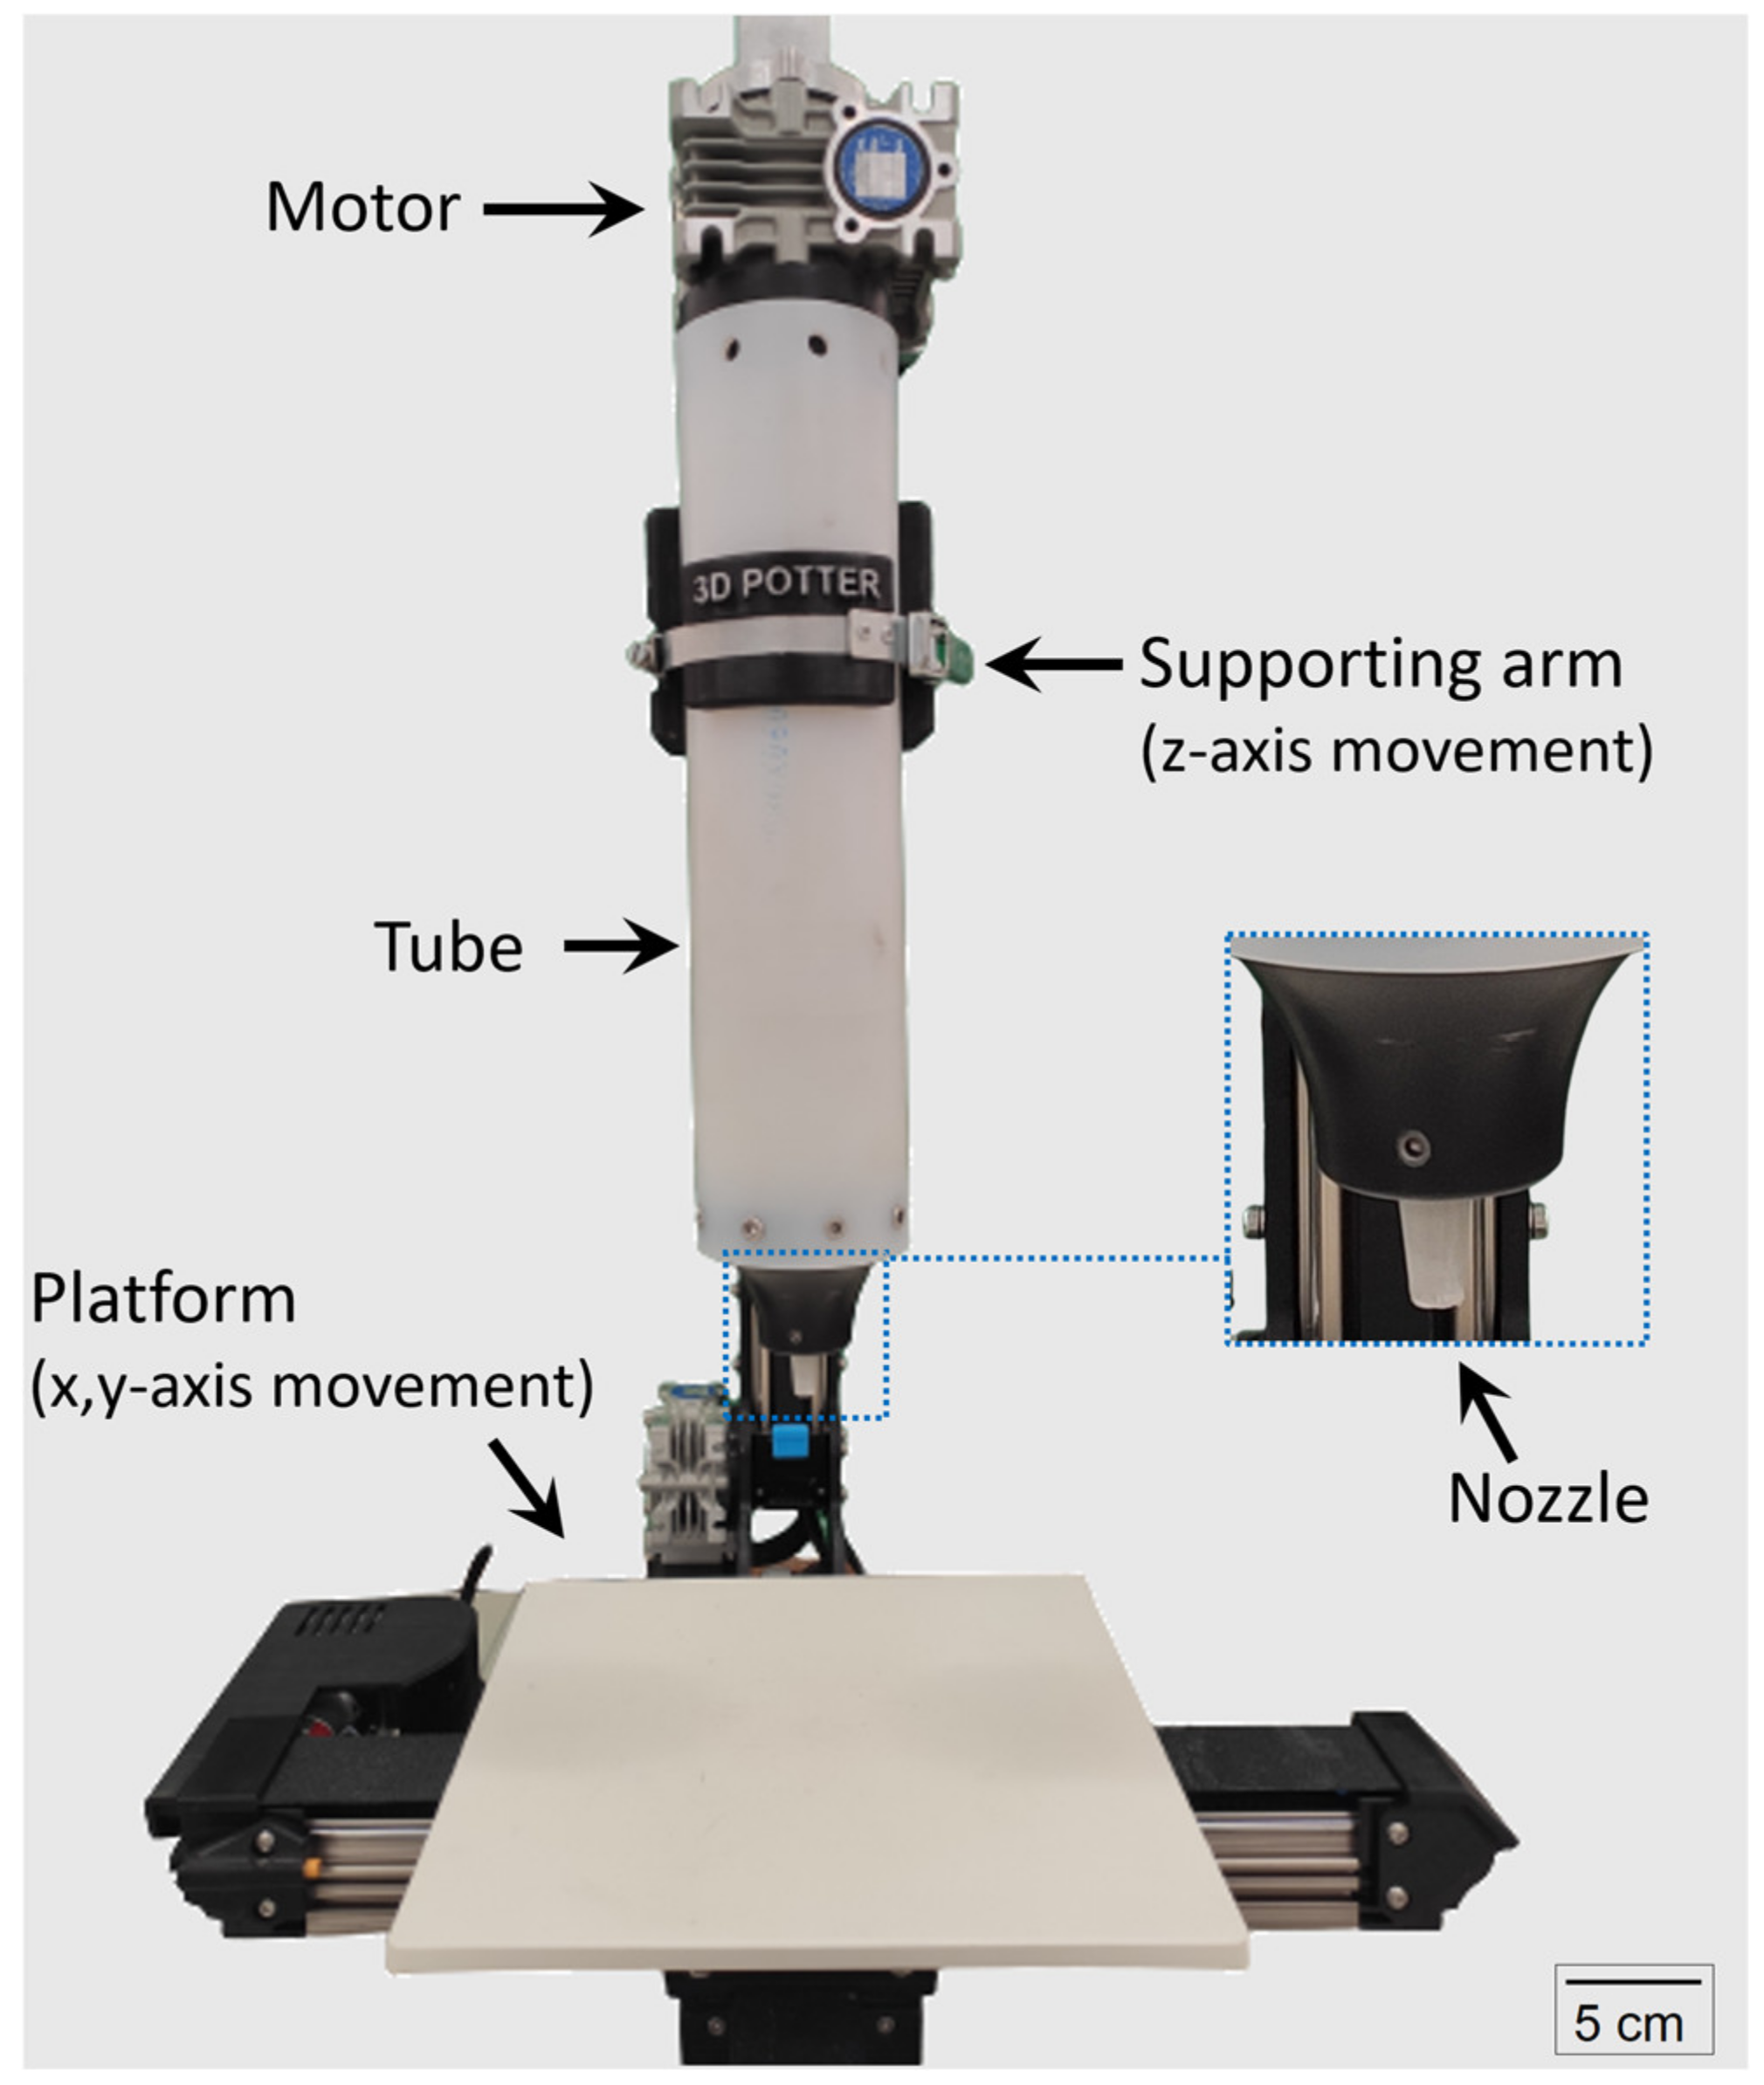
2.3.1. 3D Printing—Printability and Buildability

The samples were printed using a Potterbot Micro 10 (3D Potter, Stuart, FL, USA) illustrated in Figure 2, with a nozzle of 6.0 mm in diameter, a layer height of 3.5 mm, and a printing speed of 15 mm/s. This 3D printer is composed of a ram-type extruder where low extrusion rates can promote a slightly bleeding or segregation as a consequence of the high pressure applied [40]. However, more accurate and stiff layers can be printed with this type of extruder when compared to screw-type extruders [41]. The “printability” corresponds to the ability to produce a continuous filament without disruption, while the “buildability” corresponds to the ability to resist successive layer deposition without collapsing. The printability was assessed by printing a continuous filament of 200 mm in length, similar to that proposed by Ma et al. [30]. The buildability was assessed by determining the maximum number of layers printed prior to the overall specimen collapse or the printing of an off-axis (i.e., eccentric) layer when continuously printing a cylindrical specimen of 75 mm in diameter. It is commonly accepted that fresh 3DP elements can fail either by buckling or by the plastic collapse of material [42], leading to a general instability. However, failure can also occur on the scale of a single layer [43], and excessive deformation can cause inadequate layer deposition. This will prevent further layer deposition even though the specimen could support the weight of subsequent layers without abruptly collapsing.
The printability test was repeated every 10 min starting at 30 min of hydration, while the buildability test was performed at only at 30 min of hydration due to material volume limitation. The nozzle was sealed between each printability test to avoid water loss; about 50 mL of sample was discarded before each printing. The buildability test was recorded in video to improve the accuracy of the analysis. The 3DP tests were conducted in a room with a constant temperature of 23 °C.

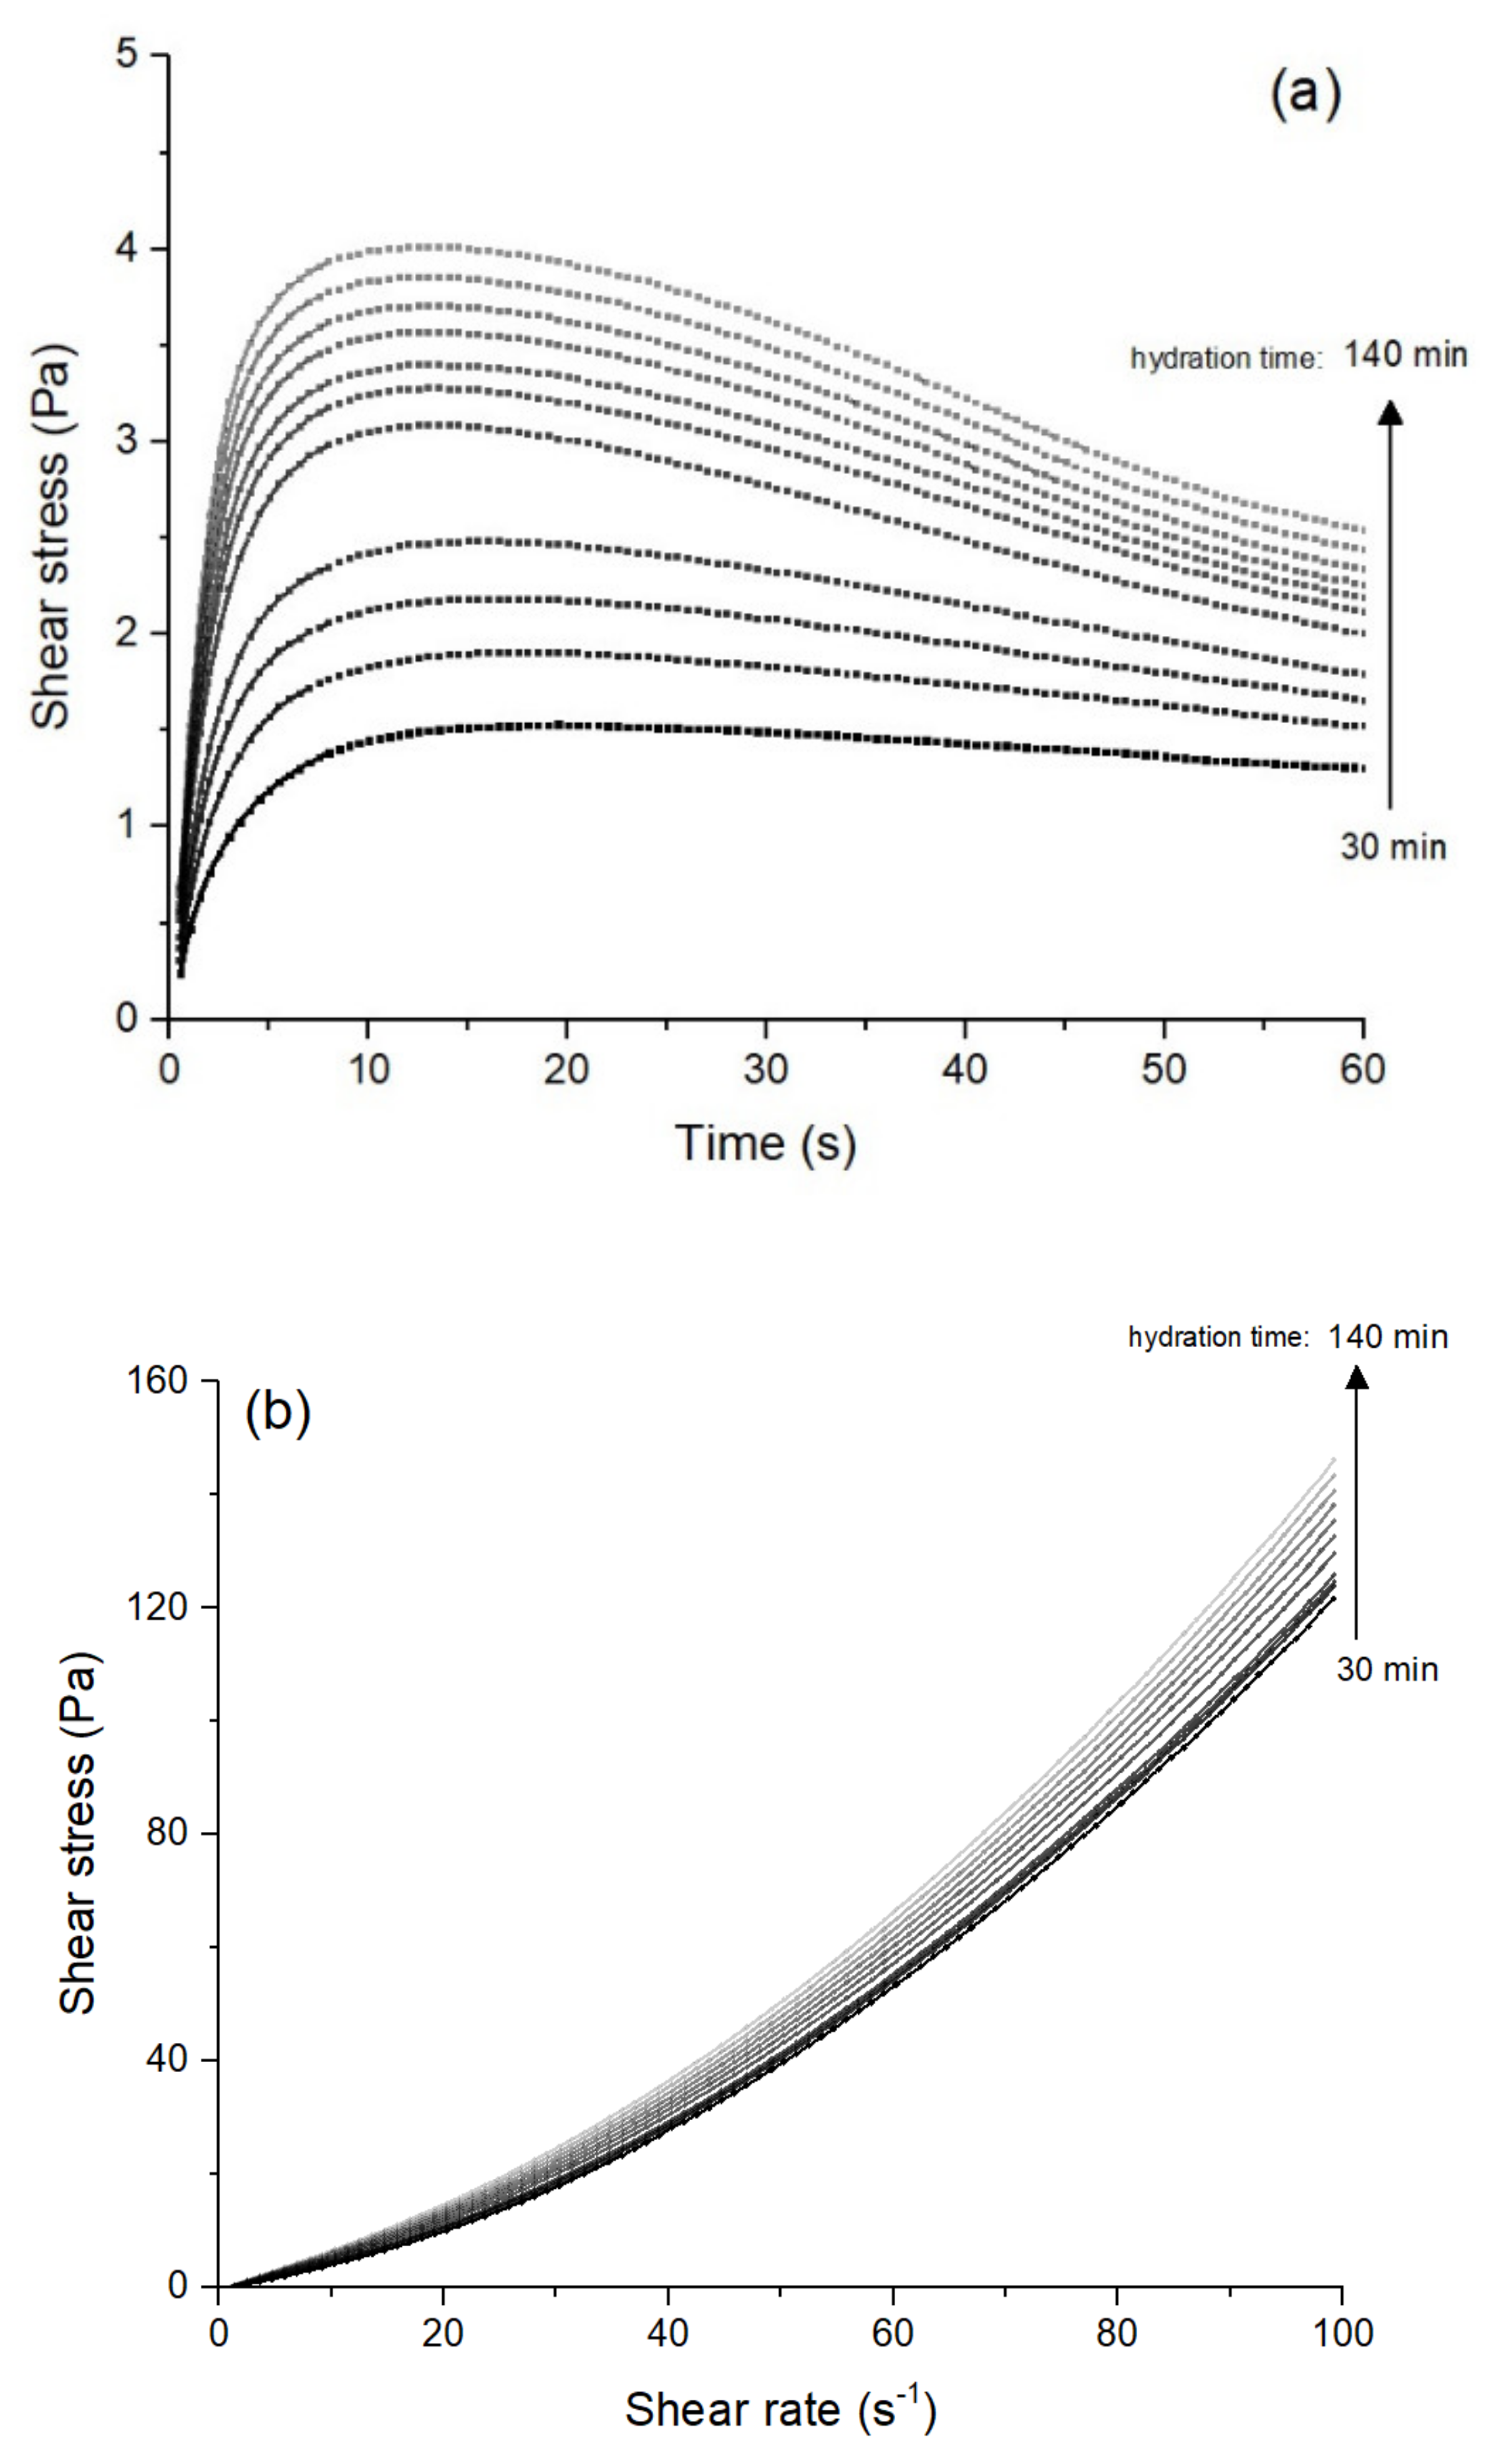
2.3.2. Fresh-State Tests

Rotational rheometry tests were conducted using a HAAKE MARS III (Thermo Scientific, Waltham, MA, USA) rheometer equipped with a four-blade vane geometry. The vane had 11.00 mm in height and 22.00 mm in diameter, and the cup had 27.20 mm in diameter. The temperature was kept at 23.0 °C using a Peltier unit. After placing the sample in the rheometer container, it was pre-sheared for 60 s at 100 s−1 to erase its shear history and rested until starting the rheological measurements.
The rheological properties were measured as follows:
(i)
a constant shear rate of 0.01 s−1 was kept for 60 s to determine the static yield stress;
(ii)
the sample was sheared for 60 s at 100 s−1;
(iii)
the shear rate was decreased from 100 to 0 s−1 during 90 s to determine the flow curve.
The static yield stress (τ0,s) was defined as the highest shear stress resisted by the material before flowing in (i), while the dynamic yield stress (τ0,d) and the equivalent plastic viscosity (µeq) were calculated through Equations (1) and (2), respectively, using the data from (iii). The measurements started 30 min after the first contact between the dry materials and water, and the steps (i)–(iii) were repeated every 10 min up to 140 min in the same sample, kept in the rheometer’s container. An isolation hood was used to prevent water evaporation [44].
τ = τ 0 , d + K . γ n
μ eq   = 3 K n + 2 . ( γ m a x ) n 1
where τ is the shear stress (Pa), γ is the shear rate (s−1), K and n, respectively, are the consistency and pseudoplastic parameters of the model, and γ max is the maximum shear rate applied.
In addition, the structuration rate over time (Athix) was evaluated using Equation (3) suggested by Roussel and Cussigh [45].
τ 0 , s t = τ 0 , s t = 0 + t . A t h i x
where τ0,s(t) is the static yield stress at a given time t (Pa), τ0,s(t=0) is the static yield stress prior to flocculation at a time = 0 (Pa), and t is the elapsed time (min).

2.3.3. Cement Hydration

In situ X-ray diffraction (XRD) was conducted using an X’Pert PRO (PANalytical, Almelo, The Netherlands) diffractometer with Bragg–Brentano geometry and an X’Celerator position-sensitive detector. The equipment operated at 45 kV and 40 mA with CuKα1,2 radiation. Scans were recorded at the 7–55° 2θ range with a step size of 0.017° 2θ and a total measurement time of 10 min per scan. The measurements started 30 min after the first contact between the dry materials and water and were conducted up to 140 min of hydration. Fresh pastes were placed in the sample holder and were covered with a Kapton foil to avoid carbonation and water evaporation.
Rietveld quantitative phase analysis (QPA) was conducted using TOPAS v5 (Bruker, Billerica, MA, USA) software and the ICSD database (structures detailed in Table A1). The absolute weight fraction of the phases was calculated using the external standard method and the G-factor approach, detailed elsewhere [46,47]. Corundum (α-Al2O3) was used as external standard also covered with the foil and measured under the same conditions as the fresh pastes. The amorphous contribution of SF was modeled following Naber et al. [48], using an hkl phase created through a Pawley fit from a pure SF sample with the tetragonal P4 space group and fixed lattice parameters a = 1.000 Å; c = 60.000 Å. The diffuse contributions of free water and the film were also modeled with hkl phases as detailed in Refs. [49,50].

3. Results and Discussion

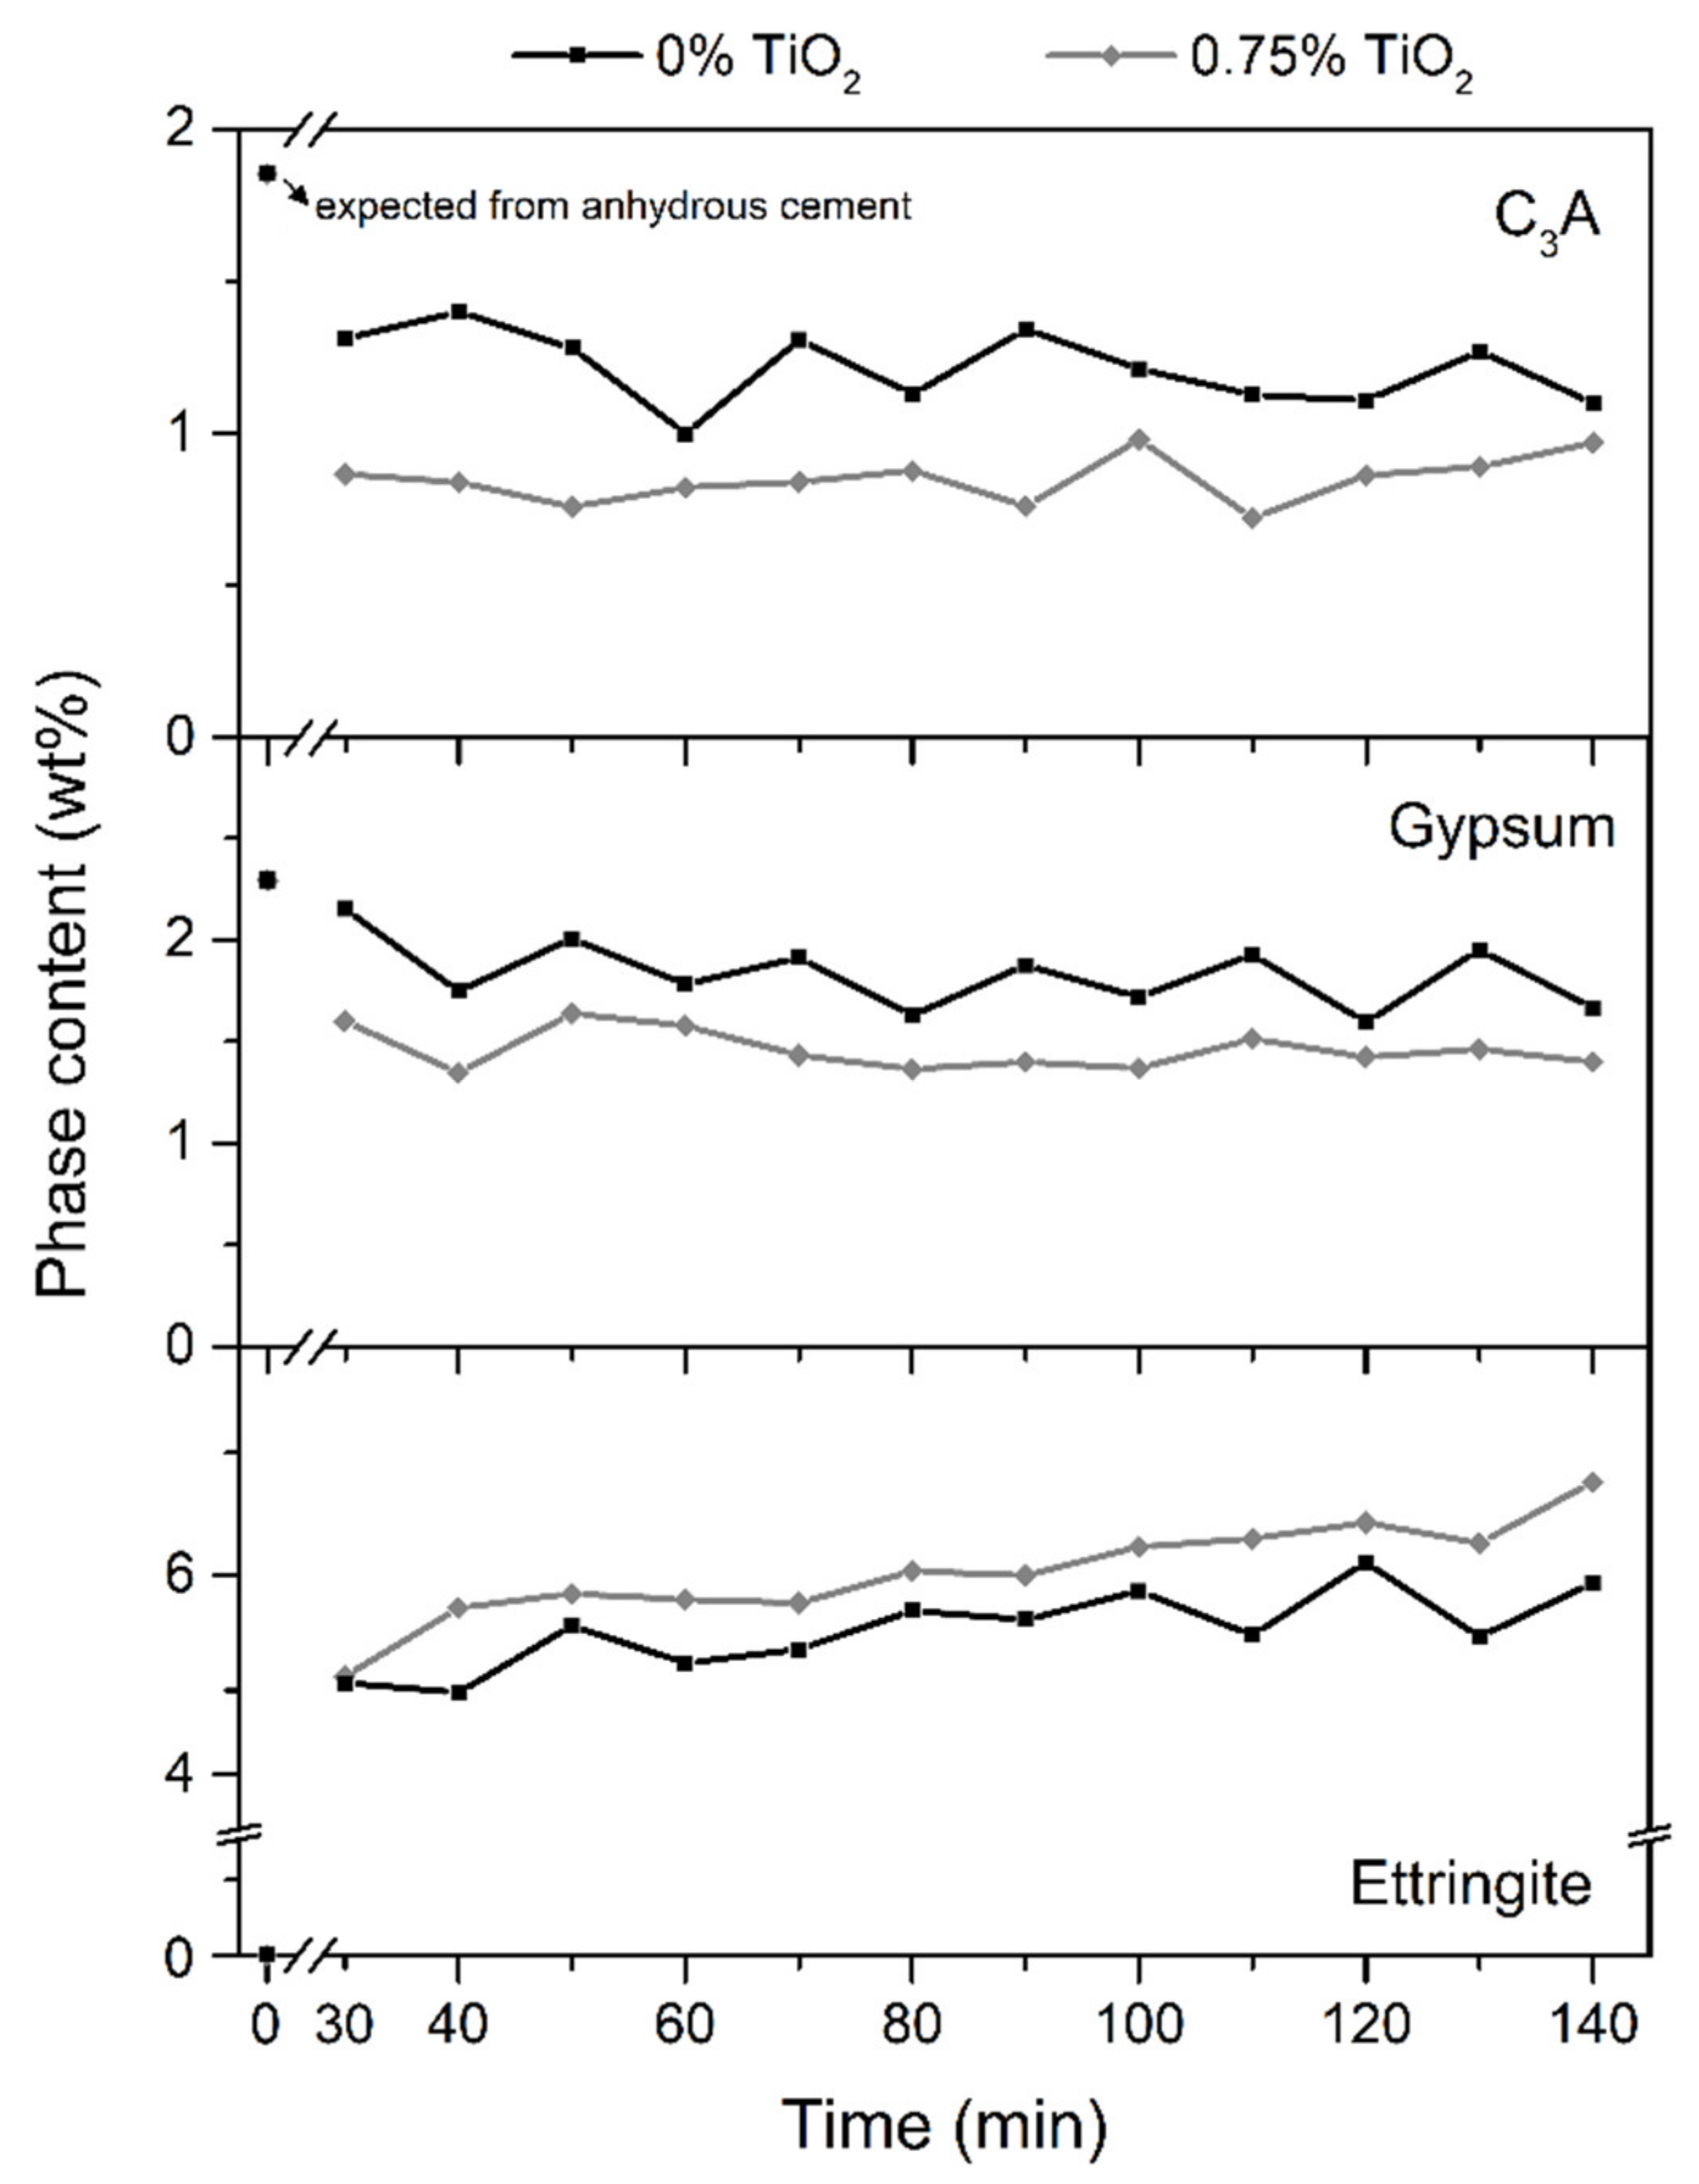
3.1. Cement Hydration

Figure 3 shows the C3A, gypsum, and ettringite contents over time obtained by in situ XRD and Rietveld QPA for the pastes without nanomaterial (0 wt.% TiO2) and with the intermediate content used in this work (0.75 wt.% TiO2). The remaining samples were not measured due to equipment access restrictions. The other major phases from the anhydrous cement (C3S, C2S, and C4AF) marginally reacted within the first 140 min of hydration in line with [46,51], so they are not shown. The incorporation of nano-TiO2 increased the C3A and gypsum consumption and the ettringite precipitation within the first 140 min of hydration. For example, the ettringite content of the 0.75% TiO2 mix was about 1 wt% higher than that of the system with 0% TiO2 at 140 min of hydration. This trend can be attributed to the very high SSA of the nanoparticles (70.2 m2/g), which provide extra surface for the nucleation and growth of hydrated products—here, more specifically ettringite [52]. Hargis et al. [53] demonstrated through in situ soft X-ray images that ettringite can also preferentially grow in nucleation sites such as those commonly observed for C-S-H [52]. Although cement was partially removed to incorporate the nano-TiO2, the removal levels were low (0.25–1.50 wt.% in general; 0.75 wt.% for in situ XRD), so factors such as the dilution effect (i.e., the higher water availability due to the increase in the effective water/cement ratio [54]) and the reduced clinker content can be neglected. In turn, it is known that the cement hydration rate is directly related to the surface area of the particles [55]. For instance, the incorporation of 0.75 wt.% nano-TiO2 increased the SSA of the binder fraction (i.e., cement + silica fume + nano-TiO2) by 12% compared to the reference mix (i.e., from 4.27 to 4.78 m2/g), explaining the further reaction degree of the mix containing the nanomaterial at the first 140 min of hydration. In line with our results, Bhojaraju et al. [56] and Wang et al. [57] also reported increased ettringite precipitation within the first hours of hydration in the presence of nanoparticles of graphene oxide and C-S-H, respectively.
Specifically regarding 3DP of Portland-based systems, the early-age hydration enhancement with nanoparticles incorporation was also previously reported. Zhang et al. [33] observed increased heat releases within the first two hours of hydration when incorporated silica fume and/or nanoclay in pastes used for 3DP application. Yang et al. [23] replaced 0–3 wt.% limestone filler with nano-CaCO3 in 3DP cement mortars, observing reductions in the induction period and increases in the cumulative heat release in calorimetry (e.g., by 14% at 24 h for 2% replacement) with the incorporation of the nanoparticles. The authors attributed this trend to the extra nucleation sites provided by the high surface area of the nanomaterial discussed above (as expected). This trend can affect the fresh properties of the mixes, as discussed next.

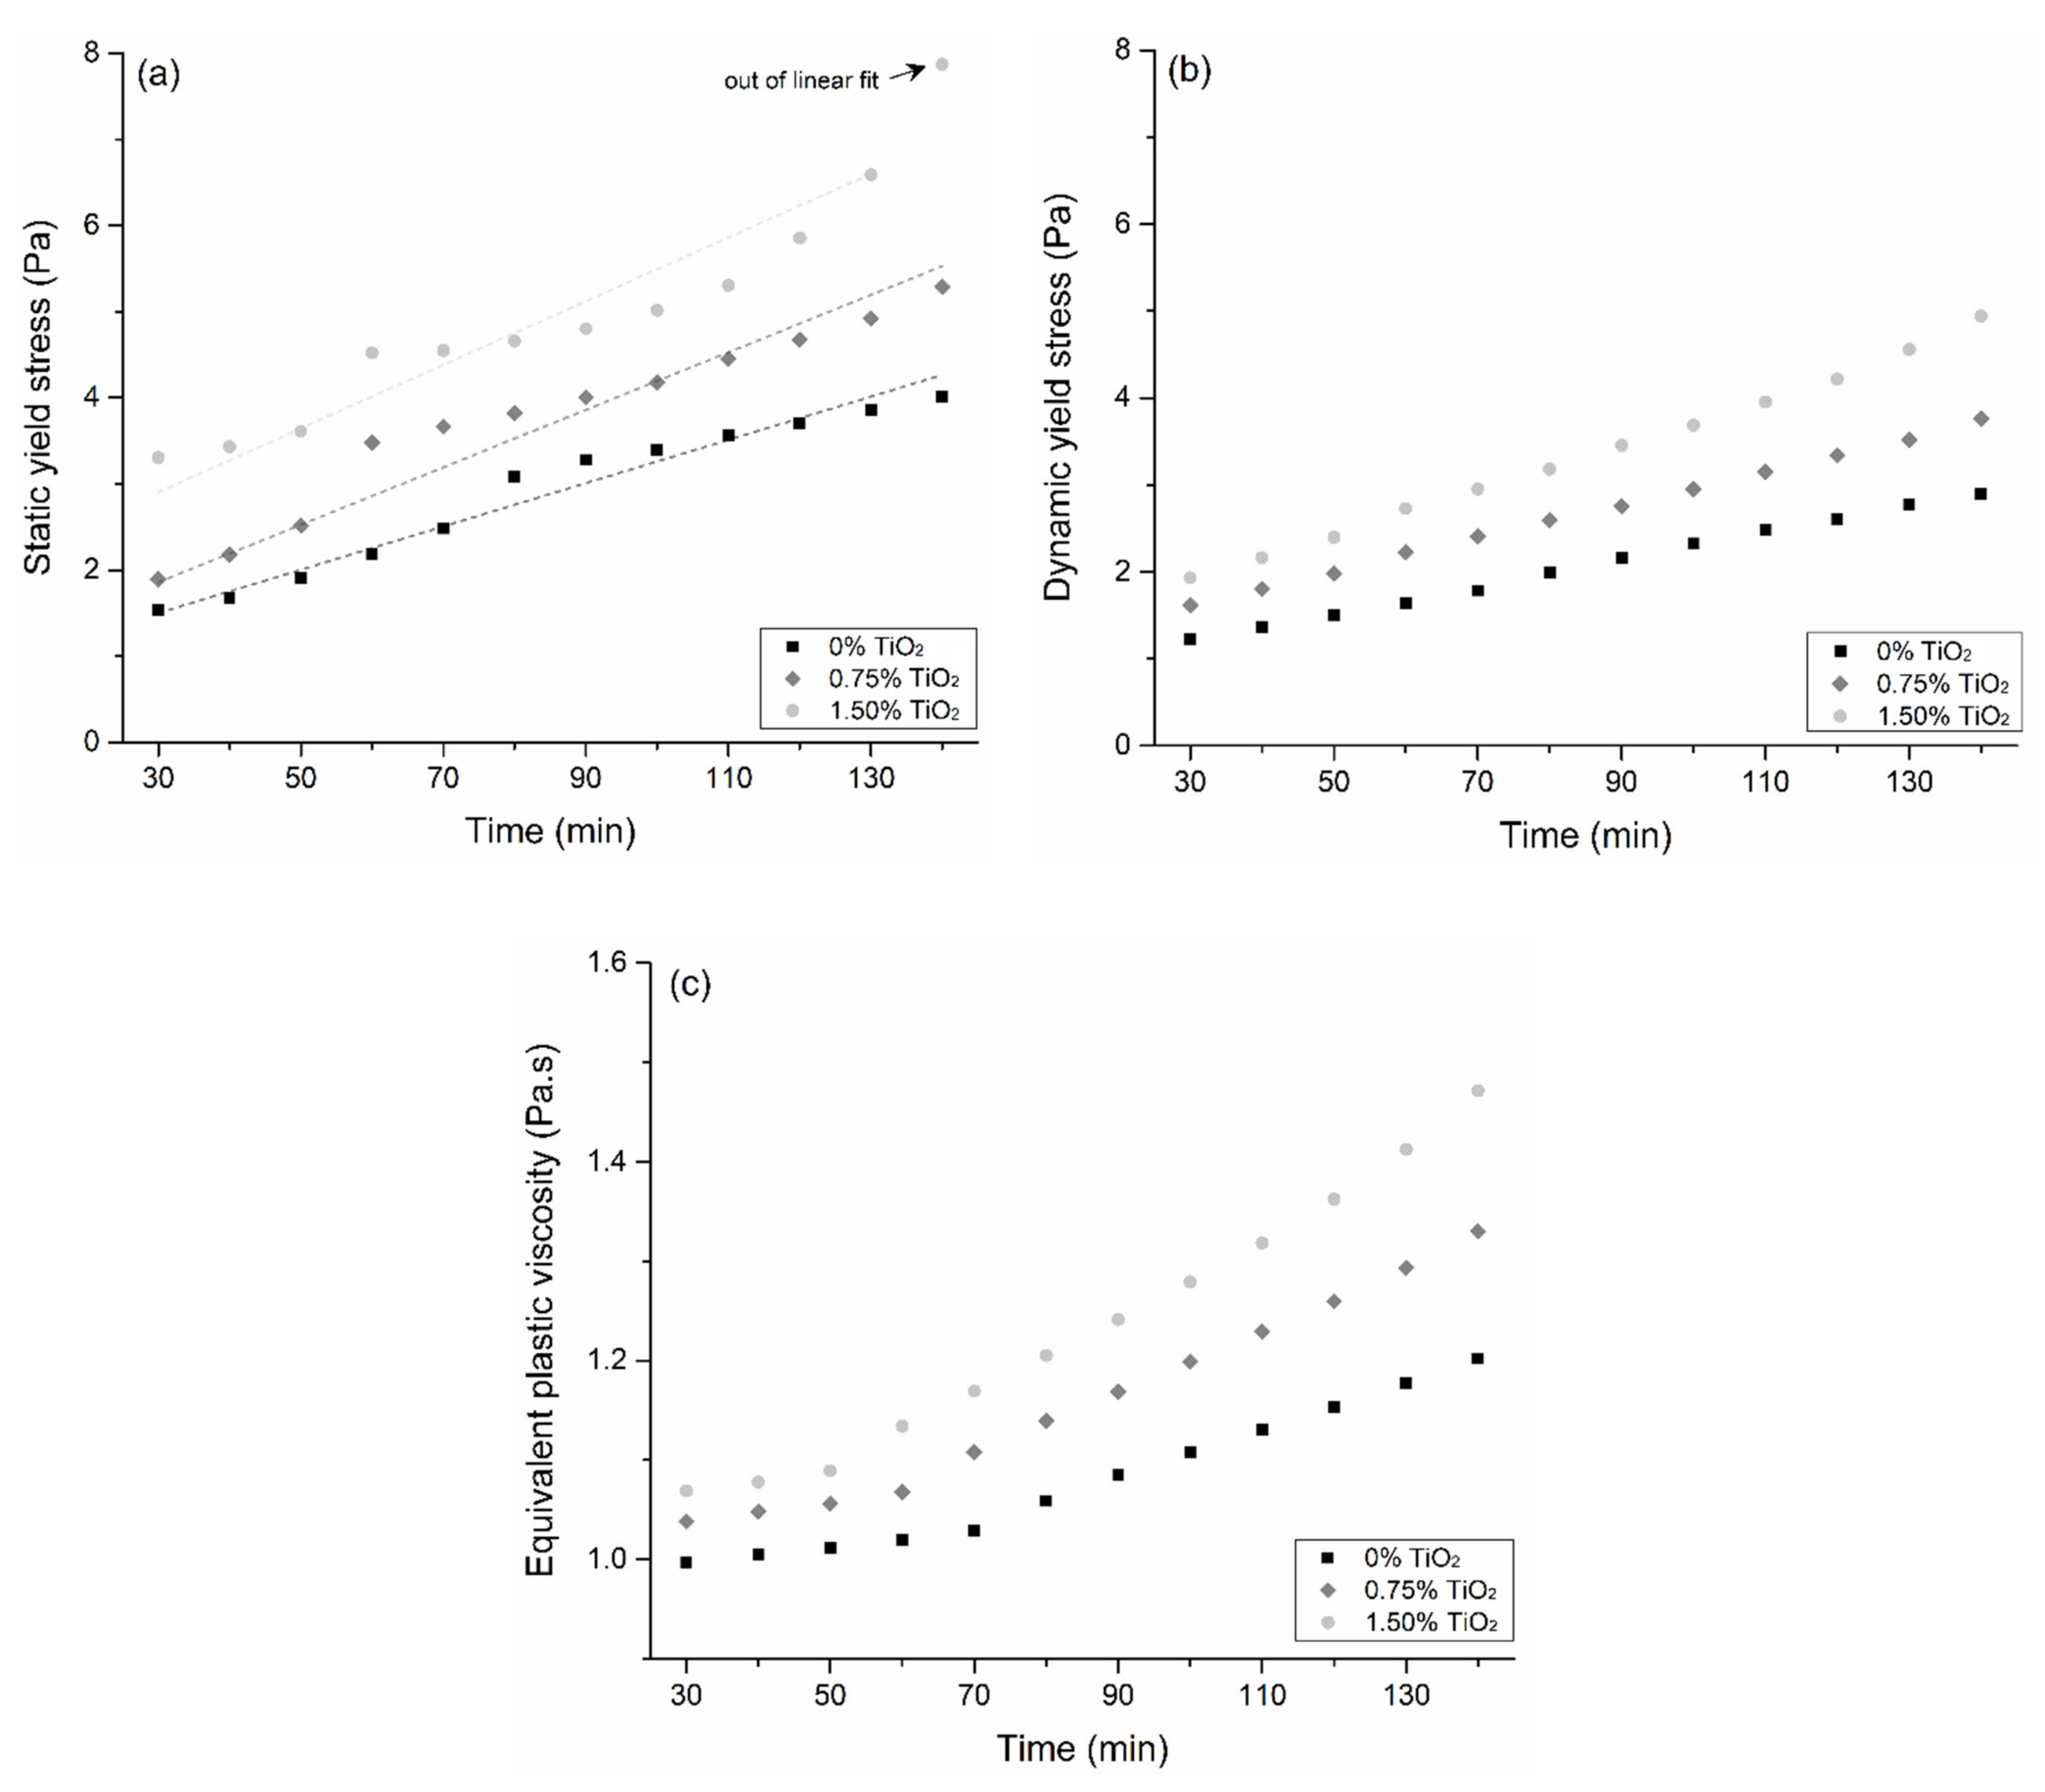
3.2. Rheological Characterization

Figure 4 exemplifies the curves obtained in the time-resolved rheological tests for the 0% TiO2 mix: the shear stress vs. time in Figure 4a and the flow curves in Figure 4b. Figure 5 shows the rheological properties of the pastes with 0, 0.75, and 1.50 wt.% TiO2 over time, and Table 3 shows their structuration rate parameters (Athix). After 130 min, the static yield stress of the 1.50% TiO2 mix grew exponentially, so it was not considered in the linear fit to determine Athix. It is worth mentioning that the shear stress values found were significantly lower than those reported for 3DP mortars [58,59] due to the absence of aggregates in the samples.
The incorporation of nano-TiO2 progressively increased the static and dynamic yield stress, and the viscosity of the pastes for a given elapsed time. For instance, at the first measurement (at 30 min), these increases were up to 116, 85, and 7%, respectively, for the static yield stress, dynamic yield stress, and equivalent plastic viscosity when comparing 1.50% TiO2 with 0% TiO2. Furthermore, the structuration rate (Athix) was higher as the nano-TiO2 content increased, from 0.025 Pa/min for 0% TiO2 to 0.037 Pa/min for 1.5% TiO2. The yield stress and viscosity increase with nano-TiO2 incorporation, both at the first measurement and over time, can be explained by (i) an increased cement hydration rate and (ii) a reduction in the PSD of the solid fraction in the nanomaterial presence, discussed next.
Regarding (i), Roussel et al. [60] demonstrated that the time-dependent rigidification of cementitious suspensions occurs due to the combination of flocculation (confirmed by Yang et al. [23]) and the progressive formation of hydration products—more specifically C-S-H, according to the authors—that form a rigid network. In addition, Qian [61] reported that the rigidification rate of a cementitious paste increases with a reduced inter-particle distance due to the higher pseudo-contact between particles and consequently higher C-S-H bridging. In this context, the very high SSA of nano-TiO2 reduced the inter-particle distance, consequently increasing the rigidification rate of the cementitious mixes. Although the nanocrystalline structure of C-S-H can be indirectly quantified through XRD (for instance, as suggested by Bergold et al. [62]), this phase is still in the form of colloidal agglomerates at the first hours of hydration [63,64], especially in the presence of SP admixtures [65]. Thus, C-S-H could not be quantified here within the first 140 min of hydration, as observed by [66,67].
Besides C-S-H, ettringite also plays an important role in the rigidification of cement paste since its precipitation consumes a great amount of water (chemical formula Ca6Al2(SO4)3(OH)12(H2O)26), and its needle-like shape can hinder the flow [68]. Furthermore, according to Huang et al. [69], the density of ettringite is 1.78 g/cm3, while the densities of gypsum and C3A are 2.33 and 3.03 g/cm3, respectively. Therefore, the increase in the solid volume due to ettringite precipitation is higher than the reduction in the solid volume due to gypsum and C3A consumption, naturally increasing the volumetric solid fraction of the system. In this regard, Jakob et al. [70] demonstrated that the ettringite content of a cement paste directly affects its yield stress and viscosity due to the increase in the volumetric solid fraction as a consequence of water consumption by ettringite formation. In agreement with that, our in situ XRD results revealed higher ettringite contents in the mix containing 0.75 wt.% nano-TiO2 compared to the reference system (see Section 3.1) during the first 140 min of hydration, which contributed to higher yield stress and viscosity values for the mixes containing the nanomaterial. On the other hand, the presence of nano-TiO2 particles can also improve the mechanical performance at early ages, as described by Chen et al. [71] and Meng et al. [38].
As for (ii), Guo et al. [72] demonstrated that the yield stress of a cementitious suspension is closely related to the PSD of its solid fraction: a reduced PSD decreases the inter-particle distance, increasing the probability of collision between particles during flow. In addition, a reduced PSD—and increased SSA—for a given particle concentration increases the amount of water adsorbed into the particles, leaving less water available to lubricate the system. This phenomenon was investigated in detail by Kwan and co-authors [73,74] in terms of water film thickness.
Similar trends of increasing the yield stress and viscosity of cement paste with other nanomaterials incorporation besides TiO2 were previously reported by the authors [75,76] and by other research groups [77,78,79]. Specifically for 3DP mixes, Sikora et al. [24] observed that 2% nano-SiO2 incorporation was enough to increase the yield stress of 3DP mortars by 4.2 times (from 46 to 239 Pa). Kruger et al. [18] observed progressive increases (up to 76%) in the yield stress of 3DP mortar with 0–3% nano-SiO2 incorporation. Yang et al. [23] also reported higher yield stress increases over time for nanoparticle-containing 3DP mixes: the yield stress increased from 30 to 110 min by 39, 322, and 751%, respectively, for 0, 1, and 2% replacement of limestone with nano-CaCO3. In turn, specifically regarding nano-TiO2 incorporation in cementitious systems, the direct comparison of our results is difficult since most of the existing works only evaluated empirical properties such as slump flow, V-funnel time, and superplasticizer demand [27,28]. Nonetheless, to the best of our knowledge, the only reports that actually measured the rheological properties of the systems are those from Senff et al. [25,26], which also reported increases in the yield stress, viscosity, and thixotropy with nano-TiO2 incorporation.

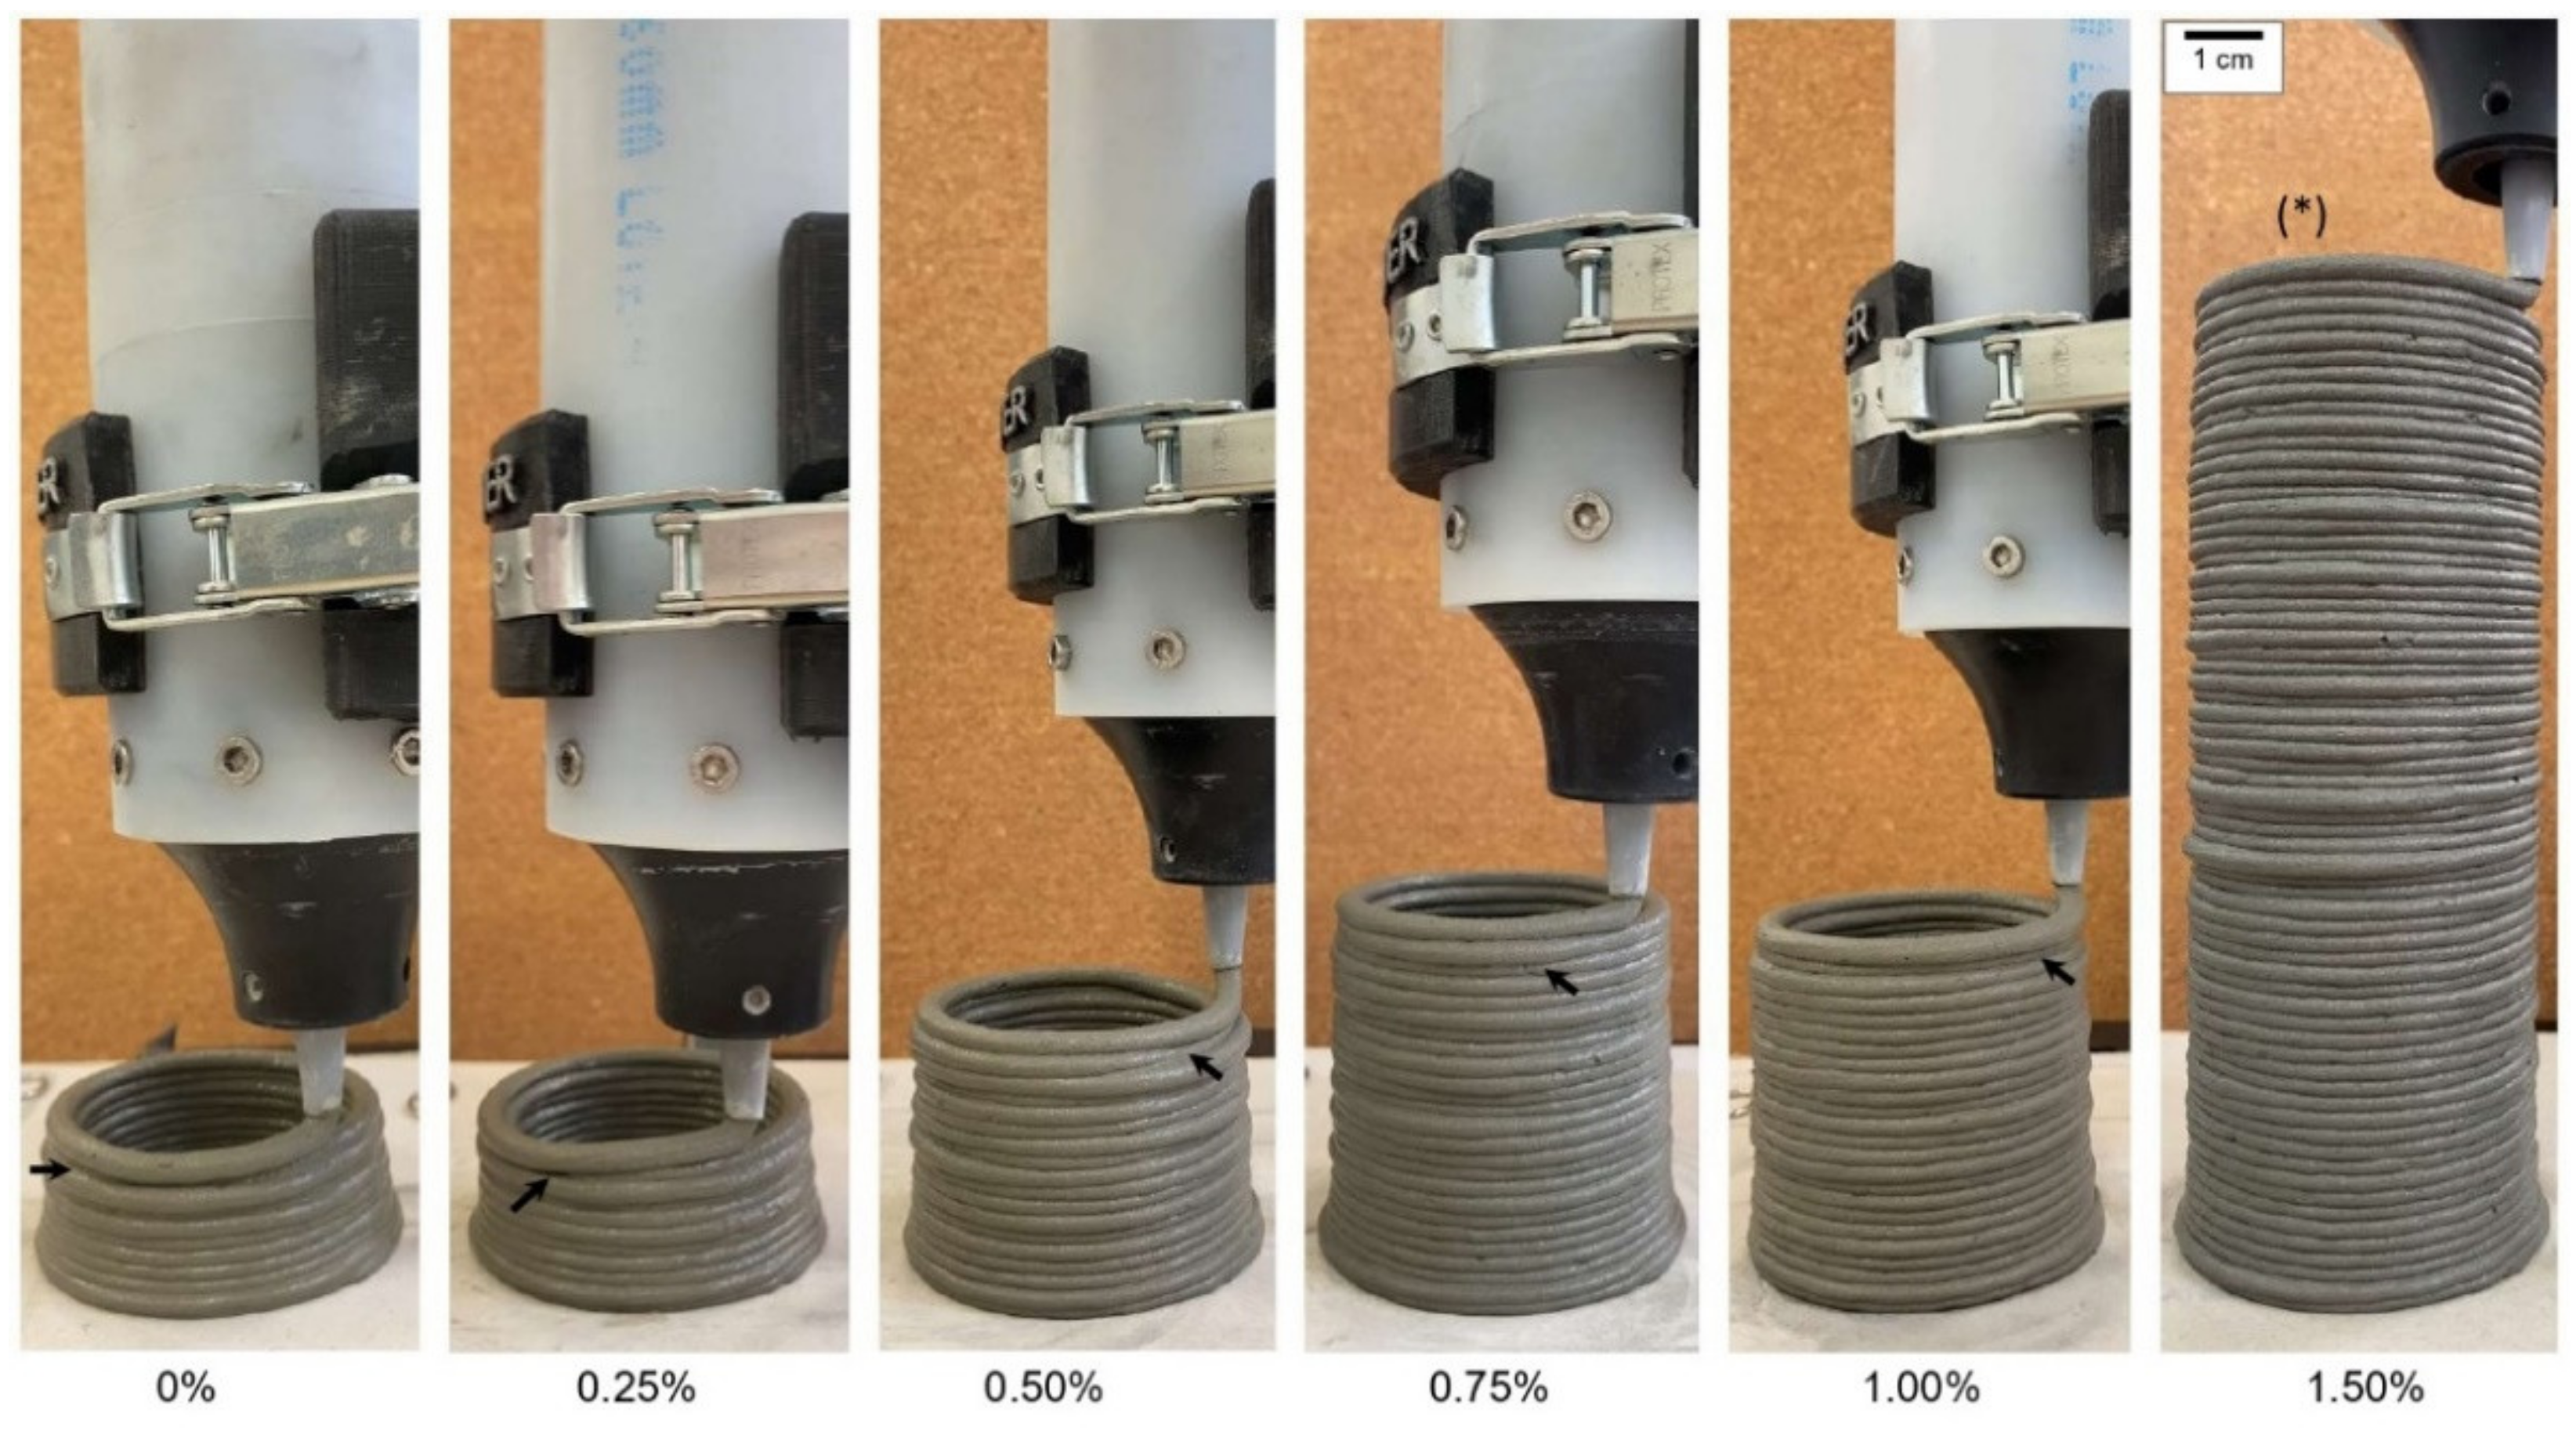
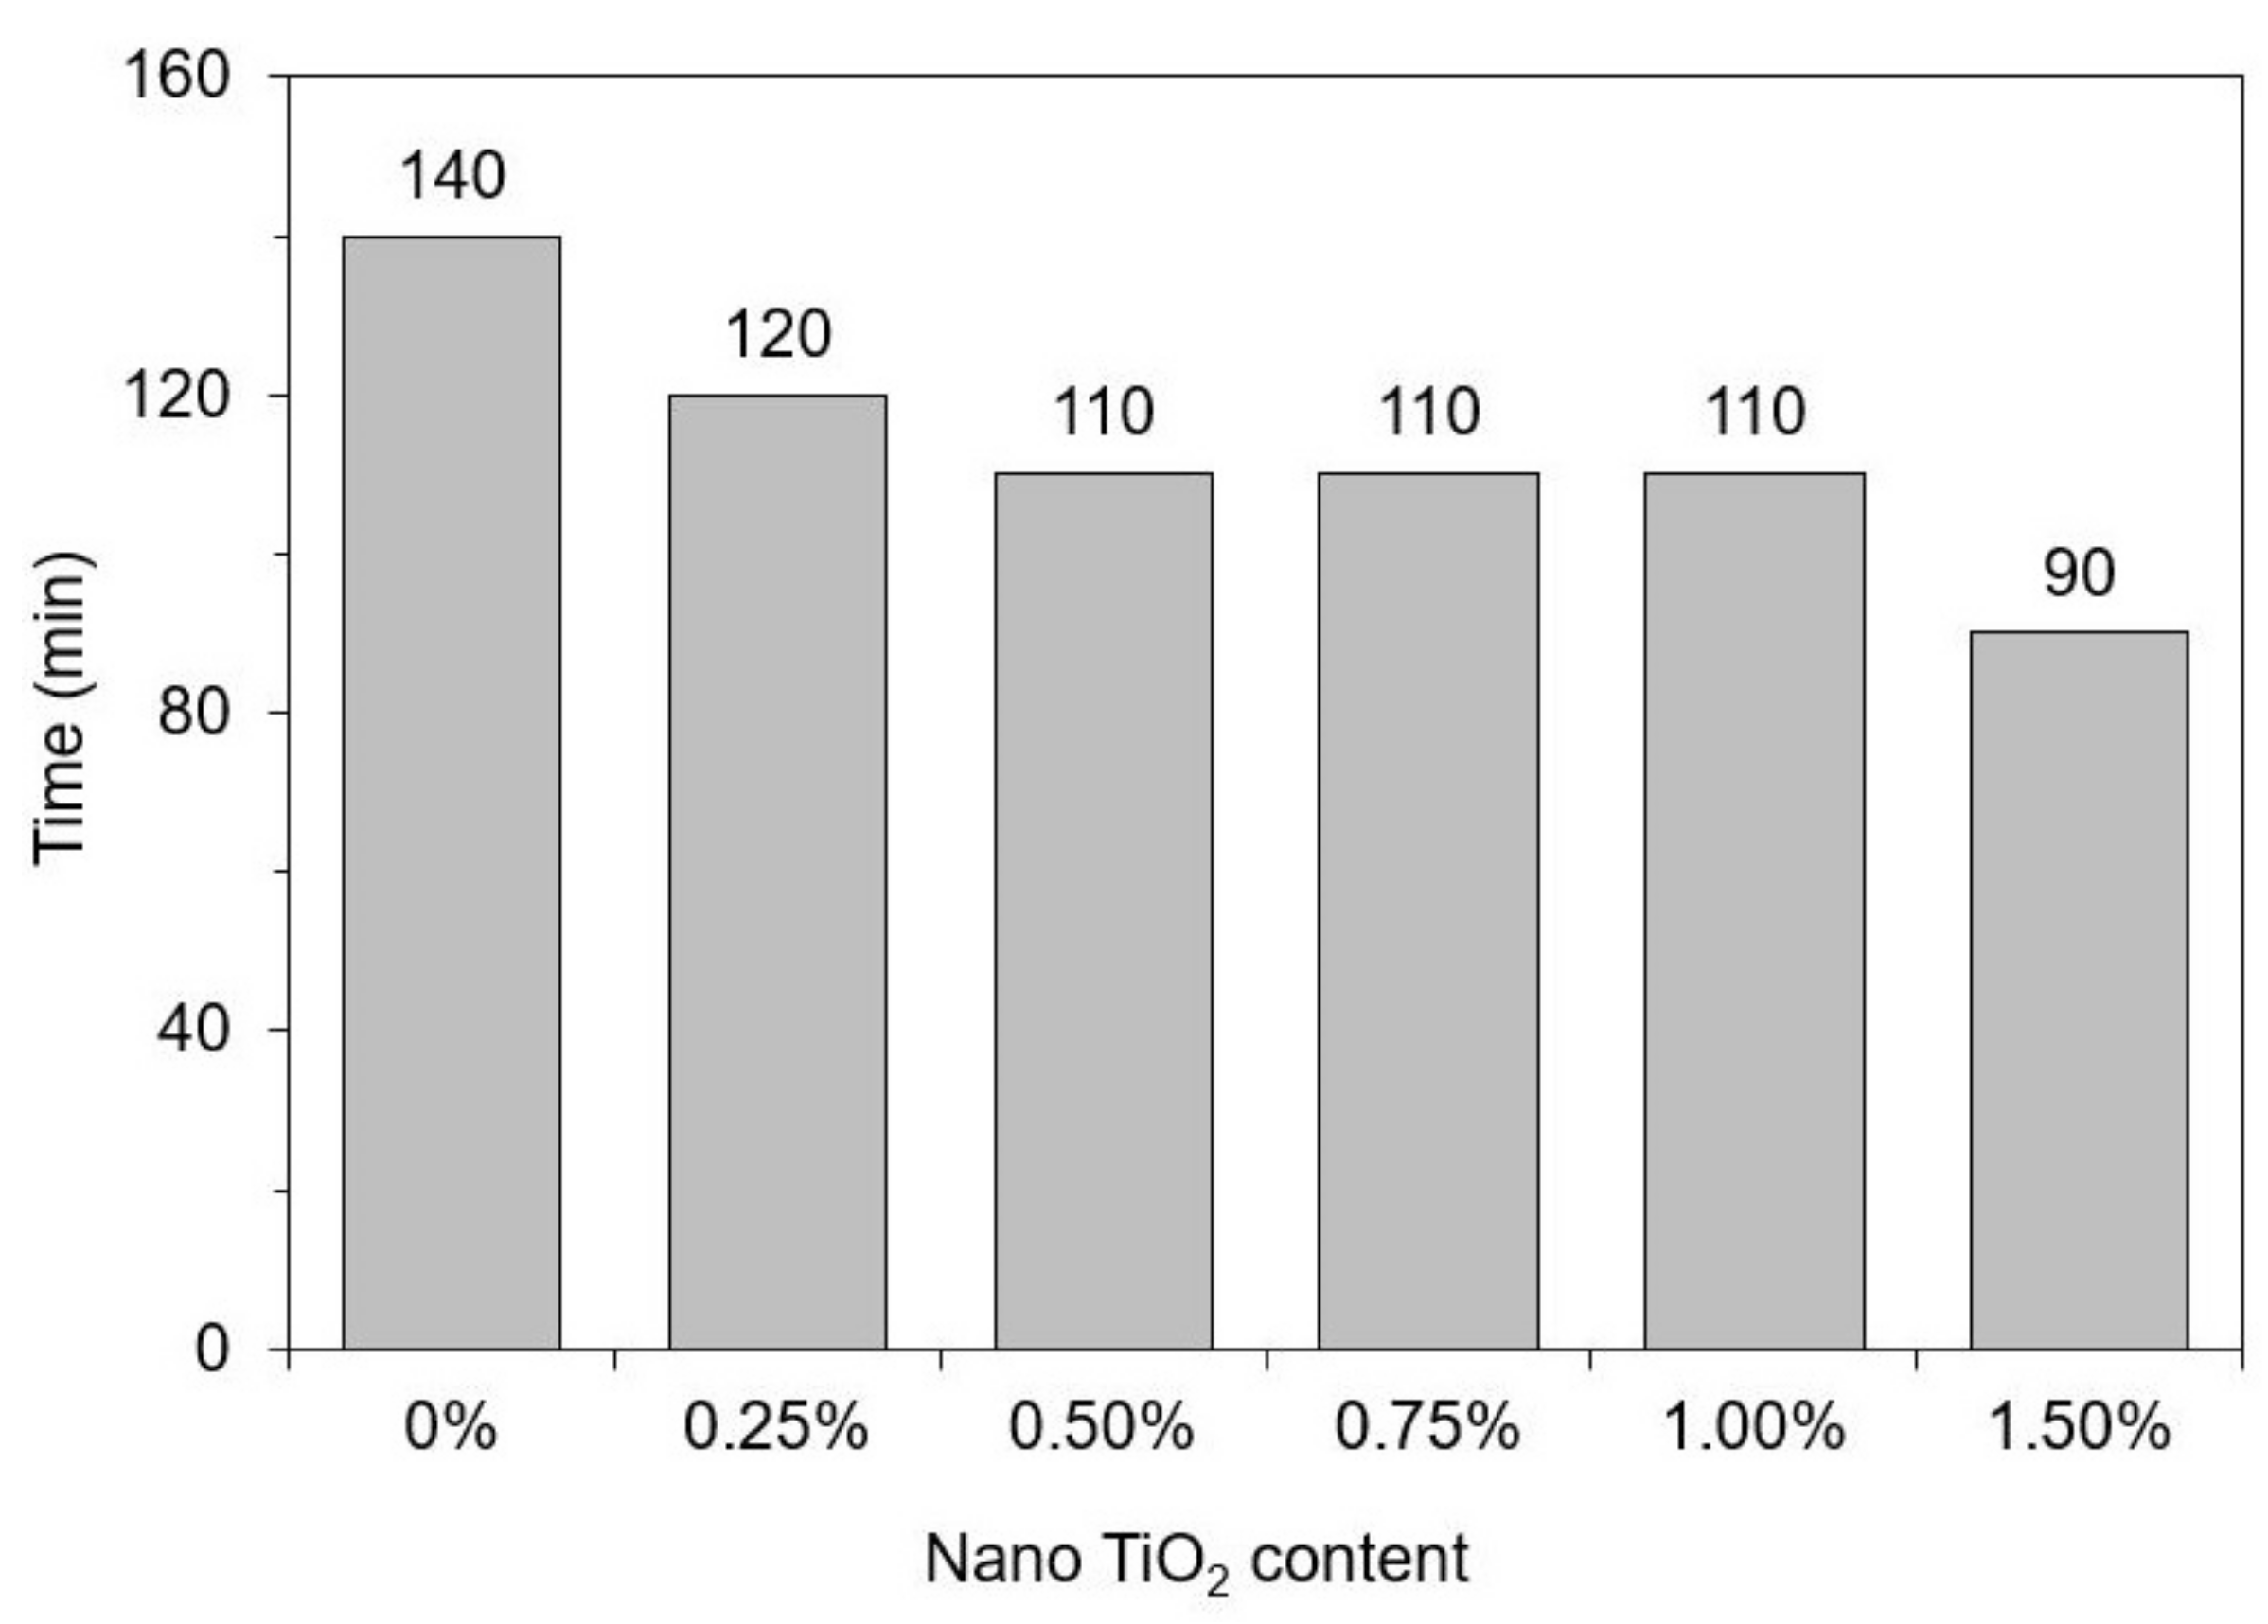
3.3. 3D Printing Tests

Figure 6 shows the samples during the buildability tests, and Figure 7 shows the buildability results in terms of the maximum number of printed layers before failure. The failure criterion is explained in Section 2.3.1. The incorporation of nano-TiO2 progressively improved the buildability of the mixes, increasing the maximum number of printed layers from 11 (0% TiO2) to 64 (1.50% TiO2). This can be explained by the increase in the yield stress at the first measurement (30 min) promoted by nano-TiO2 incorporation, identified by the rheological test results (see Section 3.2). It is well known that freshly printed material must have yield stress that resists the gravity-induced stress from the above layers [41]. By increasing the yield stress of the mixes through nano-TiO2 incorporation, the number of printable layers also increased. This relation was confirmed by Yang et al. [23], which simultaneously observed increases in the yield stress and reductions in the vertical displacement of freshly printed mortars (also at 30 min) with nano-CaCO3 incorporation, improving their resistance against collapse. For instance, 1% and 2% nano-CaCO3 incorporation in limestone replacement reduced the vertical displacement of printed elements by 11.1% and 44.4%, respectively, compared with that containing only limestone. Finally, the yield stress of pastes at 30 min increased by up to 116% with the nano-TiO2 incorporation, while the buildability of mortars increased by 4.8 times. Although these two properties are related, the rheological tests were conducted in paste samples, while the 3DP tests were conducted in mortar samples. Therefore, we could not establish a direct correlation between these two parameters.
Figure 8 shows the printability test results in terms of “open time”, defined as the period during which the sample was printable, i.e., it was possible to print a continuous filament with 200 mm in length without any failure, defect, or disruption. Figure 9 exemplifies the filaments obtained in the printability test for the reference mix; all the filaments are shown in Supplementary Materials Figure S1. The incorporation of nano-TiO2 progressively reduced the open time of the cementitious composites from 140 min (0% TiO2) to 90 min (1.50% TiO2). This can be attributed to the higher flocculation and hydration rate in the presence of nano-TiO2 (discussed in Section 3.1 and Section 3.2), which increases the rigidification rate of the material and reduces the period that it is “castable” (in this case, printable). Unfortunately, since we could not conduct the rheological test in mortar samples, we were not able to define yield stress and viscosity values that allow suitable 3DP.
One can note that the incorporation of nano-TiO2 progressively improved the buildability of the composites (Figure 8) but harmed their printability (Figure 9). This is explained by Souza et al. [2]: on the one hand, the time-dependent stiffening of the material (demonstrated by our rheological test results) makes it harder to print over time; on the other hand, the same phenomenon can improve the mechanical strength of the first layers to support the deposition of the subsequent ones. In this sense, it would be derisible to define a nano-TiO2 content that reaches optimum buildability and printability requirements simultaneously. However, this not only depends on the material’s properties but also on the 3DP process (e.g., total printing time, printing speed, size of the printed element, etc.). Nonetheless, as general considerations, we can infer that using “low” nano-TiO2 contents (around 0.25%) was not advantageous since it reduced the open time by 20 min without contributing to buildability. Using contents around 0.75–1.00% led to comparable impacts on printability than 0.25% did (with a 10 min difference) but significantly improved the buildability of the mixes, increasing the maximum number of layers by 118%. Finally, the highest nano-TiO2 content led to far better buildability, but it would require a quick printing process since it reduced the open time by 50 min compared to the control mix.

4. Conclusions

This work investigated the effect of the incorporation of nano-TiO2 particles on the fresh-state performance of cementitious composites destinated for 3DP applications. In situ XRD showed that the incorporation of nano-TiO2 increased the C3A and gypsum consumption and the ettringite precipitation during the first 140 min of hydration. Time-resolved rheological tests showed that the yield stress (both static and dynamic), viscosity, and structuration rate (Athix) of the pastes increased as the content of nanomaterial increased. This was associated with the reduction in the inter-particle distance due to the very high SSA of nano-TiO2 and the increased formation of ettringite (revealed by XRD). As for the printing-related properties, nano-TiO2 incorporation improved the buildability of the composites, increasing the number of printed layers before failure from 11 successive layers (0% TiO2) to 64 layers (1.5% TiO2) at 30 min of hydration. In this sense, nano-TiO2 is an effective “thickener” material for the production of cementitious composites destinated to 3D printing applications. In turn, the nanomaterial incorporation progressively reduced the open time (i.e., the period during which it was possible to print a continuous filament of 200 mm in length) from 140 min (0% TiO2) to 90 min (1.5% TiO2). Thus, incorporating “high” nano-TiO2 contents (e.g., >1 wt.%) was beneficial for the buildability of the 3DP composites but would require a quicker printing process. The adoption of “intermediate” nano-TiO2 contents (around 0.75–1.00%) may be an interesting choice since it reduced the printability of the composites by 30 min but increased their maximum printable layers by 13 (118%) compared with the control mix.

Supplementary Materials

The following supporting information can be downloaded at: https://www.mdpi.com/article/10.3390/ma15113896/s1, Figure S1: Filaments obtained in the printability test. (a) 0% TiO2; (b) 0.25% TiO2; (c) 0.50% TiO2; (d) 0.75% TiO2; (e) 1.00% TiO2; (f) 1.50% TiO2.

Author Contributions

Conceptualization, P.d.M. and E.R.; methodology, T.Z., K.C., E.F. and R.S.; formal analysis, P.d.M., T.Z., K.C., E.F. and E.R.; investigation, T.Z., K.C., E.F. and R.S.; resources, P.d.M. and E.R.; data curation, T.Z. and R.S.; writing—original draft preparation, P.d.M. and E.F.; writing—review and editing, T.Z., K.C., G.M. and E.R.; visualization, P.d.M. and T.Z.; supervision, P.d.M. and E.R.; project administration, P.d.M. and E.R.; funding acquisition, P.d.M., G.M. and E.R. All authors have read and agreed to the published version of the manuscript.

Funding

This research was funded by the following Brazilian governmental agencies: National Council for Scientific and Technological Development (CNPq), grant number 403563/2021-6 under the project CNPq/MCTI/FNDCT Nº 18/2021—UNIVERSAL; Research Support Foundation of the State of Rio Grande do Sul (FAPERGS), grant number 21/2551-0000723-0. This research also received the financial support from the project with ALOCER and São Gabriel Saneamento S.A.

Institutional Review Board Statement

Not applicable.

Informed Consent Statement

Not applicable.

Data Availability Statement

Not applicable.

Acknowledgments

Cézar A. Casagrande (UTFPR, Brazil) is acknowledged for supplying the TiO2 nanopowder and its characterization. Philippe J.P. Gleize from LabNANOTEC (UFSC, Brazil) is acknowledged for the infrastructure for the rheological tests. Carlos E.M. Campos and the staff from LDRX-UFSC are acknowledged for the XRD data collection. Eduarda Melchiors and the staff of GEMASC-UFSM are acknowledged for the assistance in the 3DP tests.

Conflicts of Interest

The authors declare that they have no known competing financial interests or personal relationships that have influenced the work reported in this paper.

Appendix A

Table A1. Mineralogical composition of the cement used, obtained by XRD-Rietveld QPA.
PhaseICSD CodeContent (wt.%)
C3S-M39474233.62
C3S-M1*13.13
C2S-α’H810970.22
β-C2S810968.34
C3A-cubic18412.50
C3A-orthorhombic18800.34
C4AF91976.45
Aphthitalite260140.45
Langbeinite409890.31
Syngenite1570721.79
Periclase98630.84
Portlandite154711.46
Lime757860.77
Gypsum1516923.09
Bassanite690600.33
Calcite734464.93
Dolomite104040.56
Quartz1740.28
Ettringite155395-
ACn **-20.60
Rwp (%)-5.14
* Not in ICSD; structure from [80]. ** ACn: amorphous and crystalline non-quantified, determined by the external standard method.

References

  1. Chen, Z.; Li, Z.; Li, J.; Liu, C.; Lao, C.; Fu, Y.; Liu, C.; Li, Y.; Wang, P.; He, Y. 3D printing of ceramics: A review. J. Eur. Ceram. Soc. 2019, 39, 661–687. [Google Scholar] [CrossRef]
  2. Souza, M.T.; Ferreira, I.M.; Guzi de Moraes, E.; Senff, L.; Novaes de Oliveira, A.P. 3D printed concrete for large-scale buildings: An overview of rheology, printing parameters, chemical admixtures, reinforcements, and economic and environmental prospects. J. Build. Eng. 2020, 32, 101833. [Google Scholar] [CrossRef]
  3. De Schutter, G.; Lesage, K.; Mechtcherine, V.; Nerella, V.N.; Habert, G.; Agusti-Juan, I. Vision of 3D printing with concrete—Technical, economic and environmental potentials. Cem. Concr. Res. 2018, 112, 25–36. [Google Scholar] [CrossRef]
  4. Souza, M.T.; Simão, L.; Guzi de Moraes, E.; Senff, L.; de Castro Pessôa, J.R.; Ribeiro, M.J.; Novaes de Oliveira, A.P. Role of temperature in 3D printed geopolymers: Evaluating rheology and buildability. Mater. Lett. 2021, 293, 129680. [Google Scholar] [CrossRef]
  5. Weng, Y.; Ruan, S.; Li, M.; Mo, L.; Unluer, C.; Tan, M.J.; Qian, S. Feasibility study on sustainable magnesium potassium phosphate cement paste for 3D printing. Constr. Build. Mater. 2019, 221, 595–603. [Google Scholar] [CrossRef]
  6. Volpe, S.; Petrella, A.; Sangiorgio, V.; Notarnicola, M.; Fiorito, F. Preparation and characterization of novel environmentally sustainable mortars based on magnesium potassium phosphate cement for additive manufacturing. AIMS Mater. Sci. 2021, 8, 640–658. [Google Scholar] [CrossRef]
  7. Jiao, D.; Shi, C.; Yuan, Q.; An, X.; Liu, Y.; Li, H. Effect of constituents on rheological properties of fresh concrete-A review. Cem. Concr. Compos. 2017, 83, 146–159. [Google Scholar] [CrossRef]
  8. Zhang, C.; Nerella, V.N.; Krishna, A.; Wang, S.; Zhang, Y.; Mechtcherine, V.; Banthia, N. Mix design concepts for 3D printable concrete: A review. Cem. Concr. Compos. 2021, 122, 104155. [Google Scholar] [CrossRef]
  9. Wangler, T.; Flatt, R.J.; Roussel, N.; Perrot, A.; Sonebi, M.; Wolfs, R.; Bos, F.; Lowke, D.; Freund, N.; Stephan, D.; et al. Digital Fabrication with Cement-Based Materials; Roussel, N., Lowke, D., Eds.; Springer International Publishing: Cham, Switzerland, 2022. [Google Scholar]
  10. Bica, B.O.; de Melo, J.V.S. Concrete blocks nano-modified with zinc oxide (ZnO) for photocatalytic paving: Performance comparison with titanium dioxide (TiO2). Constr. Build. Mater. 2020, 252, 119120. [Google Scholar] [CrossRef]
  11. Staub de Melo, J.V.; Trichês, G. Study of the influence of nano-TiO2 on the properties of Portland cement concrete for application on road surfaces. Road Mater. Pavement Des. 2018, 19, 1011–1026. [Google Scholar] [CrossRef]
  12. Casagrande, C.A.; Repette, W.L.; Hotza, D. Effect of environmental conditions on degradation of NOx gases by photocatalytic nanotitania-based cement mortars after long-term hydration. J. Clean. Prod. 2020, 274, 123067. [Google Scholar] [CrossRef]
  13. Reches, Y. Nanoparticles as concrete additives: Review and perspectives. Constr. Build. Mater. 2018, 175, 483–495. [Google Scholar] [CrossRef]
  14. Silvestro, L.; Gleize, P.J.P. Effect of carbon nanotubes on compressive, flexural and tensile strengths of Portland cement-based materials: A systematic literature review. Constr. Build. Mater. 2020, 264, 120237. [Google Scholar] [CrossRef]
  15. Marchon, D.; Kawashima, S.; Bessaies-Bey, H.; Mantellato, S.; Ng, S. Hydration and rheology control of concrete for digital fabrication: Potential admixtures and cement chemistry. Cem. Concr. Res. 2018, 112, 96–110. [Google Scholar] [CrossRef]
  16. Mendoza Reales, O.A.; Duda, P.; Silva, E.C.C.M.; Paiva, M.D.M.; Filho, R.D.T. Nanosilica particles as structural buildup agents for 3D printing with Portland cement pastes. Constr. Build. Mater. 2019, 219, 91–100. [Google Scholar] [CrossRef]
  17. Douba, A.E.; Ma, S.; Kawashima, S. Rheology of fresh cement pastes modified with nanoclay-coated cements. Cem. Concr. Compos. 2022, 125, 104301. [Google Scholar] [CrossRef]
  18. Kruger, J.; Zeranka, S.; van Zijl, G. An ab initio approach for thixotropy characterisation of (nanoparticle-infused) 3D printable concrete. Constr. Build. Mater. 2019, 224, 372–386. [Google Scholar] [CrossRef]
  19. Sanjayan, J.G.; Jayathilakage, R.; Rajeev, P. Vibration induced active rheology control for 3D concrete printing. Cem. Concr. Res. 2021, 140, 106293. [Google Scholar] [CrossRef]
  20. Senff, L.; Labrincha, J.A.; Ferreira, V.M.; Hotza, D.; Repette, W.L. Effect of nano-silica on rheology and fresh properties of cement pastes and mortars. Constr. Build. Mater. 2009, 23, 2487–2491. [Google Scholar] [CrossRef]
  21. Senff, L.; Hotza, D.; Repette, W.L.; Ferreira, V.M.; Labrincha, J.A. Rheological characterisation of cement pastes with nanosilica, silica fume and superplasticiser additions. Adv. Appl. Ceram. 2010, 109, 213–218. [Google Scholar] [CrossRef]
  22. Rodríguez, E.D.; Bernal, S.A.; Provis, J.L.; Payá, J.; Monzó, J.M.; Borrachero, M.V. Structure of Portland Cement Pastes Blended with Sonicated Silica Fume. J. Mater. Civ. Eng. 2012, 24, 1295–1304. [Google Scholar] [CrossRef]
  23. Yang, H.; Che, Y.; Shi, M. Influences of calcium carbonate nanoparticles on the workability and strength of 3D printing cementitious materials containing limestone powder. J. Build. Eng. 2021, 44, 102976. [Google Scholar] [CrossRef]
  24. Sikora, P.; Chung, S.Y.; Liard, M.; Lootens, D.; Dorn, T.; Kamm, P.H.; Stephan, D.; Abd Elrahman, M. The effects of nanosilica on the fresh and hardened properties of 3D printable mortars. Constr. Build. Mater. 2021, 281, 122574. [Google Scholar] [CrossRef]
  25. Senff, L.; Hotza, D.; Lucas, S.; Ferreira, V.M.; Labrincha, J.A. Effect of nano-SiO2 and nano-TiO2 addition on the rheological behavior and the hardened properties of cement mortars. Mater. Sci. Eng. A 2012, 532, 354–361. [Google Scholar] [CrossRef]
  26. Senff, L.; Tobaldi, D.M.; Lemes-Rachadel, P.; Labrincha, J.A.; Hotza, D. The influence of TiO2 and ZnO powder mixtures on photocatalytic activity and rheological behavior of cement pastes. Constr. Build. Mater. 2014, 65, 191–200. [Google Scholar] [CrossRef]
  27. Joshaghani, A.; Balapour, M.; Mashhadian, M.; Ozbakkaloglu, T. Effects of nano-TiO2, nano-Al2O3, and nano-Fe2O3 on rheology, mechanical and durability properties of self-consolidating concrete (SCC): An experimental study. Constr. Build. Mater. 2020, 245, 118444. [Google Scholar] [CrossRef]
  28. Jalal, M.; Fathi, M.; Farzad, M. Effects of fly ash and TiO2 nanoparticles on rheological, mechanical, microstructural and thermal properties of high strength self compacting concrete. Mech. Mater. 2013, 61, 11–27. [Google Scholar] [CrossRef]
  29. De Matos, P.R.; Andrade Neto, J.; Sakata, R.; Kirchheim, A.P.; Rodríguez, E.D.; Campos, C. Strategies for XRD quantitative phase analysis of blended Portland cements. Cem. Concr. Res. 2022, 131, 104571. [Google Scholar] [CrossRef]
  30. Ma, G.; Li, Z.; Wang, L. Printable properties of cementitious material containing copper tailings for extrusion based 3D printing. Constr. Build. Mater. 2018, 162, 613–627. [Google Scholar] [CrossRef]
  31. Lothenbach, B.; Le Saout, G.; Ben Haha, M.; Figi, R.; Wieland, E. Hydration of a low-alkali CEM III/B-SiO2 cement (LAC). Cem. Concr. Res. 2012, 42, 410–423. [Google Scholar] [CrossRef]
  32. Rahul, A.V.; Santhanam, M. Evaluating the printability of concretes containing lightweight coarse aggregates. Cem. Concr. Compos. 2020, 109, 103570. [Google Scholar] [CrossRef]
  33. Zhang, Y.; Zhang, Y.; Liu, G.; Yang, Y.; Wu, M.; Pang, B. Fresh properties of a novel 3D printing concrete ink. Constr. Build. Mater. 2018, 174, 263–271. [Google Scholar] [CrossRef]
  34. Rahul, A.V.; Santhanam, M.; Meena, H.; Ghani, Z. 3D printable concrete: Mixture design and test methods. Cem. Concr. Compos. 2019, 97, 13–23. [Google Scholar] [CrossRef]
  35. Yousefi, A.; Allahverdi, A.; Hejazi, P. Effective dispersion of nano-TiO2 powder for enhancement of photocatalytic properties in cement mixes. Constr. Build. Mater. 2013, 41, 224–230. [Google Scholar] [CrossRef]
  36. Reches, Y.; Thomson, K.; Helbing, M.; Kosson, D.S.; Sanchez, F. Agglomeration and reactivity of nanoparticles of SiO2, TiO2, Al2O3, Fe2O3, and clays in cement pastes and effects on compressive strength at ambient and elevated temperatures. Constr. Build. Mater. 2018, 167, 860–873. [Google Scholar] [CrossRef]
  37. Sun, J.; Xu, K.; Shi, C.; Ma, J.; Li, W.; Shen, X. Influence of core/shell TiO2@SiO2 nanoparticles on cement hydration. Constr. Build. Mater. 2017, 156, 114–122. [Google Scholar] [CrossRef]
  38. Meng, T.; Yu, Y.; Qian, X.; Zhan, S.; Qian, K. Effect of nano-TiO2 on the mechanical properties of cement mortar. Constr. Build. Mater. 2012, 29, 241–245. [Google Scholar] [CrossRef]
  39. Senff, L.; Modolo, R.C.E.; Tobaldi, D.M.; Ascenção, G.; Hotza, D.; Ferreira, V.M.; Labrincha, J.A. The influence of TiO2 nanoparticles and poliacrilonitrile fibers on the rheological behavior and hardened properties of mortars. Constr. Build. Mater. 2015, 75, 315–330. [Google Scholar] [CrossRef]
  40. Mechtcherine, V.; Bos, F.P.; Perrot, A.; da Silva, W.R.L.; Nerella, V.N.; Fataei, S.; Wolfs, R.J.M.; Sonebi, M.; Roussel, N. Extrusion-based additive manufacturing with cement-based materials—Production steps, processes, and their underlying physics: A review. Cem. Concr. Res. 2020, 132, 106037. [Google Scholar] [CrossRef]
  41. Roussel, N. Rheological requirements for printable concretes. Cem. Concr. Res. 2018, 112, 76–85. [Google Scholar] [CrossRef]
  42. Suiker, A.S.J.; Wolfs, R.J.M.; Lucas, S.M.; Salet, T.A.M. Elastic buckling and plastic collapse during 3D concrete printing. Cem. Concr. Res. 2020, 135, 106016. [Google Scholar] [CrossRef]
  43. Carneau, P.; Mesnil, R.; Baverel, O.; Roussel, N. Layer pressing in concrete extrusion-based 3D-printing: Experiments and analysis. Cem. Concr. Res. 2022, 155, 106741. [Google Scholar] [CrossRef]
  44. De Matos, P.R.; Pilar, R.; Casagrande, C.A.; Gleize, P.J.P.; Pelisser, F. Comparison between methods for determining the yield stress of cement pastes. J. Braz. Soc. Mech. Sci. Eng. 2020, 42, 24. [Google Scholar] [CrossRef]
  45. Roussel, N.; Cussigh, F. Distinct-layer casting of SCC: The mechanical consequences of thixotropy. Cem. Concr. Res. 2008, 38, 624–632. [Google Scholar] [CrossRef]
  46. Jansen, D.; Goetz-Neunhoeffer, F.; Stabler, C.; Neubauer, J. A remastered external standard method applied to the quantification of early OPC hydration. Cem. Concr. Res. 2011, 41, 602–608. [Google Scholar] [CrossRef]
  47. Jansen, D.; Stabler, C.; Goetz-Neunhoeffer, F.; Dittrich, S.; Neubauer, J. Does Ordinary Portland Cement contain amorphous phase? A quantitative study using an external standard method. Powder Diffr. 2011, 26, 31–38. [Google Scholar] [CrossRef] [Green Version]
  48. Naber, C.; Stegmeyer, S.; Jansen, D.; Goetz-Neunhoeffer, F.; Neubauer, J. The PONKCS method applied for time resolved XRD quantification of supplementary cementitious material reactivity in hydrating mixtures with ordinary Portland cement. Constr. Build. Mater. 2019, 214, 449–457. [Google Scholar] [CrossRef]
  49. Andrade Neto, J.S.; de Matos, P.R.; De la Torre, A.G.; Campos, C.E.M.; Gleize, P.J.P.; Monteiro, P.J.M.; Kirchheim, A.P. The role of sodium and sulfate sources on the rheology and hydration of C3A polymorphs. Cem. Concr. Res. 2022, 151, 106639. [Google Scholar] [CrossRef]
  50. De Matos, P.R.; Sakata, R.D.; Onghero, L.; Uliano, V.G.; de Brito, J.; Campos, C.E.M.; Gleize, P.J.P. Utilization of ceramic tile demolition waste as supplementary cementitious material: An early-age investigation. J. Build. Eng. 2021, 38, 102187. [Google Scholar] [CrossRef]
  51. Jansen, D.; Neubauer, J.; Goetz-Neunhoeffer, F.; Haerzschel, R.; Hergeth, W.D. Change in reaction kinetics of a Portland cement caused by a superplasticizer-Calculation of heat flow curves from XRD data. Cem. Concr. Res. 2012, 42, 327–332. [Google Scholar] [CrossRef]
  52. Berodier, E.; Scrivener, K. Understanding the filler effect on the nucleation and growth of C-S-H. J. Am. Ceram. Soc. 2014, 97, 3764–3773. [Google Scholar] [CrossRef]
  53. Hargis, C.W.; Kirchheim, A.P.; Monteiro, P.J.M.; Gartner, E.M. Early age hydration of calcium sulfoaluminate (synthetic ye’elimite, C 4A3 S ) in the presence of gypsum and varying amounts of calcium hydroxide. Cem. Concr. Res. 2013, 48, 105–115. [Google Scholar] [CrossRef]
  54. Cyr, M.; Lawrence, P.; Ringot, E. Mineral admixtures in mortars: Quantification of the physical effects of inert materials on short-term hydration. Cem. Concr. Res. 2005, 35, 719–730. [Google Scholar] [CrossRef]
  55. Oey, T.; Kumar, A.; Bullard, J.W.; Neithalath, N.; Sant, G. The filler effect: The influence of filler content and surface area on cementitious reaction rates. J. Am. Ceram. Soc. 2013, 96, 1978–1990. [Google Scholar] [CrossRef]
  56. Bhojaraju, C.; Di Mare, M.; Ouellet-Plamondon, C.M. The impact of carbon-based nanomaterial additions on the hydration reactions and kinetics of GGBS-modified cements. Constr. Build. Mater. 2021, 303, 124366. [Google Scholar] [CrossRef]
  57. Wang, F.; Kong, X.; Jiang, L.; Wang, D. The acceleration mechanism of nano-C-S-H particles on OPC hydration. Constr. Build. Mater. 2020, 249, 118734. [Google Scholar] [CrossRef]
  58. Ivanova, I.; Ivaniuk, E.; Bisetti, S.; Nerella, V.N.; Mechtcherine, V. Comparison between methods for indirect assessment of buildability in fresh 3D printed mortar and concrete. Cem. Concr. Res. 2022, 156, 106764. [Google Scholar] [CrossRef]
  59. Reiter, L.; Wangler, T.; Roussel, N.; Flatt, R.J. Slow penetration for characterizing concrete for digital fabrication. Cem. Concr. Res. 2022, 157, 106802. [Google Scholar] [CrossRef]
  60. Roussel, N.; Ovarlez, G.; Garrault, S.; Brumaud, C. The origins of thixotropy of fresh cement pastes. Cem. Concr. Res. 2012, 42, 148–157. [Google Scholar] [CrossRef]
  61. Qian, Y. Effect of polycarboxylate ether (PCE) superplasticizer on thixotropic structural build-up of fresh cement pastes over time. Constr. Build. Mater. 2021, 291, 123241. [Google Scholar] [CrossRef]
  62. Bergold, S.T.; Goetz-Neunhoeffer, F.; Neubauer, J. Quantitative analysis of C-S-H in hydrating alite pastes by in-situ XRD. Cem. Concr. Res. 2013, 53, 119–126. [Google Scholar] [CrossRef]
  63. Bellmann, F.; Damidot, D.; Möser, B.; Skibsted, J. Improved evidence for the existence of an intermediate phase during hydration of tricalcium silicate. Cem. Concr. Res. 2010, 40, 875–884. [Google Scholar] [CrossRef]
  64. Huang, L.; Tang, L.; Gu, H.; Li, Z.; Yang, Z. New insights into the reaction of tricalcium silicate (C3S) with solutions to the end of the induction period. Cem. Concr. Res. 2022, 152, 106688. [Google Scholar] [CrossRef]
  65. Plank, J.; Schönlein, M.; Kanchanason, V. Study on the early crystallization of calcium silicate hydrate (C-S-H) in the presence of polycarboxylate superplasticizers. J. Organomet. Chem. 2018, 869, 227–232. [Google Scholar] [CrossRef]
  66. Jansen, D.; Naber, C.; Ectors, D.; Lu, Z.; Kong, X.M.; Goetz-Neunhoeffer, F.; Neubauer, J. The early hydration of OPC investigated by in-situ XRD, heat flow calorimetry, pore water analysis and 1H NMR: Learning about adsorbed ions from a complete mass balance approach. Cem. Concr. Res. 2018, 109, 230–242. [Google Scholar] [CrossRef]
  67. Bergold, S.T.; Jansen, D.; Dittrich, S.; Goetz-Neunhoeffer, F.; Neubauer, J. Development of C-S-H during the early hydration of alite with water at different temperatures: Direct quantification by in-situ XRD. GDCh-Monographie 2012, 45, 91–96. [Google Scholar]
  68. De Matos, P.R.; Prudêncio, L.R., Jr.; Pilar, R.; Gleize, P.J.P.; Pelisser, F. Use of recycled water from mixer truck wash in concrete: Effect on the hydration, fresh and hardened properties. Constr. Build. Mater. 2020, 230, 116981. [Google Scholar] [CrossRef]
  69. Huang, T.; Yuan, Q.; He, F.; Xie, Y. Understanding the mechanisms behind the time-dependent viscoelasticity of fresh C3A–gypsum paste. Cem. Concr. Res. 2020, 133, 106084. [Google Scholar] [CrossRef]
  70. Jakob, C.; Jansen, D.; Ukrainczyk, N.; Koenders, E.; Pott, U.; Stephan, D.; Neubauer, J. Relating ettringite formation and rheological changes during the initial cement hydration: A comparative study applying XRD analysis, rheological measurements and modeling. Materials 2019, 12, 2957. [Google Scholar] [CrossRef] [Green Version]
  71. Chen, J.; Kou, S.C.; Poon, C.S. Hydration and properties of nano-TiO2 blended cement composites. Cem. Concr. Compos. 2012, 34, 642–649. [Google Scholar] [CrossRef]
  72. Guo, Y.; Zhang, T.; Wei, J.; Yu, Q.; Ouyang, S. Evaluating the distance between particles in fresh cement paste based on the yield stress and particle size. Constr. Build. Mater. 2017, 142, 109–116. [Google Scholar] [CrossRef]
  73. Wong, H.H.C.; Kwan, A.K.H. Rheology of cement paste: Role of excess water to solid surface area ratio. J. Mater. Civ. Eng. 2008, 20, 189–197. [Google Scholar] [CrossRef]
  74. Kwan, A.K.H.; McKinley, M. Effects of limestone fines on water film thickness, paste film thickness and performance of mortar. Powder Technol. 2014, 261, 33–41. [Google Scholar] [CrossRef]
  75. De Azevedo, N.H.; de Matos, P.R.; Gleize, P.J.P.; Betioli, A.M. Effect of thermal treatment of SiC nanowhiskers on rheological, hydration, mechanical and microstructure properties of Portland cement pastes. Cem. Concr. Compos. 2021, 117, 103903. [Google Scholar] [CrossRef]
  76. Silvestro, L.; Ruviaro, A.; Lima, G.; de Matos, P.; de Azevedo, A.R.G.; Monteiro, S.N.; Gleize, P. Influence of ultrasonication of functionalized carbon nanotubes on the rheology, hydration, and compressive strength of portland cement pastes. Materials 2021, 14, 5248. [Google Scholar] [CrossRef]
  77. Jiang, S.; Shan, B.; Ouyang, J.; Zhang, W.; Yu, X.; Li, P.; Han, B. Rheological properties of cementitious composites with nano/fiber fillers. Constr. Build. Mater. 2018, 158, 786–800. [Google Scholar] [CrossRef]
  78. Mendoza Reales, O.A.; Arias Jaramillo, Y.P.; Ochoa Botero, J.C.; Delgado, C.A.; Quintero, J.H.; Toledo Filho, R.D. Influence of MWCNT/surfactant dispersions on the rheology of Portland cement pastes. Cem. Concr. Res. 2018, 107, 101–109. [Google Scholar] [CrossRef]
  79. Neto, J.D.S.A.; Santos, T.A.; de Andrade Pinto, S.; Dias, C.M.R.; Ribeiro, D.V. Effect of the combined use of carbon nanotubes (CNT) and metakaolin on the properties of cementitious matrices. Constr. Build. Mater. 2021, 271, 121903. [Google Scholar] [CrossRef]
  80. De Noirfontaine, M.N.; Courtial, M.; Dunstetter, F.; Gasecki, G.; Signes-Frehel, M. Tricalcium silicate Ca3SiO5 superstructure analysis: A route towards the structure of the M1 polymorph. Z. Krist. 2012, 227, 102–112. [Google Scholar] [CrossRef]
Figure 1. Particle size distribution (PSD) of the Portland cement (PC), silica fume (SF), and quartz powder (QP) used.
Materials 15 03896 g001
Figure 2. 3D printer setup used.
Materials 15 03896 g002
Figure 3. C3A, gypsum, and ettringite content of pastes over time obtained by in situ XRD-Rietveld QPA.
Materials 15 03896 g003
Figure 4. Example of curves obtained in the time-resolved rheological tests for the 0% TiO2 mix. (a) Shear stress vs. time [constant γ = 0.01 s−1]; (b) flow curves.
Materials 15 03896 g004
Figure 5. Rheological properties of the pastes over time. (a) static yield stress; (b) dynamic yield stress; (c) equivalent plastic viscosity.
Materials 15 03896 g005
Figure 6. Failure during the buildability test for the different nano-TiO2 contents. The arrows indicate the failure; (*) indicates that the failure occurred in the opposite face.
Materials 15 03896 g006
Figure 7. Buildability tests results.
Materials 15 03896 g007
Figure 8. Printability tests results—“open time”.
Materials 15 03896 g008
Figure 9. Example of filaments obtained in the printability test (0% TiO2).
Materials 15 03896 g009
Table 1. Chemical composition and physical properties of the binder materials used.
PropertyPortland CementSilica FumeNano-TiO2
Chemical composition (wt.%)
SiO216.993.9<0.1
Al2O33.60.40.4
Fe2O32.60.4<0.1
CaO68.40.3<0.1
K2O1.10.80.2
Na2O0.11.80.1
MgO2.42.00.1
SO34.40.1<0.1
TiO20.3<0.198.5
P2O50.2<0.10.4
* L.O.I3.46-0.40
Physical property
Density (g/cm3)3.082.224.23
BET SSA ** (m2/g)2.619.370.2
* L.O.I: loss on ignition at 950 °C; ** SSA: specific surface area.
Table 2. Detailed composition of the mortars produced (by weight).
Mix/MaterialCementNano-TiO2Silica FumeQuartz PowderWaterSuperplasticizer
0% TiO20.90000.00000.101.000.300.018
0.25% TiO20.89750.0025
0.50% TiO20.89500.0050
0.75% TiO20.89250.0075
1.00% TiO20.89000.0100
1.50% TiO20.88500.0150
Table 3. Structuration rate parameters of the pastes.
Mix τ 0 , s t = 0
(Pa)
Athix
(Pa/min)
Coefficient of Determination (R2)
0% TiO20.750.0250.94
0.75% TiO20.860.0330.93
1.50% TiO21.800.0370.87
Publisher’s Note: MDPI stays neutral with regard to jurisdictional claims in published maps and institutional affiliations.

