
Theoretical Prediction of Structures and Properties of 2,4,6-Trinitro-1,3,5-Triazine (TNTA) Green Energetic Materials from DFT and ReaxFF Molecular Modeling


Abstract
:1. Introduction
2. Computational Details
3. Results and Discussions
3.1. Crystal Structure Predict
3.2. Reactive Molecular Dynamics Using ReaxFF-lg
4. Conclusions
Author Contributions
Funding
Institutional Review Board Statement
Informed Consent Statement
Acknowledgments
Conflicts of Interest
References
- Finger, H. Über abkömmlinge des cyanurs. (Vorläufige Mitteilung). J. Prakt. Chem. 1907, 75, 103–104. [Google Scholar] [CrossRef] [Green Version]
- Immirzi, A.; Pernir, B. Prediction of density in organic crystals. Acta Crystallogr. A 1977, 33, 216–218. [Google Scholar] [CrossRef]
- Korkin, A.A.; Bartlett, R.J. Theoretical prediction of 2,4,6-trinitro-1,3,5-triazine (TNTA). A new, powerful, high-energy density material? J. Am. Chem. Soc. 1996, 118, 12244–12245. [Google Scholar] [CrossRef]
- Yang, K.; Park, Y.H.; Cho, S.G.; Lee, H.W.; Kim, C.K.; Koo, H.J. Theoretical studies on the formation mechanism and explosive performance of nitro-substituted 1,3,5-triazines. J. Comput. Chem. 2010, 31, 2483–2492. [Google Scholar] [CrossRef]
- Desiraju, G.R.; Parshall, G.W. Crystal engineering: The design of organic solids. Mater. Sci. Monogr. 1989, 54, XIV-312. [Google Scholar]
- Desiraju, G.R. Crystal engineering: From molecule to crystal. J. Am. Chem. Soc. 2013, 135, 9952–9967. [Google Scholar] [CrossRef]
- Ma, Y.; Meng, L.; Li, H.; Zhang, C. Enhancing intermolecular interactions and their anisotropy to build low-impact-sensitivity energetic crystals. CrystEngComm 2017, 19, 3145–3155. [Google Scholar] [CrossRef]
- Ma, Y.; Zhang, A.; Xue, X.; Jiang, D.; Zhu, Y.; Zhang, C. Crystal packing of impact-sensitive high-energy explosives. Cryst. Growth Des. 2014, 14, 6101–6114. [Google Scholar] [CrossRef]
- Ma, Y.; Zhang, A.; Zhang, C.; Jiang, D.; Zhu, Y.; Zhang, C. Crystal packing of low-sensitivity and high-energy explosives. Cryst. Growth Des. 2014, 14, 4703–4713. [Google Scholar] [CrossRef]
- Bu, R.; Xiong, Y.; Wei, X.; Li, H.; Zhang, C. Hydrogen bonding in CHON-containing energetic crystals: A review. Cryst. Growth Des. 2019, 19, 5981–5997. [Google Scholar] [CrossRef]
- Liu, G.; Gou, R.; Li, H.; Zhang, C. Polymorphism of energetic materials: A comprehensive study of molecular conformers, crystal packing, and the dominance of their energetics in governing the most stable polymorph. Cryst. Growth Des. 2018, 18, 4174–4186. [Google Scholar] [CrossRef]
- Zhang, C.; Jiao, F.; Li, H. Crystal engineering for creating low sensitivity and highly energetic materials. Cryst. Growth Des. 2018, 18, 5713–5726. [Google Scholar] [CrossRef]
- Graser, J.; Kauwe, S.K.; Sparks, T.D. Machine learning and energy minimization approaches for crystal structure predictions: A review and new horizons. Chem. Mater. 2018, 30, 3601–3612. [Google Scholar] [CrossRef]
- Naserifar, S.; Zybin, S.; Ye, C.C.; Goddard, W.A., III. Prediction of structures and properties of 2,4,6-triamino-1,3,5-triazine-1,3,5-trioxide (MTO) and 2,4,6-trinitro-1,3,5-triazine-1,3,5-trioxide (MTO3N) green energetic materials from DFT and ReaxFF molecular modeling. J. Mater. Chem. A 2016, 4, 1264–1276. [Google Scholar] [CrossRef] [Green Version]
- Li, H.J.; Liu, J.C.; Yang, L.; Yan, Z.Z.; Lu, Y.W.; Han, J.M.; Li, W. Theoretical predict structure and property of the novel CL-20/2, 4-DNI cocrystal by systematic search approach. Def. Technol. 2021, in press. [CrossRef]
- Chen, L.; Wang, H.; Wang, F.; Geng, D.; Wu, J.; Lu, J. Thermal decomposition mechanism of 2,2′,4,4′,6,6′-hexanitrostilbene by ReaxFF reactive molecular dynamics simulations. J. Phys. Chem. C 2018, 122, 19309–19318. [Google Scholar] [CrossRef]
- Song, L.; Zhao, F.Q.; Xu, S.Y.; Ju, X.H. Reactive molecular dynamics simulation of the high-temperature pyrolysis of 2,2′,2′′,4,4′,4′′,6,6′,6′′-nonanitro-1,1′:3′,1′′-terphenyl (NONA). RSC Adv. 2020, 10, 5507–5515. [Google Scholar] [CrossRef]
- Song, L.; Zhao, F.Q.; Xu, S.Y.; Ye, C.C.; Ju, X.H. Structural evolution of aluminum hydride nanoparticles in water using ReaxFF molecular dynamics method. Mater. Today Commun. 2021, 26, 101804. [Google Scholar] [CrossRef]
- Mei, Z.; An, Q.; Zhao, F.Q.; Xu, S.Y.; Ju, X.H. Reactive molecular dynamics simulation of thermal decomposition for nano-aluminized explosives. Phys. Chem. Chem. Phys. 2018, 20, 29341–29350. [Google Scholar] [CrossRef]
- Frisch, M.J. gaussian16. 2020. Available online: http://www.gaussian.com/ (accessed on 11 March 2022).
- Lu, X.; Clements-Croome, D.; Viljanen, M. Fractal geometry and architecture design: Case study review. Chaotic Model. Simul. (CMSIM) 2012, 2, 311–322. [Google Scholar]
- Lyu, K.; Peng, Y.; Xiao, L.; Lu, J.; Zhuang, L. Water induced phase segregation in hydrocarbon proton exchange membranes. J. Energy Chem. 2018, 27, 1517–1520. [Google Scholar] [CrossRef] [Green Version]
- Spackman, M.A.; Jayatilaka, D. Hirshfeld surface analysis. CrystEngComm 2009, 11, 19–32. [Google Scholar] [CrossRef]
- Turner, M.J.; Grabowsky, S.; Jayatilaka, D.; Spackman, M.A. Accurate and efficient model energies for exploring intermolecular interactions in molecular crystals. J. Phys. Chem. Lett. 2014, 5, 4249–4255. [Google Scholar] [CrossRef] [PubMed] [Green Version]
- Spackman, M.A.; McKinnon, J.J. Fingerprinting intermolecular interactions in molecular crystals. CrystEngComm 2002, 4, 378–392. [Google Scholar] [CrossRef]
- McKinnon, J.J.; Fabbiani, F.P.; Spackman, M.A. Comparison of polymorphic molecular crystal structures through Hirshfeld surface analysis. Cryst. Growth Des. 2007, 7, 755–769. [Google Scholar] [CrossRef]
- McKinnon, J.J.; Spackman, M.A.; Mitchell, A.S. Novel tools for visualizing and exploring intermolecular interactions in molecular crystals. Acta Crystallogr. Sect. B Struct. Sci. 2004, 6, 627–628. [Google Scholar]
- McKinnon, J.J.; Jayatilaka, D.; Spackman, M.A. Towards quantitative analysis of intermolecular interactions with Hirshfeld surfaces. Chem. Commun. 2007, 37, 3814–3816. [Google Scholar] [CrossRef]
- Hamilton, B.W.; Kroonblawd, M.P.; Islam, M.M.; Strachan, A. Sensitivity of the shock initiation threshold of 1,3,5-triamino-2,4,6-trinitrobenzene (TATB) to nuclear quantum effects. J. Phys. Chem. C 2019, 123, 21969–21981. [Google Scholar] [CrossRef]
- Mighell, A.D.; Himes, V.L.; Rodgers, J.R. Space-group frequencies for organic compounds. Acta Crystallogr. A 1983, 39, 737–740. [Google Scholar] [CrossRef]
- Wilson, A.J.C. Space groups rare for organic structures. I. Triclinic, monoclinic and orthorhombic crystal classes. Acta Crystallogr. A 1988, 44, 715–724. [Google Scholar] [CrossRef]
- Baur, W.H.; Kassner, D. The perils of Cc: Comparing the frequencies of falsely assigned space groups with their general population. Acta Crystallogr B 1992, 48, 356–369. [Google Scholar] [CrossRef]
- Belsky, V.K.; Zorkii, P.M. Distribution of organic homomolecular crystals by chiral types and structural classes. Acta Crystallogr. A 1977, 33, 1004–1006. [Google Scholar] [CrossRef]
- Wang, Y.; Song, S.; Huang, C.; Qi, X.; Wang, K.; Liu, Y.; Zhang, Q. Hunting for advanced high-energy-density materials with well-balanced energy and safety through an energetic host-guest inclusion strategy. J. Mater. Chem. A 2019, 7, 19248–19257. [Google Scholar] [CrossRef]
- Ding, R.; Xu, J.; Tao, Y.; Sun, J.; Lei, M. Experimental and theoretical study on the stability of CL-20-based host-guest energetic materials. J. Phys. Chem. A 2020, 124, 6389–6398. [Google Scholar] [CrossRef]
- Spackman, M.A.; Byrom, P.G. A novel definition of a molecule in a crystal. Chem. Phys. Lett. 1997, 267, 215–220. [Google Scholar] [CrossRef]


| Force Field Types | Atom Type Description | RESP Charges | |
|---|---|---|---|
| C1–C3 | C3N | sp2, double bond to N (-C=N-) | 0.78 |
| O1–O6 | O12 | sp2, in nitro group (-NO2) | −0.35 |
| N1–N3 | N2= | sp2, double bond to C (-N=C-) | −0.73 |
| N4–N6 | N3O | sp2, in nitro group (-NO2) | 0.65 |
| Method/ Functional | Space Groups | Z | E (kJ/mol) | ρ (g/cm3) | a (Å) | b (Å) | c (Å) | α (°) | β (°) | γ (°) |
|---|---|---|---|---|---|---|---|---|---|---|
| GGA-PBE | P1 | 2 | −3.82 | 1.85 | 10.99 | 5.51 | 9.02 | 86.84 | 116.27 | 124.64 |
| P21 | 2 | −3.72 | 1.83 | 9.06 | 5.48 | 9.12 | 90.0 | 60.03 | 90.0 | |
| P212121 | 4 | −3.87 | 1.83 | 14.12 | 6.26 | 8.90 | 90.0 | 90.0 | 90.0 | |
| P21/c | 4 | −3.82 | 1.86 | 8.15 | 15.65 | 6.42 | 90.0 | 109.16 | 90.0 | |
| Pna21 | 4 | −4.11 | 1.89 | 8.69 | 9.07 | 9.65 | 90.0 | 90.0 | 90.0 | |
| Pbca | 8 | −3.91 | 1.90 | 13.17 | 9.57 | 12.01 | 90.0 | 90.0 | 90.0 | |
| C2/c | 8 | −3.88 | 1.84 | 15.70 | 6.48 | 17.04 | 90.0 | 64.49 | 90.0 | |
| GGA-PW91 | P1 | 2 | −4.02 | 1.76 | 10.07 | 6.07 | 8.89 | 90.14 | 117.46 | 118.00 |
| P21 | 2 | −3.96 | 1.73 | 9.16 | 5.68 | 9.21 | 90.0 | 59.79 | 90.0 | |
| P212121 | 4 | −4.05 | 1.75 | 14.29 | 6.33 | 9.09 | 90.0 | 90.0 | 90.0 | |
| P21/c | 4 | −4.01 | 1.75 | 8.30 | 15.91 | 6.59 | 90.0 | 109.57 | 90.0 | |
| Pna21 | 4 | −4.24 | 1.80 | 8.73 | 9.16 | 9.98 | 90.0 | 90.0 | 90.0 | |
| Pbca | 8 | −4.07 | 1.78 | 13.55 | 9.71 | 12.24 | 90.0 | 90.0 | 90.0 | |
| C2/c | 8 | −0.87 | 1.76 | 15.80 | 6.58 | 17.40 | 90.0 | 64.70 | 90.0 | |
| P1 | 2 | 22.63 | 2.28 | 9.21 | 5.39 | 8.40 | 90.65 | 120.99 | 113.80 | |
| LDA-CA-PZ | P21 | 2 | 23.01 | 2.23 | 8.73 | 4.89 | 8.72 | 90.0 | 59.88 | 90.0 |
| P212121 | 4 | 22.32 | 2.30 | 13.36 | 5.61 | 8.33 | 90.0 | 90.0 | 90.0 | |
| P21/c | 4 | 22.49 | 2.28 | 7.71 | 14.02 | 6.16 | 90.0 | 108.96 | 90.0 | |
| Pna21 | 4 | 22.17 | 2.31 | 8.30 | 8.58 | 8.70 | 90.0 | 90.0 | 90.0 | |
| Pbca | 8 | 22.32 | 2.32 | 12.13 | 8.96 | 11.37 | 90.0 | 90.0 | 90.0 | |
| C2/c | 8 | −35.8 | 1.77 | 15.79 | 6.53 | 17.45 | 90.0 | 64.57 | 90.0 |
| Species | Appearance Time (ps) | Life Time (fs) | Max Numbers | ||||||
|---|---|---|---|---|---|---|---|---|---|
| 1800 K | 2500 K | 3500 K | 1800 K | 2500 K | 3500 K | 1800 K | 2500 K | 3500 K | |
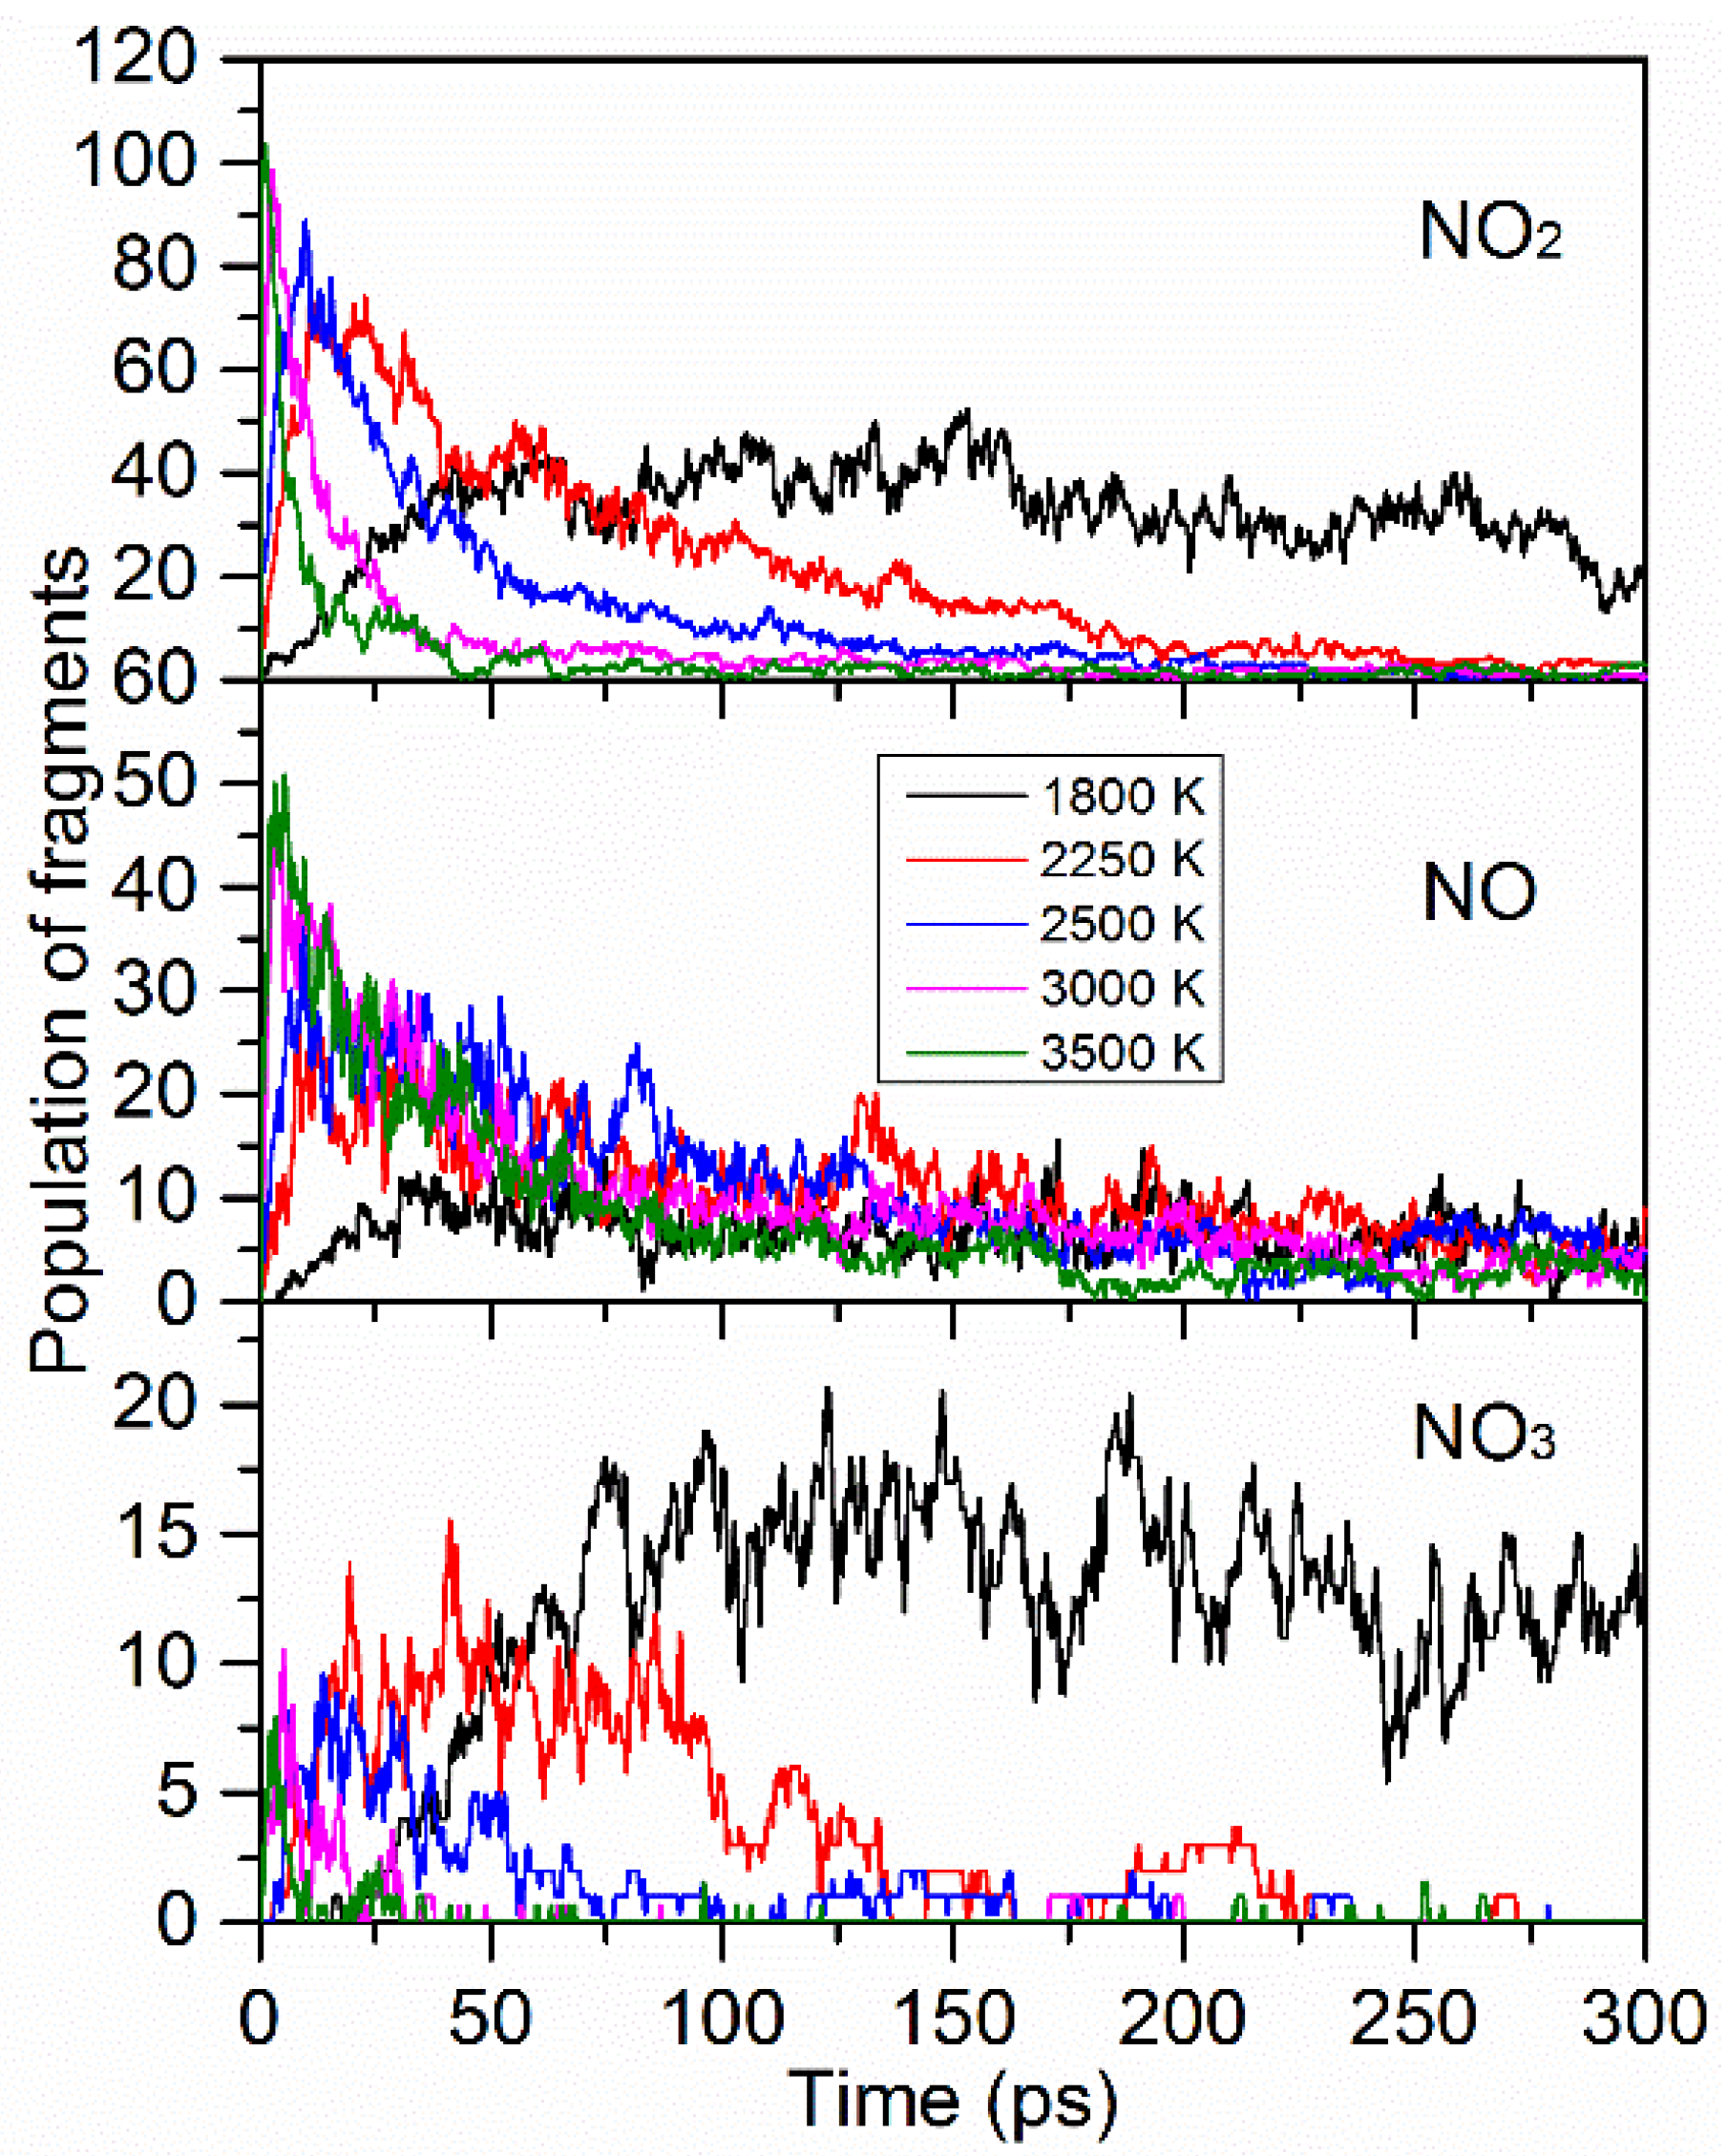
| NO2 | 0.3 | 0.3 | 0.3 | 2616 | 2384 | 1343 | 53 | 91 | 106 |
| NO | 4.2 | 0.3 | 0.3 | 1032 | 1160 | 1090 | 17 | 39 | 53 |
| NO3 | 15.9 | 3.3 | 0.6 | 4629 | 1771 | 568 | 21 | 10 | 9 |
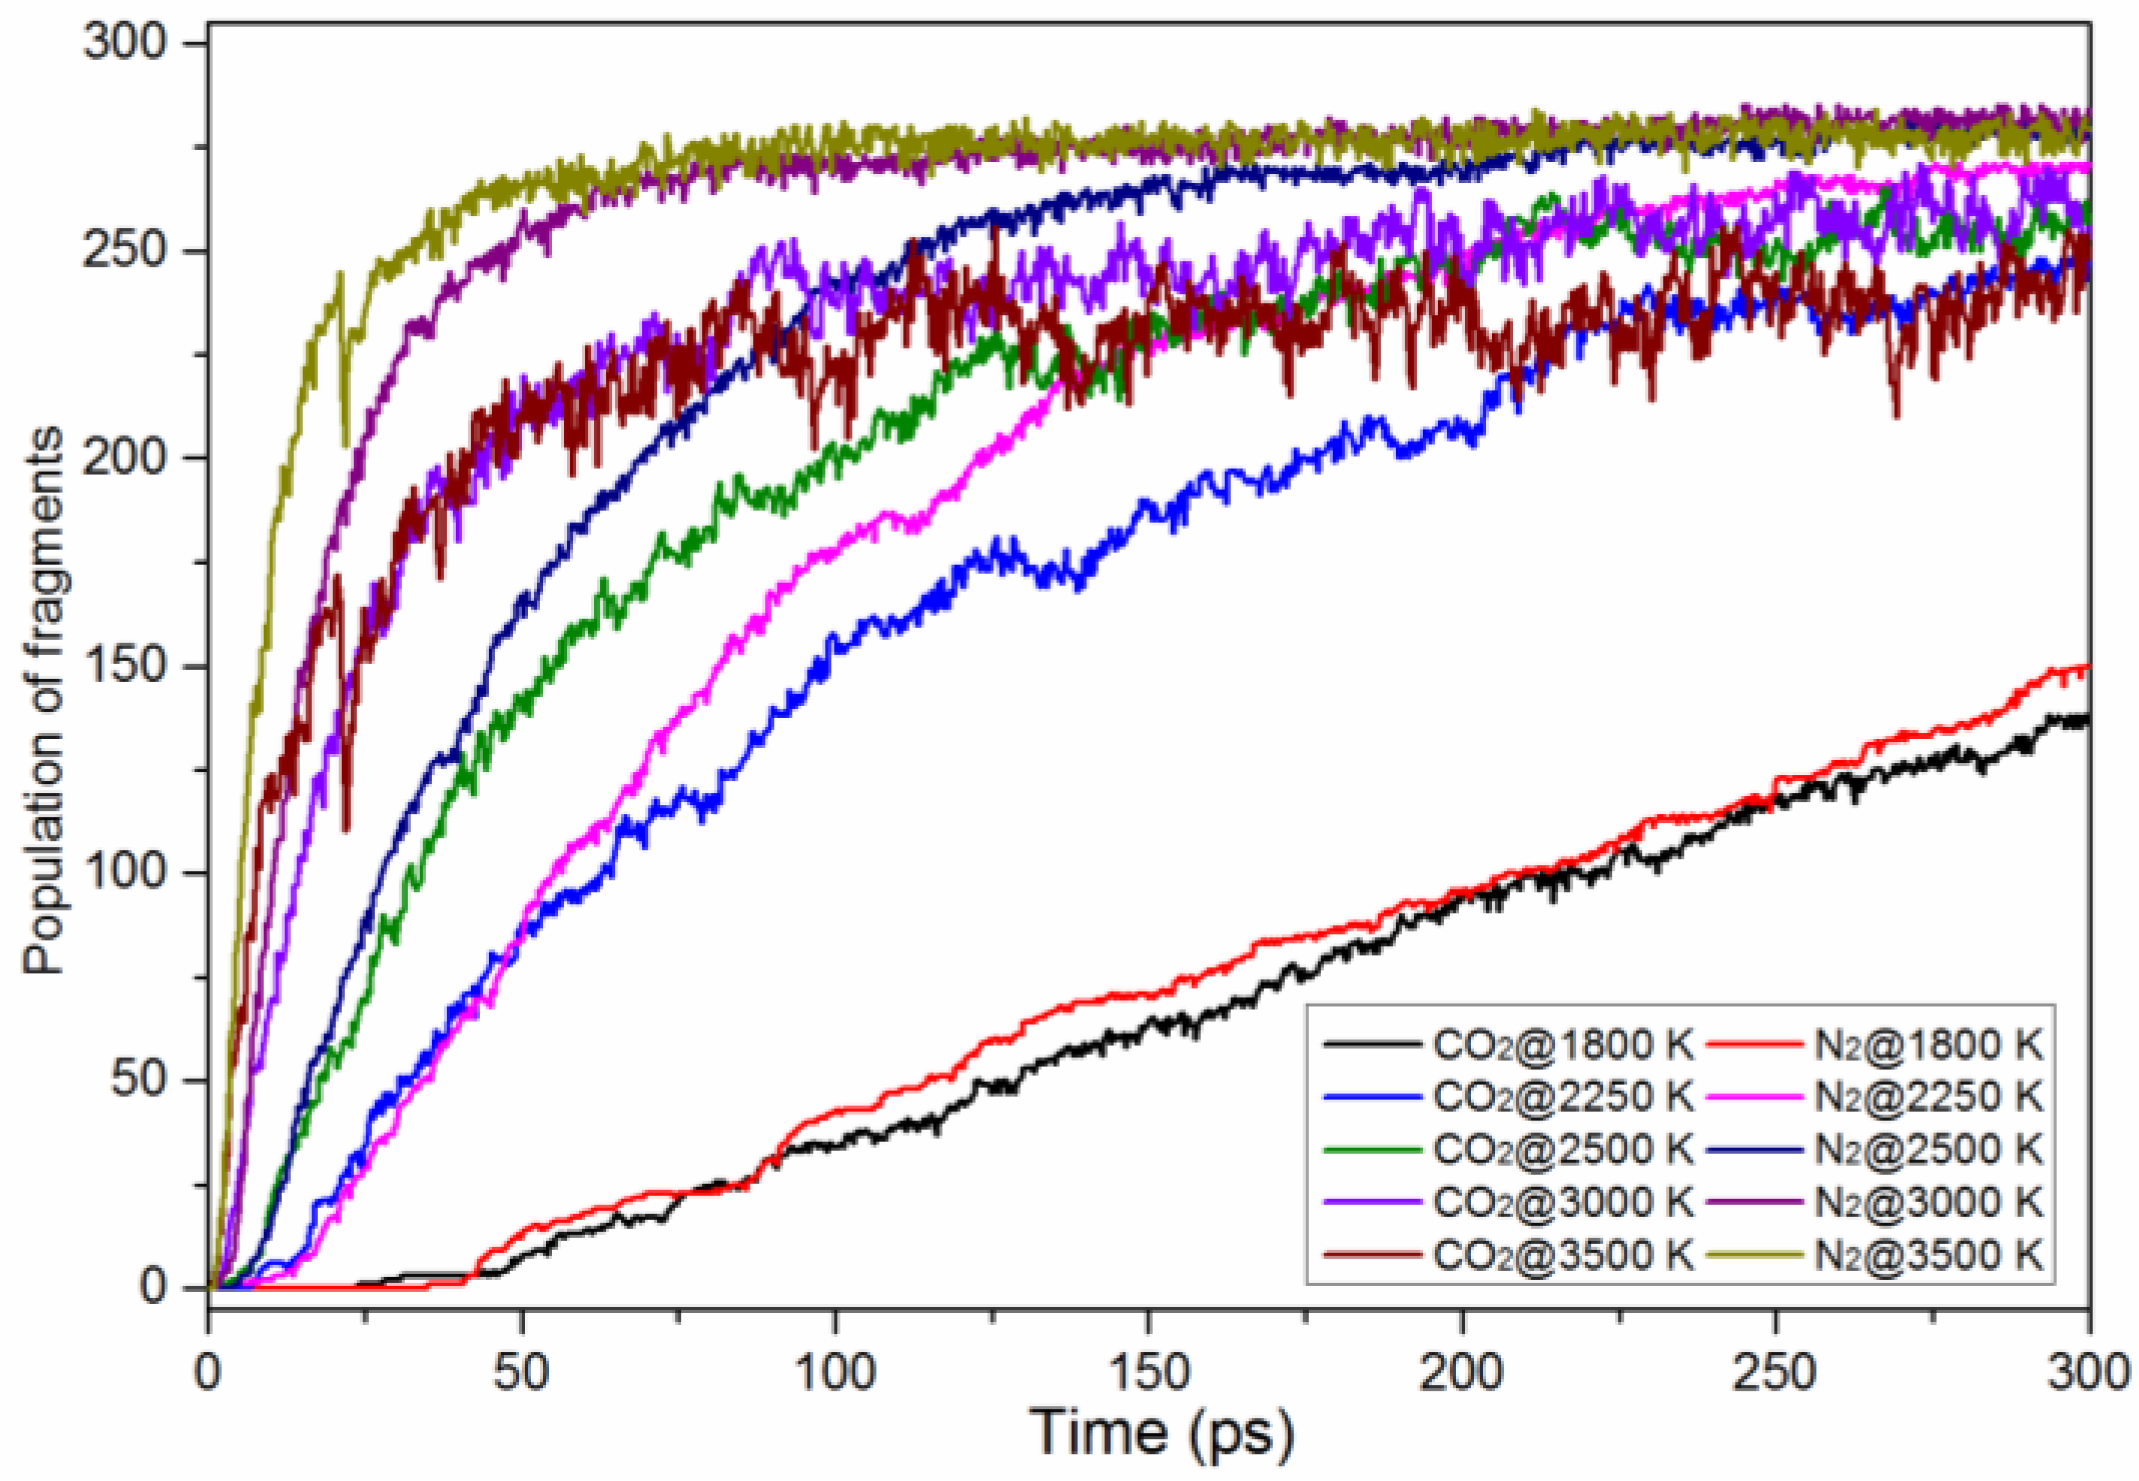
| CO2 | 24 | 2.1 | 0.9 | 17,561 | 14,017 | 4494 | 138 | 265 | 256 |
| N2 | 35.1 | 4.2 | 1.2 | 48,558 | 25,722 | 11,026 | 150 | 282 | 284 |
| 2500 K | 3500 K | ||||
|---|---|---|---|---|---|
| No. | Reactions | NF | No. | Reactions | NF |
| R0 | CO2N2 → N2 + CO2 | 1053 | R0 | CO2 + N2 → CO2N2 | 3116 |
| R1 | N2 + CO2 → CO2N2 | 1050 | R1 | CO2N2 → CO2 + N2 | 3103 |
| R2 | C2O4 → 2 CO2 | 531 | R2 | C2O4 → 2 CO2 | 2590 |
| R3 | CO3N → CO2 + ON | 499 | R3 | 2 CO2 → C2O4 | 2539 |
| R4 | 2 CO2 → C2O4 | 499 | R4 | CO2 + CO → C2O3 | 604 |
| R5 | CO2 + ON → CO3N | 498 | R5 | C2O3 → CO2 + CO | 599 |
| R6 | CO4N → CO2 + O2N | 260 | R6 | CO2 + ON → CO3N | 454 |
| R7 | CO2 + O2N → CO4N | 254 | R7 | CO3N → CO2 + ON | 448 |
| R8 | ON3 → N2 + ON | 251 | R8 | N4 → 2 N2 | 400 |
| R9 | N2 + ON → ON3 | 245 | R9 | 2 N2 → N4 | 394 |
| R10 | 2 ON → O2N2 | 197 | R10 | CON2 → N2 + CO | 337 |
| R11 | O2N2 → 2 ON | 175 | R11 | N2 + CO → CON2 | 327 |
| R12 | 2 O2N → O4N2 | 149 | R12 | CO2 + C2O3 → C3O5 | 294 |
| R13 | CO2 + CO → C2O3 | 143 | R13 | ON3 → N2 + ON | 292 |
| R14 | CON2 → N2 + CO | 142 | R14 | N2 + ON → ON3 | 291 |
| R15 | O4N2 → 2 O2N | 128 | R15 | C3O5 → CO2 + C2O3 | 279 |
| R16 | C2O3 → CO2 + CO | 122 | R16 | C2O4 + CO2 → C3O6 | 197 |
| R17 | N2 + CO → CON2 | 121 | R17 | C3O6 → C2O4 + CO2 | 189 |
| R18 | CON + ON → CO2N2 | 114 | R18 | CO2 + CO3 → C2O5 | 178 |
| R19 | N2 + CON → CON3 | 111 | R19 | N2 + C2O3 → C2O3N2 | 166 |
| R20 | CON3 → N2 + CON | 108 | R20 | C2O3N2 → N2 + C2O3 | 164 |
| R21 | C2O3N → CO2 + CON | 98 | R21 | CO2 + O2N → CO4N | 152 |
| R22 | O3N2 → O2N + ON | 92 | R22 | C2O5 → CO2 + CO3 | 142 |
| R23 | CO2N2 → CON + ON | 85 | R23 | CO4 → CO2 + O2 | 134 |
| R24 | O2N + ON → O3N2 | 84 | R24 | C2O4N2 → 2 CO2 + N2 | 134 |
| R25 | CO2 + CON → C2O3N | 83 | R25 | CO4N → CO2 + O2N | 131 |
| R26 | O2N2 + ON → O3N3 | 79 | R26 | C2O4 + CO2 → C2O4 + CO2 | 131 |
| R27 | C3O6N6 → O2N + C3O4N5 | 78 | R27 | C3O6 → 3 CO2 | 127 |
| R28 | CO2 + C2O3 → C3O5 | 78 | R28 | C2O4N2 → C2O4 + N2 | 124 |
| R29 | C3O5 → CO2 + C2O3 | 77 | R29 | CO2 + O2 → CO4 | 122 |
| R30 | N4 → 2 N2 | 76 | R30 | 2 CO2 + N2 → C2O4N2 | 121 |
Publisher’s Note: MDPI stays neutral with regard to jurisdictional claims in published maps and institutional affiliations. |
© 2022 by the authors. Licensee MDPI, Basel, Switzerland. This article is an open access article distributed under the terms and conditions of the Creative Commons Attribution (CC BY) license (https://creativecommons.org/licenses/by/4.0/).
Share and Cite
Zhou, M.-M.; Xiang, D. Theoretical Prediction of Structures and Properties of 2,4,6-Trinitro-1,3,5-Triazine (TNTA) Green Energetic Materials from DFT and ReaxFF Molecular Modeling. Materials 2022, 15, 3873. https://doi.org/10.3390/ma15113873
Zhou M-M, Xiang D. Theoretical Prediction of Structures and Properties of 2,4,6-Trinitro-1,3,5-Triazine (TNTA) Green Energetic Materials from DFT and ReaxFF Molecular Modeling. Materials. 2022; 15(11):3873. https://doi.org/10.3390/ma15113873
Chicago/Turabian StyleZhou, Ming-Ming, and Dong Xiang. 2022. "Theoretical Prediction of Structures and Properties of 2,4,6-Trinitro-1,3,5-Triazine (TNTA) Green Energetic Materials from DFT and ReaxFF Molecular Modeling" Materials 15, no. 11: 3873. https://doi.org/10.3390/ma15113873
APA StyleZhou, M.-M., & Xiang, D. (2022). Theoretical Prediction of Structures and Properties of 2,4,6-Trinitro-1,3,5-Triazine (TNTA) Green Energetic Materials from DFT and ReaxFF Molecular Modeling. Materials, 15(11), 3873. https://doi.org/10.3390/ma15113873