
A Review on Principles, Theories and Materials for Self Sensing Concrete for Structural Applications

 ,
,  and
and 
Abstract
:1. Introduction
2. Sensing Mechanism
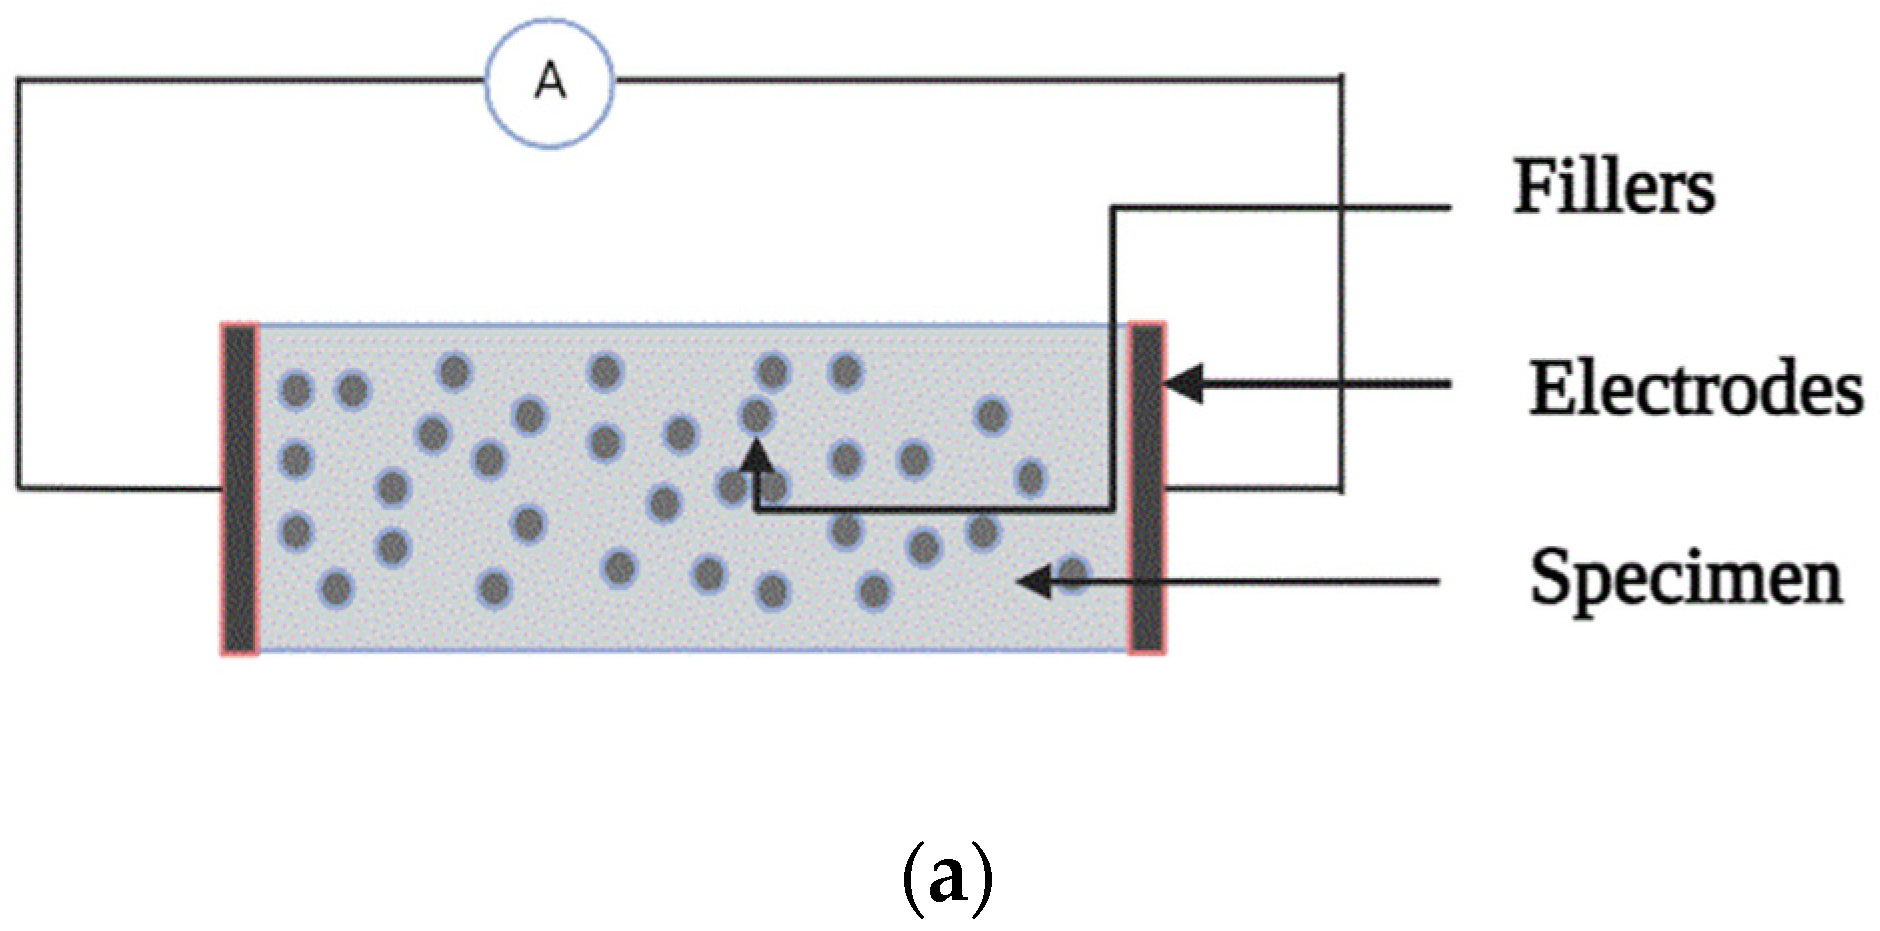
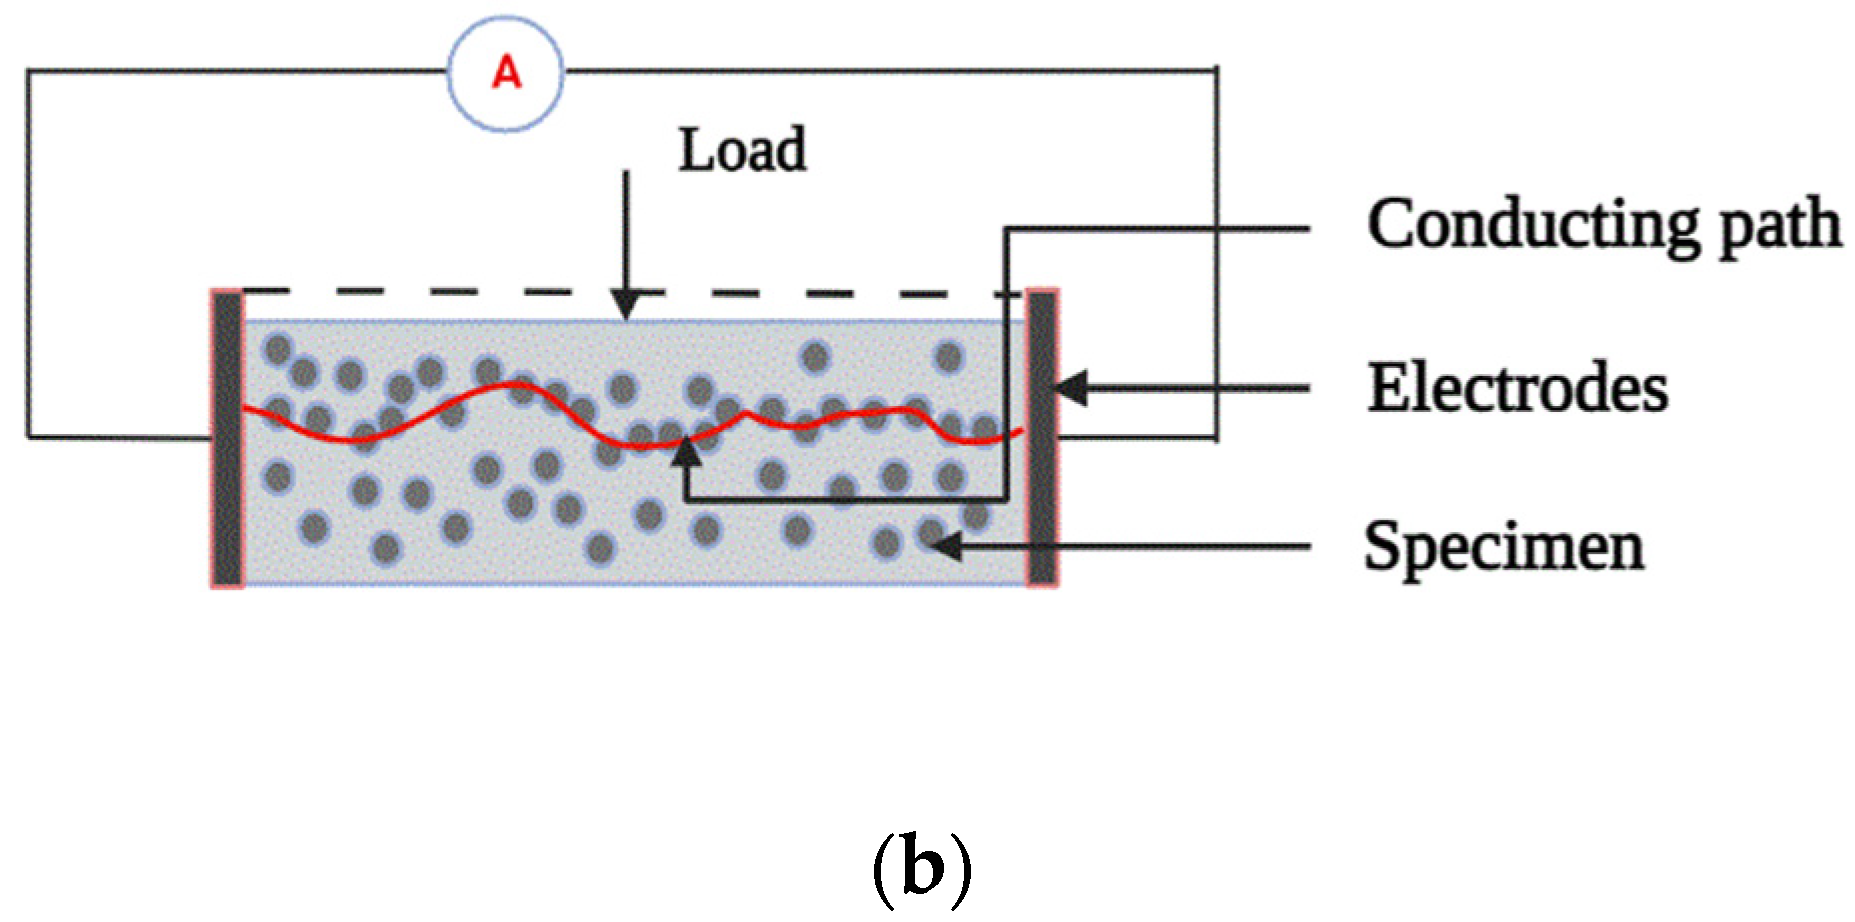
3. Electromechanical Mechanism
3.1. Piezoresistive Performance
3.1.1. Materials
- Conductive material:
- Non-conductive material:

| Conductive Material | Geometric Shape | Tensile Strength (GPa) | Elastic Modulus (GPa) | Aspect Ratio | Density (kg/m3) |
|---|---|---|---|---|---|
| Steel fibres (straight) [25] | Fibre (Micro filler) | 500 | 200 | 97.5 | 7850 |
| Steel fibres (twisted) [26] | Fibre (Micro filler) | 2428 | 200 | 100 | 7900 |
| Carbon nano fibre [27,28] | Particle (Micro filler) | 4900 | 230 | 100–500 | 1000 |
| CNT [29] | Particle (Nano filler) | 11 | 300–1000 | ~1000 | 50–150 |
| Nano graphene platelets [30,31] | Particle (Nano filler) | 5000 | 1000–2000 | 50–300 | 1800 |
| Carbon black [31,34] | Particle (Nano filler) | 2000–2400 | - | 120 | 1800–2100 |
3.1.2. Sensing Theories
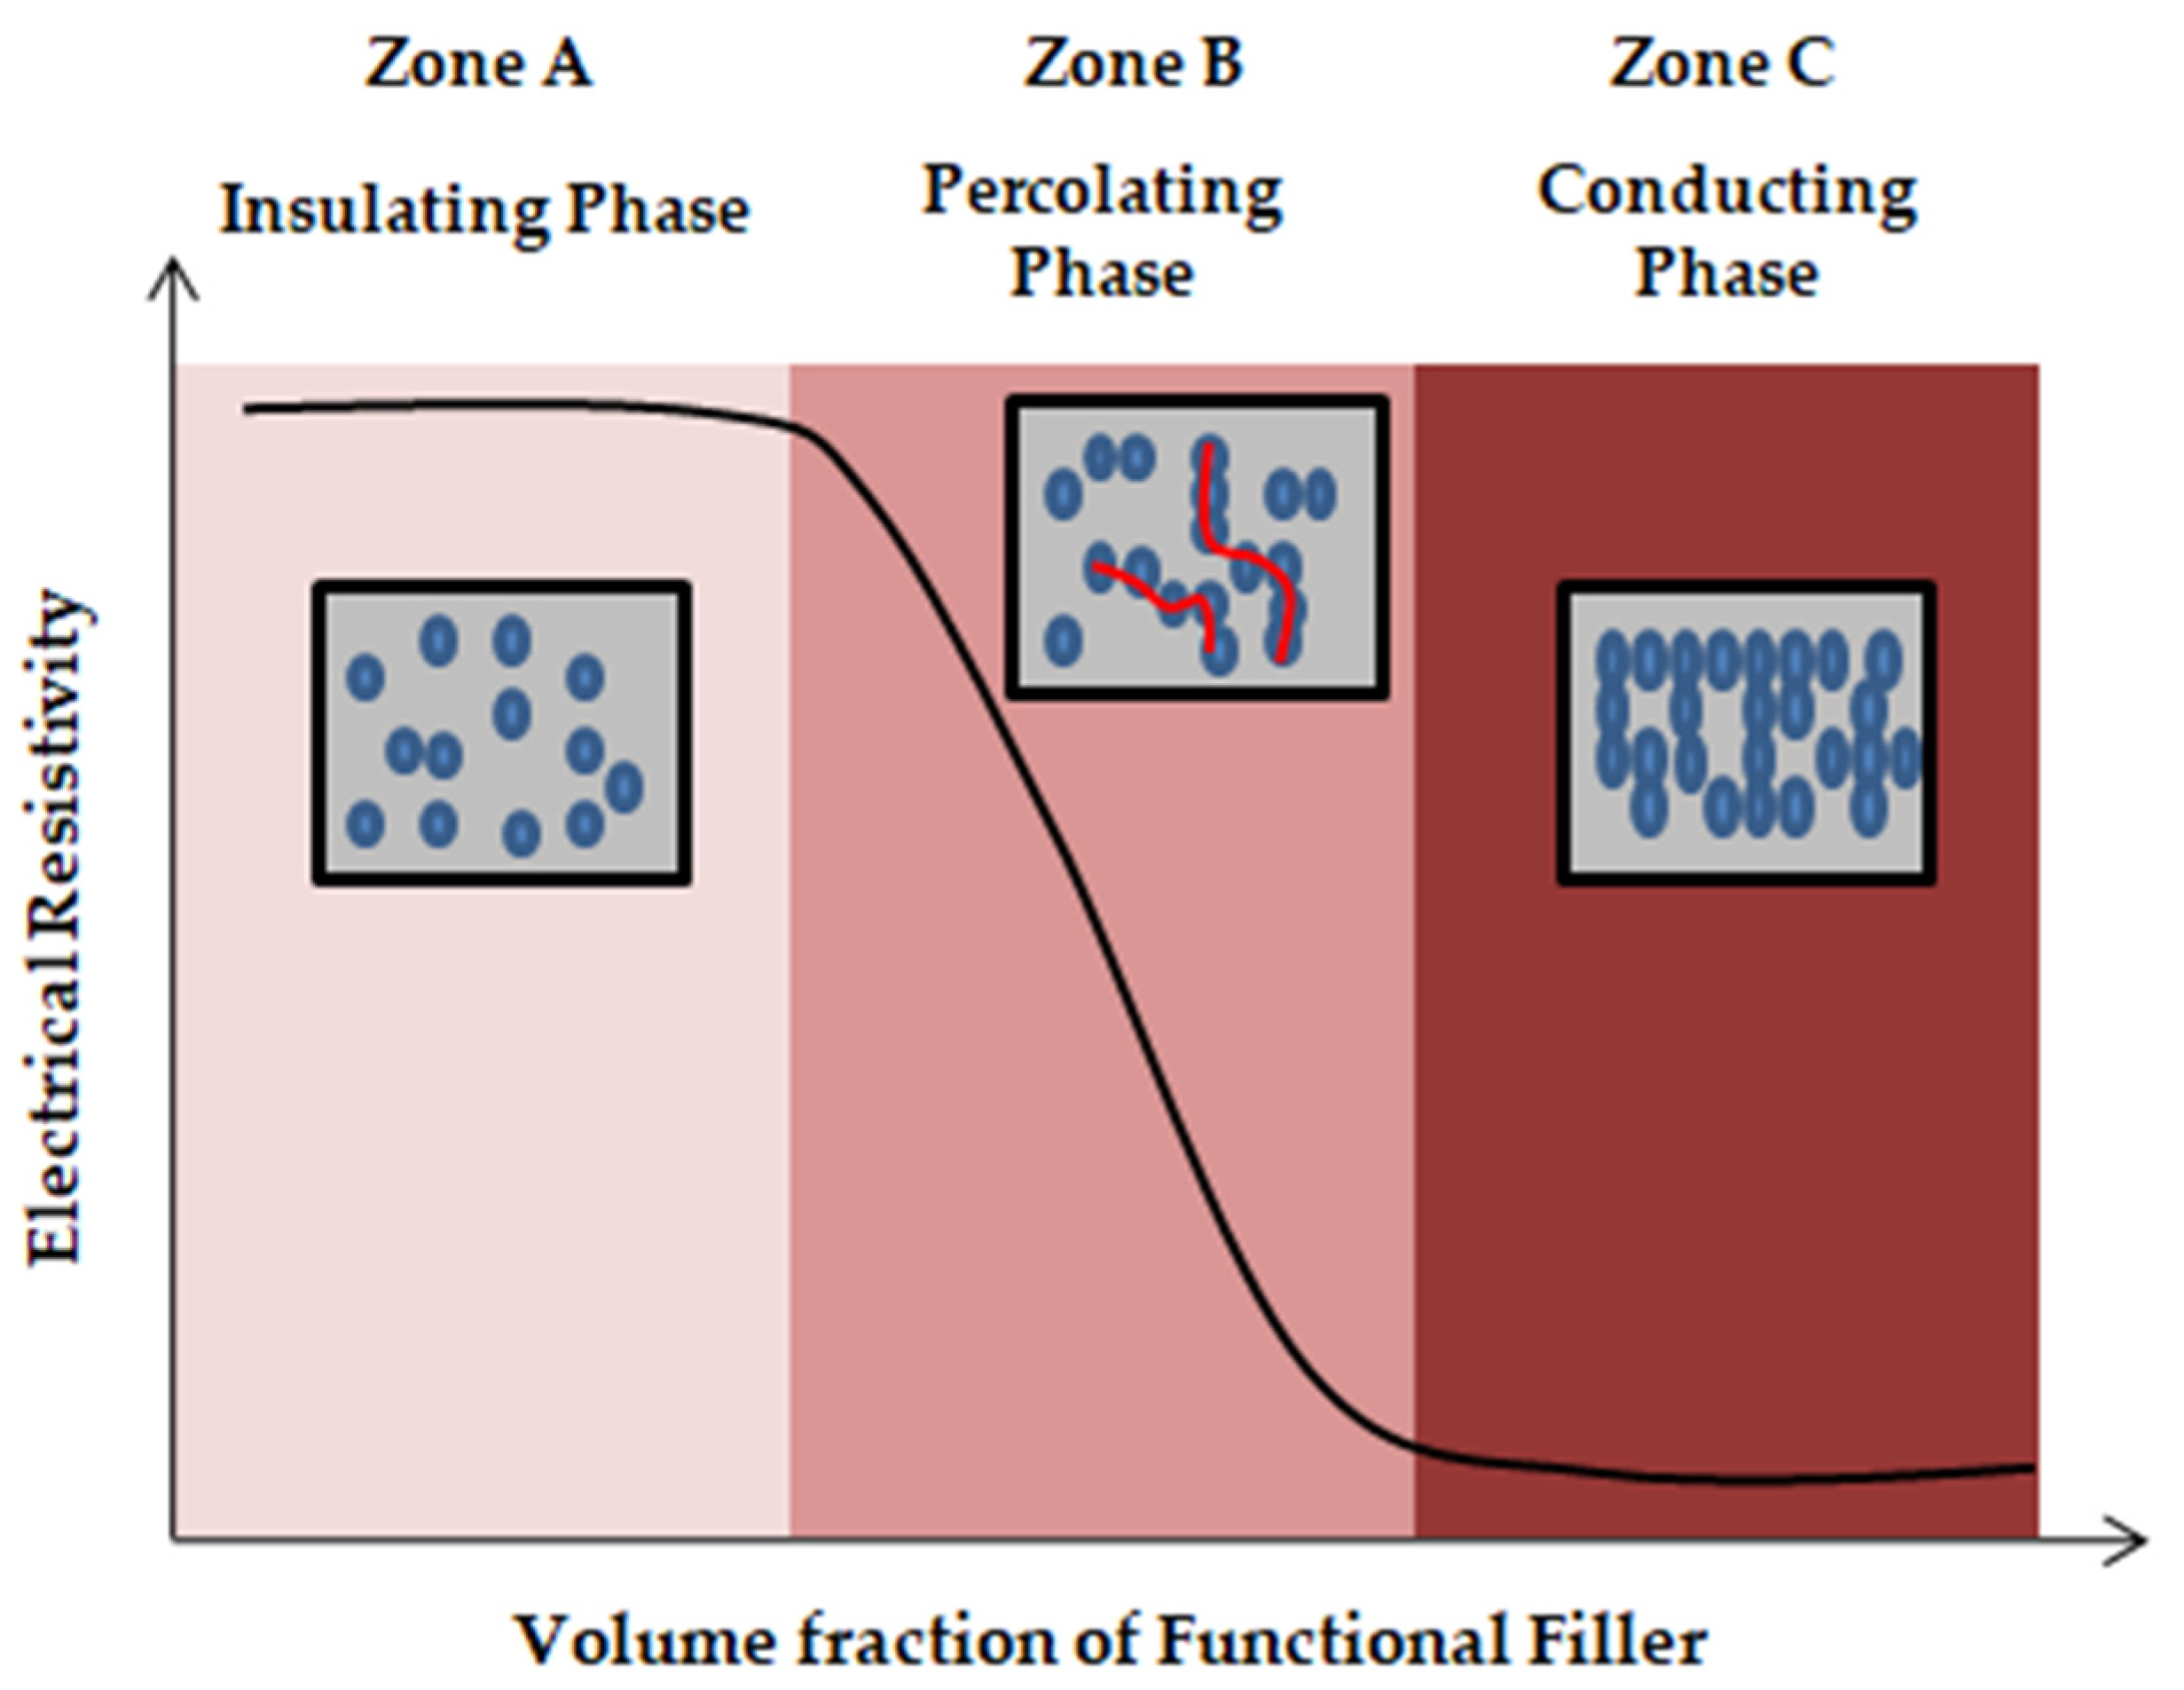
- Percolation theory
Parameters Influencing Percolation Threshold
- Filler Geometry:
- Filler and matrix properties:
- Filler Concentration:
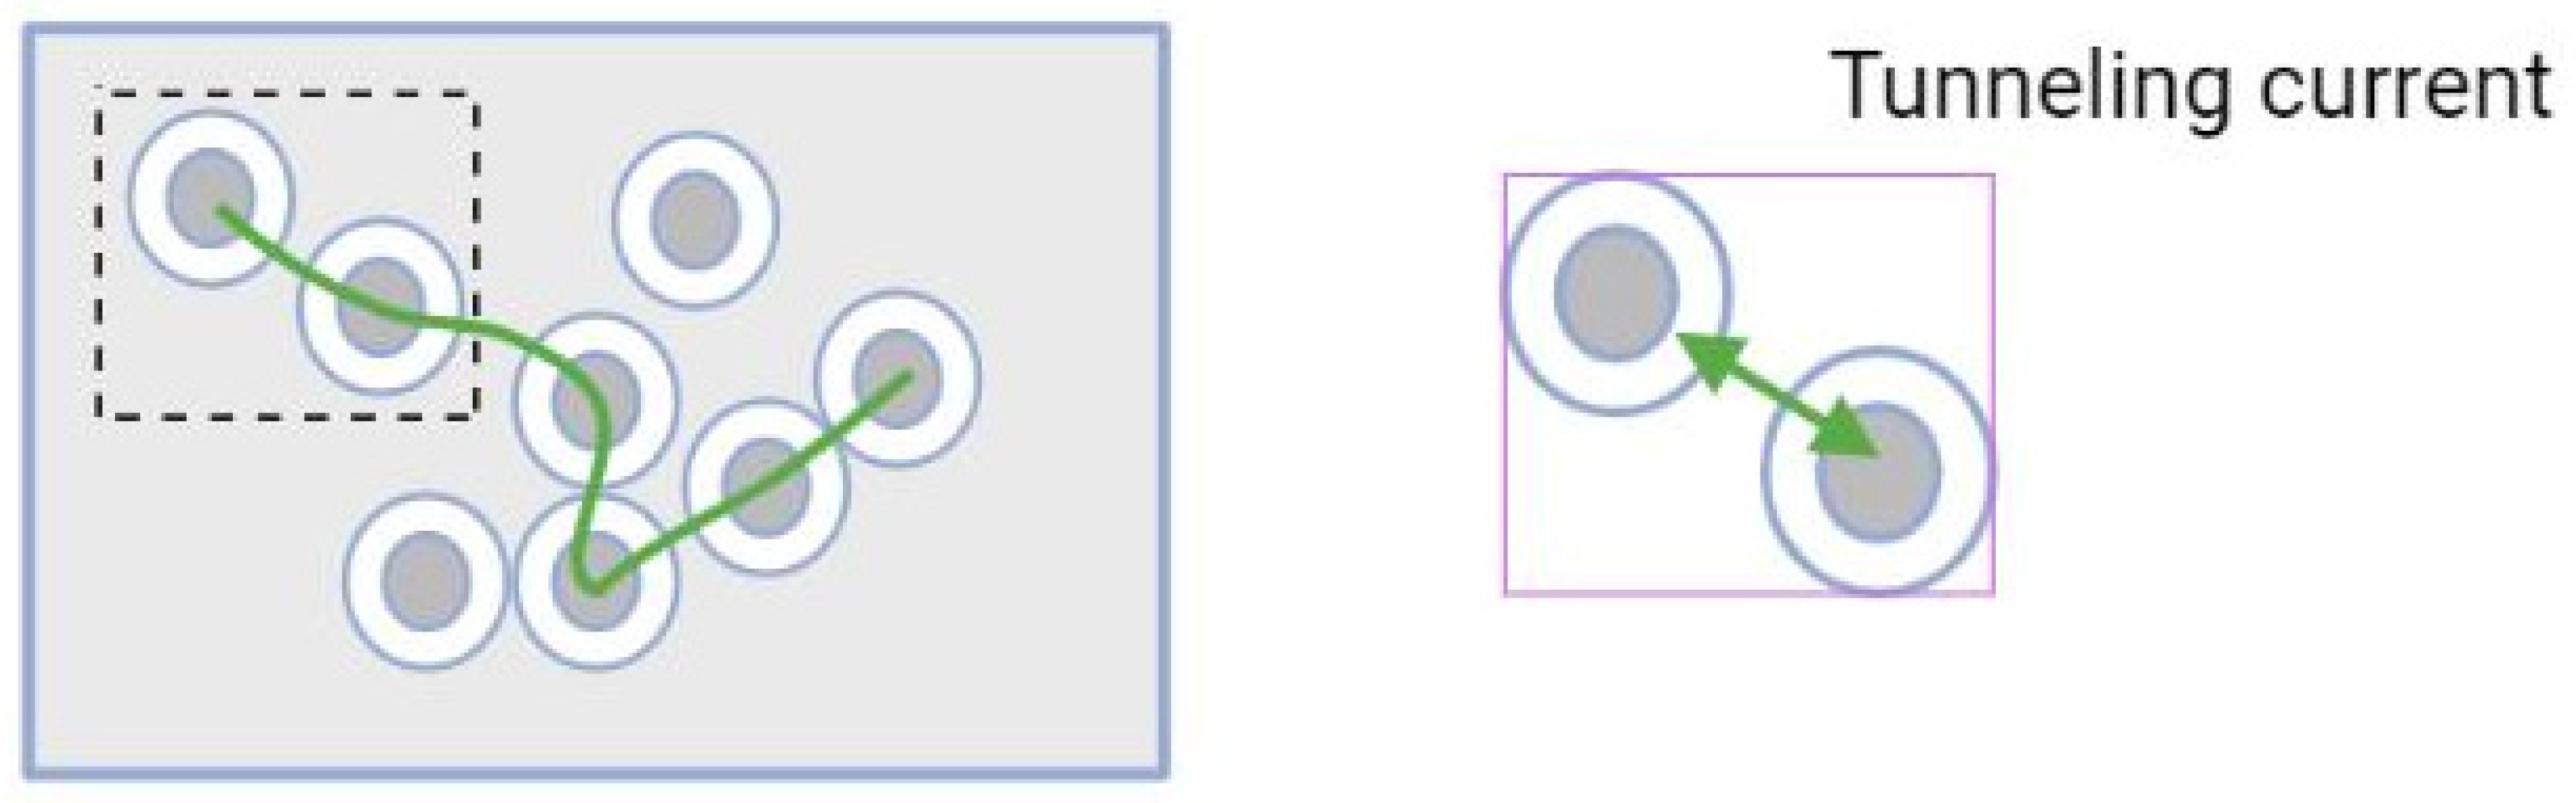
- Field emission effect:
3.1.3. Sensing Techniques and Measuring Parameters
- Sensing technique
- Measuring parameters:
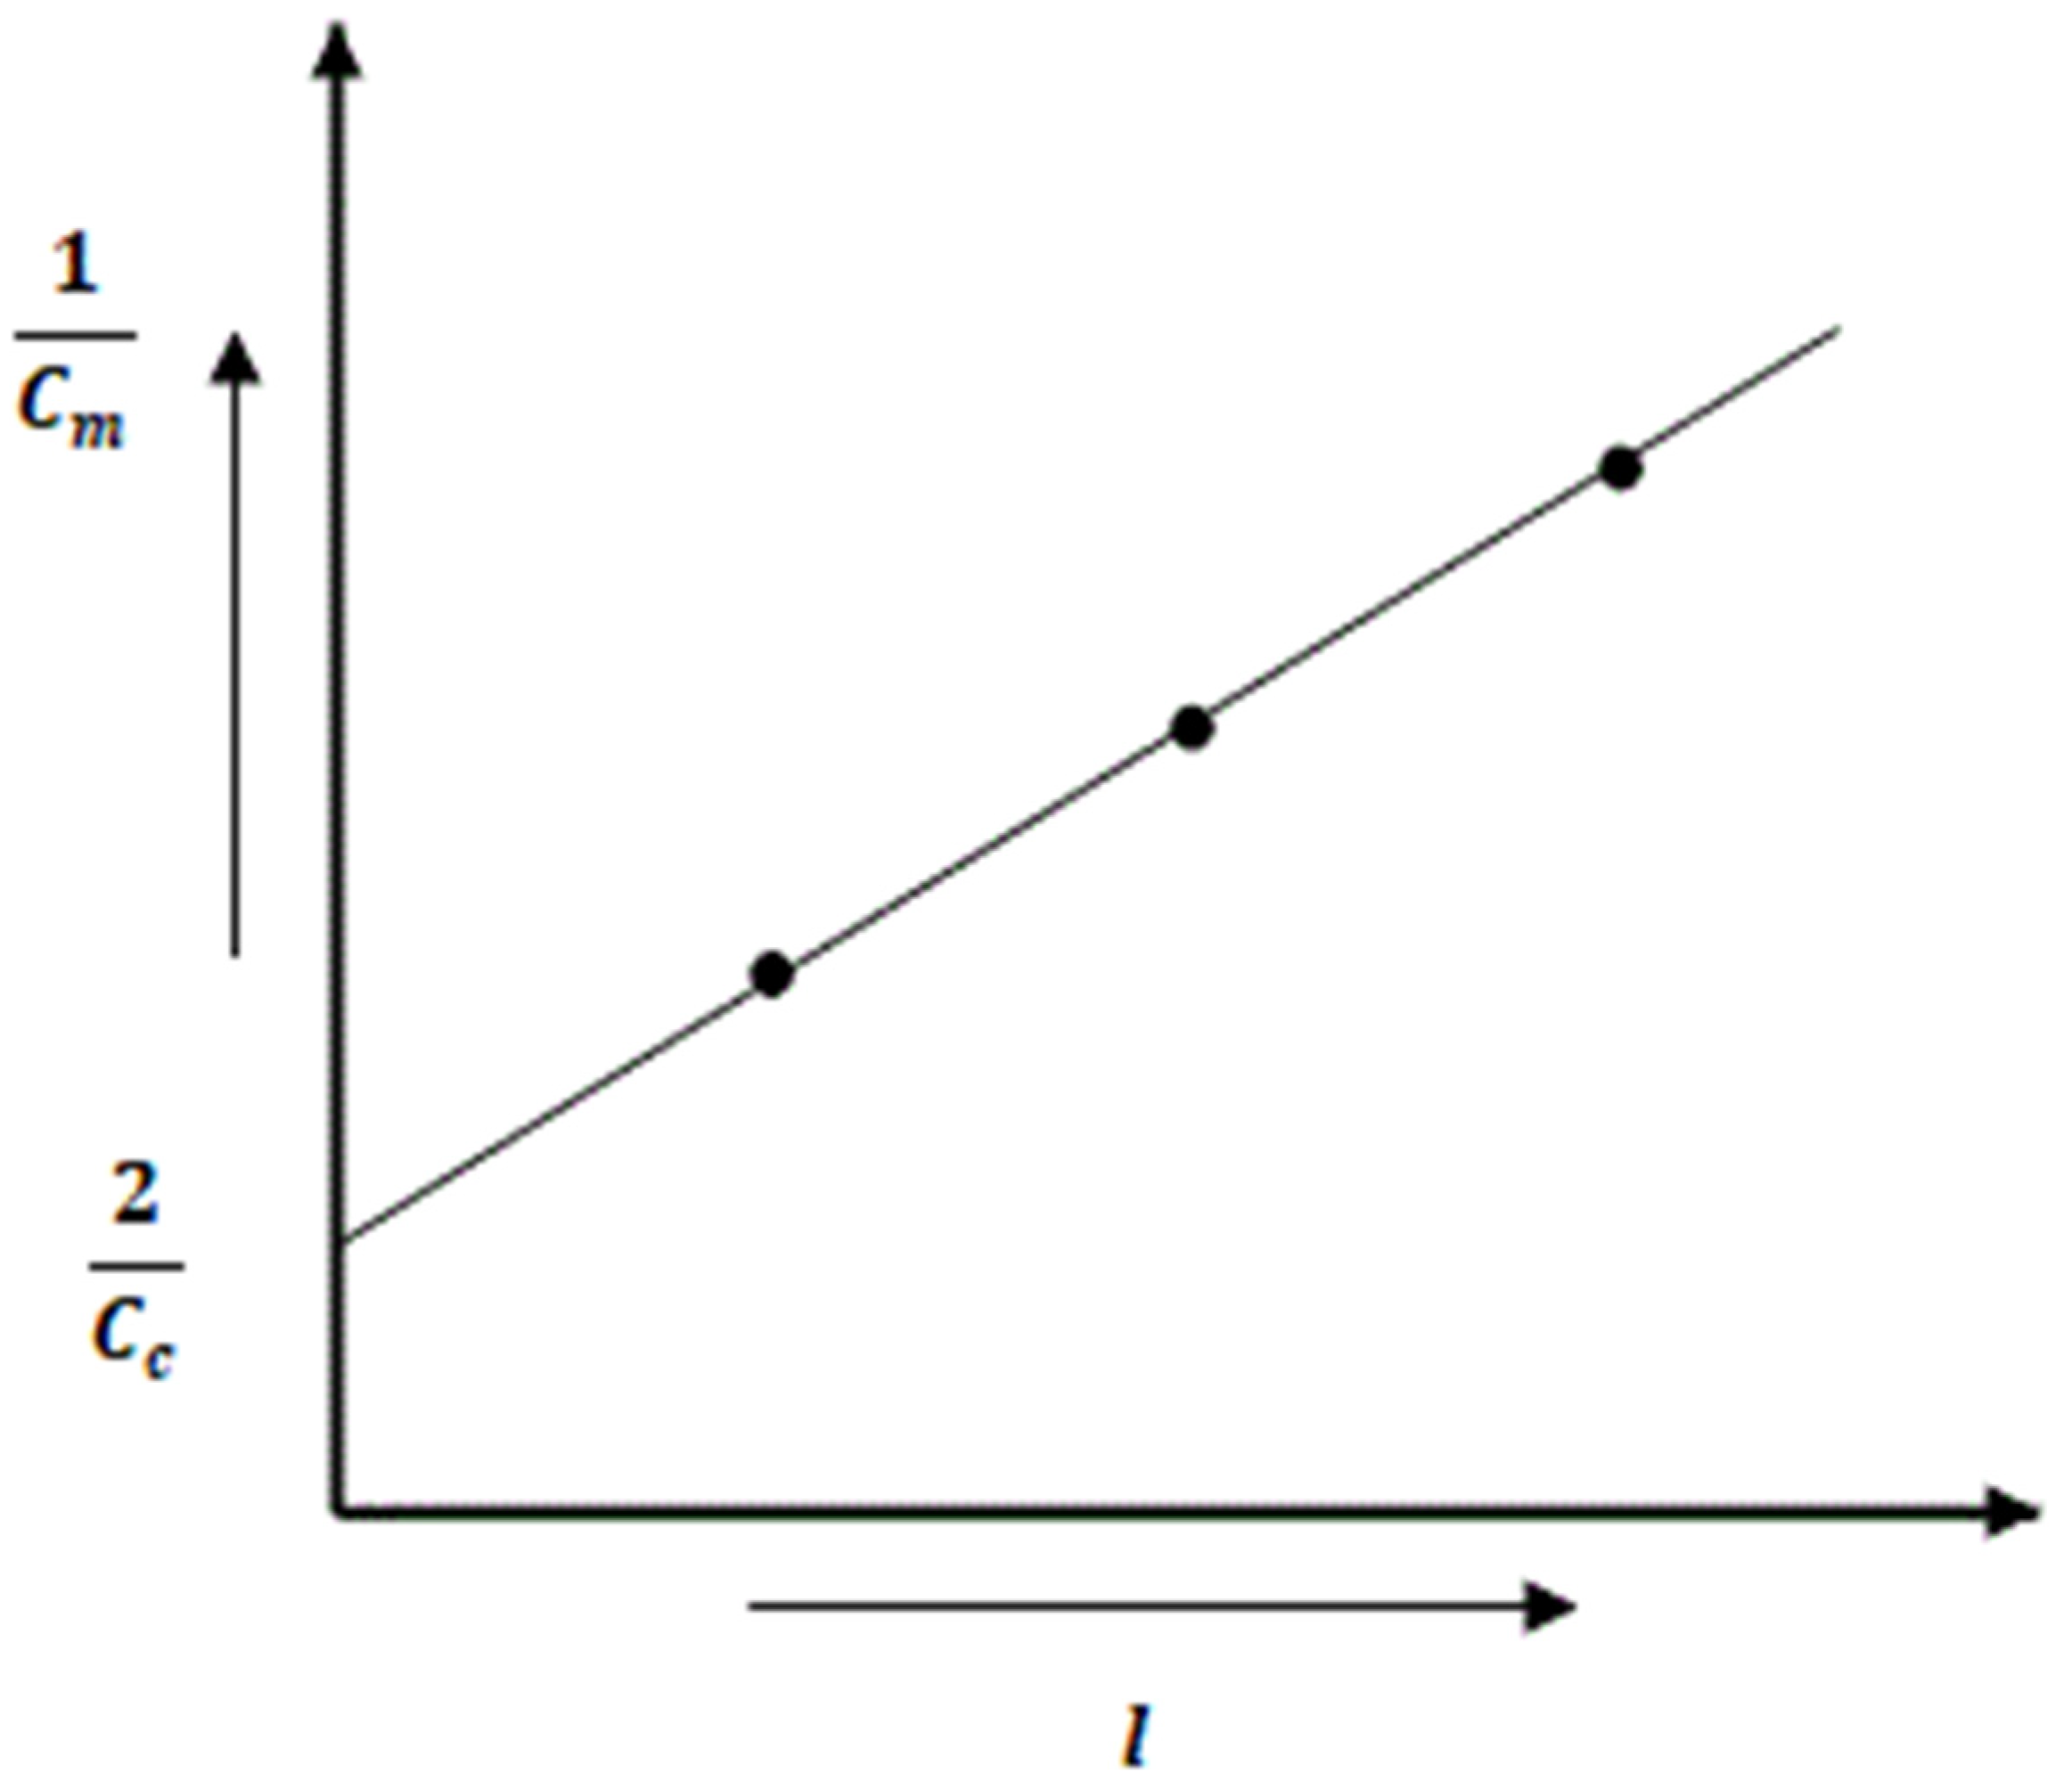
3.2. Piezopermittivity
3.2.1. Materials
3.2.2. Sensing Theory
- Sensing method:
- Measurement technique:
- Sensitivity measurement:
3.3. Influencing Parameters
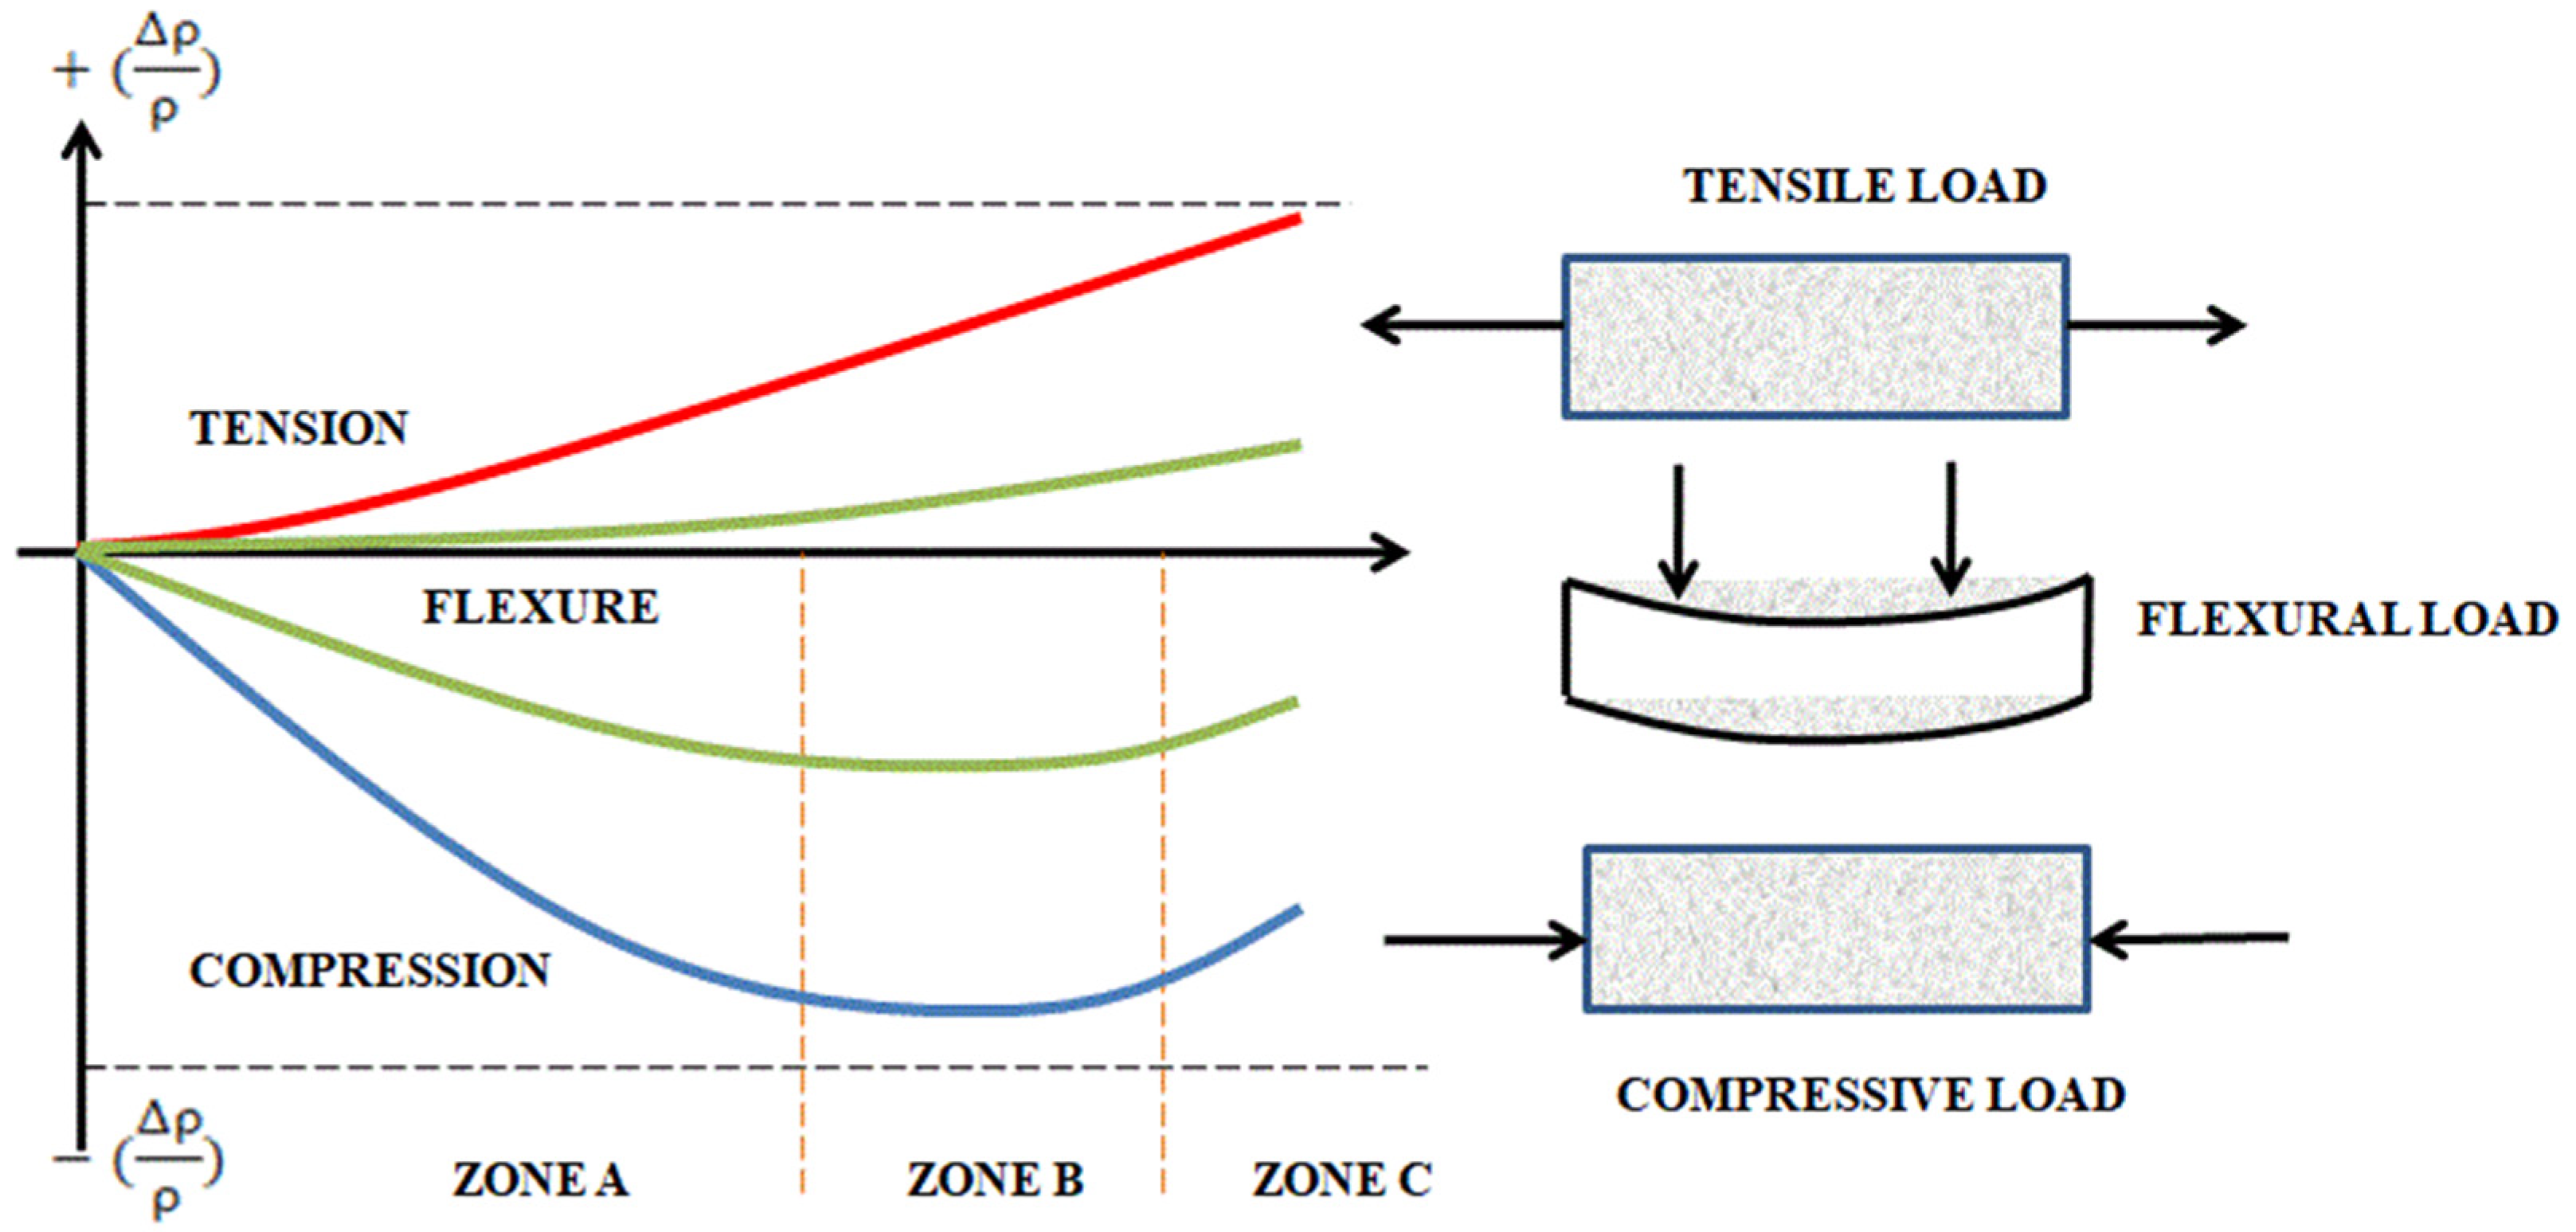
- Loading condition:
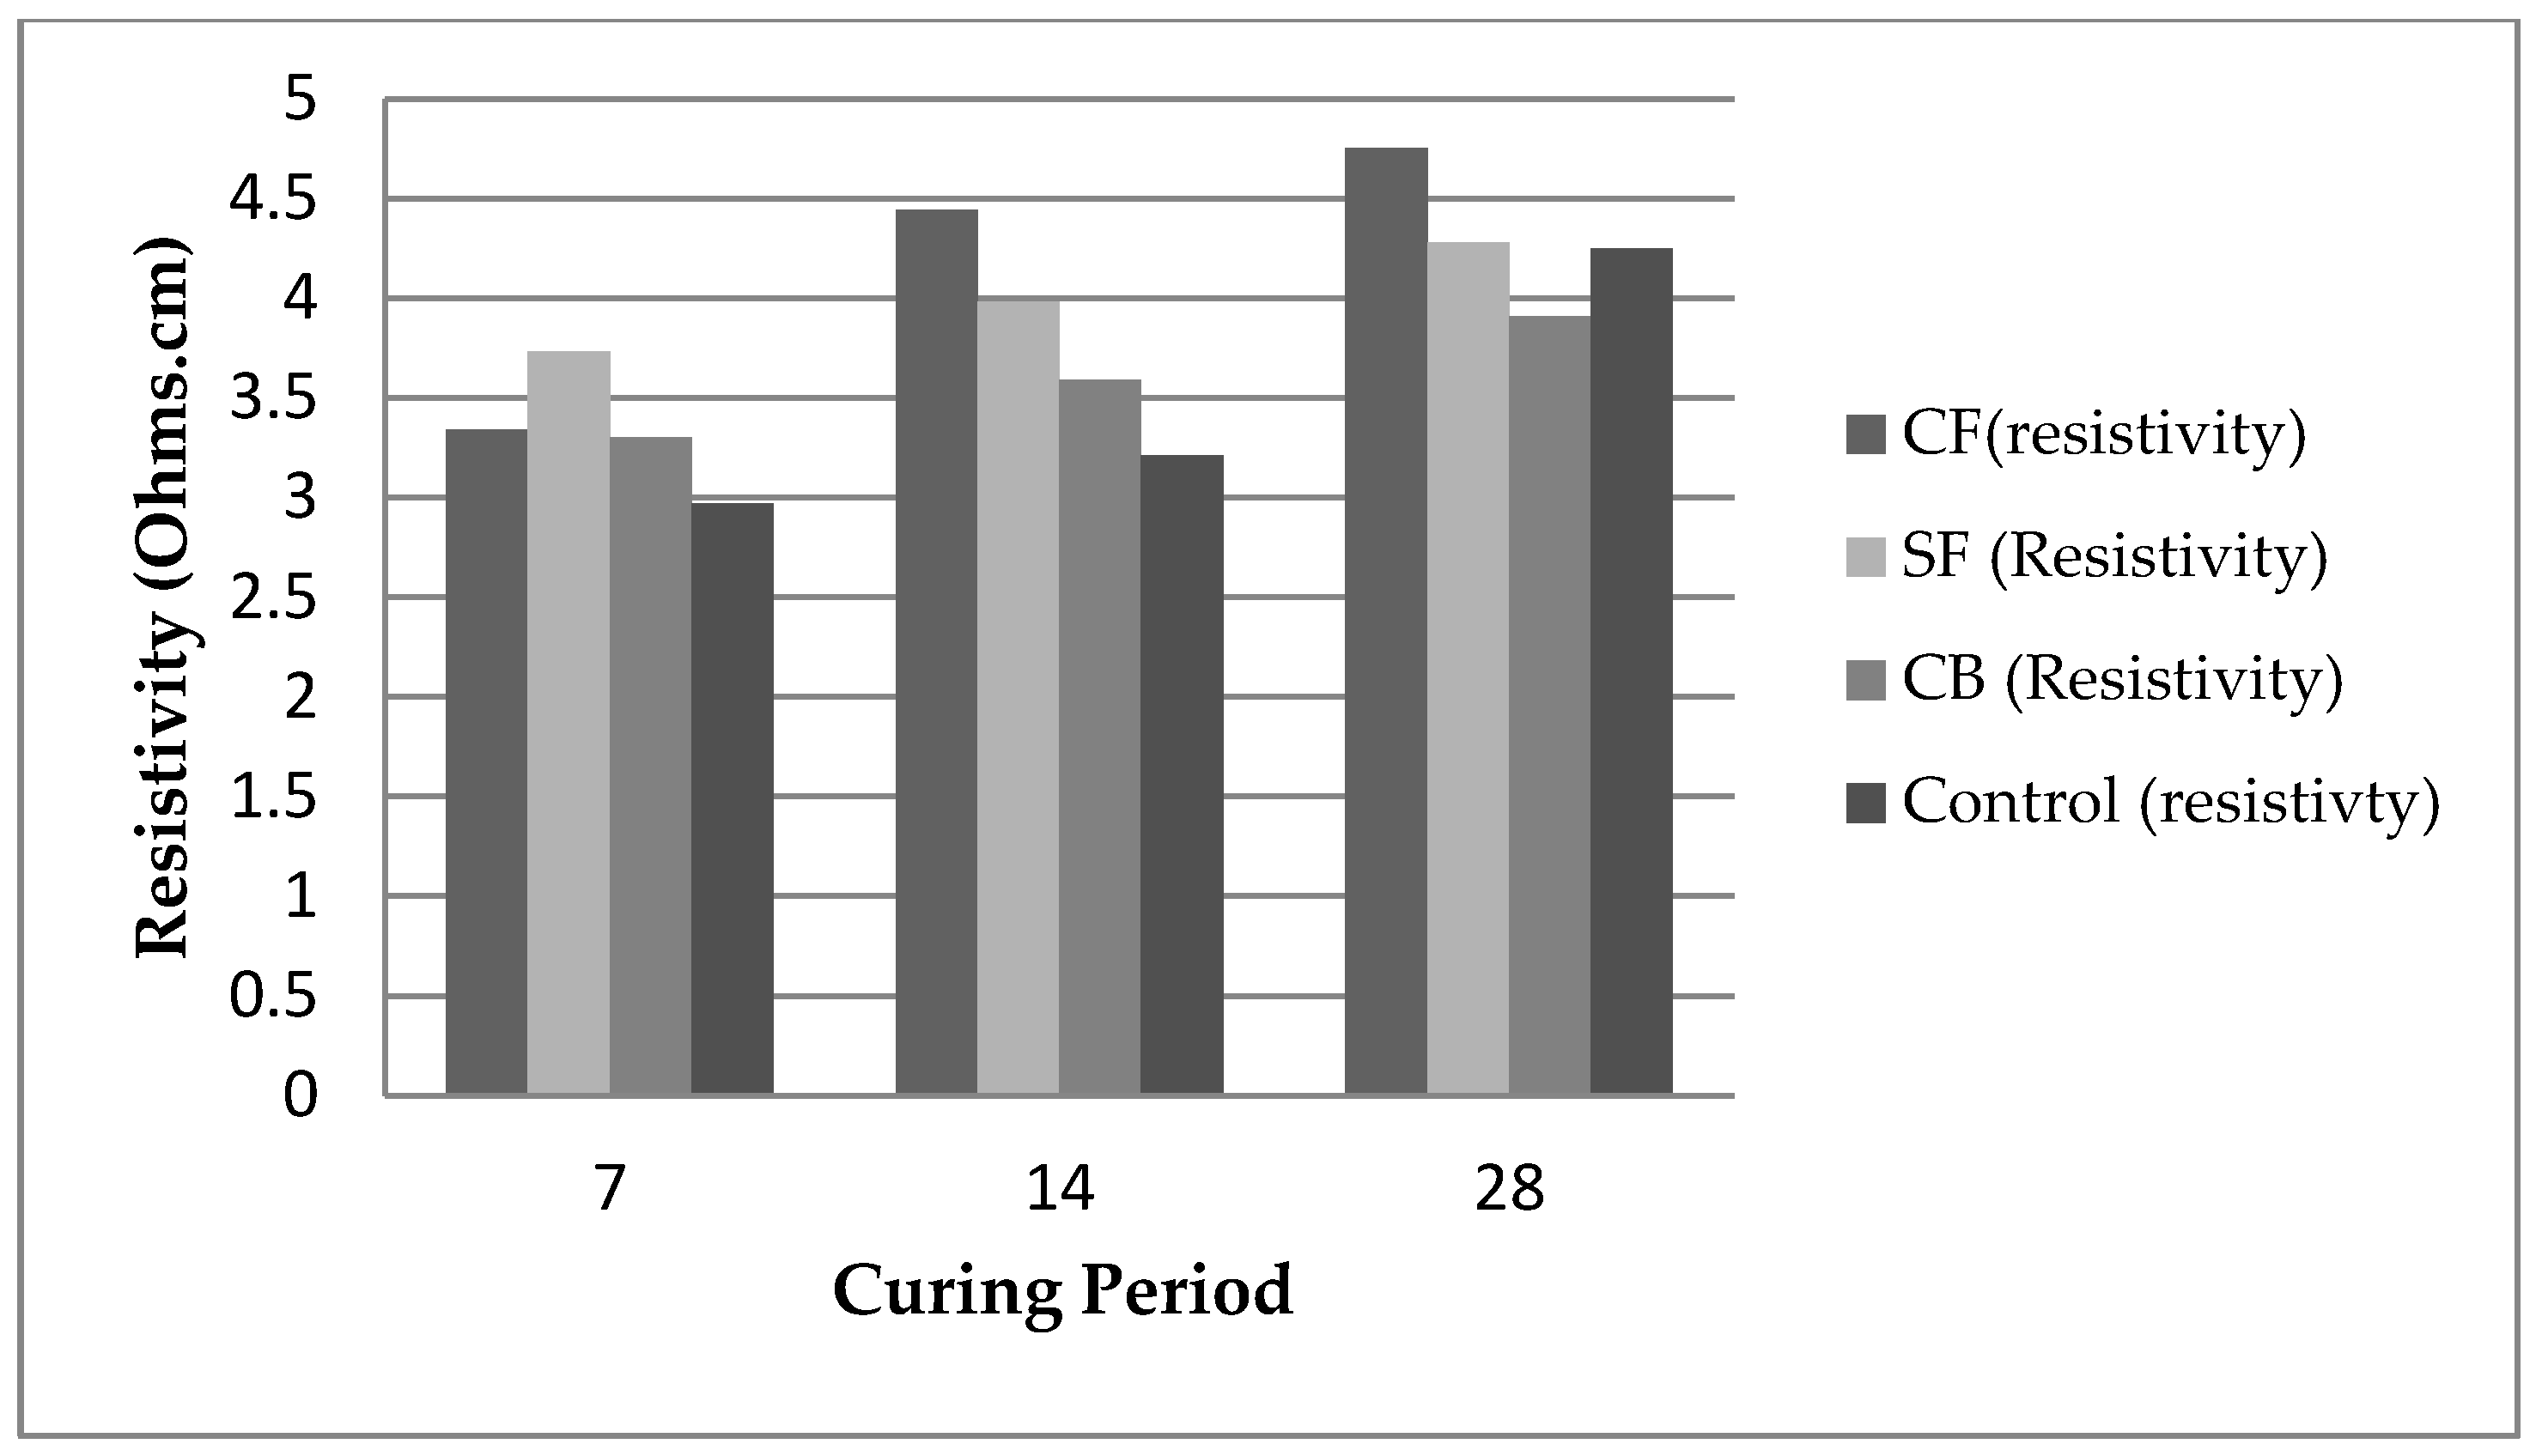
- Curing age:
- Dispersion of filler material:
- Other influencing factors:
4. Electrochemical Principle
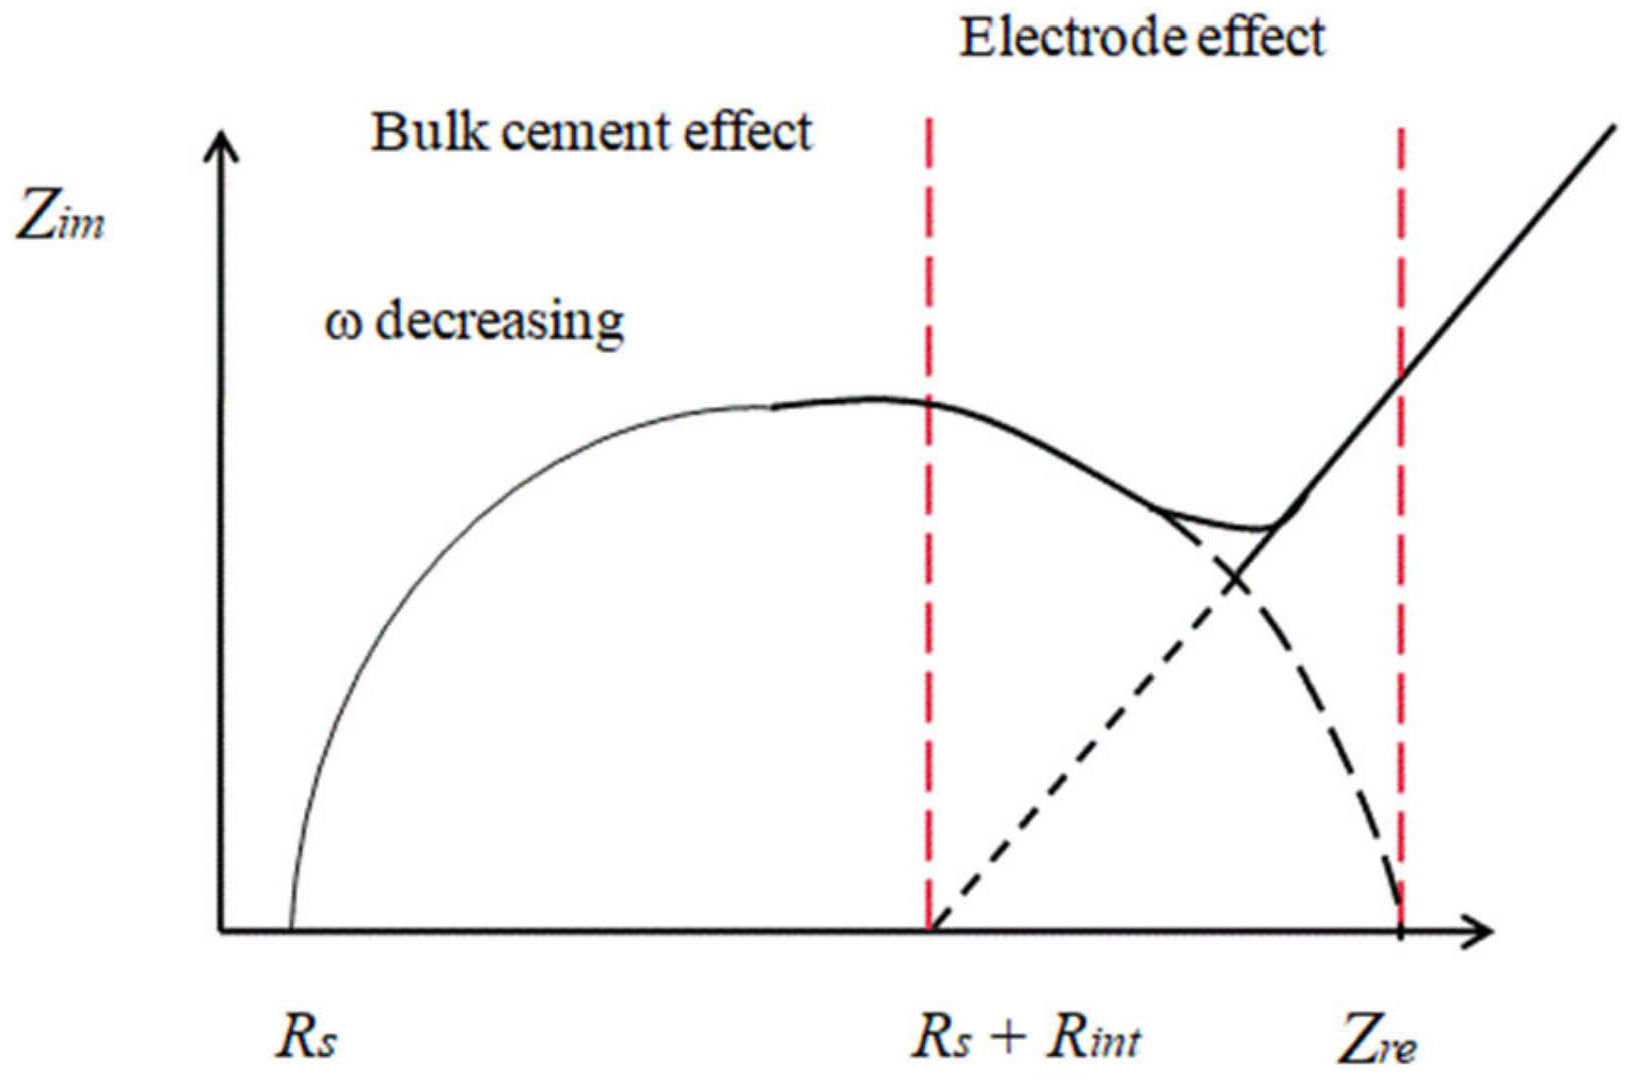
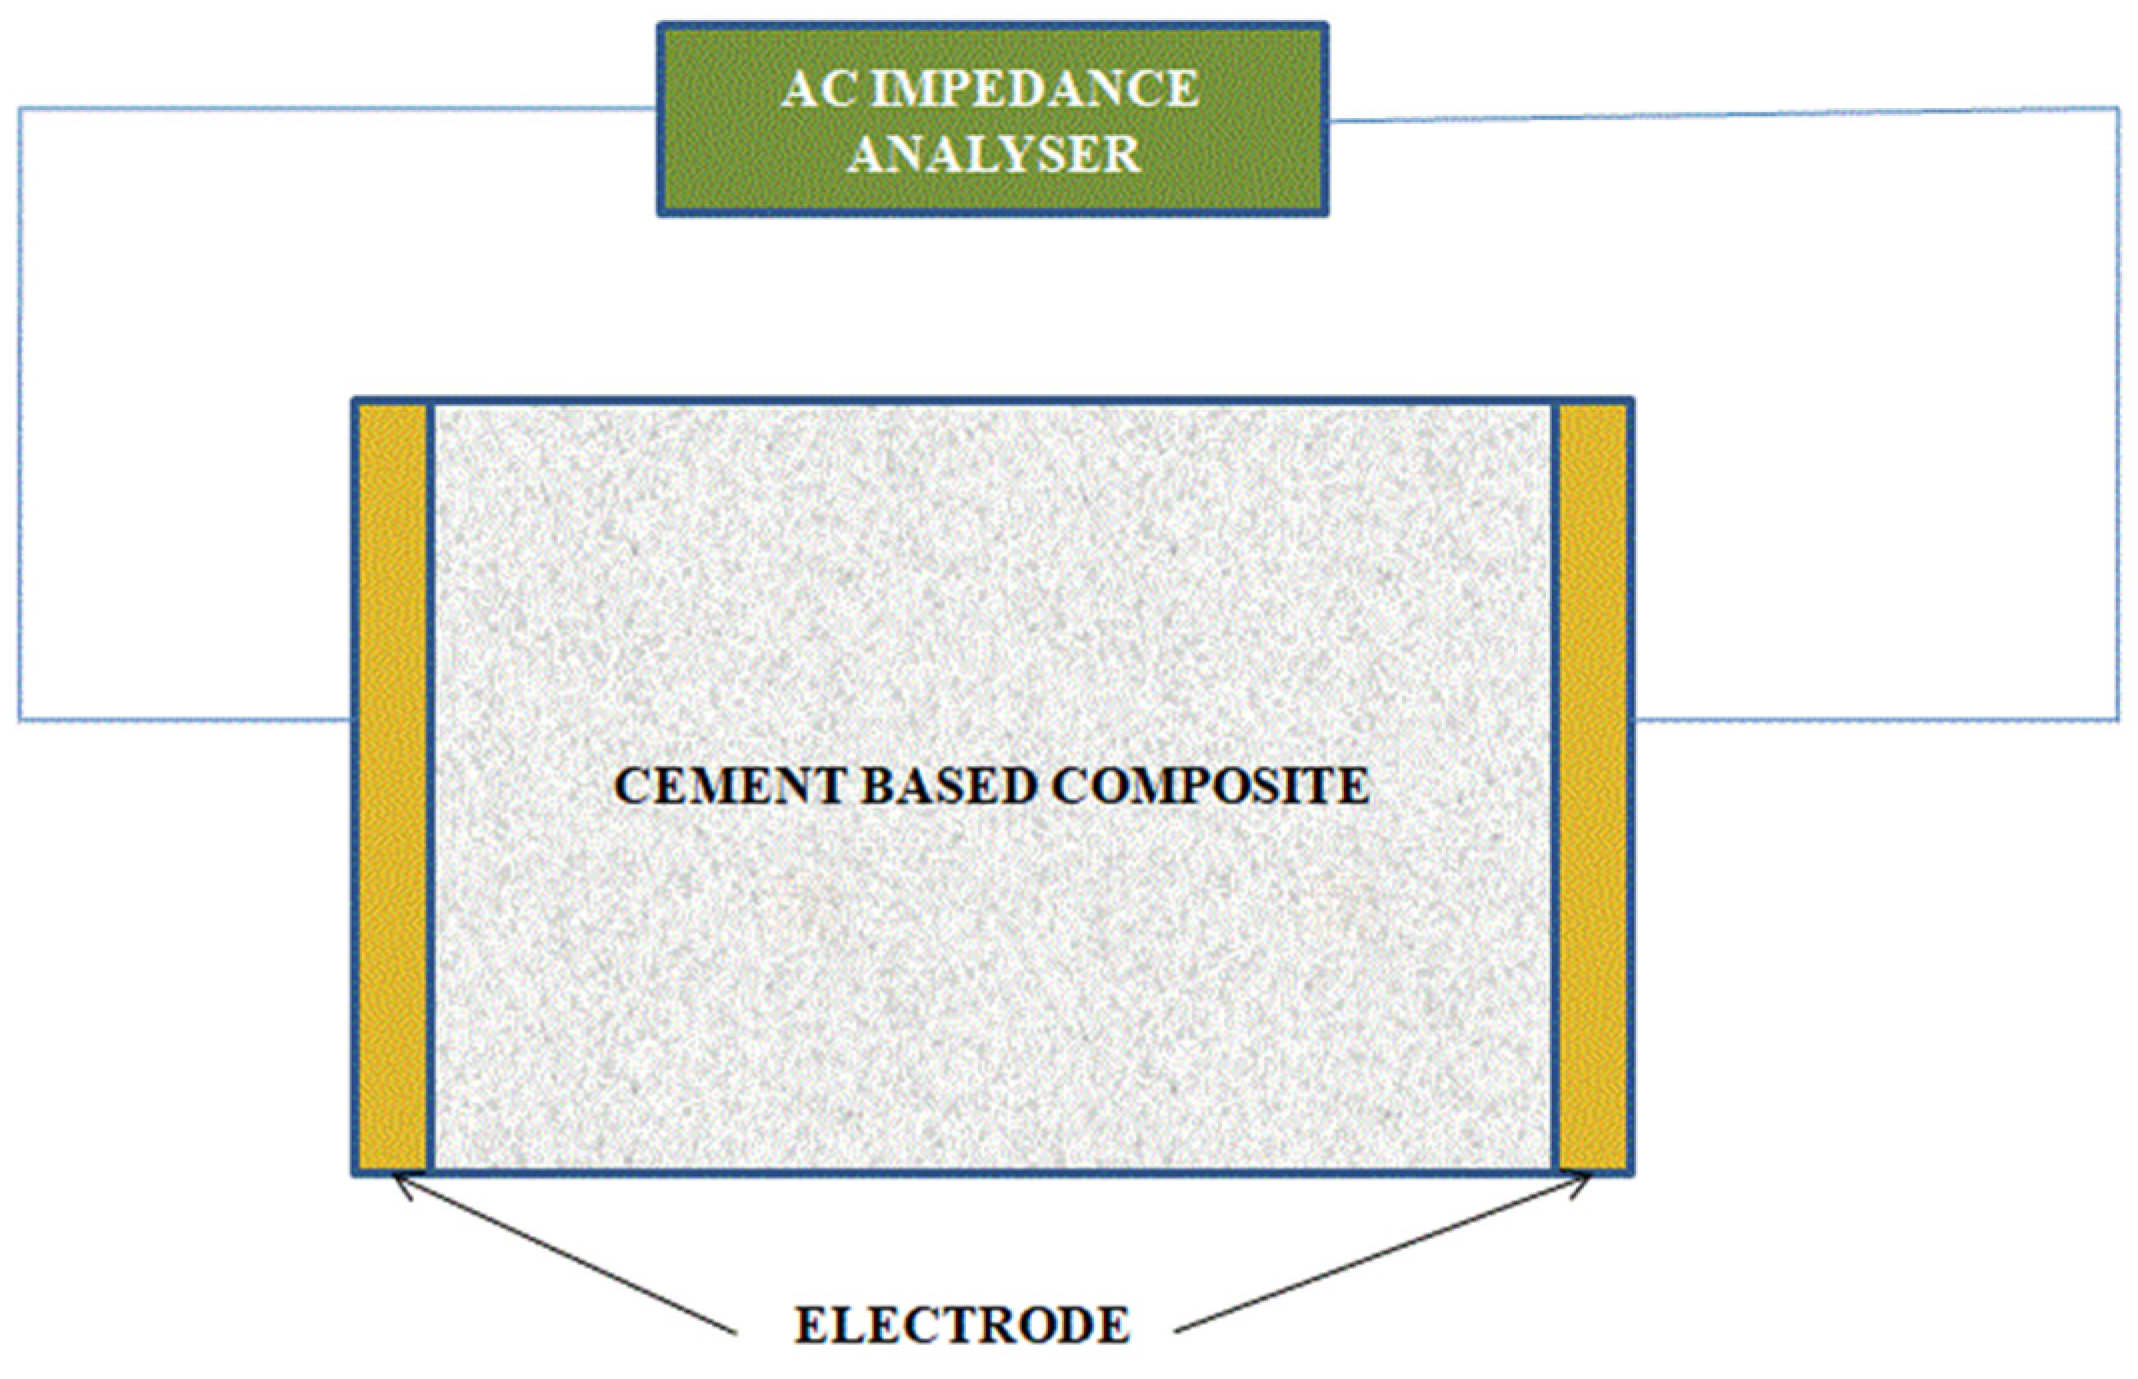
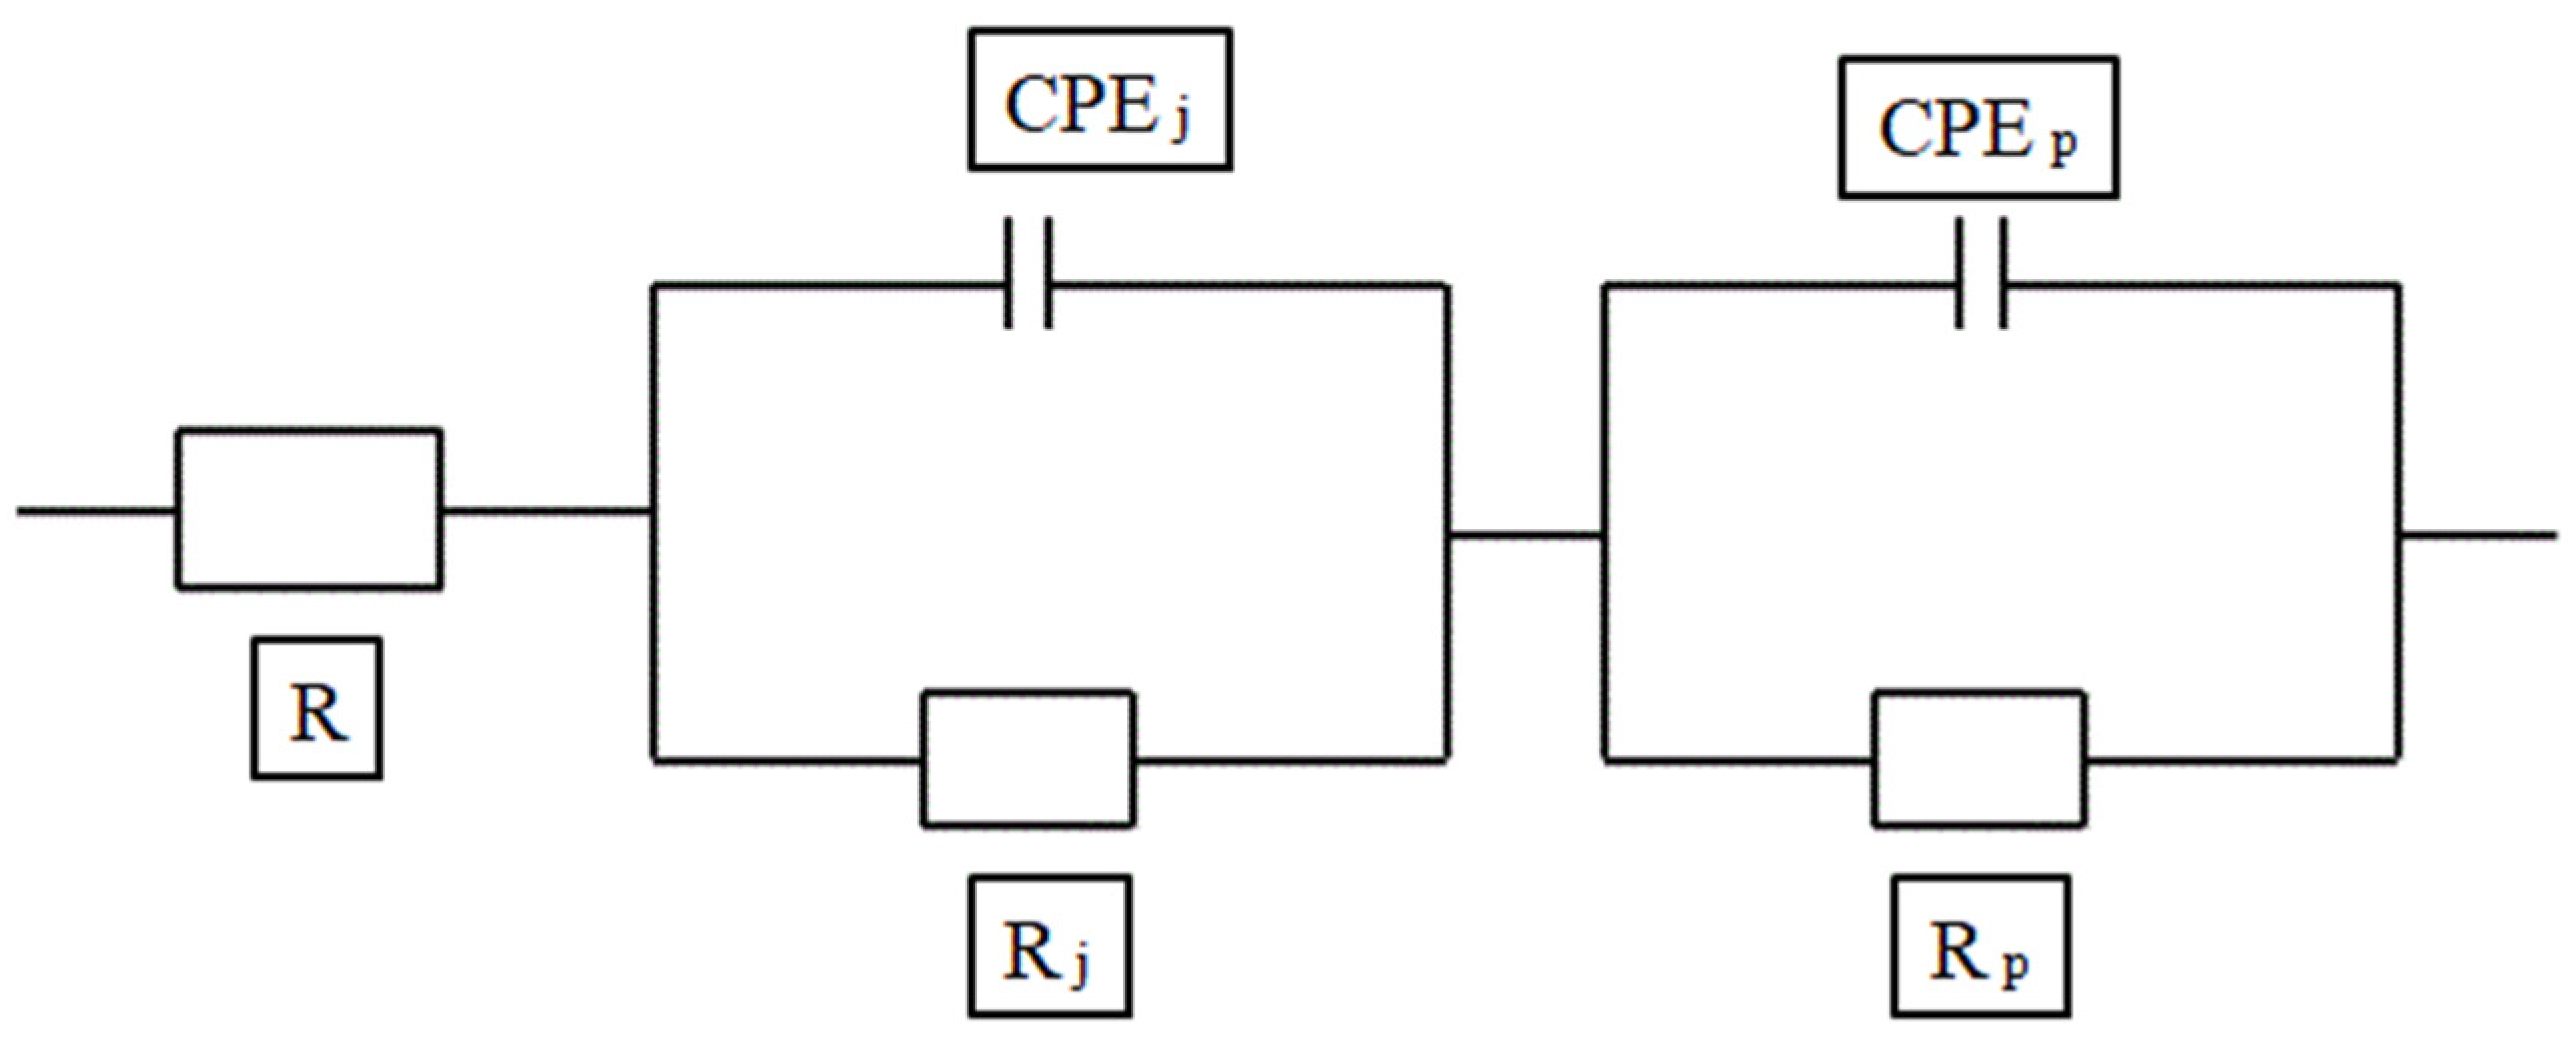
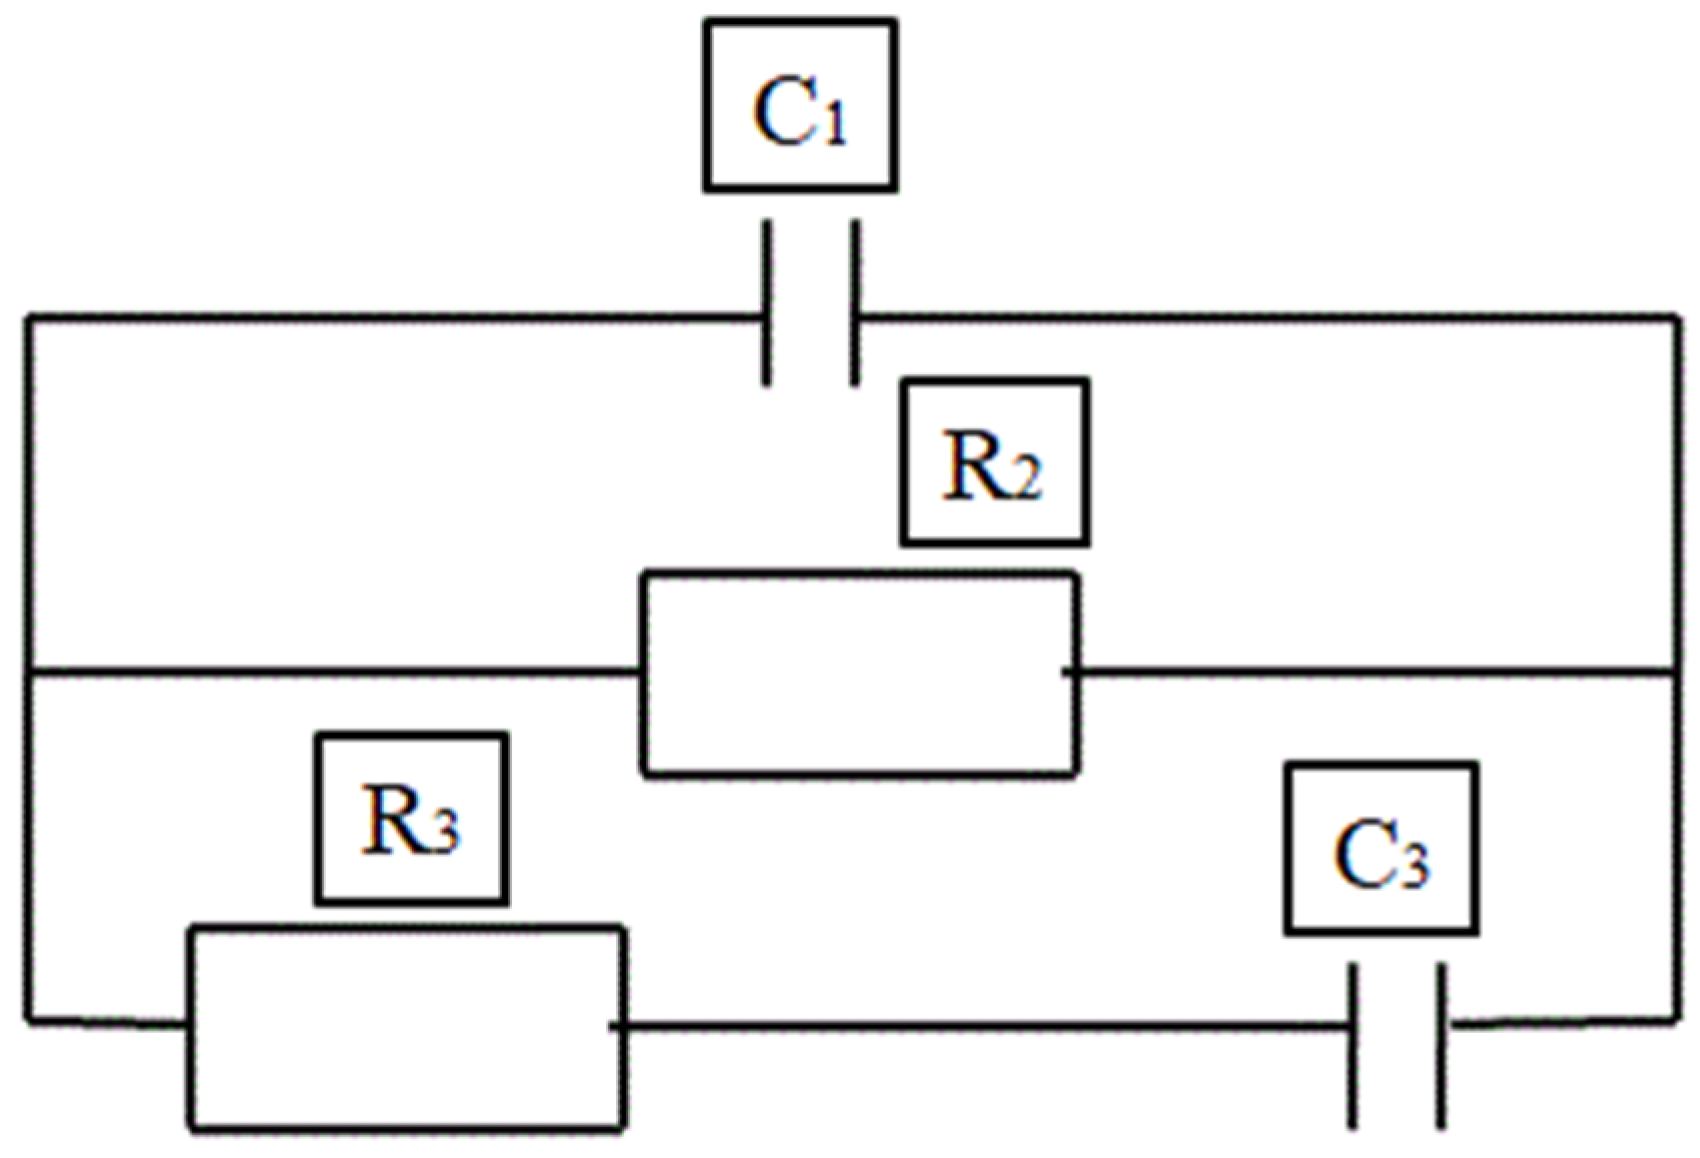
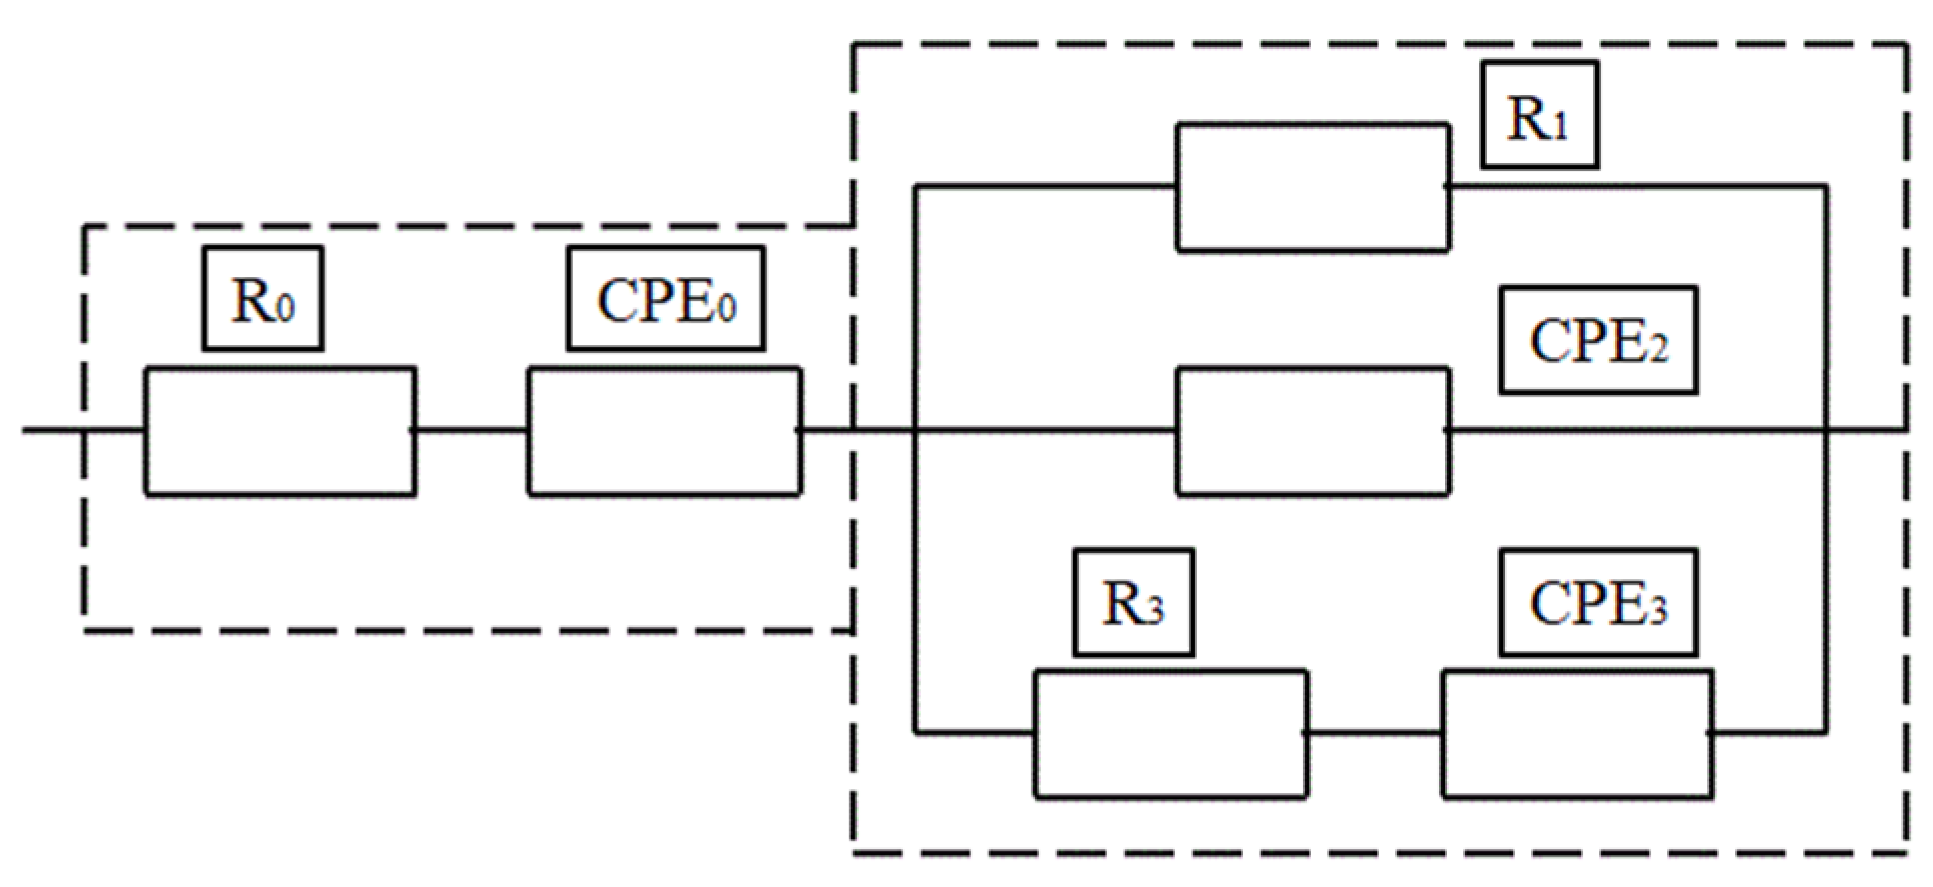
4.1. Alternate Current-Impedance Spectroscopy
4.2. Equivalent Circuit Model
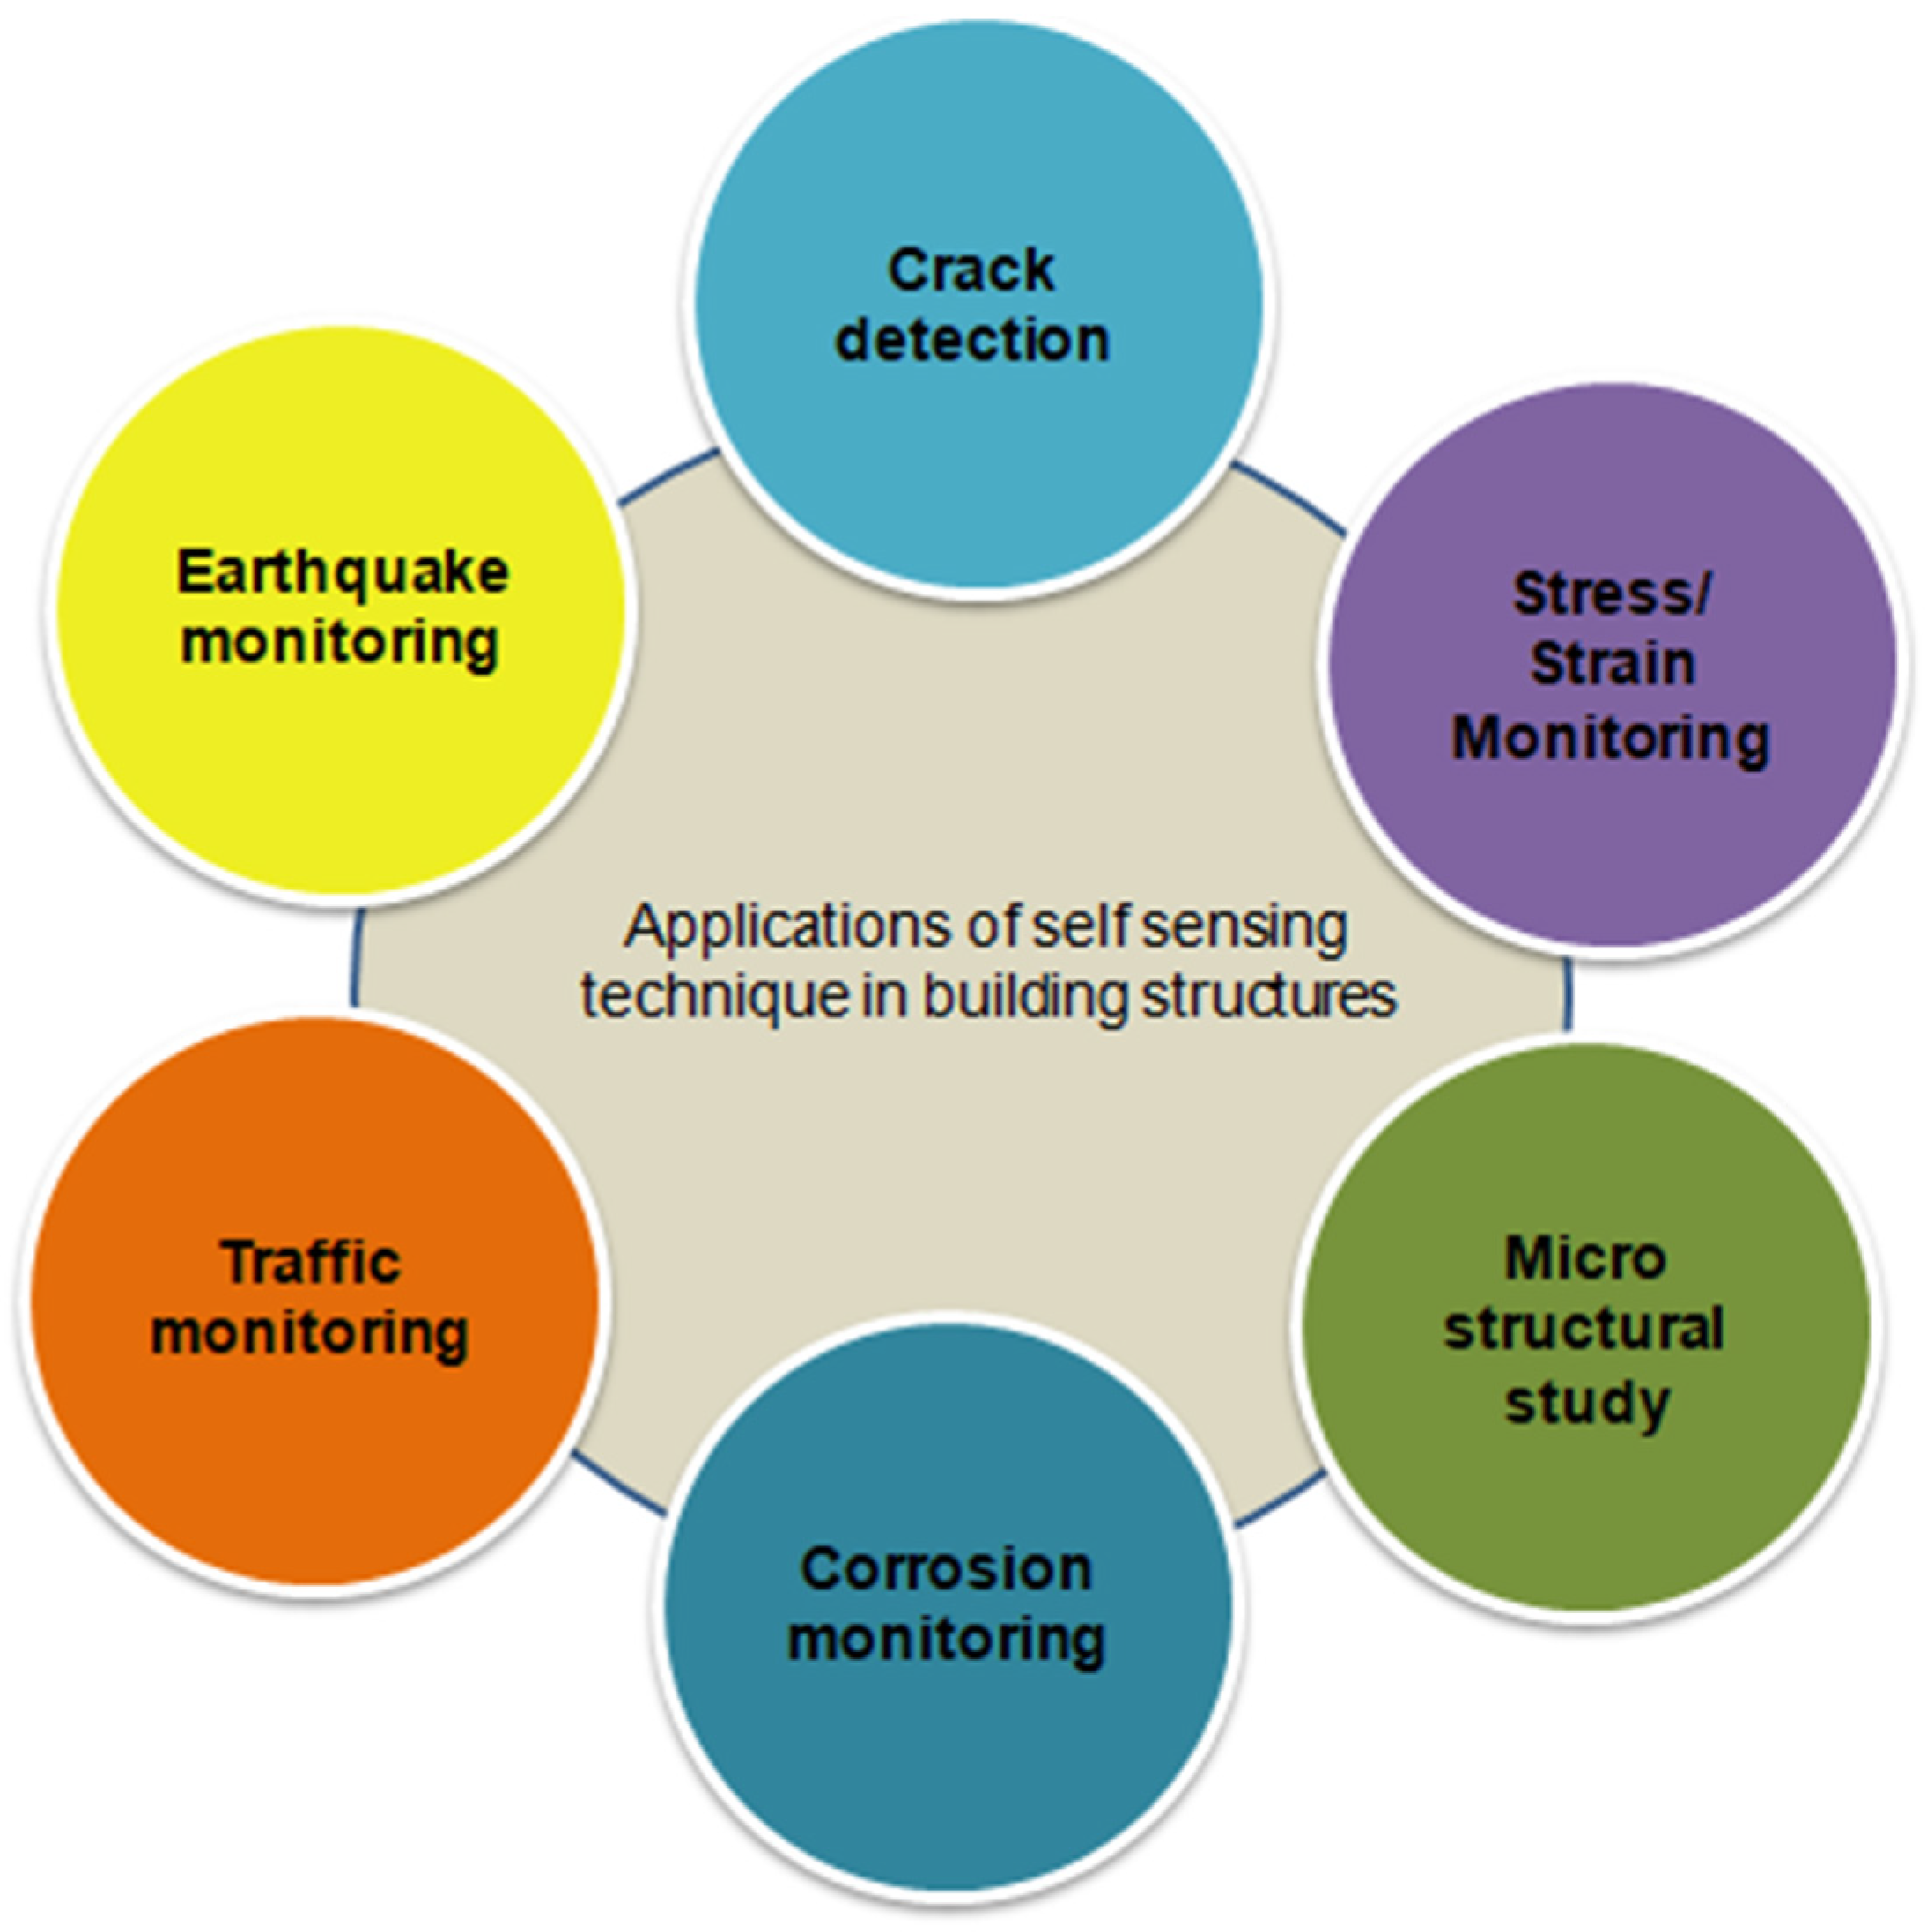
5. Applications
- In the bulk form, the structure is developed entirely using self-sensing materials, which both satisfies the structural health monitoring parameter and also strengthens the structure. It is easy to construct but economically expensive.
- Coated type—the non-conductive material is coated with a conductive or self-sensing medium. It provides both strength and sensitivity to the composite.
- Sandwiched type—involves covering the composite on the top and bottom surfaces using the conductive medium.
- Bonded type—The self-sensing sensors are attached over the surface of the composite.
- Embedded type—performed by inserting a self-sensing sensor inside the concrete composite. The sensors are typically as small as or slightly larger than the size of the conventional coarse aggregates.
6. Discussion
- Electromechanical principle—the piezoresistive and piezopermittivity techniques were the focus. The filler material plays a major role in the conductivity and the piezoresistivity. The filler should not be less or more than the percolating value. The conducting mechanism depends on the tunnelling theory, where the electron transfer occurs when the filler particle gets overlapped. The four-probe method is more suitable for measuring the sensitivity parameters, but there are some complications in measuring due to the instrumental setup, whereas in the piezopermittivity method, the filler material is unnecessary for the conducting mechanism. The electrodes are replaced by a dielectric medium, the measuring technique becomes easier and the method becomes more economical due to the absence of conducting fillers. However, this technique fails to give an accurate sensing result.
- Electrochemical principle-based method—focused on AC impedance spectroscopy techniques. Various electrical circuit models were established to determine the pore structure, fibre orientation, corrosion monitoring and chloride migration. The recently developed method gives more accurate results for the sensing parameters.
7. Scope for Future Work
Author Contributions
Funding
Institutional Review Board Statement
Informed Consent Statement
Data Availability Statement
Acknowledgments
Conflicts of Interest
References
- Ou, J.P.; Li, H. Structural health monitoring in mainland china: Review and future trends. Struct. Health Monit. 2010, 9, 219–231. [Google Scholar]
- Kumar Mehta, P.D.P.; Monteiro, P.J.M. Concrete Microstructure, Properties, and Materials; McGraw-Hill Education: New York, NY, USA, 2014. [Google Scholar]
- Hall, S.R. The effective management and use of structural health data. In Proceedings of the 2nd Internation Workshop on Structural Health Monitoring, Technomic, Lancaster, PA, USA, 8–10 September 1999. [Google Scholar]
- Kessler, S.; Spearing, S.M.; Soutis, C. Damage detection in composite materials using Lamb wave methods. Smart Mater. Struct. 2010, 11, 269–278. [Google Scholar] [CrossRef] [Green Version]
- Raghavan, A.; Cesnik, C.E.S. Review of guided-wave structural health monitoring. Shock Vib. Digest 2007, 39, 91–114. [Google Scholar] [CrossRef]
- Ou, J.; Han, B. Piezoresistive Cement-based Strain Sensors and Self-sensing Concrete Components. J. Intell. Mater. Syst. Struct. 2009, 20, 329–336. [Google Scholar]
- Han, B.; Ding, S.; Yu, X. Intrinsic self-sensing concrete and structures: A review. Measurement 2015, 59, 110–128. [Google Scholar] [CrossRef]
- Han, B.; Zhang, K.; Burnham, T.; Kwon, E.; Yu, X. Integration and road tests of a self-sensing CNT concrete pavement system for traffic detection. Smart Mater. Struct. 2013, 22, 015020. [Google Scholar] [CrossRef]
- Lu, Y.; Zhang, J.; Li, Z.; Dong, B. Corrosion monitoring of reinforced concrete beam using embedded cement-based piezoelectric sensor. Mag. Concr. Res. 2013, 65, 1265–1276. [Google Scholar] [CrossRef]
- Farrar, C.R. Historical Overview of Structural Health Monitoring. Lecture Notes on Structural Health Monitoring Using Statistical Pattern Recognition; Los Alamos Dynamics: Los Alamos, NM, USA, 2001. [Google Scholar]
- Farrar, C.R.; Allen, D.W.; Ball, S.; Masquelier, M.P.; Park, G. Coupling sensing hardware with data interrogation software for structural health monitoring. In Proceedings of the 6th International Symposium on Dynamic Problems of Mechanics, Ouro Preto, Brazil, 28 February–4 March 2005. [Google Scholar]
- Downey, A.; D’Alessandro, A.; Laflamme, S.; Ubertini, F. Smart bricks for strain sensing and crack detection in masonry structures. Smart Mater. Struct. 2017, 27, 015009. [Google Scholar] [CrossRef] [Green Version]
- Park, G.; Sohn, H.; Farrar, C.R.; Inman, D.J. Overview of piezoelectric impedance-based health monitoring and path forward. Shock Vib. Digest 2003, 35, 451–463. [Google Scholar] [CrossRef] [Green Version]
- Kim, D.Y.; Seon, J.H.; Roh, Y.; Park, S.H.; Yun, C.B. Damage detection of civil infrastructures with piezoelectric oscillator sensors. In Proceedings of the KSCE Conference, Jeju, Korea, 21–24 October 2005; pp. 2907–2910. [Google Scholar]
- An, Y.K.; Sohn, H. Experimental validations of a baselinefree crack detection technique using Dual-PZTs. In Proceedings of the SPIE, San Diego, CA, USA, 4 August 2009. [Google Scholar]
- Butler, L.; Gibbons, N.; He, P.; Middleton, C.; Elshafie, M. Evaluating the early-age behaviour of full-scale prestressed concrete beams using distributed and discrete fibre optic sensors. Constr. Build. Mater. 2016, 126, 894–912. [Google Scholar] [CrossRef]
- Johnson, G.A.; Vohra, S.T.; Danver, B.A.; Pran, K.; Havsgard, G.B.; Wang, G. Vibration monitoring of a ship water jet with fiber Bragg gratings. In Proceedings of the 13th International Conference on Optical Fiber Sensors (OFS-13), Kyonju, Korea, 12–16 April 2011. [Google Scholar]
- Min, J.; Park, S.; Yun, C.-B.; Song, B. Development of a low-cost multifunctional wireless impedance sensor node. Smart Struct. Syst. 2010, 6, 689–709. [Google Scholar] [CrossRef]
- Chung, H.C.; Enomoto, T.; Shinozuka, M.; Chou, P.; Park, C.; Yokoi, I.; Morishita, S. Real-time visualization of structural response with wireless MEMS sensors. In Proceedings of the 13th World Conference on Earthquake Engineering, Vancouver, BC, Canada, 1–6 August 2004. [Google Scholar]
- Yoo, D.-Y.; Kim, S.; Lee, S.H. Self-sensing capability of ultra-high-performance concrete containing steel fibers and carbon nanotubes under tension. Sens. Actuators 2018, 276, 125–136. [Google Scholar] [CrossRef]
- Pham, G.T.; Park, Y.B.; Liang, Z.; Zhang, C.; Wang, B. Processing and modeling of conductive thermoplastic/carbon nanotube films for strain sensing. Compos. Part B Eng. 2008, 39, 209–216. [Google Scholar] [CrossRef]
- D’Alessandro, A.; Ubertini, F.; Materazzi, A.L.; Laflamme, S.; Porfiri, M. Electromechanical modelling of a new class of nanocomposite cement-based sensors for structural health monitoring. Struct. Health Monit. 2015, 14, 137–147. [Google Scholar] [CrossRef] [Green Version]
- Vertuccio, L.; Vittoria, V.; Guadagno, L.; De Santis, F. Strain and damage monitoring in carbon-nanotube-based composite under cyclic strain. Compos. Part A Appl. Sci. Manuf. 2015, 71, 9–16. [Google Scholar] [CrossRef]
- Faghih, F. Structural Performance of Nano Concrete-Steel; University of London Institutional Repository: London, UK, 2018. [Google Scholar]
- Wen, S.; Chung, D.D.L. Electrical-resistance-based damage self-sensing in carbon fiber reinforced cement. Carbon 2007, 45, 710–716. [Google Scholar] [CrossRef]
- Kim, M.-J.; Kim, S.; Yoo, D.-Y. Hybrid Effect of Twisted Steel and Polyethylene Fibers on the Tensile Performance of Ultra-High Performance Cementitious Composites. Polymers 2018, 10, 879. [Google Scholar] [CrossRef] [Green Version]
- Chen, P.-W.; Chung, D.D.L. Carbon fiber reinforced concrete for smart structures capable of non-destructive flaw detection. Smart Mater. Struct. 1993, 2, 22. [Google Scholar] [CrossRef]
- Sassani, A.; Arabzadeh, A.; Ceylan, H.; Kim, S.; Sadati, S.S.; Gopalakrishnan, K.; Taylor, P.C.; Abdualla, H. Carbon fiber-based electrically conductive concrete for salt-free deicing of pavements. J. Clean. Prod. 2018, 203, 799–809. [Google Scholar] [CrossRef]
- Wen, S.; Chung, D.D.L. A comparative study of steel and carbon-fibre cement as piezoresistive strain sensors. Adv. Cem. Res. 2003, 15, 119–128. [Google Scholar] [CrossRef]
- Han, J.; Pan, J.; Cai, J.; Li, X. A review on carbon-based self-sensing cementitious composites. Constr. Build. Mater. 2020, 265, 120764. [Google Scholar] [CrossRef]
- Abdullah, W.; Mohammed, A.; Abdullah, A. Self-Sensing Concrete: A Brief Review. Int. J. Adv. Mech. Civil Eng. 2019, 6, 2394–2827. [Google Scholar]
- Geim, A.K.; Novoselov, K.S. The rise of graphene. Nat. Mater. 2007, 6, 183–191. [Google Scholar] [CrossRef] [PubMed]
- Whittington, H.W.; McCarter, J.; Forde, M.C. The Conduction of Electricity through Concrete. Mag. Concr. Res. 1981, 33, 48. [Google Scholar] [CrossRef]
- Ozbulut, O.E.; Jiang, Z.; Harris, D.K. Exploring scalable fabrication of self-sensing cementitious composites with graphene nanoplatelets. Smart Mater. 2018, 27, 115029. [Google Scholar] [CrossRef]
- Singh, A.P.; Gupta, B.K.; Mishra, M.; Govind; Chandra, A.; Mathur, R.B.; Dhawan, S.K. Multiwalled carbon nanotube/cement composites with exceptional electromagnetic interference shielding properties. Carbon 2013, 56, 86. [Google Scholar] [CrossRef]
- Wen, S.; Chung, D.D.L. The role of electronic and ionic conduction in the electrical conductivity of carbon fiber reinforced cement. Carbon 2006, 44, 2130–2138. [Google Scholar] [CrossRef]
- Abeles, B.; Pinch, H.L.; Gittleman, J.I. Percolation conductivity in W-Al2O3 granular metal films. Phys. Rev. Lett. 1975, 35, 247–250. [Google Scholar] [CrossRef]
- Simmons, G. Generalized Formula for the Electric Tunnel Effect between Similar Electrodes Separated by a Thin Insulating Film. J. Appl. Phys. 1963, 34, 1793. [Google Scholar] [CrossRef] [Green Version]
- Ding, S.; Dong, S.; Ashour, A. Development of sensing concrete: Principles, properties and its applications. J. Appl. Phys. 2019, 126, 241101. [Google Scholar] [CrossRef] [Green Version]
- Nam, I.W.; Souri, H.; Lee, H.K. Percolation threshold and piezoresistive response of multi-wall carbon nanotube/cement composites. Smart Struct. Syst. 2016, 18, 217–231. [Google Scholar] [CrossRef]
- Nan, C.W. Physics of inhomogeneous inorganic materials. Prog. Mater. Sci. 1993, 37, 1–116. [Google Scholar] [CrossRef]
- Stankovich, S.; Diki, D.A.; Dommett, G.H.B.; Kohlhaas, K.M.; Zimney, E.J.; Stach, E.A.; Piner, R.D.; Nguyen, S.T.; Ruoff, R.S. Graphene-based composite materials", Nature Publishing Group. Nature 2006, 442, 282. [Google Scholar] [CrossRef] [PubMed]
- Balberg, I. Tunneling and nonuniversal conductivity in composite materials. Phys. Rev. Lett. 1987, 59, 1305. [Google Scholar] [CrossRef] [PubMed]
- Sheng, P.; Abeles, B.; Arie, Y. Hopping conductivity in granular metals. Phys. Rev. Lett. 1973, 31, 44–47. [Google Scholar] [CrossRef] [Green Version]
- Balberg, I. Tunnelling and percolation in lattices and the continuum. J. Phys. D Appl. Phys. 2009, 42, 064003. [Google Scholar] [CrossRef]
- Balberg, I. A comprehensive picture of the electrical phenomena in carbon black-polymer composites. Carbon 2002, 40, 139–143. [Google Scholar] [CrossRef]
- Stauffer, D.; Bunde, A. Introduction to Percolation Theory. Phys. Today 2008, 40, 122–123. [Google Scholar] [CrossRef]
- Vionnet-Menot, S.; Grimaldi, C.; Maeder, T.; Strässler, S.; Ryser, P. Tunneling-percolation origin of nonuniversality: Theory and experiments. Phys. Rev. B 2005, 71, 064201. [Google Scholar] [CrossRef] [Green Version]
- Rejón, L.; Rosas-Zavala, A.; Porcayo-Calderon, J.; Castaño, V.M. Percolationphenomena in carbonblackfilledpolymeric concrete. Polym. Eng. Sci. 2000, 40, 2101–2104. [Google Scholar] [CrossRef]
- Sun, M.; Liew, R.J.Y.; Zhang, M.-H.; Li, W. Development of cement-based strain sensor for health monitoring of ultra high strength concrete. Constr. Build. Mater. 2014, 65, 630–637. [Google Scholar] [CrossRef]
- Li, J.; Kim, J.K.; Sham, M.L. Conductive graphite nanoplatelet/epoxy nanocomposites: Effects of exfoliation and UV/ozone treatment of graphite. Scripta Mater. 2005, 53, 235–240. [Google Scholar] [CrossRef] [Green Version]
- Weng, W.G.; Chen, G.H.; Wu, D.J.; Yan, W.L. HDPE/expanded graphite electrically conducting composite. Compos. Interface 2004, 11, 131–143. [Google Scholar] [CrossRef]
- Fukushima, H.; Drzal, L.T. Graphite nanocomposites: Structural and electrical properties. In Proceedings of the 14th International Conference on Composites Materials (ICCM–14), San Diego, CA, USA, 14–18 July 2003. [Google Scholar]
- Chen, G.H.; Wu, D.J.; Weng, W.G.; Yan, W.L. Preparation of polymer/ graphite conducting nanocomposite by intercalation polymerization. J. Appl. Polym. Sci. 2001, 82, 2506–2513. [Google Scholar] [CrossRef]
- Zheng, W.; Wong, S.C. Electrical conductivity and dielectric properties of PMMA/expanded graphite composites. Compos. Sci. Technol. 2003, 63, 225–235. [Google Scholar] [CrossRef]
- Bocharov, G.S.; Eletskii, A.V. Theory of carbon nanotube (CNT)—Based electron field emitters. Nanomaterials 2013, 3, 393–442. [Google Scholar] [CrossRef] [Green Version]
- Dong, W.K.; Li, W.G.; Tao, Z.; Wang, K.J. Piezoresistive properties of cement-based sensors: Review and perspective. Constr. Build. Mater. 2019, 203, 146–163. [Google Scholar] [CrossRef]
- Chen, X.M.; Shen, J.W.; Huang, W.Y. Novel electrically conductive polypropyrene/graphite nanocomposites. J. Mater. Sci. Lett. 2002, 21, 213–214. [Google Scholar] [CrossRef]
- Li, J.; Kim, J.K.; Sham, M.L.; Marom, G. Morphology and properties of UV/ozone treated graphite nanoplatelet/epoxy nanocomposites. Compos. Sci. Technol. 2007, 67, 296–305. [Google Scholar] [CrossRef] [Green Version]
- Simmons, J.G. Electric tunnel effect between dissimilar electrodes separated by a thin insulating film. J. Appl. Phys. 1963, 34, 2581–2590. [Google Scholar] [CrossRef]
- Han, B.G.; Yu, X.; Ou, J.P. Multifunctional and smart carbon nanotube reinforced cement-based materials. Nanotechnol. Civ. Infrastruct. 2011, 315, 1–47. [Google Scholar]
- Zhenjun, Z.; Zhengfang, Y. Study on the smart property of carbon coated nylon fiber-reinforced concrete composites. J. Chin. Ceram. Soc. 2001, 29, 192–195. [Google Scholar]
- Chen, M.; Gao, P.; Geng, F.; Zhang, L.; Liu, H. Mechanical and smart properties of carbon fiber and graphite conductive concrete for internal damage monitoring of structure. Constr. Build. Mater. 2001, 142, 320–327. [Google Scholar] [CrossRef]
- Vilaplana, J.L.; Baeza, F.J.; Galao, O.; Zornoza, E.; Garcés, P. Self-sensing properties of alkali activated blast furnace slag (BFS) composites reinforced with carbon fibers. Materials 2013, 6, 4776–4786. [Google Scholar] [CrossRef] [Green Version]
- Lin, V.W.; Li, M.; Lynch, J.P.; Li, V.C. Mechanical and electrical characterization of self-sensing carbon black ECC. Nondestructive Characterization for Composite Materials, Aerospace Engineering, Civil Infrastructure, and Homeland Security 2011. Int. Soc. Opt. Photonics 2011, 7983, 16. [Google Scholar]
- Han, B.; Guan, X.; Ou, J. Electrode design, measuring method and data acquisition system of carbon fiber cement paste piezoresistive sensors. Sens. Actuators 2007, A135, 360–369. [Google Scholar] [CrossRef]
- Zhang, T.; Zhang, K.; Liu, W. Exact impact response of multi-layered cement-based piezoelectric composite considering electrode effect. J. Intell. Mater. Syst. Struct. 2019, 30, 400–415. [Google Scholar] [CrossRef]
- Li, Z.; Wei, X.; Li, W. Preliminary interpretation of Portland cement hydration process using resistivity measurements. Mater. J. 2003, 100, 253–257. [Google Scholar]
- Zhang, J.; Li, Z. Application of GEM equation in microstructure characterization of cement-based materials. J. Mater. Civ. Eng. 2009, 21, 648–656. [Google Scholar] [CrossRef]
- Reza, F.; Batson, G.B.; Yamamuro, J.A.; Lee, J.S. Volume electrical resistivity of carbon fiber cements composites. Mater. J. 2001, 98, 25–35. [Google Scholar]
- Wei, X.; Li, Z. Study on hydration of Portland cement with fly ash using electrical measurement. Mater. Struct. 2005, 38, 411–417. [Google Scholar] [CrossRef]
- Li, Z.; Xiao, L.; Wei, X. Determination of concrete setting time using electrical resistivity measurement. J. Mater. Civ. Eng. 2007, 19, 423–427. [Google Scholar] [CrossRef]
- Meehan, D.G.; Wang, S.; Chung, D.D.L. Electrical-resistance-based sensing of impact damage in carbon fiber reinforced cement-based materials. J. Intell. Mater. Syst. Struct. 2010, 21, 83–105. [Google Scholar] [CrossRef]
- Luo, J.; Chung Kwok, L.; Li, Q.; Chen, S.; Li, L.; Hou, D.; Zhang, C. Piezoresistive properties of cement composites reinforced by functionalized carbon nanotubes using photo-assisted Fenton. Smart Mater. Struct. 2017, 26, 035025. [Google Scholar]
- Monteiro, A.O.; Cachim, P.B.; Costa, P.M.F.J. Self-sensing piezoresistive cement composite loaded with carbon black particles. Cem. Concr. Compos. 2017, 81, 59–65. [Google Scholar] [CrossRef]
- Monteiro, A.O.; Loredo, A.; Costa, P.M.F.J.; Oeser, M.; Cachim, P.B. A pressuresensitive carbon black cement composite for traffic monitoring. Constr. Build. Mater. 2017, 154, 1079–1086. [Google Scholar] [CrossRef]
- Yıldırım, G.; Oztürk, O.; Al-Dahawi, A.; Afs¸ın Ulu, A.; Sahmaran, M. Self-sensing capability of engineered cementitious composites: Effects of aging and loading conditions. Constr. Build. Mater. 2020, 231, 117132. [Google Scholar] [CrossRef]
- Ding, Y.; Chen, Z.; Han, Z.; Zhang, Y.; Pacheco-Torgal, F. Nano-carbon black and carbon fiber as conductive materials for the diagnosing of the damage of concrete beam. Constr. Build. Mater. 2013, 43, 233–241. [Google Scholar] [CrossRef] [Green Version]
- Baeza, F.J.; Galao, O.; Zornoza, E.; Garcés, P. Effect of aspect ratio on strain sensing capacity of carbon fiber reinforced cement composites. Mater. Des. 2013, 51, 1085–1094. [Google Scholar] [CrossRef]
- Gallo, G.J.; Thostenson, E.T. Electrical characterization and modeling of carbon nanotube and carbon fiber self-sensing composites for enhanced sensing of microcracks. Mater. Today Commun. 2015, 3, 17–26. [Google Scholar] [CrossRef]
- Yoo, D.-Y.; You, I.; Zi, G.; Lee, S.-J. Effects of carbon nanomaterial type and amount on self-sensing capacity of cement paste. Measurement 2018, 134, 750–761. [Google Scholar] [CrossRef]
- Chung, D.D.L. A critical review of piezoresistivity and its application in electrical-resistance-based strain sensing. J. Mater. Sci. 2020, 55, 15367–15396. [Google Scholar] [CrossRef]
- Kim, M.K.; Park, J.; Kim, D.J. Characterizing the electro-mechanical response of self-sensing steel-fiber-reinforced cementitious composites. Constr. Build. Mater. 2020, 240, 117954. [Google Scholar] [CrossRef]
- Qiu, L.; Dong, S.; Yu. X.; Han, B. Self-sensing ultra-high performance concrete for in-situ monitoring. Sens. Actuators A Phys. 2021, 331, 113049. [Google Scholar] [CrossRef]
- Suchorzewski, J.; Prieto, M.; Mueller, U. An experimental study of self-sensing concrete enhanced with multiwall carbon nanotubes in wedge splitting test and DI. Constr. Build. Mater. 2020, 262, 120871. [Google Scholar] [CrossRef]
- Abedi, M.; Fangueiro, R.; Correia, A.G. Effects of multiscale carbon-based conductive fillers on the performances of a self-sensing cementitious geocomposite. J. Build. Eng. 2021, 43, 103171. [Google Scholar] [CrossRef]
- Lee, S.H.; Kim, S.; Yoo, D.Y. Hybrid effects of steel fiber and carbon nanotube on self-sensing capability of ultra-high-performance concrete. Constr. Build. Mater. 2018, 185, 530–544. [Google Scholar] [CrossRef]
- Ding, Y.; Liu, G.; Hussain, A.; Pacheco-Torgal, F.; Zhang, Y. Effect of steel fiber and carbon black on the self-sensing ability of concrete cracks under bending. Constr. Build. Mater. 2019, 207, 630–639. [Google Scholar] [CrossRef]
- Wen, S.S.; Chung, D.D.L. Effect of admixtures on the dielectric constant of cement paste. Cement Concr. Res. 2001, 31, 673–677. [Google Scholar] [CrossRef]
- Wang, Y.; Chung, D.D.L. Effect of the fringing electric field on the apparent electric permittivity of cement-based materials. Compos. Part B 2017, 126, 192–201. [Google Scholar] [CrossRef]
- Wen, S.; Chung, D.D.L. Cement-based materials for stress sensing by dielectric measurement. Cement Concr. Res. 2002, 32, 1429–1433. [Google Scholar] [CrossRef]
- Hong, X.; Yu, W.; Chung, D.D.L. Electric permittivity of reduced graphite oxide. Carbon 2017, 111, 182–190. [Google Scholar] [CrossRef]
- Available online: https://en.wikipedia.org/wiki/Relative_permittivity (accessed on 17 May 2022).
- Fu, X.; Chung, D.D.L. Degree of dispersion of latex particles in cement paste, as assessed by electrical resistivity measurement. Cem. Concr. Res. 1996, 26, 985–991. [Google Scholar] [CrossRef]
- Chen, P.; Chung, D.D.L. Improving the electrical conductivity of composites comprised of short conducting fibers in a non-conducting matrix: The addition of a non-conducting particulate filler. J. Electron. Mater. 1995, 24, 47–51. [Google Scholar] [CrossRef]
- Bhattacharya, S.; Sachdev, V.K.; Chatterjee, R.; Tandon, R.P. Decisive properties of graphite-filled cement composites for device application. Appl. Phys. 2008, A 92, 417–420. [Google Scholar] [CrossRef]
- Sachdev, V.K.; Sharma, S.K.; Bhattacharya, S.; Patel, K.; Mehra, N.C.; Gupta, V.; Tandon, R.P. Electromagnetic shielding performance of graphite in cement matrix for applied application. Adv. Mater. Lett. 2015, 6, 965–972. [Google Scholar] [CrossRef]
- Ciomaga, C.E.; Padurariu, L.; Curecheriu, L.P.; Lupu, N.; Lisiecki, I.; Deluca, M.; Tascu, S.; Galassi, C.; Mitoseriu, L. Using multi-walled carbon nanotubes in spark plasma sintered Pb(Zr0.47Ti0.53)O3 ceramics for tailoring dielectric and tunability properties. J. Appl. Phys. 2014, 116, 164110. [Google Scholar] [CrossRef]
- Hong, X.; Yu, W.; Wang, A.; Chung, D.D.L. Graphite oxide paper as a polarizable electrical conductor in the through-thickness direction. Carbon 2016, 109, 874–882. [Google Scholar] [CrossRef]
- Xi, X.; Chung, D.D.L. Capacitance-based self-sensing of flaws and stress in carbon-carbon composite, with reports of the electric permittivity, piezoelectricity and piezoresistivity. Carbon 2019, 146, 447–461. [Google Scholar] [CrossRef]
- Hong, X.; Yu, W.; Chung, D.D.L. Significant effect of sorbed water on the electrical and dielectric behavior of graphite oxide. Carbon 2017, 119, 403–418. [Google Scholar] [CrossRef]
- Hong, X.; Chung, D.D.L. Exfoliated graphite with relative dielectric constant reaching 360, obtained by exfoliation of acid-intercalated graphite flakes without subsequent removal of the residual acidity. Carbon 2015, 91, 1–10. [Google Scholar] [CrossRef]
- Wang, A.; Chung, D.D.L. Dielectric and electrical conduction behavior of carbon paste electrochemical electrodes, with decoupling of carbon, electrolyte and interface contributions. Carbon 2014, 72, 135–151. [Google Scholar] [CrossRef]
- Moalleminejad, M.; Chung, D.D.L. Dielectric constant and electrical conductivity of carbon black as an electrically conductive additive in a manganesedioxide electrochemical electrode, and their dependence on electrolyte permeation. Carbon 2015, 91, 76–87. [Google Scholar] [CrossRef]
- Chung, D.D.L.; Xi, X. Piezopermittivity for capacitance-based strain/stress sensing. Sens. Actuators A Phys. 2021, 332, 113028. [Google Scholar] [CrossRef]
- Christensen, B.J.; Coverdale, T.; Olson, R.A.; Ford, S.J.; Garboczi, E.J.; Jennings, H.M. Impedance spectroscopy of hydrating cement-based materials: Measurement, Interpretation, and application. J. Am. Ceram. Soc. 1994, 77, 2789–2804. [Google Scholar] [CrossRef]
- Xiao, H.; Hui, L.; Ou, J. Self-monitoring properties of concrete columns with embedded cement-based strain sensors. J. Intell. Mater. Syst. Struct. 2011, 22, 191–200. [Google Scholar] [CrossRef]
- Meng, X.; Feng, J.; Pai, N.; Zequan, H.; Kaiyuan, L.; Cheng, Z.; Yazhen, Z. See fewer. Effects of filler type and aging on self-sensing capacity of cement paste using eddy current-based nondestructive detection. Measurement 2021, 182, 109708. [Google Scholar] [CrossRef]
- Woo, L.; Wansom, S.; Hixson, A.; Campo, M.; Mason, T. A universal equivalent circuit model for the impedance response of composites. J. Mater. Sci. 2003, 38, 2265–2270. [Google Scholar] [CrossRef]
- Ubertini, F.; Materazzi, A.L.; D’Alessandro, A.; Laflamme, S. Natural frequencies identification of a reinforced concrete beam using carbon nanotube cementbased sensors. Eng. Struct. 2014, 60, 265–275. [Google Scholar] [CrossRef] [Green Version]
- D’Alessandro, A.; Ubertini, F.; Garcia-Macias, E.; Castro-Triguero, R.; Downey, A.; Laflamme, S.; Meoni, A.; Materazzi, A.L. Static and dynamic strain monitoring of reinforced concrete components through embedded carbon nanotube cement-based sensors. Shock Vib. 2017, 2017, 3648403. [Google Scholar] [CrossRef]
- Downey, A.; D’Alessandro, A.; Ubertini, F.; Laflamme, S. Automated crack detection in conductive smart-concrete structures using a resistor mesh model. Meas. Sci. Technol. 2017, 29, 035107. [Google Scholar] [CrossRef] [Green Version]
- Fu, X.L.; Chung, D.D.L. Effect of curing age on the self-monitoring behavior of carbon fiber reinforced mortar. Cem. Concr. Res. 1997, 27, 1313–1318. [Google Scholar] [CrossRef]
- Xu, Z.; Zhu, J.; Ding, Y.; Sun, Y. Review of pressure-resistance effect of carbon fiber reinforced polymer. Fiber Reinfor. Plast. Compos. 2015, 07, 86–90. [Google Scholar]
- Coverdale, R.; Christensen, B.; Mason, T.; Jennings, H.; Garboczi, E. Interpretation of the impedance spectroscopy of cement paste via computer modeling. J. Mater. Sci. 1994, 29, 4984–4992. [Google Scholar] [CrossRef]
- Coverdale, R.; Jennings, H.; Garboczi, E. An improved model for simulating impedance spectroscopy. Comput. Mater. Sci. 1995, 3, 465–474. [Google Scholar] [CrossRef]
- Macphee, D.; Cormack, S.; Sinclair, D. AC impedance spectroscopy of pore reduced cements: Influence of contact resistance. J. Mater. Sci. 2000, 35, 4823–4826. [Google Scholar] [CrossRef]
- Ravikumar, D.; Neithalath, N. An electrical impedance investigation into the chloride ion transport resistance of alkali silicate powder activated slag concretes. Cement. Concr. Compos. 2013, 44, 58–68. [Google Scholar] [CrossRef]
- Zhu, Y.; Zhang, H.; Zhang, Z.; Yao, Y. Electrochemical impedance spectroscopy (EIS) of hydration process and drying shrinkage for cement paste with W/C of 0.25 affected by high range water reducer. Constr. Build. Mater. 2017, 131, 536–541. [Google Scholar] [CrossRef]
- McCarter, W.; Starrs, G.; Chrisp, T. The complex impedance response of fly-ash cements revisited. Cement Concr. Res. 2004, 34, 1837–1843. [Google Scholar] [CrossRef]
- Cabeza, M.; Merino, P.; Miranda, A.; Nóvoa, X.; Sanchez, I. Impedance spectroscopy study of hardened Portland cement paste. Cement Concr. Res. 2002, 32, 881–891. [Google Scholar] [CrossRef]
- Neithalath, N.; Jain, J. Relating rapid chloride transport parameters of concretes to microstructural features extracted from electrical impedance. Cement Concr. Res. 2010, 40, 1041–1051. [Google Scholar] [CrossRef]
- Gu, P.; Xie, P.; Fu, Y.; Beaudoin, J. AC impedance phenomena in hydrating cement systems: Frequency dispersion angle and pore size distribution. Cement Concr. Res. 1994, 24, 86–88. [Google Scholar] [CrossRef]
- Keru, S.M.L.J.W. AC impedance method to study the mechanism of corrosion of rebar in concrete. J. Build. Mater. 1998, 3. [Google Scholar]
- McCarter, W.J. Effects of temperature on conduction and polarization in Portland cement mortar. J. Am. Ceram. Soc. 1995, 78, 411–415. [Google Scholar] [CrossRef]
- Sato, T. An AC Impedance Spectroscopy Study of the Freezing-Thawing Durability of Wollastonite Micro-Fibre Reinforced Cement Paste; University of Ottawa: Ottawa, ON, Canada, 2002. [Google Scholar]
- McCarter, W. A parametric study of the impedance characteristics of cement-aggregate systems during early hydration. Cement Concr. Res. 1994, 24, 1097–1110. [Google Scholar] [CrossRef]
- Poupard, O.; Aıt-Mokhtar, A.; Dumargue, P. Corrosion by chlorides in reinforced concrete: Determination of chloride concentration threshold by impedance spectroscopy. Cement Concr. Res. 2004, 34, 991–1000. [Google Scholar] [CrossRef]
- Song, G. Equivalent circuit model for AC electrochemical impedance spectroscopy of concrete. Cement Concr. Res. 2000, 30, 1723–1730. [Google Scholar] [CrossRef]
- Sánchez, I.; Nóvoa, X.; De Vera, G.; Climent, M. Microstructural modifications in Portland cement concrete due to forced ionic migration tests. Study by impedance spectroscopy. Cement Concr. Res. 2008, 38, 1015–1025. [Google Scholar] [CrossRef]
- Gu, P.; Xie, P.; Beaudoin, J.J. Contact capacitance effect in measurement of a.c. impedance spectra for hydrating cement systems. J. Mater. Sci. 1996, 31, 144–149. [Google Scholar]
- Howser, R.; Dhonde, H.; Mo, Y. Self-sensing of carbon nanofiber concrete columns subjected to reversed cyclic loading. Smart Mater. Struct. 2011, 20, 085031. [Google Scholar] [CrossRef]
- Han, B.; Yu, X.; Zhang, K.; Kwon, E.; Ou, J. Sensing properties of CNT-filled cementbased stress sensors. J. Civ. Struct. Health Monit. 2011, 1, 17–24. [Google Scholar] [CrossRef]
- Han, B.; Ou, J. Embedded piezoresistive cement-based stress/strain sensor. Sens. Actuators 2007, A 138, 294–298. [Google Scholar] [CrossRef]
- Downey, A.; D’Alessandro, A.; Baquera, M.; Garcia-Macias, E.; Rolfesm, D.; Ubertini, F.; Laflamme, S.; Castro-Triguero, R. Damage detection, localization and quantification in conductive smart concrete structures using a resistor mesh model. Eng. Struct. 2017, 148, 924–935. [Google Scholar] [CrossRef] [Green Version]
- Garcés, P.; Andion, L.G.; De la Varga, I.; Catala, G.; Zornoza, E. Corrosion of steel reinforcement in structural concrete with carbon material addition. Corros. Sci. 2007, 49, 2557–2566. [Google Scholar] [CrossRef]
- Chen, B.; Liu, J. Damage in carbon fiber-reinforced concrete, monitored by both electrical resistance measurement and acoustic emission analysis. Constr. Build. Mater. 2008, 22, 2196–2201. [Google Scholar] [CrossRef]


| Sensor Type | Application | Limitations |
|---|---|---|
| Accelerometer [6,7] | Measures the motion and vibration of a structure that is exposed to dynamic loads | Low durability and non-intrinsic |
| Extensometer [6,7] | Measures the elongation of material subjected to stress | Vulnerable and less sensitivity |
| Strain gauge [8] | Determines stresses in the structure by responding to the changes in dimensions due to creep, crack, temperature change, moisture change, etc. | Low sensing, worse durability and non-intrinsic |
| Piezoelectric sensors [9,10,11] | Measure impedance-based damage detection, guided wave damage detection, and structural dynamics applications in a structure | More AUD is required and non-intrinsic |
| Optical fibre sensors [12,13] | Measure the strain, temperature, and pressure in a structure | Vulnerable and non-intrinsic |
| Wireless smart sensors [14] | Detect, locate, and assess structural damages in a structure | Complication in implementing |
| Vision-based displacement measurement system [15] | Used for sensing the displacements in a structure | Not accurate and non-intrinsic |
| Shape Memory Alloy [16] | Used in building materials to withstand varied thermal conditions by gaining its original properties | More AUD is required and non-intrinsic |
| Condition | Piezoresistivity | Piezopermittivity | Piezoelectricity |
|---|---|---|---|
| Mechanism | Change in electrical resistivity on the application of external stimuli | Change in capacitance on subjected to external stimuli | Change in Electric field, on subjected to external stimuli |
| Materials | Conductive filler (steel fibre, nano nickel particles, carbon fibre, carbon nanotube, functionalized graphene groups) and non-conductive matrix (cement-based composites, alkali-based materials, etc.) | Composite (fibre reinforced polymer matrix, concrete), dielectric film and electrodes (copper, aluminium or steel) | Conductive filler (steel fibre, nano nickel particles, carbon fibre, carbon nanotube, functionalized graphene groups) and non-conductive matrix (cement-based composites, alkali-based materials, etc.) |
| Dominant factor | Current and Voltage | Frequency | Voltage |
| Parameter | Formula | Description |
|---|---|---|
| Filler geometry | refers to particle size; is interparticle distance of the filler [45]. | |
| Filler and matrix properties | = volume fraction of minor phase, = percolation threshold, | |
| R1 = particle size of the major filler, R2 = particle size of the minor filler. Spherical filler in a homogeneous composite with random orientation [49] | ||
| Ellipsoidal filler in an isotropic composite with random orientation [49] | ||
| Filler concentration |
| δ = electrical conductivity of the material, δf = conductivity of the filler material, φ = filler concentration, φc = percolation threshold, = universal critical exponential [44].
|
| Filler | Matrix | % of Fibres | Percolation Threshold (%) | References |
|---|---|---|---|---|
| Carbon black | Cementitious material | 0.2–0.5 | 7.22–11.39 | [49] |
| Expanded graphite | High Density Polyethylene | 0.1 | 4.46 | [50] |
| Graphite | Epoxy | 0.5 | 1.13 | [51] |
| Graphite | Poly(styrene-methyl methacrylate) | 0.5, 1 | 0.878 | [52] |
| Expanded graphite | Polymethylmethacrylate | 1 | 0.529 | [52] |
| Graphite nanoplatelets | Polypropylene | - | 0.67 | [53] |
| Graphite nanoplatelets | Epoxy | 0.2, 0.4, 0.6 | 0.5 | [54] |
| Graphite nanoplatelets | Polymer composite | 0.5 | 0.52 | [55] |
| Carbon fibres | polymer matrix | 1, 1.5 | 0.9 | [56] |
| MWCNT | Cementitious material | 0.5, 1.15 | 1.00 | [56] |
| MWCNT | Cementitious material | 1 | 1.15 | [56] |
| MWCNT | Cementitious material | 0.3–0.6 | 0.35–0.7 | [56] |
| Matrix | Fibre (%) | Method | Electrode Type | Current Type | Resistivity (Ω·cm) × 103 | References |
|---|---|---|---|---|---|---|
| Alkali activated blast furnace slag | Carbon fibre (0.58) | Four-probe method | Silver paint wrapped with copper wire | DC | 9.956 | [61] |
| E.C.C. | Carbon fibre (1) | Surface electrodes | An electrode made up of copper plate | AC | 7.5 | [62] |
| ECC | CNT (0.5) | Surface electrodes | An electrode made up of copper plate | AC | 84.5 | [62] |
| E.C.C. | Carbon black (0.01) | Surface electrodes | An electrode made up of copper plate | AC | 97.34 | [62] |
| UHPC | Steel fibre (2) | Two-probe method | - | AC | 420 | [68] |
| Concrete | MWCNTs (0.05) | Four-probe method | An electrode made up of copper plate | DC | 181 | [68] |
| Circuit Type | Ohm’s Law | Description |
|---|---|---|
| Direct current circuit | V refers to the voltage (V), I is the intensity of the current (A) and R is the electrical resistance (Ω) [68]. | |
| Alternating current circuit | Z is the impedance (including resistance and reactants), which refers to the total opposition of the current flow [70]. |
| Condition | F.C.R. | Gauge Factor | Sensitivity Criterion |
|---|---|---|---|
| In case 1, the gauge factor is dictated by the change in resistivity (δρ/ρ) and has a magnitude that depends on the piezoresistivity of the material, and it is not limited. | |||
| In case 2, the maximum value of µ is 0.5, so the maximum value that the G.F. can obtain is 2, which is low. | |||
| In case 3, the maximum G.F. that can be obtained is 3, which is low. |
| Type of Filler | Type of Matrix | Percentage of Filler Material (%) | Sensitivity Properties | References | ||
|---|---|---|---|---|---|---|
| F.C.R. | Gauge Factor | Resistivity (Ohms·cm) | ||||
| Steel Fiber | Cementitious matrix | 0.5 | - | 87.26 | 102.86 | [81,82,83] |
| 1 | - | 155.99 | 21.43 | |||
| 1.5 | - | 164.24 | 17.13 | |||
| 2 | - | 156.45 | 11.39 | |||
| Concrete | 20 | 0.194 | 1.78 | - | ||
| 40 | 0.13 | 4.68 | - | |||
| 60 | 0.122 | 0.77 | - | |||
| Cement mortar | Lengthy twisted (1.5) | 138.09 | 55.54 | |||
| Lengthy smooth (1.5) | - | 99.85 | 109.06 | |||
| Lengthy hooked (1.5) | - | 88.5 | 175.03 | |||
| Medium twisted (1.5) | - | 139.68 | 113.58 | |||
| Medium smooth (1.5) | - | 99.7 | 352.11 | |||
| Short smooth (1.5) | - | 52.9 | 628.97 | |||
| Carbon Nanotube | Cement paste | 0.2 | 0.02 | - | - | [84,85,86] |
| 0.3 | 0.03 | - | - | |||
| Cement paste | 0.6 | - | 1 | 1 | ||
| 0.7 | - | 50 | 50 | |||
| 1.2 | - | 2 | 2 | |||
| Concrete | 0.25 | 20 | - | - | ||
| 0.5 | 25 | - | - | |||
| Carbon Fiber | Concrete | 0.5 | 12.5 | - | - | [87,88] |
| 1 | 11 | - | ||||
| Cement paste | 0.5 | 405.3 | ||||
| Cement paste | 0.1 | 13 | ||||
| 0.5 | 3 | |||||
| 1 | 2 | |||||
| Concrete | 0.5 | 0.37 | ||||
| 2 | 1.01 | |||||
| 3 | 1.32 | |||||
| C.F., C.N.T. | Cement paste | 0.1, 0.5 | 160.3 | 25 | [88] | |
| S.F., C.N.T | Concrete | 2, 0.5 | 0.236 | 67.8 | [89] | |
| S.F, CB | Concrete | 20, 1 (kg/m3) | 0.323 | 1.08 | - | [90] |
| S.F, CB, CF | concrete | 60, 1, 2 (kg/m3) | 0.169 | 1.55 | [90] | |
| Conducting Type | Material | Permittivity (F/m) |
|---|---|---|
| Conducting | CFRP | 1.6 × 10³ |
| Conducting | Copper | 2.4 × 10³ |
| Conducting | Carbon fibre | 4.0 × 10³ |
| Non-Conducting | Cement paste | 28 |
| Non-Conducting | Mortar | 13.2 |
| Non-Conducting | Concrete | 11.9 |
| Condition | Sensing Effectiveness |
|---|---|
Publisher’s Note: MDPI stays neutral with regard to jurisdictional claims in published maps and institutional affiliations. |
© 2022 by the authors. Licensee MDPI, Basel, Switzerland. This article is an open access article distributed under the terms and conditions of the Creative Commons Attribution (CC BY) license (https://creativecommons.org/licenses/by/4.0/).
Share and Cite
Ramachandran, K.; Vijayan, P.; Murali, G.; Vatin, N.I. A Review on Principles, Theories and Materials for Self Sensing Concrete for Structural Applications. Materials 2022, 15, 3831. https://doi.org/10.3390/ma15113831
Ramachandran K, Vijayan P, Murali G, Vatin NI. A Review on Principles, Theories and Materials for Self Sensing Concrete for Structural Applications. Materials. 2022; 15(11):3831. https://doi.org/10.3390/ma15113831
Chicago/Turabian StyleRamachandran, Kousalya, Ponmalar Vijayan, Gunasekaran Murali, and Nikolai Ivanovich Vatin. 2022. "A Review on Principles, Theories and Materials for Self Sensing Concrete for Structural Applications" Materials 15, no. 11: 3831. https://doi.org/10.3390/ma15113831
APA StyleRamachandran, K., Vijayan, P., Murali, G., & Vatin, N. I. (2022). A Review on Principles, Theories and Materials for Self Sensing Concrete for Structural Applications. Materials, 15(11), 3831. https://doi.org/10.3390/ma15113831