
Forecasting Compressive Strength of RHA Based Concrete Using Multi-Expression Programming

 , ,
, ,  , ,
, ,  ,
,  and
and 
Abstract
:1. Introduction
2. Multi-Expression Programming (MEP)
3. Data Collection
4. Model Development
4.1. Shapley Additive Explanations (SHAP)
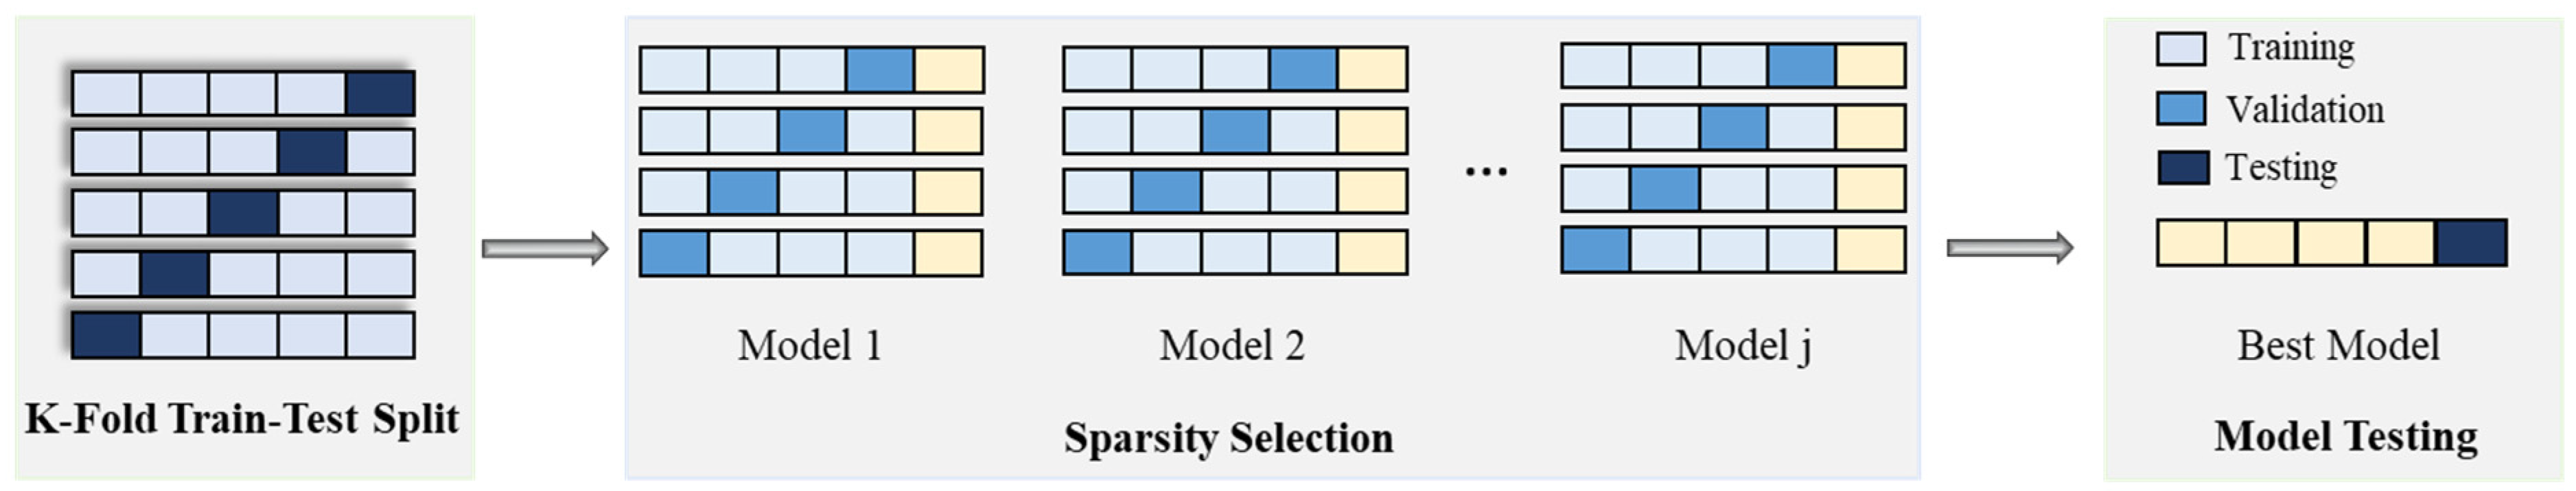
4.2. Cross-Validation Using 10 K-Fold Method
5. Results and Discussion
5.1. MEP Analysis of CRHA
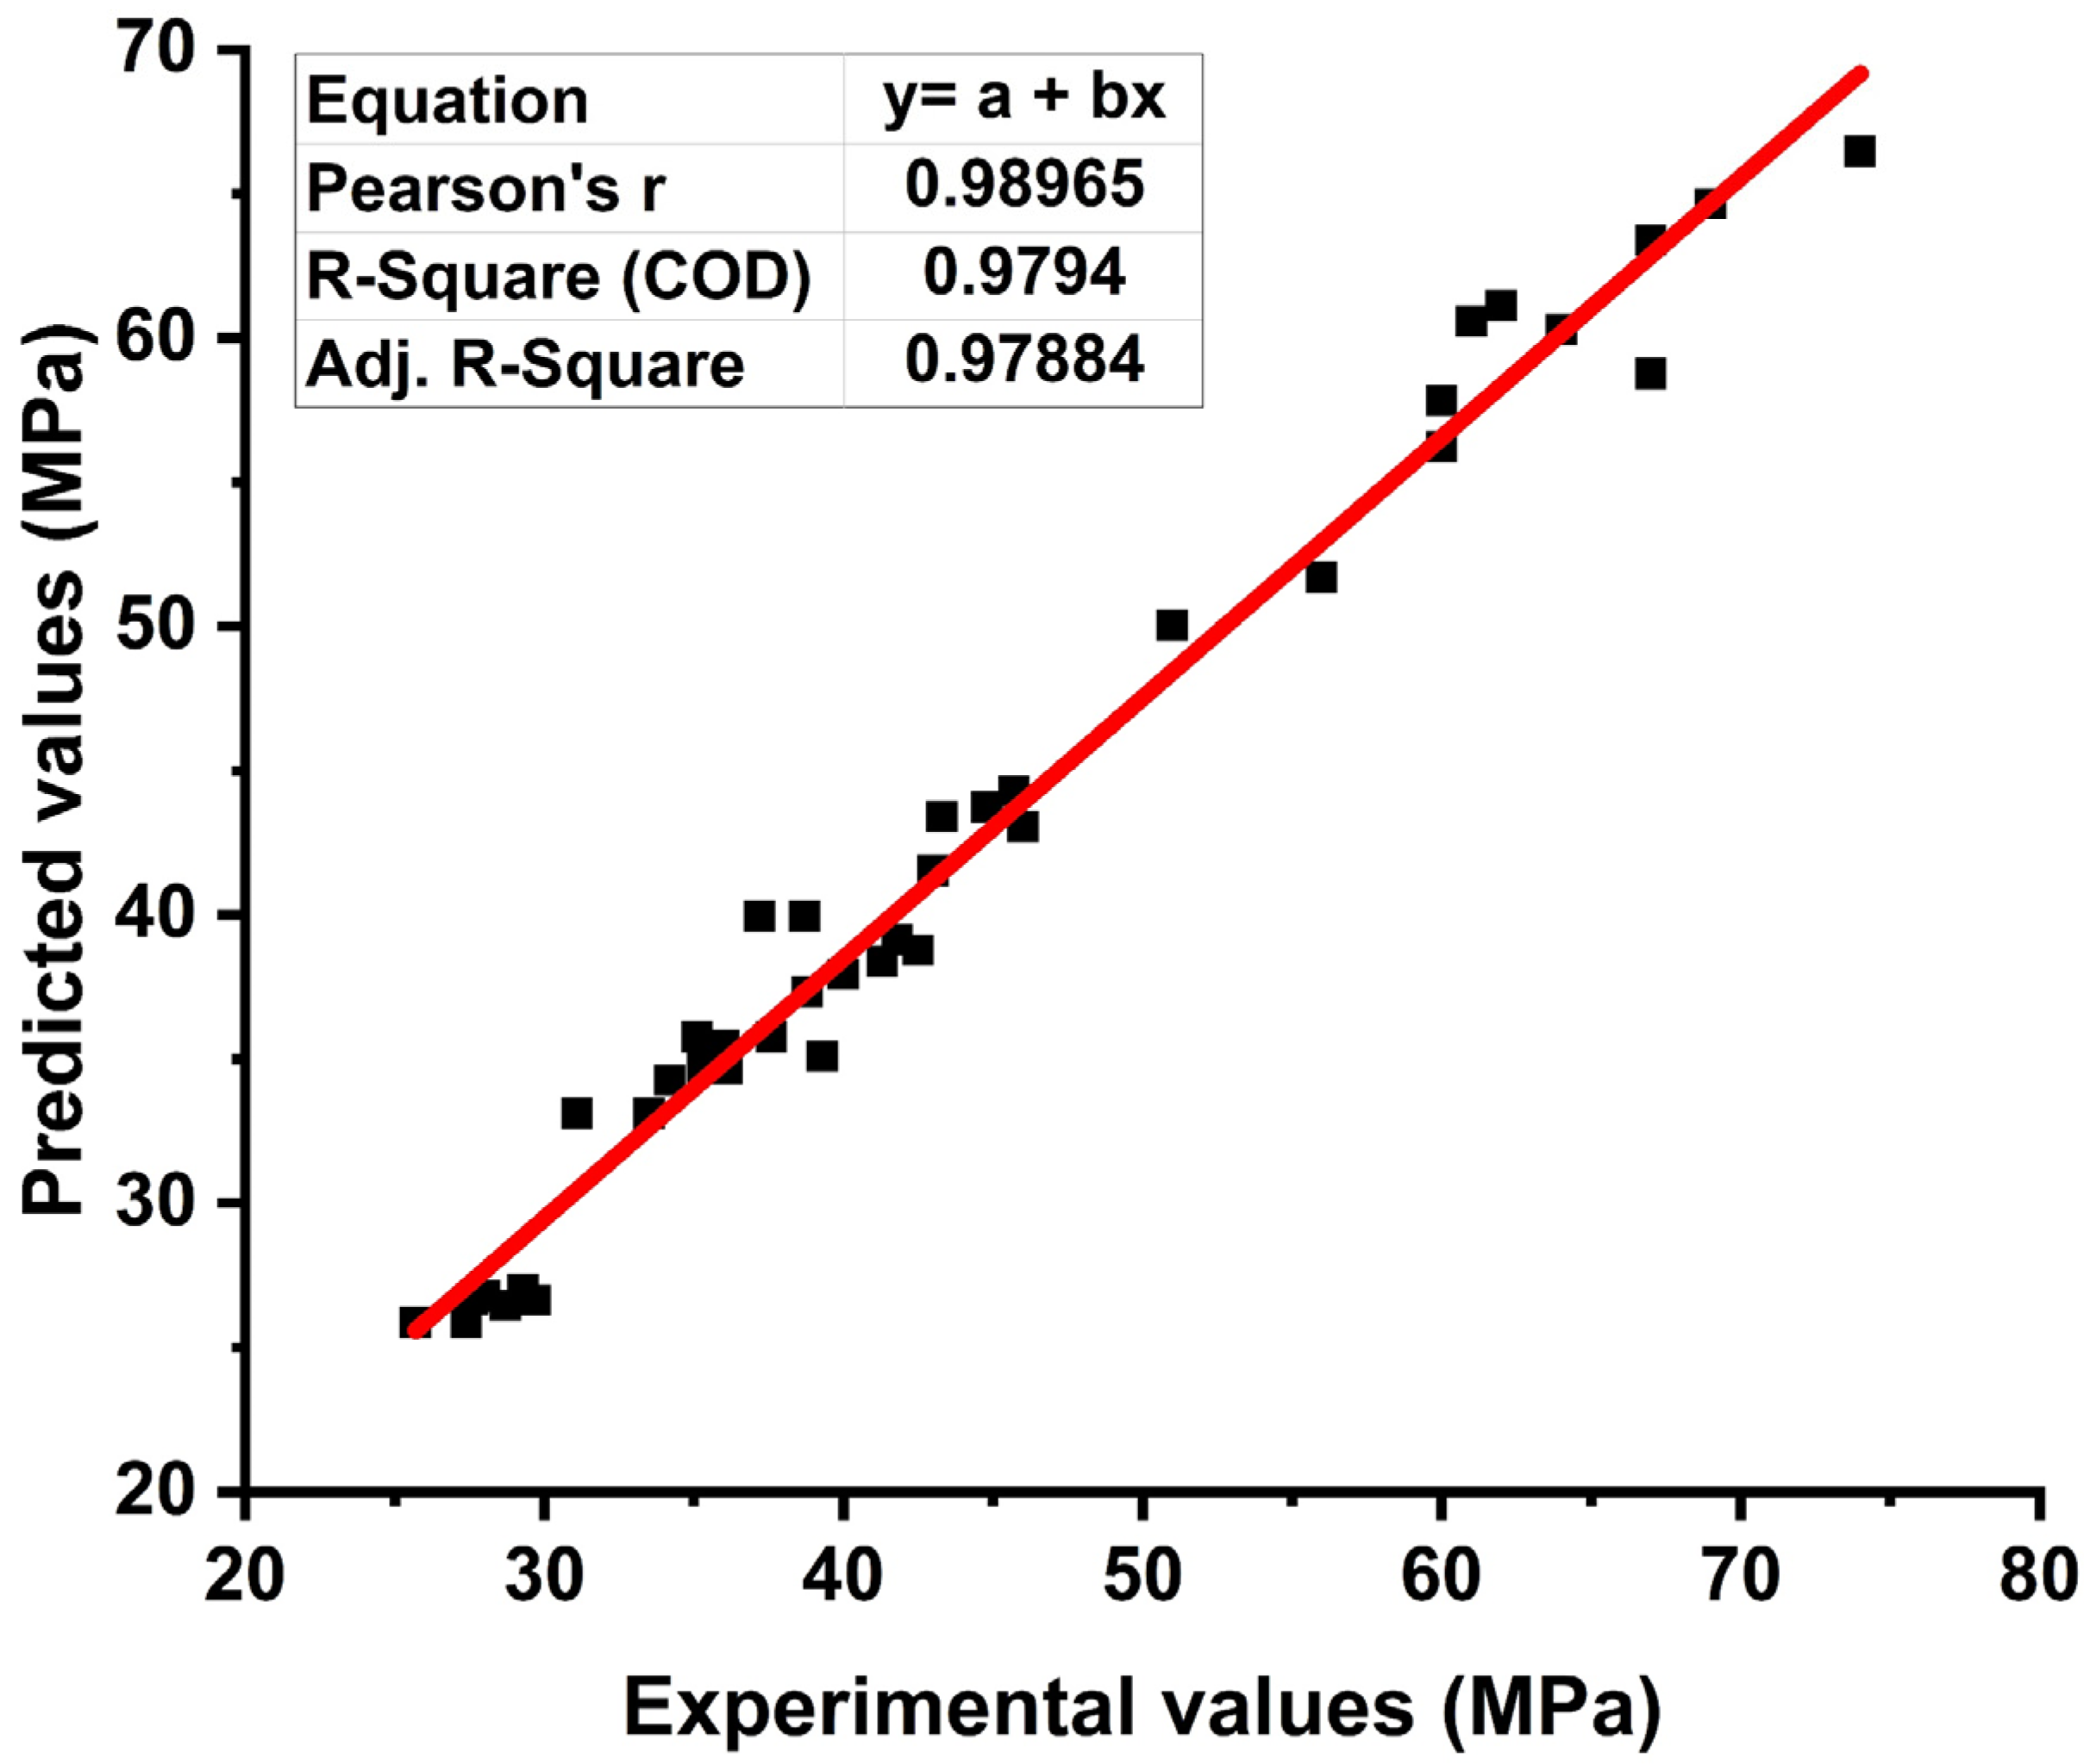
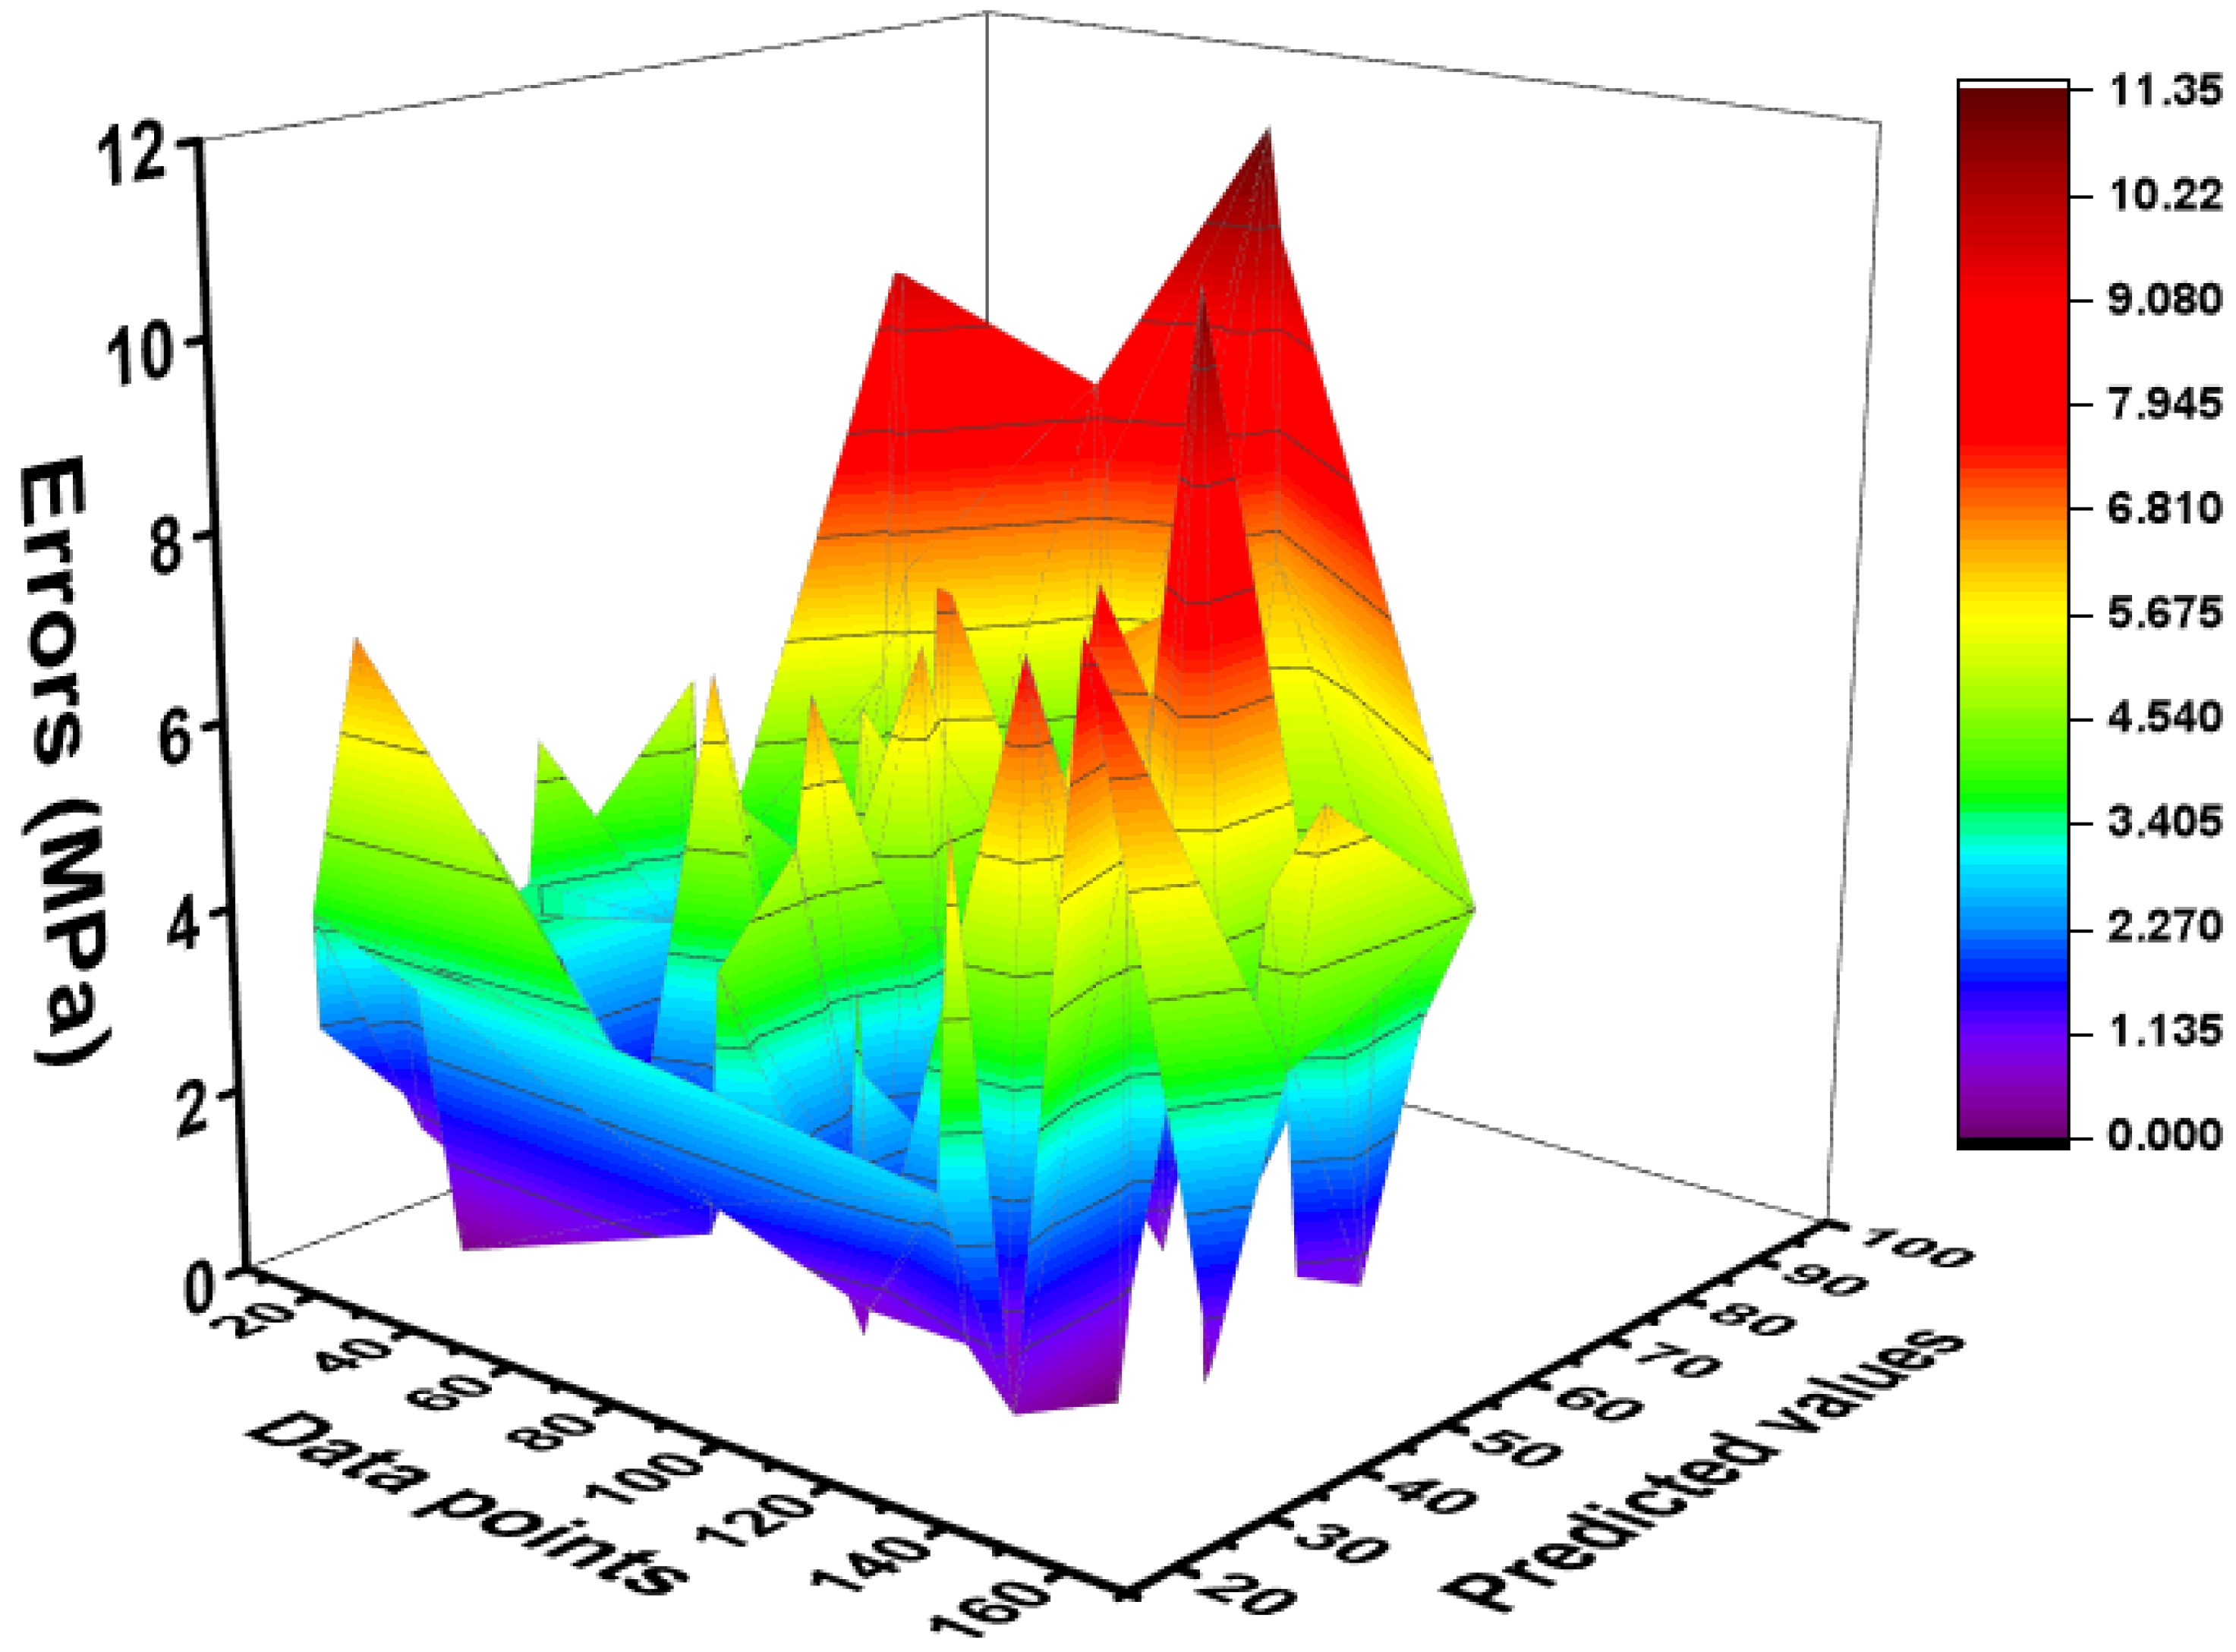
5.2. Performance Evaluation of MEP Model
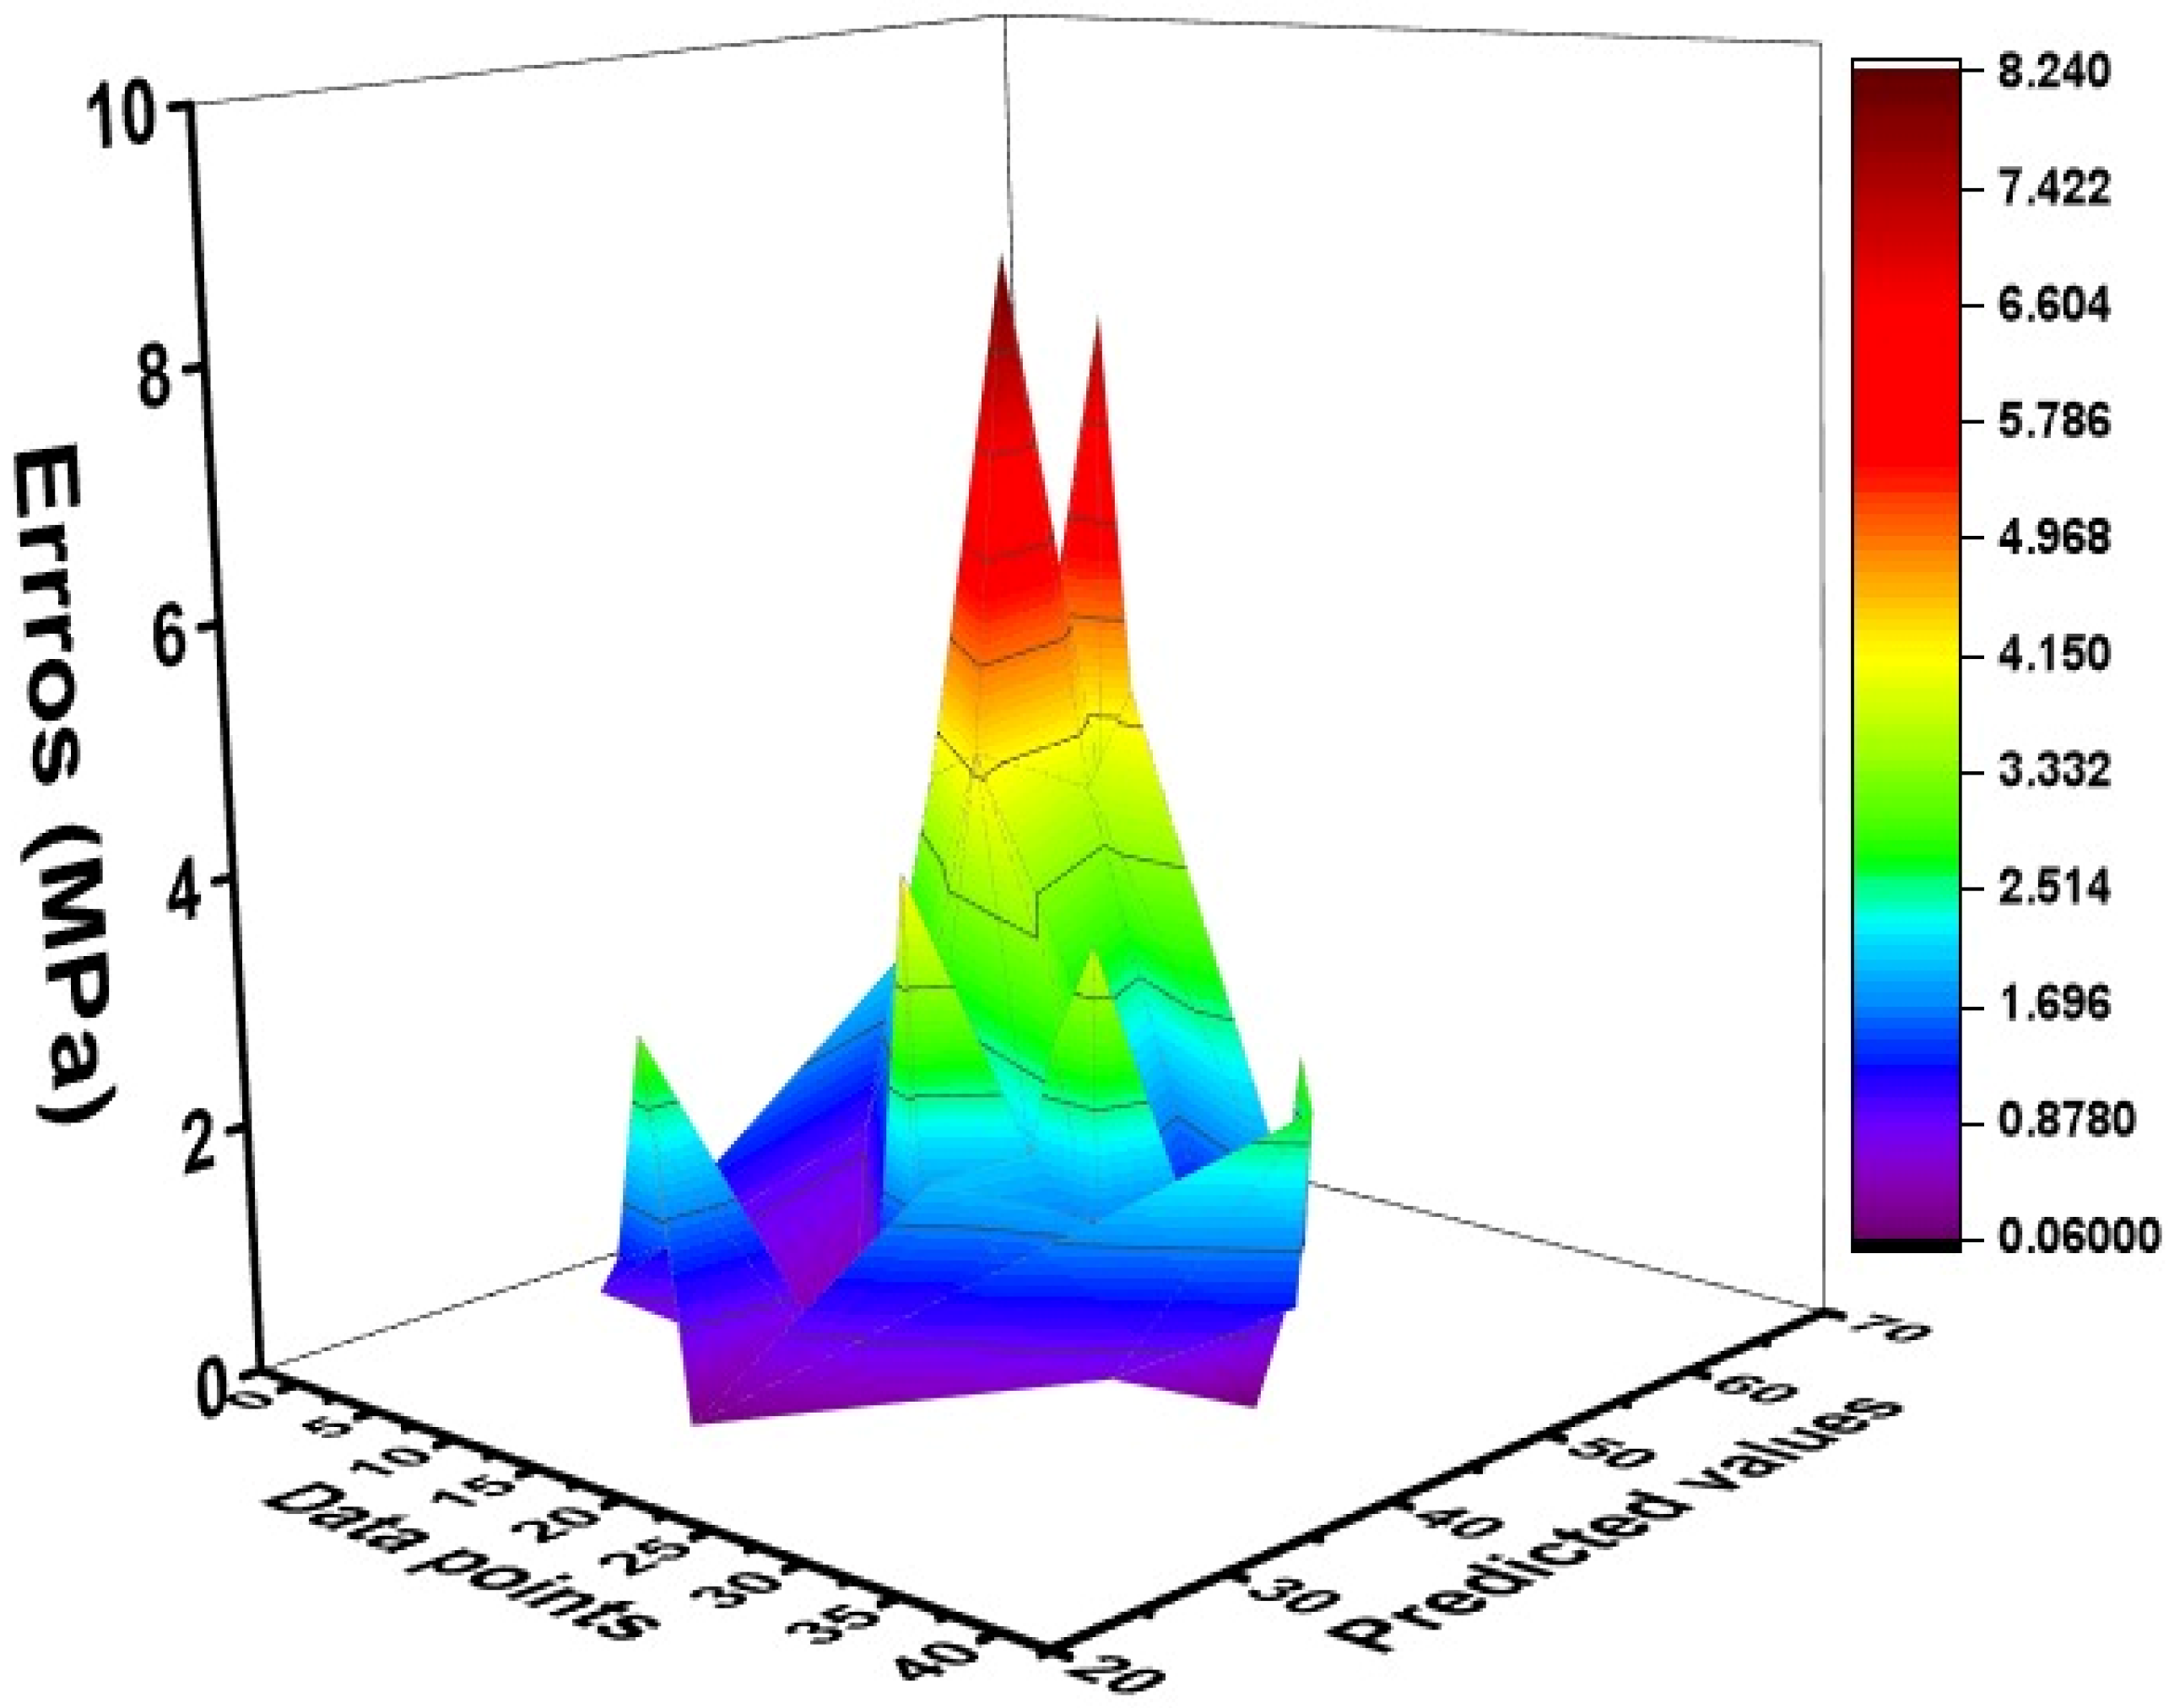
5.3. External Validation
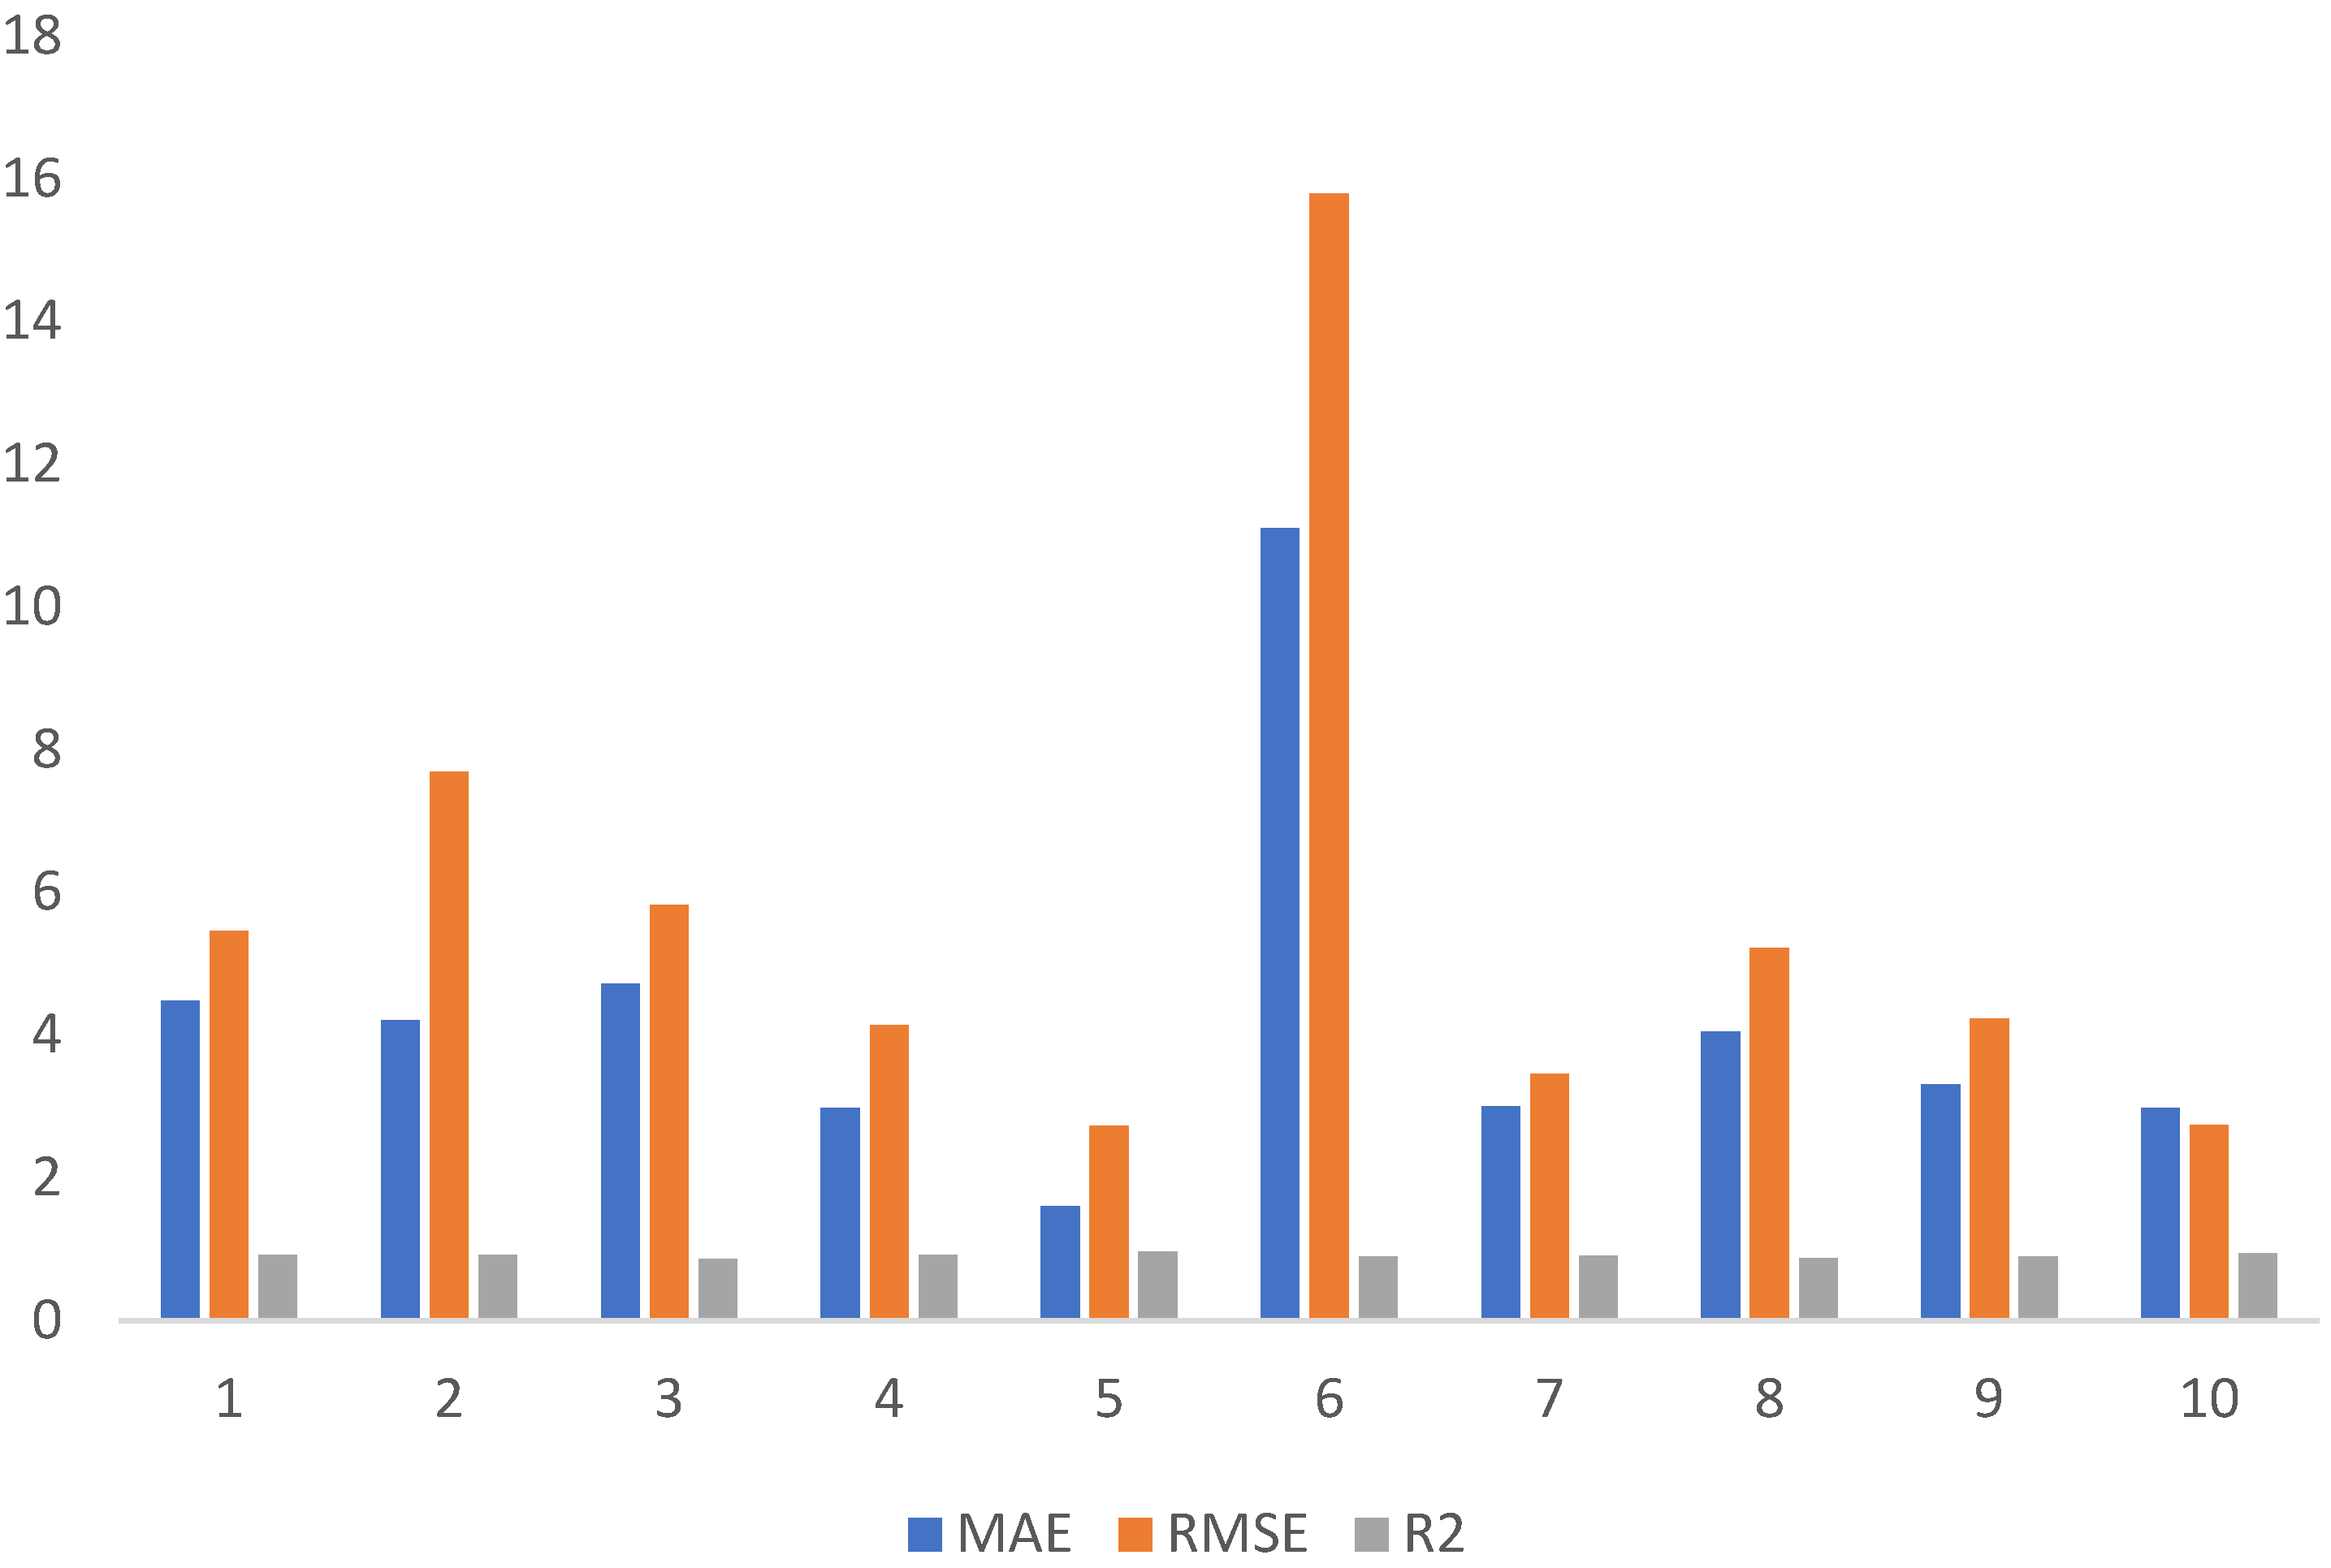
5.4. 10-K Fold Cross Validation
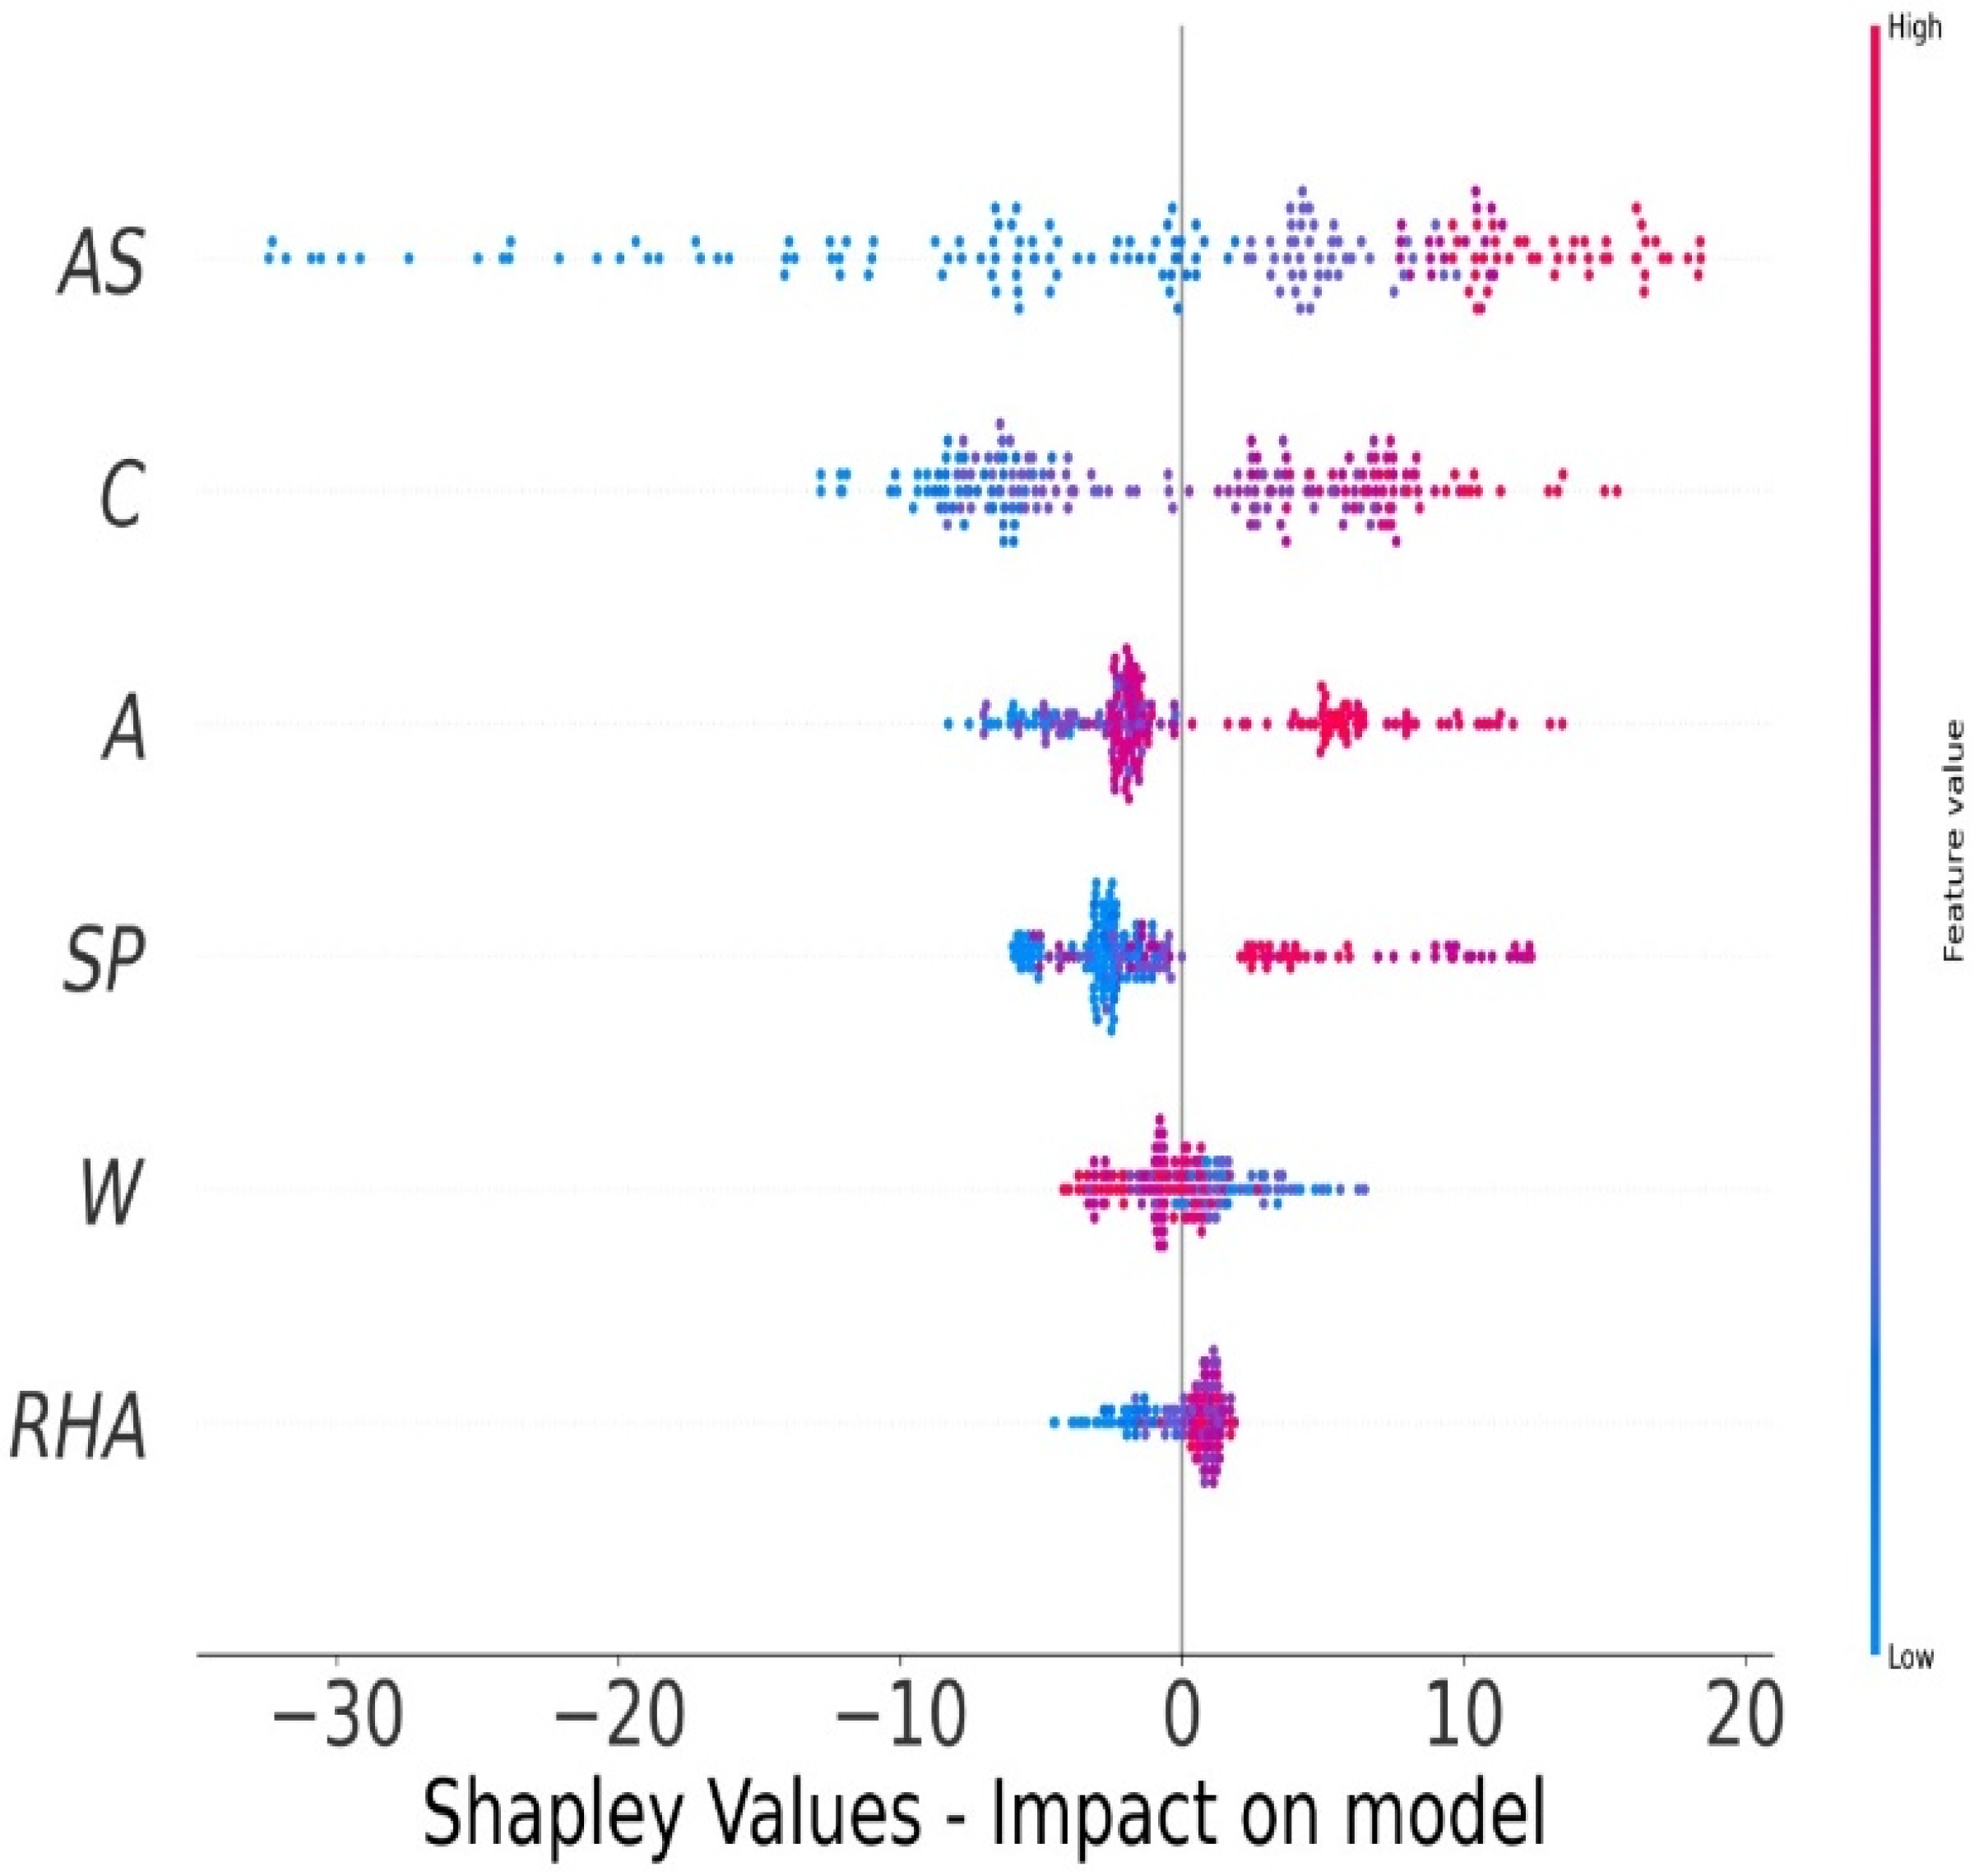
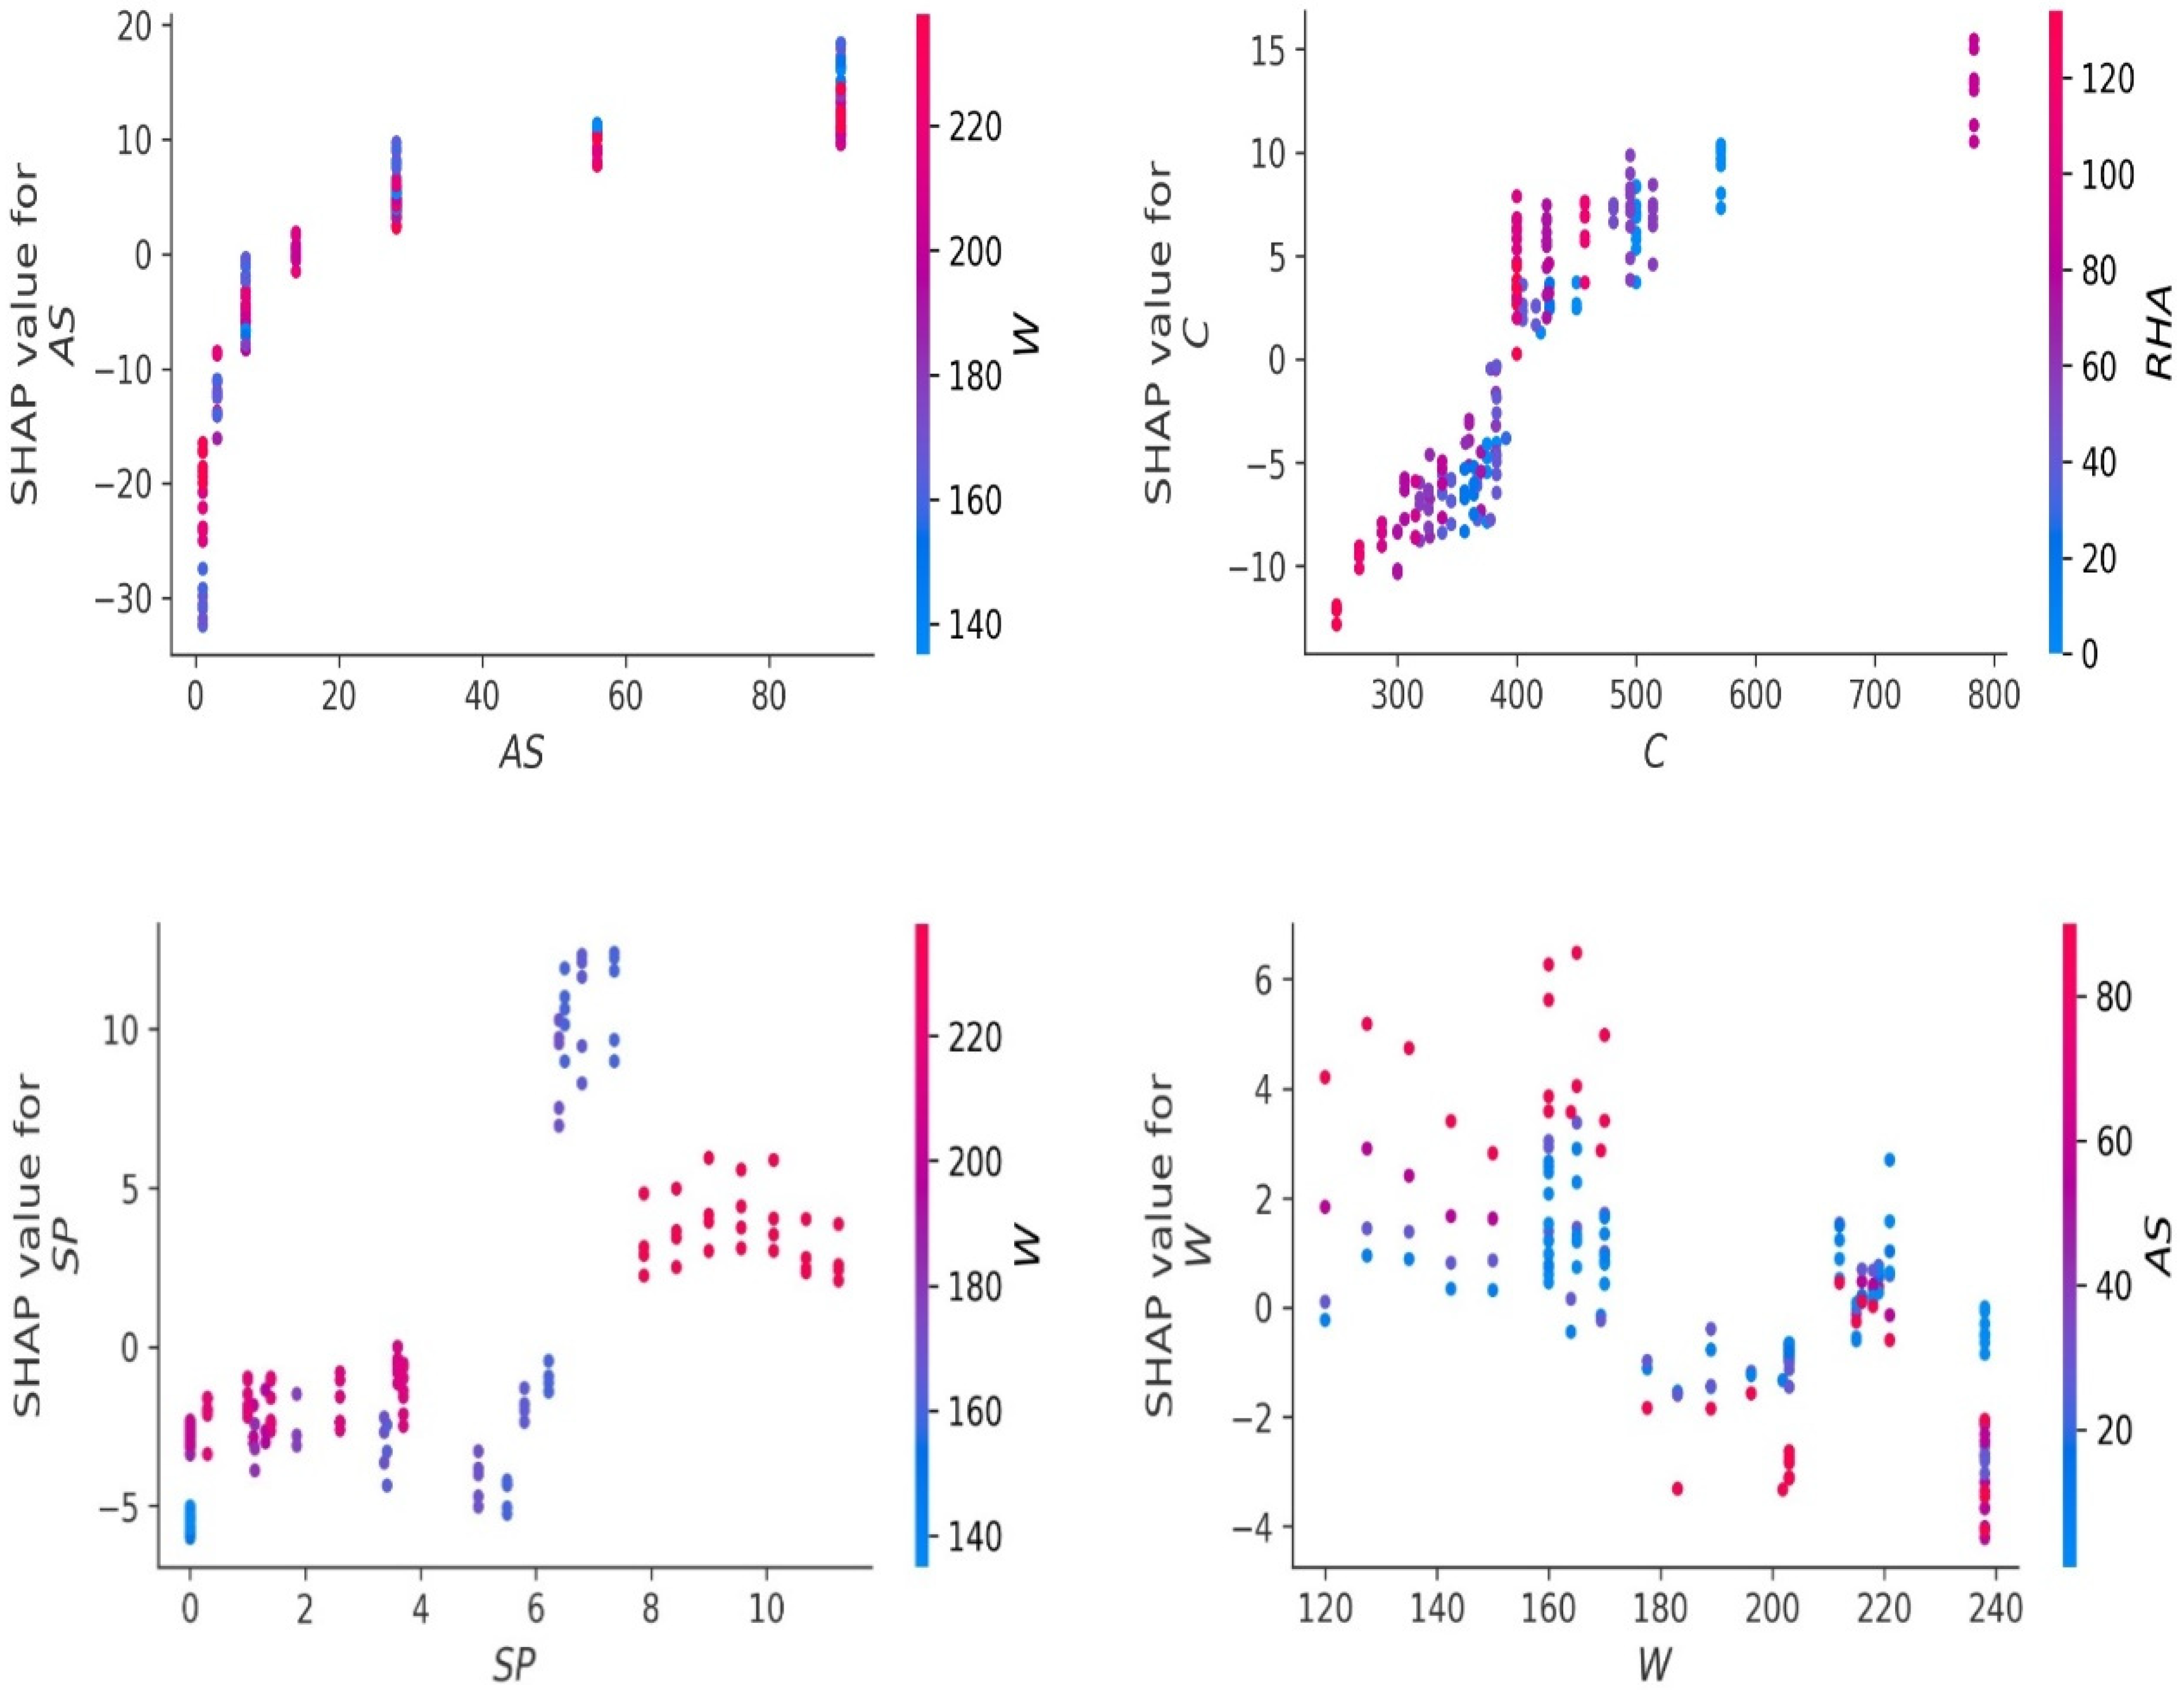
5.5. Explanation Using MEP Model
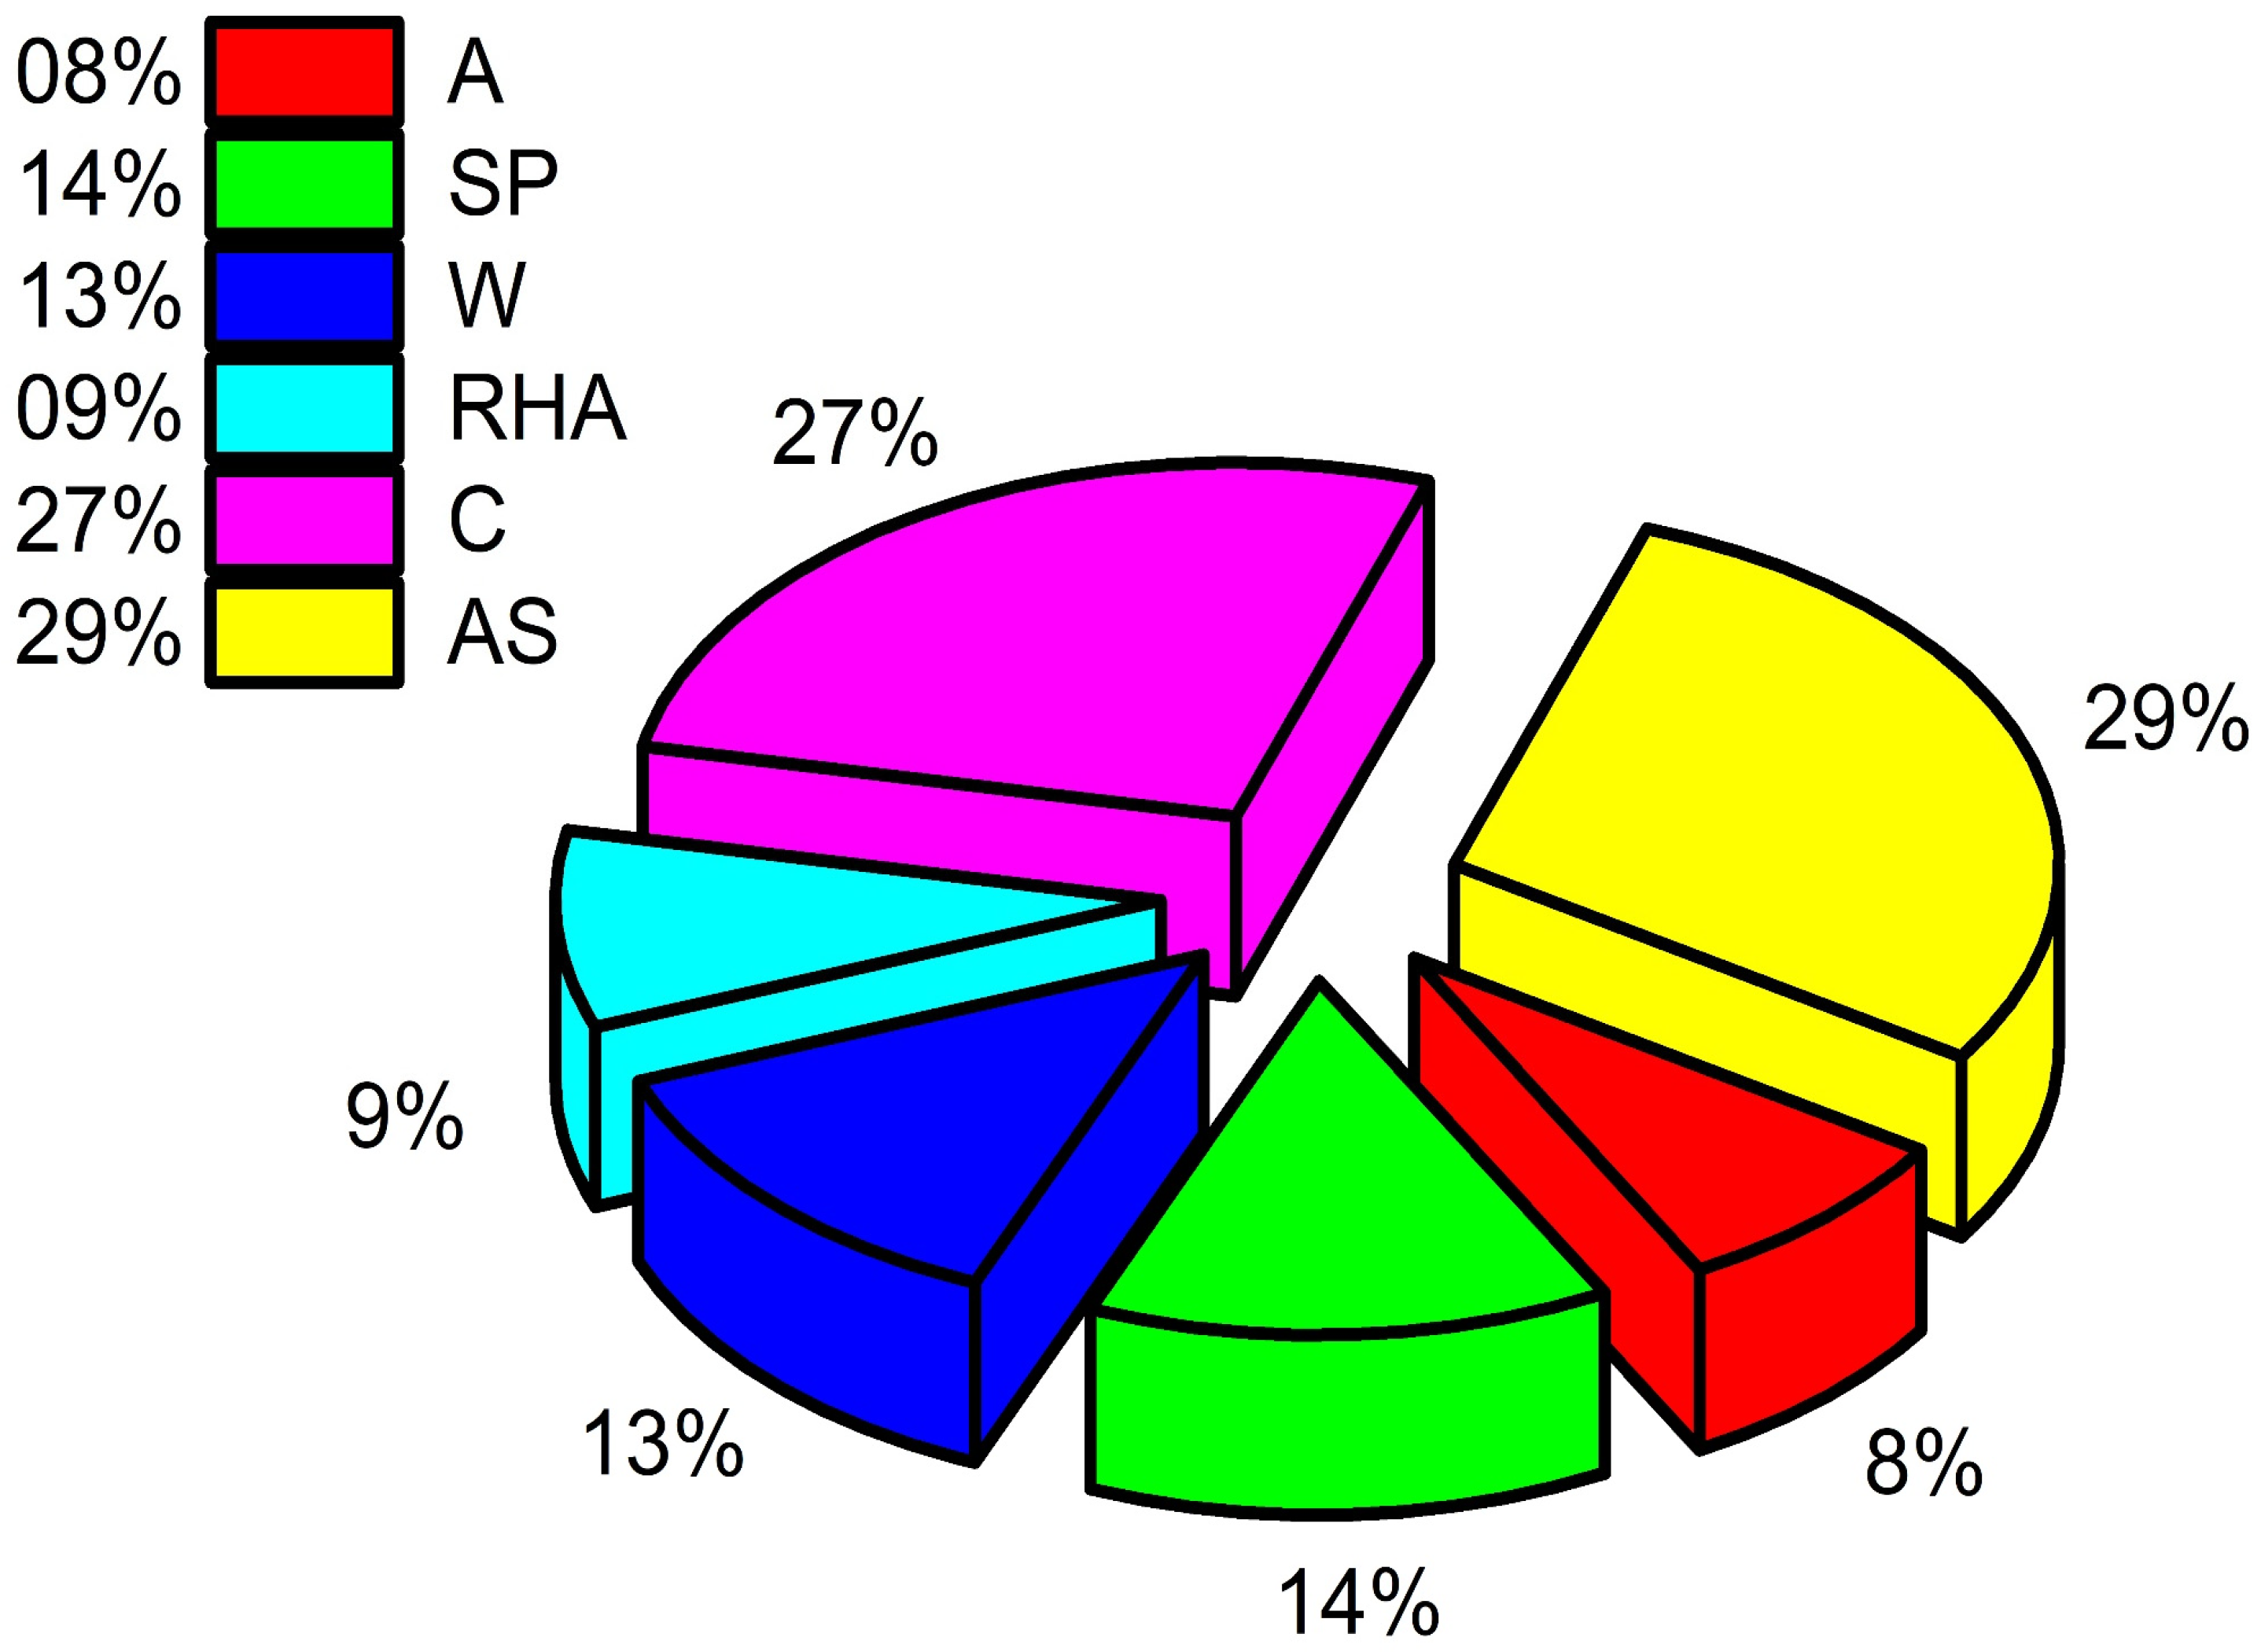
5.6. Sensitivity Analysis
6. Conclusions
Future Recommendation
Supplementary Materials
Author Contributions
Funding
Institutional Review Board Statement
Informed Consent Statement
Data Availability Statement
Acknowledgments
Conflicts of Interest
Abbreviations
| RHA | Rice husk ash |
| MEP | Multi-expression programming |
| CRHA | Concrete made with rice husk ash |
| SHAP | SHapley Additive exPlanations |
| OPC | Ordinary Portland cement |
| AIA | Artificial intelligence algorithms |
| BBA | Black-box algorithms |
| EA | Evolutionary algorithms |
| GA | Genetic algorithm |
| NN | Neural network |
| GEP | Gene expression programming |
| SP | Superplasticizer |
| C | Amount of cement |
| W | Amount of water |
| A | Amount of aggregate |
| AC | Age of concrete |
| CS | Compressive strength |
| RMSE | Root mean square error |
| R | Coefficient of correlation |
| MAE | Mean absolute error |
| R2 | Coefficient of regression |
| RRMSE | Relative root mean square error |
| RE | Relative squared error |
| Performance index | |
| OBF | Objective function |
| NSE | Normalized mean square error |
Appendix A
| pg[0] = x[0]; |
| pg[1] = sqrt(pg[0]); |
| pg[2] = x[1]; |
| pg[3] = x[3]; |
| pg[4] = exp(pg[1]); |
| pg[5] = pg[1] × pg[2]; |
| pg[6] = pg[4] / pg[3]; |
| pg[7] = pg[0] + pg[3]; |
| pg[8] = pg[2] − pg[7]; |
| pg[9] = x[4]; |
| pg[10] = pg[8] × pg[9]; |
| pg[11] = pg[10] + pg[5]; |
| pg[12] = pg[1] × pg[0]; |
| pg[13] = pg[8] + pg[11]; |
| pg[14] = pow(pg[1], pg[9]); |
| pg[15] = pg[13] − pg[12]; |
| pg[16] = sqrt(pg[15]); |
| pg[17] = x[2]; |
| pg[18] = pg[6] + pg[8]; |
| pg[19] = pg[9] × pg[17]; |
| pg[20] = pg[12] / pg[18]; |
| pg[21] = pg[19] + pg[18]; |
| pg[22] = sqrt(pg[11]); |
| pg[23] = pg[5] / pg[21]; |
| pg[24] = sqrt(pg[14]); |
| pg[25] = pg[24] × pg[4]; |
| pg[26] = pg[6] − pg[20]; |
| pg[27] = pg[22] / pg[25]; |
| pg[28] = pg[26] / pg[23]; |
| pg[29] = pg[16] − pg[27]; |
| pg[30] = pg[29] + pg[28]; |
References
- Imtiaz, L.; Rehman, S.K.U.; Ali Memon, S.; Khizar Khan, M.; Faisal Javed, M. A review of recent developments and advances in eco-friendly geopolymer concrete. Appl. Sci. 2020, 10, 7838. [Google Scholar] [CrossRef]
- Yang, H.; Liu, L.; Yang, W.; Liu, H.; Ahmad, W.; Ahmad, A.; Aslam, F.; Joyklad, P. A comprehensive overview of geopolymer composites: A bibliometric analysis and literature review. Case Stud. Constr. Mater. 2022, 16, e00830. [Google Scholar] [CrossRef]
- Akbar, A.; Farooq, F.; Shafique, M.; Aslam, F.; Alyousef, R.; Alabduljabbar, H. Sugarcane bagasse ash-based engineered geopolymer mortar incorporating propylene fibers. J. Build. Eng. 2021, 33, 101492. [Google Scholar] [CrossRef]
- Alyousef, R.; Ahmad, W.; Ahmad, A.; Aslam, F.; Joyklad, P.; Alabduljabbar, H. Potential use of recycled plastic and rubber aggregate in cementitious materials for sustainable construction: A review. J. Clean. Prod. 2021, 329, 129736. [Google Scholar] [CrossRef]
- Ahmad, W.; Ahmad, A.; Ostrowski, K.A.; Aslam, F.; Joyklad, P.; Zajdel, P. Sustainable approach of using sugarcane bagasse ash in cement-based composites: A systematic review. Case Stud. Constr. Mater. 2021, 15, e00698. [Google Scholar] [CrossRef]
- Ahmad, W.; Ahmad, A.; Ostrowski, K.A.; Aslam, F.; Joyklad, P. A scientometric review of waste material utilization in concrete for sustainable construction. Case Stud. Constr. Mater. 2021, 15, e00683. [Google Scholar] [CrossRef]
- Santhosh, K.G.; Subhani, S.M.; Bahurudeen, A. Recycling of palm oil fuel ash and rice husk ash in the cleaner production of concrete—A review. J. Clean. Prod. 2022, 354, 131736. [Google Scholar] [CrossRef]
- Yao, W.; Bai, M.; Pang, J.; Liu, T. Performance degradation and damage model of rice husk ash concrete under dry–wet cycles of sulfate environment. Environ. Sci. Pollut. Res. 2022, 1–17. [Google Scholar] [CrossRef]
- Siddika, A.; Al Mamun, M.A.; Alyousef, R.; Mohammadhosseini, H. State-of-the-art-review on rice husk ash: A supplementary cementitious material in concrete. J. King Saud Univ.-Eng. Sci. 2021, 33, 294–307. [Google Scholar] [CrossRef]
- Thomas, B.S. Green concrete partially comprised of rice husk ash as a supplementary cementitious material–A comprehensive review. Renew. Sustain. Energy Rev. 2018, 82, 3913–3923. [Google Scholar] [CrossRef]
- Amran, M.; Fediuk, R.; Murali, G.; Vatin, N.; Karelina, M.; Ozbakkaloglu, T.; Krishna, R.; Kumar, S.A.; Kumar, D.S.; Mishra, J. Rice husk ash-based concrete composites: A critical review of their properties and applications. Crystals 2021, 11, 168. [Google Scholar] [CrossRef]
- Iftikhar, B.; Alih, S.C.; Vafaei, M.; Elkotb, M.A.; Shutaywi, M.; Javed, M.F.; Deebani, W.; Khan, M.I.; Aslam, F. Predictive modeling of compressive strength of sustainable rice husk ash concrete: Ensemble learner optimization and comparison. J. Clean. Prod. 2022, 348, 131285. [Google Scholar] [CrossRef]
- Aslam, F.; Elkotb, M.A.; Iqtidar, A.; Khan, M.A.; Javed, M.F.; Usanova, K.I.; Khan, M.I.; Alamri, S.; Musarat, M.A. Compressive strength prediction of rice husk ash using multiphysics genetic expression programming. Ain Shams Eng. J. 2022, 13, 101593. [Google Scholar] [CrossRef]
- Das, S.K.; Mishra, J.; Mustakim, S.M. Rice husk ash as a potential source material for geopolymer concrete: A. Int. J. Appl. Eng. Res. 2018, 13, 81–84. [Google Scholar]
- Das, S.K.; Mishra, J.; Singh, S.K.; Mustakim, S.M.; Patel, A.; Das, S.K.; Behera, U. Characterization and utilization of rice husk ash (RHA) in fly ash–Blast furnace slag based geopolymer concrete for sustainable future. Mater. Today Proc. 2020, 33, 5162–5167. [Google Scholar] [CrossRef]
- Ahmadi, M.H.; Baghban, A.; Sadeghzadeh, M.; Zamen, M.; Mosavi, A.; Shamshirband, S.; Kumar, R.; Mohammadi-Khanaposhtani, M. Evaluation of electrical efficiency of photovoltaic thermal solar collector. Eng. Appl. Comput. Fluid Mech. 2020, 14, 545–565. [Google Scholar] [CrossRef] [Green Version]
- Asadi, E.; Isazadeh, M.; Samadianfard, S.; Ramli, M.F.; Mosavi, A.; Nabipour, N.; Shamshirband, S.; Hajnal, E.; Chau, K.W. Groundwater quality assessment for sustainable drinking and irrigation. Sustainability 2019, 12, 177. [Google Scholar] [CrossRef] [Green Version]
- Farooq, F.; Jin, X.; Javed, M.F.; Akbar, A.; Shah, M.I.; Aslam, F.; Alyousef, R. Geopolymer concrete as sustainable material: A state of the art review. Constr. Build. Mater. 2021, 306, 124762. [Google Scholar] [CrossRef]
- Ghalandari, M.; Shamshirband, S.; Mosavi, A.; Chau, K.W. Flutter speed estimation using presented differential quadrature method formulation. Eng. Appl. Comput. Fluid Mech. 2019, 13, 804–810. [Google Scholar] [CrossRef] [Green Version]
- Nabipour, M.; Nayyeri, P.; Jabani, H.; Shahab, S.; Mosavi, A. Predicting stock market trends using machine learning and deep learning algorithms via continuous and binary data; a comparative analysis. IEEE Access 2020, 8, 150199–150212. [Google Scholar] [CrossRef]
- Aldrees, A.; Khan, M.A.; Tariq, M.A.U.R.; Mustafa Mohamed, A.; Ng, A.W.M.; Bakheit Taha, A.T. Multi-Expression Programming (MEP): Water Quality Assessment Using Water Quality Indices. Water 2022, 14, 947. [Google Scholar] [CrossRef]
- Khan, M.A.; Farooq, F.; Javed, M.F.; Zafar, A.; Ostrowski, K.A.; Aslam, F.; Malazdrewicz, S.; Maślak, M. Simulation of Depth of Wear of Eco-Friendly Concrete Using Machine Learning Based Computational Approaches. Materials 2022, 15, 58. [Google Scholar] [CrossRef]
- Farooq, F.; Czarnecki, S.; Niewiadomski, P.; Aslam, F.; Alabduljabbar, H.; Ostrowski, K.A.; Śliwa-Wieczorek, K.; Nowobilski, T.; Malazdrewicz, S. A comparative study for the prediction of the compressive strength of self-compacting concrete modified with fly ash. Materials 2021, 14, 4934. [Google Scholar] [CrossRef] [PubMed]
- Band, S.S.; Janizadeh, S.; Chandra Pal, S.; Saha, A.; Chakrabortty, R.; Melesse, A.M.; Mosavi, A. Flash flood susceptibility modeling using new approaches of hybrid and ensemble tree-based machine learning algorithms. Remote Sens. 2020, 12, 3568. [Google Scholar] [CrossRef]
- Band, S.S.; Janizadeh, S.; Chandra Pal, S.; Saha, A.; Chakrabortty, R.; Shokri, M.; Mosavi, A. Novel ensemble approach of deep learning neural network (DLNN) model and particle swarm optimization (PSO) algorithm for prediction of gully erosion susceptibility. Sensors 2020, 20, 5609. [Google Scholar] [CrossRef] [PubMed]
- Shabani, S.; Samadianfard, S.; Sattari, M.T.; Mosavi, A.; Shamshirband, S.; Kmet, T.; Várkonyi-Kóczy, A.R. Modeling pan evaporation using Gaussian process regression K-nearest neighbors random forest and support vector machines; comparative analysis. Atmosphere 2020, 11, 66. [Google Scholar] [CrossRef] [Green Version]
- Shamshirband, S.; Mosavi, A.; Rabczuk, T.; Nabipour, N.; Chau, K.W. Prediction of significant wave height; comparison between nested grid numerical model, and machine learning models of artificial neural networks, extreme learning and support vector machines. Eng. Appl. Comput. Fluid Mech. 2020, 14, 805–817. [Google Scholar] [CrossRef]
- Taherei Ghazvinei, P.; Hassanpour Darvishi, H.; Mosavi, A.; Yusof, K.B.W.; Alizamir, M.; Shamshirband, S.; Chau, K.W. Sugarcane growth prediction based on meteorological parameters using extreme learning machine and artificial neural network. Eng. Appl. Comput. Fluid Mech. 2018, 12, 738–749. [Google Scholar] [CrossRef] [Green Version]
- Torabi, M.; Hashemi, S.; Saybani, M.R.; Shamshirband, S.; Mosavi, A. A Hybrid clustering and classification technique for forecasting short-term energy consumption. Environ. Prog. Sustain. Energy 2019, 38, 66–76. [Google Scholar] [CrossRef] [Green Version]
- Farooq, F.; Ahmed, W.; Akbar, A.; Aslam, F.; Alyousef, R. Predictive modeling for sustainable high-performance concrete from industrial wastes: A comparison and optimization of models using ensemble learners. J. Clean. Prod. 2021, 292, 126032. [Google Scholar] [CrossRef]
- Azim, I.; Yang, J.; Javed, M.F.; Iqbal, M.F.; Mahmood, Z.; Wang, F.; Liu, Q. feng Prediction model for compressive arch action capacity of RC frame structures under column removal scenario using gene expression programming. Structures 2020, 25, 212–228. [Google Scholar] [CrossRef]
- Iqbal, M.F.; Javed, M.F.; Rauf, M.; Azim, I.; Ashraf, M.; Yang, J.; Liu, Q.F. Sustainable utilization of foundry waste: Forecasting mechanical properties of foundry sand based concrete using multi-expression programming. Sci. Total Environ. 2021, 780, 146524. [Google Scholar] [CrossRef] [PubMed]
- Iqbal, M.; Zhang, D.; Jalal, F.E.; Faisal Javed, M. Computational AI prediction models for residual tensile strength of GFRP bars aged in the alkaline concrete environment. Ocean. Eng. 2021, 232, 109134. [Google Scholar] [CrossRef]
- Jalal, F.E.; Xu, Y.; Iqbal, M.; Jamhiri, B.; Javed, M.F. Predicting the compaction characteristics of expansive soils using two genetic programming-based algorithms. Transp. Geotech. 2021, 30, 100608. [Google Scholar] [CrossRef]
- Jalal, F.E.; Xu, Y.; Iqbal, M.; Javed, M.F.; Jamhiri, B. Predictive modeling of swell-strength of expansive soils using artificial intelligence approaches: ANN, ANFIS and GEP. J. Environ. Manag. 2021, 289, 112420. [Google Scholar] [CrossRef] [PubMed]
- Zha, T.H.; Castillo, O.; Jahanshahi, H.; Yusuf, A.; Alassafi, M.O.; Alsaadi, F.E.; Chu, Y.M. A fuzzy-based strategy to suppress the novel coronavirus (2019-NCOV) massive outbreak. Appl. Comput. Math. 2021, 20, 160–176. [Google Scholar]
- Zhao, T.H.; Khan, M.I.; Chu, Y.M. Artificial neural networking (ANN) analysis for heat and entropy generation in flow of non-Newtonian fluid between two rotating disks. Math. Methods Appl. Sci. 2021. [Google Scholar] [CrossRef]
- Zhao, T.H.; Qian, W.M.; Chu, Y.M. Sharp power mean bounds for the tangent and hyperbolic sine means. J. Math. Inequalities 2021, 15, 1459–1472. [Google Scholar] [CrossRef]
- Ghalandari, M.; Ziamolki, A.; Mosavi, A.; Shamshirband, S.; Chau, K.W.; Bornassi, S. Aeromechanical optimization of first row compressor test stand blades using a hybrid machine learning model of genetic algorithm, artificial neural networks and design of experiments. Eng. Appl. Comput. Fluid Mech. 2019, 13, 892–904. [Google Scholar] [CrossRef] [Green Version]
- Joloudari, J.H.; Hassannataj Joloudari, E.; Saadatfar, H.; Ghasemigol, M.; Razavi, S.M.; Mosavi, A.; Nabipour, N.; Shamshirband, S.; Nadai, L. Coronary artery disease diagnosis; ranking the significant features using a random trees model. Int. J. Environ. Res. Public Health 2020, 17, 731. [Google Scholar] [CrossRef] [Green Version]
- Mahmoudi, M.R.; Heydari, M.H.; Qasem, S.N.; Mosavi, A.; Band, S.S. Principal component analysis to study the relations between the spread rates of COVID-19 in high risks countries. Alex. Eng. J. 2021, 60, 457–464. [Google Scholar] [CrossRef]
- Behnood, A.; Golafshani, E.M. Machine learning study of the mechanical properties of concretes containing waste foundry sand. Constr. Build. Mater. 2020, 243, 118152. [Google Scholar] [CrossRef]
- Iqbal, M.F.; Liu, Q.F.; Azim, I.; Zhu, X.; Yang, J.; Javed, M.F.; Rauf, M. Prediction of mechanical properties of green concrete incorporating waste foundry sand based on gene expression programming. J. Hazard. Mater. 2020, 384, 121322. [Google Scholar] [CrossRef] [PubMed]
- Farooq, F.; Amin, M.N.; Khan, K.; Sadiq, M.R.; Javed, M.F.; Aslam, F.; Alyousef, R. A comparative study of random forest and genetic engineering programming for the prediction of compressive strength of high strength concrete (HSC). Appl. Sci. 2020, 10, 7330. [Google Scholar] [CrossRef]
- Chu, H.H.; Khan, M.A.; Javed, M.; Zafar, A.; Khan, M.I.; Alabduljabbar, H.; Qayyum, S. Sustainable use of fly-ash: Use of gene-expression programming (GEP) and multi-expression programming (MEP) for forecasting the compressive strength geopolymer concrete. Ain Shams Eng. J. 2021, 12, 3603–3617. [Google Scholar] [CrossRef]
- Fallahpour, A.; Wong, K.Y.; Rajoo, S.; Tian, G. An evolutionary-based predictive soft computing model for the prediction of electricity consumption using multi expression programming. J. Clean. Prod. 2021, 283, 125287. [Google Scholar] [CrossRef]
- Zou, Y.; Zheng, C.; Alzahrani, A.M.; Ahmad, W.; Ahmad, A.; Mohamed, A.M.; Elattar, S. Evaluation of Artificial Intelligence Methods to Estimate the Compressive Strength of Geopolymers. Gels 2022, 8, 271. [Google Scholar] [CrossRef]
- Oltean, M.; Groşan, C. Evolving evolutionary algorithms using multi expression programming. In European Conference on Artificial Life; Springer: Berlin/Heidelberg, Germany, 2003; pp. 651–658. [Google Scholar]
- Koza, J.R.; Koza, J.R. Genetic Programming: On the Programming of Computers by Means of Natural Selection; MIT Press: Cambridge, MA, USA, 1992; Volume 1. [Google Scholar]
- Khan, S.; Ali Khan, M.; Zafar, A.; Javed, M.F.; Aslam, F.; Musarat, M.A.; Vatin, N.I. Predicting the Ultimate Axial Capacity of Uniaxially Loaded CFST Columns Using Multiphysics Artificial Intelligence. Materials 2022, 15, 39. [Google Scholar] [CrossRef]
- Ilyas, I.; Zafar, A.; Javed, M.F.; Farooq, F.; Aslam, F.; Musarat, M.A.; Vatin, N.I. Forecasting Strength of CFRP Confined Concrete Using Multi Expression Programming. Materials 2021, 14, 7134. [Google Scholar] [CrossRef]
- Ameri, F.; Shoaei, P.; Bahrami, N.; Vaezi, M.; Ozbakkaloglu, T. Optimum rice husk ash content and bacterial concentration in self-compacting concrete. Constr. Build. Mater. 2019, 222, 796–813. [Google Scholar] [CrossRef]
- Chao-Lung, H.; Le Anh-Tuan, B.; Chun-Tsun, C. Effect of rice husk ash on the strength and durability characteristics of concrete. Constr. Build. Mater. 2011, 25, 3768–3772. [Google Scholar] [CrossRef]
- Bui, D.; Hu, J.; Stroeven, P. Particle size effect on the strength of rice husk ash blended gap-graded Portland cement concrete. Cem. Concr. Compos. 2005, 27, 357–366. [Google Scholar] [CrossRef]
- Ganesan, K.; Rajagopal, K.; Thangavel, K. Rice husk ash blended cement: Assessment of optimal level of replacement for strength and permeability properties of concrete. Constr. Build. Mater. 2008, 22, 1675–1683. [Google Scholar] [CrossRef]
- Ramezanianpour, A.; Mahdikhani, M.; Ahmadibeni, G. The effect of rice husk ash on mechanical properties and durability of sustainable concretes. Int. J. Civ. Eng. 2009, 7, 83–91. [Google Scholar]
- Sakr, K. Effects of silica fume and rice husk ash on the properties of heavy weight concrete. J. Mater. Civ. Eng. 2006, 18, 367–376. [Google Scholar] [CrossRef]
- de Sensale, G.R. Strength development of concrete with rice-husk ash. Cem. Concr. Compos. 2006, 28, 158–160. [Google Scholar] [CrossRef]
- Elwell, D.J.; Fu, G. Compression Testing of Concrete: Cylinders vs. Cubes; New York State Department of Transportation: Albany, NY, USA, 1995. [Google Scholar]
- Lopes, H.S.; Weinert, W.R. A Gene Expression Programming System for Time Series Modeling. In Proceedings of the XXV Iberian Latin American Congress on Computational Methods in Engineering (CILAMCE), Recife, Brazil, 21–25 November 2004; pp. 10–12. [Google Scholar]
- Ahmad, A.; Ahmad, W.; Aslam, F.; Joyklad, P. Compressive strength prediction of fly ash-based geopolymer concrete via advanced machine learning techniques. Case Stud. Constr. Mater. 2022, 16, e00840. [Google Scholar] [CrossRef]
- Golbraikh, A.; Tropsha, A. Beware of q2! J. Mol. Graph. Model. 2002, 20, 269–276. [Google Scholar] [CrossRef]
- Hajiseyedazizi, S.N.; Samei, M.E.; Alzabut, J.; Chu, Y.M. On multi-step methods for singular fractional q-integro-differential equations. Open Math. 2021, 19, 1378–1405. [Google Scholar] [CrossRef]
- Nazeer, M.; Hussain, F.; Khan, M.I.; El-Zahar, E.R.; Chu, Y.M.; Malik, M. Theoretical study of MHD electro-osmotically flow of third-grade fluid in micro channel. Appl. Math. Comput. 2022, 420, 126868. [Google Scholar] [CrossRef]
- Rashid, S.; Sultana, S.; Karaca, Y.; Khalid, A.; Chu, Y.M. Some further extensions considering discrete proportional fractional operators. Fractals 2022, 30, 2240026. [Google Scholar] [CrossRef]
- Chu, Y.M.; Nazir, U.; Sohail, M.; Selim, M.M.; Lee, J.R. Enhancement in thermal energy and solute particles using hybrid nanoparticles by engaging activation energy and chemical reaction over a parabolic surface via finite element approach. Fractal Fract. 2021, 5, 119. [Google Scholar] [CrossRef]
- Zhao, T.; Wang, M.; Chu, Y. On the bounds of the perimeter of an ellipse. Acta Math. Sci. 2022, 42, 491–501. [Google Scholar] [CrossRef]
- Zhao, T.H.; Wang, M.K.; Hai, G.J.; Chu, Y.M. Landen inequalities for Gaussian hypergeometric function. Rev. Real Acad. Cienc. Exactas Físicas Naturales. Ser. A. Matemáticas 2022, 116, 53. [Google Scholar] [CrossRef]
- Darban, S.; Ghasemzadeh Tehrani, H.; Karballaeezadeh, N.; Mosavi, A. Application of Analytical Hierarchy Process for Structural Health Monitoring and Prioritizing Concrete Bridges in Iran. Appl. Sci. 2021, 11, 8060. [Google Scholar] [CrossRef]
- Ebrahimi-Khusfi, Z.; Taghizadeh-Mehrjardi, R.; Roustaei, F.; Ebrahimi-Khusfi, M.; Mosavi, A.H.; Heung, B.; Soleimani-Sardo, M.; Scholten, T. Determining the contribution of environmental factors in controlling dust pollution during cold and warm months of western Iran using different data mining algorithms and game theory. Ecol. Indic. 2021, 132, 108287. [Google Scholar] [CrossRef]
- Mala, A.A.; Sherwani, A.F.H.; Younis, K.H.; Faraj, R.H.; Mosavi, A. Mechanical and fracture parameters of ultra-high performance fiber reinforcement concrete cured via steam and water: Optimization of binder content. Materials 2021, 14, 2016. [Google Scholar] [CrossRef]
- Panahi, F.; Ehteram, M.; Ahmed, A.N.; Huang, Y.F.; Mosavi, A.; El-Shafie, A. Streamflow prediction with large climate indices using several hybrid multilayer perceptrons and copula Bayesian model averaging. Ecol. Indic. 2021, 133, 108285. [Google Scholar] [CrossRef]
- Meiabadi, M.S.; Moradi, M.; Karamimoghadam, M.; Ardabili, S.; Bodaghi, M.; Shokri, M.; Mosavi, A.H. Modeling the producibility of 3D printing in polylactic acid using artificial neural networks and fused filament fabrication. Polymers 2021, 13, 3219. [Google Scholar] [CrossRef]
- Peng, Y.; Ghahnaviyeh, M.B.; Ahmad, M.N.; Abdollahi, A.; Bagherzadeh, S.A.; Azimy, H.; Mosavi, A.; Karimipour, A. Analysis of the effect of roughness and concentration of Fe3O4/water nanofluid on the boiling heat transfer using the artificial neural network: An experimental and numerical study. Int. J. Therm. Sci. 2021, 163, 106863. [Google Scholar] [CrossRef]
- Mousavi, S.M.; Ghasemi, M.; Dehghan Manshadi, M.; Mosavi, A. Deep learning for wave energy converter modeling using long short-term memory. Mathematics 2021, 9, 871. [Google Scholar] [CrossRef]


| AS * (Day) | C * (kg/m3) | RHA * (kg/m3) | W * (kg/m3) | SP * (kg/m3) | A * (kg/m3) | CS (MPa) | |
|---|---|---|---|---|---|---|---|
| AS (day) | 1.00 | ||||||
| C30 (kg/m3) | −0.11 | 1.00 | |||||
| RHA (kg/m3) | −0.03 | −0.22 | 1.00 | ||||
| W (kg/m3) | 0.01 | 0.08 | 0.14 | 1.00 | |||
| SP (kg/m3) | 0.00 | 0.25 | −0.02 | 0.27 | 1.00 | ||
| A (kg/m3) | −0.06 | −0.24 | −0.14 | −0.55 | −0.21 | 1.00 | |
| CS (MPa) | 0.49 | 0.37 | −0.02 | −0.24 | 0.30 | 0.15 | 1.00 |
| Description of Variables | AS (Day) | C (kg/m3) | RHA (kg/m3) | W (kg/m3) | SP (kg/m3) | A (kg/m3) | CS (MPa) |
|---|---|---|---|---|---|---|---|
| Mean | 34.57 | 409.02 | 62.33 | 193.54 | 3.34 | 1621.51 | 48.14 |
| Median | 28.00 | 400.00 | 57.00 | 203.00 | 1.85 | 1725.00 | 45.95 |
| Mode | 28.00 | 400.00 | 0.00 | 203.00 | 0.00 | 1725.00 | 47.00 |
| Standard Deviation | 33.52 | 105.47 | 41.55 | 31.93 | 3.52 | 267.77 | 17.54 |
| Sample Variance | 1123.61 | 11,124.88 | 1726.77 | 1019.71 | 12.37 | 71,702.44 | 307.70 |
| Skewness | 0.75 | 1.55 | 0.44 | −0.42 | 0.69 | −0.74 | 0.83 |
| Range | 89.00 | 534.00 | 171.00 | 118.00 | 11.25 | 930.00 | 88.10 |
| Minimum | 1.00 | 249.00 | 0.00 | 120.00 | 0.00 | 1040.00 | 16.00 |
| Maximum | 90.00 | 783.00 | 171.00 | 238.00 | 11.25 | 1970.00 | 104.10 |
| Sum | 6638.00 | 78,531.00 | 11,967.10 | 37,158.91 | 640.35 | 311,330.00 | 9243.10 |
| Count | 192.00 | 192.00 | 192.00 | 192.00 | 192.00 | 192.00 | 192.00 |
| Parameters | MEP |
|---|---|
| Num of subpopulation | 20 |
| Subpopulation size | 1000 |
| Code length | 50 |
| Crossover probability | 0.9 |
| Crossover type | Uniform |
| Mutation probability | 0.001 |
| Tournament size | 2 |
| Operators | 0.5 |
| Variables | 0.5 |
| Number of generations | 1000 |
| Function set | +, −, ×, / |
| Terminal set | Problem input |
| Replication number | 10 |
| Error measure | Mean squared error |
| Problem type | Regression |
| Simplified | Yes |
| Random seed | 0 |
| Number of runs | 10 |
| Number of threads | 1 |
| Trial No. | No. of Subpopulation | Subpopulation Size | Code Length | No. of Generation | Functions Used | R2 | RMSE | MAE | RRSE | Time (Min) |
|---|---|---|---|---|---|---|---|---|---|---|
| MP1 | 10 | 200 | 20 | 200 | +, −, ×, / | 0.9275 | 71.1 | 48.03 | 0.2693 | 0–2 |
| MP2 | 20 | 20 | +, −, ×, / | 0.9448 | 62.17 | 41.82 | 0.2355 | |||
| MP3 | 50 | 25 | +, −, ×, / | 0.9454 | 61.94 | 45.67 | 0.2346 | |||
| MP4 | 70 | 25 | +, −, ×, / | 0.9233 | 74.09 | 47.03 | 0.2806 | |||
| MP5 | 100 | 35 | +, −, ×, / | 0.9221 | 74.33 | 46.89 | 0.2815 | |||
| MP6 | 20 | 400 | 35 | +, −, ×, / | 0.9156 | 88.17 | 60.35 | 0.334 | ||
| MP7 | 600 | 35 | +, −, ×, / | 0.9496 | 59.68 | 41.9 | 0.226 | |||
| MP10 | 40 | 400 | +, −, ×, / | 0.9614 | 53.41 | 38.12 | 0.2023 | 15 | ||
| MP11 | 40 | 600 | +, −, ×, / | 0.9376 | 66.01 | 42.78 | 0.25 | 25 | ||
| MP12 | 1000 | 50 | +, −, ×, / | 0.9298 | 70.13 | 43.56 | 0.2656 | |||
| MP13 | 50 | 1000 | +, −, ×, / | 0.9362 | 66.97 | 45.06 | 0.2536 | 45 |
| Indicators | Training | Validation |
|---|---|---|
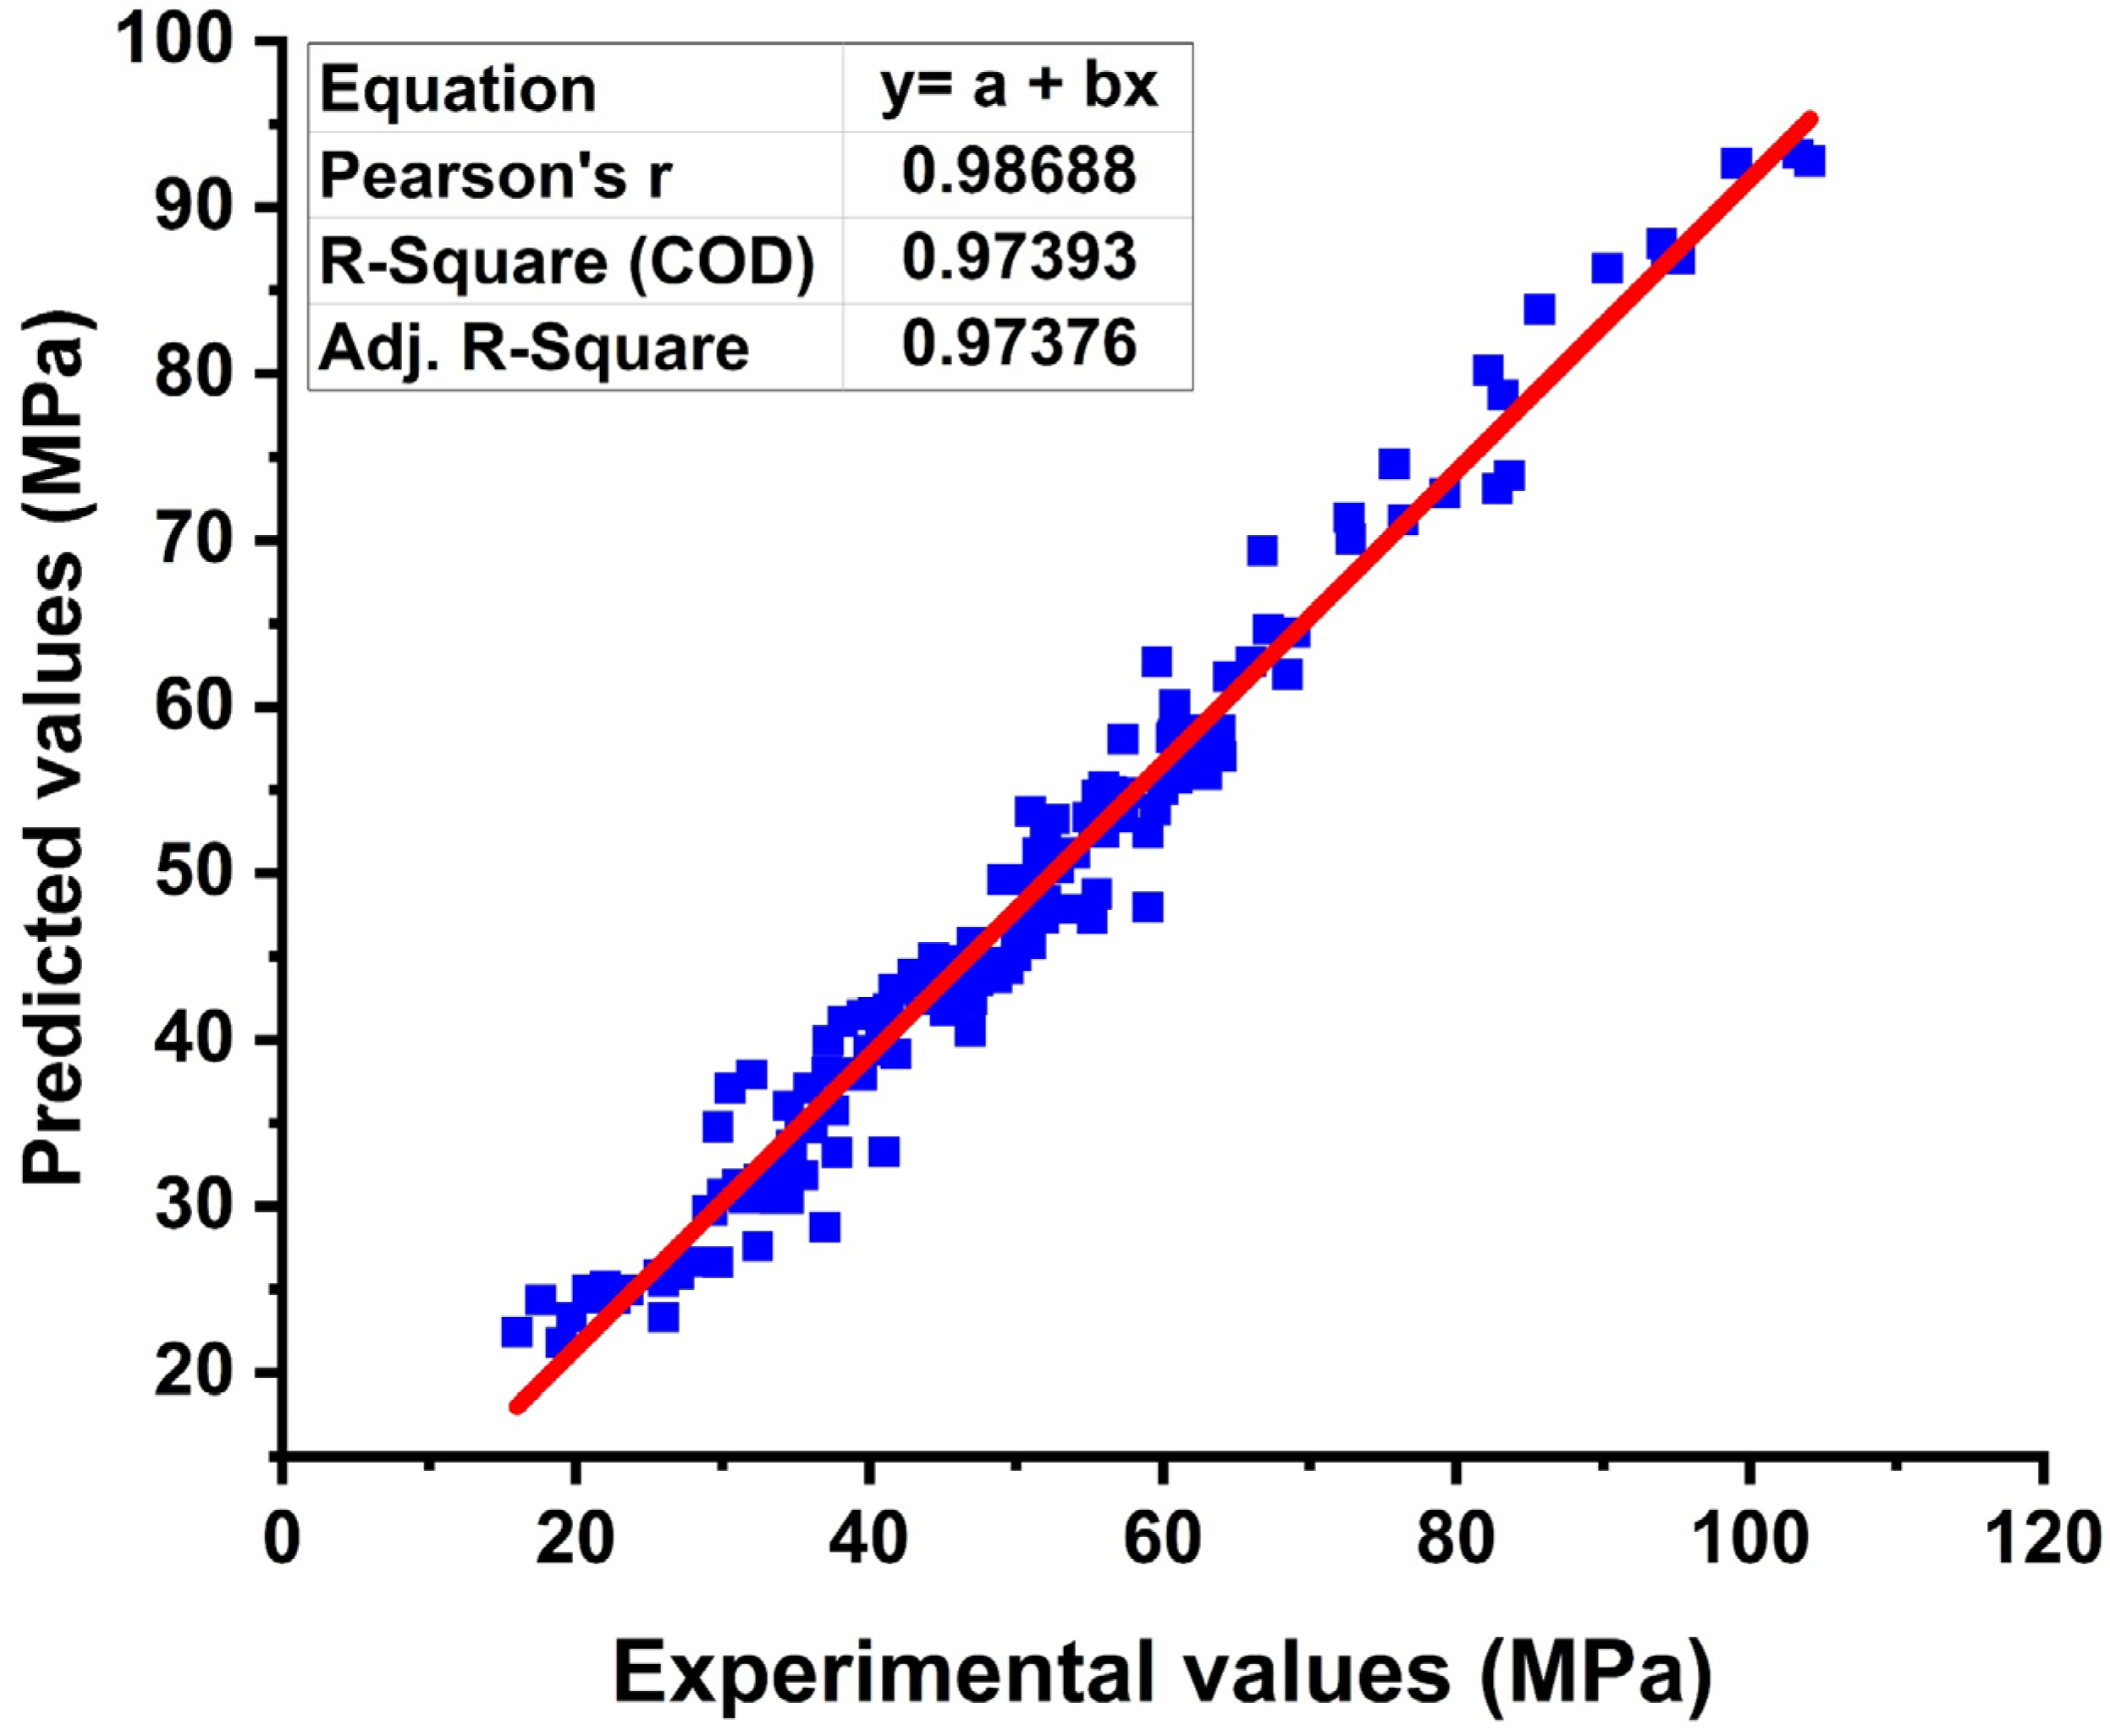
| R2 | 0.976419 | 0.971378 |
| R | 0.988139 | 0.985585 |
| RMSE | 3.843116 | 3.406354 |
| MAE | 3.067433 | 2.317413 |
| RRMSE | 0.079188 | 0.072075 |
| RE | 0.047253 | 0.048581 |
| 0.03983 | 0.0363 | |
| OBF | 0.04 |
| S. No. | Equation | Condition | MP | Suggested by |
|---|---|---|---|---|
| 1 | R > 0.8 | 0.98 | [63,64,65] | |
| 2 | 0.85 < k < 1.15 | 0.975 | [62] | |
| 3 | 0.85 < k′ < 1.15 | 0.976 | ||
| 4 | where | Rm > 0.5 | 0.856 | [66,67,68] |
| 0.989 | [69,70,71,72] | |||
| 1.000 |
| MAE | RMSE | R2 |
|---|---|---|
| 4.47 | 5.4 | 0.919 |
| 4.209 | 7.68 | 0.91 |
| 4.71 | 5.82 | 0.86 |
| 2.97 | 4.14 | 0.91 |
| 1.60 | 2.71 | 0.95 |
| 11.1 | 15. | 0.89 |
| 2.99 | 3.45 | 0.90 |
| 4.04 | 5.21 | 0.87 |
| 3.30 | 4.22 | 0.89 |
| 2.97 | 2.73 | 0.93 |
Publisher’s Note: MDPI stays neutral with regard to jurisdictional claims in published maps and institutional affiliations. |
© 2022 by the authors. Licensee MDPI, Basel, Switzerland. This article is an open access article distributed under the terms and conditions of the Creative Commons Attribution (CC BY) license (https://creativecommons.org/licenses/by/4.0/).
Share and Cite
Amin, M.N.; Khan, K.; Javed, M.F.; Ewais, D.Y.Z.; Qadir, M.G.; Faraz, M.I.; Alam, M.W.; Alabdullah, A.A.; Imran, M. Forecasting Compressive Strength of RHA Based Concrete Using Multi-Expression Programming. Materials 2022, 15, 3808. https://doi.org/10.3390/ma15113808
Amin MN, Khan K, Javed MF, Ewais DYZ, Qadir MG, Faraz MI, Alam MW, Alabdullah AA, Imran M. Forecasting Compressive Strength of RHA Based Concrete Using Multi-Expression Programming. Materials. 2022; 15(11):3808. https://doi.org/10.3390/ma15113808
Chicago/Turabian StyleAmin, Muhammad Nasir, Kaffayatullah Khan, Muhammad Faisal Javed, Dina Yehia Zakaria Ewais, Muhammad Ghulam Qadir, Muhammad Iftikhar Faraz, Mir Waqas Alam, Anas Abdulalim Alabdullah, and Muhammad Imran. 2022. "Forecasting Compressive Strength of RHA Based Concrete Using Multi-Expression Programming" Materials 15, no. 11: 3808. https://doi.org/10.3390/ma15113808
APA StyleAmin, M. N., Khan, K., Javed, M. F., Ewais, D. Y. Z., Qadir, M. G., Faraz, M. I., Alam, M. W., Alabdullah, A. A., & Imran, M. (2022). Forecasting Compressive Strength of RHA Based Concrete Using Multi-Expression Programming. Materials, 15(11), 3808. https://doi.org/10.3390/ma15113808