
Compressive Fatigue Investigation on High-Strength and Ultra-High-Strength Concrete within the SPP 2020


Abstract
:1. Introduction
2. Materials and Methods
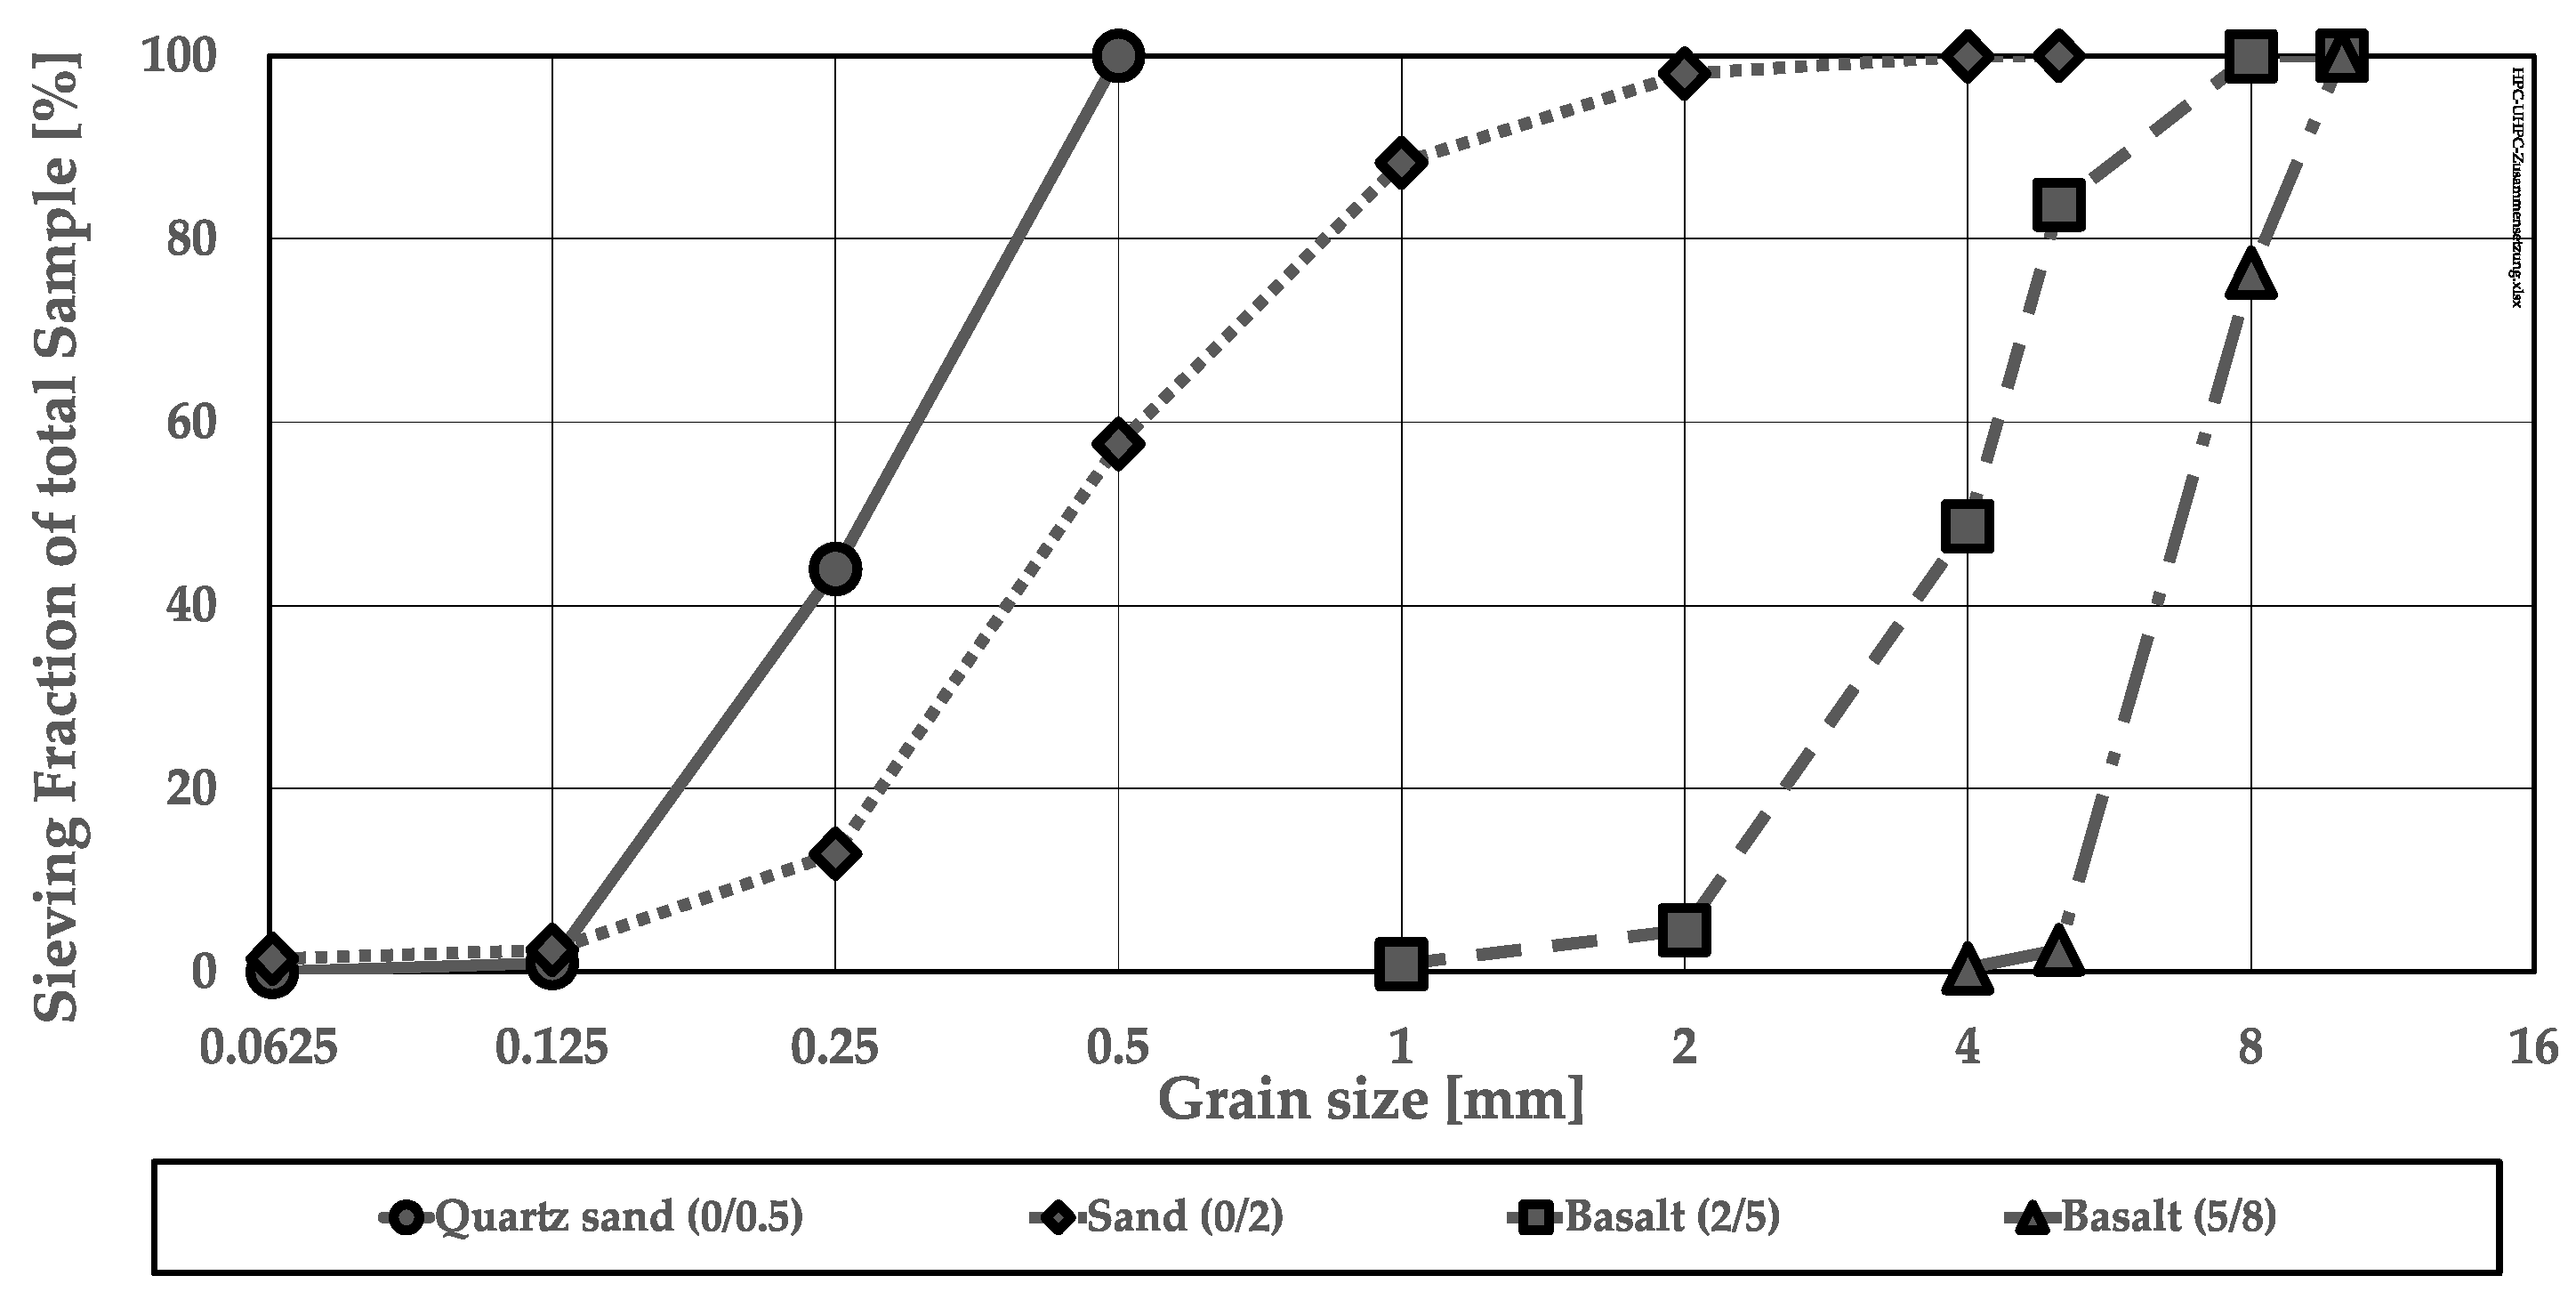
2.1. Concrete Composition
2.2. Specimens for the Fatigue Investigations
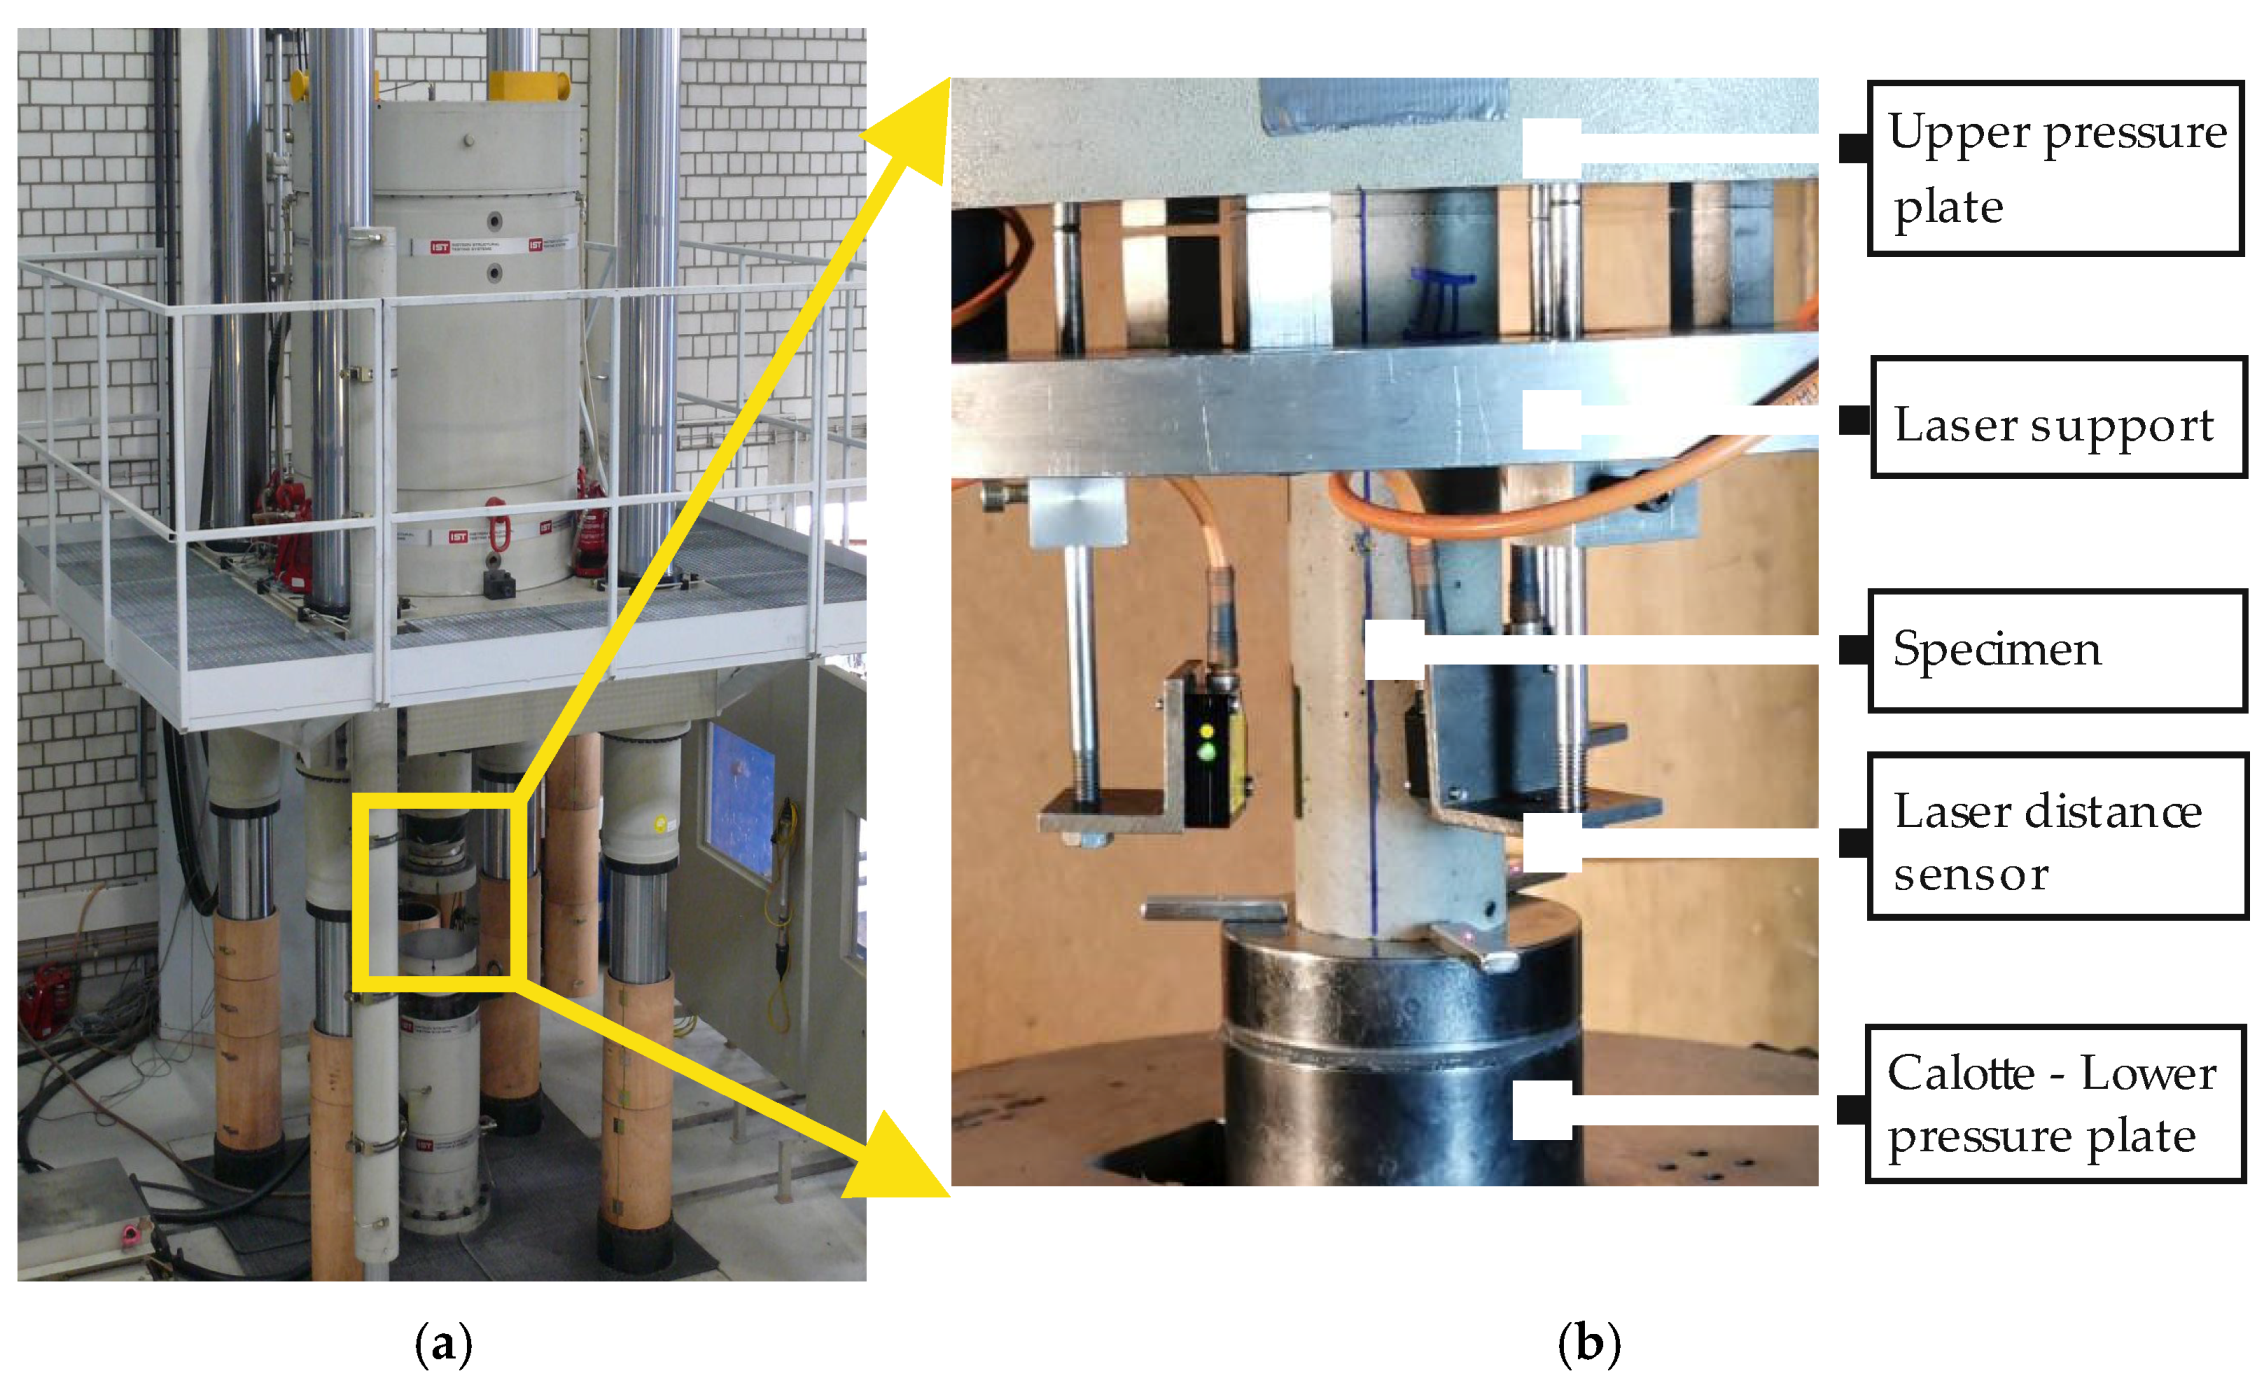
2.3. Fatigue Test Programme and Experimental Set-Up
2.4. Analysis Methods
3. Results
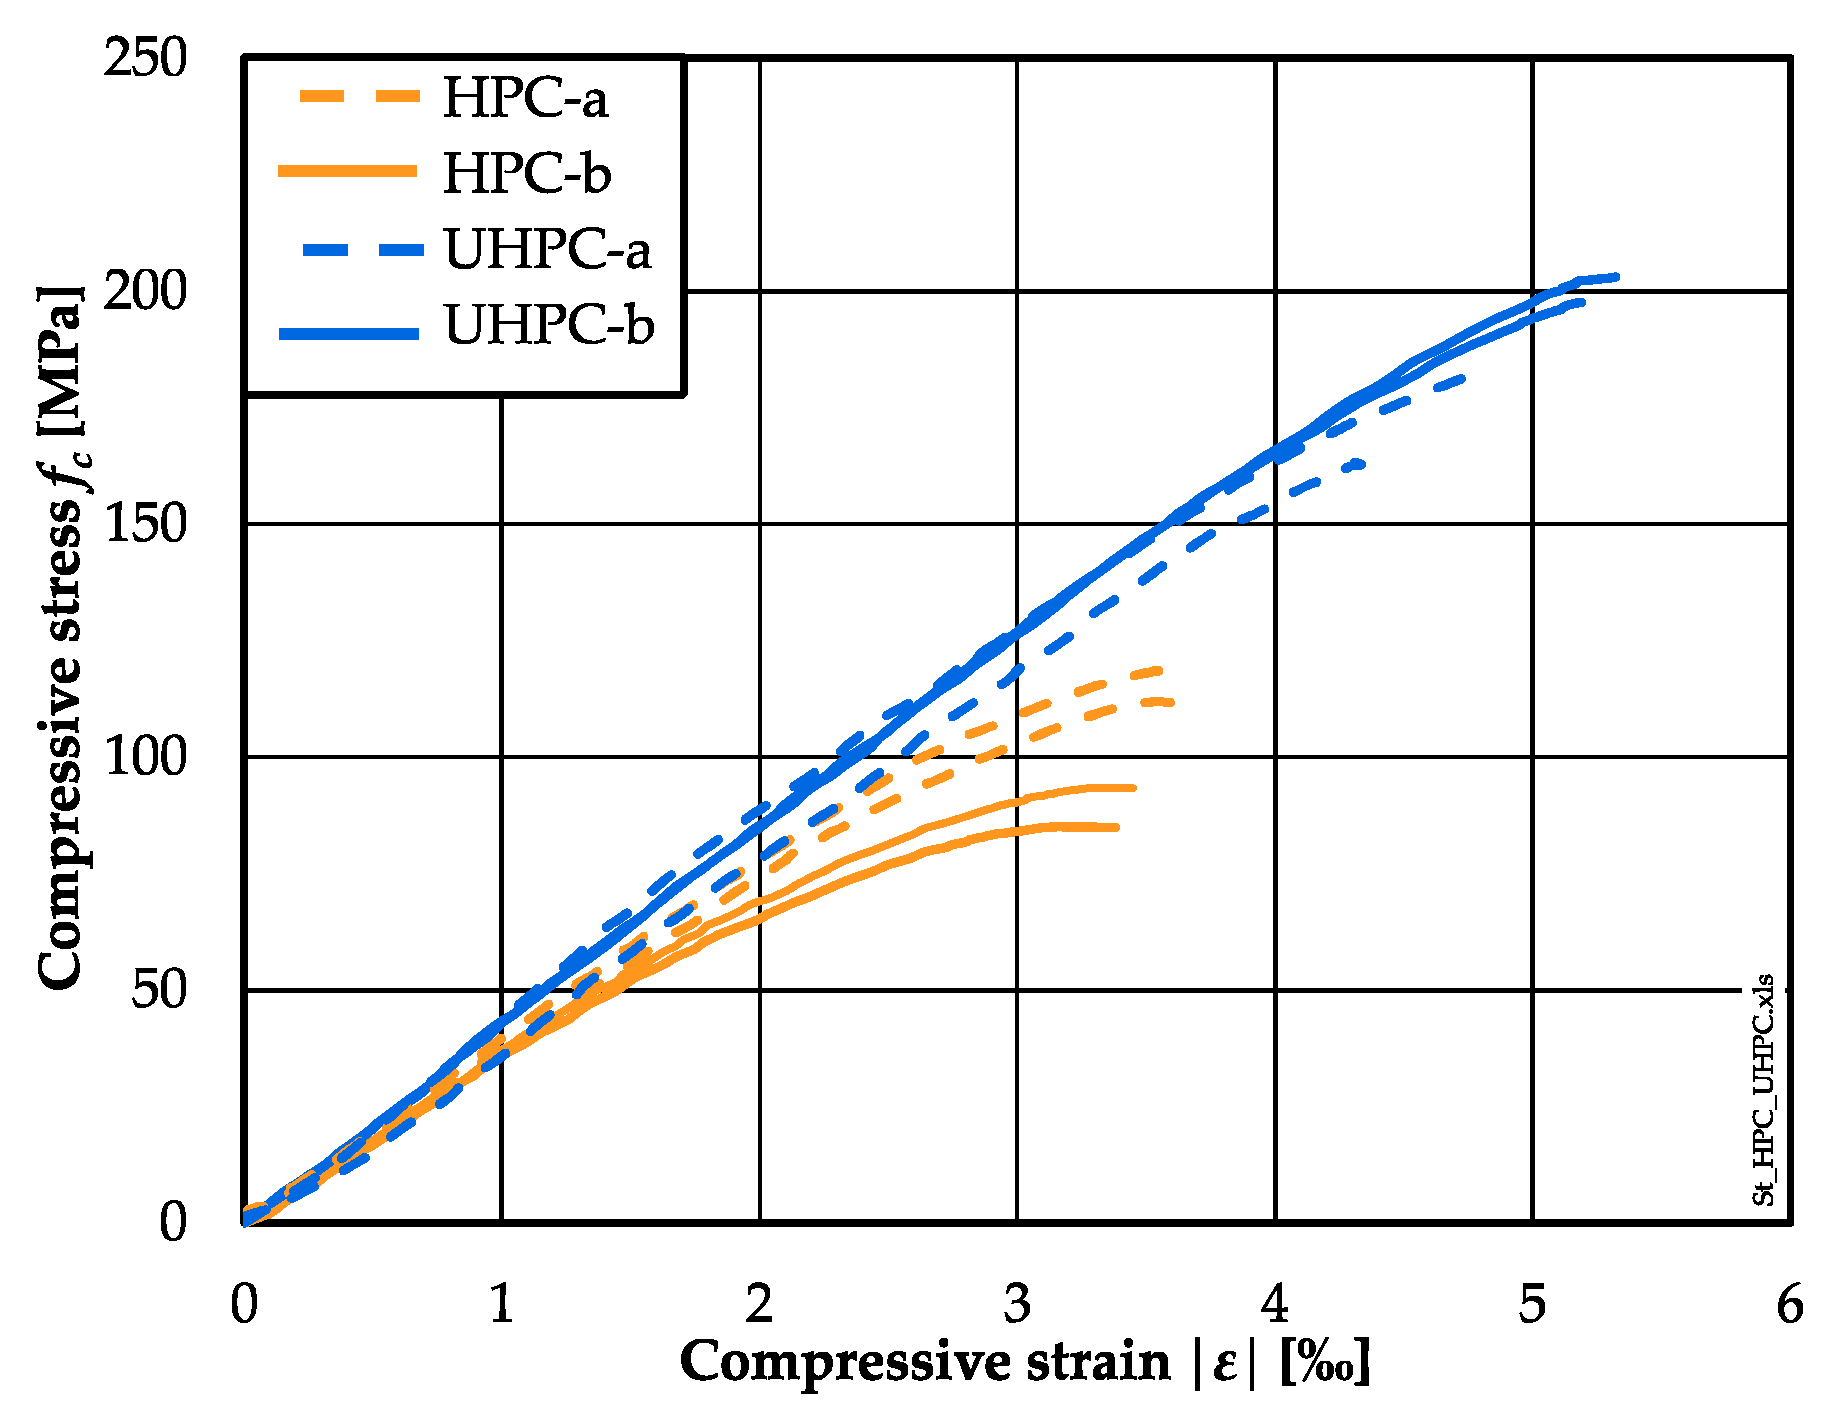
3.1. Stress–Strain Curves
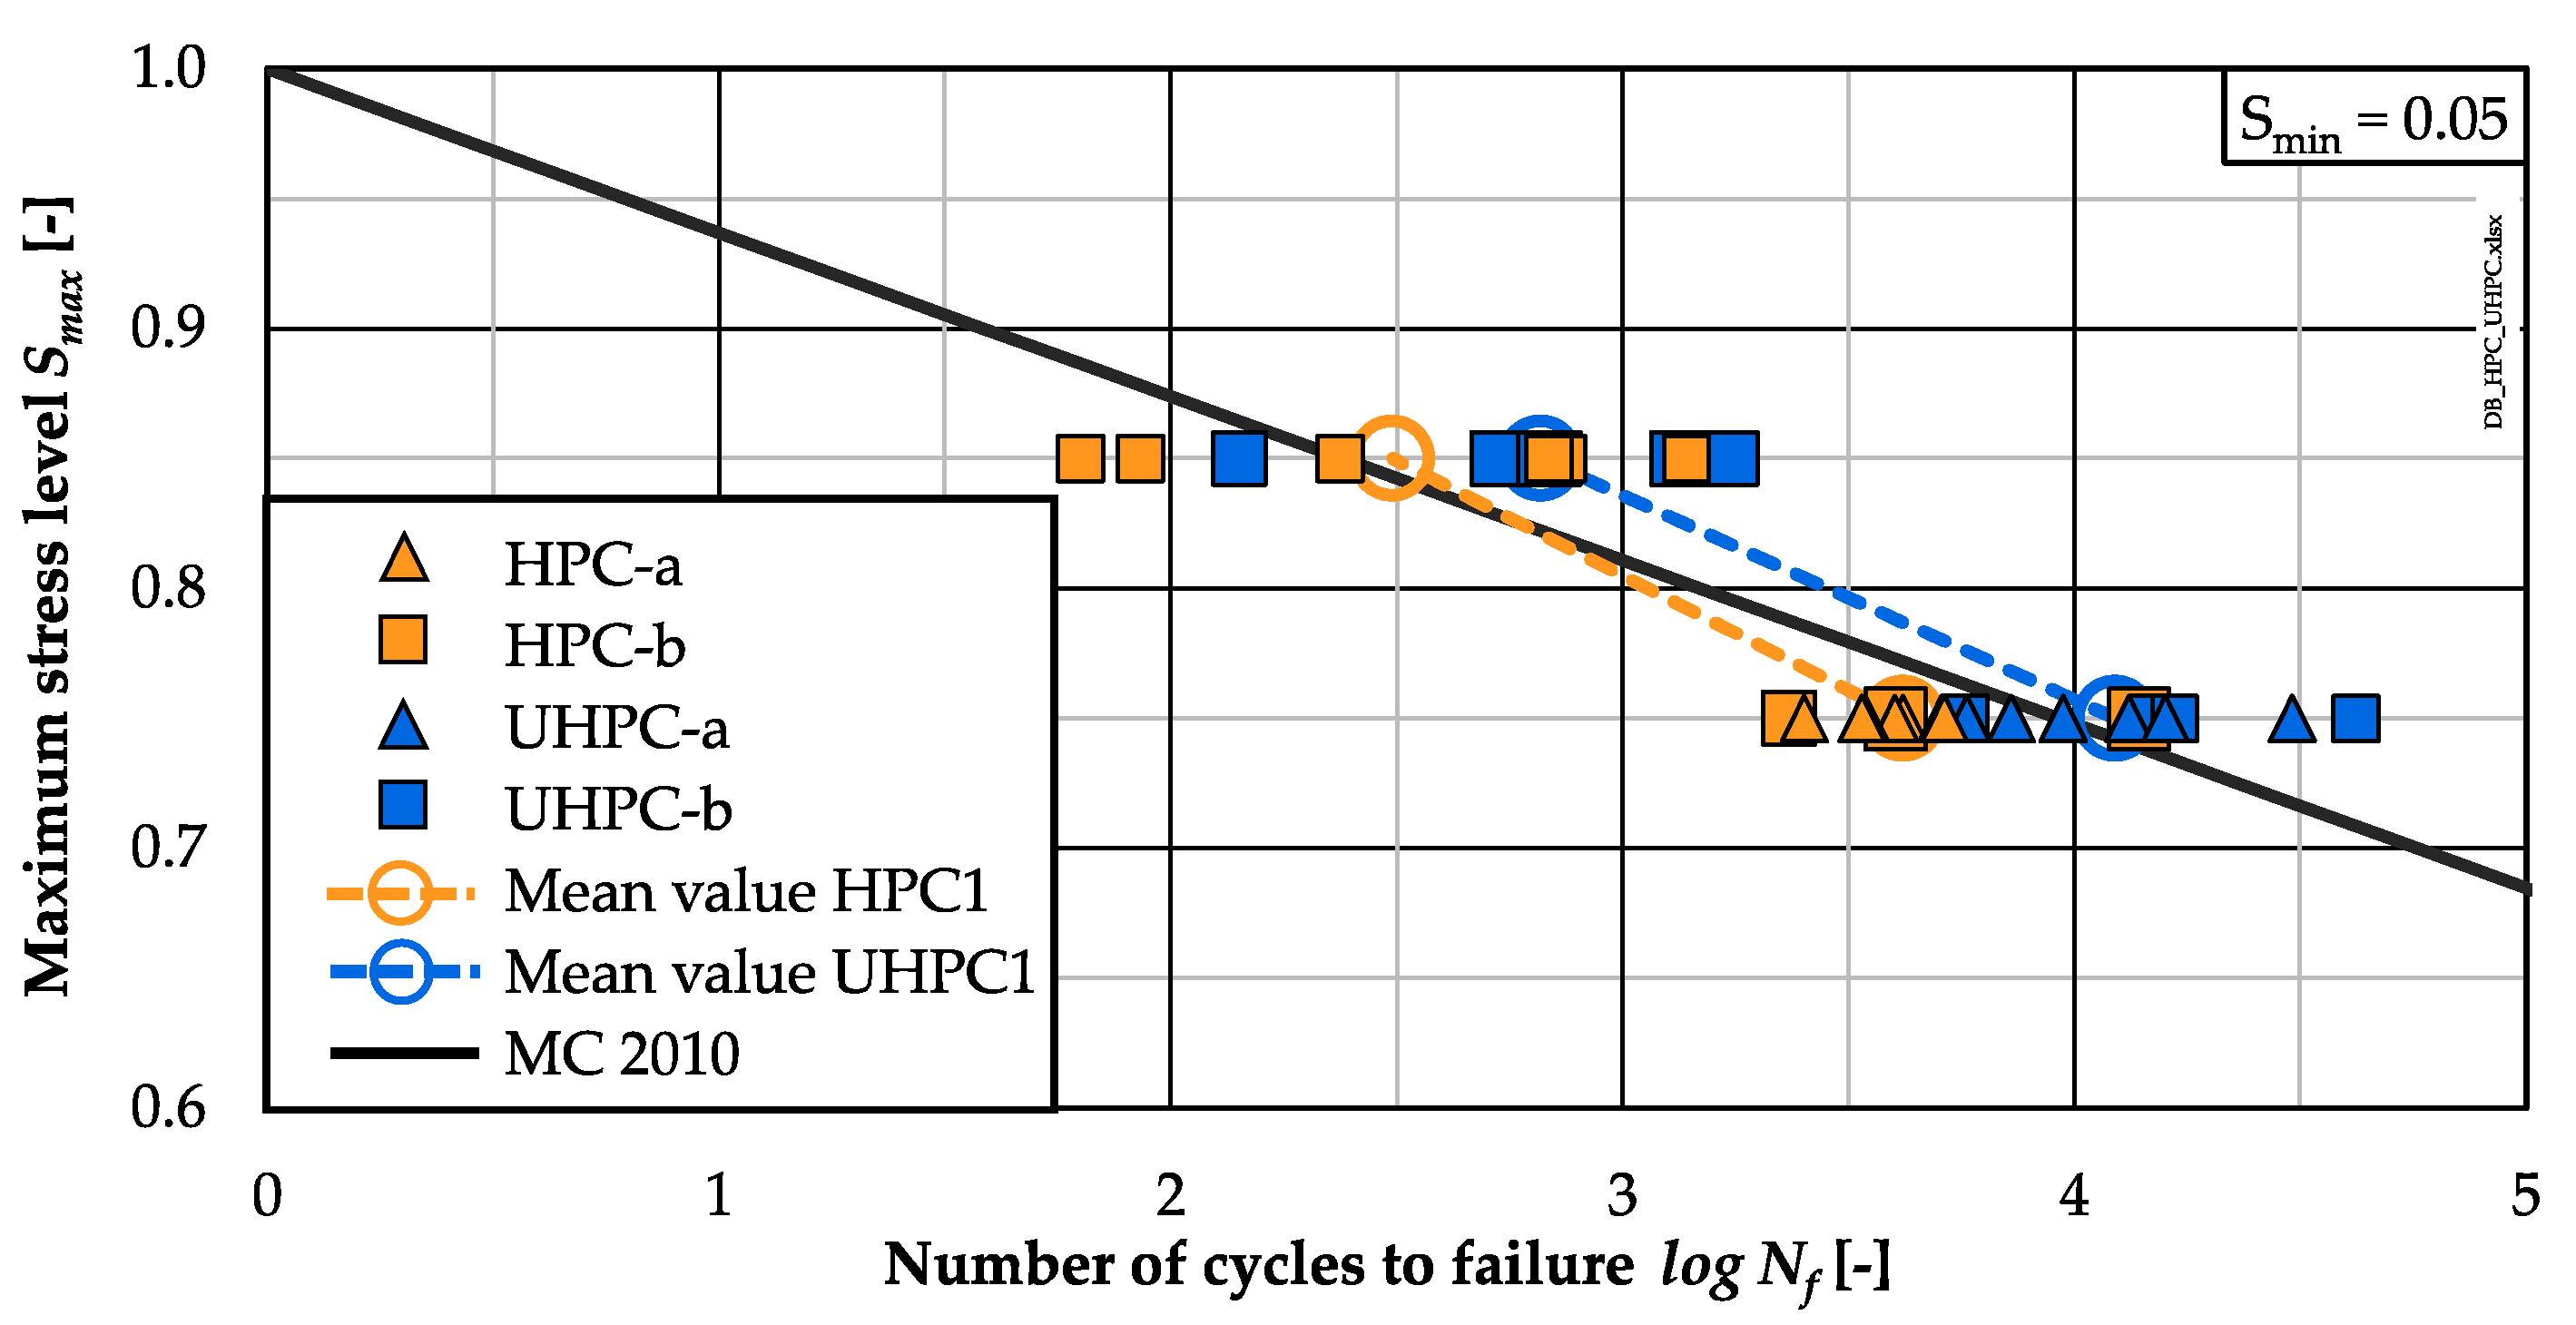
3.2. Numbers of Cycles to Failure
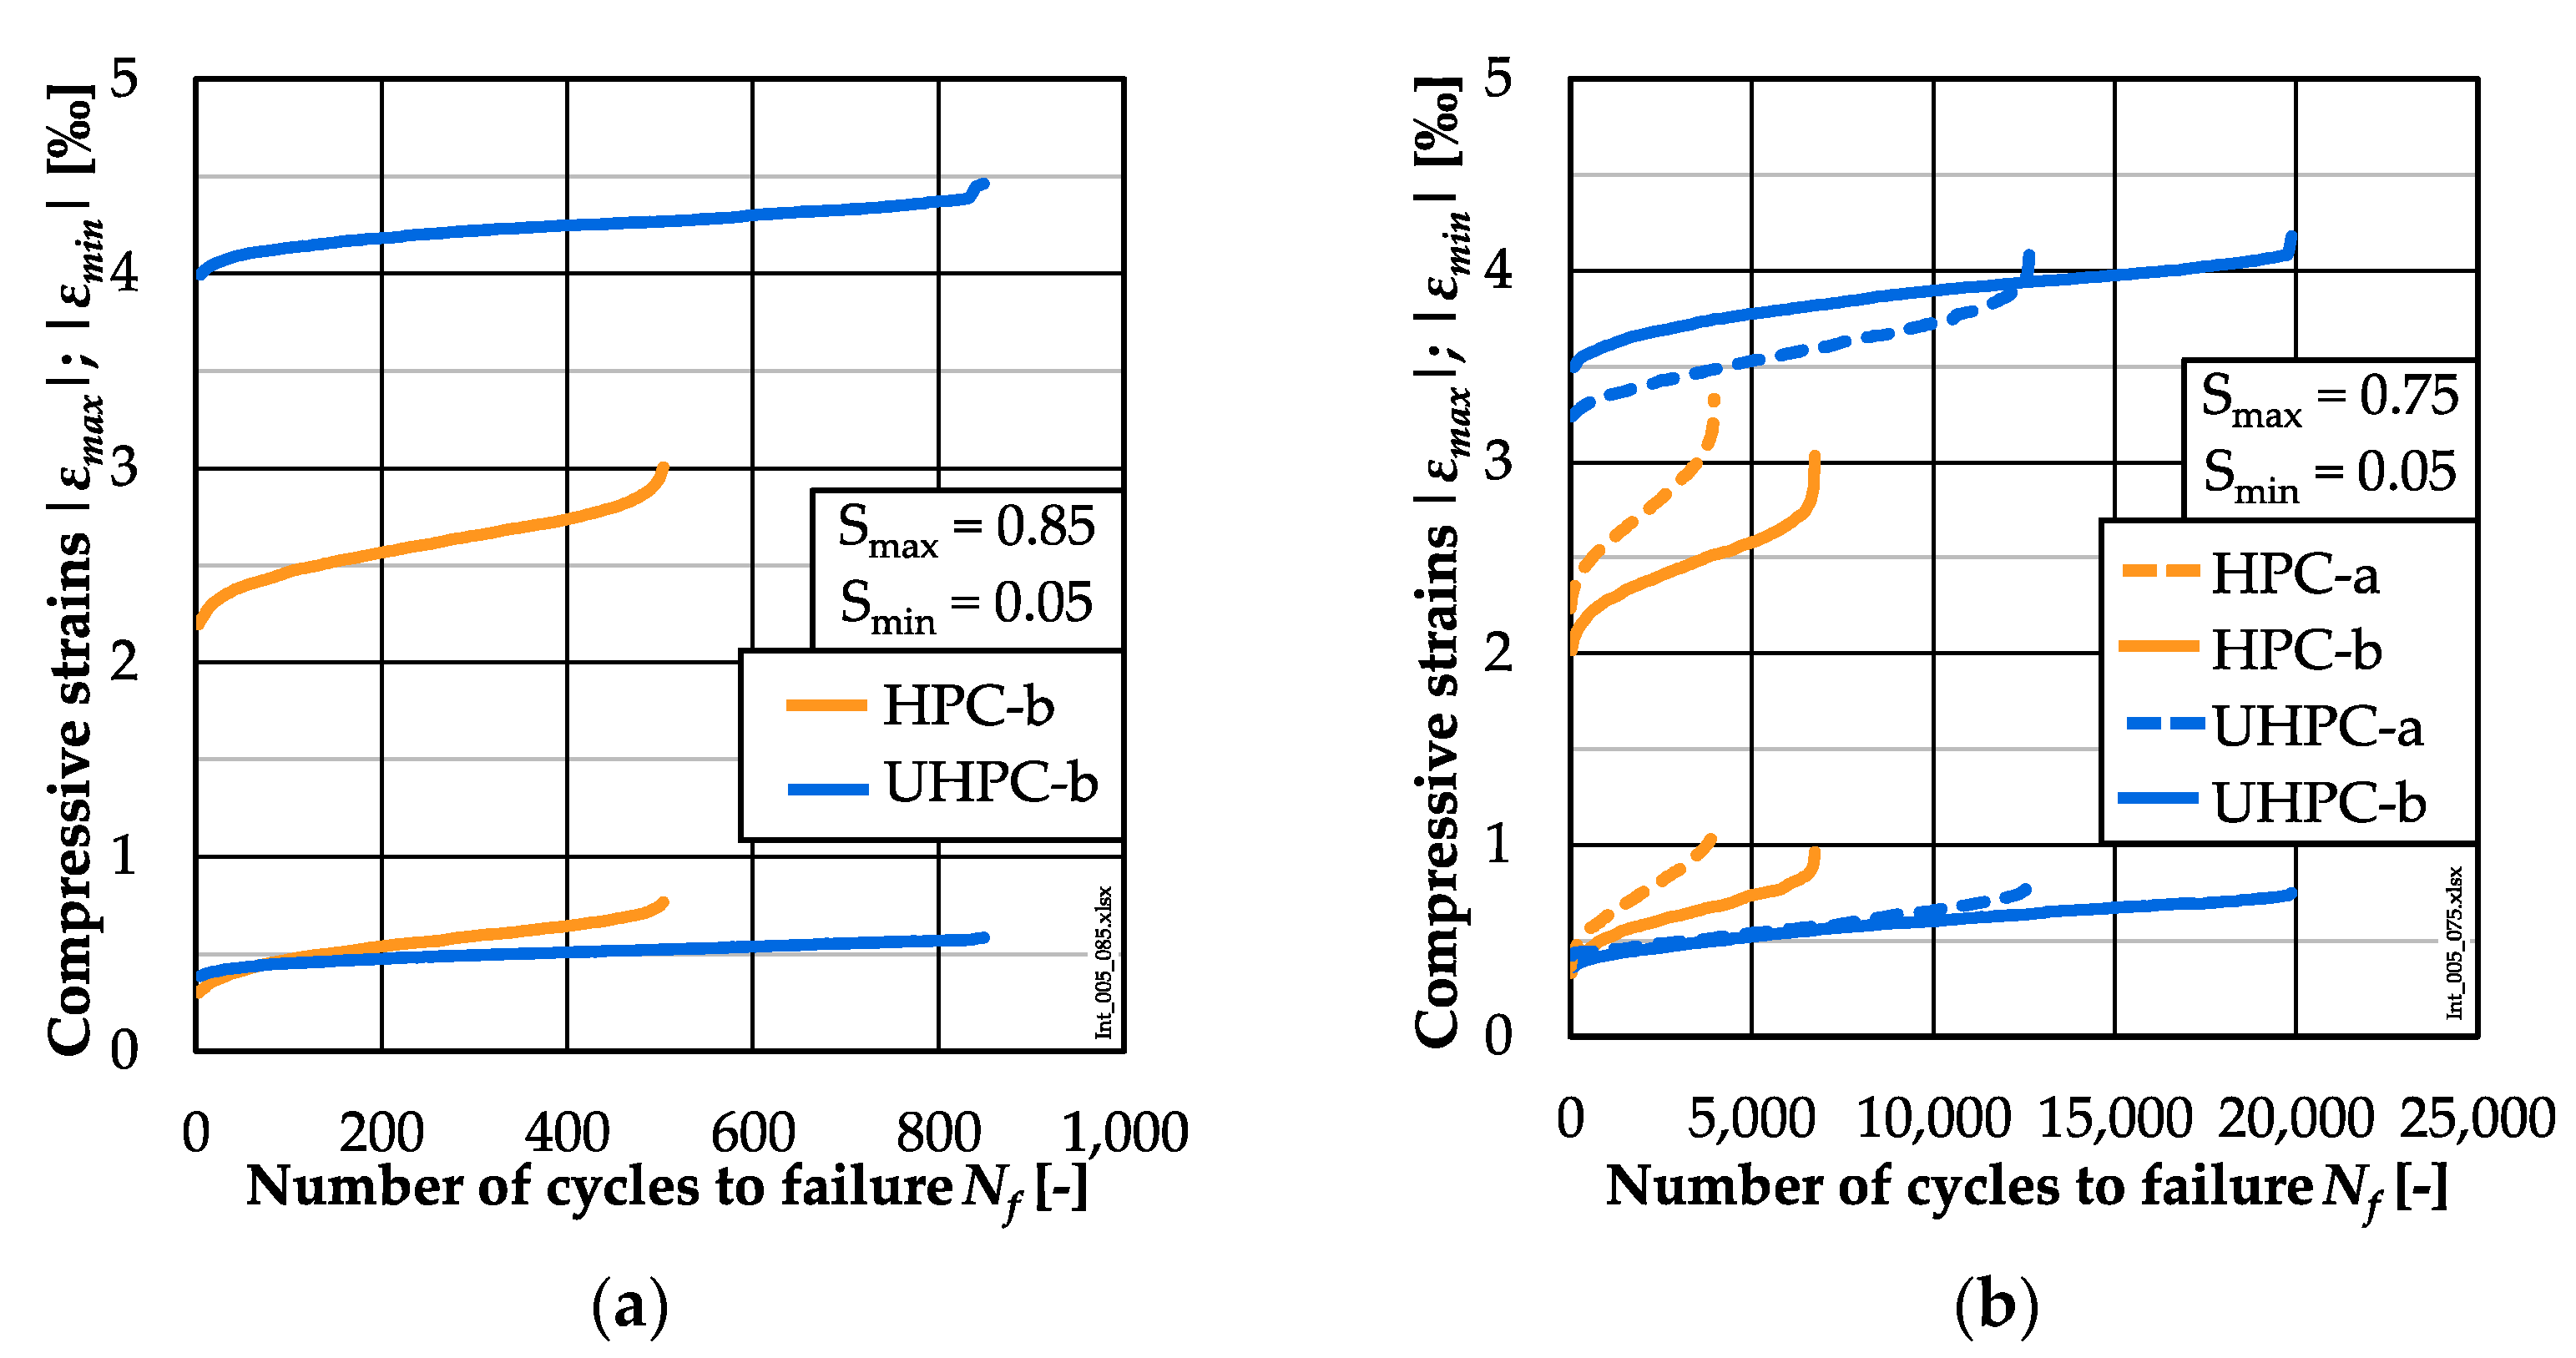
3.3. Strain Development
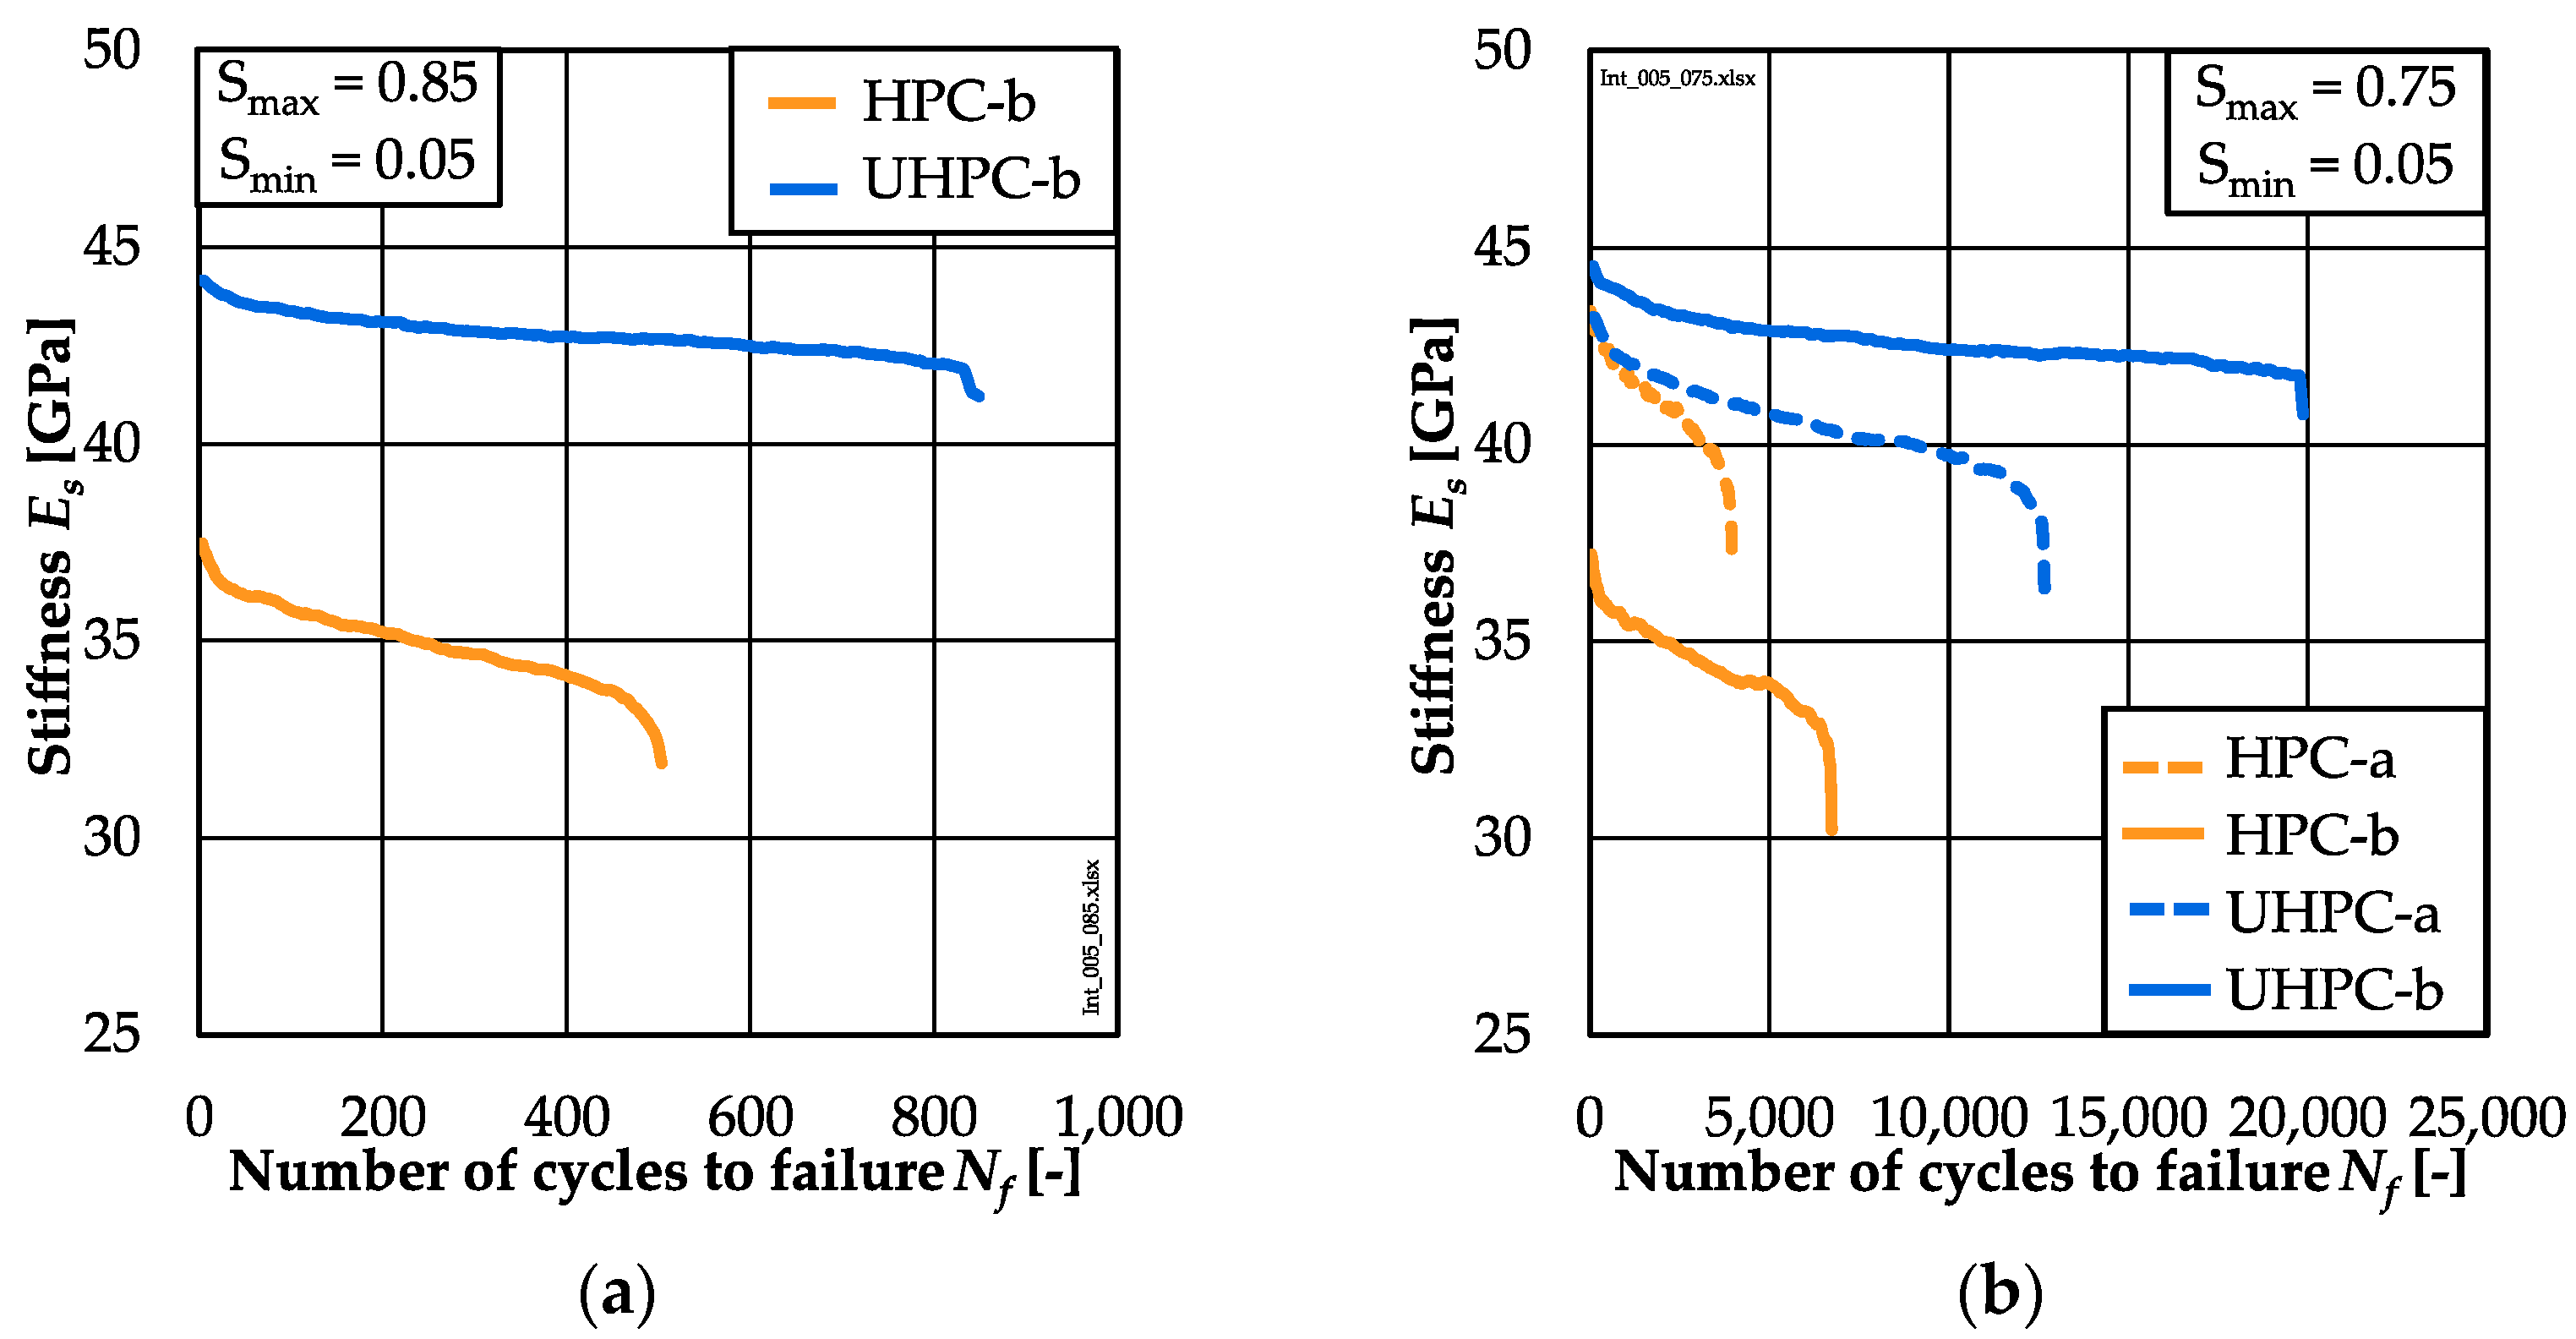
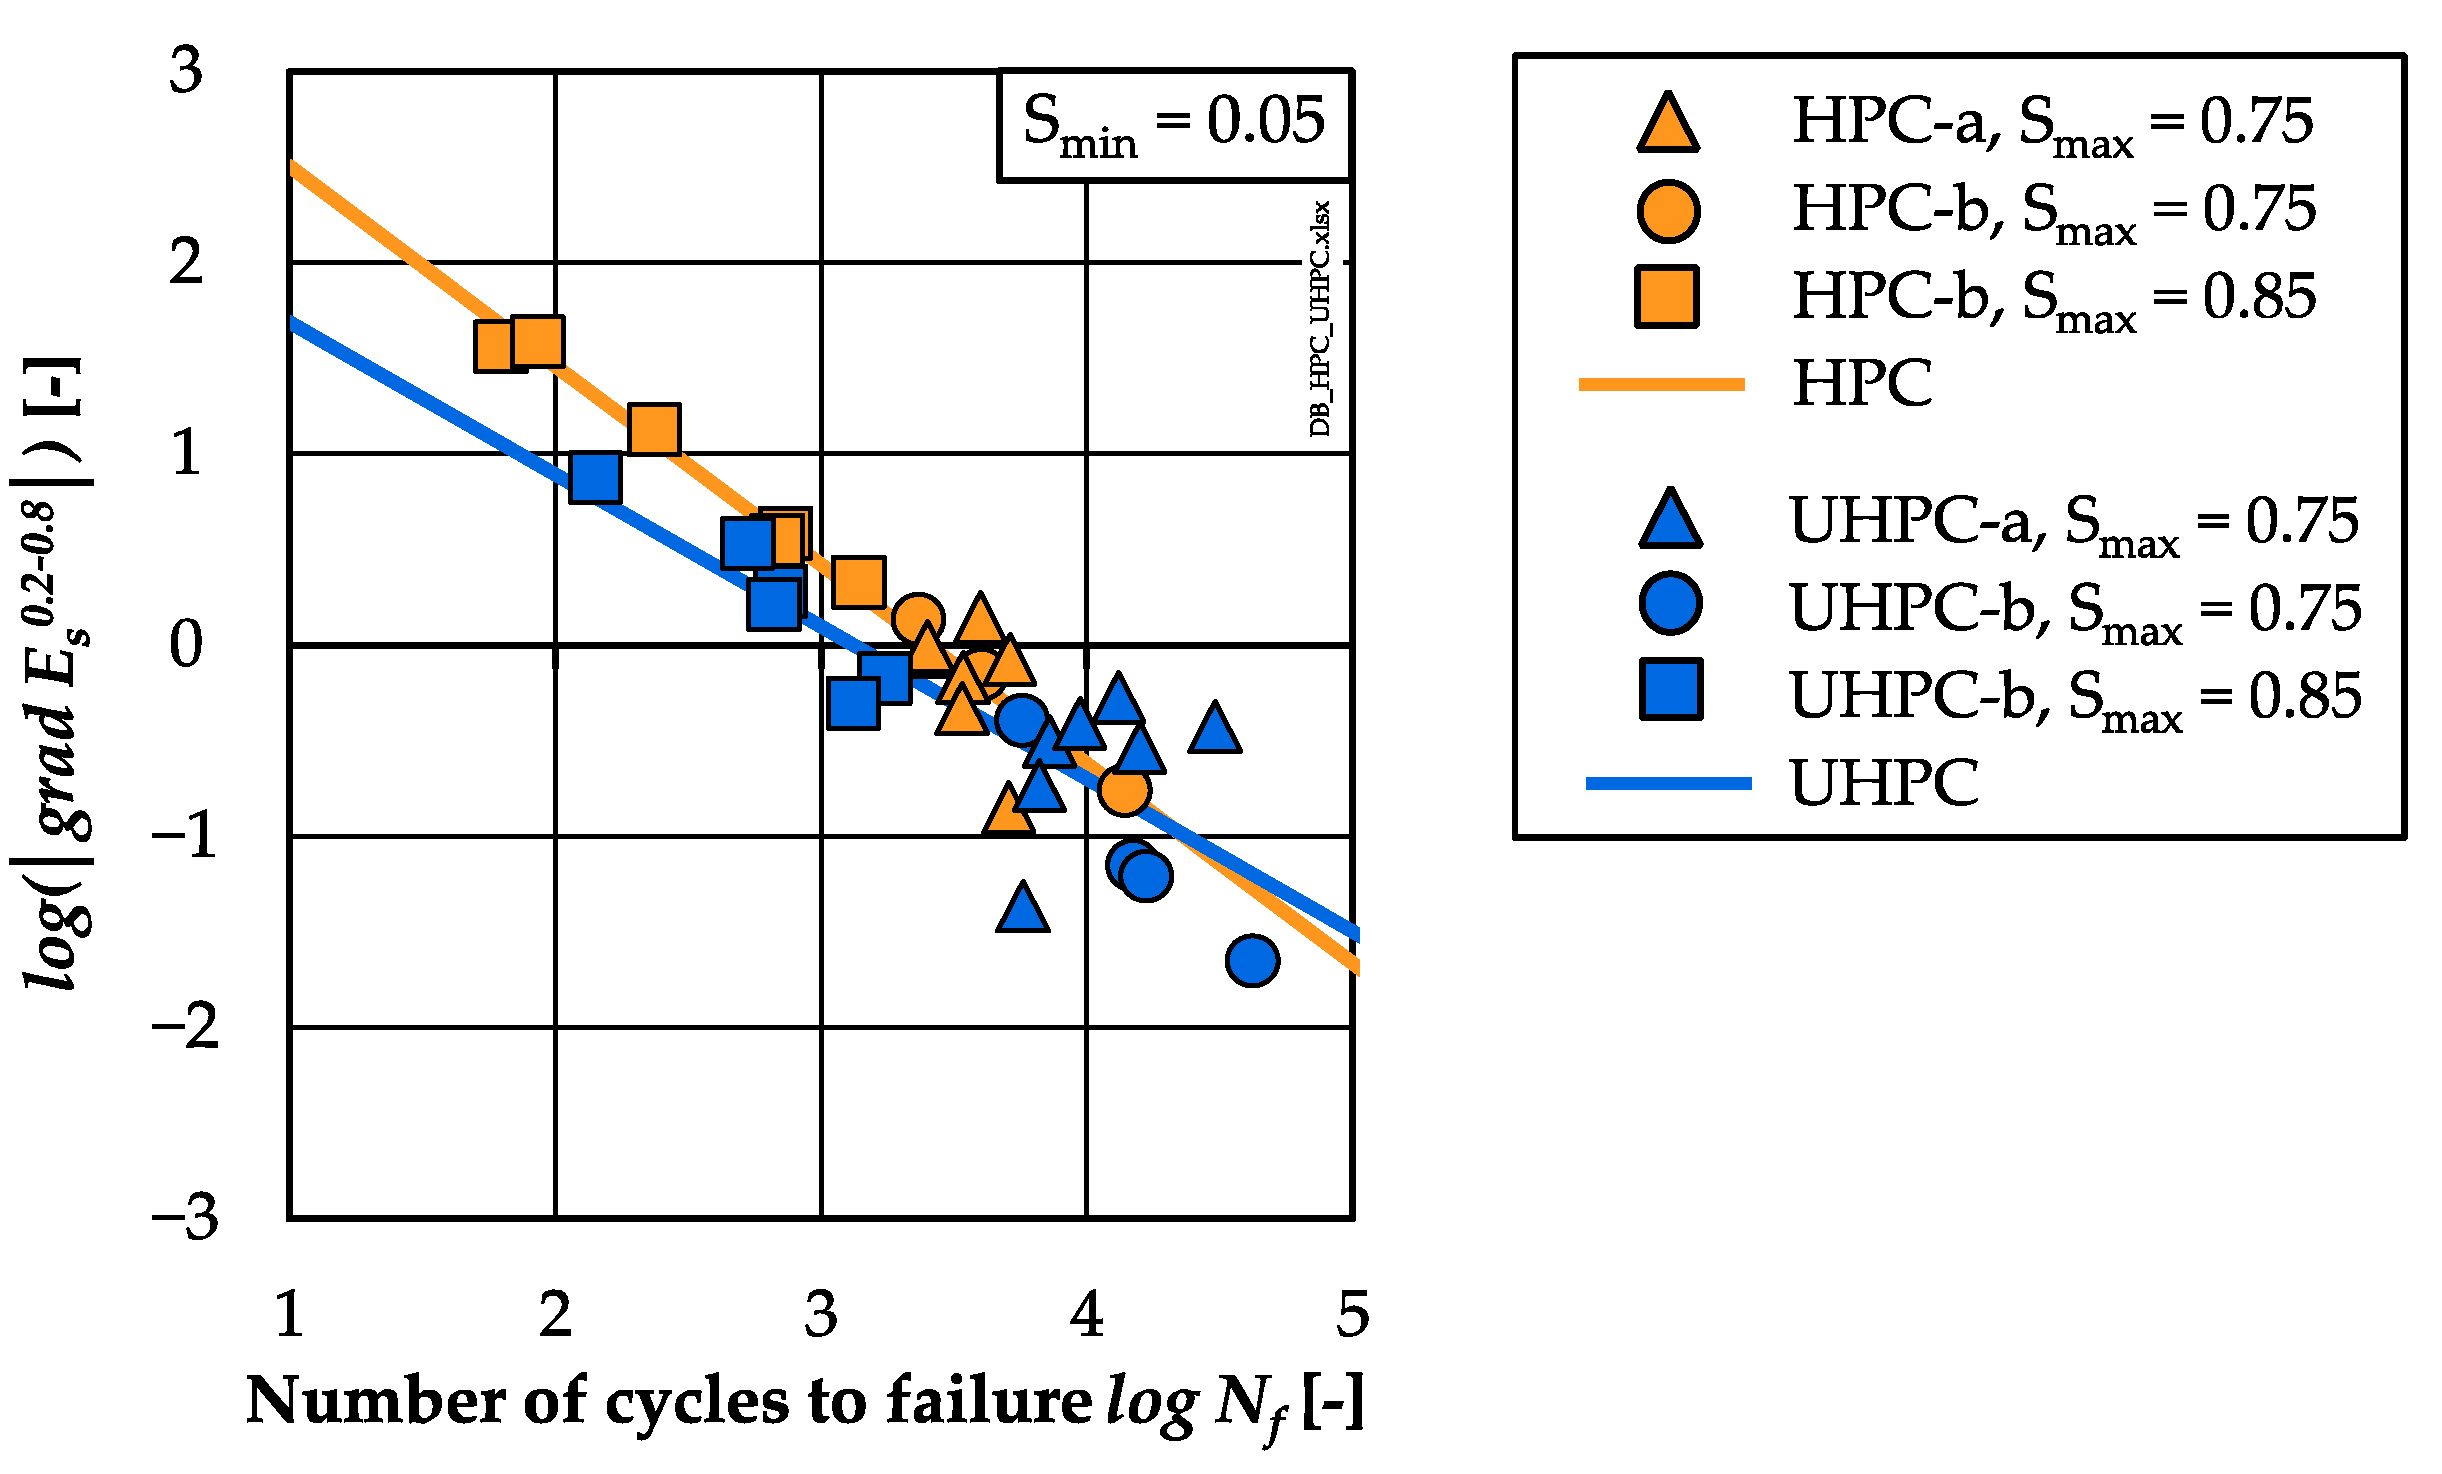
3.4. Stiffness Development
4. Discussion
| HPC: | R² = 0.98 | (2) | |
| HPC: | R² = 0.98 | (3) | |
| UHPC: | R² = 0.88 | (4) | |
| UHPC: | R² = 0.80 | (5) |
| HPC: | R² = 0.93 | (6) | |
| UHPC: | R² = 0.69 | (7) |
5. Conclusions
- The UHPC reached higher mean numbers of cycles to failure than the HPC at both stress levels investigated. Furthermore, the difference in mean numbers of cycles to failure was statistically significant (ANOVA, p-value << 0.05) at the lower level. Thus, a negative influence of the higher compressive strength of the UHPC on the numbers of cycles to failure was not observed in the investigations presented.
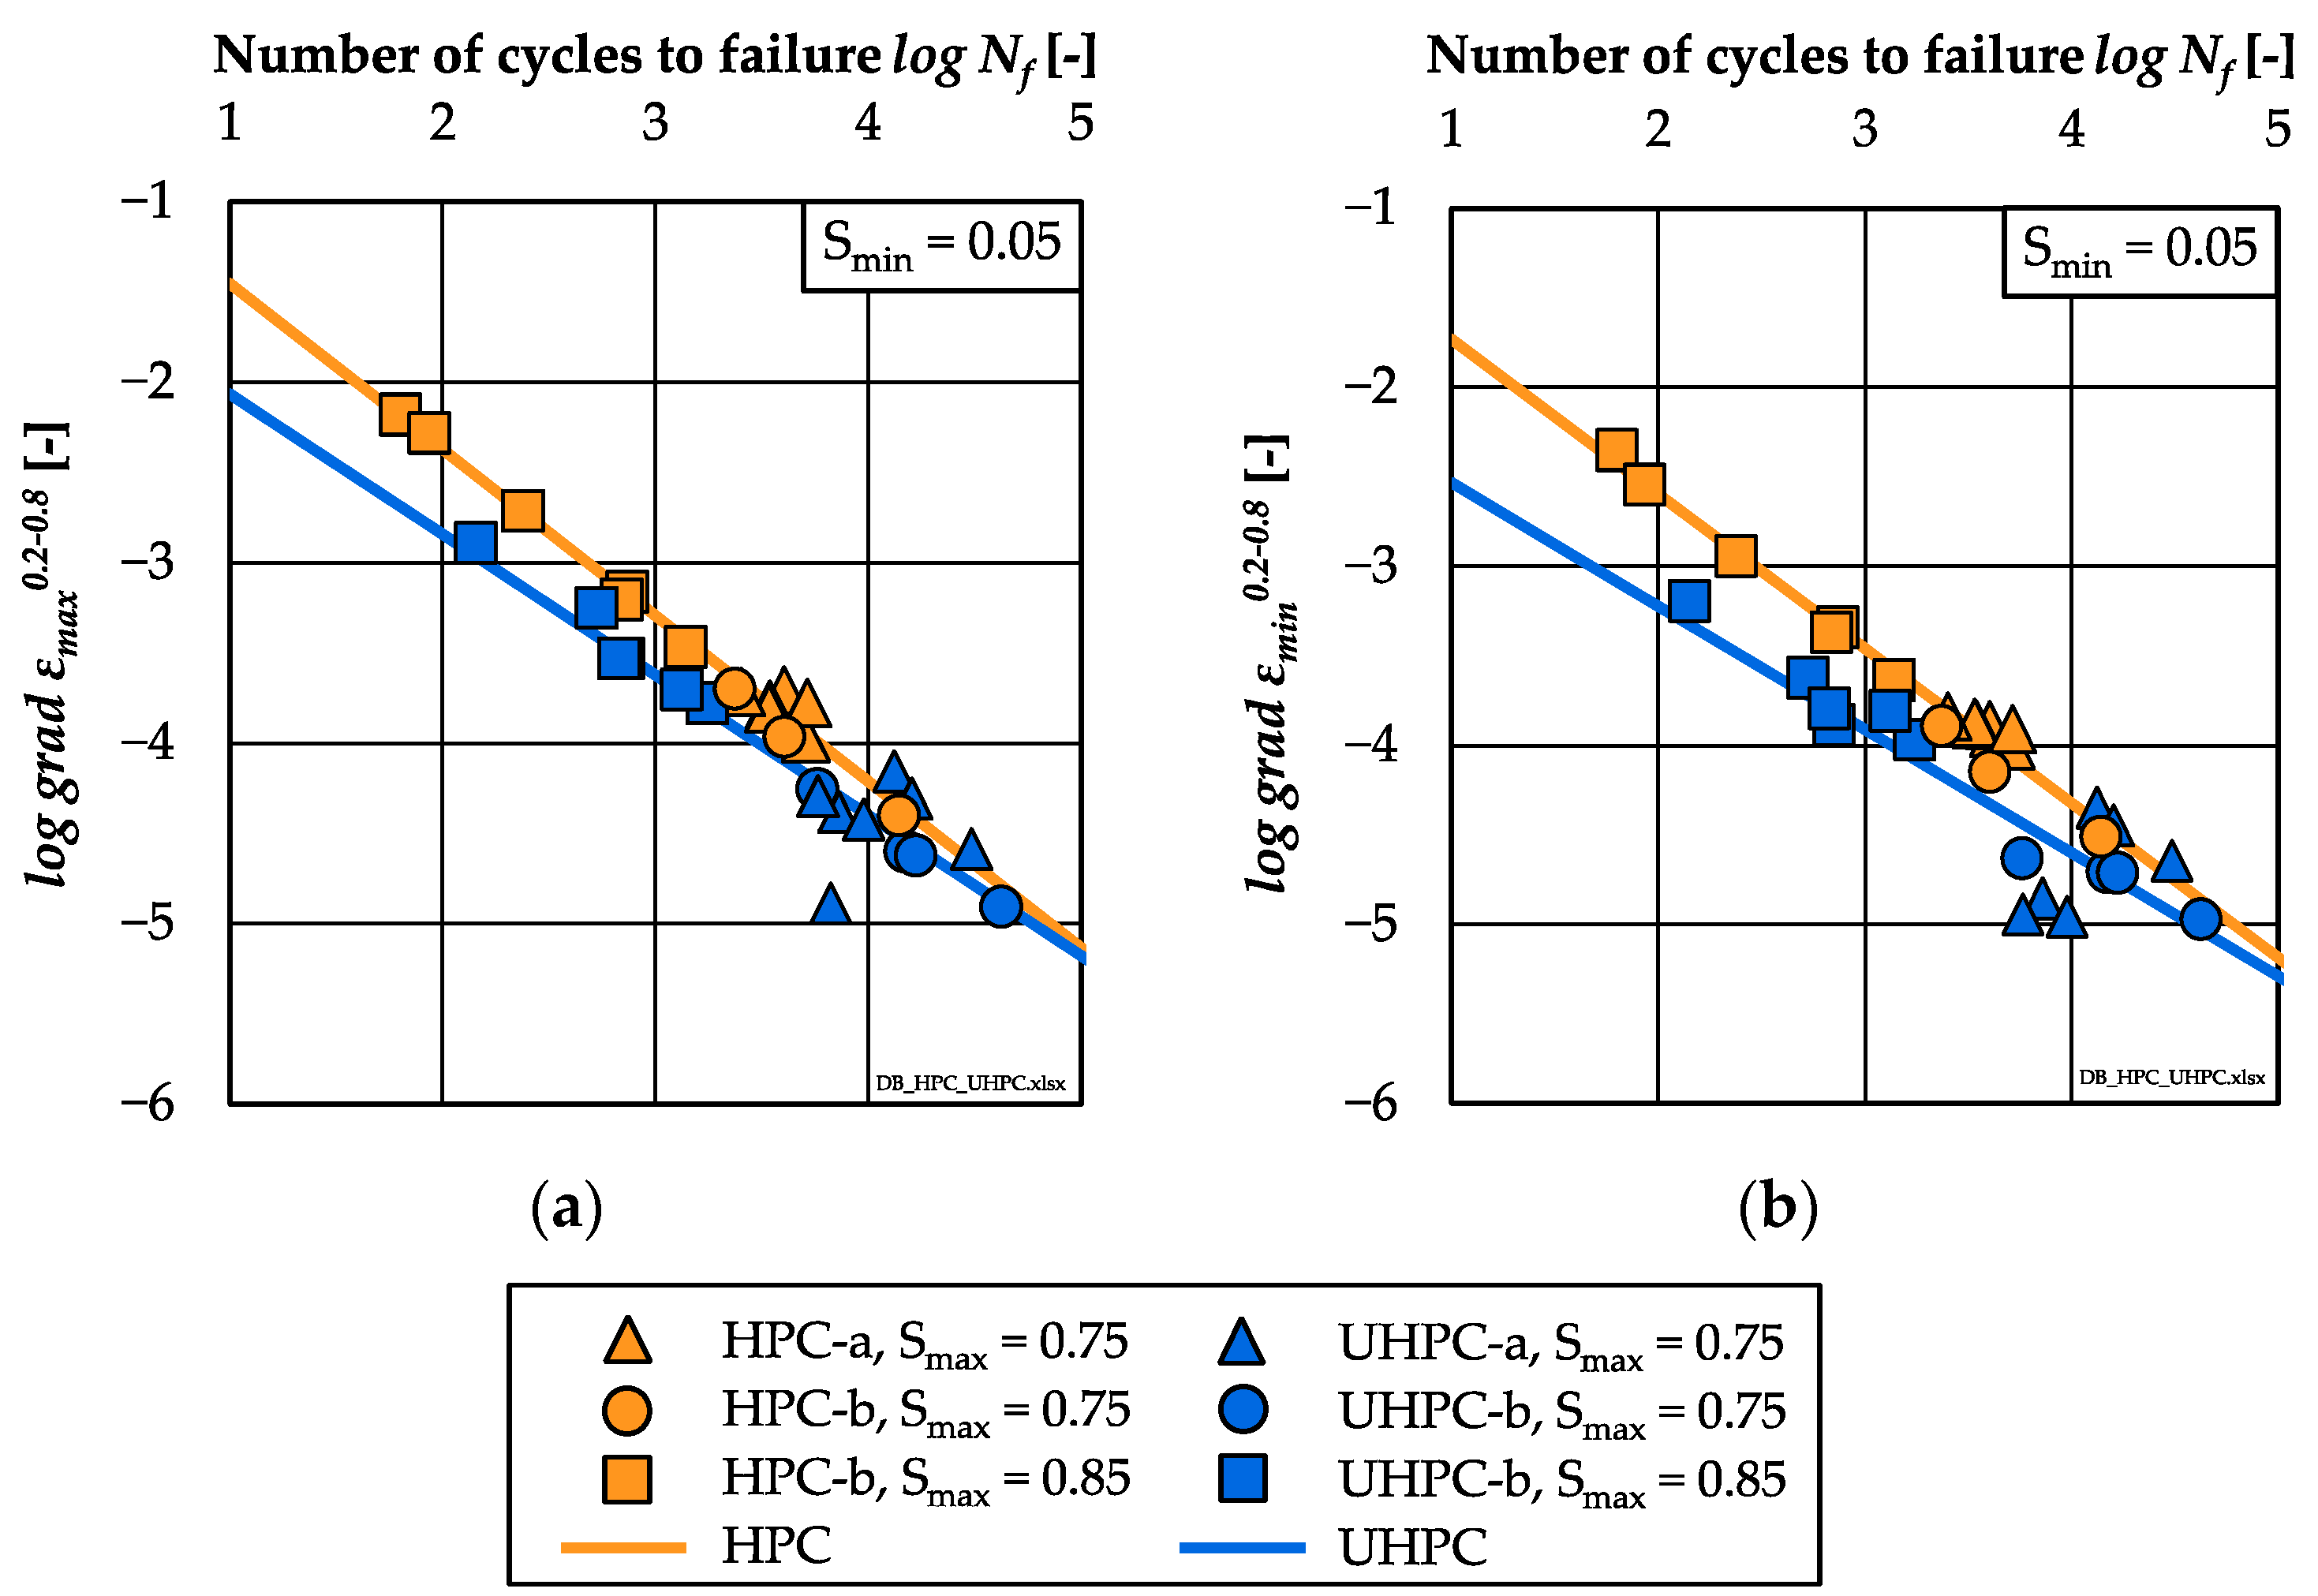
- The damage indicators showed a smaller total growth of strains and a smaller percentile reduction of stiffness of the UHPC compared to the HPC. Furthermore, the gradients of strain and stiffness in phase II, i.e., the increase in strain and decrease in stiffness per load cycle, respectively, of the UHPC were smaller than those of the HPC. In summary, the UHPC showed a less pronounced damage evolution compared to the HPC. Furthermore, the damage indicators reveal a different material-dependent fatigue behaviour.
- A batch influence on the results of the reference compressive strength for both concretes was identified. For each concrete, this batch influence was not found in the numbers of cycles to failure. Thus, the batch influence was equalised due to the determination of the tested fatigue stresses, based on the respective reference compressive strength of the batch.
Author Contributions
Funding
Institutional Review Board Statement
Informed Consent Statement
Data Availability Statement
Acknowledgments
Conflicts of Interest
Appendix A


| Materials | Density | Fineness | d10 | d50 | d90 |
|---|---|---|---|---|---|
| [kg/dm³] | [cm²/g] | [µm] | |||
| CEM I 52.5 R-HS/NA | 3.18 | 3969 | 1.60 | 11.25 | 33.18 |
| Silica fume | 2.23 | - | 7.01 | 17.37 | 32.27 |
| Quartz powder | 2.66 | - | 2.09 | 12.71 | 37.18 |
| Materials | Chemical Composition [%] | |||||
|---|---|---|---|---|---|---|
| SiO2 | Al2O3 | Fe2O3 | CaO | MgO | SO3 | |
| CEM I 52.5 R-HS/NA | 21.41 | 3.97 | 4.79 | 65.41 | 0.85 | 2.98 |
| Concrete | Wet 1 | Wet 1 | Dry 2 | Dry 2 | Total |
|---|---|---|---|---|---|
| 150 mm | 100 mm | 150 mm | 100 mm | ||
| HPC | 16 | 38 | 3 | 18 | 75 |
| UHPC | 5 | 6 | 0 | 61 | 72 |
| Concrete | HPC-a | HPC-b | UHPC-a | UHPC-b | ||
|---|---|---|---|---|---|---|
| 0.85/0.05 | ∆εmax0.0–1.0 | [‰] | - | 0.87 | - | 0.52 |
| ∆εmin0.0–1.0 | [‰] | - | 0.50 | - | 0.22 | |
| [-] | - | 2.57 × 10⁻³ | - | 4.67 × 10⁻⁵ | ||
| [-] | - | 1.59 × 10⁻³ | - | 2.38 × 10⁻⁵ | ||
| ∆Es0.0–1.0 | [%] | - | 15.97 | - | 7.36 | |
| [MPa] | - | −16.38 | - | −2.61 | ||
| Concrete | HPC-a | HPC-b | UHPC-a | UHPC-b | ||
| 0.75/0.05 | ∆εmax0.0–1.0 | [‰] | 1.21 | 1.17 | 0.99 | 0.78 |
| ∆εmin0.0–1.0 | [‰] | 0.81 | 0.71 | 0.41 | 0.44 | |
| [-] | 1.25 × 10⁻⁴ | 1.16 × 10⁻⁴ | 4.10 × 10⁻⁵ | 2.92 × 10⁻⁵ | ||
| [-] | 1.63 × 10⁻⁴ | 7.66 × 10⁻⁵ | 2.31 × 10⁻⁵ | 1.82 × 10⁻⁵ | ||
| ∆Es0.0–1.0 | [%] | 16.62 | 21.80 | 16.08 | 9.52 | |
| [MPa] | −0.78 | −0.75 | −0.30 | −0.14 | ||
References
- Hohberg, R. Zum Ermüdungsverhalten von Beton. On the Fatigue Behaviour of Concrete. Ph.D. Thesis, Technische Universität Berlin, Berlin, Germany, 2004. (In German) [Google Scholar] [CrossRef]
- Oneschkow, N. Fatigue behaviour of high-strength concrete with respect to strain and stiffness. Int. J. Fatigue 2016, 87, 38–49. [Google Scholar] [CrossRef]
- Thiele, M. Experimentelle Untersuchungen und Analyse der Schädigungsevolution in Beton unter Hochzyklischen Ermüdungsbeanspruchungen. Experimental Investigation and Analysis of the Damage Development in Concrete Subjected to High-Cycle Fatigue. Ph.D. Thesis, Technische Universität Berlin, Berlin, Germany, 2016. (In German). [Google Scholar]
- Viswanath, S.; LaFave, J.M.; Kuchma, D.A. Concrete compressive strain behaviour and magnitudes under uniaxial fatigue loading. Constr. Build. Mater. 2021, 296, 123718. [Google Scholar] [CrossRef]
- Comité Euro-international du Beton (CEB). Fatigue of Concrete Structures—State of the Art Report. Bull. Dinf. 1988, 188, 312. [Google Scholar]
- Fédération Internationale du Béton. Fib Model Code for Concrete Structures 2010; Ernst & Sohn: Berlin, Germany, 2013. [Google Scholar] [CrossRef]
- DIN EN 1992-2:2010-12; Eurocode 2: Design of Concrete Structures—Part 2: Concrete Bridges—Design and Detailing Rules. German version EN 1992-2:2005 + AC:2008; German Institute for Standardisation: Berlin, Germany, 2010. [CrossRef]
- Kim, J.K.; Kim, Y.Y. Experimental study of the fatigue behavior of high strength concrete. Cem. Concr. Res. 1996, 26, 1513–1523. [Google Scholar] [CrossRef]
- Zhao, G.Y.; Wu, P.G.; Bai, L.M. Research on fatigue behavior of high-strength concrete under compressive cyclic loading. In Proceeding of the 4th International Symposium on Utilization of High-strength/High-performance concrete, Paris, France, 29–31 May 1996; Volume 2, pp. 757–764. [Google Scholar]
- Bennett, E.W.; Muir, S.E.S.J. Some fatigue tests of high-strength concrete in axial compression. Mag. Concr. Res. 1967, 19, 113–117. [Google Scholar] [CrossRef]
- Petković, G.; Rosseland, S.; Stemland, H. High Strength Concrete SP3—Fatigue. In Report 3.2: Fatigue of High Strength Concrete; SINTEF Structural Engineering—FCB: Trondheim, Norway, 1992. [Google Scholar]
- Kono, S.; Hasegawa, H.; Mori, K.; Ichioka, Y.; Sakashita, M.; Watanabe, F. Low cycle fatigue characteristics of high strength concrete. In Proceedings of the 8th International Symposium on Utilization of High-Strength and High-Performance Concrete, Tokyo, Japan, 27–29 October 2008; pp. 616–621. [Google Scholar]
- Wefer, M. Materialverhalten und Bemessungswerte von Ultrahochfestem Beton unter Einaxialer Ermüdungsbeanspruchung. Material Behaviour and Design Values of Ultra-High-Strength Concrete Subjected to Uniaxial Fatigue Loading. Ph.D. Thesis, Leibniz University Hannover, Hannover, Germany, 2010. (In German). [Google Scholar]
- Deutscher, M.; Tran, N.L.; Scheerer, S. Experimental Investigations on the Temperature Increase of Ultra-High Performance Concrete under Fatigue Loading. Appl. Sci. 2019, 9, 4081. [Google Scholar] [CrossRef] [Green Version]
- Petković, G. Properties of Concrete Related to Fatigue Damage with Emphasis on High Strength Concrete. Ph.D. Thesis, University of Trondheim, Trondheim, Norway, 1991. [Google Scholar]
- Do, M.T.; Chaallal, O.; Aïtcin, P.C. Fatigue Behavior of High-Performance Concrete. J. Mater. Civ. Eng. 1993, 5, 96–111. [Google Scholar] [CrossRef]
- Oneschkow, N.; Timmermann, T. Influence of the composition of high-strength concrete and mortar on the compressive fatigue behaviour. Mat. Struct. 2022, 55, 1–21. [Google Scholar] [CrossRef] [PubMed]
- Klausen, D. Festigkeit und Schädigung von Beton bei Häufig Wiederholter Beanspruchung. Strength and Damage of Concrete Subjected to Often Repeated Loading. Ph.D. Thesis, Technische Hochschule Darmstadt, Darmstadt, Germany, 1978. (In German). [Google Scholar]
- Holmen, J.O. Fatigue of Concrete by Constant and Variable Amplitude loading. ACI Symposium Publication 1982, 75, 71–110. [Google Scholar] [CrossRef]
- Dyduch, K.; Szerszen, M.; Destrebecq, J.-F. Experimental investigation of the fatigue strength of plain concrete under high compressive loading. Mat. Struct. 1994, 27, 505–509. [Google Scholar] [CrossRef]
- Hümme, J.; von der Haar, C.; Lohaus, L.; Marx, S. Fatigue behaviour of a normal-strength concrete—Number of cycles to failure and strain development. Struct. Concr. 2016, 17, 637–645. [Google Scholar] [CrossRef]
- Isojeh, B.; El-Zeghayar, M.; Vecchio, F.J. Concrete Damage under Fatigue Loading in Uniaxial Compression. ACI Mater. J. 2017, 114, 225–235. [Google Scholar] [CrossRef]
- Oneschkow, N. Analyse des Ermüdungsverhaltens von Beton anhand der Dehnungsentwicklung. Analysis of the Fatigue Behaviour of Concrete with Respect to the Development of Strain. Ph.D. Thesis, Leibniz Universität Hannover, Hannover, Germany, 2014. (In German) [Google Scholar] [CrossRef]
- Scheiden, T.; Oneschkow, N. Influence of coarse aggregate type on the damage mechanism in high-strength concrete under compressive fatigue loading. Struct. Concr. 2019, 20, 1212–1219. [Google Scholar] [CrossRef]
- Sparks, P.R. The Influence of Rate of Loading and Material Variability on the Fatigue Characteristics of Concrete. Int. Concr. Abstr. Portal 1982, 75, 331–342. [Google Scholar]
- König, G.; Danielewicz, I. Ermüdungsfestigkeit von Stahlbeton- und Spannbetonbauteilen mit Erläuterungen zu den Nachweisen gemäß CEB-FIP Model Code 1990; Fatigue Strength of Reinforced and Prestressed Concrete Components with Explanations of the Verifications According to CEB-FIP Model Code 1990; Deutscher Ausschuss für Stahlbeton; German Committee for Reinforced Concrete Issue 439; Ernst & Sohn: Berlin, Germany, 1994. (In German) [Google Scholar] [CrossRef]
- Oneschkow, N.; Lohaus, L. Zum Ermüdungsnachweis von druckschwellbeanspruchtem Beton, Teil 1 About the design concept for compressive fatigue loading of concrete—Structure of the fatigue design concept. Beton Stahlbetonbau 2017, 112, 530–540. (In German) [Google Scholar] [CrossRef]
- Oneschkow, N.; Lohaus, L. Zum Ermüdungsnachweis von druckschwellbeanspruchtem Beton, Teil 2; About the design concept for compressive fatigue loading of concrete—Safety considerations and potential of further developments. Beton Stahlbetonbau 2017, 112, 611–622. (In German) [Google Scholar] [CrossRef]
- Schmidt, M.; Fehling, E.; Fröhlich, S.; Thiemicke, J. Sustainable Building with Ultra-High Performance Concrete—Results of the German Priority Programme 1182 funded by Deutsche Forschungsgemeinschaft (DFG). In Structural Materials and Engineering Series; Kassel University Press: Kassel, Germany, 2014; Volume 22. [Google Scholar]
- DIN EN 12390-3:2019-10; Testing Hardened Concrete—Part 3: Compressive Strength of Test Specimens. German Institute for Standardisation: Berlin, Germany, 2019. [CrossRef]
- DIN EN 12390-2:2009-08; Testing Hardened Concrete—Part 2: Making and Curing Specimens for Strength Tests. German Institute for Standardisation: Berlin, Germany, 2009. [CrossRef]
- DIN EN 12390-2:2019-10; Testing Hardened Concrete—Part 2: Making and Curing Specimens for Strength Tests. German Institute for Standardisation: Berlin, Germany, 2019. [CrossRef]
- DIN 1045-2:2008; Concrete, Reinforced and Prestressed Concrete Structures—Part 2: Concrete—Specification, Properties, Production and Conformity—Application rules for DIN EN 206-1. German Institute for Standardisation: Berlin, Germany, 2008. [CrossRef]
- DIN EN 1990:2021; Eurocode 0: Basis of Structural Design; German Version EN 1990-2002 + A1:2005 + A1:2005/AC:2010. German Institute for Standardisation: Berlin, Germany, 2010. [CrossRef]
- DIN EN 206:2021-06; Concrete—Specification, Performance, Production and Conformity; German Version EN 206:2013+A2:2021. German Institute for Standardisation: Berlin, Germany, 2021. [CrossRef]
- Deutscher Ausschuss für Stahlbeton [German Committee for Reinforced Concrete]. DAfStb-Richtlinie Ultrahochfester Beton, Teil 1 Bemessung und Konstruktion; DAfStb Guideline for Ultra-High-Strength Concrete, Part 1 Design and Construction; DAfStb: Berlin, Germany, 2019. (In German) [Google Scholar]
- Basaldella, M.; Oneschkow, N.; Lohaus, L. Influence of the specimen production and preparation on the compressive strength and the fatigue resistance of HPC and UHPC. Mater. Struct. 2021, 54, 99. [Google Scholar] [CrossRef]


| Component | Unit | HPC | UHPC |
|---|---|---|---|
| CEM I 52.5 R-HS/NA (Holcim Sulfo, Lägerdorf, Germany) | [kg/m³] | 500 | 795 |
| Silica fume (Sika® Silicoll P) | [kg/m³] | - | 169 |
| Quartz powder (Quarzwerke MILLSIL® W12, Frechen, Germany) | [kg/m³] | - | 198 |
| Quartz sand (0/0.5 mm) (Quarzwerke H33, Haltern, Germany) | [kg/m³] | 75 | 971 |
| Sand (0/2 mm) (Tündern, Germany) | [kg/m³] | 850 | - |
| Basalt (2/5 mm) (Ölberg, Germany) | [kg/m³] | 350 | - |
| Basalt (5/8 mm) (Ölberg, Germany) | [kg/m³] | 570 | - |
| Superplasticiser (BASF MasterGlenium® ACE 460, Germany) | [kg/m³] | 5 | - |
| Superplasticiser (BASF MasterGlenium® ACE 394, Germany) | [kg/m³] | - | 24 |
| Stabiliser (BASF MasterMatrix® SDC 100, Germany) | [kg/m³] | 2.85 | - |
| Water | [kg/m³] | 176 | 188 |
| w/c ratio; w/ceq ratio | [-] | 0.35 | 0.19 |
| Concrete | Qty | fcm | SD | fck | Classification |
|---|---|---|---|---|---|
| [-] | [MPa] | [MPa] | [MPa] | ||
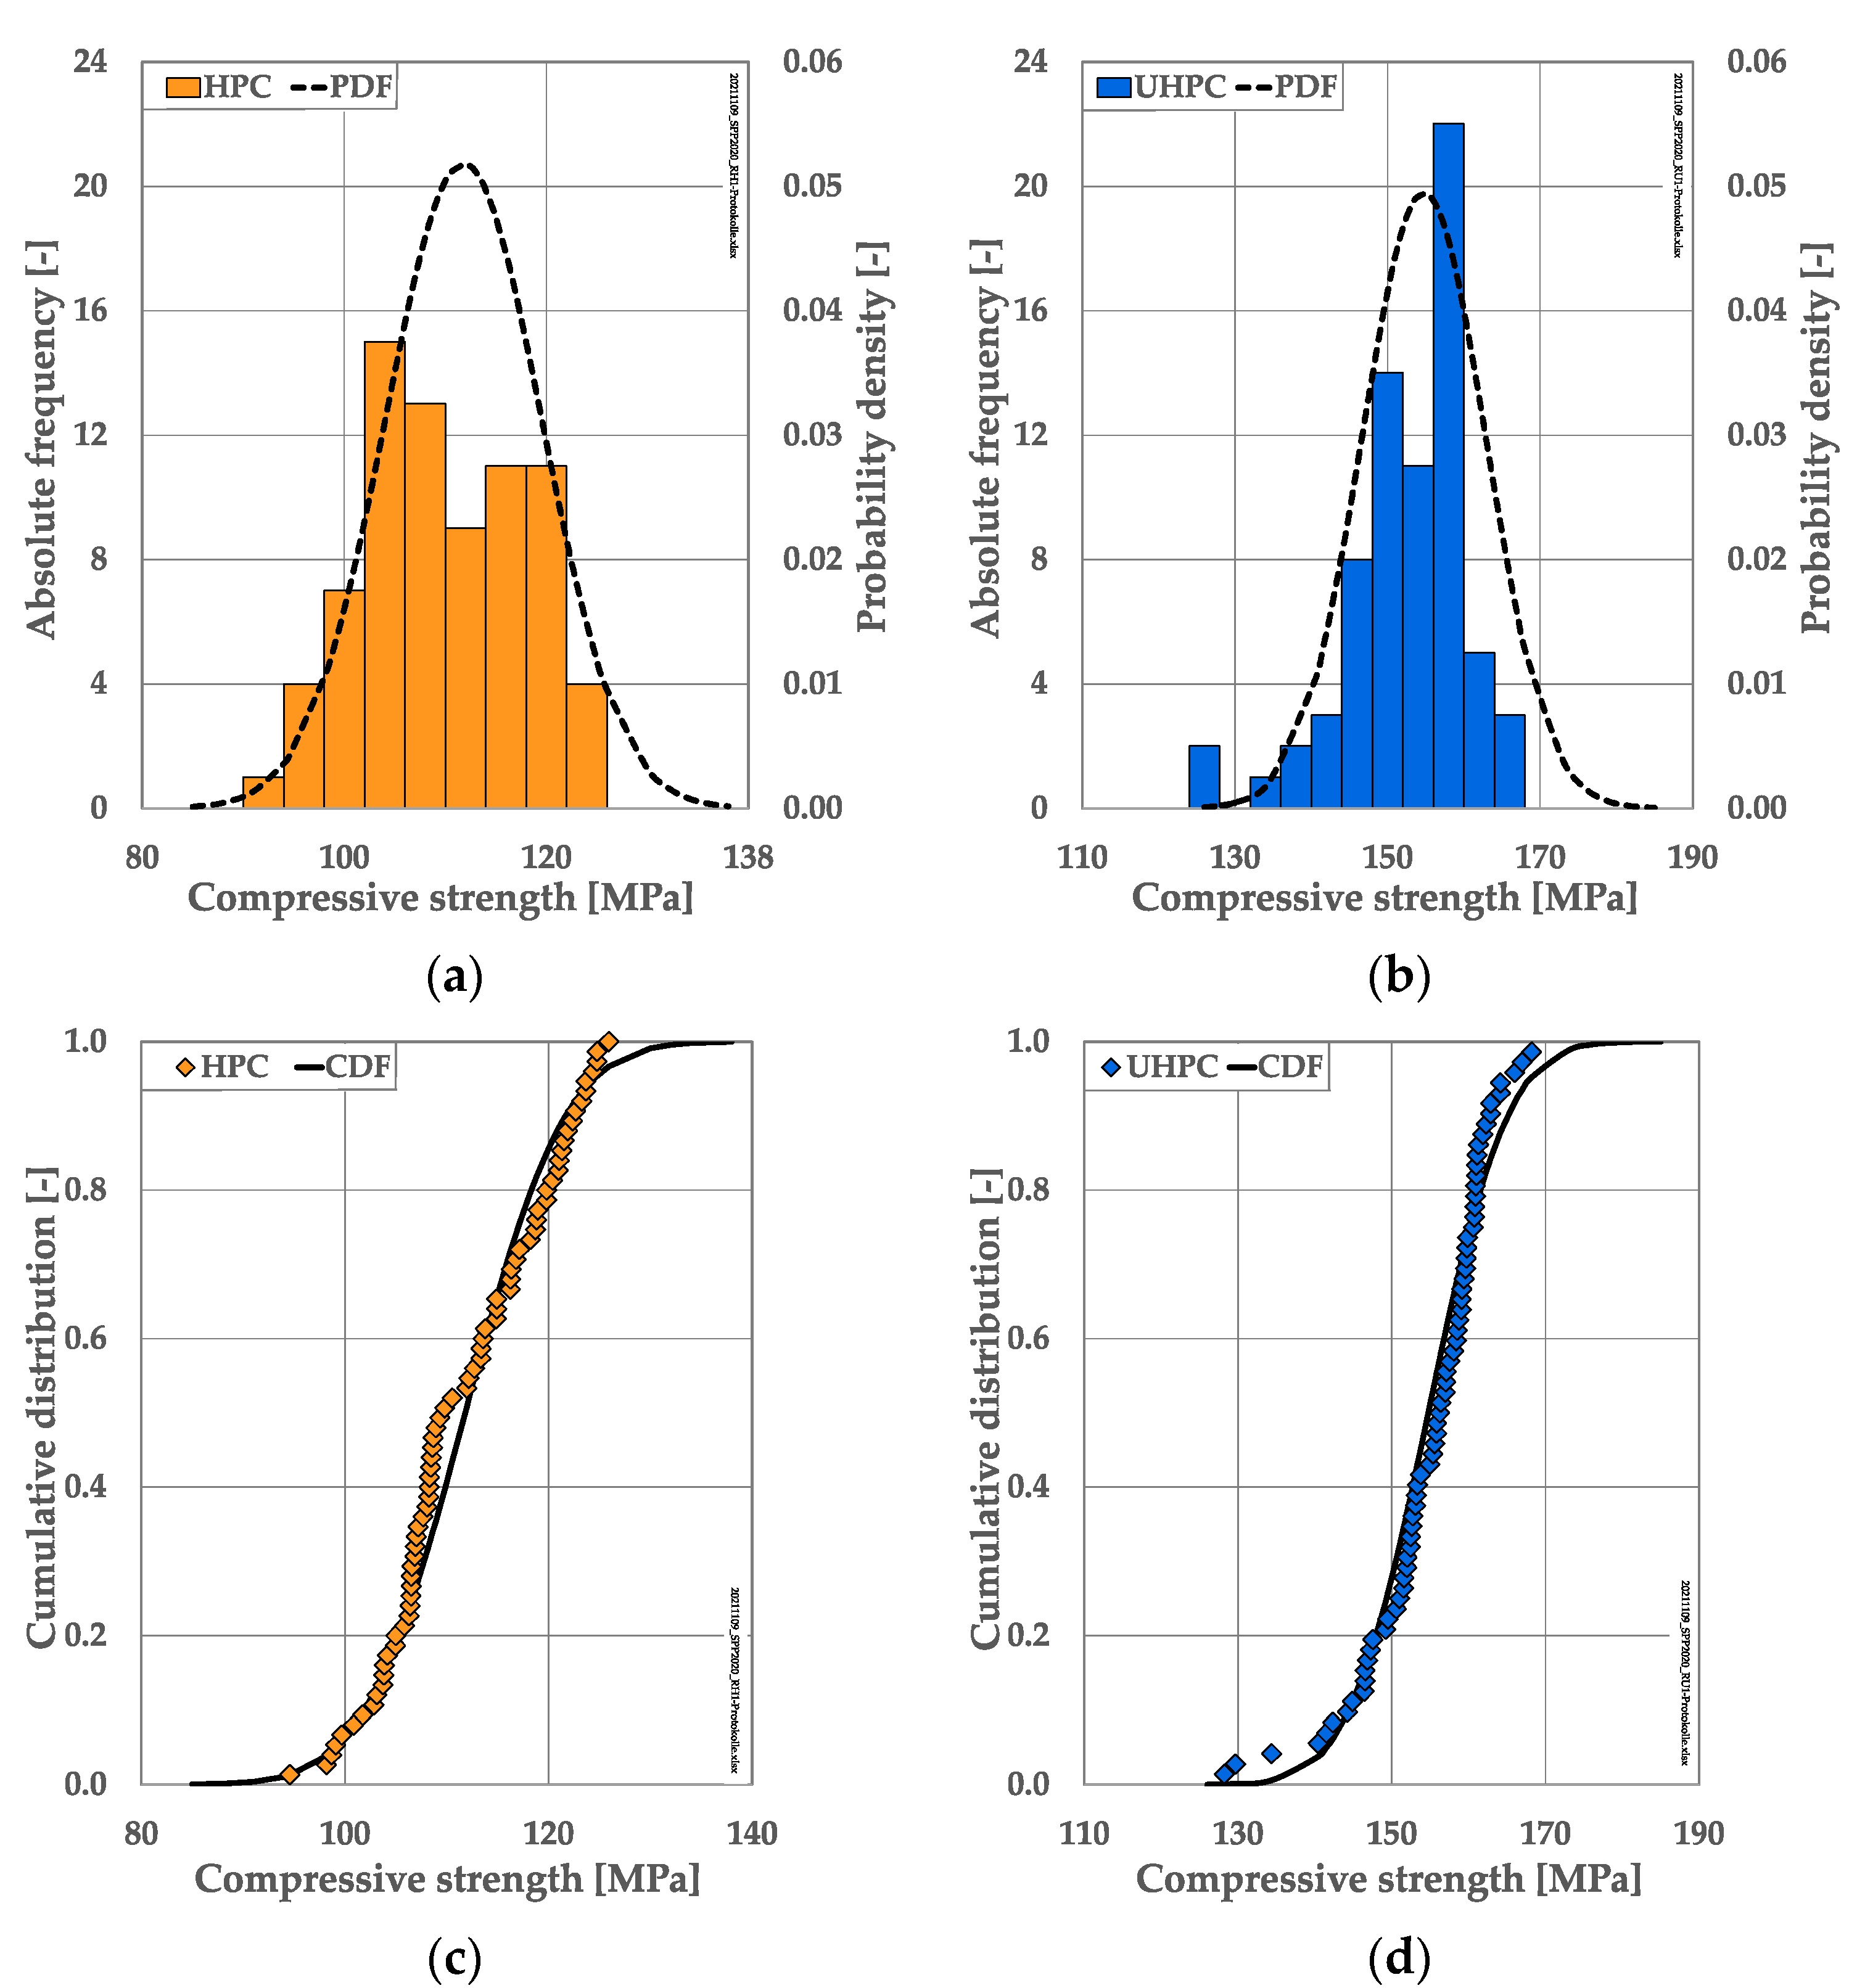
| HPC | 75 | 111.8 | 7.7 | 99.2 | C80/95 |
| UHPC | 72 | 154.8 | 8.1 | 141.5 | C130/140 |
| Concrete | HPC-a | UHPC-a | HPC-b | UHPC-b |
|---|---|---|---|---|
| Smin/Smax | IfB | IfB | MPA | MPA |
| 0.05/0.75 | 7 | 7 | 3 | 4 |
| 0.05/0.85 | - | - | 6 | 6 |
| Parameter | Unit | Description |
|---|---|---|
| [MPa] | Maximum or minimum peak stress | |
| [‰] | Strain at maximum or minimum peak stress | |
| [‰] | Total growth of strain at maximum stress, N/Nf = 0.0–1.0 | |
| [‰] | Total growth of strain at minimum stress, N/Nf = 0.0–1.0 | |
| [-] | Gradient of maximum strain development in phase II (N/Nf = 0.2–0.8) | |
| [-] | Gradient of minimum strain development in phase II (N/Nf = 0.2–0.8) | |
| [MPa] | Stiffness due fatigue loading | |
| [%] | Percentile reduction of stiffness, N/Nf = 0.0–1.0 | |
| [MPa] | Gradient of stiffness development in phase II (N/Nf = 0.2–0.8) |
| Concrete | Qty | Age | fcm,ref | SD | εcm | E0.15–0.80 |
|---|---|---|---|---|---|---|
| [-] | [d] | [MPa] | [‰] | [MPa] | [MPa] | |
| HPC-a | 6 | 79 | 116.2 | 2.2 | −3.67 | 36,700 |
| HPC-b | 4 | 213 | 89.8 | 3.0 | −3.31 | 33,200 |
| UHPC-a | 6 | 97 | 174.0 | 5.6 | −4.57 | 41,200 |
| UHPC-b | 5 | 249 | 200.6 | 1.9 | −5.24 | 41,700 |
Publisher’s Note: MDPI stays neutral with regard to jurisdictional claims in published maps and institutional affiliations. |
© 2022 by the authors. Licensee MDPI, Basel, Switzerland. This article is an open access article distributed under the terms and conditions of the Creative Commons Attribution (CC BY) license (https://creativecommons.org/licenses/by/4.0/).
Share and Cite
Basaldella, M.; Jentsch, M.; Oneschkow, N.; Markert, M.; Lohaus, L. Compressive Fatigue Investigation on High-Strength and Ultra-High-Strength Concrete within the SPP 2020. Materials 2022, 15, 3793. https://doi.org/10.3390/ma15113793
Basaldella M, Jentsch M, Oneschkow N, Markert M, Lohaus L. Compressive Fatigue Investigation on High-Strength and Ultra-High-Strength Concrete within the SPP 2020. Materials. 2022; 15(11):3793. https://doi.org/10.3390/ma15113793
Chicago/Turabian StyleBasaldella, Marco, Marvin Jentsch, Nadja Oneschkow, Martin Markert, and Ludger Lohaus. 2022. "Compressive Fatigue Investigation on High-Strength and Ultra-High-Strength Concrete within the SPP 2020" Materials 15, no. 11: 3793. https://doi.org/10.3390/ma15113793
APA StyleBasaldella, M., Jentsch, M., Oneschkow, N., Markert, M., & Lohaus, L. (2022). Compressive Fatigue Investigation on High-Strength and Ultra-High-Strength Concrete within the SPP 2020. Materials, 15(11), 3793. https://doi.org/10.3390/ma15113793