
Friction-Wear Characteristics of Carbon Fiber Reinforced Paper-Based Friction Materials under Different Working Conditions


Abstract
:1. Introduction
2. Materials and Methods
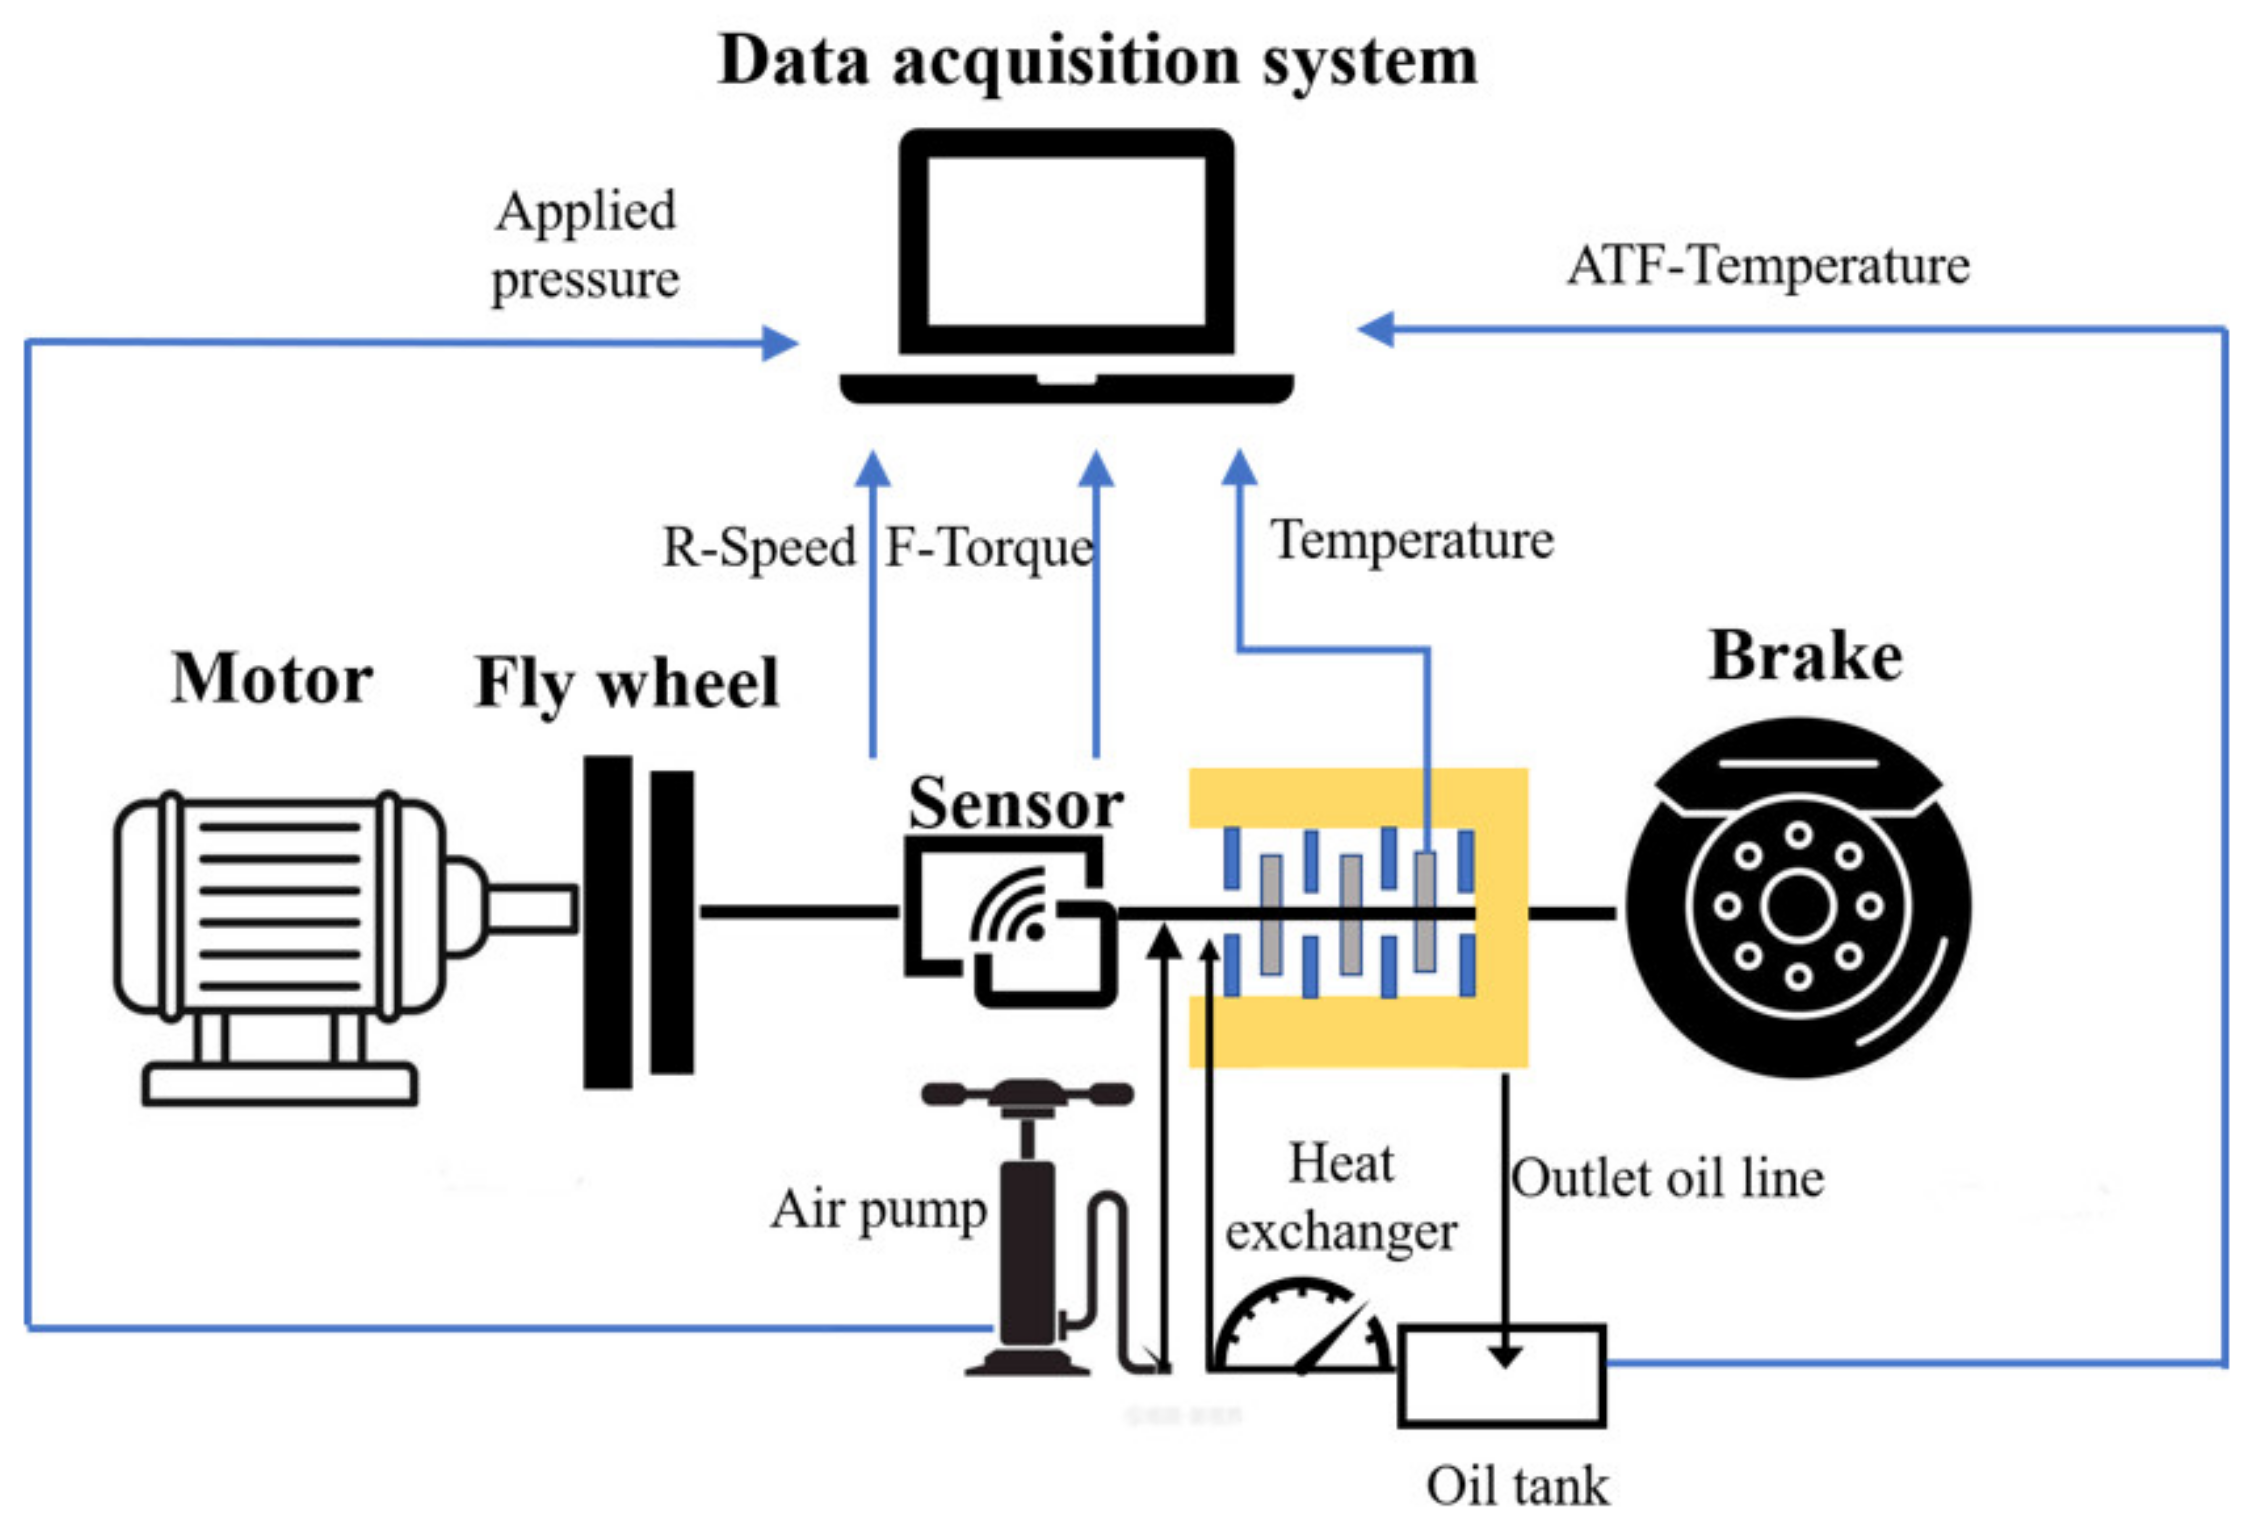
2.1. Testing Equipment
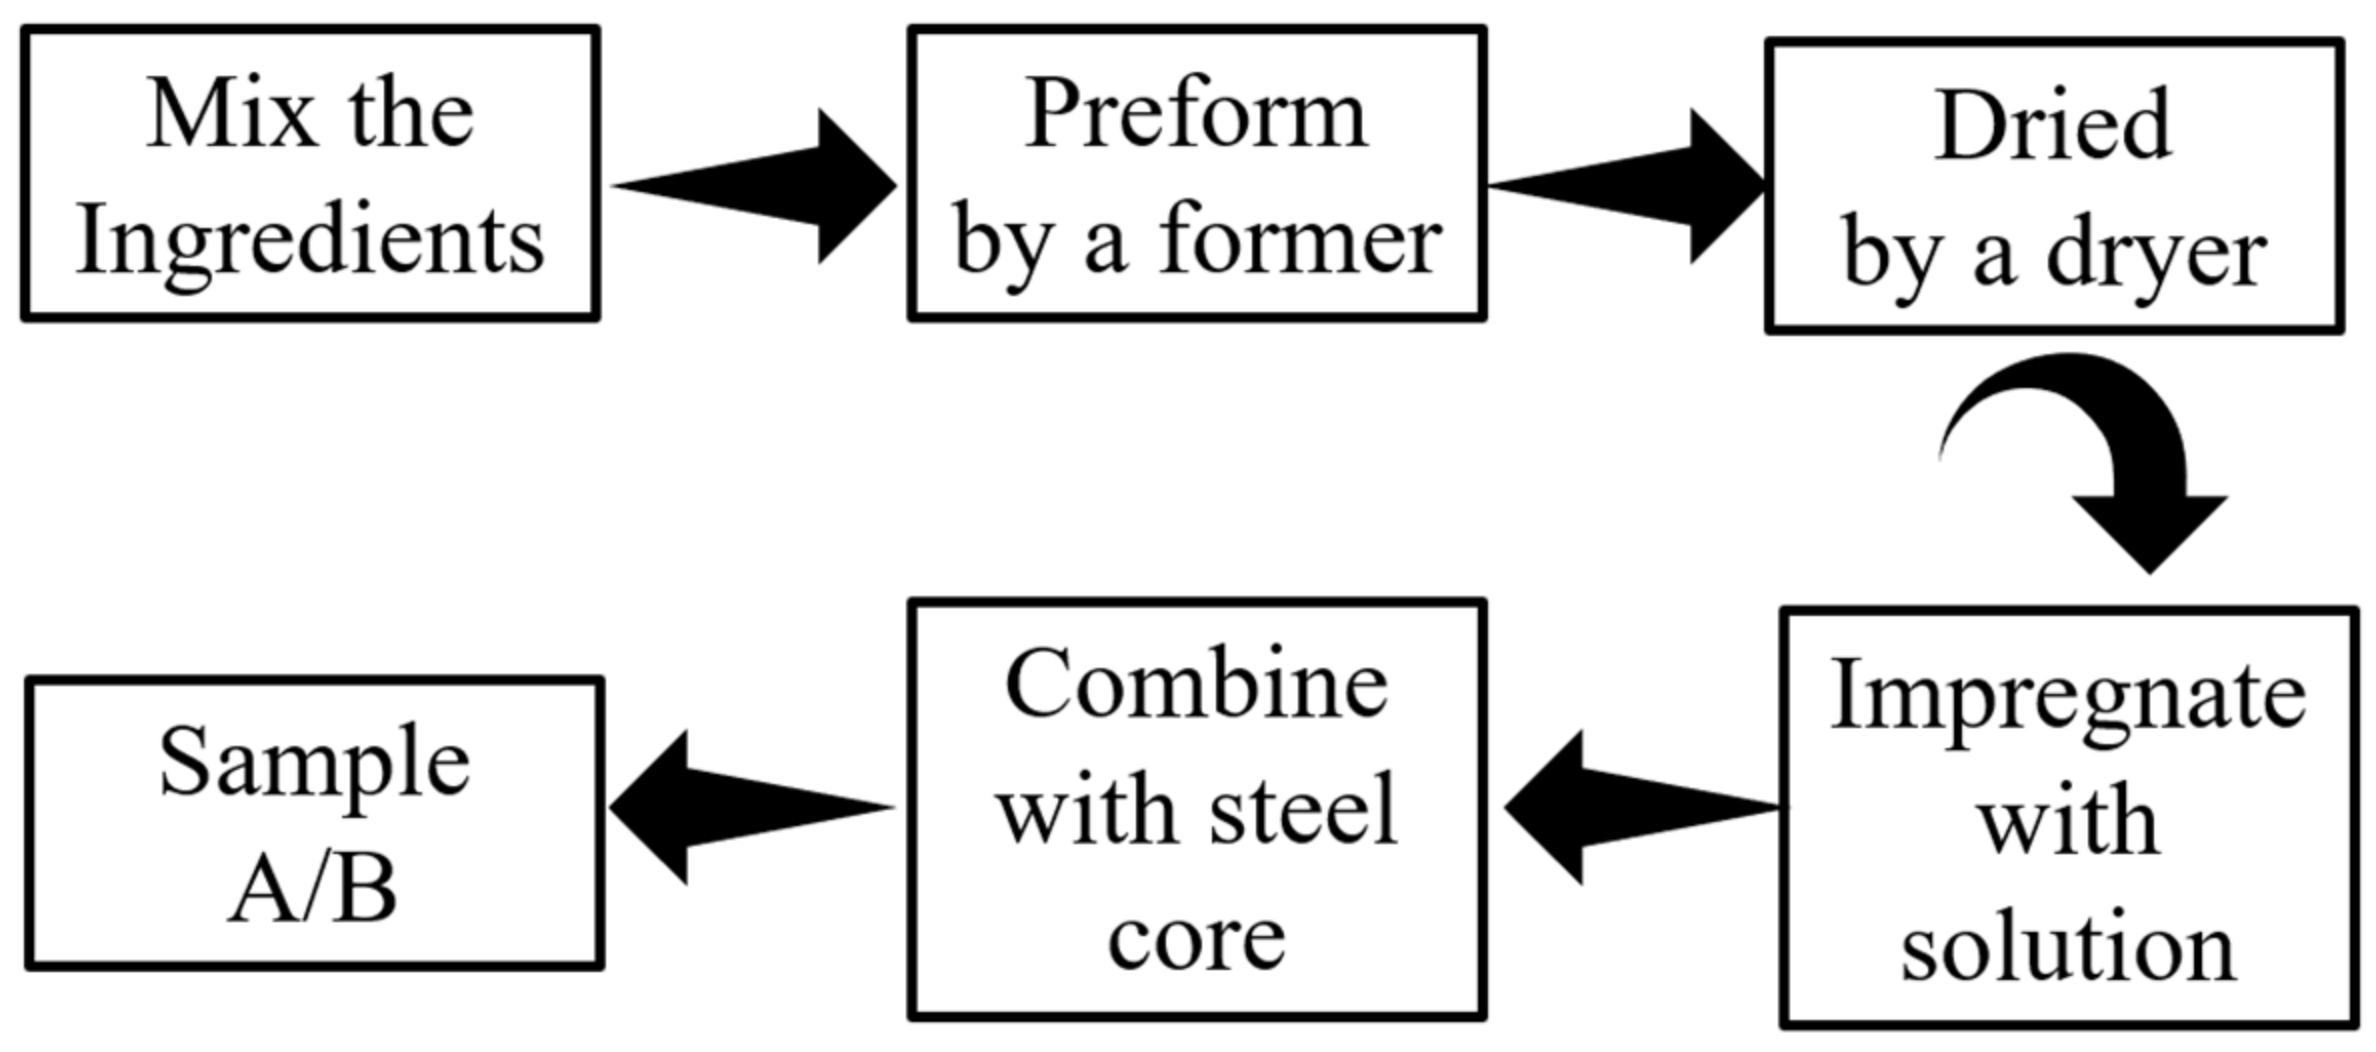
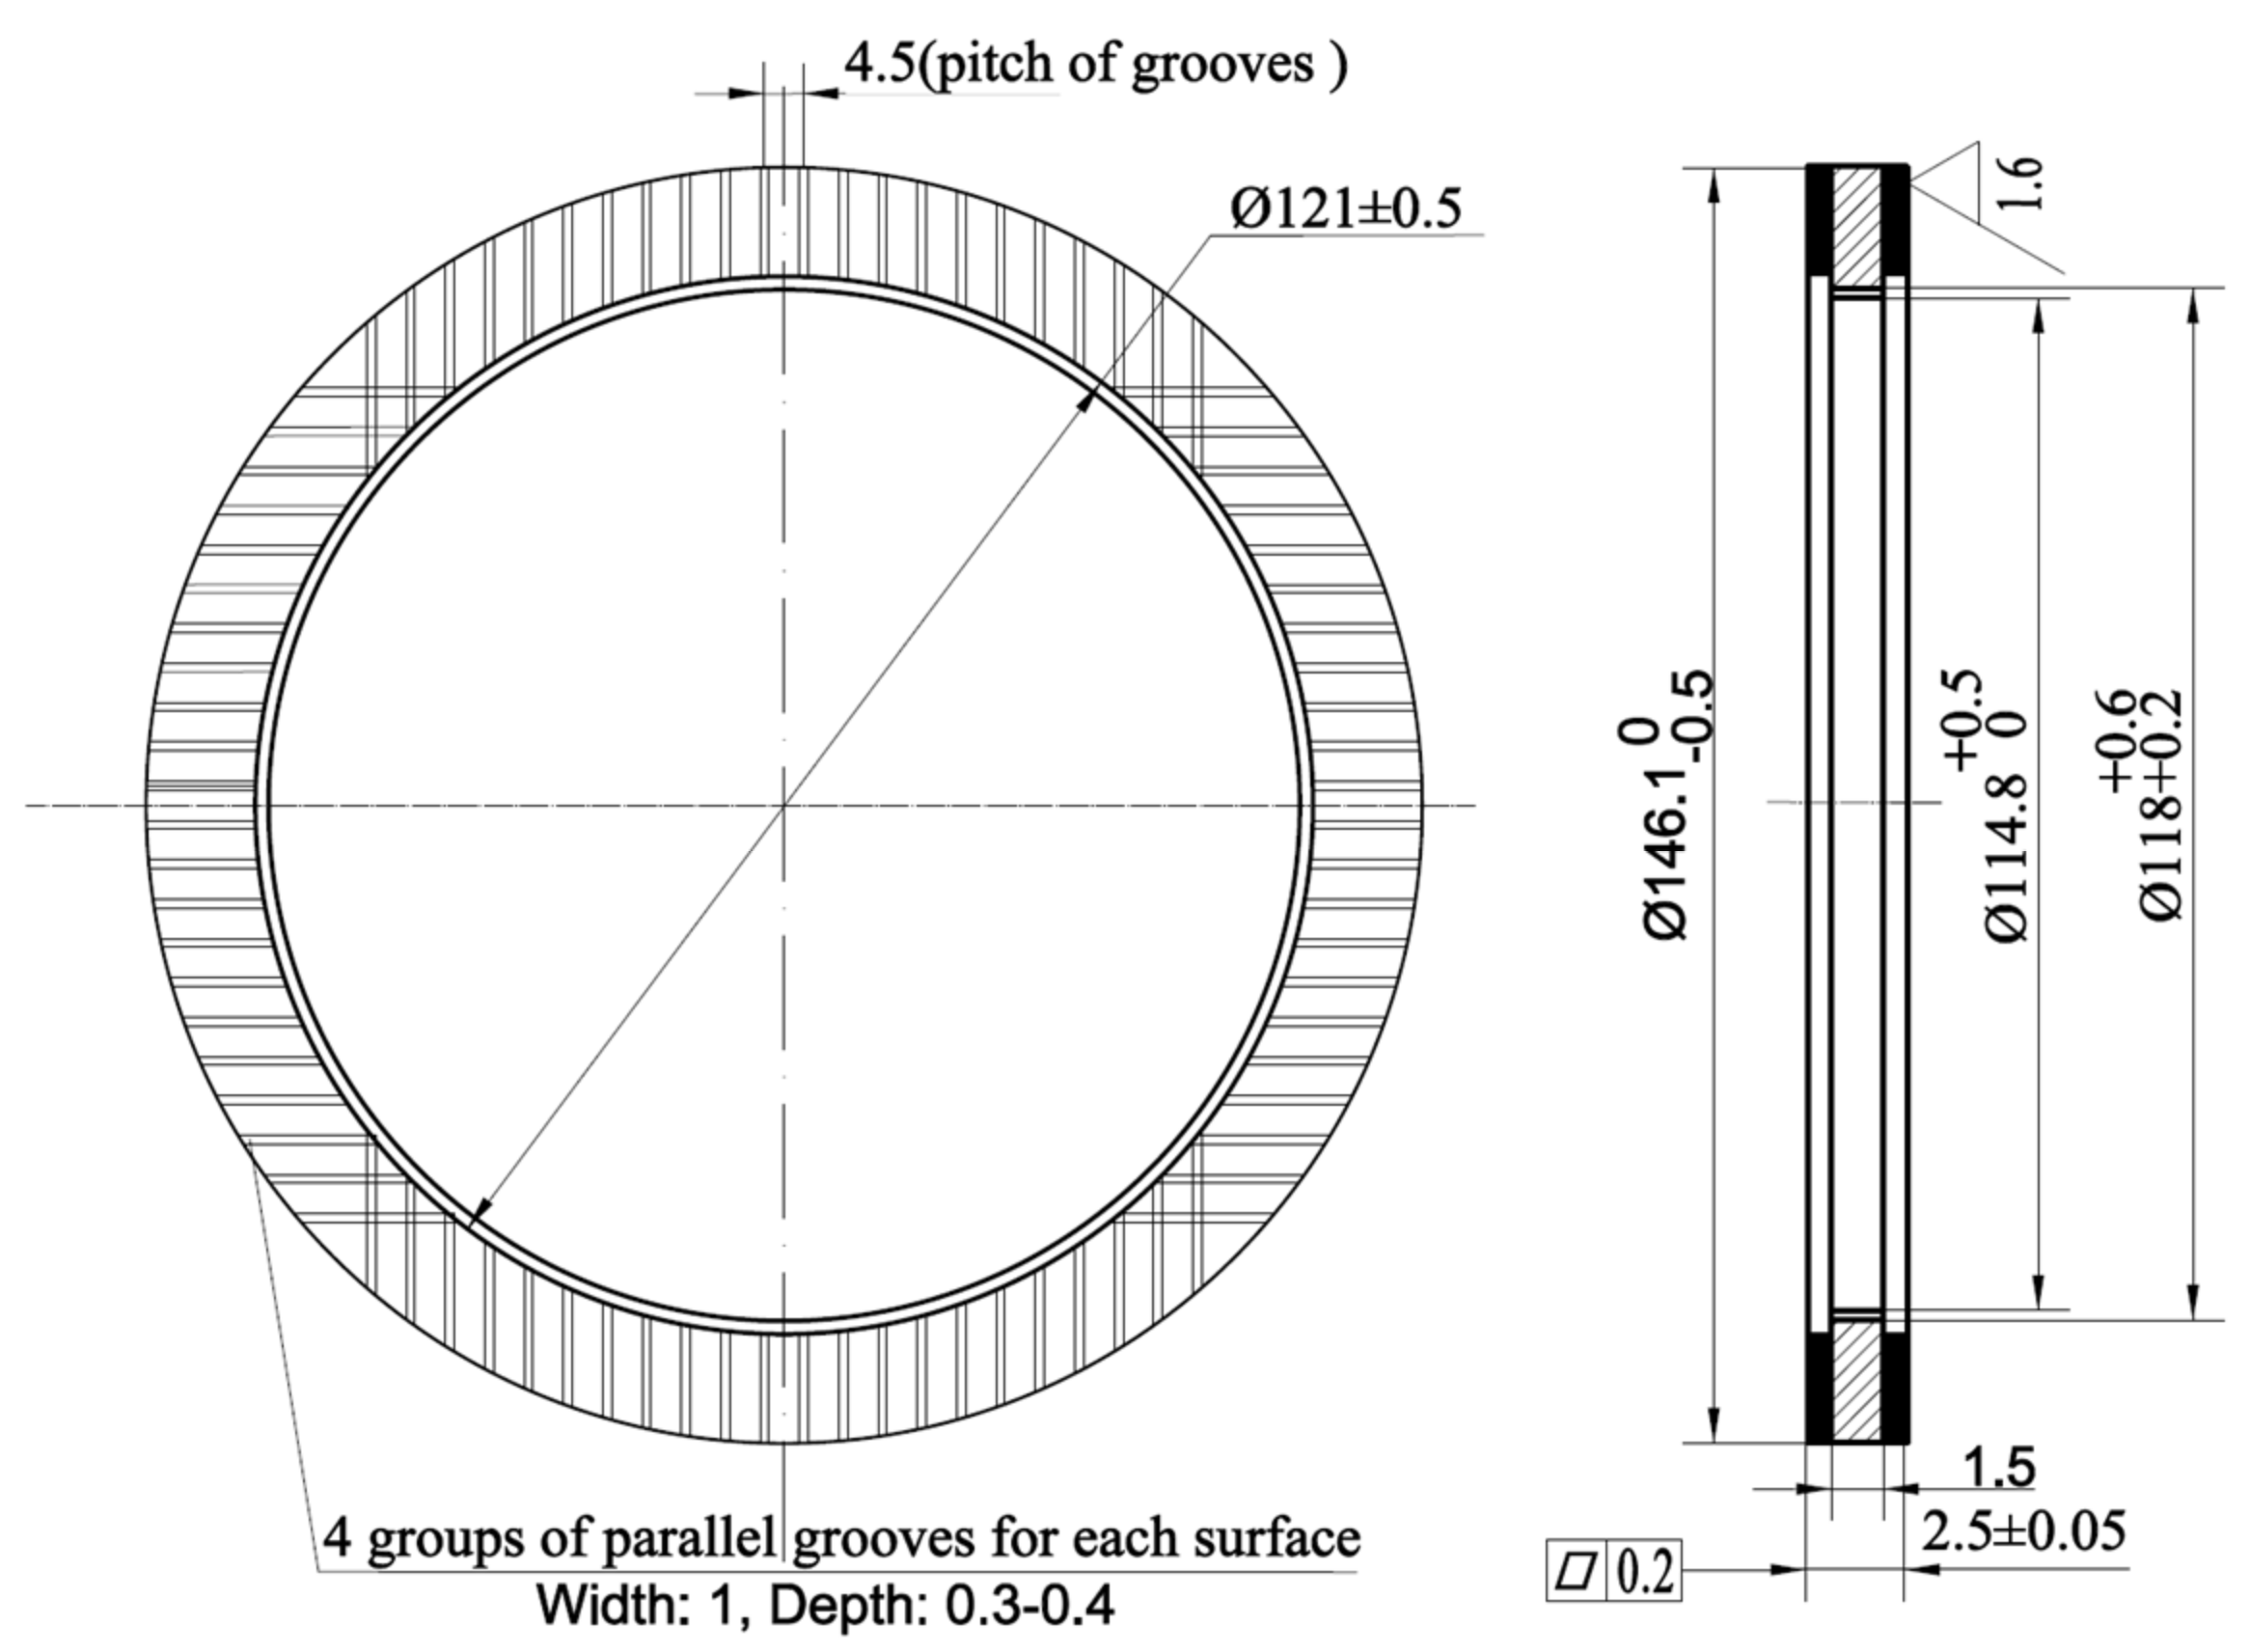
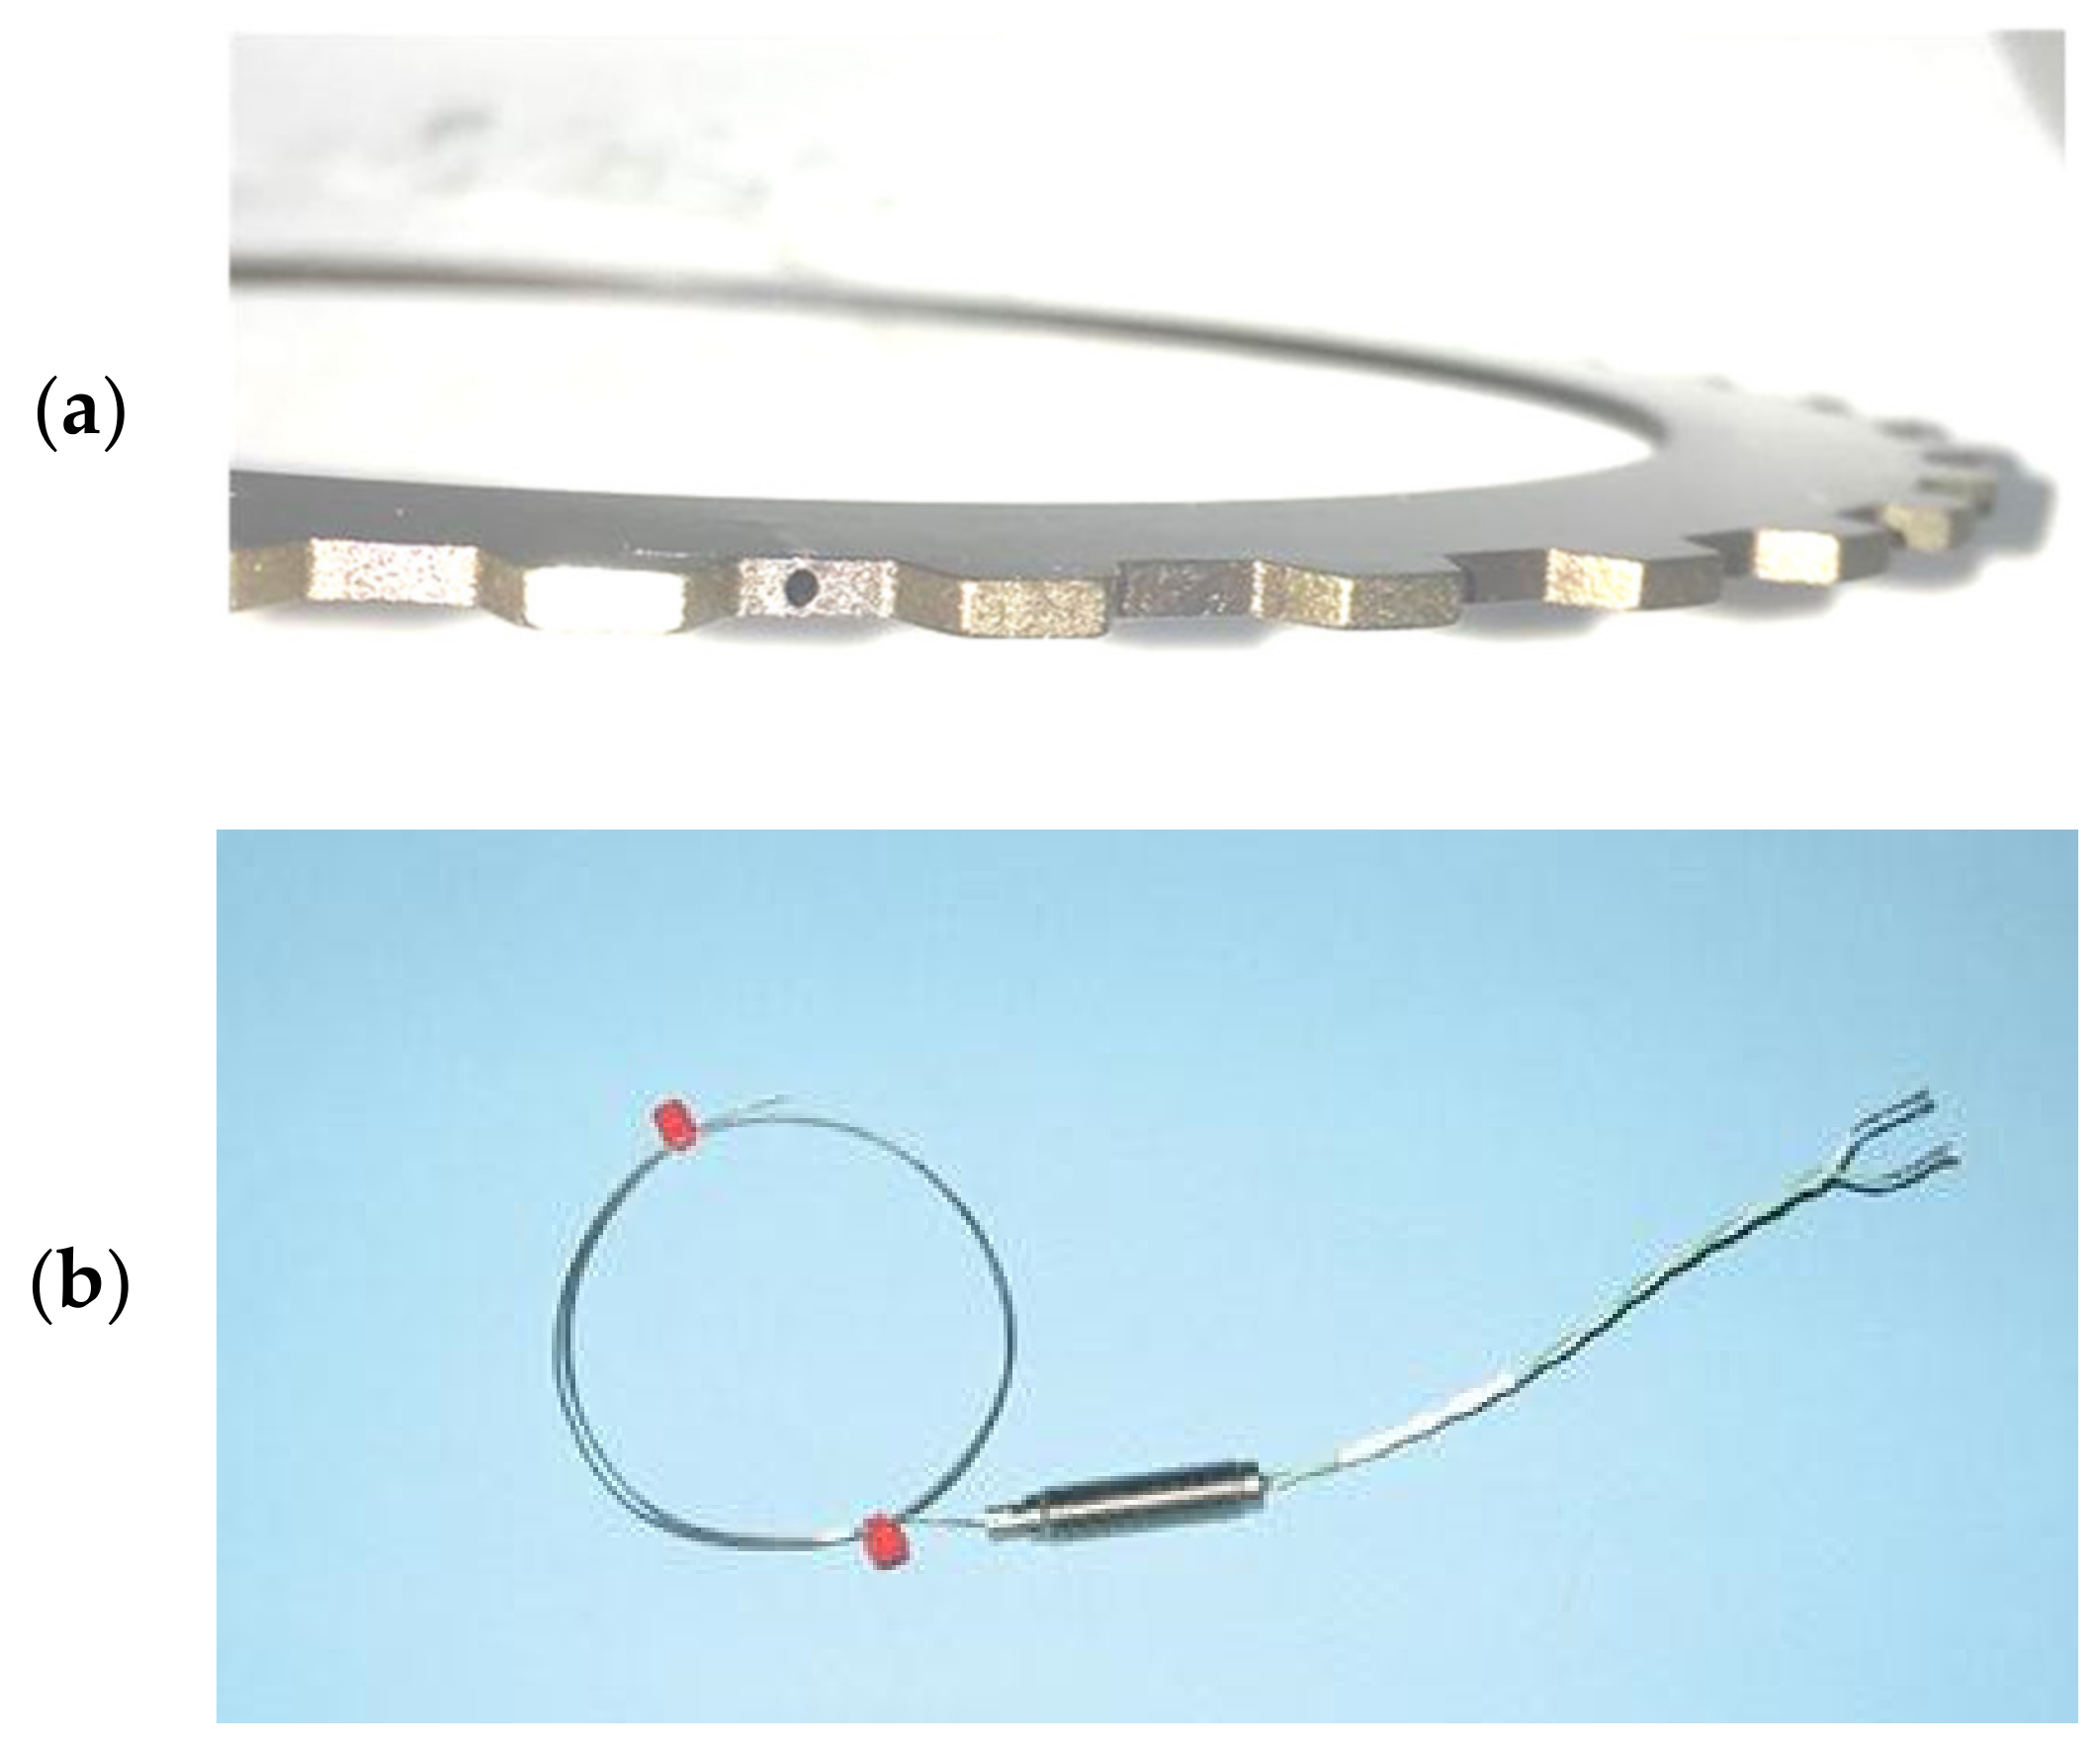
2.2. Test Samples
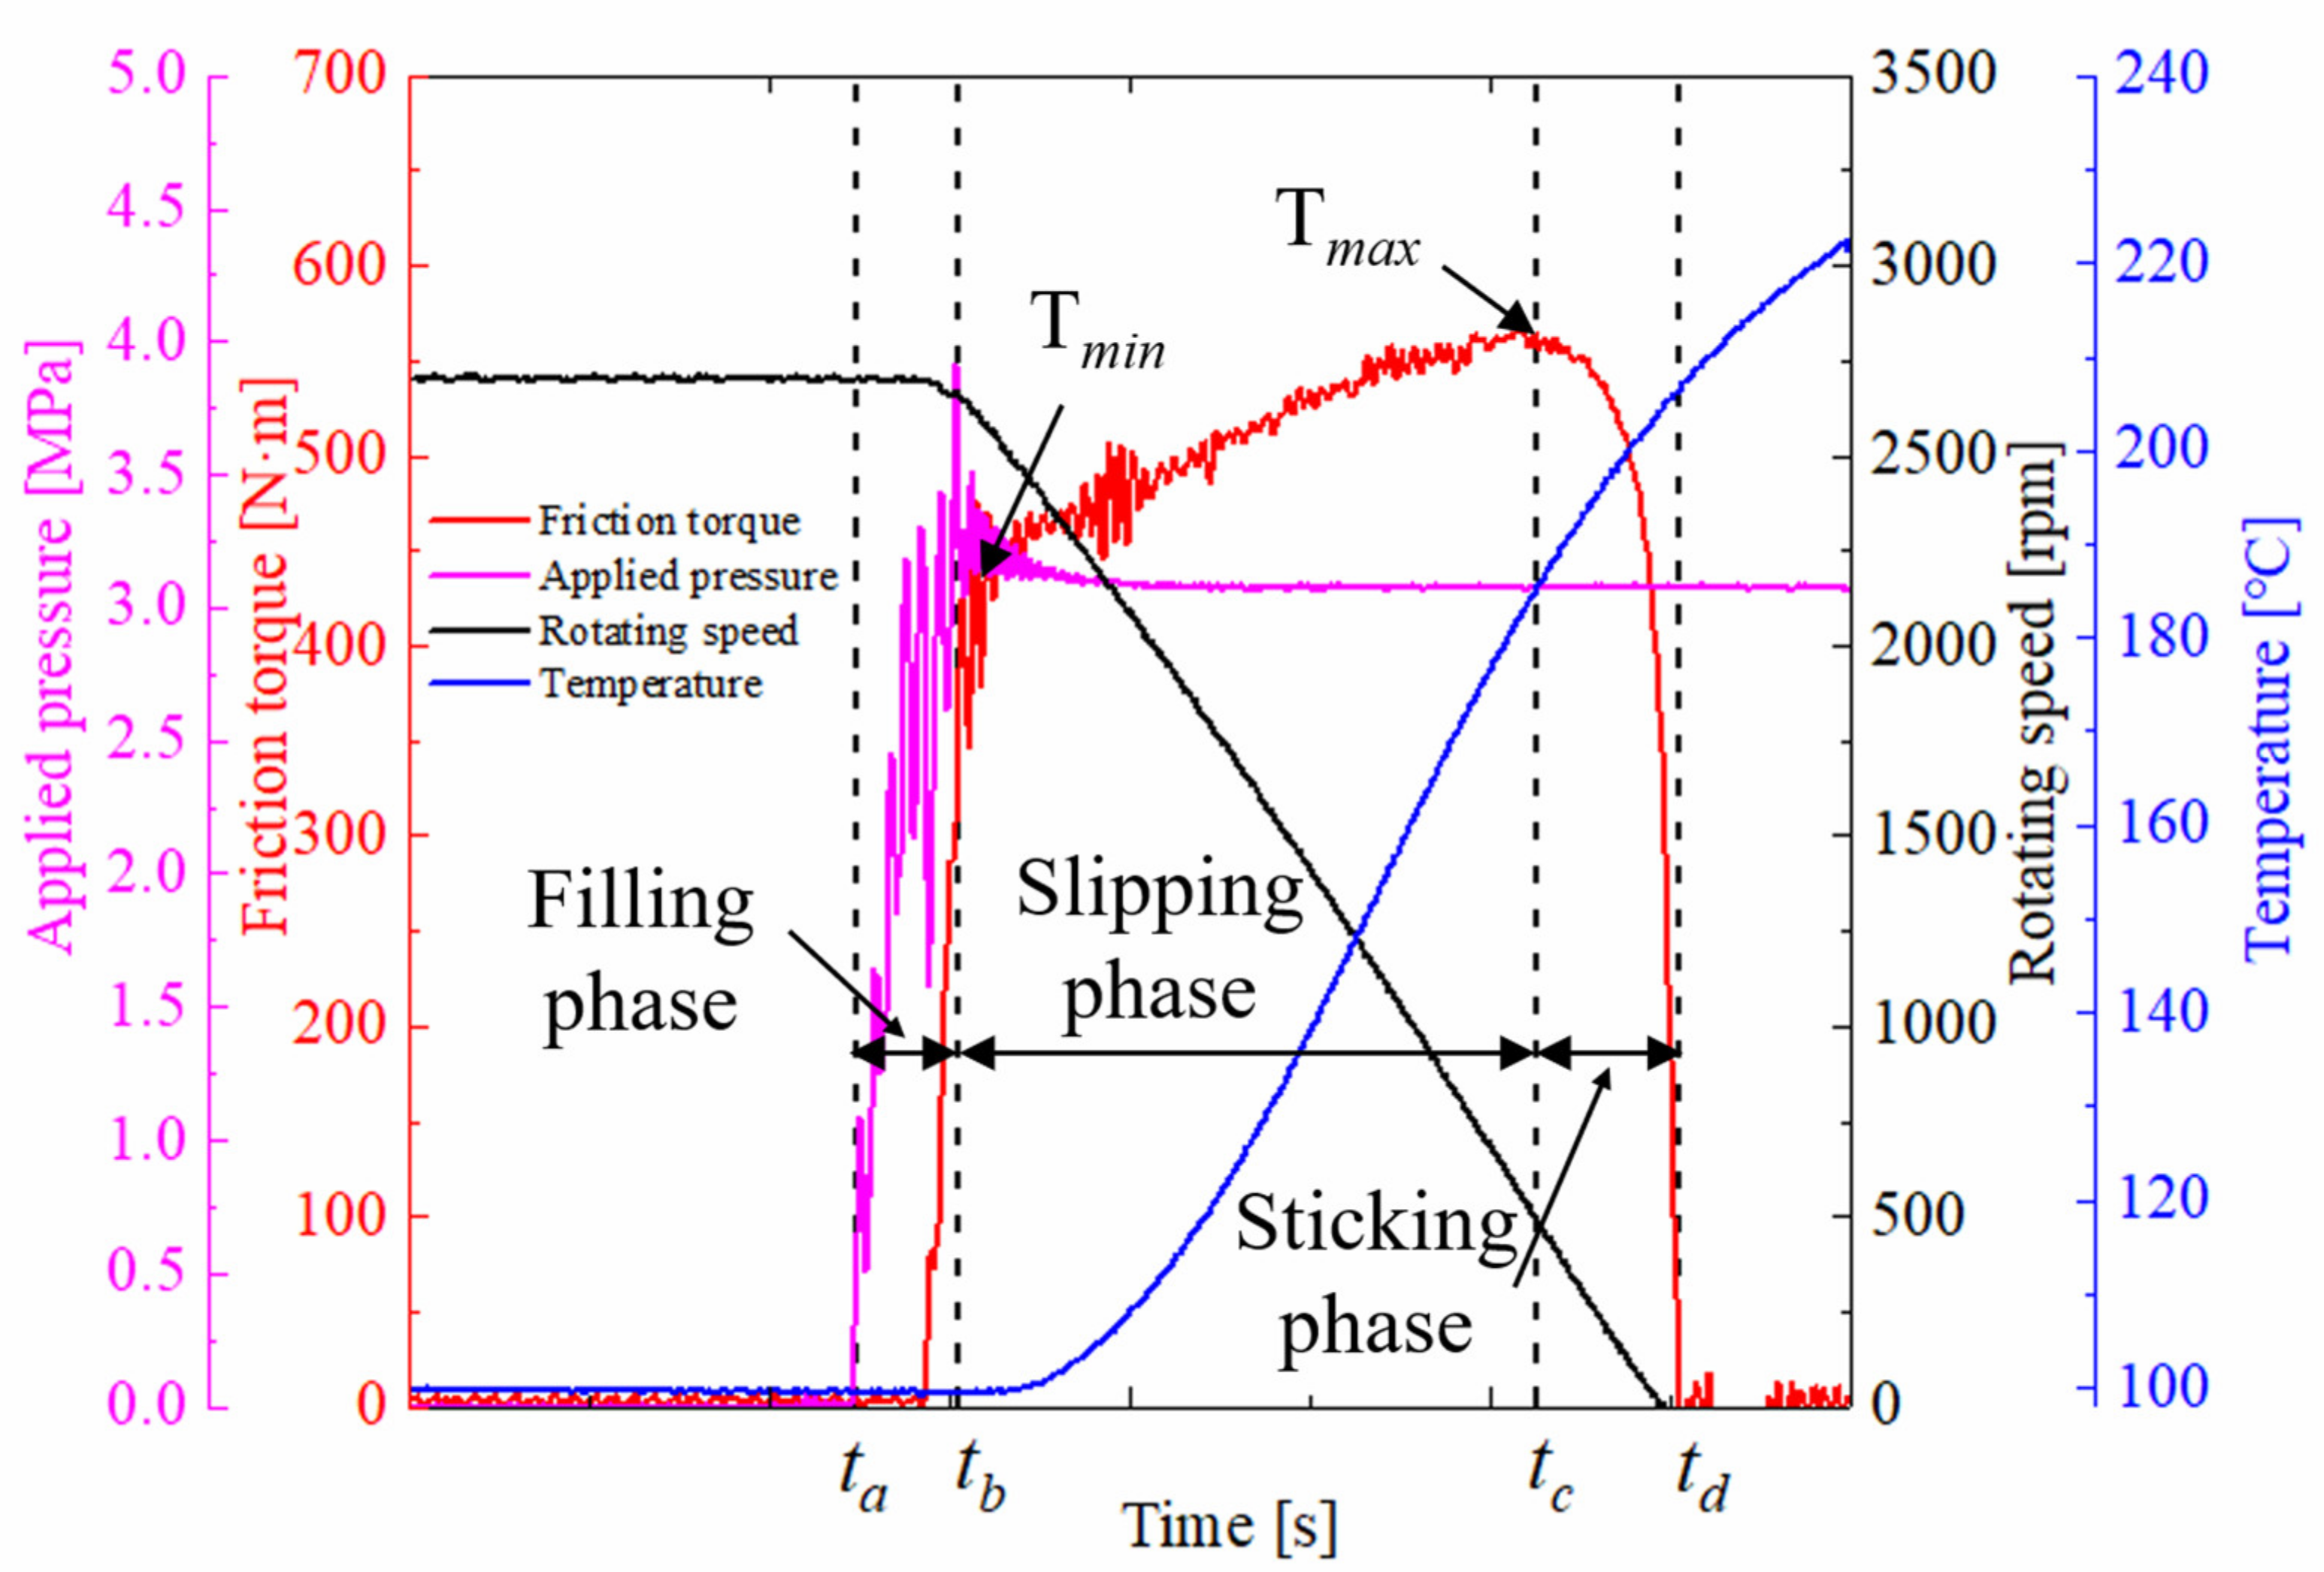
2.3. Testing Method
3. Results and Discussion
3.1. The Influence Factors of Friction Performance
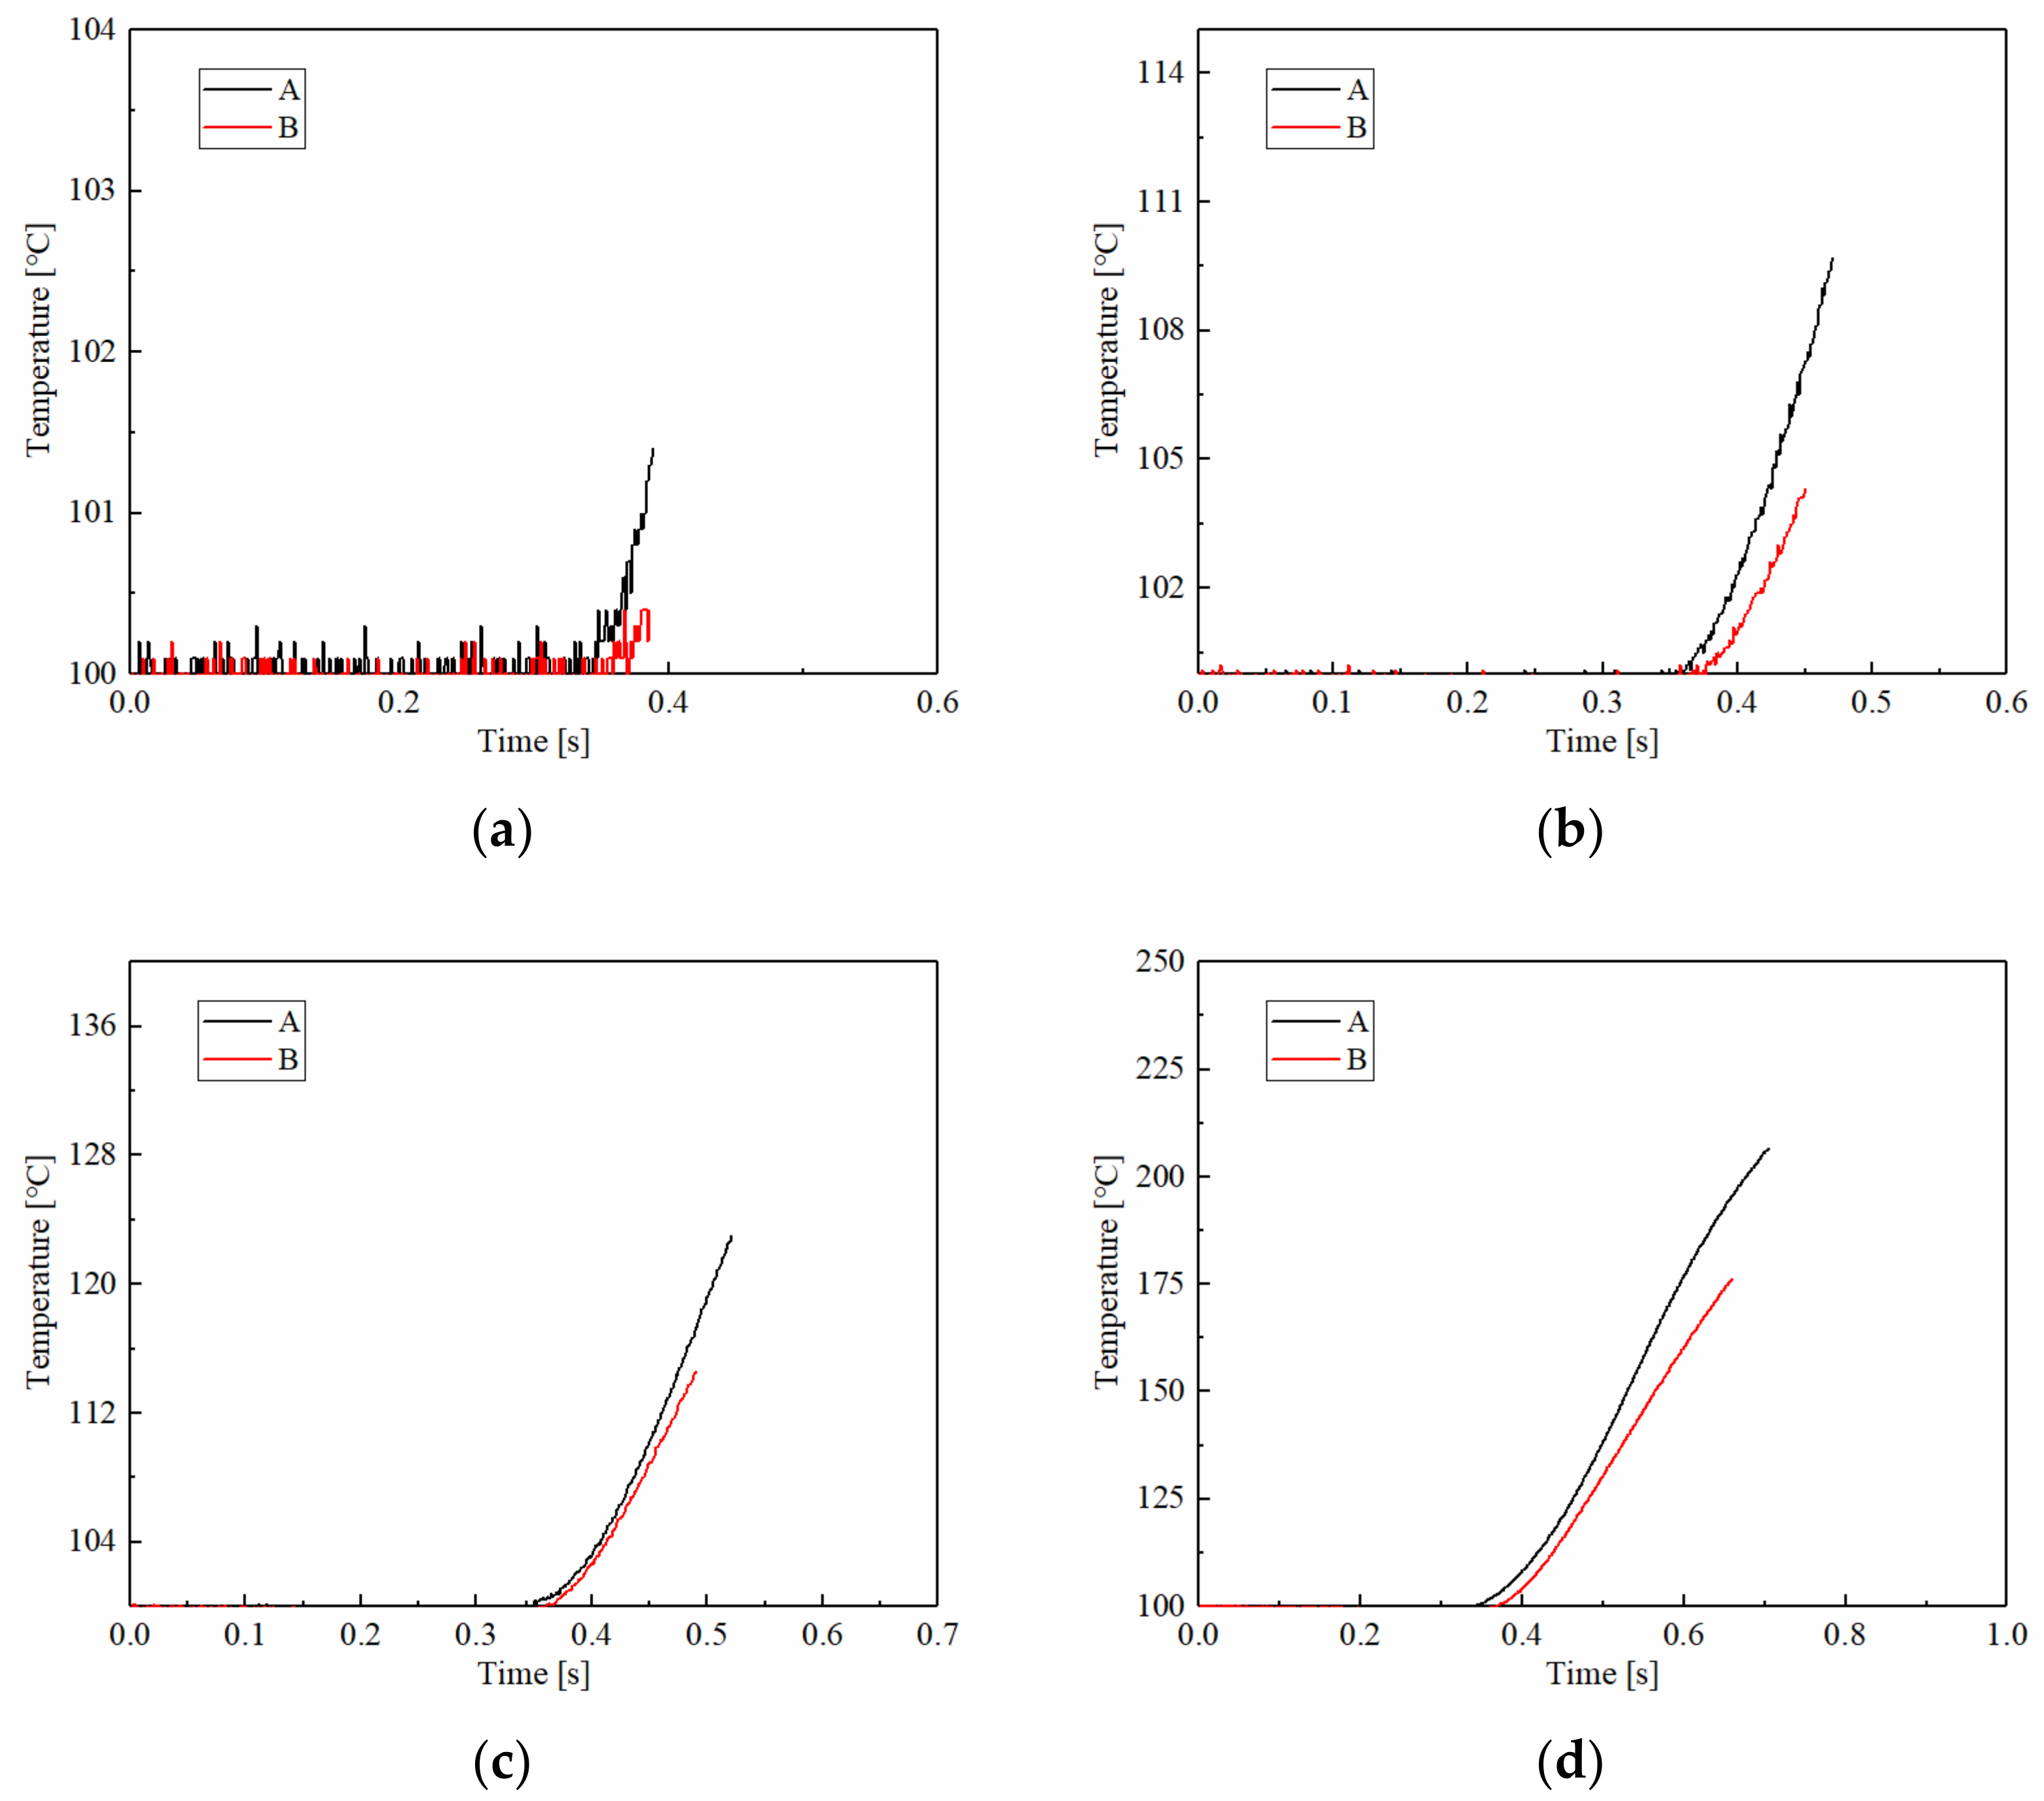
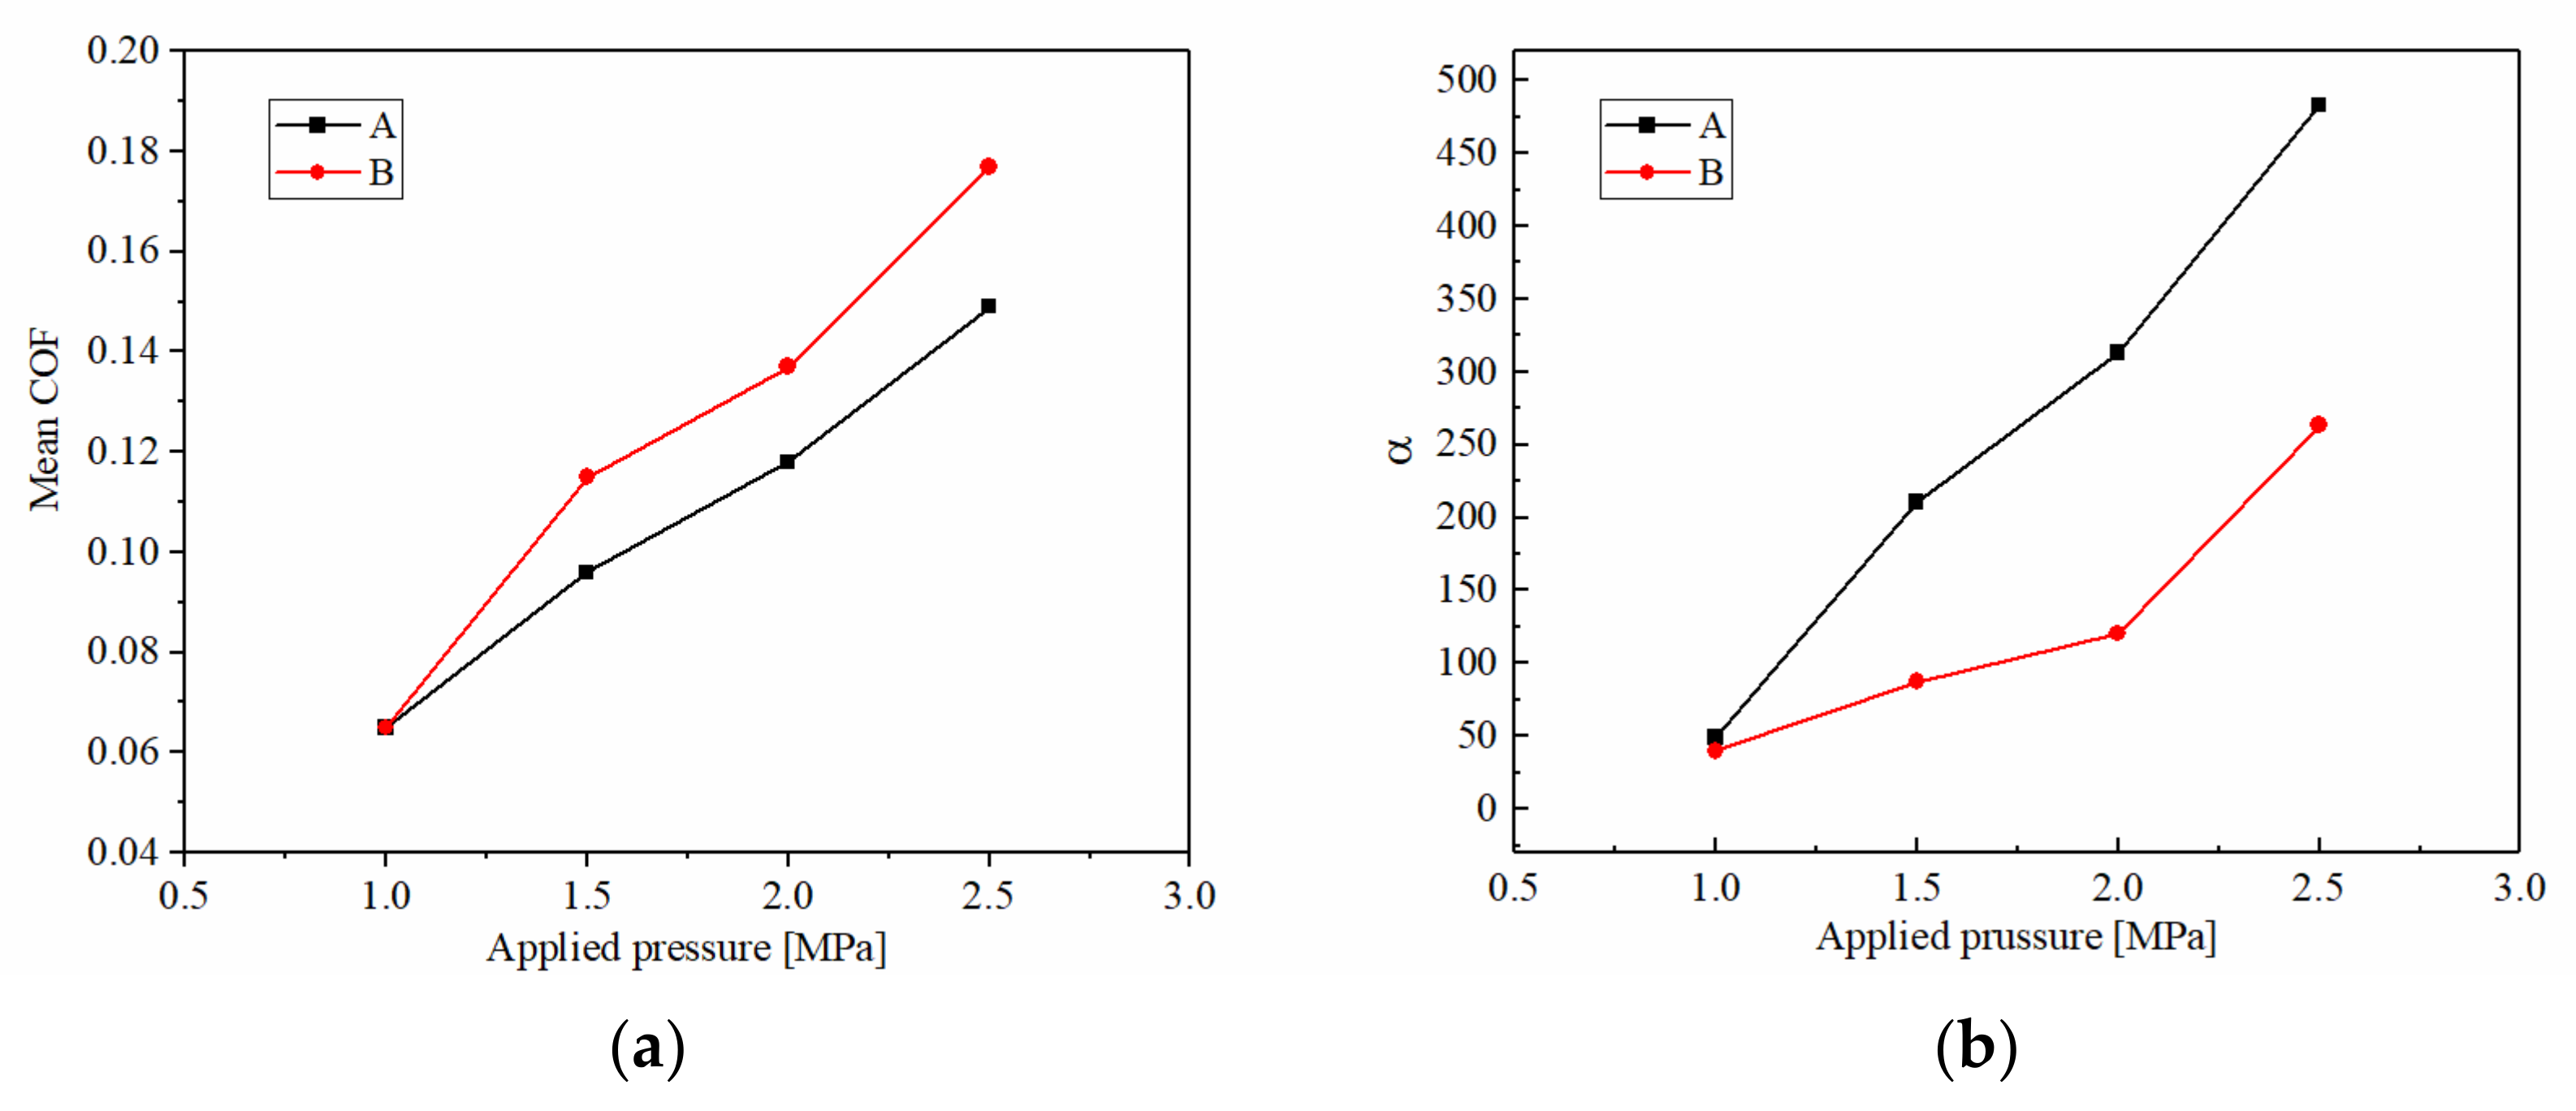
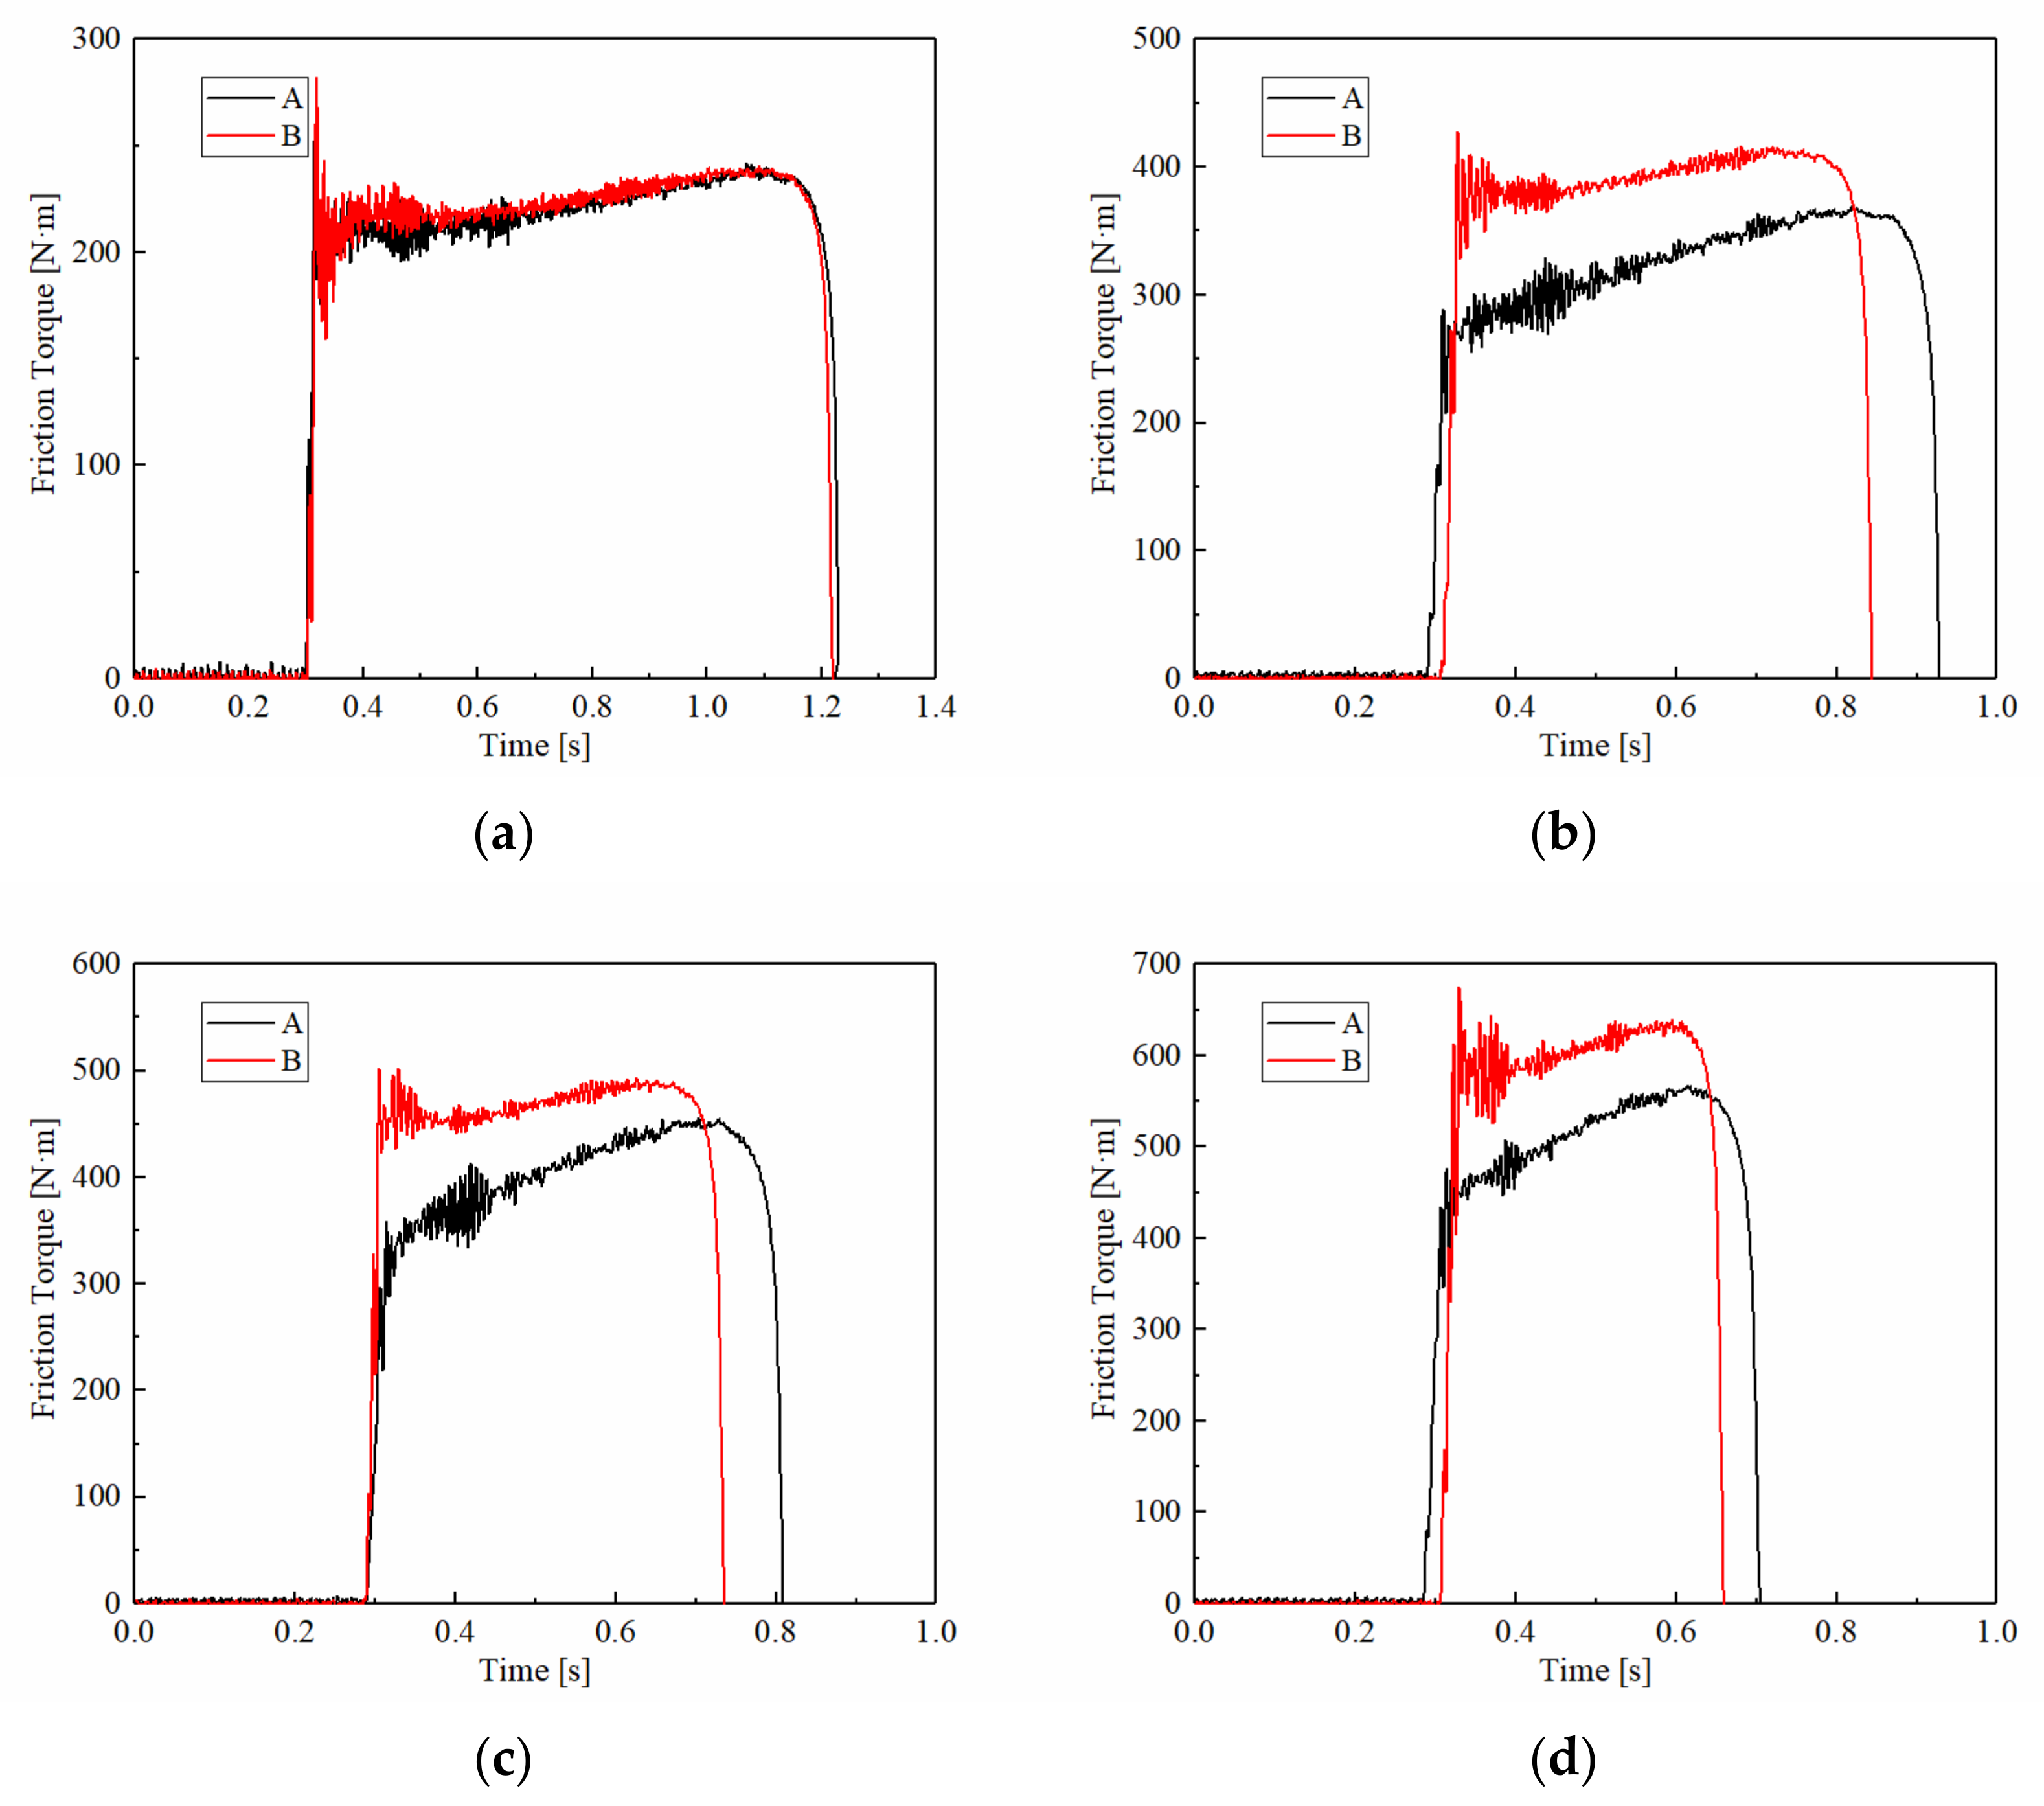
3.1.1. Applied Pressure
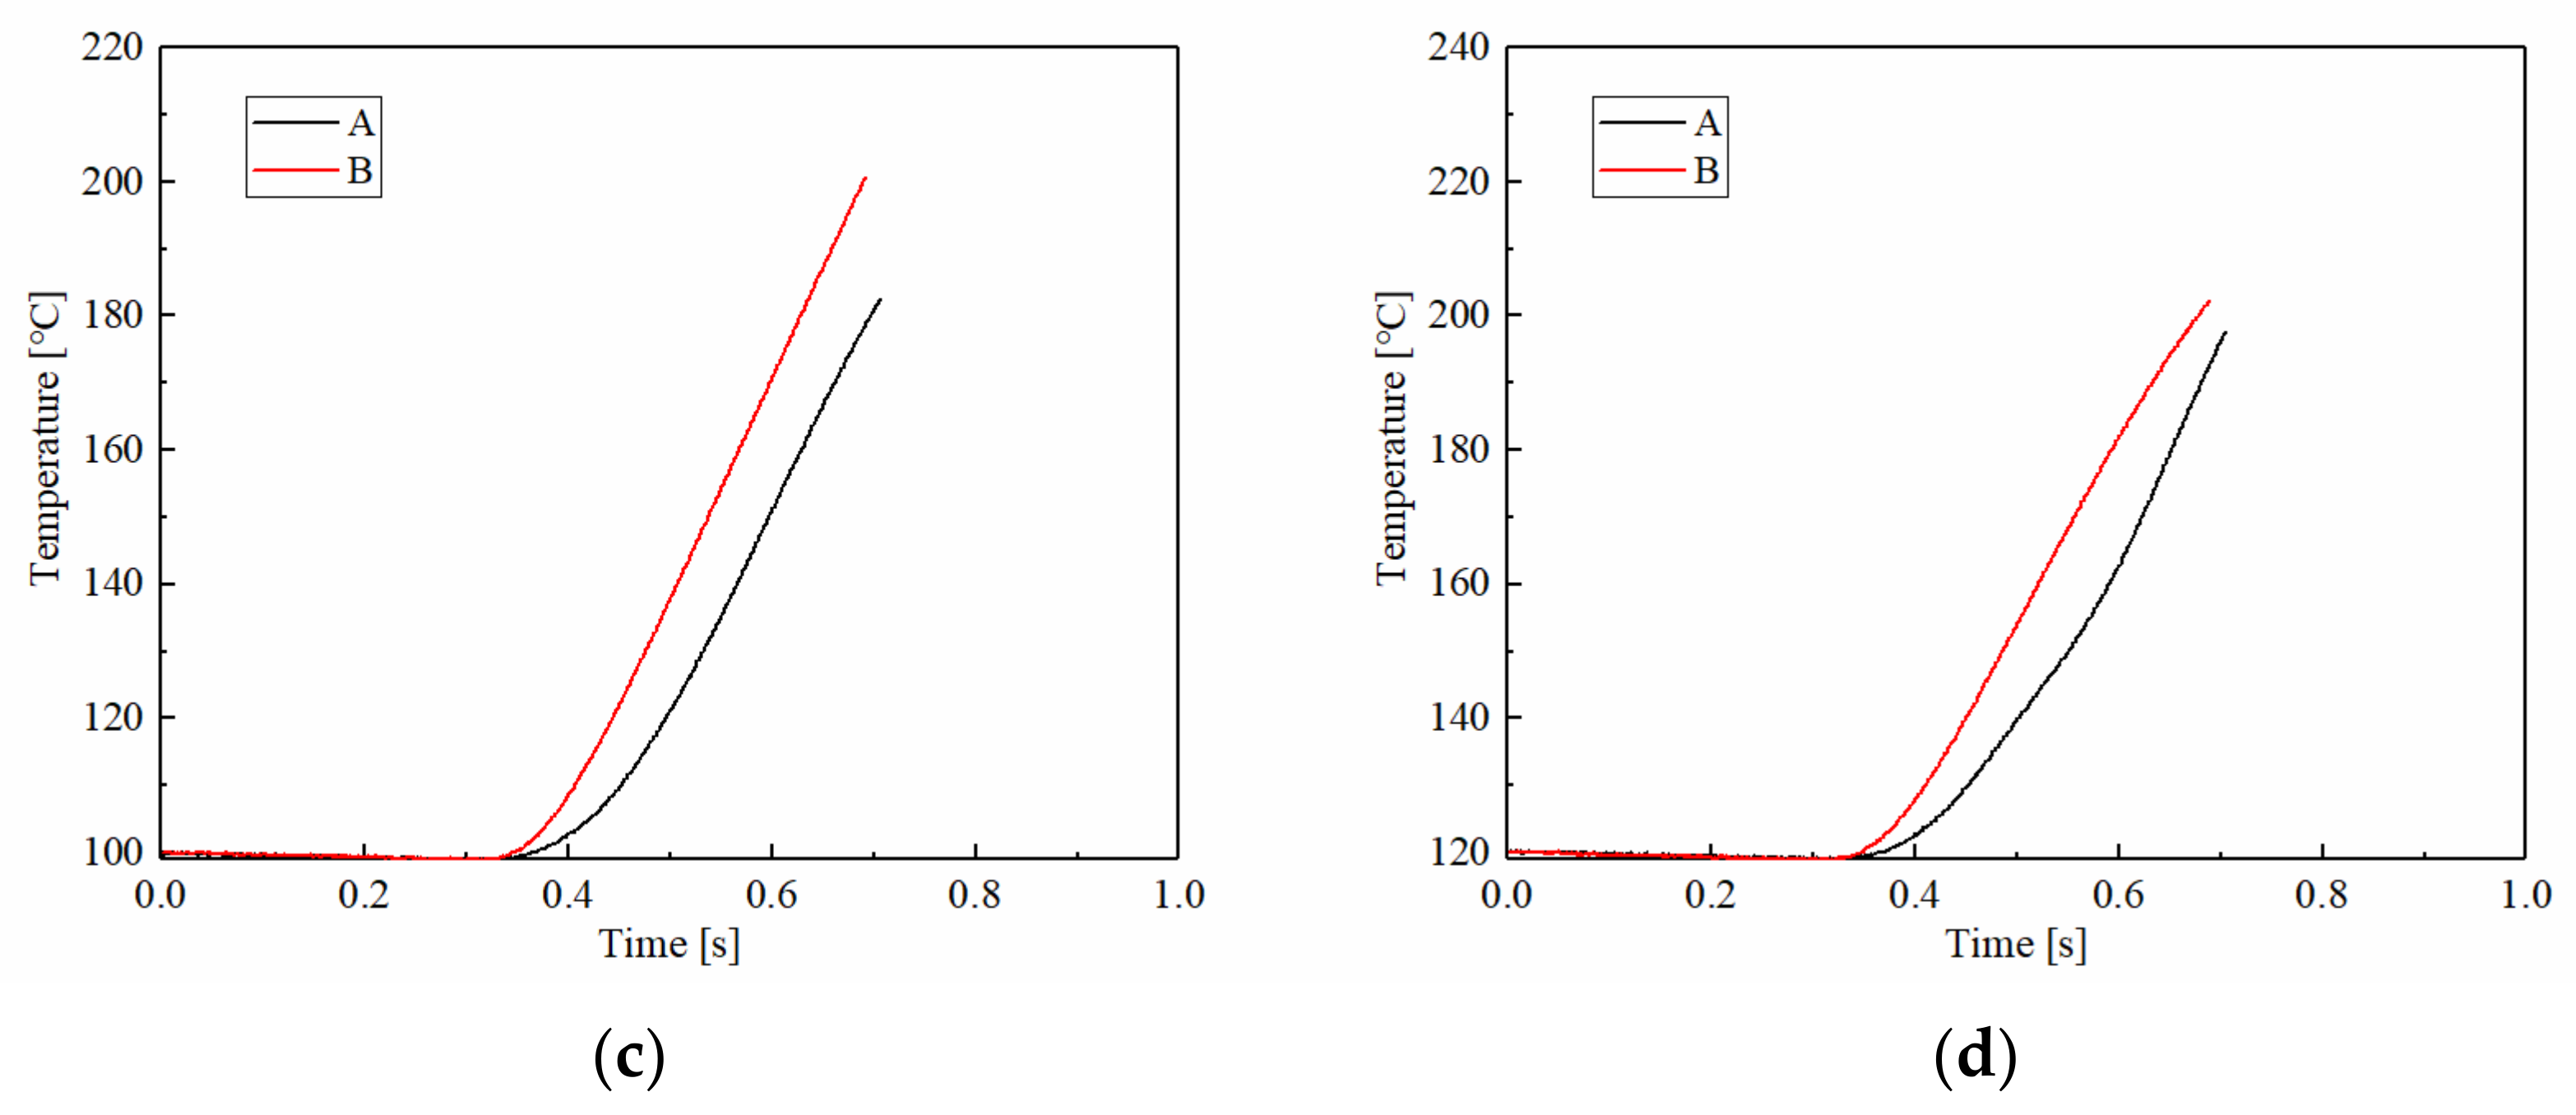
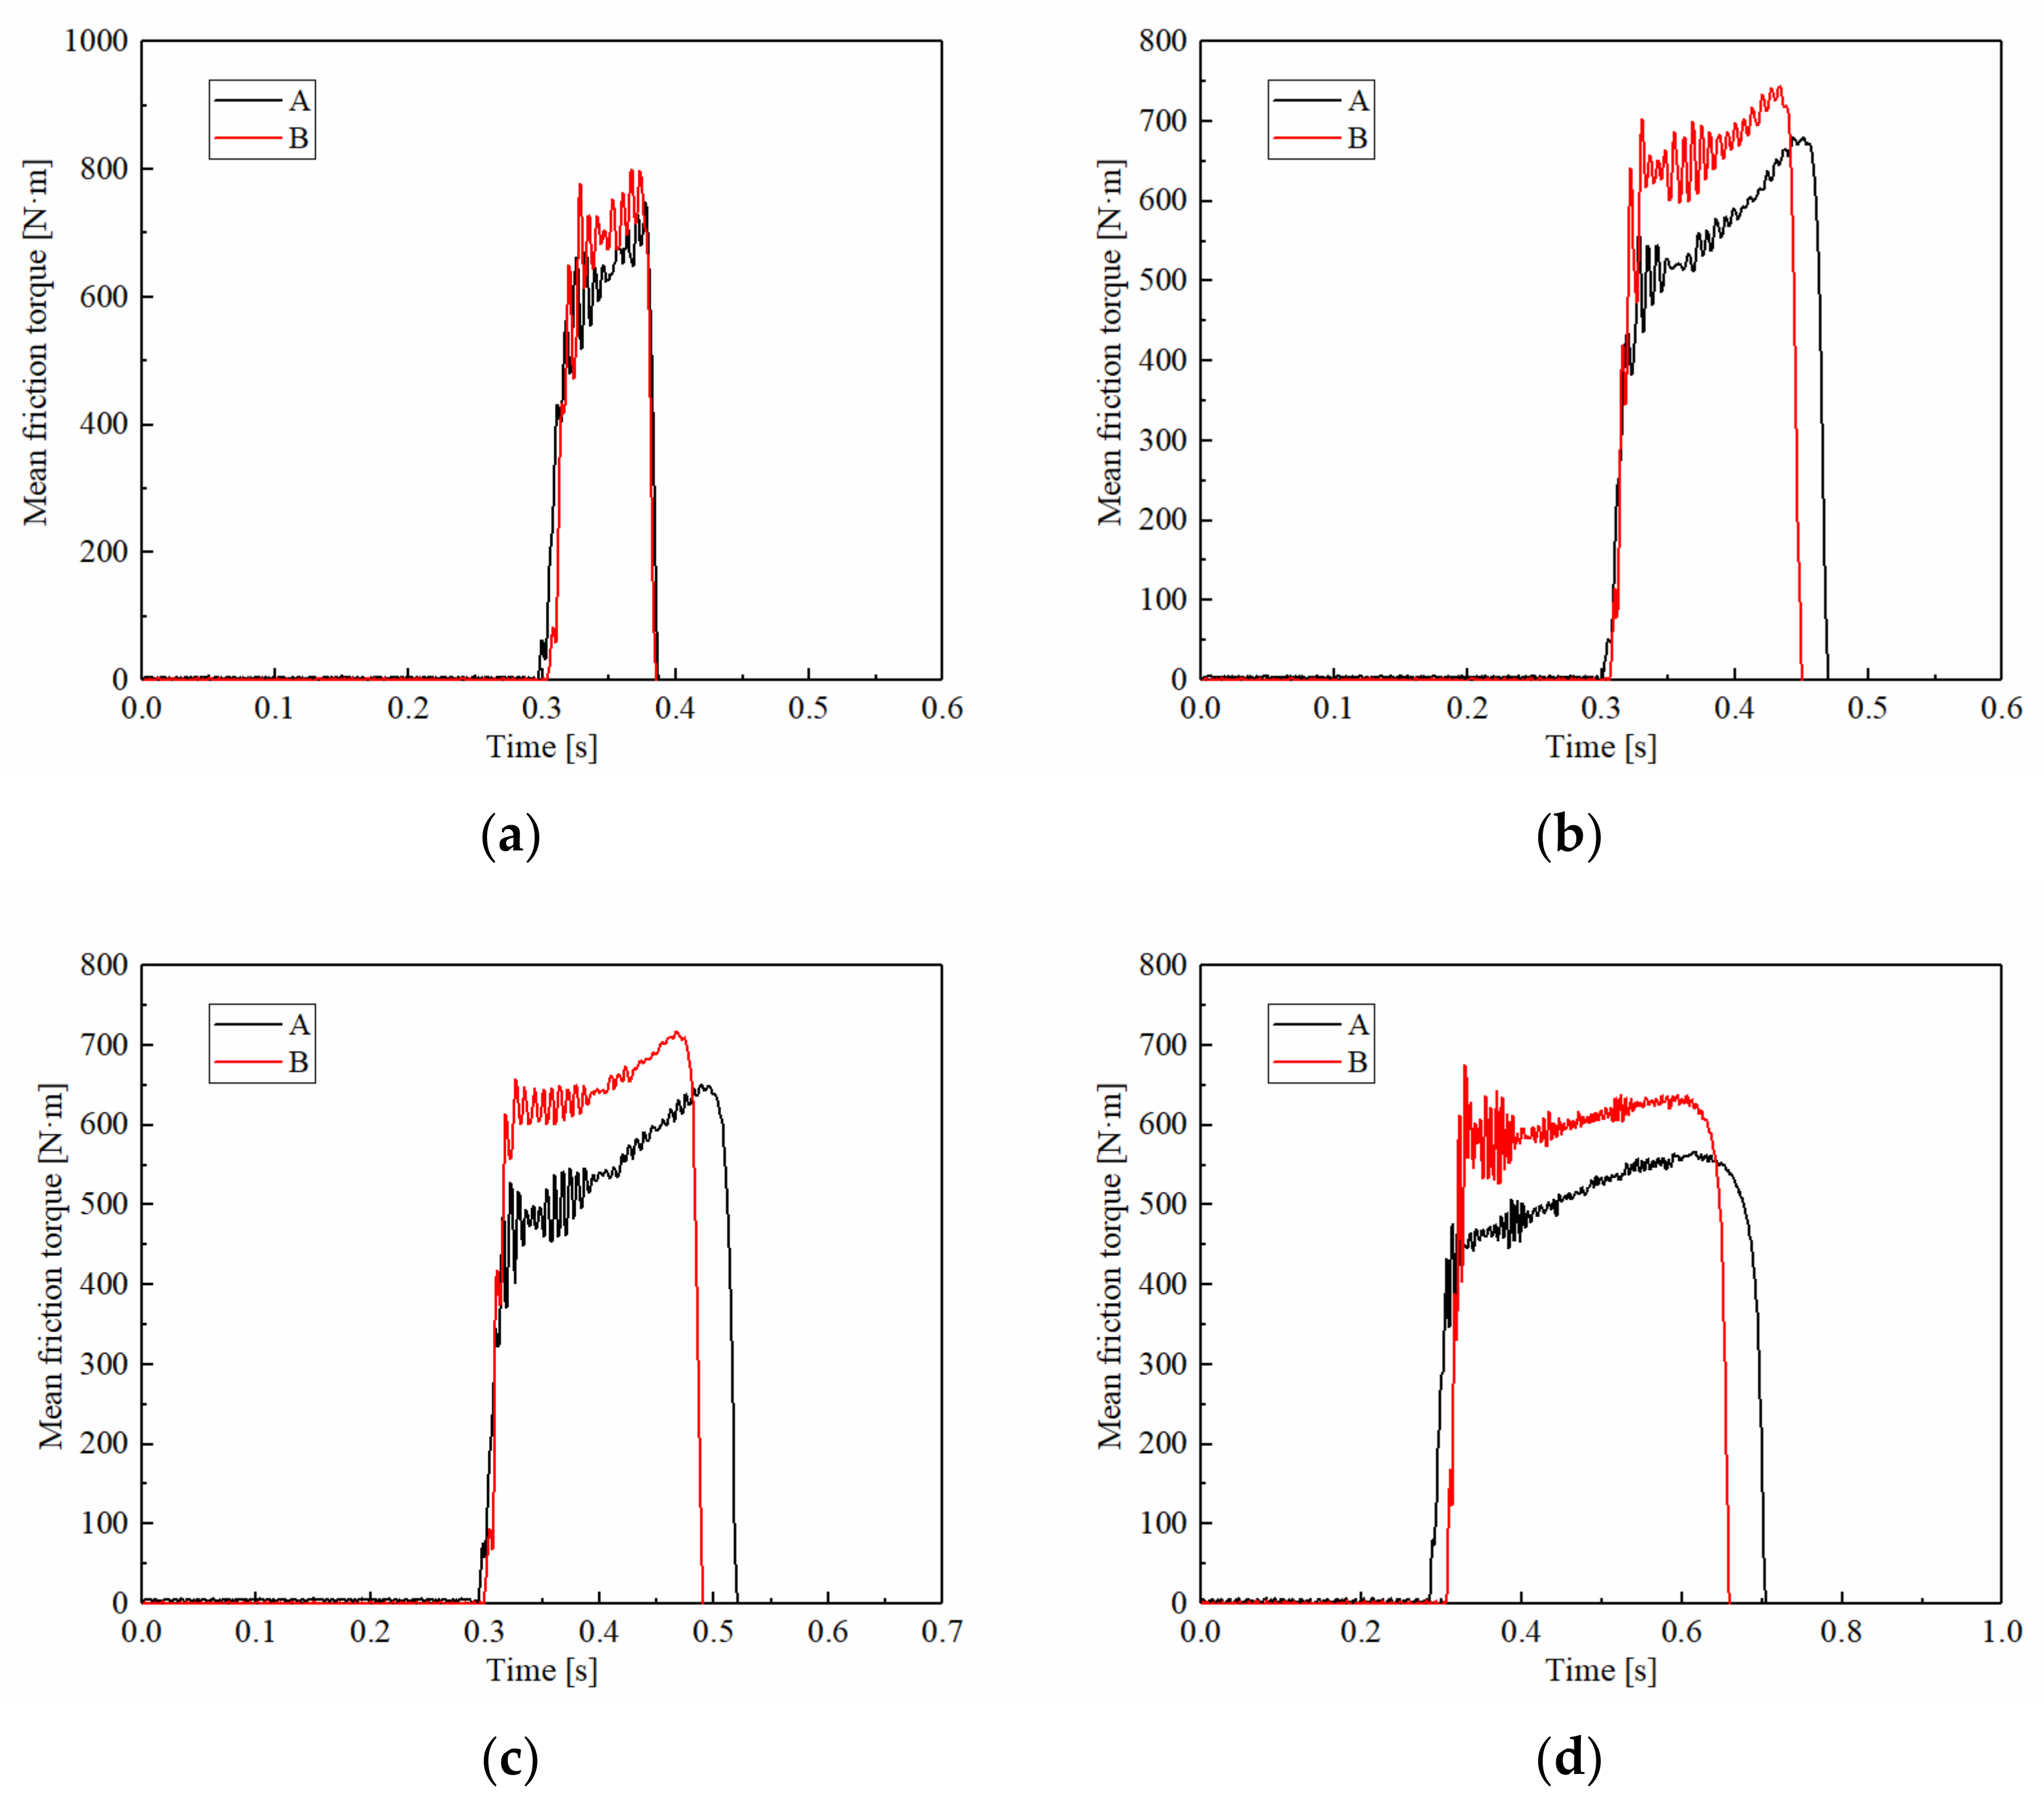
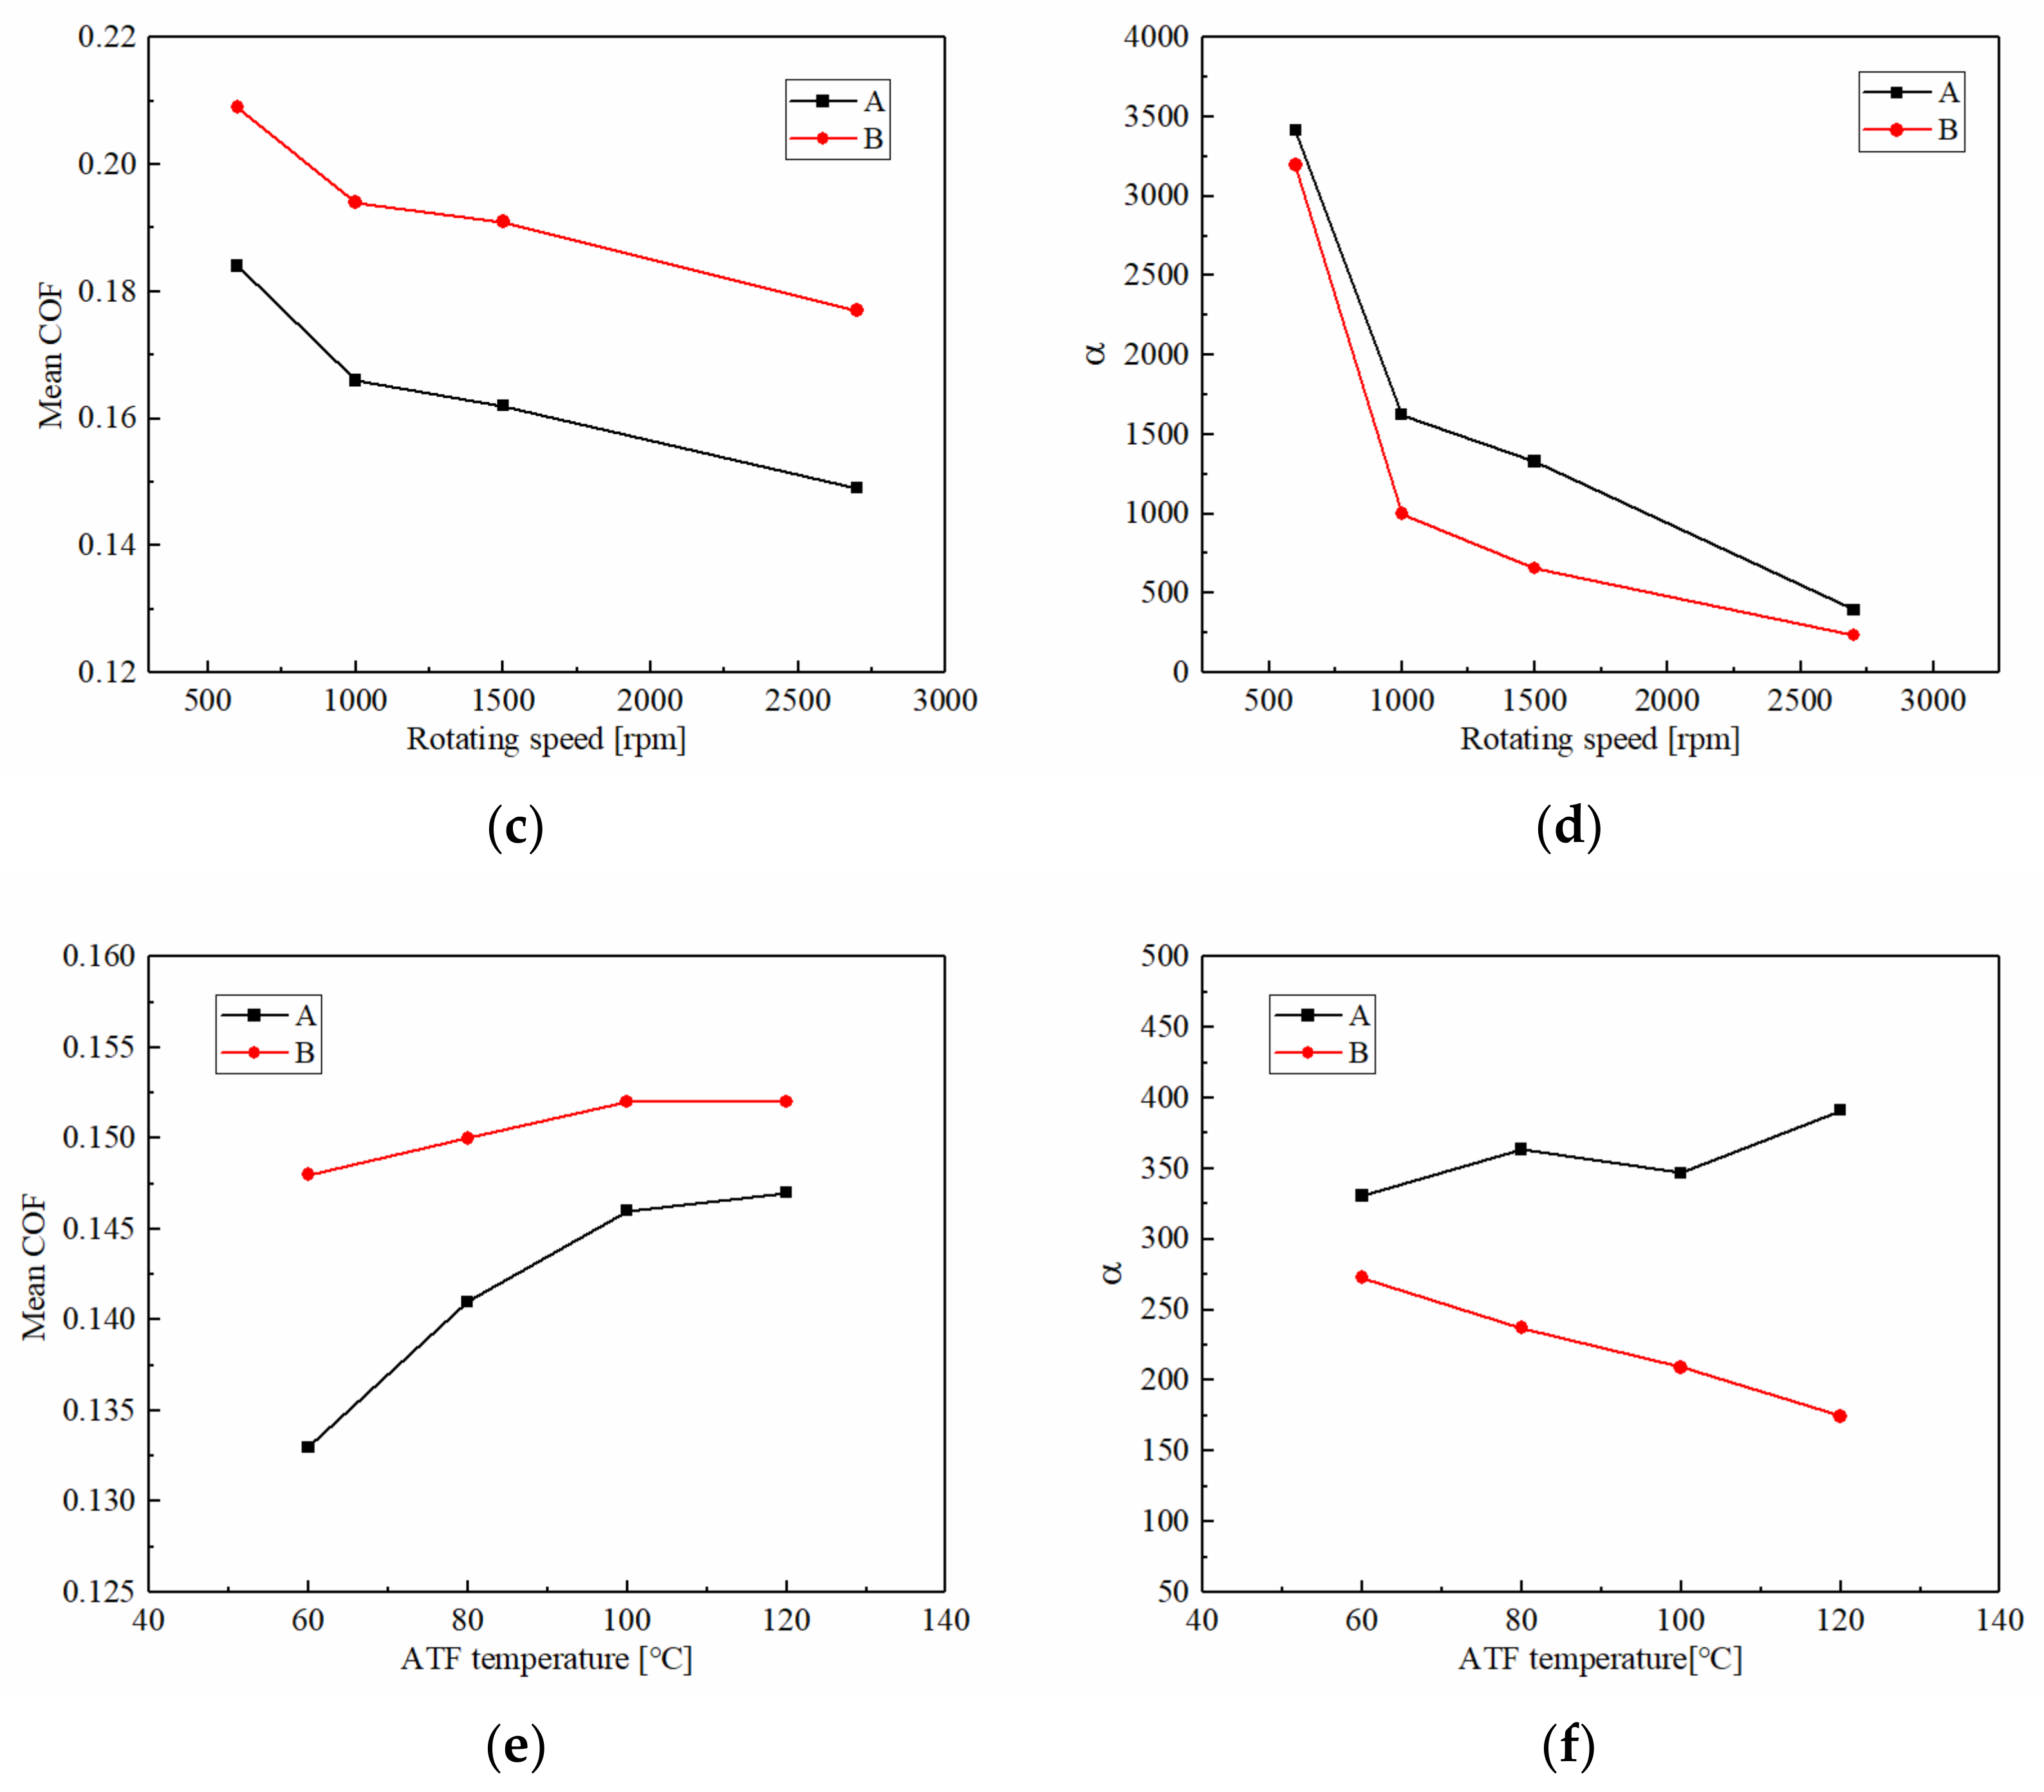
3.1.2. Rotating Speed
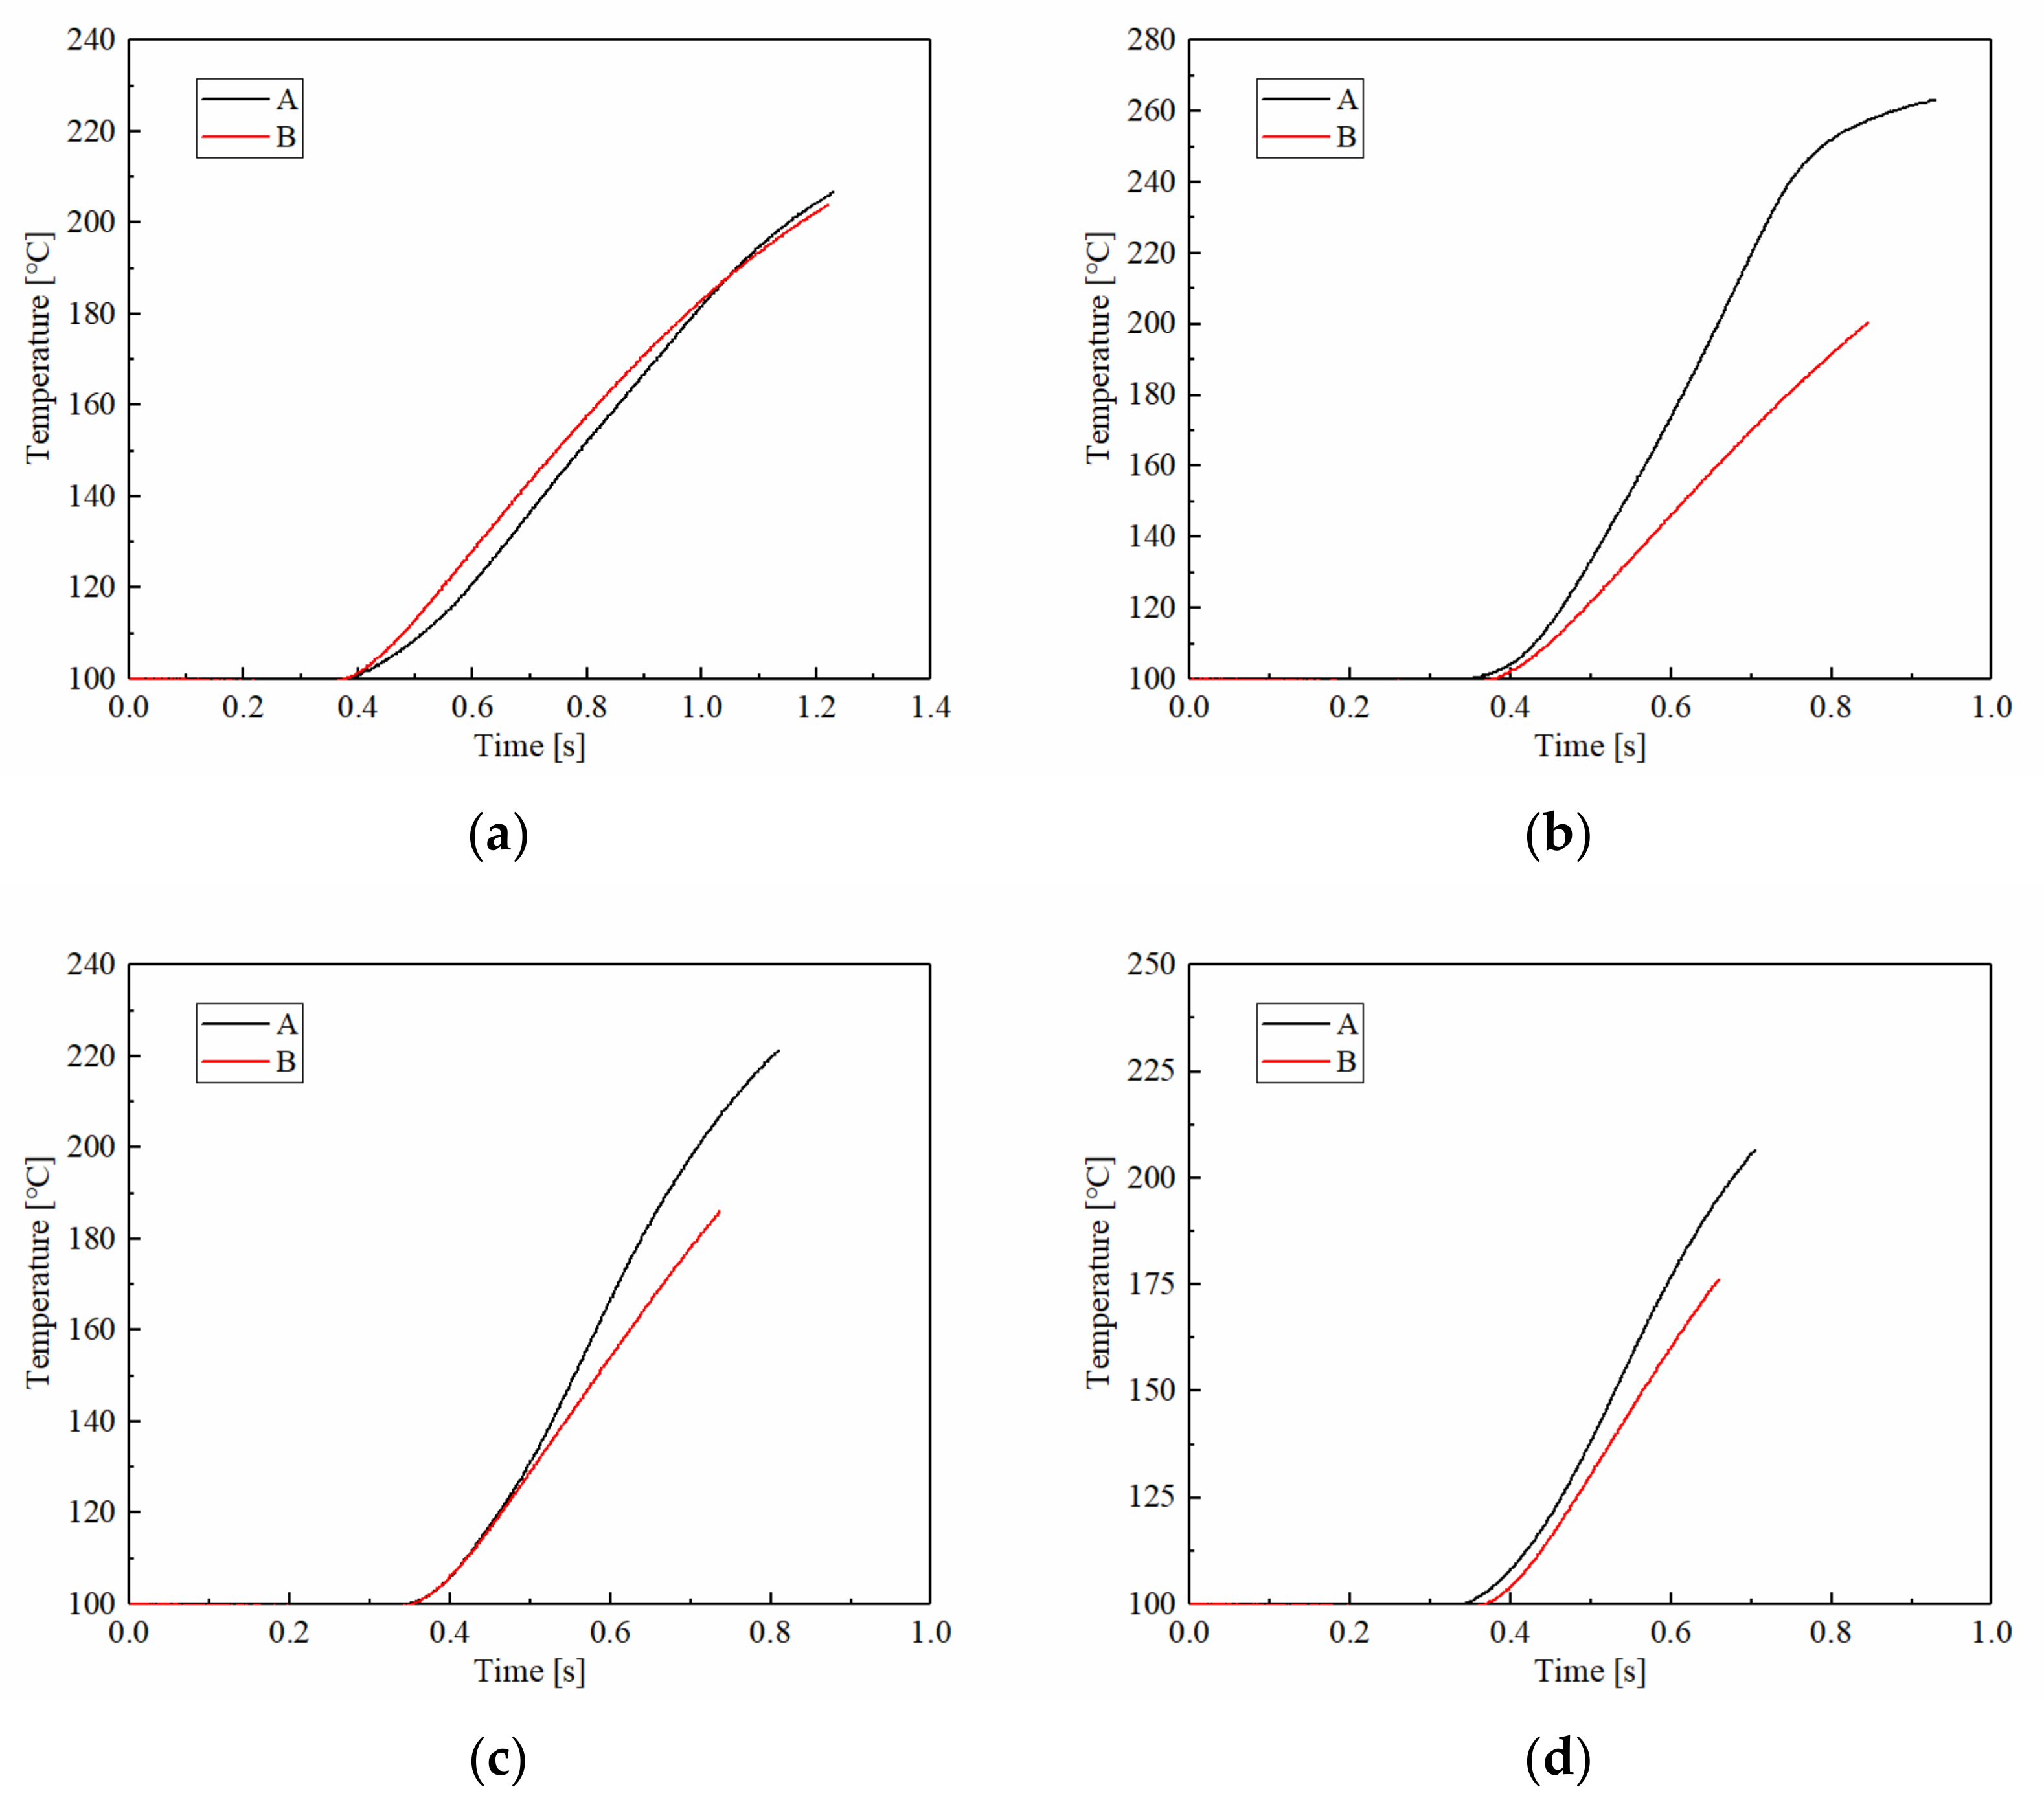
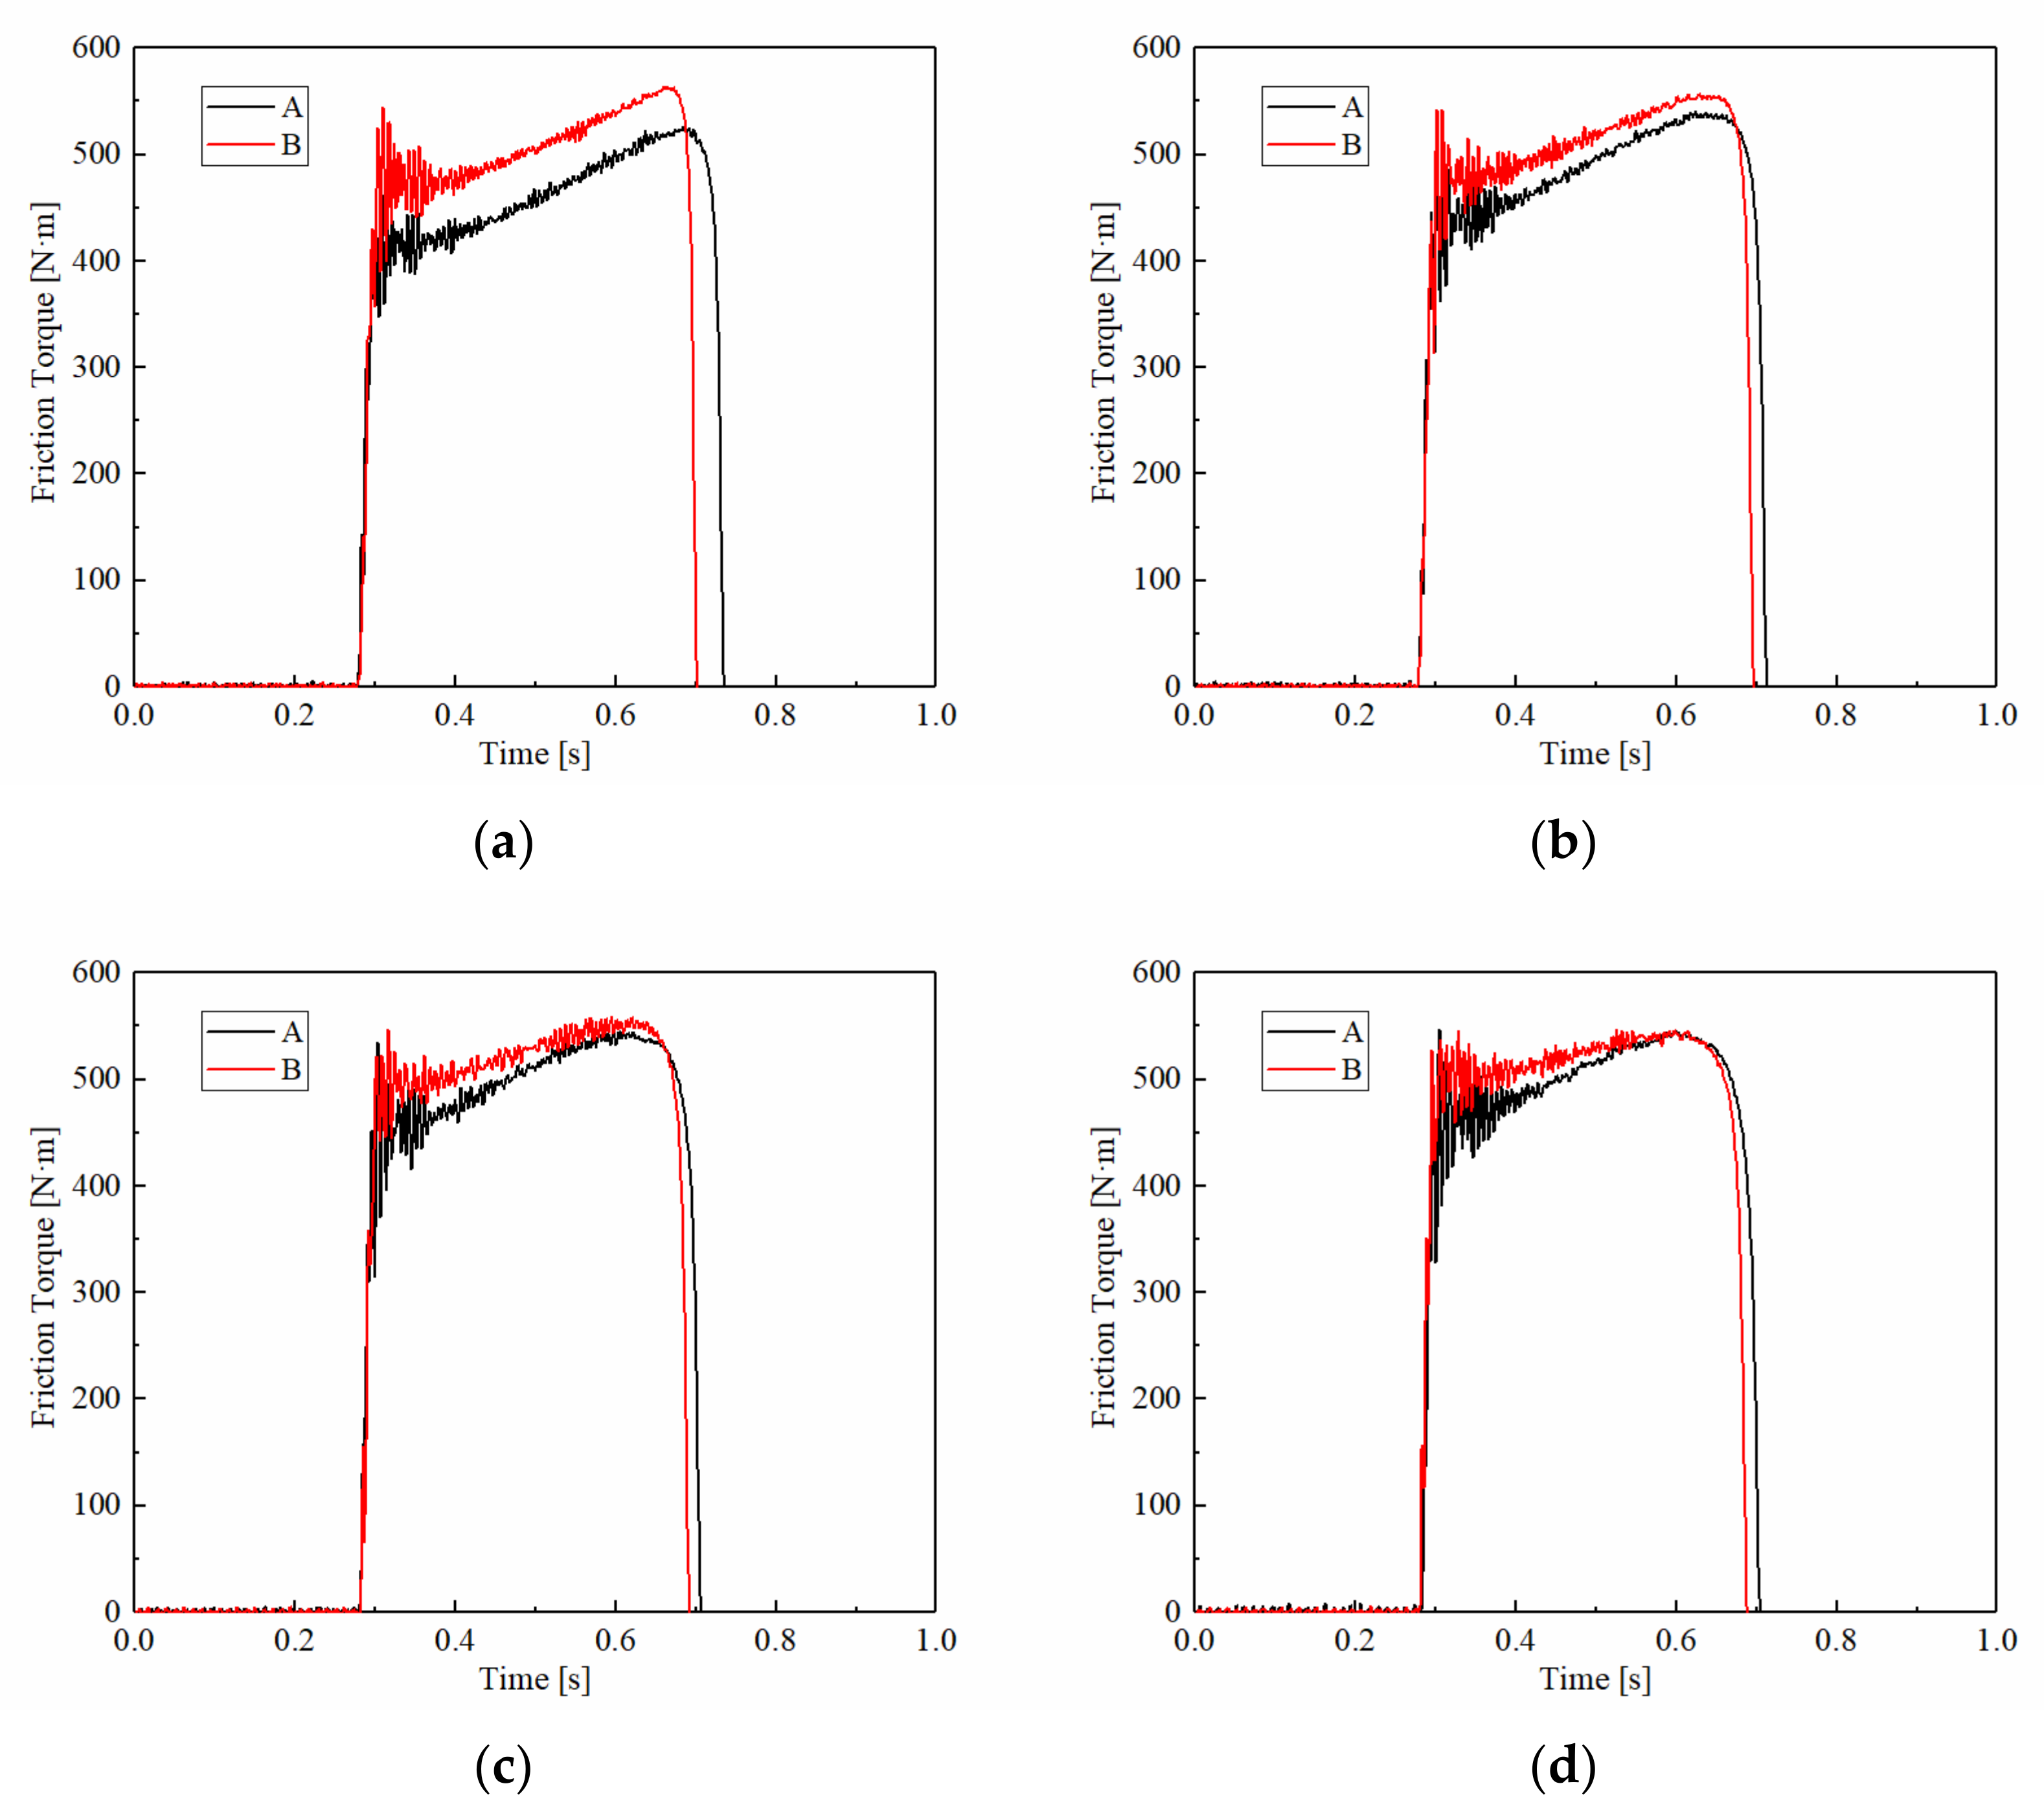
3.1.3. ATF Temperature
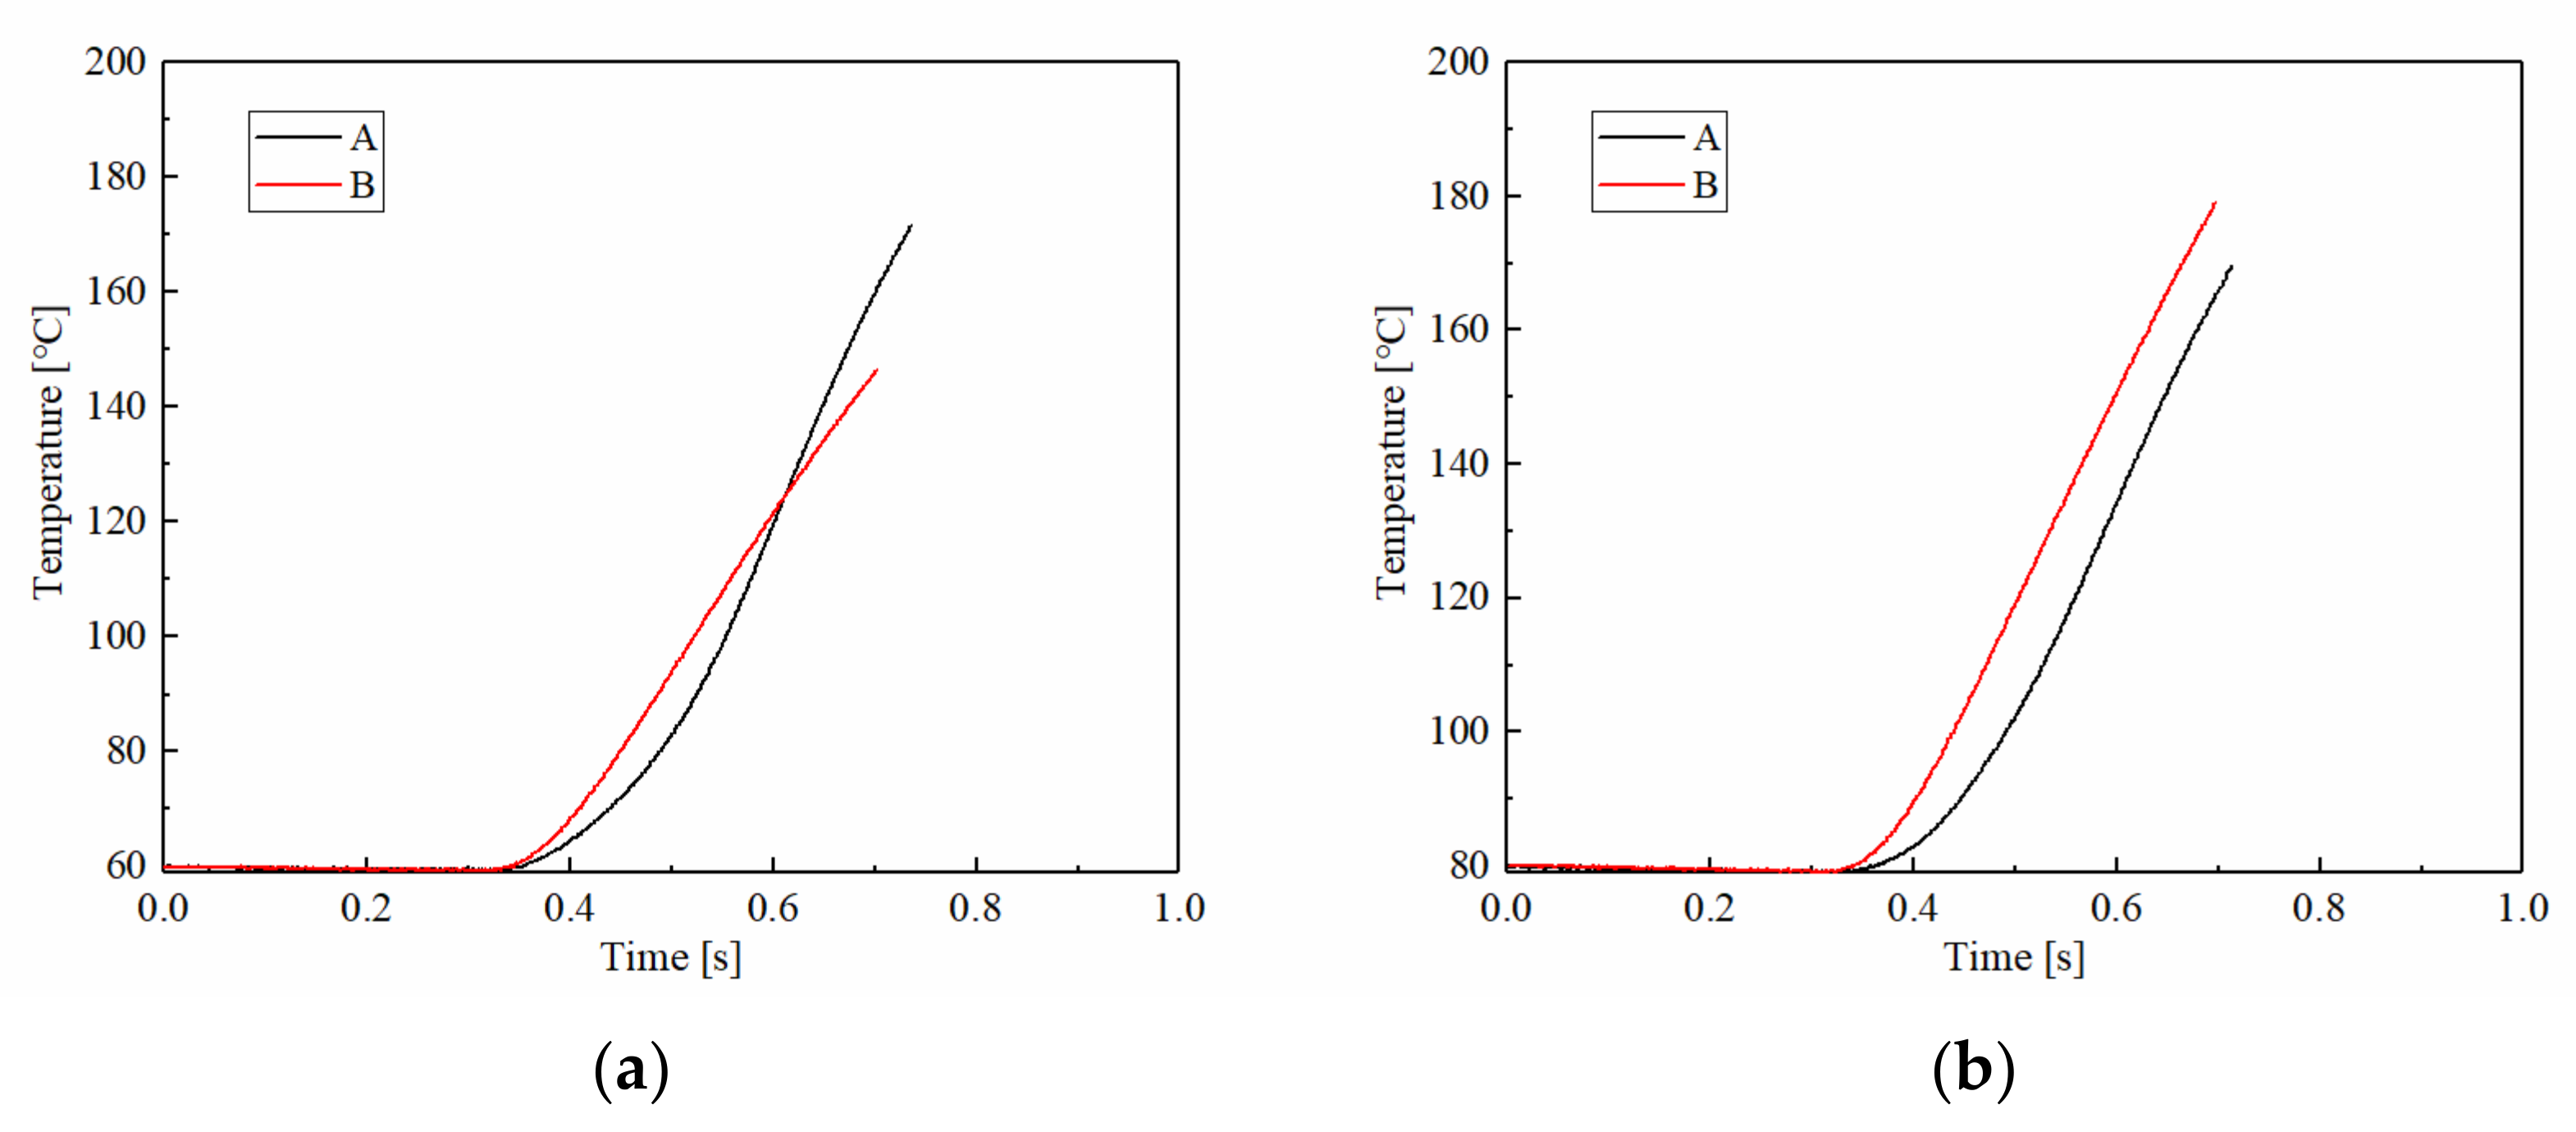
3.1.4. The Stability of Friction Performance
3.2. Wear Performance
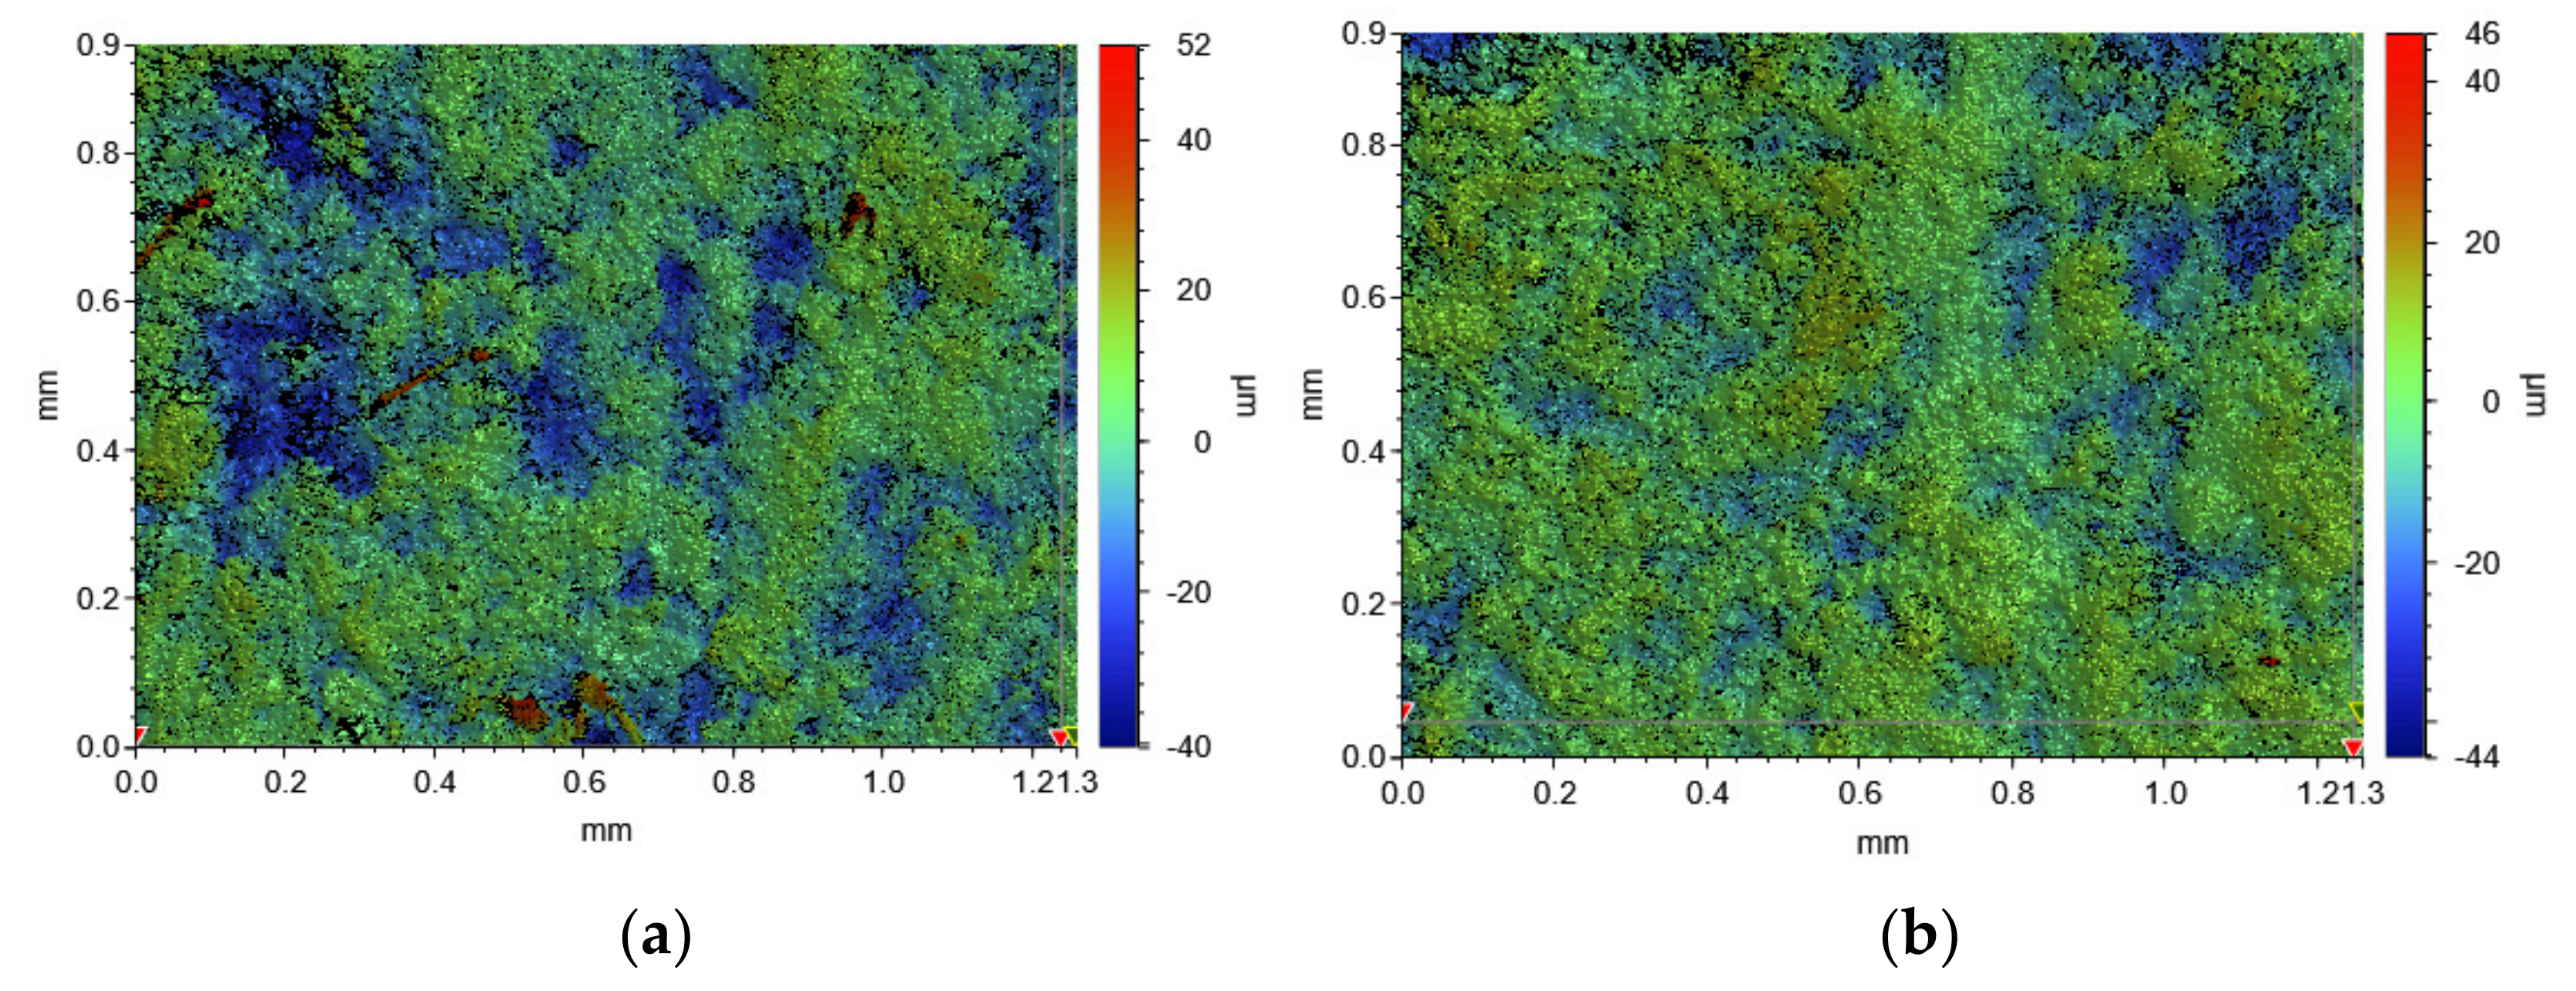
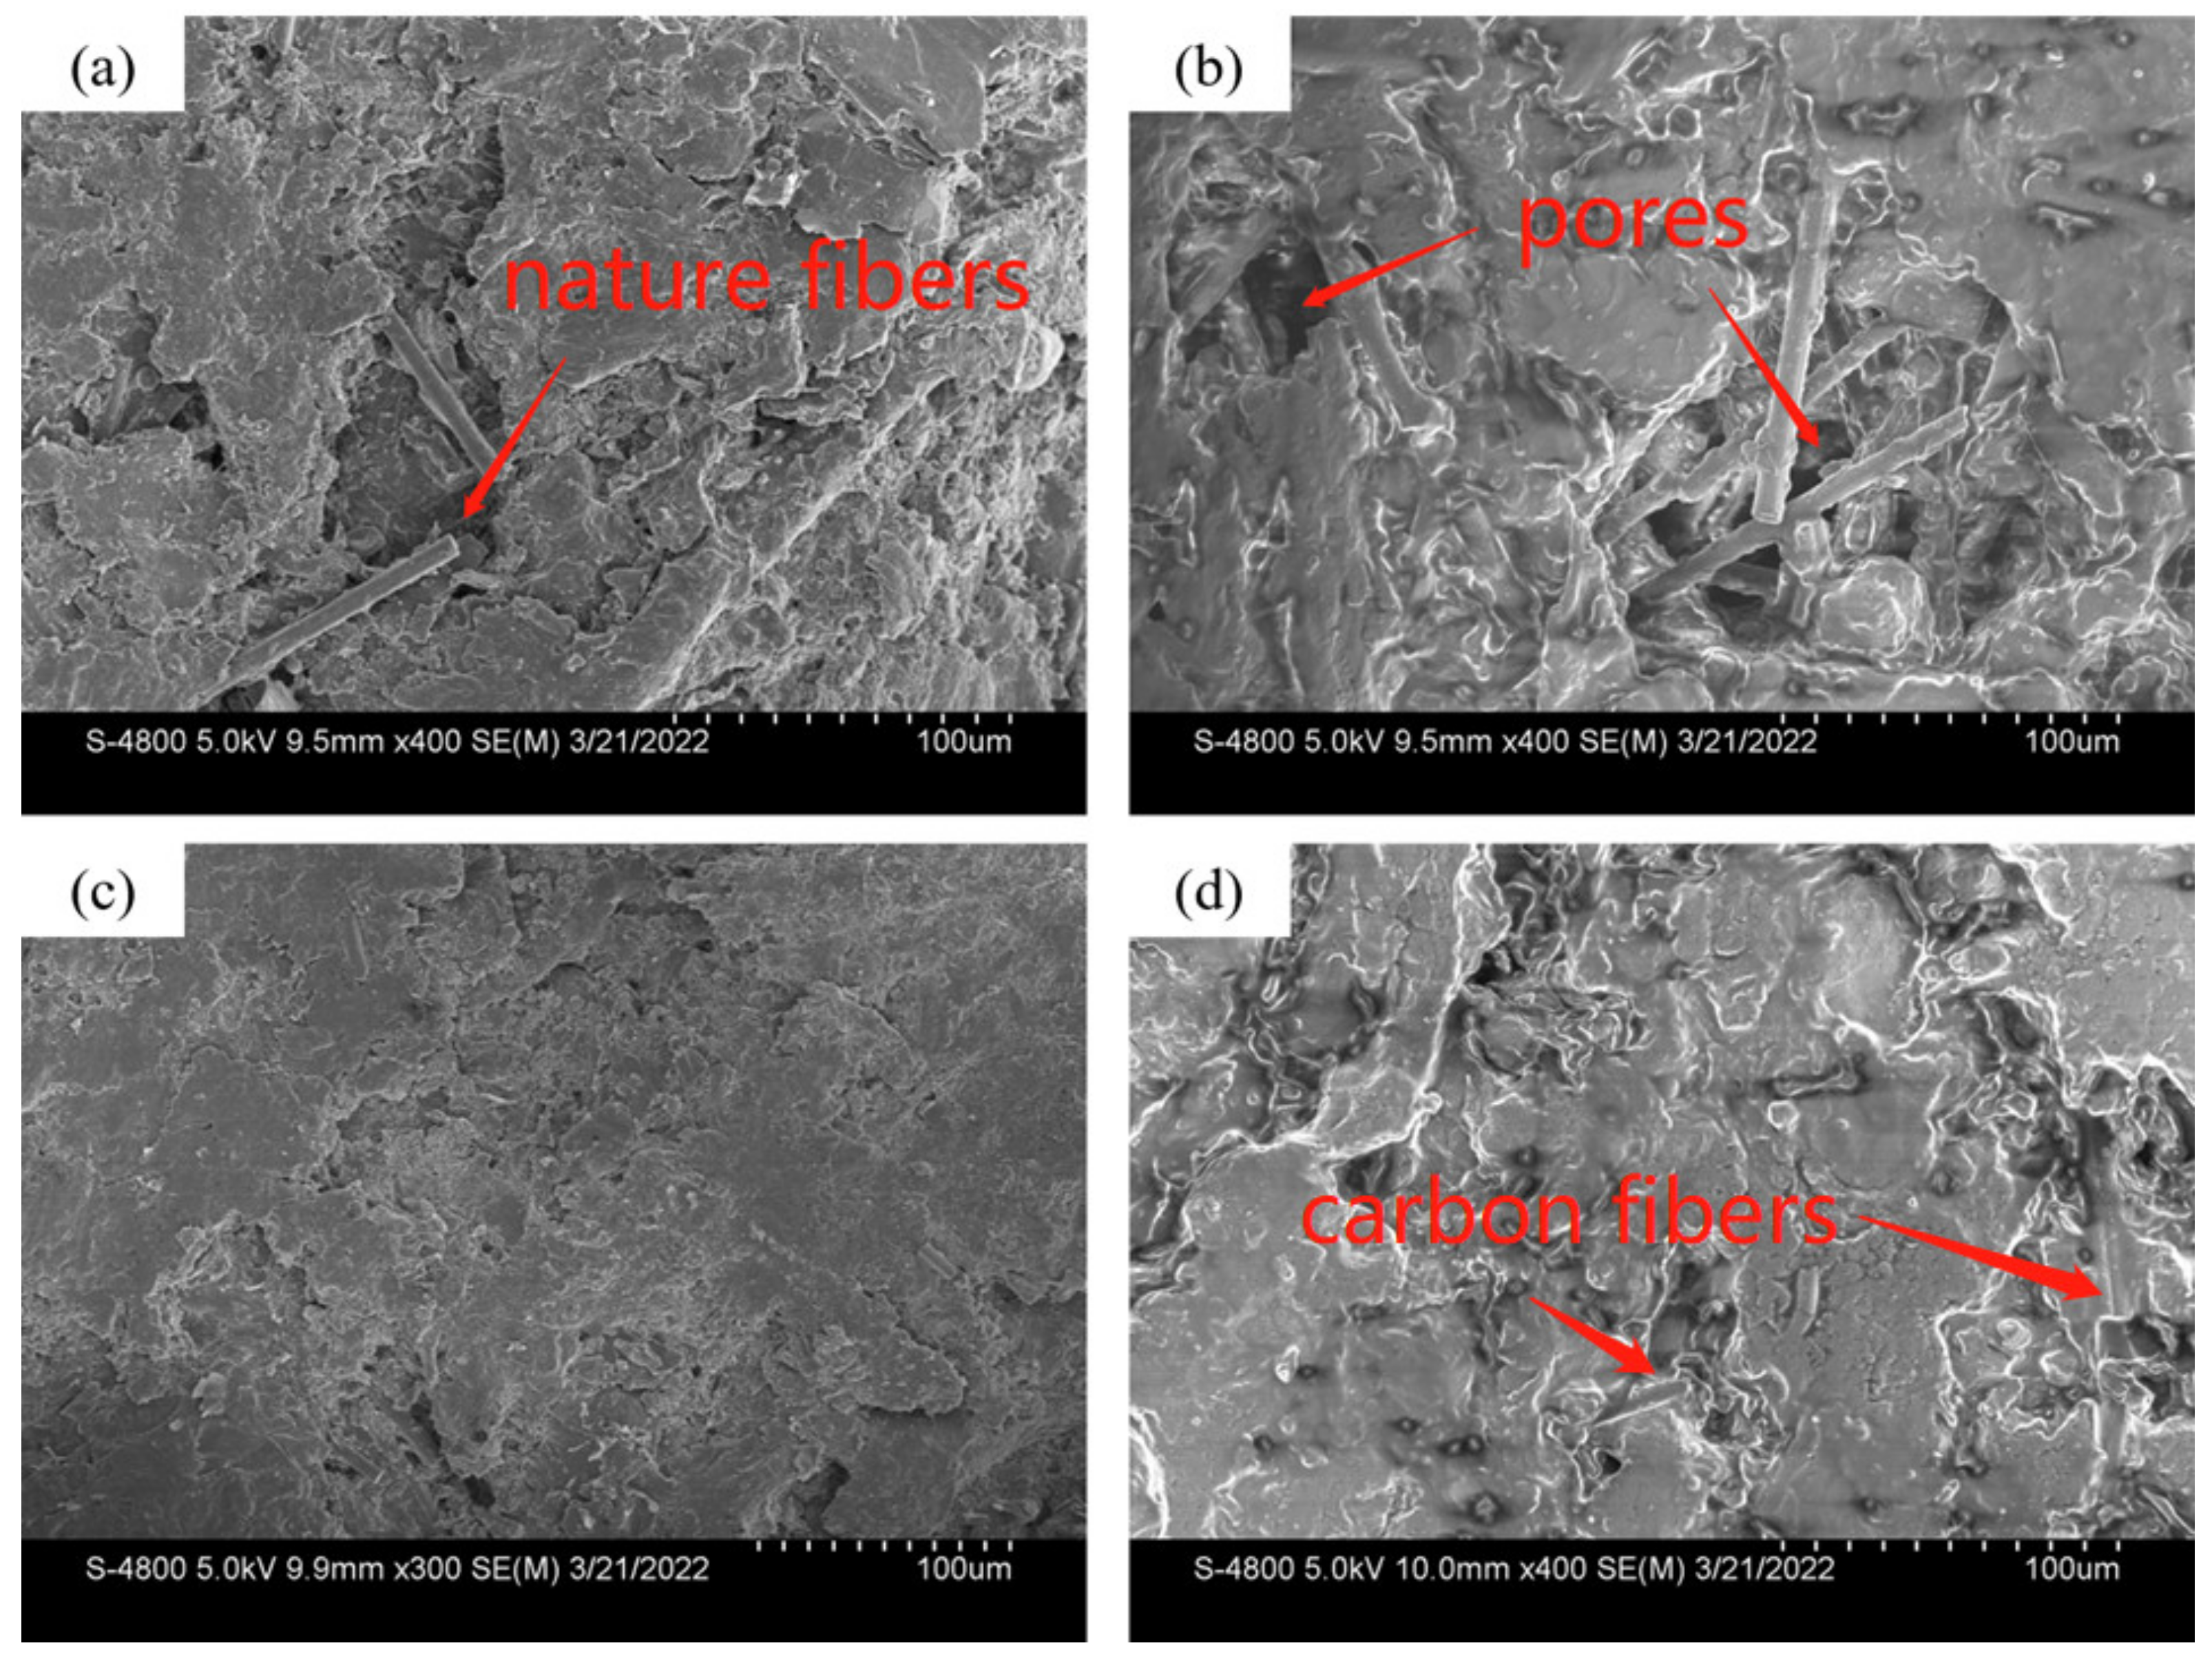
3.2.1. Surface Topography
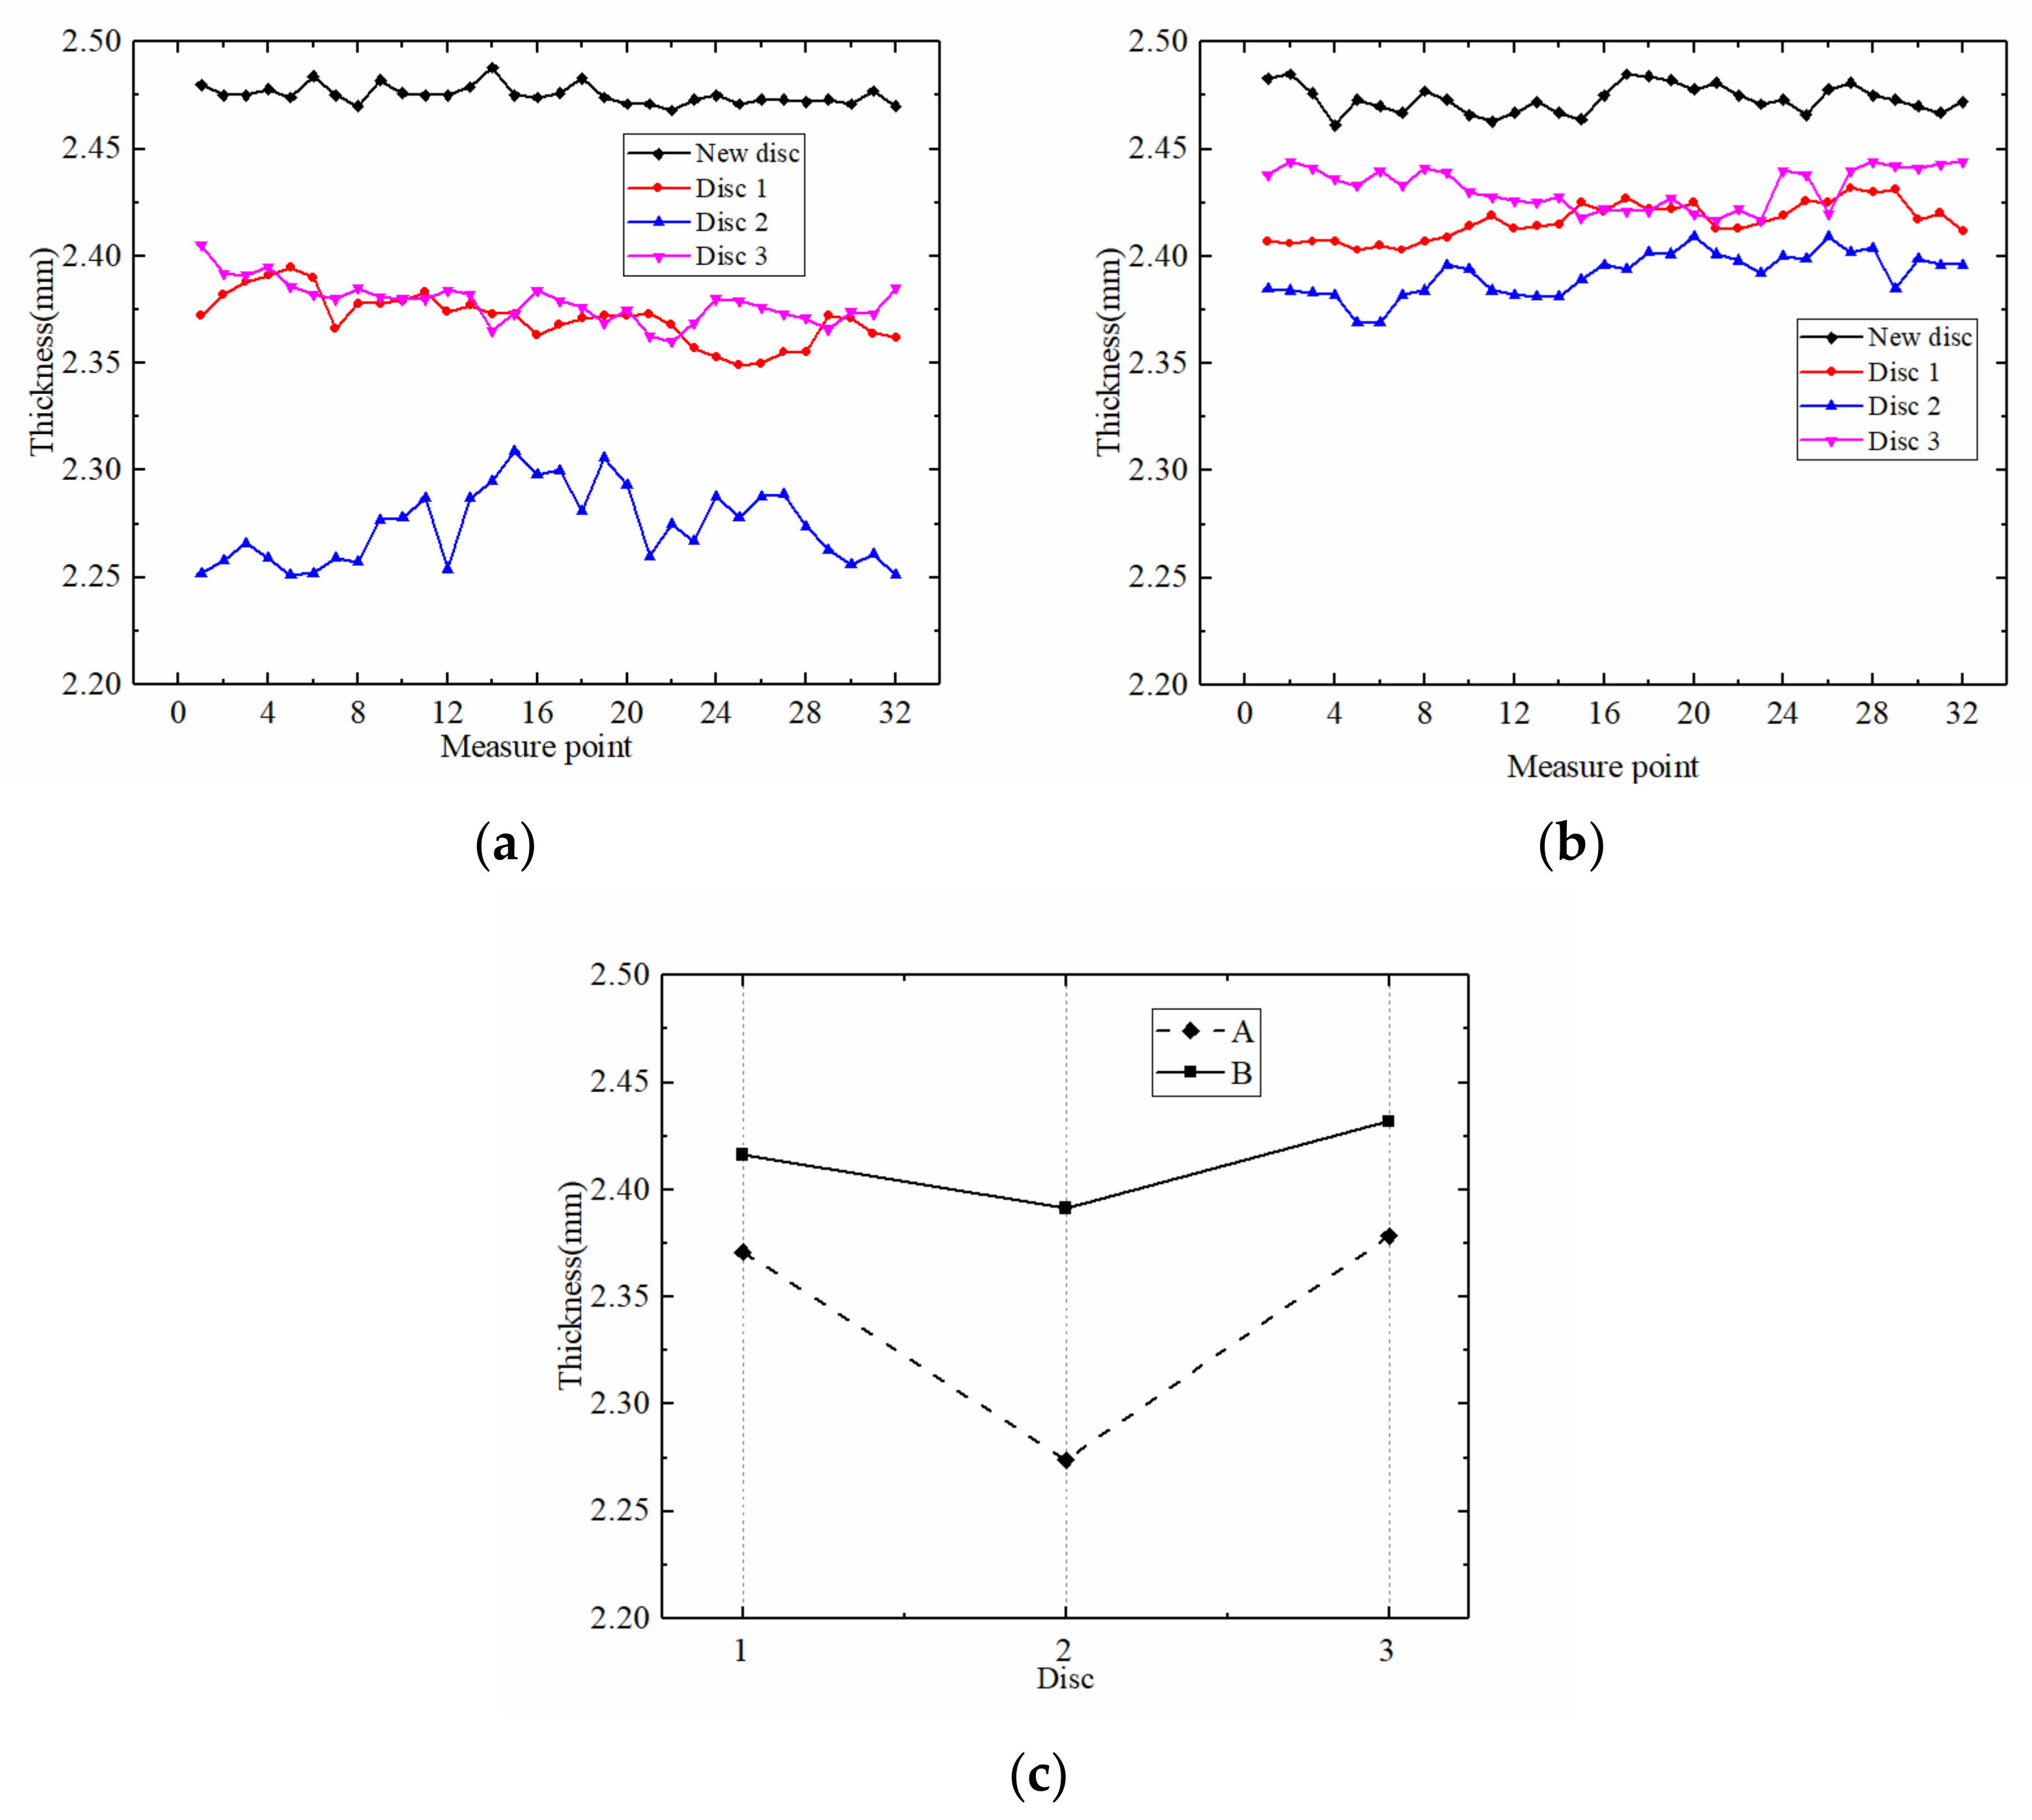
3.2.2. Variation in Thickness
4. Conclusions
- Carbon fiber reinforced friction material can provide a higher friction torque and a lower temperature rise rate under the conditions of changing applied pressure and rotating speed. This provides a basis for the use of friction discs under high-speed and high-power density;
- The excellent thermal conductivity of carbon fiber results in the higher stability of COF, and the change of α decreases significantly. As the pressure increases from 1 MPa to 2.5, the friction torque of carbon fiber reinforced friction materials increases by 400%, and the variable coefficient (α) only rises from 38.18 to 264.62, with the applied pressure increasing from 1 MPa to 2.5 MPa;
- Due to the good dispersion and excellent mechanical properties of PAN chopped carbon fibers, fewer pores form on the initial surface, which improves the high wear resistance, especially in the inter-media disc.
Author Contributions
Funding
Institutional Review Board Statement
Informed Consent Statement
Data Availability Statement
Conflicts of Interest
References
- Wang, Z.W.; Liu, C.S. Analysis on the friction material of the friction clutch and brake. Zhongguo Gonglu Xuebao China J. Highw. Transp. 2001, 14, 114. [Google Scholar]
- Ost, W.; De Baets, P. The tribological behaviour of paper friction plates for wet clutch applications investigated on SAE II and pin-on-disc test rigs. TriboTest 2003, 9, 345–353. [Google Scholar] [CrossRef]
- Yu, L.; Ma, B.; Chen, M.; Li, H.; Ma, C.; Liu, J. Comparison of the friction and wear characteristics between copper and paper based friction materials. Materials 2019, 12, 2988. [Google Scholar] [CrossRef] [PubMed] [Green Version]
- Iqbal, S.; Al-Bender, F.; Ompusunggu, A.P.; Pluymers, B.; Desmet, W. Modeling and analysis of wet friction clutch engagement dynamics. Mech. Syst. Signal Process. 2015, 60, 420–436. [Google Scholar] [CrossRef]
- Pradeepkumar, C.; Karthikeyan, S.; Rajini, N. Materials Today: Proceedings A short review on the effect of transfer layer on tribological study of composite materials. Mater. Today Proc. 2021, 50, 2073–2077. [Google Scholar] [CrossRef]
- He-yun, B.; Wei, H.; Feng-xia, L. Investigation of engagement characteristics of a multi-disc wet friction clutch. Tribol. Int. 2021, 159, 106940. [Google Scholar] [CrossRef]
- Shaffer, S.J.; Freshly, T.B.; Papanicolaou, S.E. Benchtop screening of wet clutch materials. Tribol. Int. 2018, 121, 161–166. [Google Scholar] [CrossRef]
- Ramesh, M.R.; Ravindra, K.A.; Ashok, B.; Kannan, C. Optimizing thermal performance of a dry rigid clutch by varying groove pattern and friction material. Mater. Today Proc. 2021, 46, 7459–7467. [Google Scholar] [CrossRef]
- Neupert, T.; Bartel, D. Measurement of pressure distribution and hydrodynamic axial forces of wet clutch discs. Tribol. Int. 2021, 163, 107172. [Google Scholar] [CrossRef]
- Wang, B.; Yan, L.; Kasal, B. A review of coir fibre and coir fibre reinforced cement-based composite materials (2000–2021). J. Clean. Prod. 2022, 338, 130676. [Google Scholar] [CrossRef]
- Kurdi, A.; Alhazmi, N.; Alhazmi, H.; Tabbakh, T. Practice of simulation and life cycle assessment in tribology—A review. Materials 2020, 13, 3489. [Google Scholar] [CrossRef] [PubMed]
- Cho, H.R.; Je, Y.; Chung, K.H. Assessment of Wear Characteristics of Paper-Based Wet Friction Materials. Int. J. Precis. Eng. Manuf. 2018, 19, 705–711. [Google Scholar] [CrossRef]
- Lu, J.; Li, Y.; Wang, Y.; Fu, Y. Effect of pre-impregnated organosilicon layer on friction and wear properties of paper-based friction materials. Wear 2018, 416, 6–13. [Google Scholar] [CrossRef]
- Li, M.; Khonsari, M.M.; McCarthy, D.M.C.; Lundin, J. On the wear prediction of the paper-based friction materialin a wet clutch. Wear 2015, 334, 56–66. [Google Scholar] [CrossRef]
- Yu, L.; Ma, B.; Chen, M.; Xue, J.; Zhao, P. Variation mechanism of the friction torque in a Cu-based wet clutch affected by operating parameters. Tribol. Int. 2020, 147, 106169. [Google Scholar] [CrossRef]
- Hsia, F.C.; Elam, F.M.; Bonn, D.; Weber, B.; Franklin, S.E. Tracing single asperity wear in relation to macroscale friction during running-in. Tribol. Int. 2021, 162, 107108. [Google Scholar] [CrossRef]
- Ho, S.C.; Lin, J.H.C.; Ju, C.P. Effect of fiber addition on mechanical and tribological properties of a copper/phenolic-based friction material. Wear 2005, 258, 861–869. [Google Scholar] [CrossRef]
- Kumar, N.; Singh, A.; Singh, S.; Singh, J.I.P.; Kumar, S. Napier natural fibre used as reinforcement polymer composite: As asbestos free brake friction material. Mater. Today Proc. 2021, 56, 2532–2536. [Google Scholar] [CrossRef]
- Kumar, S.; Manna, A.; Dang, R. A review on applications of natural Fiber-Reinforced composites (NFRCs). Mater. Today Proc. 2022, 50, 1632–1636. [Google Scholar] [CrossRef]
- Prabhakar, C.G.; Anand Babu, K.; Kataraki, P.S.; Reddy, S. A review on natural fibers and mechanical properties of banyan and banana fibers composites. Mater. Today Proc. 2021, 54, 348–358. [Google Scholar] [CrossRef]
- Mohankumar, D.; Rajeshkumar, L.; Muthukumaran, N.; Ramesh, M.; Aravinth, P.; Anith, R.; Balaji, S.V. Effect of fiber orientation on tribological behaviour of Typha angustifolia natural fiber reinforced composites. Mater. Today Proc. 2022. [Google Scholar] [CrossRef]
- Singh, T. Optimum design based on fabricated natural fiber reinforced automotive brake friction composites using hybrid CRITIC-MEW approach. J. Mater. Res. Technol. 2021, 14, 81–92. [Google Scholar] [CrossRef]
- Gweon, J.H.; Joo, B.S.; Jang, H. The effect of short glass fiber dispersion on the friction and vibration of brake friction materials. Wear 2016, 362, 61–67. [Google Scholar] [CrossRef]
- Zhang, X.; Li, K.Z.; Li, H.J.; Fu, Y.W.; Fei, J. Tribological and mechanical properties of glass fiber reinforced paper-based composite friction material. Tribol. Int. 2014, 69, 156–167. [Google Scholar] [CrossRef]
- Duan, J.; Zhang, M.; Chen, P.; Li, Z.; Pang, L.; Xiao, P.; Li, Y. Tribological behavior and applications of carbon fiber reinforced ceramic composites as high-performance frictional materials. Ceram. Int. 2021, 47, 19271–19281. [Google Scholar] [CrossRef]
- Li, M.; Khonsari, M.M.; McCarthy, D.M.C.; Lundin, J.; Fei, J.; Luo, W.; Huang, J.F.; Ouyang, H.; Xu, Z.; Yao, C.; et al. Effect of carbon fiber content on the friction and wear performance of paper-based friction materials. Tribol. Int. 2021, 87, 91–97. [Google Scholar] [CrossRef]
- Saindane, U.V.; Soni, S.; Menghani, J.V. Studies on mechanical properties of brake friction materials derived from carbon fibres reinforced polymer composite. Mater. Today Proc. 2021, 47, 5760–5765. [Google Scholar] [CrossRef]
- Fei, J.; Li, H.J.; Fu, Y.W.; Qi, L.H.; Zhang, Y.L. Effect of phenolic resin content on performance of carbon fiber reinforced paper-based friction material. Wear 2010, 269, 534–540. [Google Scholar] [CrossRef]
- Rehman, Z.U.; Ahn, B.H.; Jeong, Y.S.; Song, J.I.; Koo, B.H. The influence of various additives on the properties of PEO coatings formed on AZ31 Mg Alloy. Surf. Rev. Lett. 2016, 23, 1650006. [Google Scholar] [CrossRef]


| Factors | Applied Pressure (MPa) | Rotating Speed (rpm) | ATF Temperature (°C) |
|---|---|---|---|
| Part 1 | 1, 1.5, 2, 2.5 | 2700 | 100 |
| Part 2 | 2.5 | 600, 1000, 1500, 2700 | 100 |
| Part 3 | 2 | 2700 | 60, 80, 100, 120 |
Publisher’s Note: MDPI stays neutral with regard to jurisdictional claims in published maps and institutional affiliations. |
© 2022 by the authors. Licensee MDPI, Basel, Switzerland. This article is an open access article distributed under the terms and conditions of the Creative Commons Attribution (CC BY) license (https://creativecommons.org/licenses/by/4.0/).
Share and Cite
Ma, Z.; Zheng, C.; Xiong, C.; Yu, L.; Liu, Y.; Zhang, C. Friction-Wear Characteristics of Carbon Fiber Reinforced Paper-Based Friction Materials under Different Working Conditions. Materials 2022, 15, 3682. https://doi.org/10.3390/ma15103682
Ma Z, Zheng C, Xiong C, Yu L, Liu Y, Zhang C. Friction-Wear Characteristics of Carbon Fiber Reinforced Paper-Based Friction Materials under Different Working Conditions. Materials. 2022; 15(10):3682. https://doi.org/10.3390/ma15103682
Chicago/Turabian StyleMa, Zhiwei, Changsong Zheng, Cenbo Xiong, Liang Yu, Yujian Liu, and Cunzheng Zhang. 2022. "Friction-Wear Characteristics of Carbon Fiber Reinforced Paper-Based Friction Materials under Different Working Conditions" Materials 15, no. 10: 3682. https://doi.org/10.3390/ma15103682
APA StyleMa, Z., Zheng, C., Xiong, C., Yu, L., Liu, Y., & Zhang, C. (2022). Friction-Wear Characteristics of Carbon Fiber Reinforced Paper-Based Friction Materials under Different Working Conditions. Materials, 15(10), 3682. https://doi.org/10.3390/ma15103682