
Compressive Strength Evaluation of Ultra-High-Strength Concrete by Machine Learning


Abstract
:1. Introduction
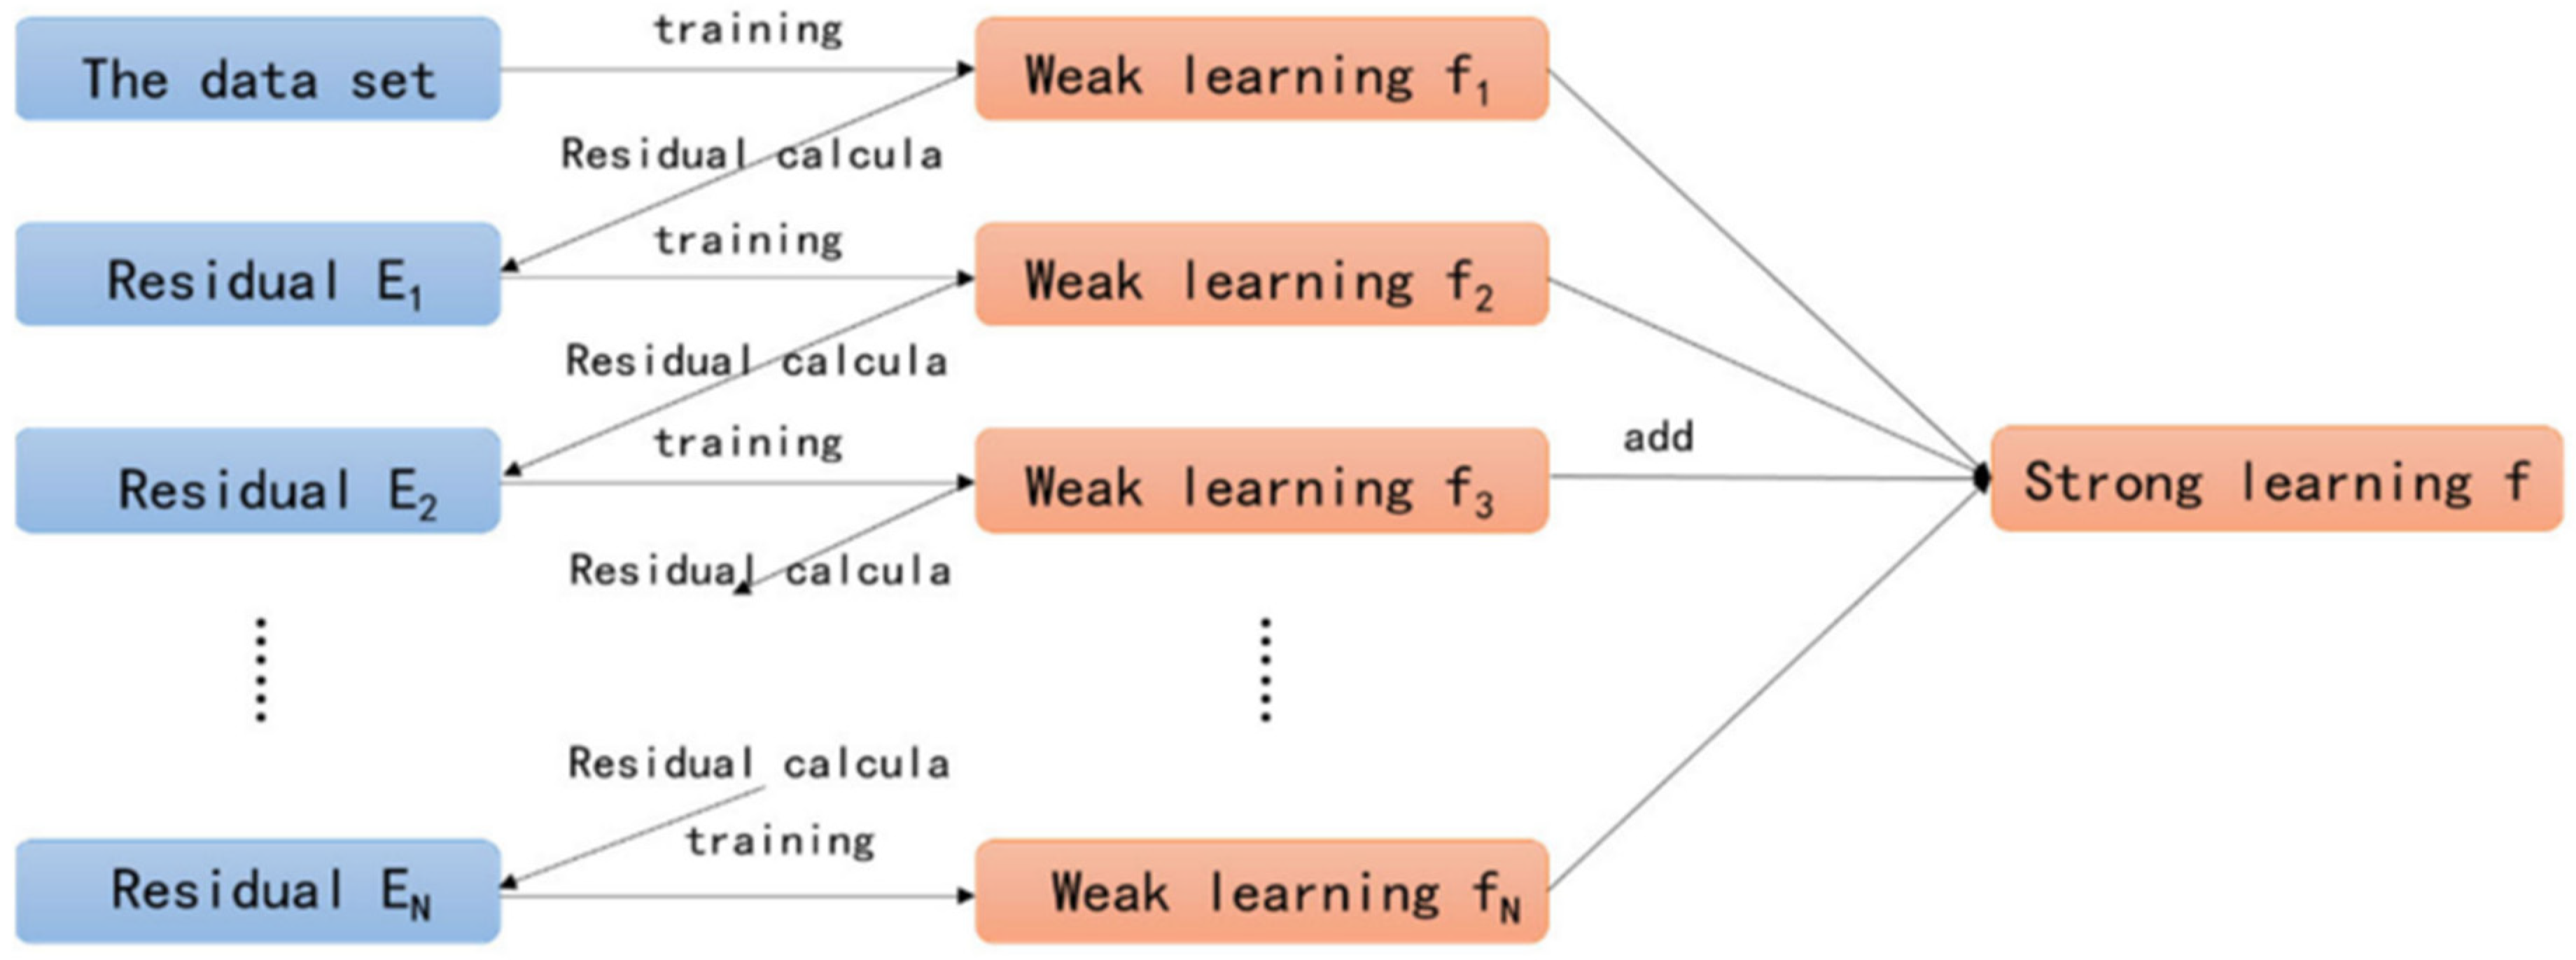
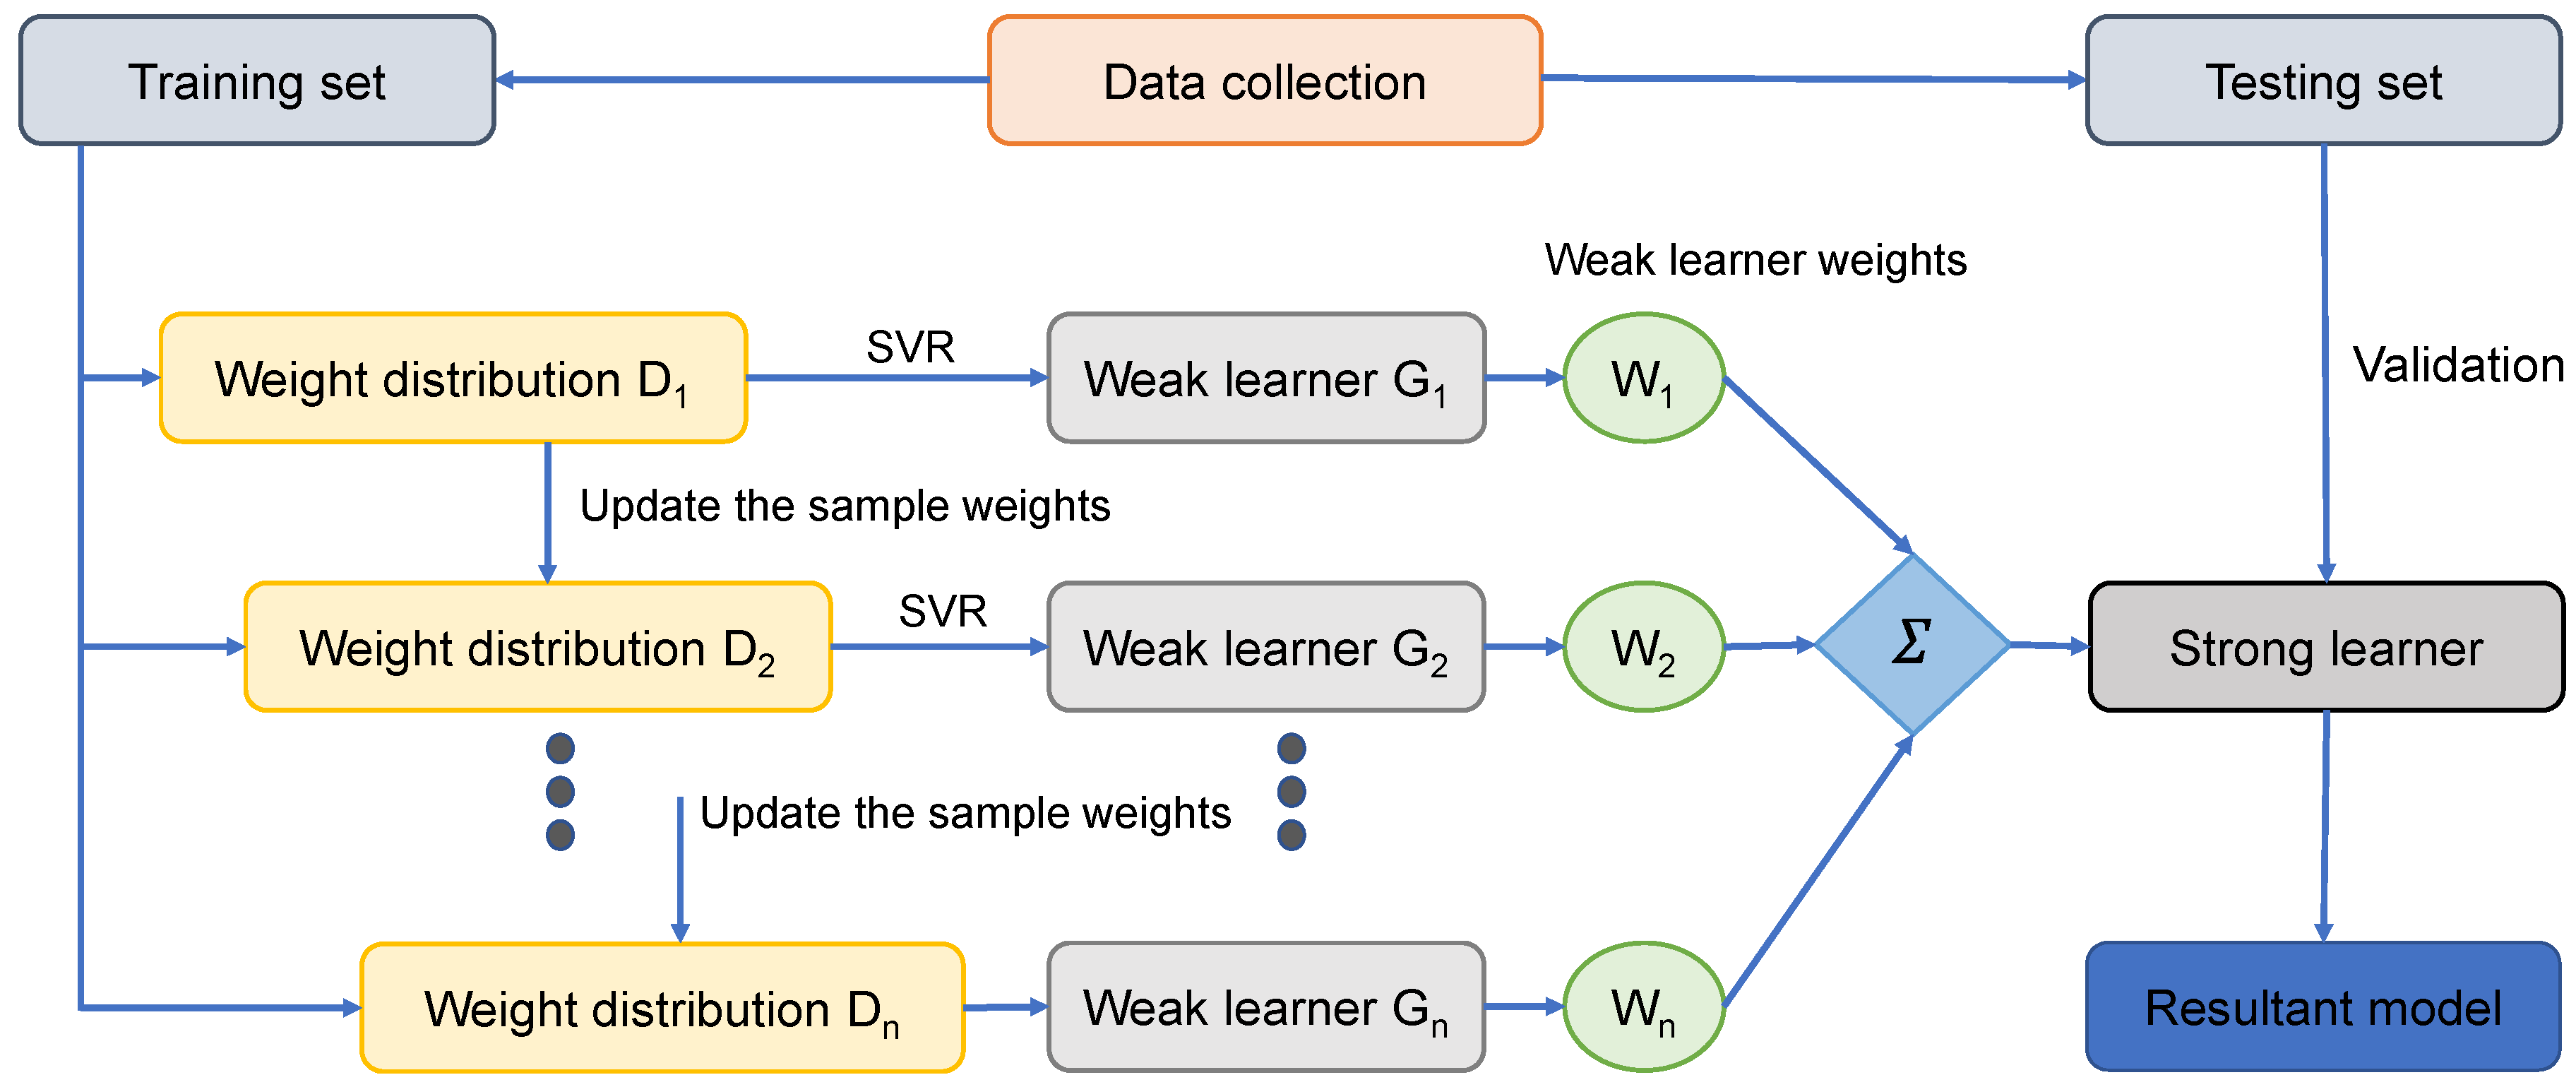
2. Soft Computing Techniques
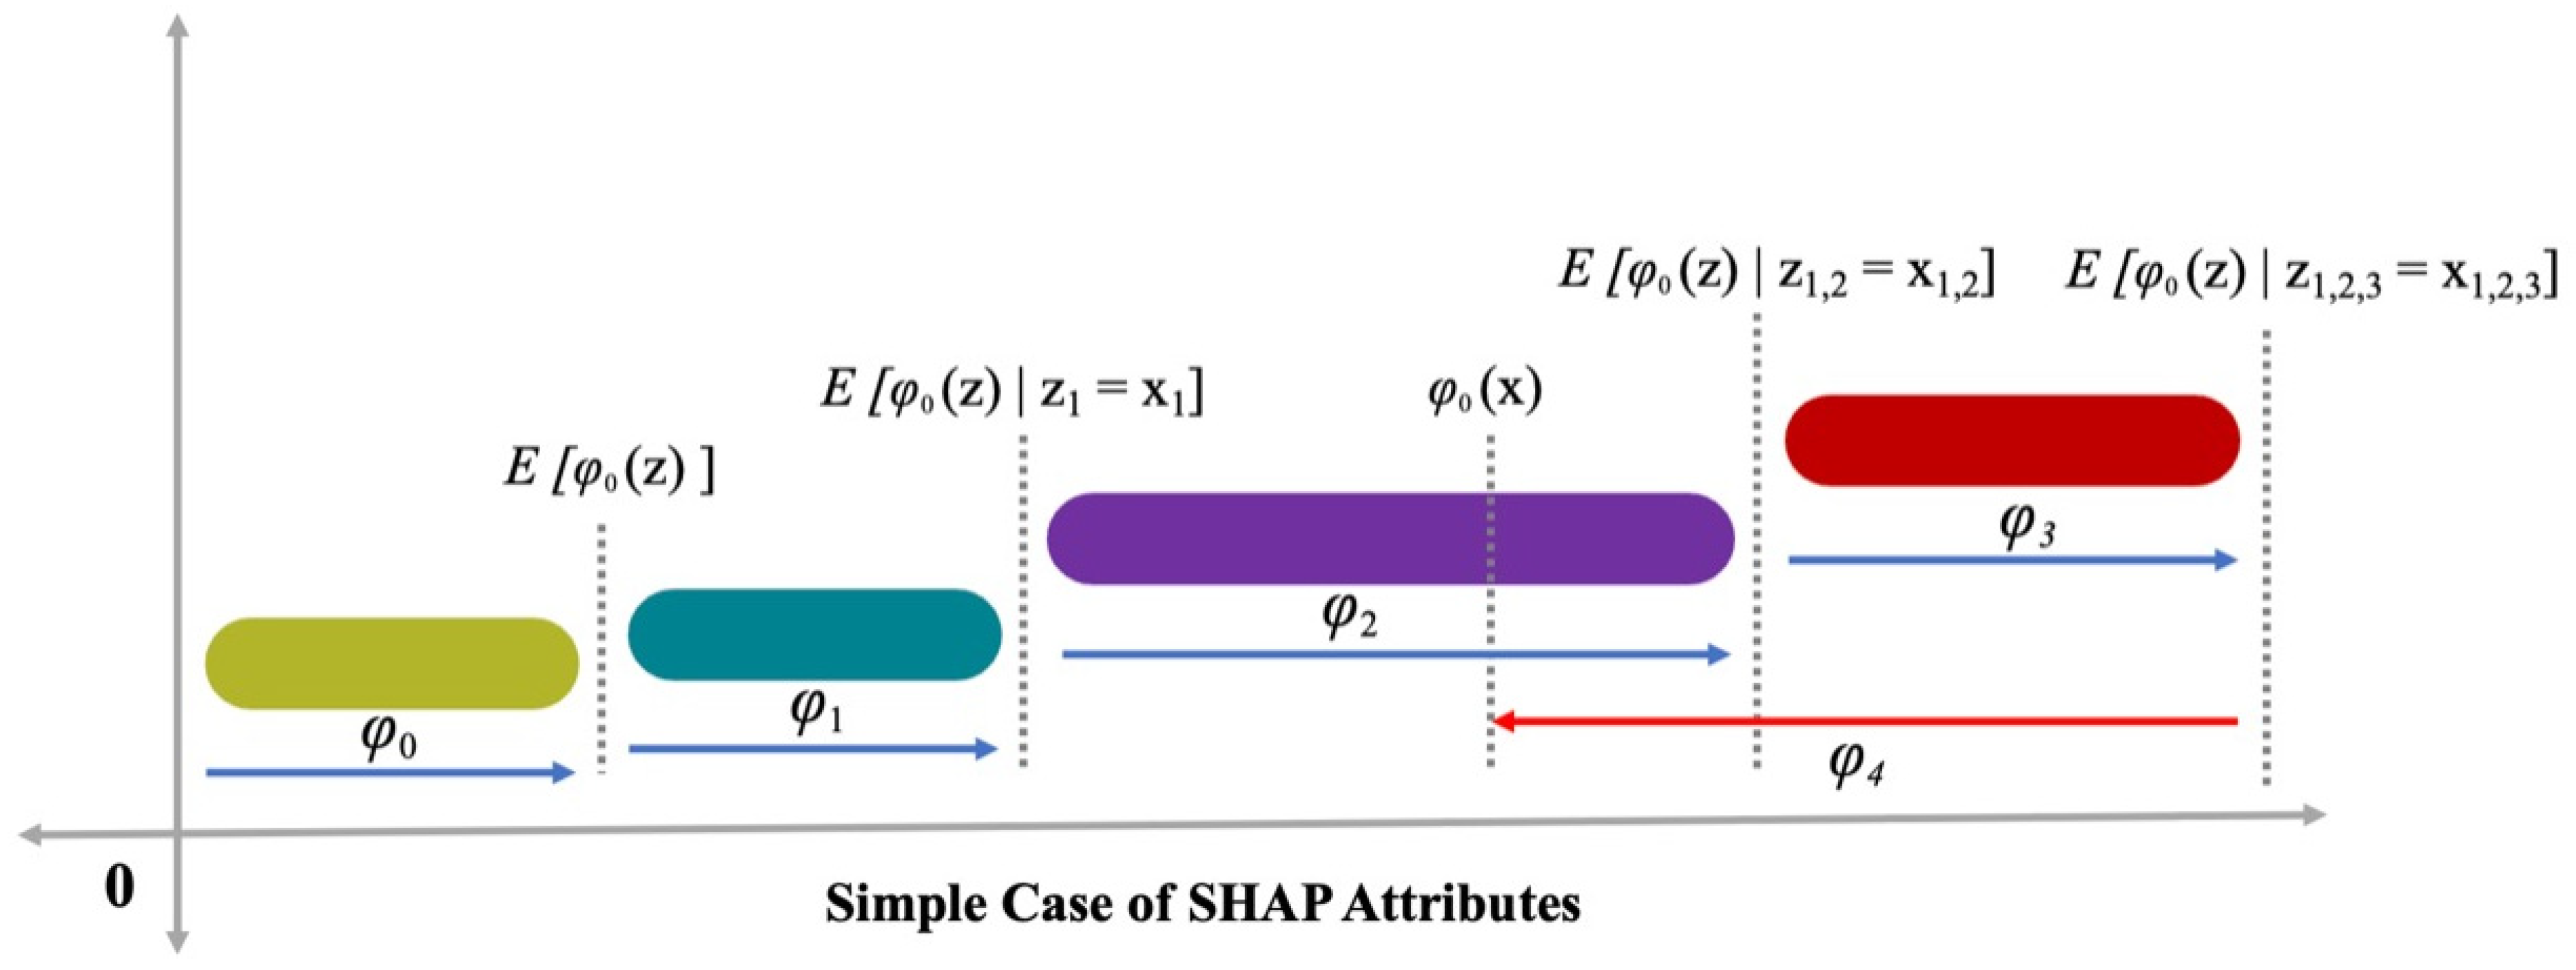
3. Interpretability of Model Using SHAP
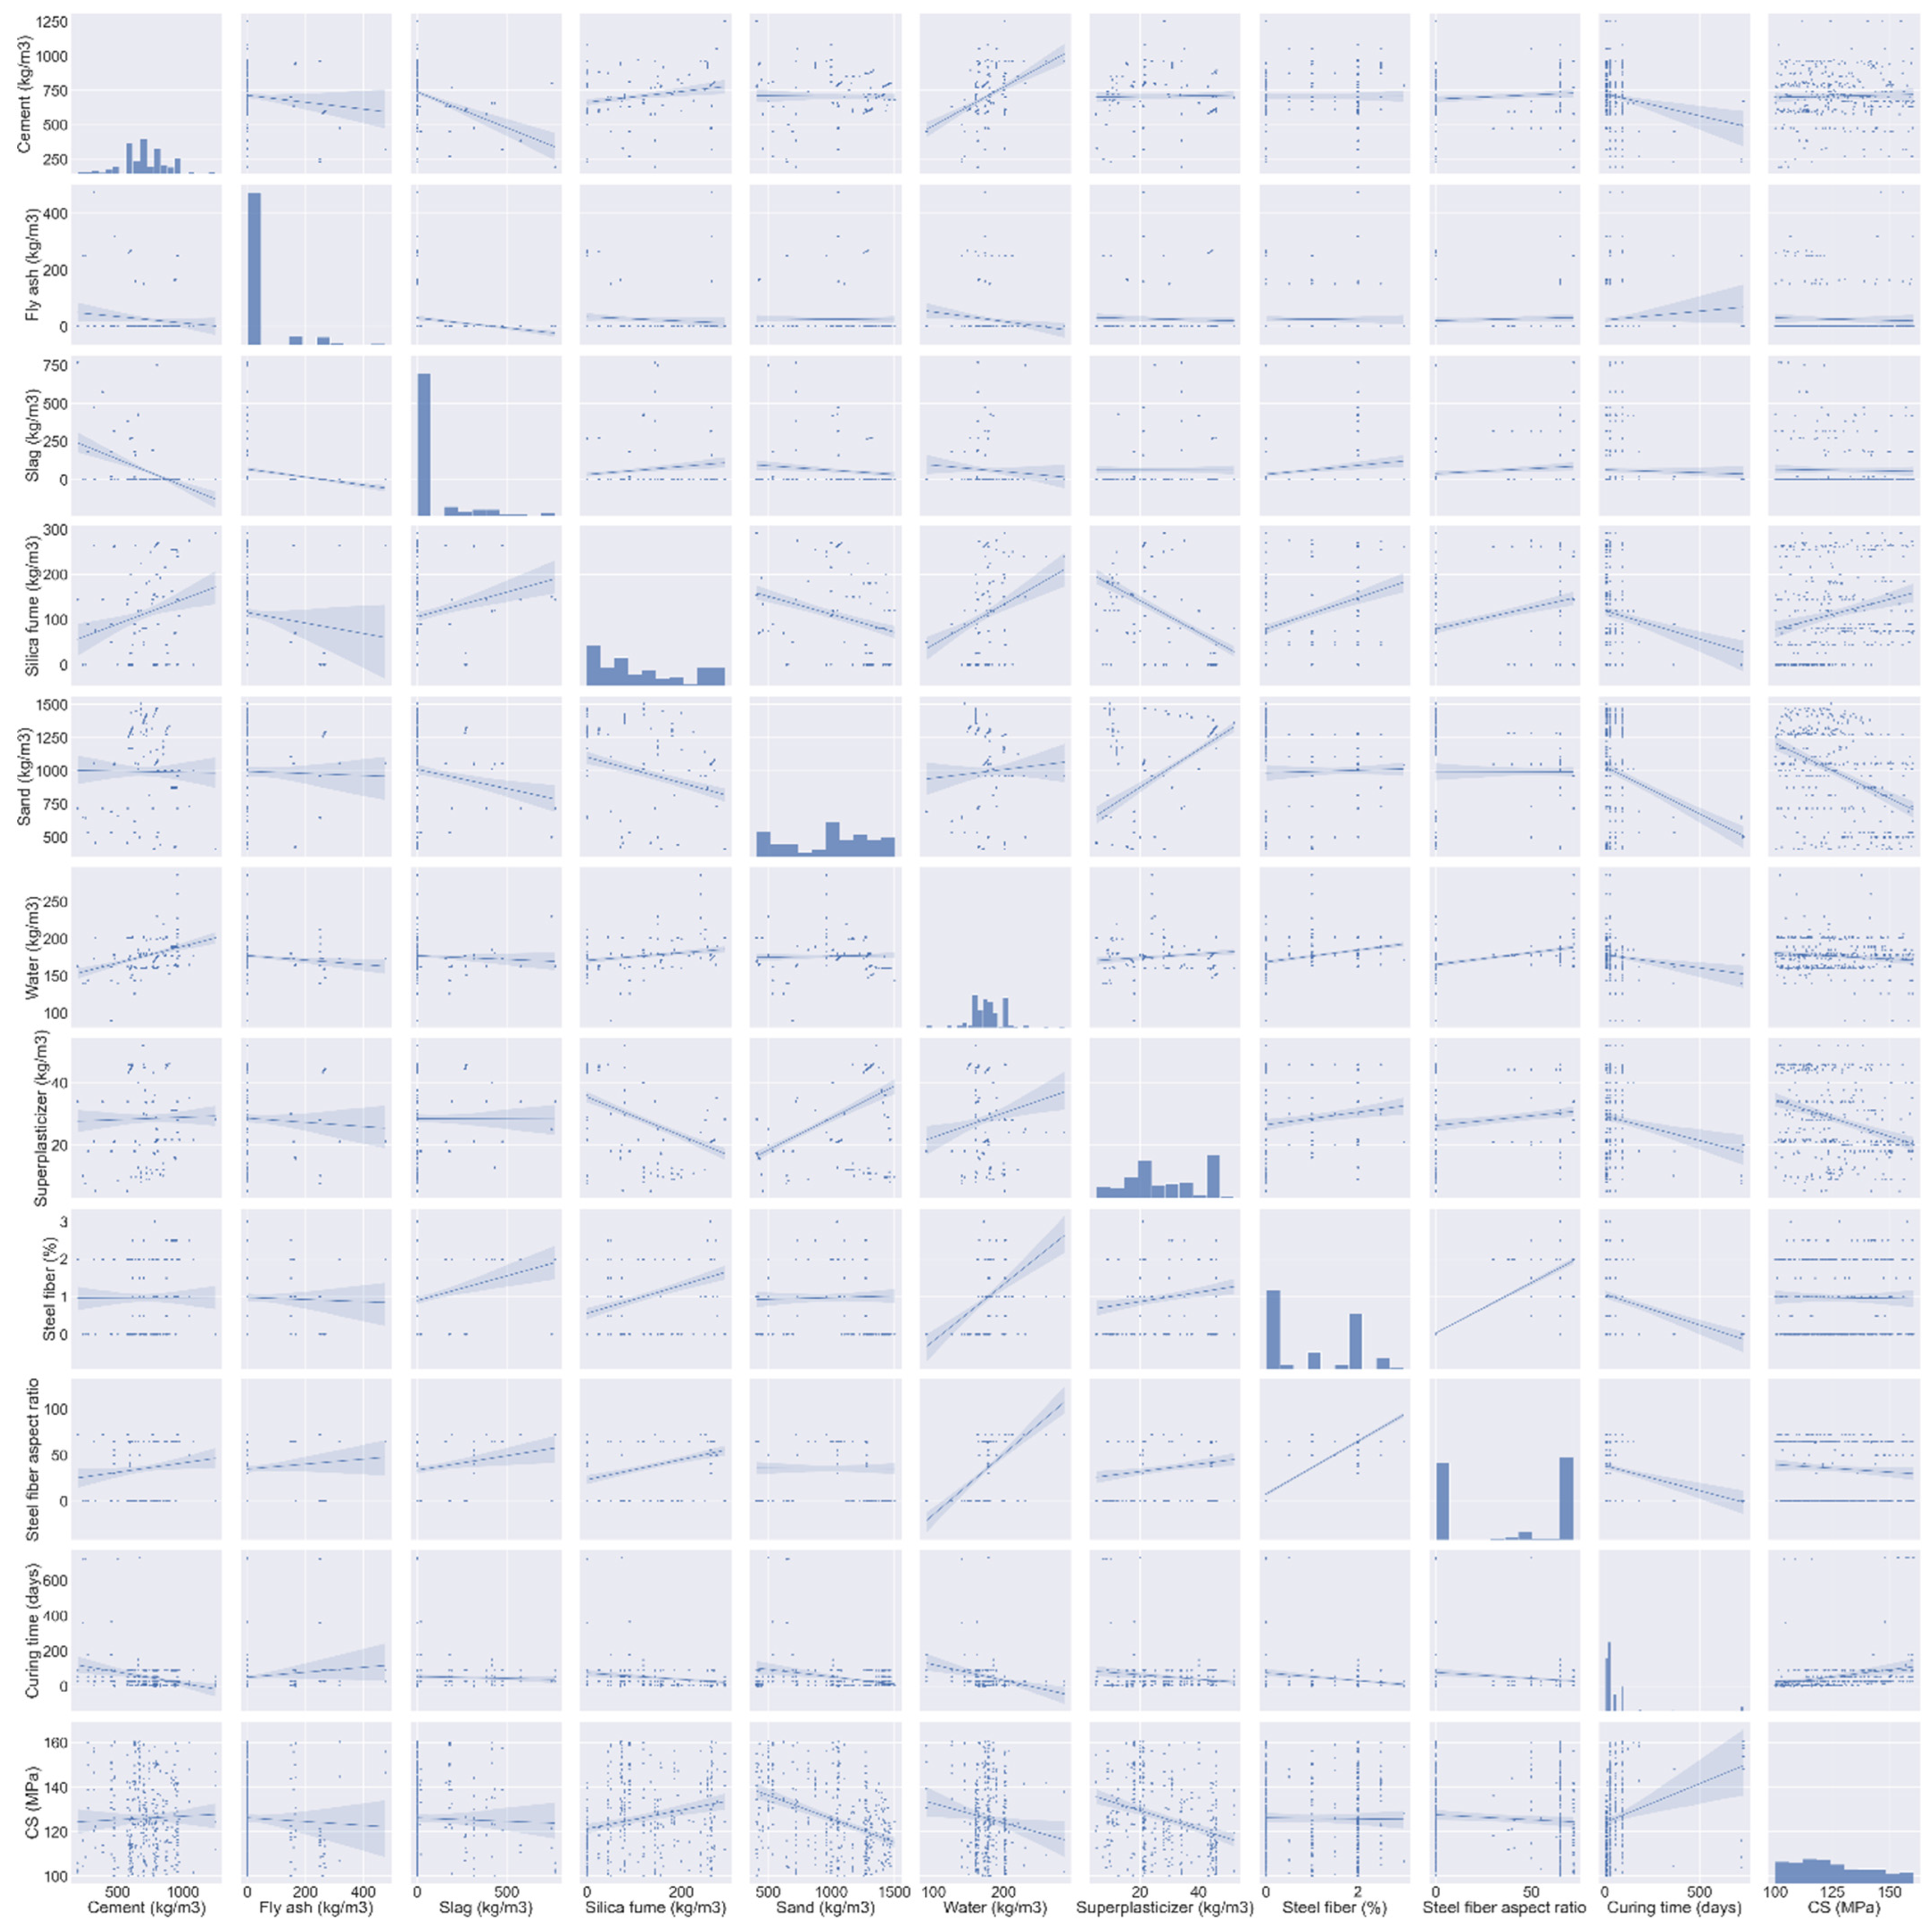
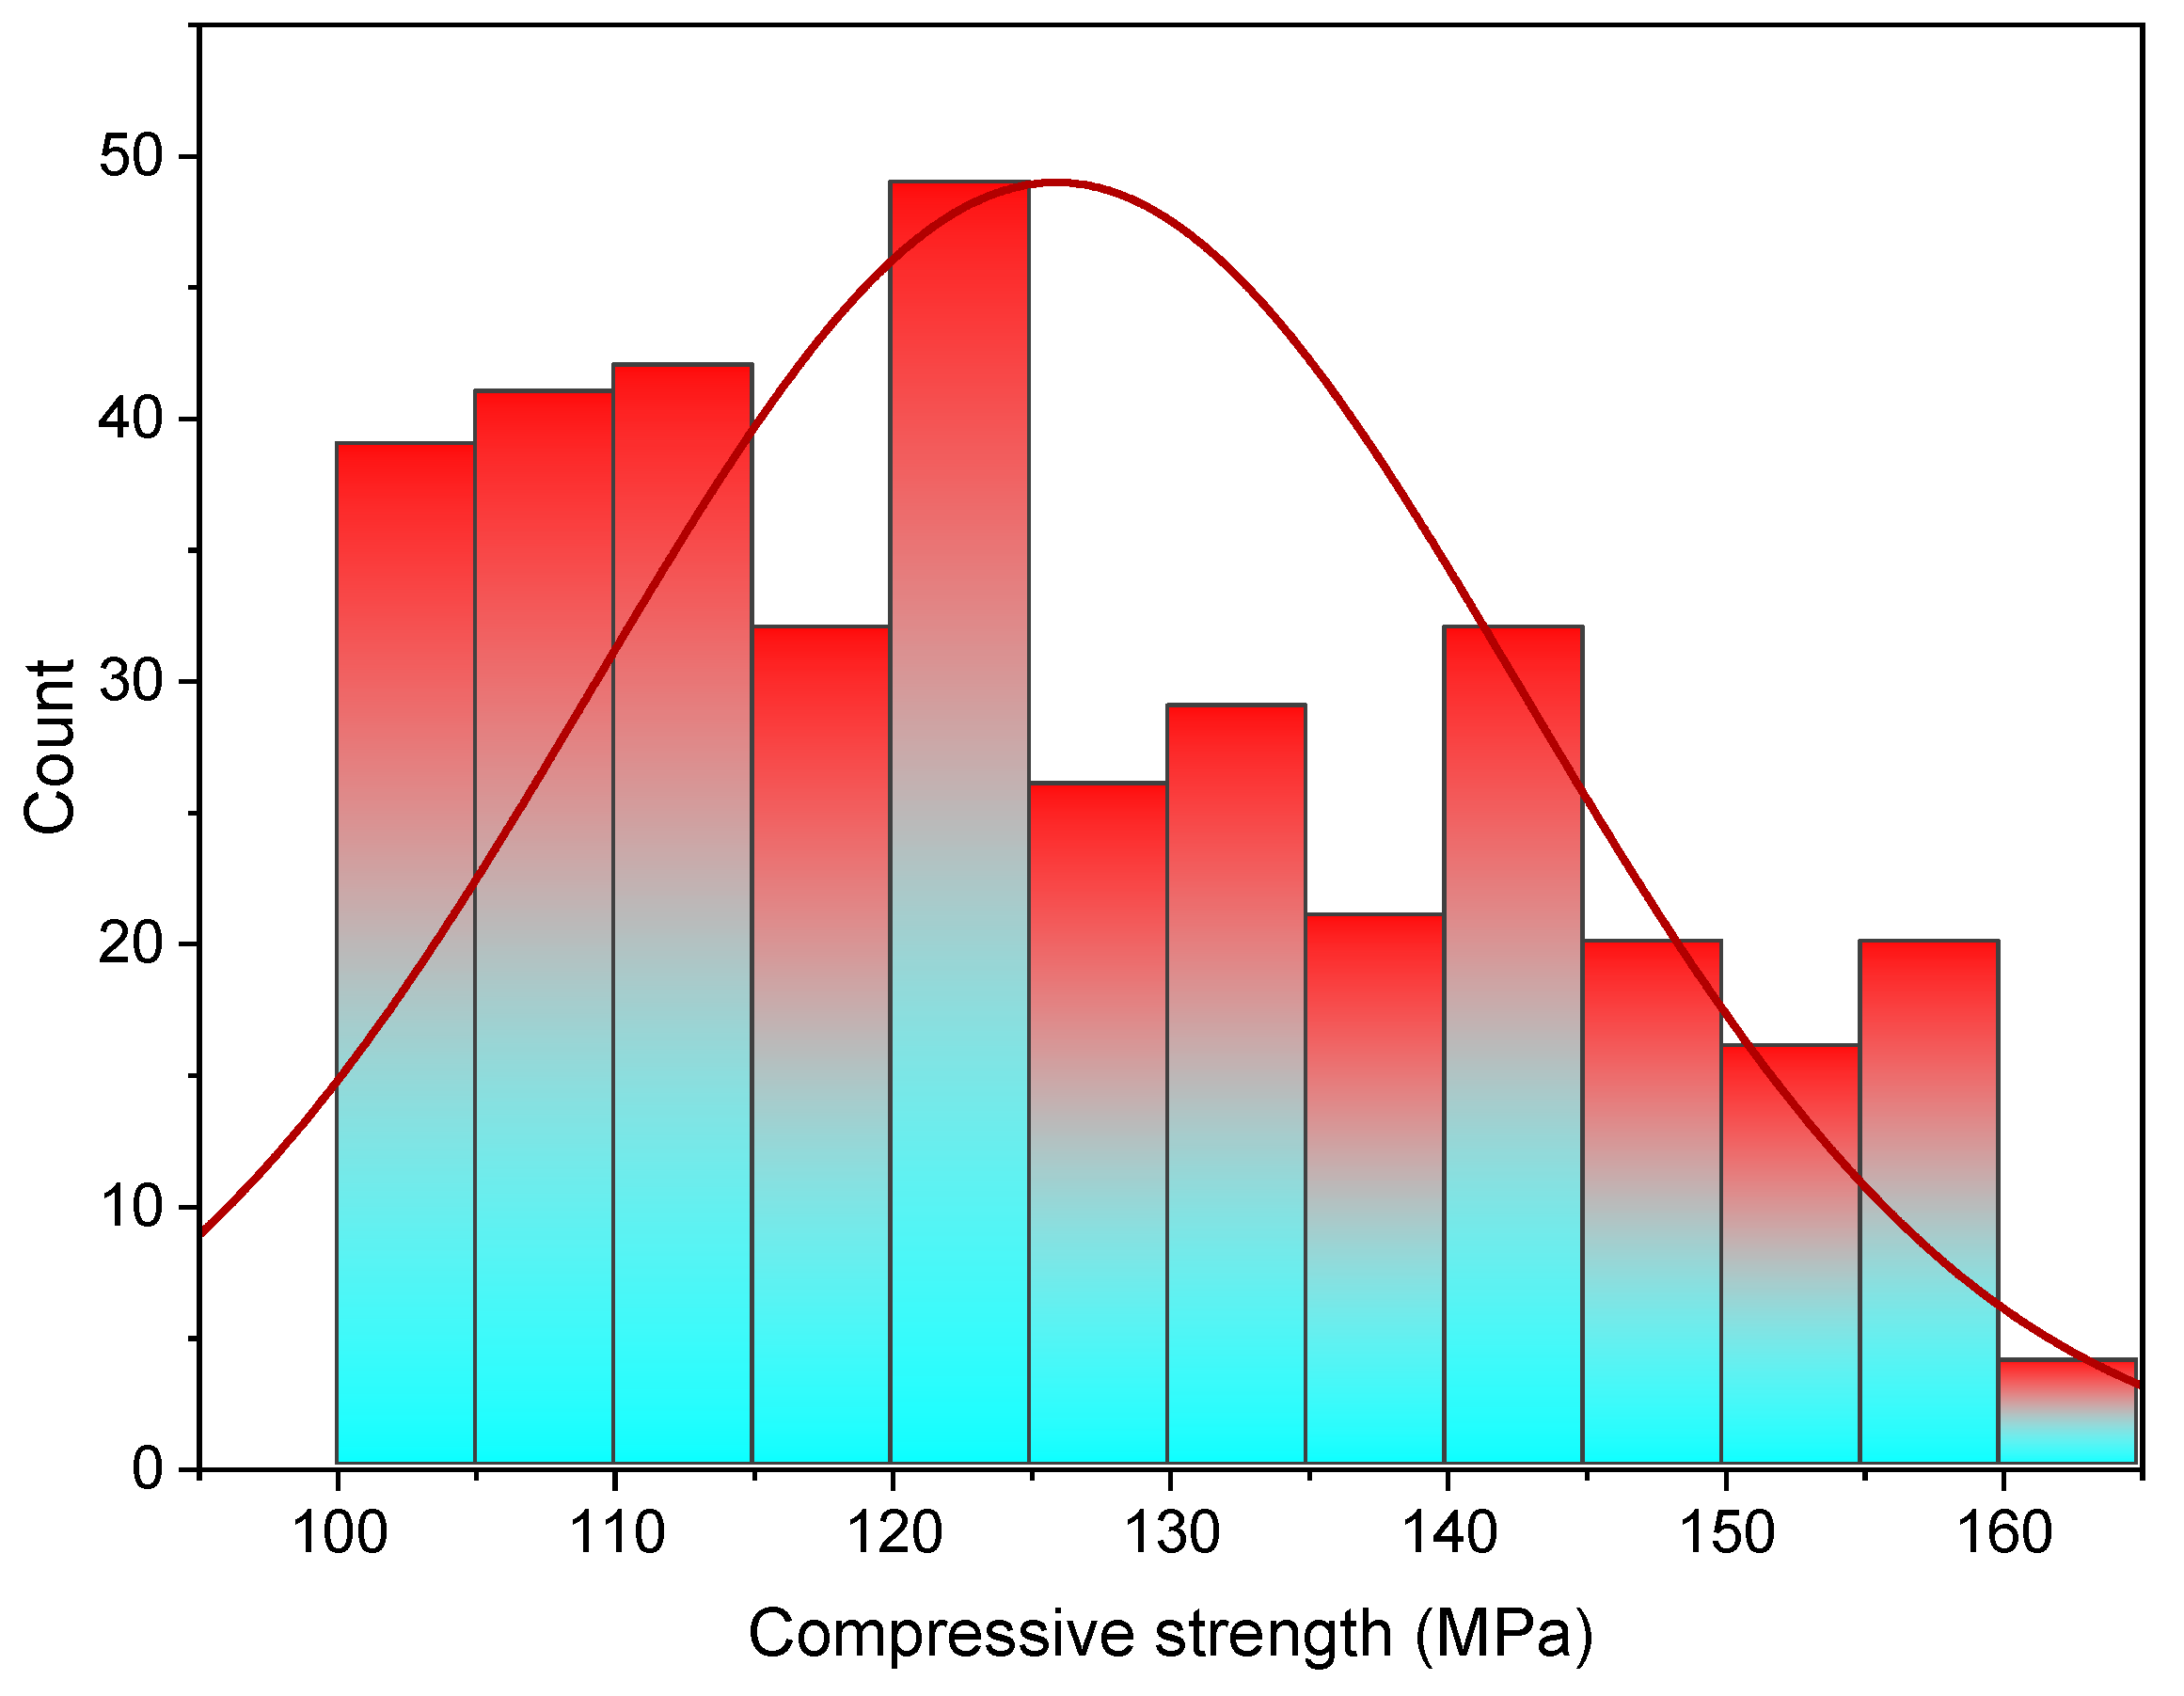
4. Data Set
5. Results and Discussion
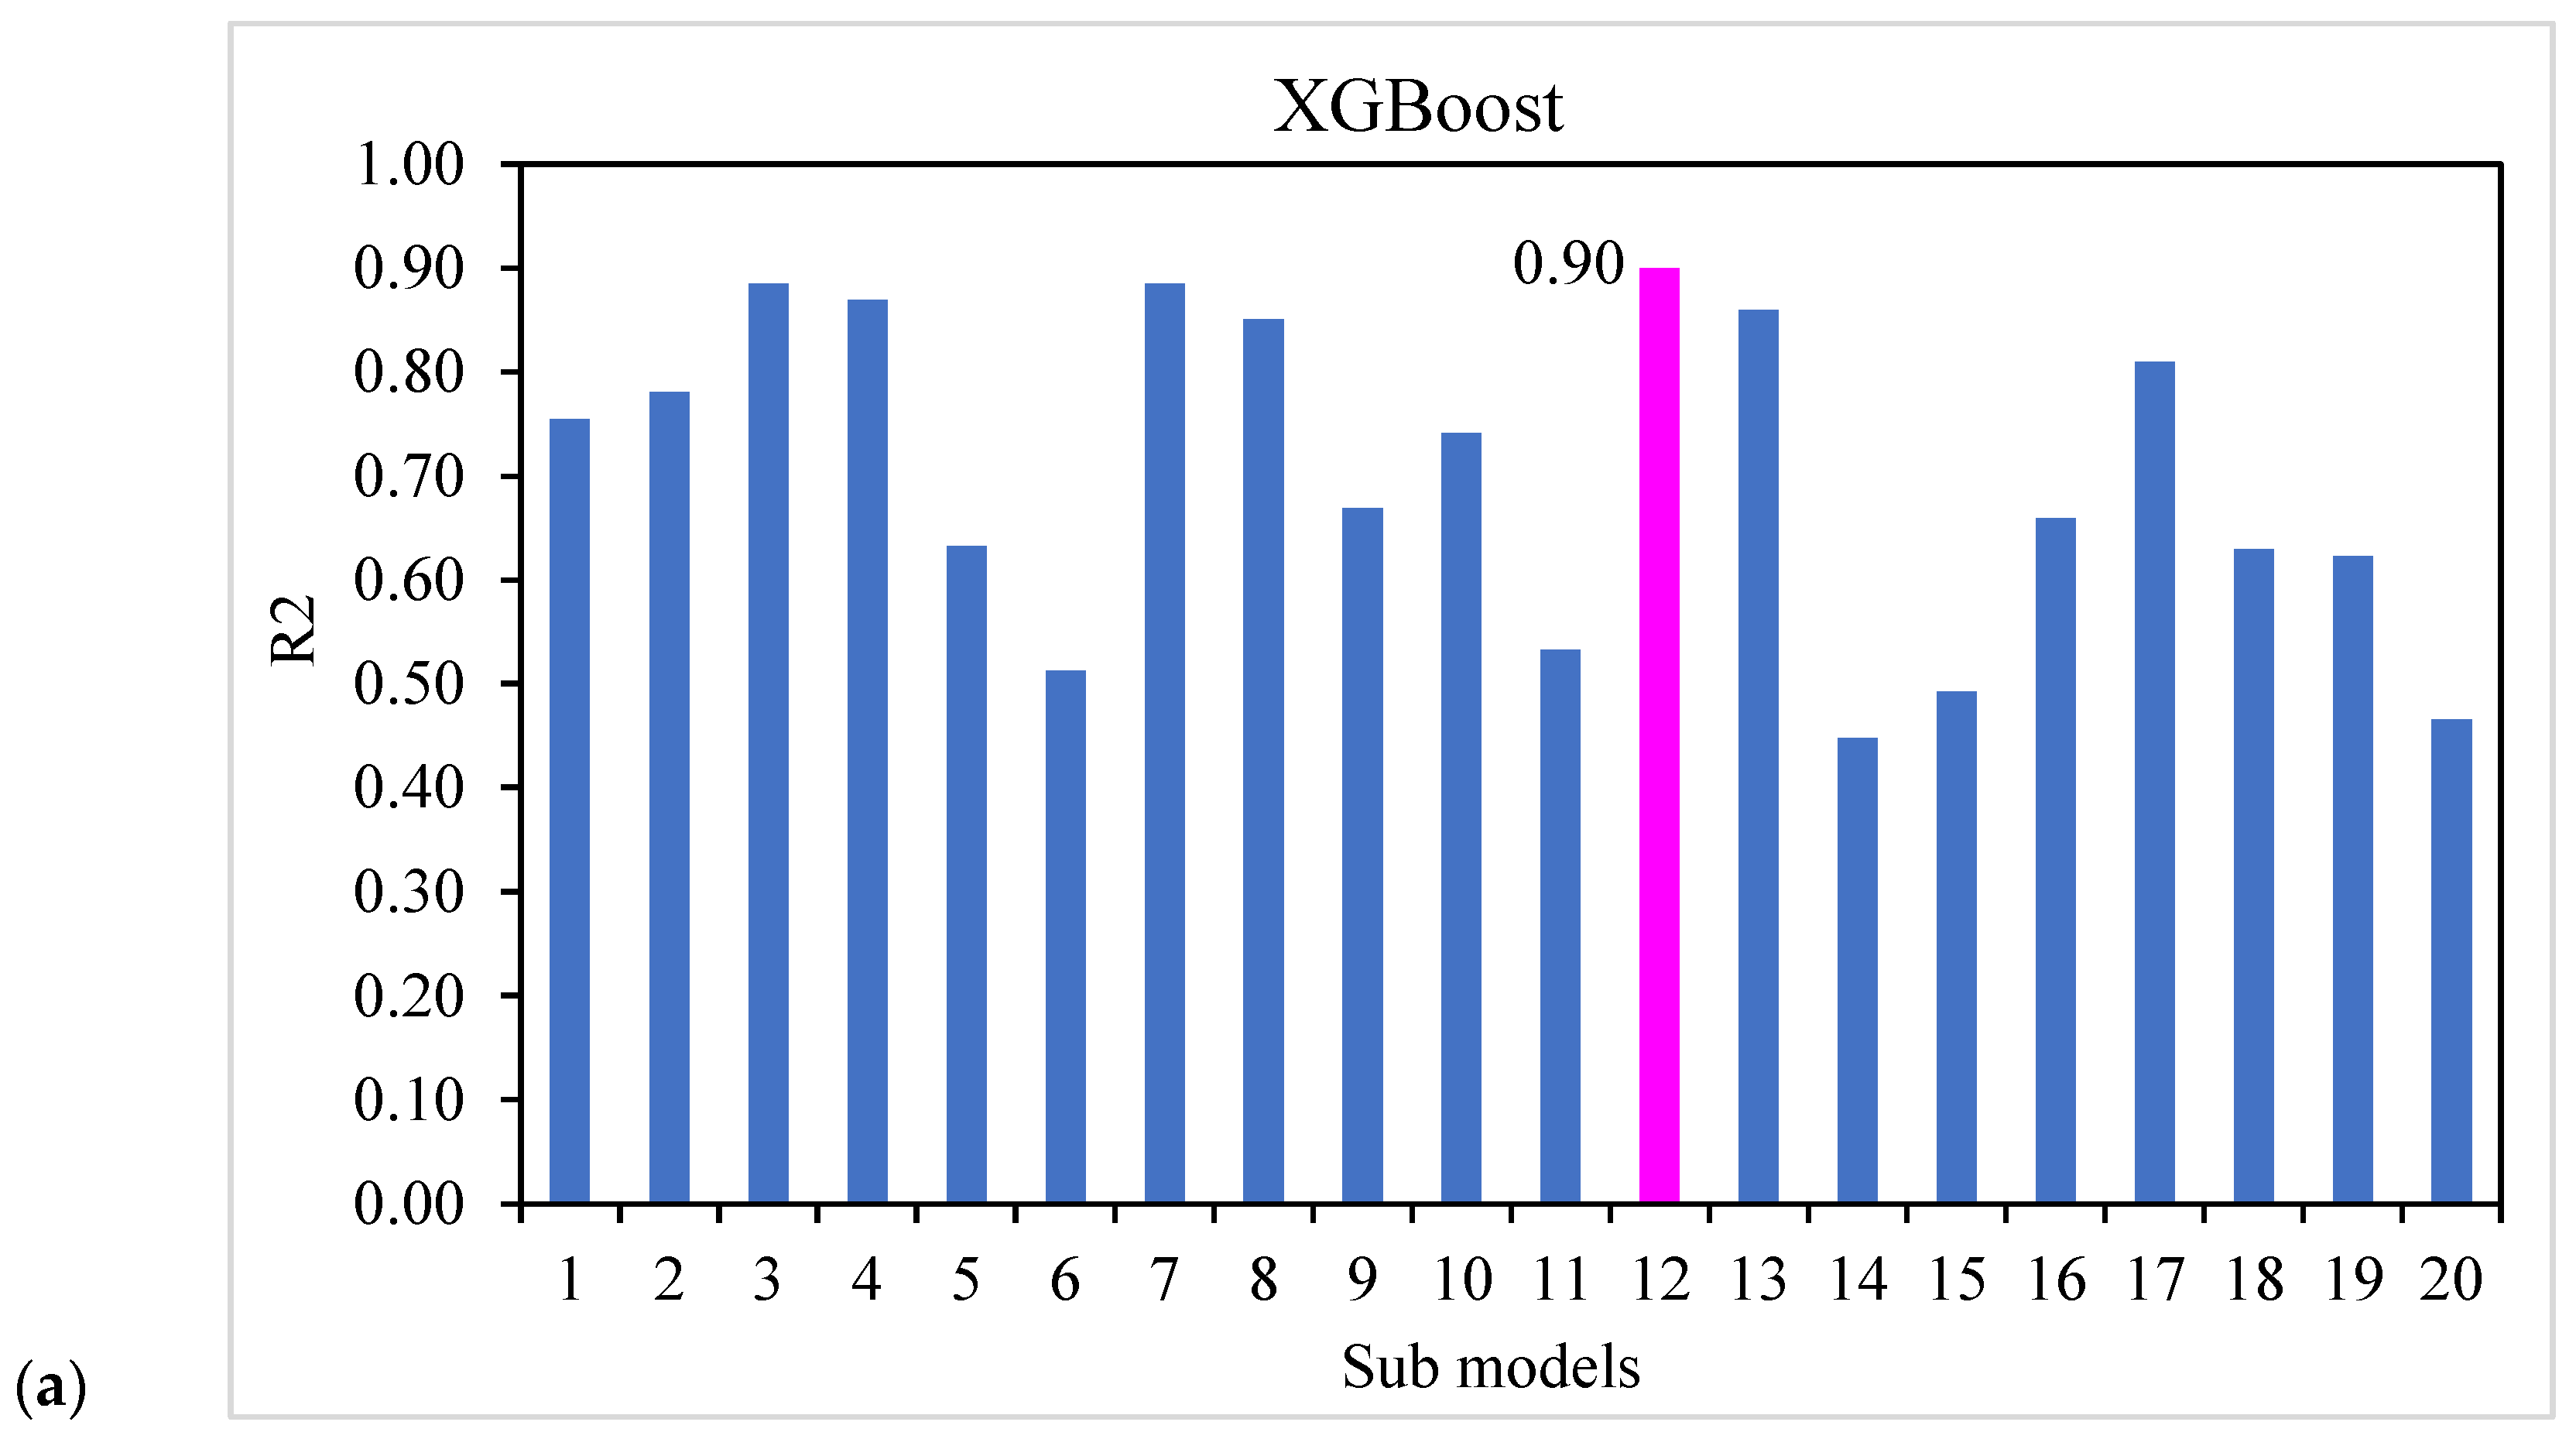
5.1. XGBoost
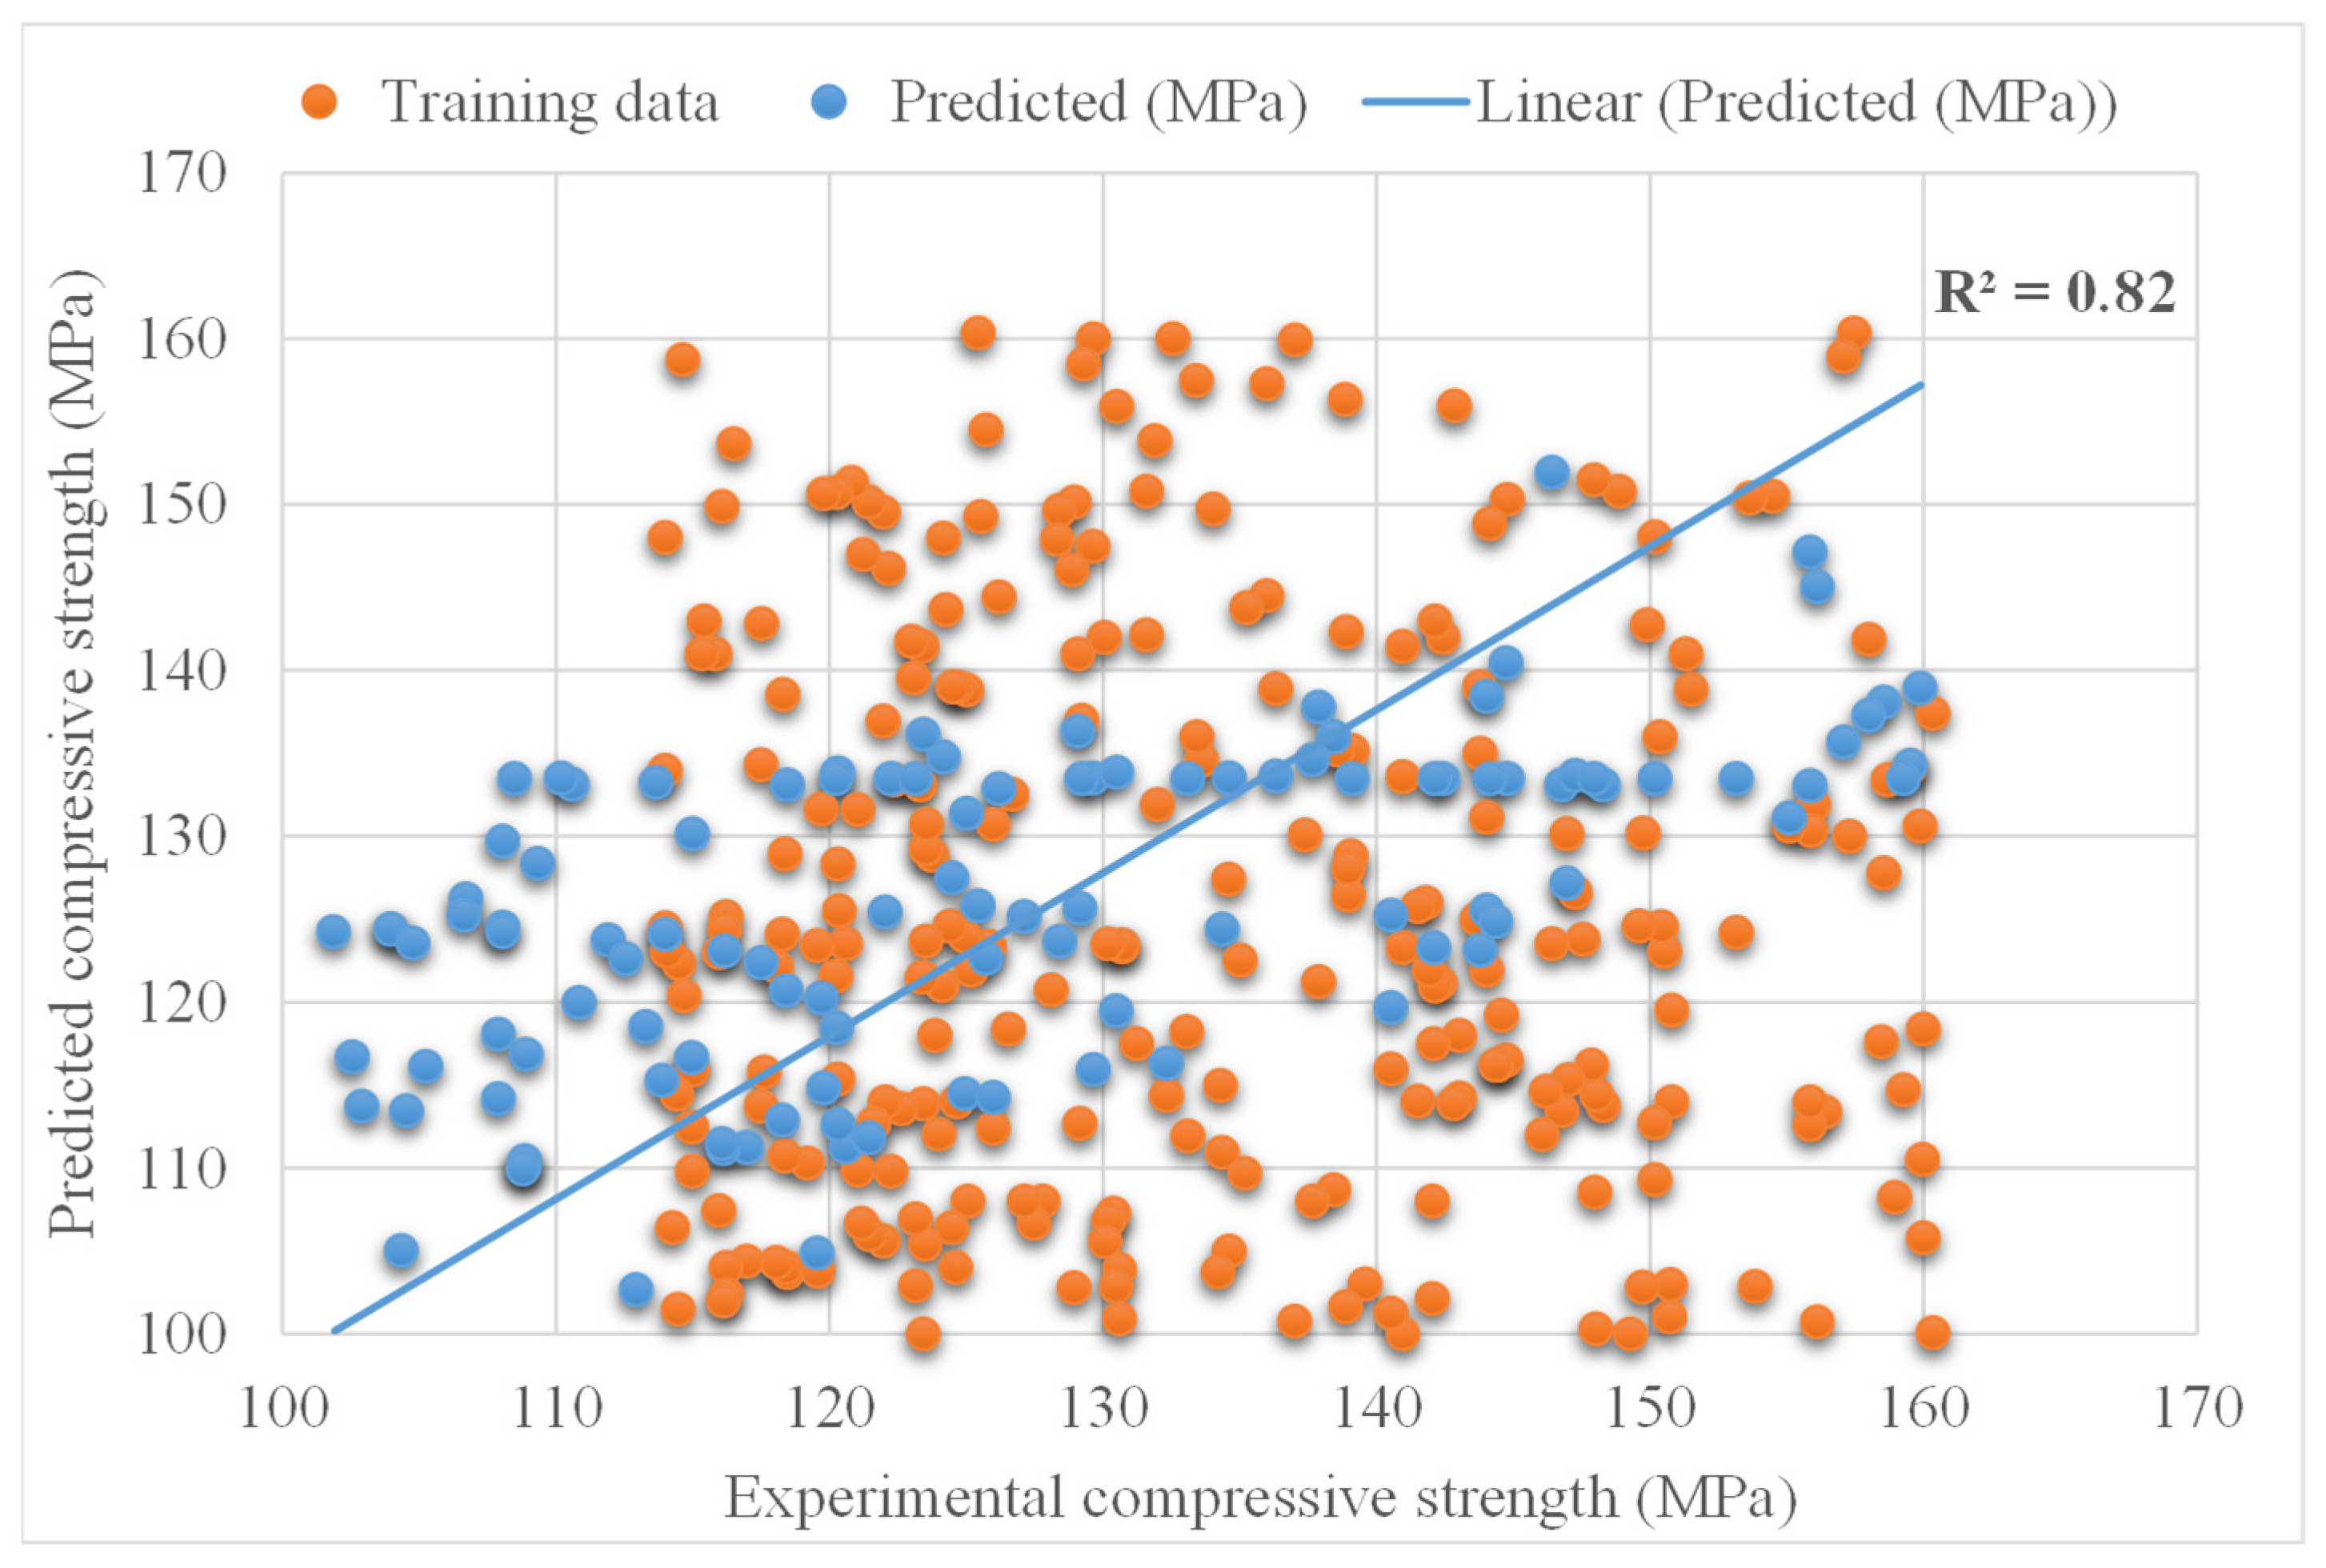
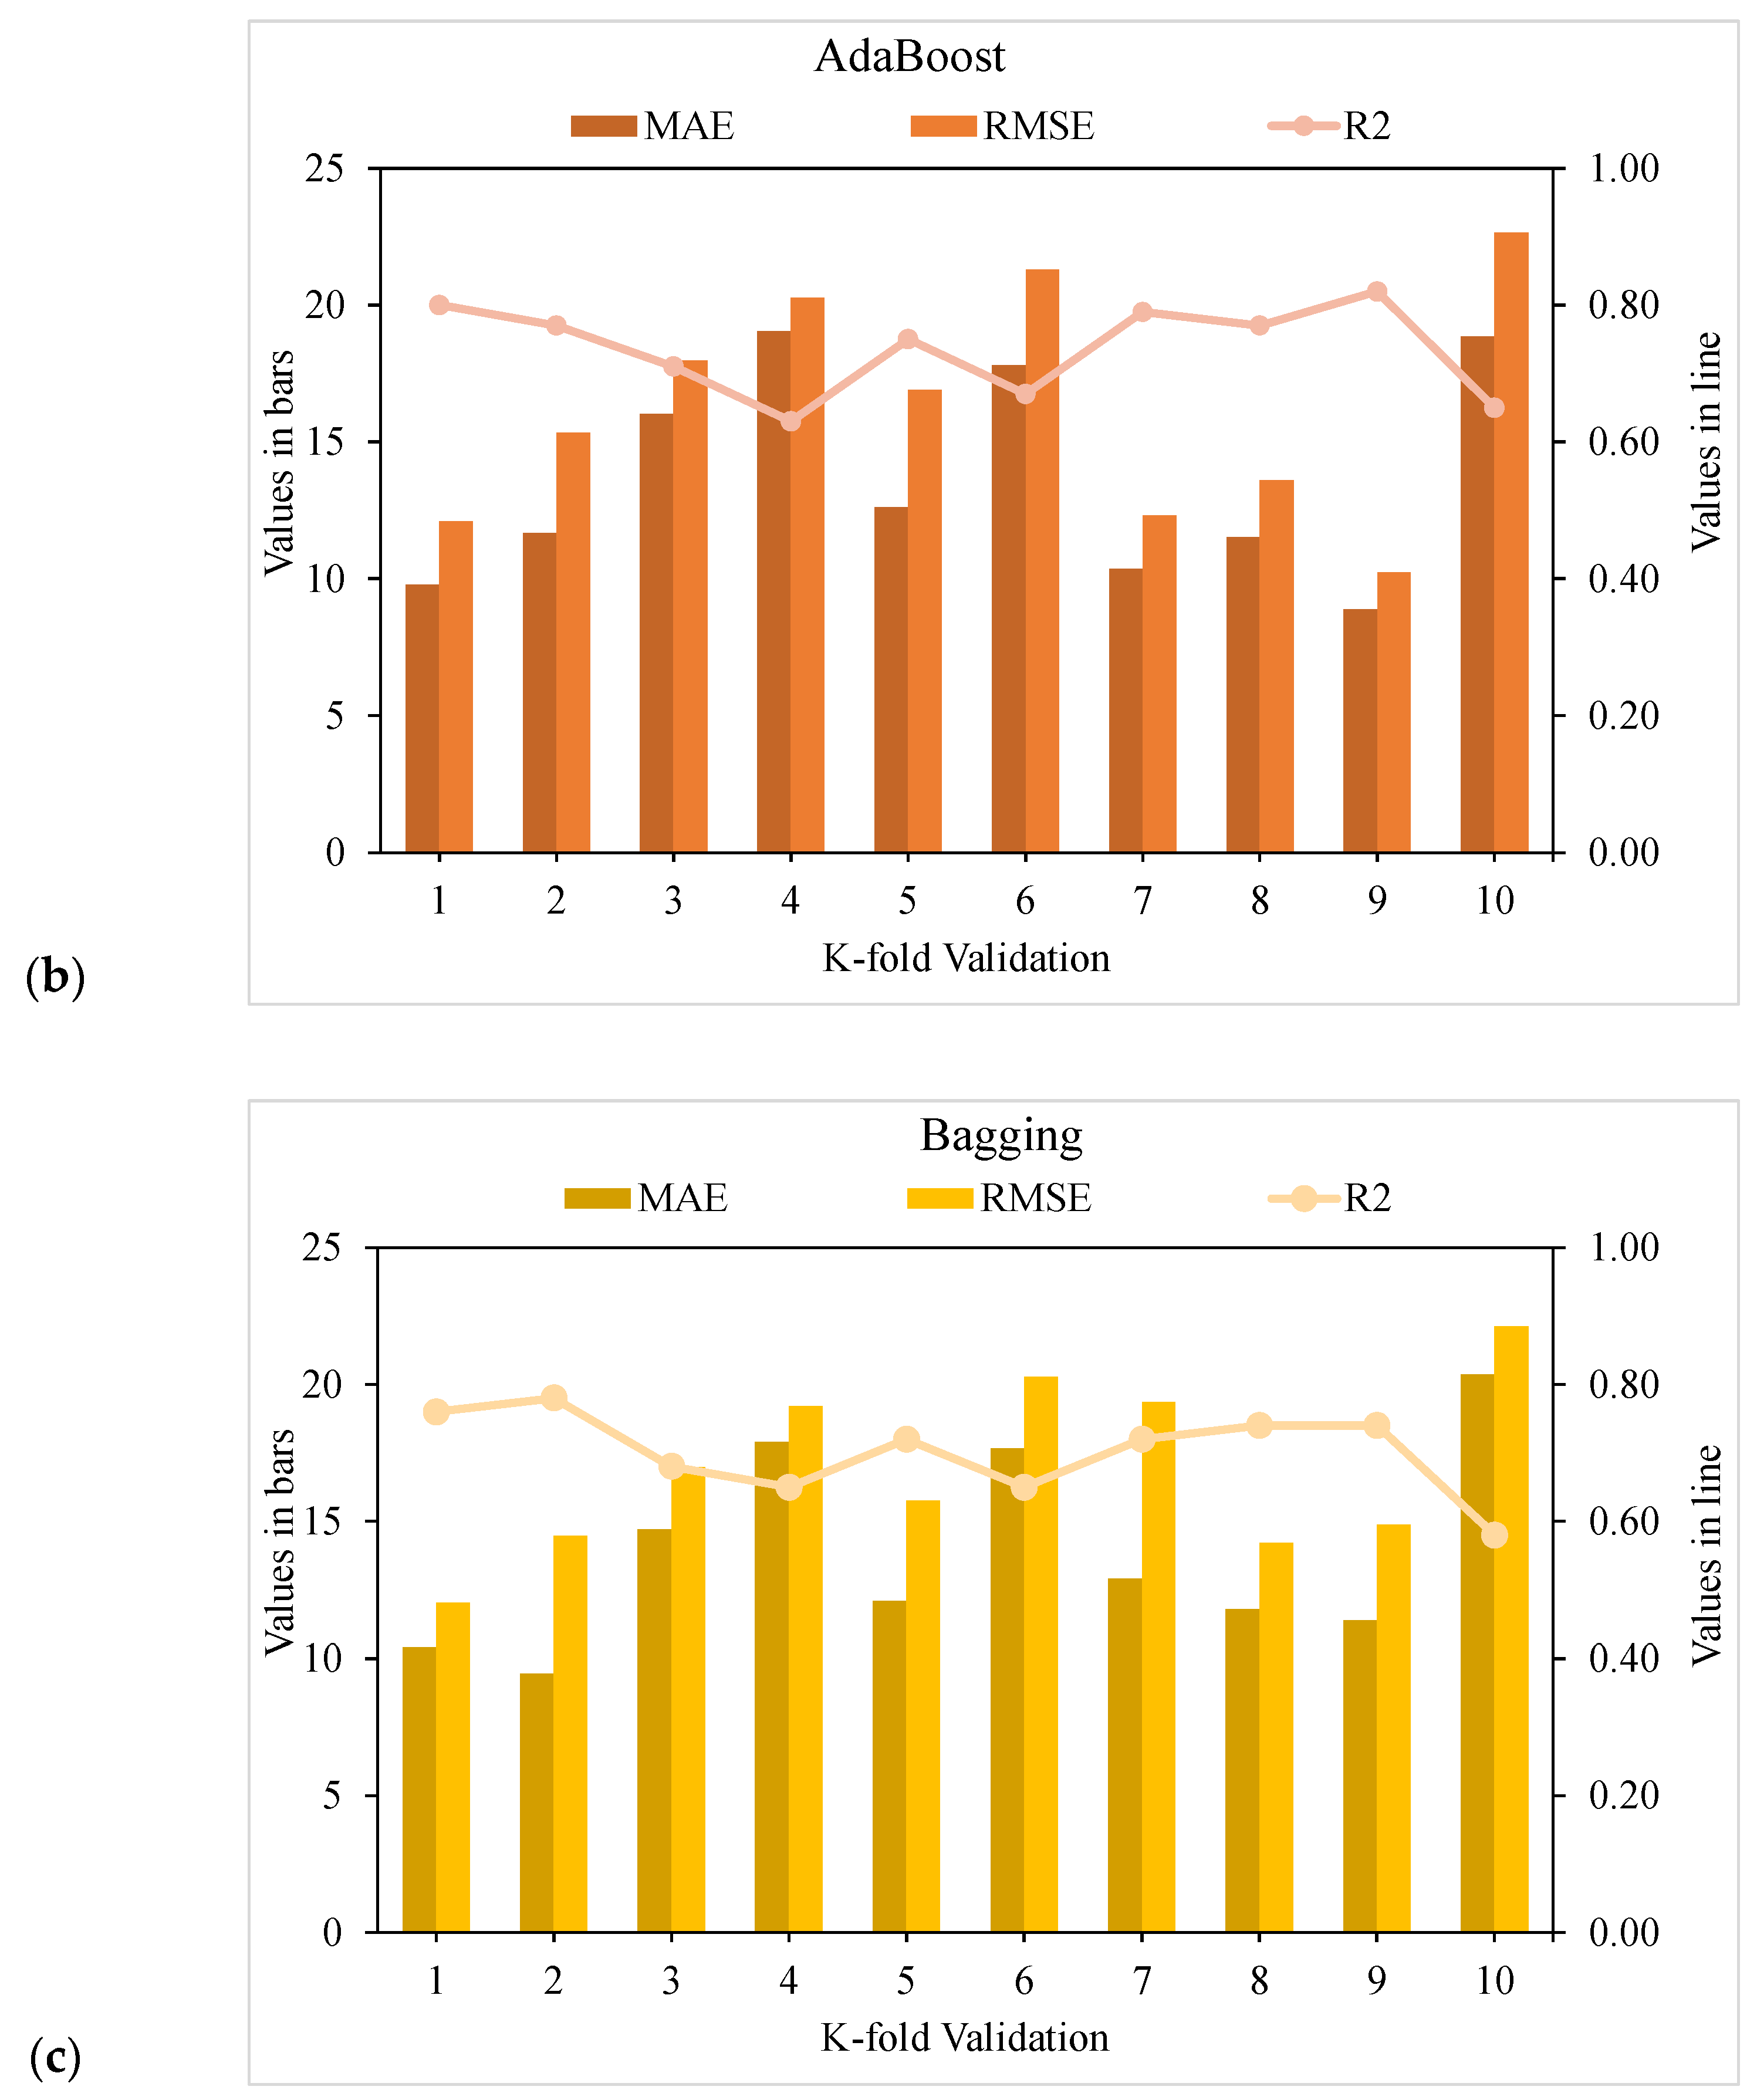
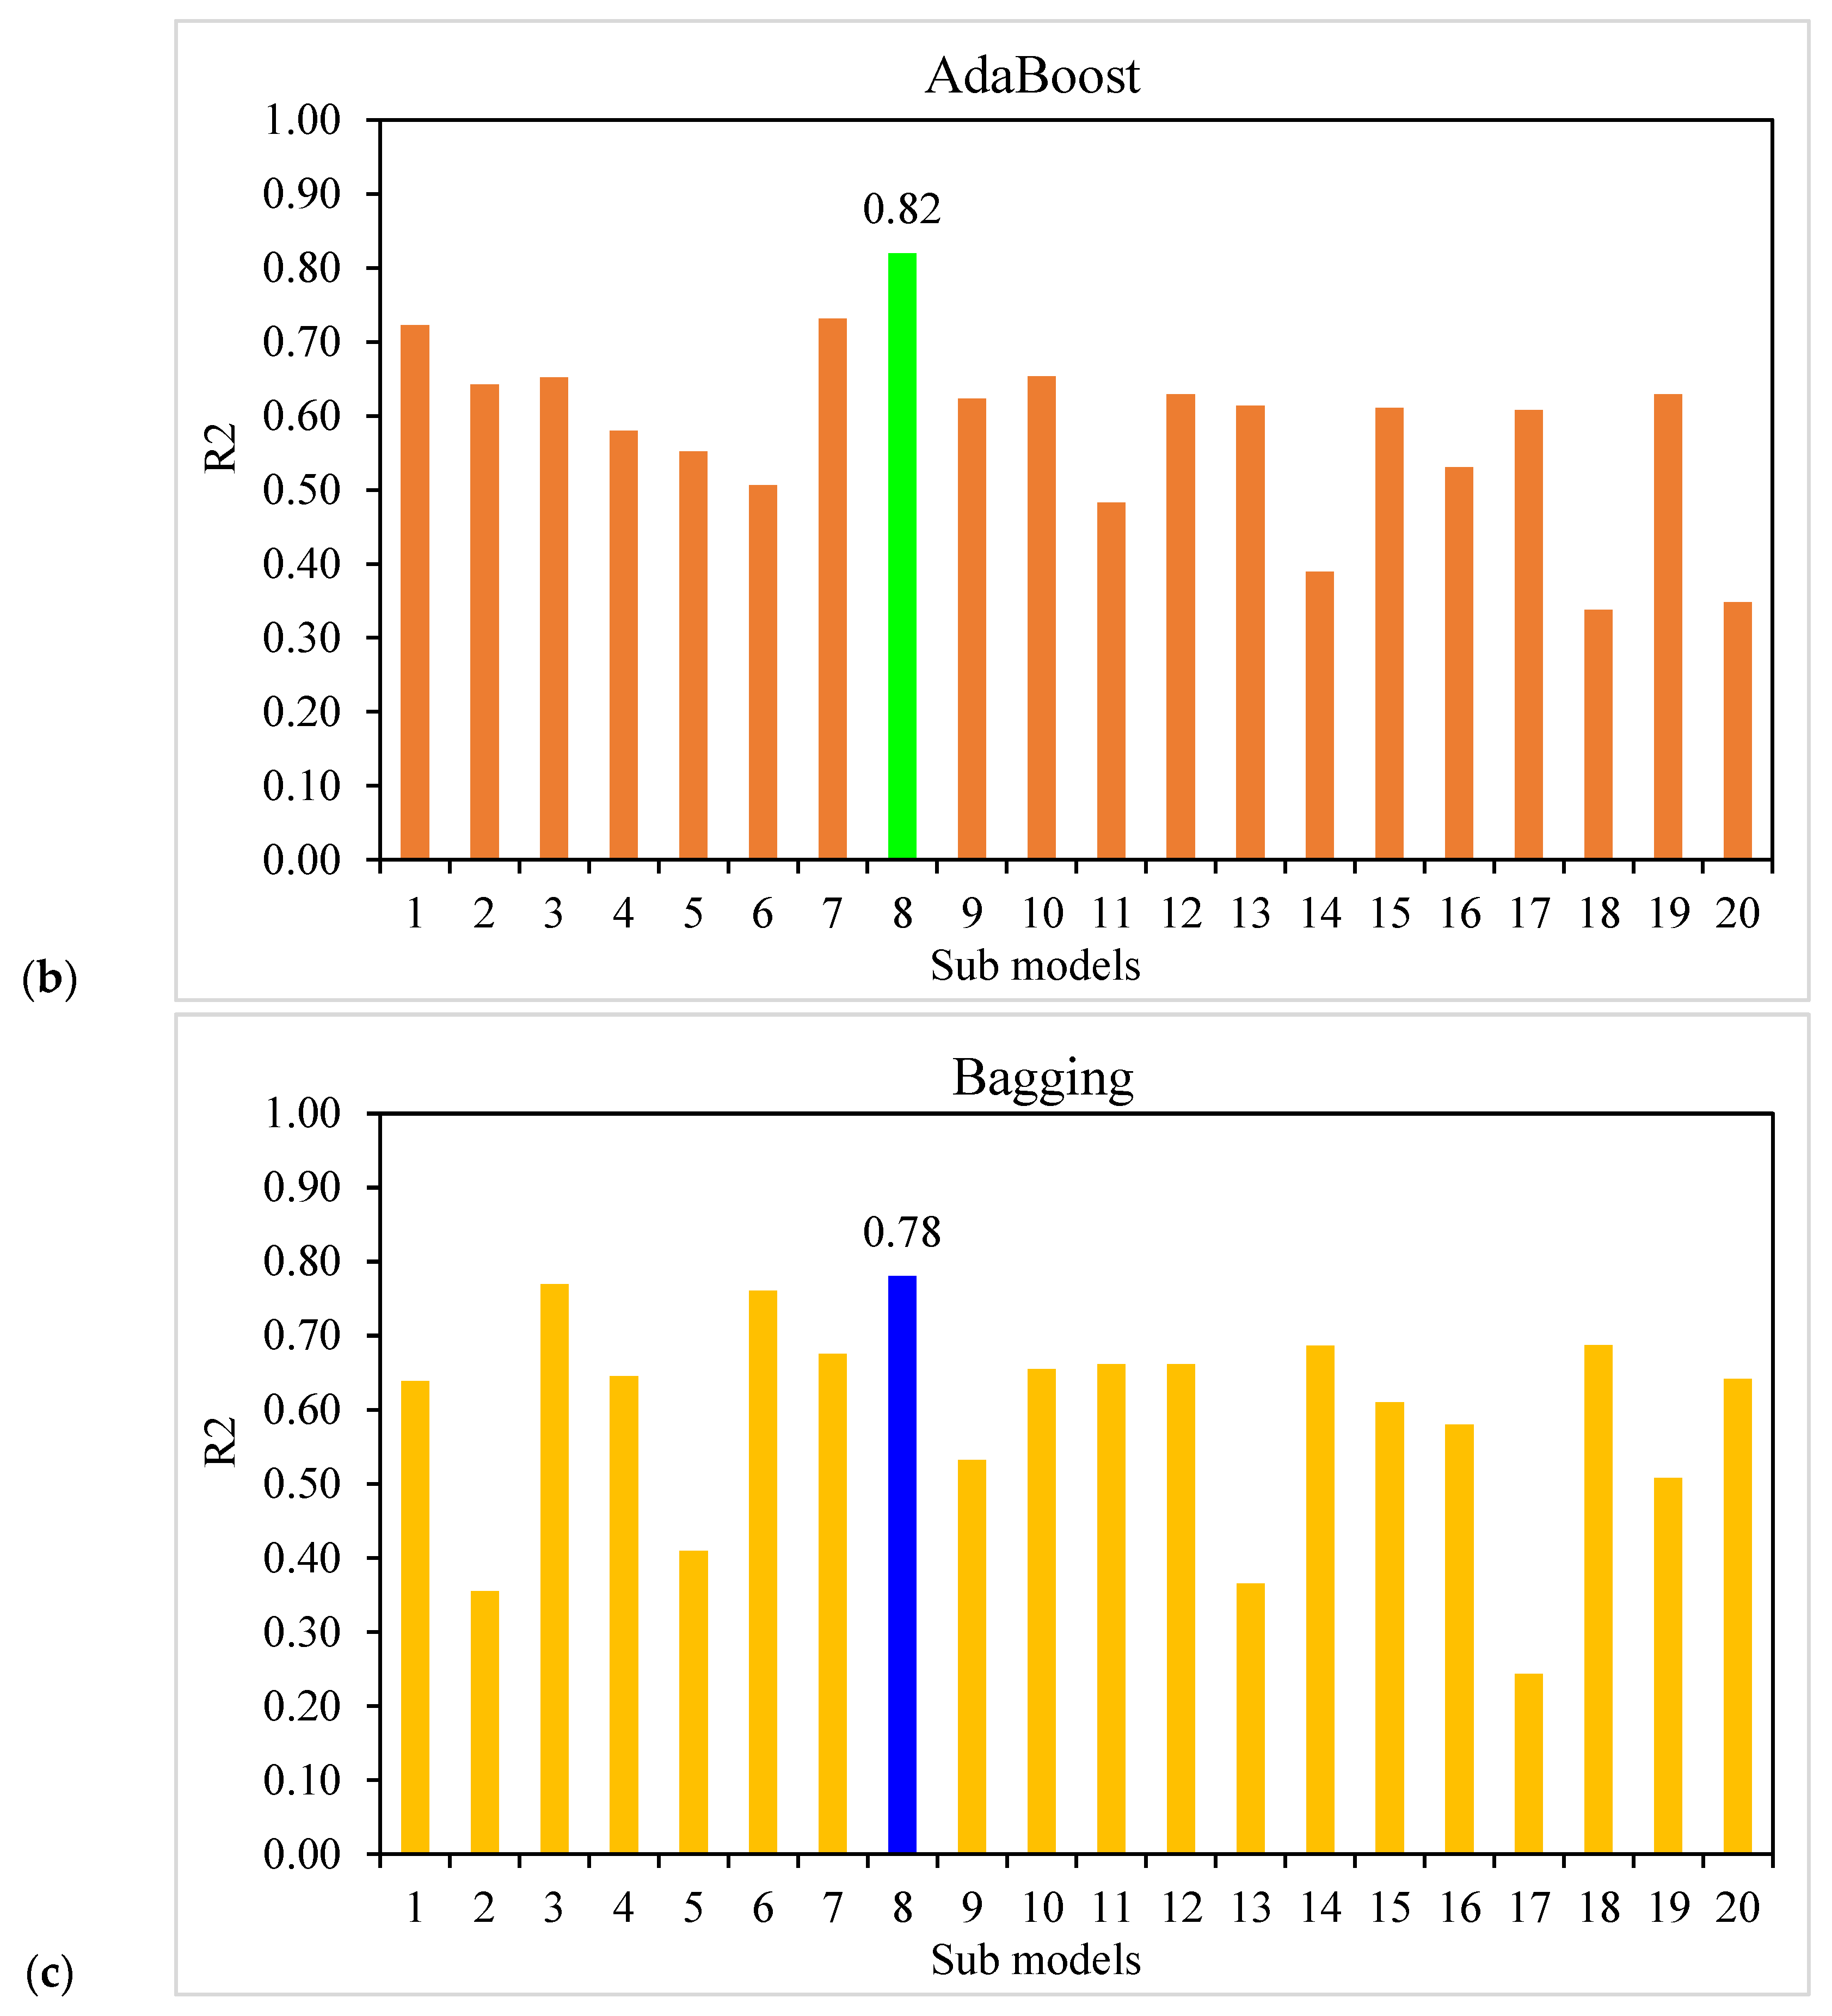
5.2. AdaBoost
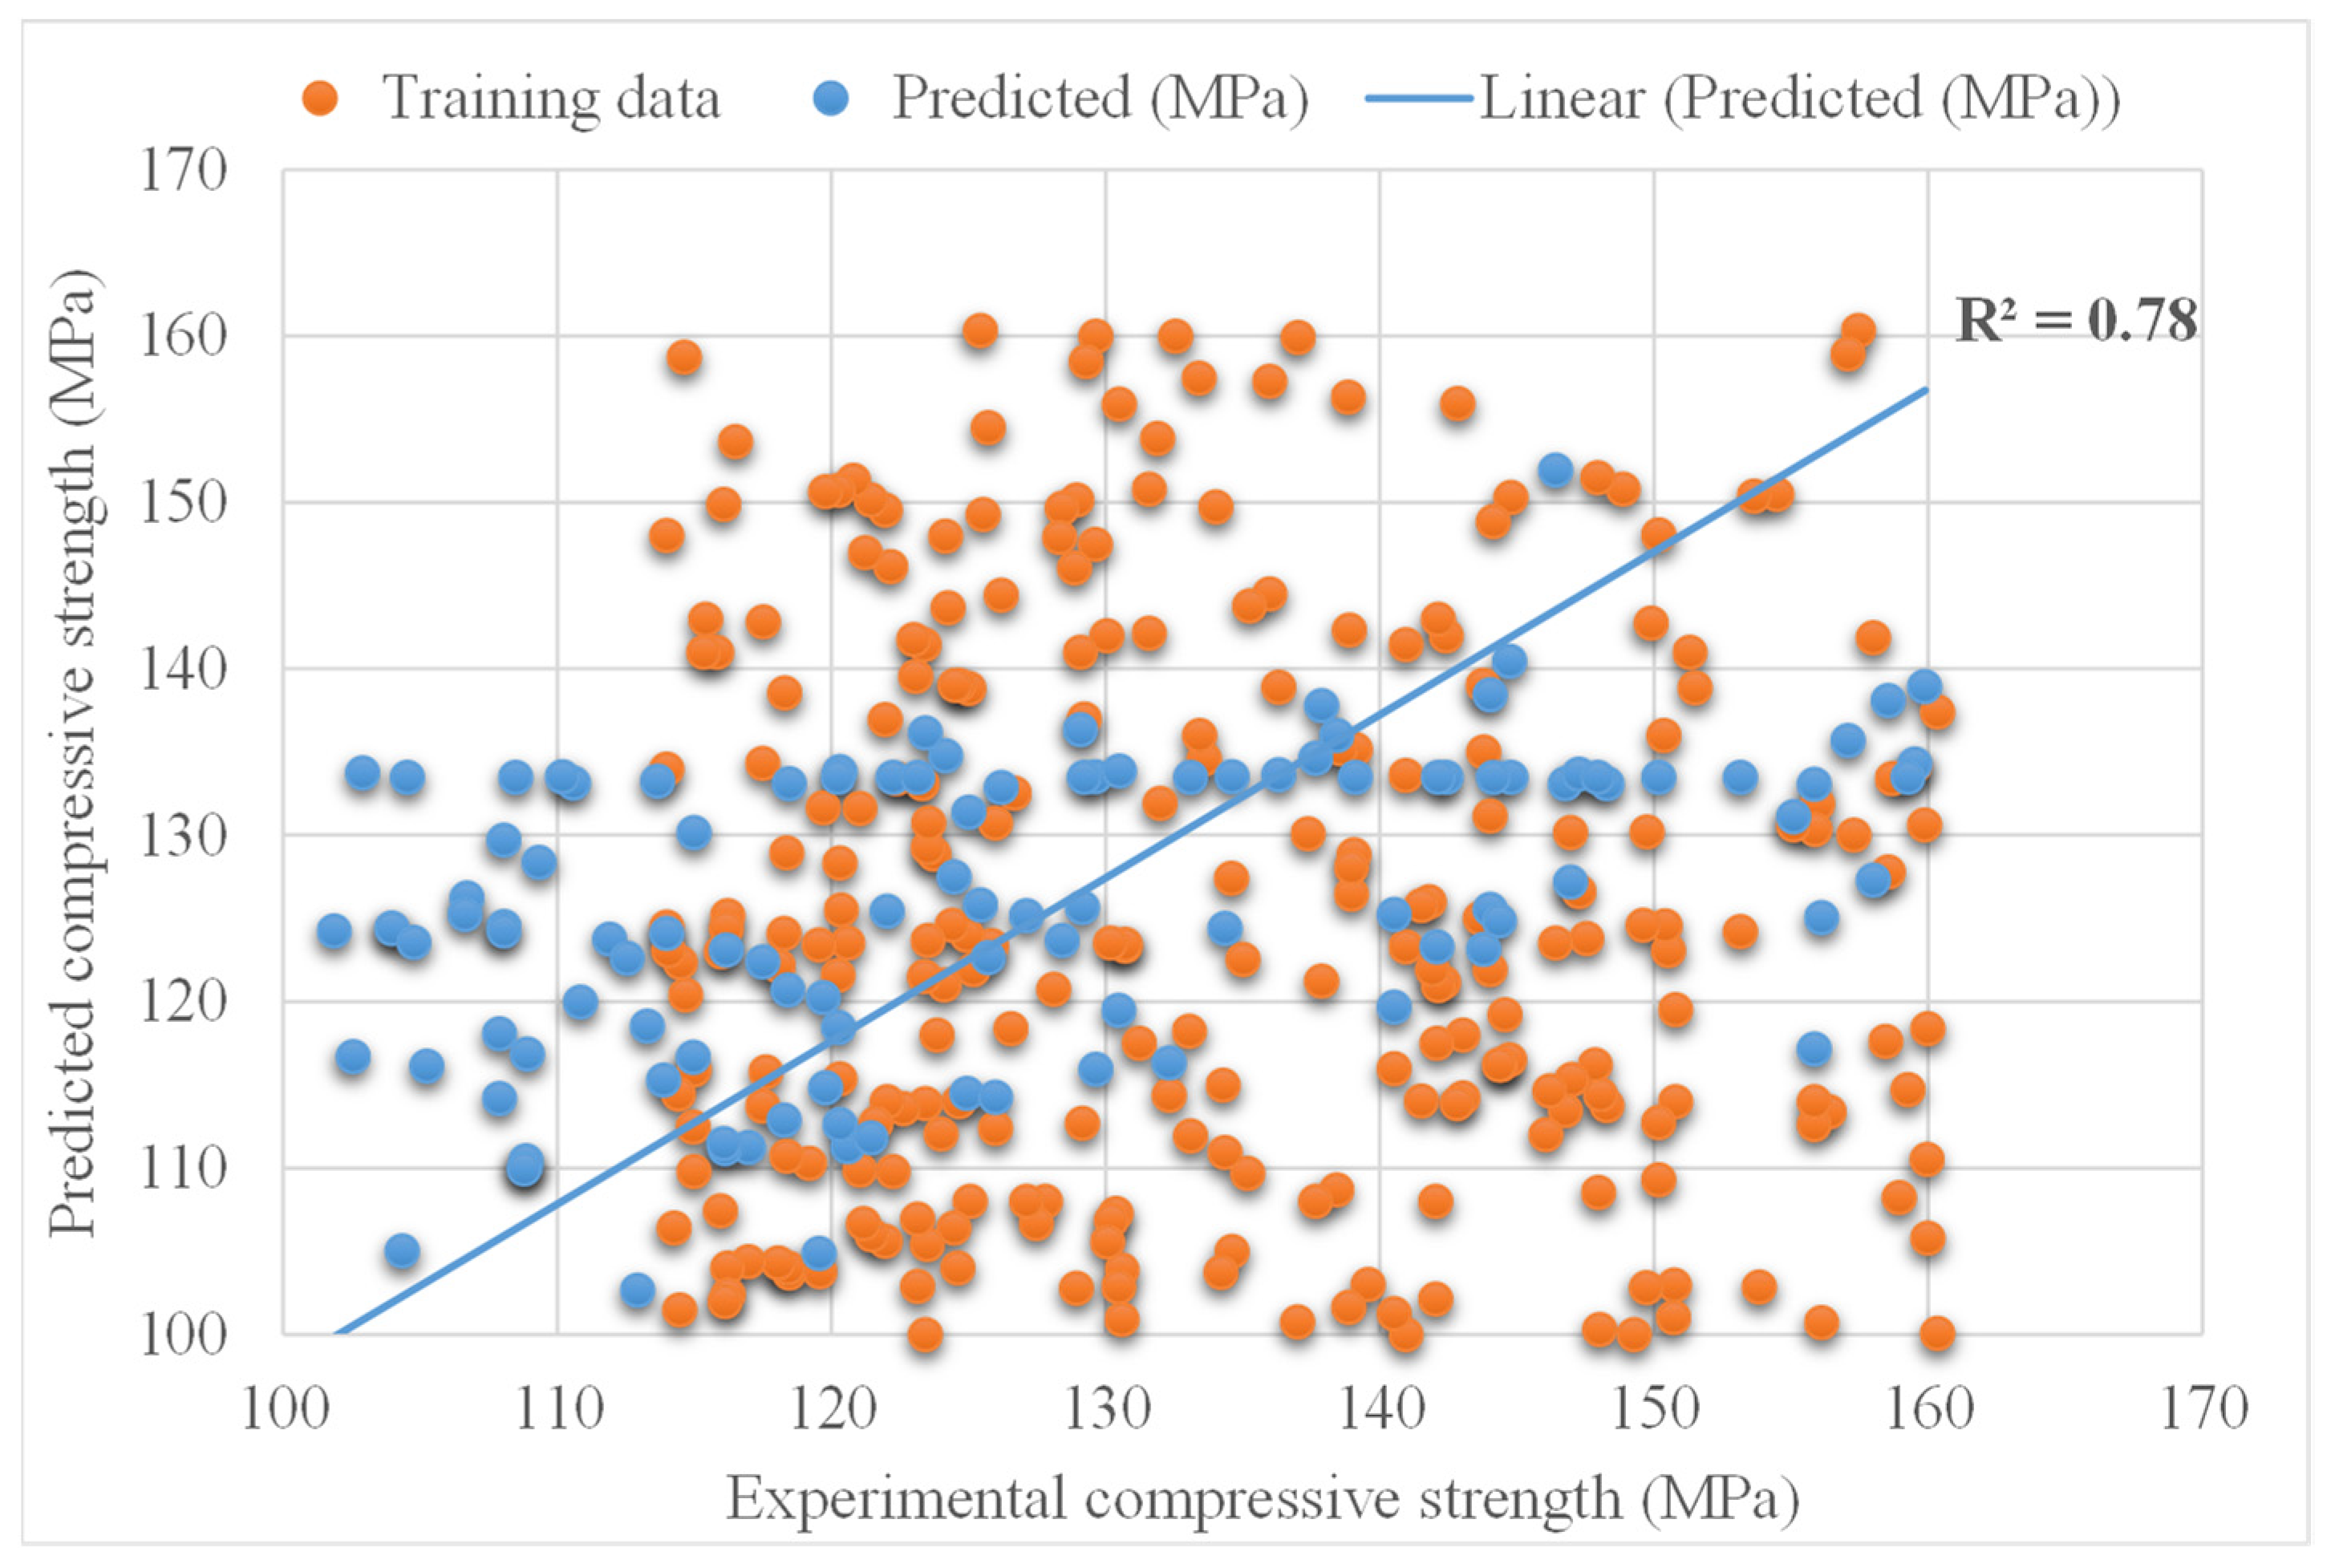
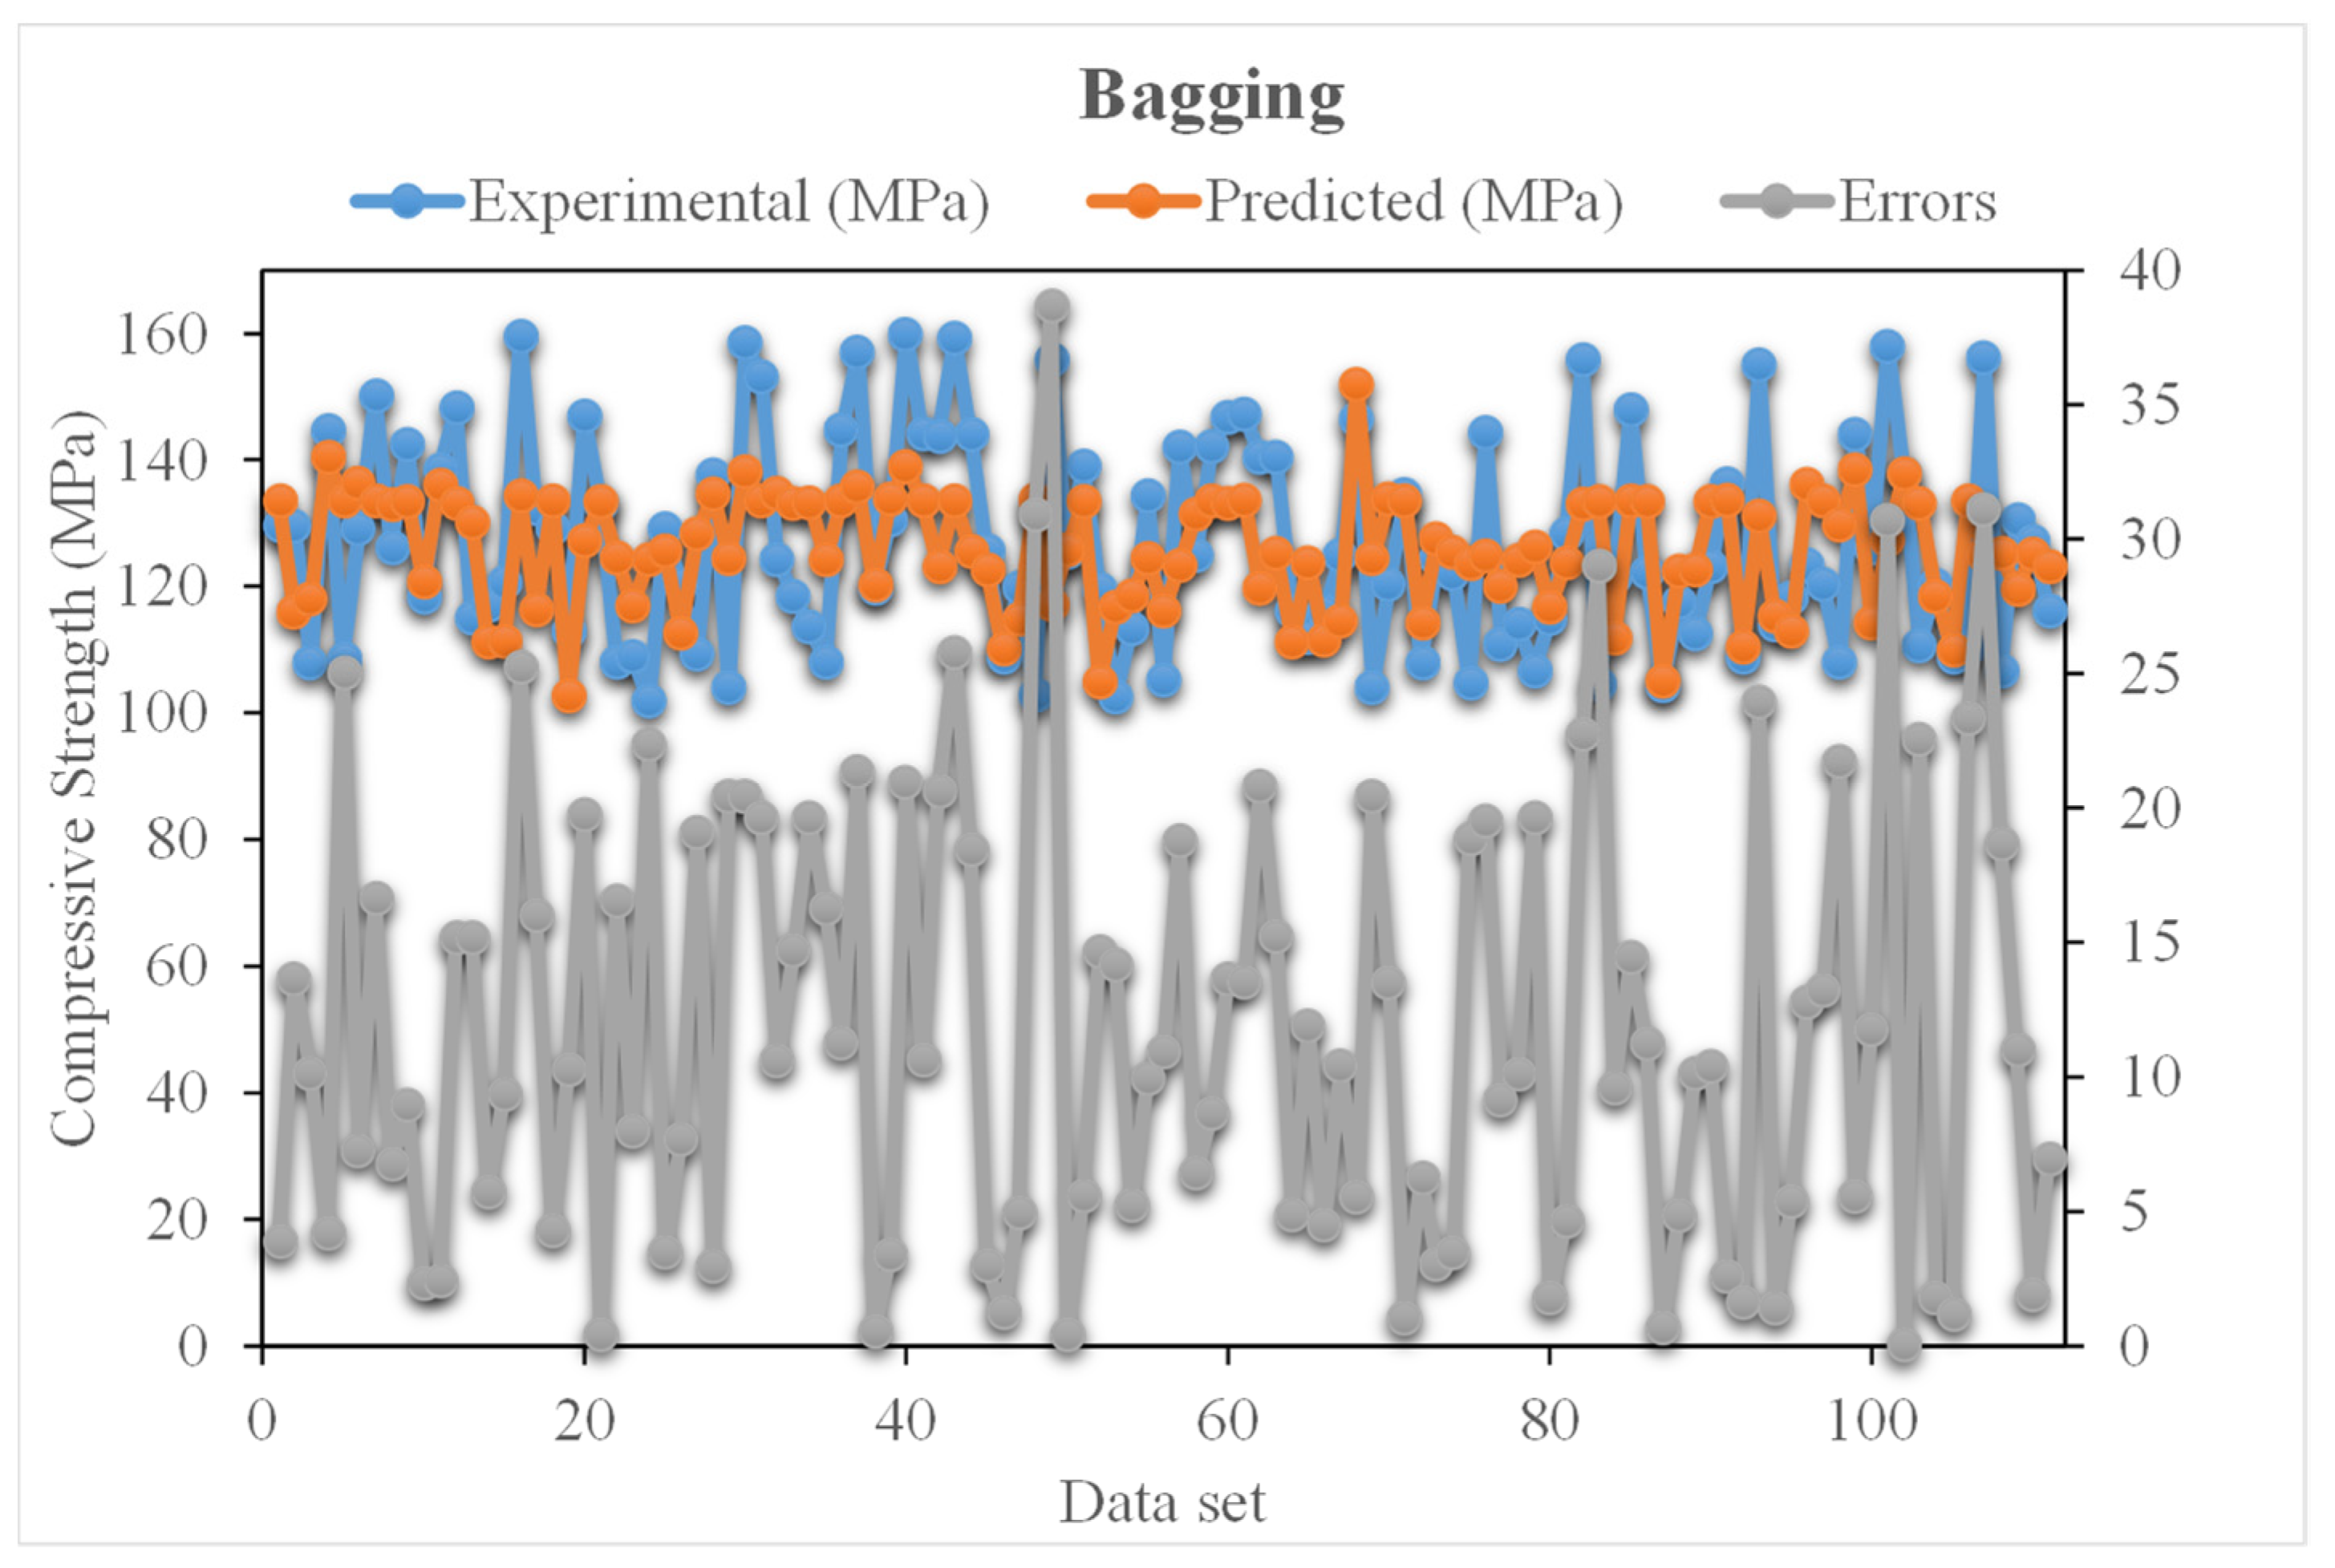
5.3. Bagging
5.4. Comparison of All Models
6. Enhanced Explainability of ML Models
7. Conclusions
- As evidenced by the R2 value of 0.90, the XGBoost method was able to accurately estimate the compressive strength of UHSC from its actual data. However, the ensembled machine learning models, i.e., AdaBoost and Bagging with R2 values of 0.82 and 0.78, predicted unacceptable findings for the compressive strength of UHSC.
- A total of twenty sub-models, ranging from 10 to 200 estimators, were utilized to optimize the anticipated compressive strength of UHSC. An ensembled model XGBoost was able to accurately forecast the compressive strength more effectively than the other models.
- XGBoost models demonstrated lower MAE and RMSE, with a higher R2 value for compressive strength of UHSC, compared to the other model in the k-fold validation results. XGBoost was proven to have the best compressive strength prediction accuracy for UHSC.
- The model’s performance was evaluated using statistical measures such as MAE and RMSE. However, XGBoost projected superior results, with less error and a higher coefficient of determination for evaluating the compressive strength of UHSC.
- The XGBoost is the best method for predicting the compressive strength of UHSC utilizing soft computing approaches.
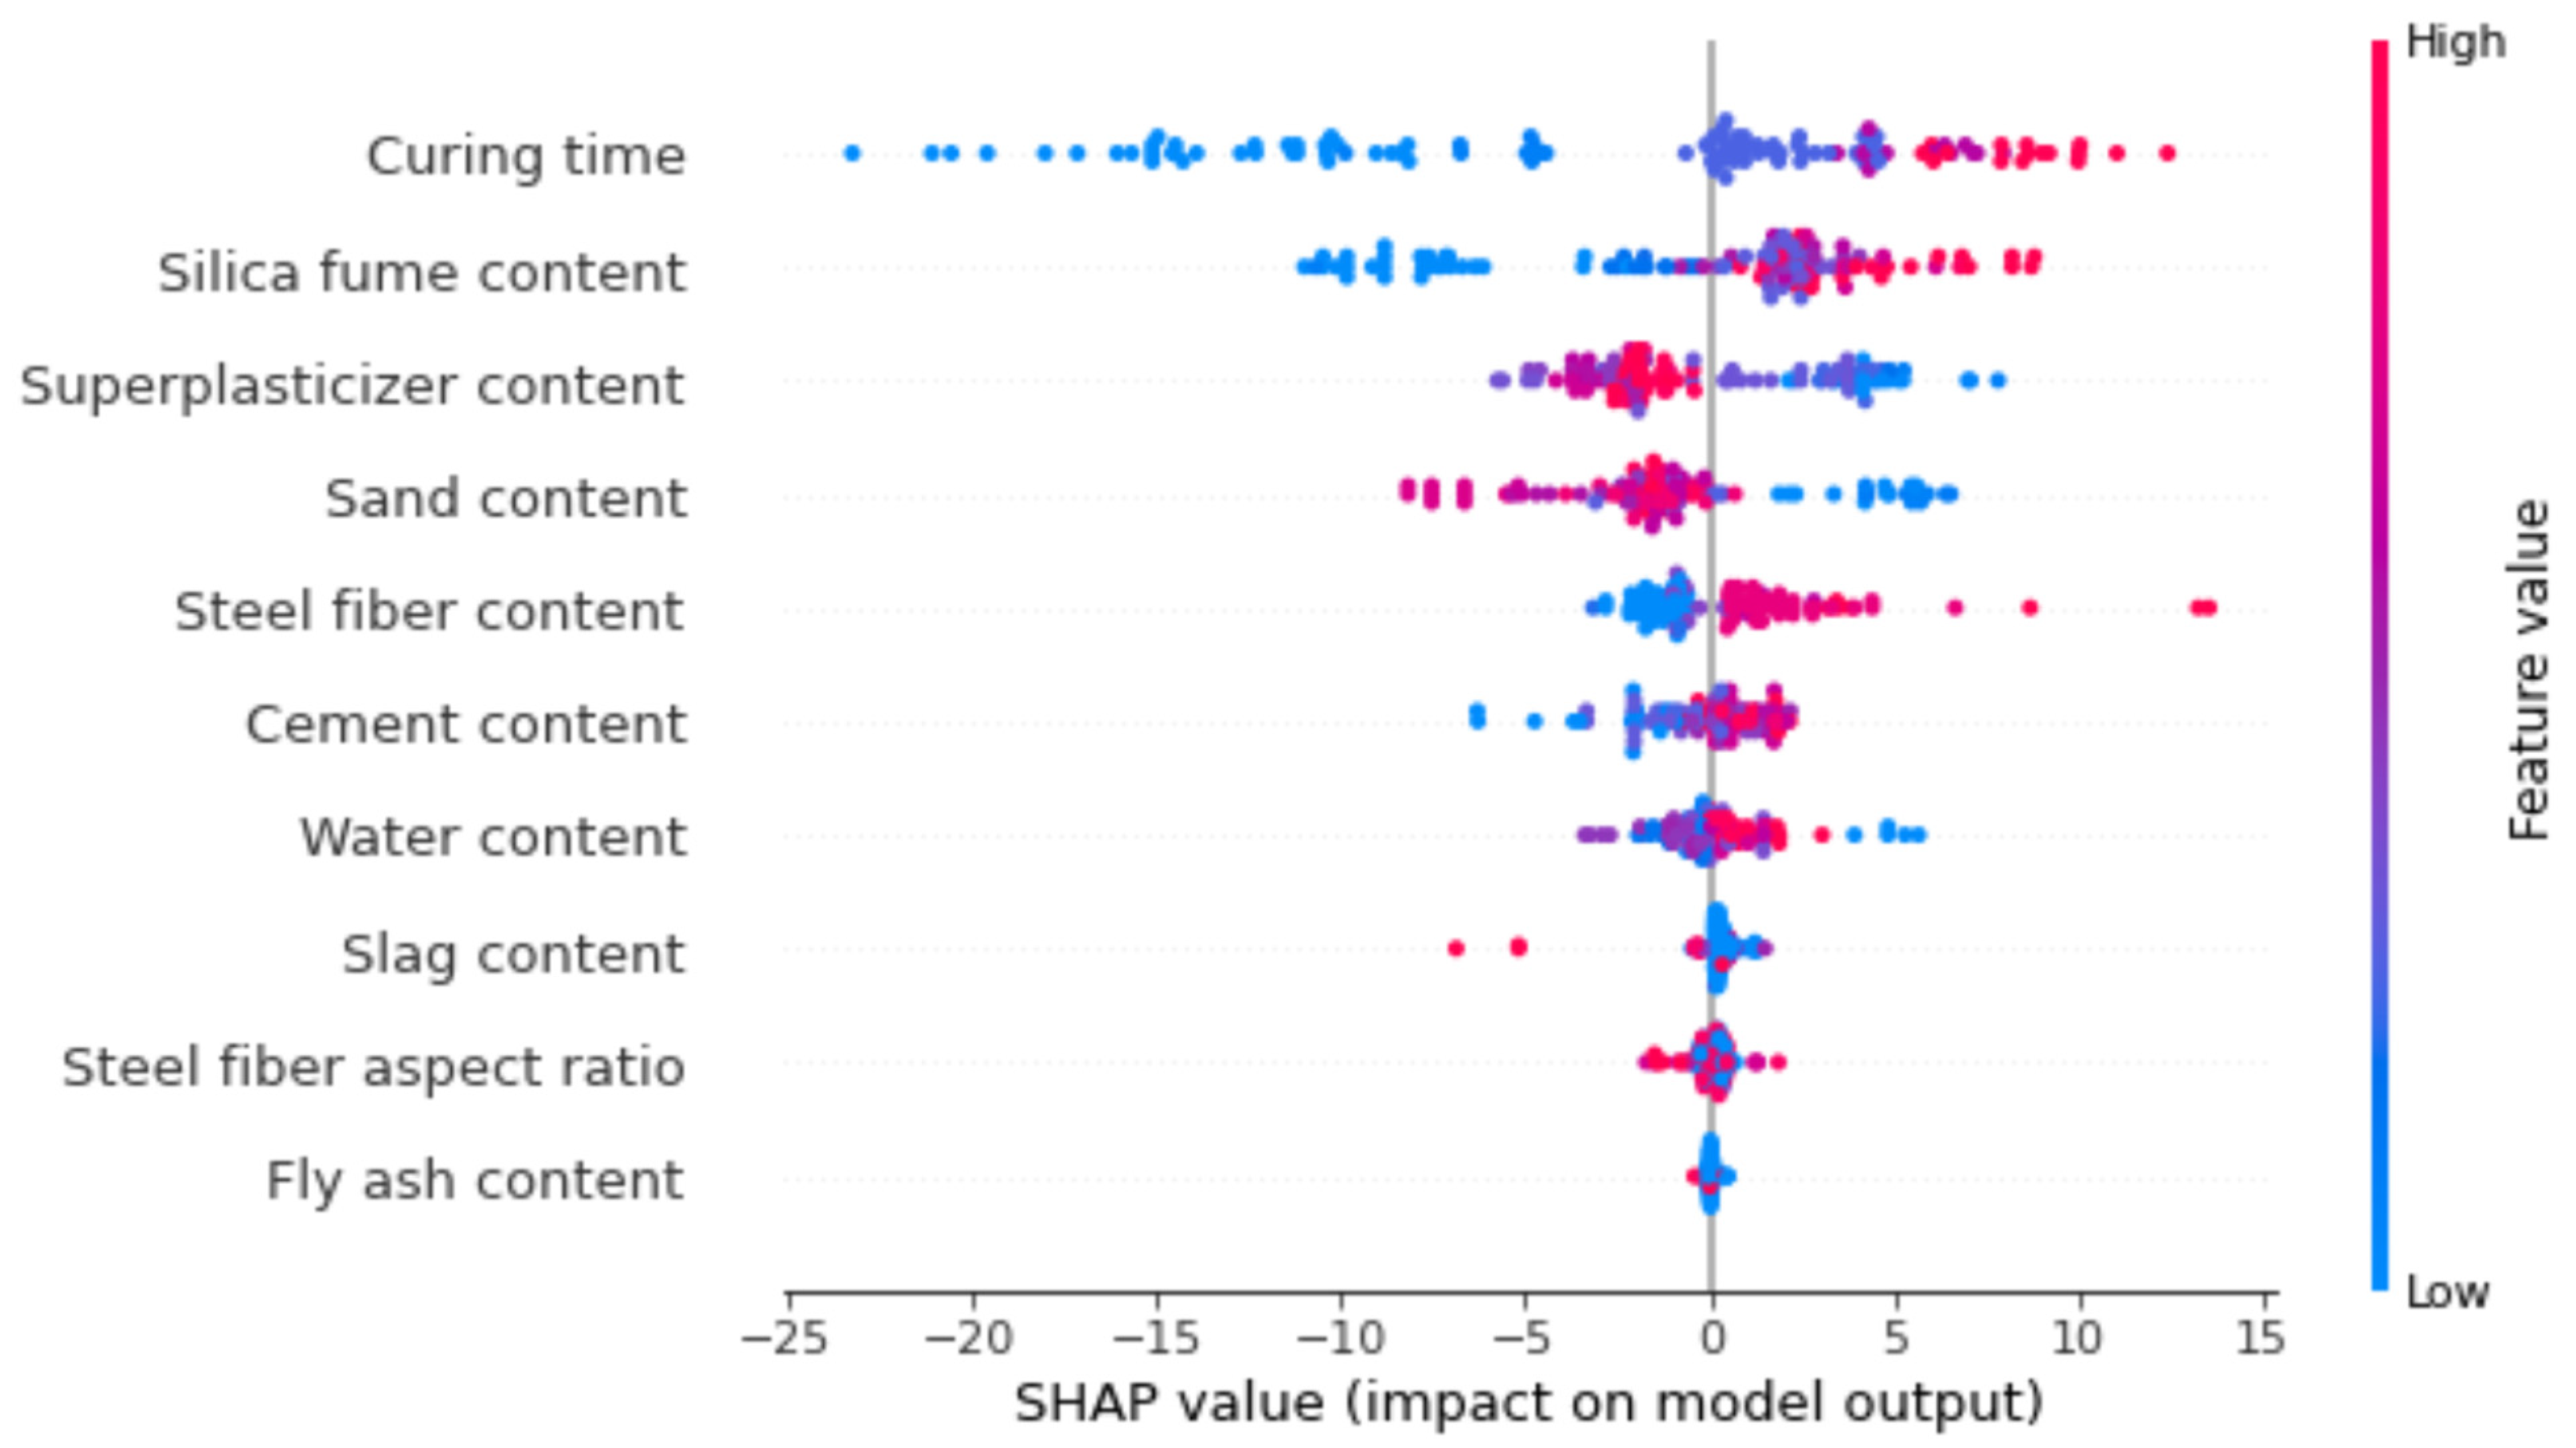
- Curing time has highest impact on UHSC compressive strength estimation, followed by silica fume, sand and super-plasticizer content, as depicted by SHAP analysis. Whereas, the compressive strength of UHSC with fly ash content is the least influential.
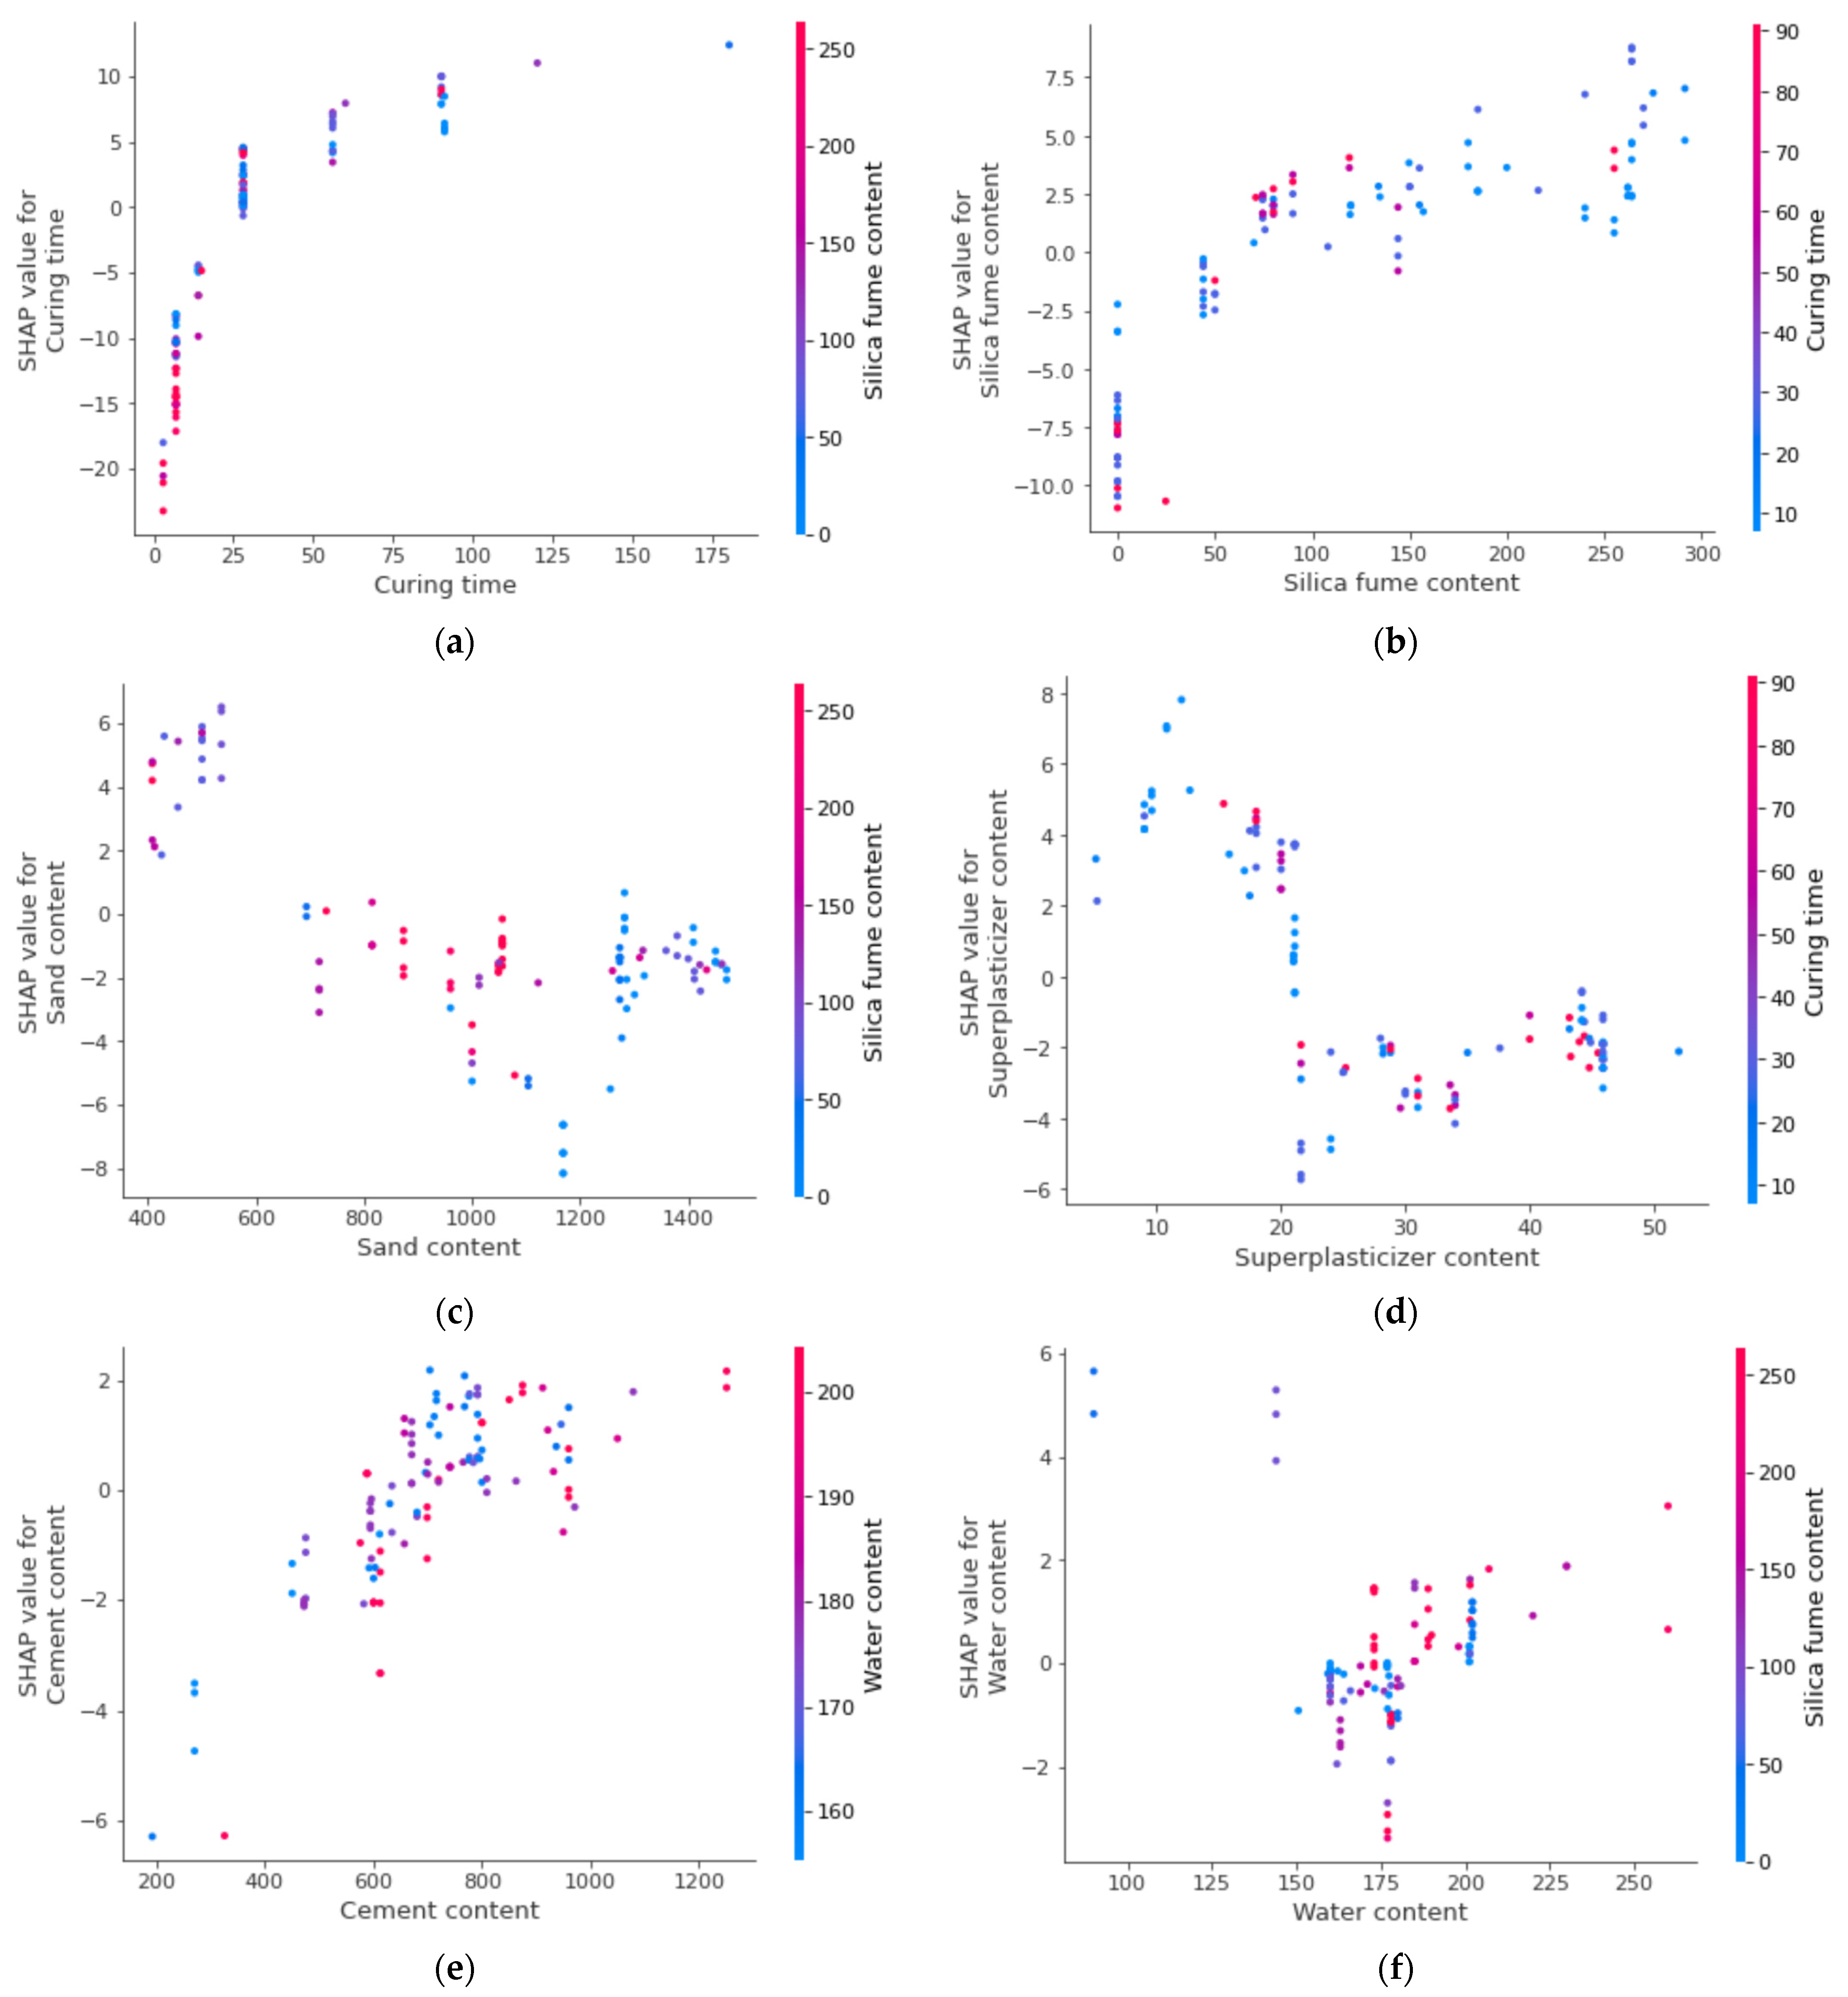
- The feature interaction plot showed that curing time, cement content, and silica fume positively influence UHSC compressive strength.
Author Contributions
Funding
Institutional Review Board Statement
Informed Consent Statement
Data Availability Statement
Conflicts of Interest
References
- Akhnoukh, A.K.; Buckhalter, C. Ultra-high-performance concrete: Constituents, mechanical properties, applications and current challenges. Case Stud. Constr. Mater. 2021, 15, e00559. [Google Scholar] [CrossRef]
- Fan, L.; Meng, W.; Teng, L.; Khayat, K.H. Effect of steel fibers with galvanized coatings on corrosion of steel bars embedded in UHPC. Compos. Part B Eng. 2019, 177, 107445. [Google Scholar] [CrossRef]
- Pyo, S.; Tafesse, M.; Kim, H.; Kim, H.-K. Effect of chloride content on mechanical properties of ultra high performance concrete. Cem. Concr. Compos. 2017, 84, 175–187. [Google Scholar] [CrossRef]
- Xu, M.; Bao, Y.; Wu, K.; Xia, T.; Clack, H.L.; Shi, H.; Li, V.C. Influence of TiO2 incorporation methods on NOx abatement in Engineered Cementitious Composites. Constr. Build. Mater. 2019, 221, 375–383. [Google Scholar] [CrossRef]
- Li, P.; Yu, Q.; Brouwers, H. Effect of coarse basalt aggregates on the properties of Ultra-high Performance Concrete (UHPC). Constr. Build. Mater. 2018, 170, 649–659. [Google Scholar] [CrossRef]
- Meng, W.; Khayat, K.H. Effect of graphite nanoplatelets and carbon nanofibers on rheology, hydration, shrinkage, mechanical properties, and microstructure of UHPC. Cem. Concr. Res. 2018, 105, 64–71. [Google Scholar] [CrossRef]
- Meng, W.; Yao, Y.; Mobasher, B.; Khayat, K.H. Effects of loading rate and notch-to-depth ratio of notched beams on flexural performance of ultra-high-performance concrete. Cem. Concr. Compos. 2017, 83, 349–359. [Google Scholar] [CrossRef]
- Cao, M.; Mao, Y.; Khan, M.; Si, W.; Shen, S. Different testing methods for assessing the synthetic fiber distribution in cement-based composites. Constr. Build. Mater. 2018, 184, 128–142. [Google Scholar] [CrossRef]
- Khan, M.; Cao, M.; Hussain, A.; Chu, S. Effect of silica-fume content on performance of CaCO3 whisker and basalt fiber at matrix interface in cement-based composites. Constr. Build. Mater. 2021, 300, 124046. [Google Scholar] [CrossRef]
- Arshad, S.; Sharif, M.B.; Irfan-ul-Hassan, M.; Khan, M.; Zhang, J.-L. Efficiency of supplementary cementitious materials and natural fiber on mechanical performance of concrete. Arab. J. Sci. Eng. 2020, 45, 8577–8589. [Google Scholar] [CrossRef]
- Xie, C.; Cao, M.; Guan, J.; Liu, Z.; Khan, M. Improvement of boundary effect model in multi-scale hybrid fibers reinforced cementitious composite and prediction of its structural failure behavior. Compos. Part B Eng. 2021, 224, 109219. [Google Scholar] [CrossRef]
- Cao, M.; Khan, M. Effectiveness of multiscale hybrid fiber reinforced cementitious composites under single degree of freedom hydraulic shaking table. Struct. Concr. 2021, 22, 535–549. [Google Scholar] [CrossRef]
- Khan, U.A.; Jahanzaib, H.M.; Khan, M.; Ali, M. Improving the tensile energy absorption of high strength natural fiber reinforced concrete with fly-ash for bridge girders. In Key Engineering Materials; Trans Tech Publication: Stafa-Zurich, Switzerland, 2018; pp. 335–342. [Google Scholar]
- Khan, M.; Cao, M.; Ai, H.; Hussain, A. Basalt Fibers in Modified Whisker Reinforced Cementitious Composites. Period. Polytech. Civil Eng. 2022, 66, 344–354. [Google Scholar] [CrossRef]
- Zhang, N.; Yan, C.; Li, L.; Khan, M. Assessment of fiber factor for the fracture toughness of polyethylene fiber reinforced geopolymer. Constr. Build. Mater. 2022, 319, 126130. [Google Scholar] [CrossRef]
- Khan, M.; Ali, M. Improvement in concrete behavior with fly ash, silica-fume and coconut fibres. Constr. Build. Mater. 2019, 203, 174–187. [Google Scholar] [CrossRef]
- Khan, M.; Cao, M.; Chu, S.; Ali, M. Properties of hybrid steel-basalt fiber reinforced concrete exposed to different surrounding conditions. Constr. Build. Mater. 2022, 322, 126340. [Google Scholar] [CrossRef]
- Li, L.; Khan, M.; Bai, C.; Shi, K. Uniaxial tensile behavior, flexural properties, empirical calculation and microstructure of multi-scale fiber reinforced cement-based material at elevated temperature. Materials 2021, 14, 1827. [Google Scholar] [CrossRef]
- Khan, M.; Cao, M.; Xie, C.; Ali, M. Hybrid fiber concrete with different basalt fiber length and content. Struct. Concr. 2022, 23, 346–364. [Google Scholar] [CrossRef]
- Khan, M.; Cao, M.; Xie, C.; Ali, M. Effectiveness of hybrid steel-basalt fiber reinforced concrete under compression. Case Stud. Constr. Mater. 2022, 16, e00941. [Google Scholar] [CrossRef]
- Chaabene, W.B.; Flah, M.; Nehdi, M.L. Machine learning prediction of mechanical properties of concrete: Critical review. Constr. Build. Mater. 2020, 260, 119889. [Google Scholar] [CrossRef]
- Castelli, M.; Vanneschi, L.; Silva, S. Prediction of high performance concrete strength using genetic programming with geometric semantic genetic operators. Expert Syst. Appl. 2013, 40, 6856–6862. [Google Scholar] [CrossRef]
- Ramadan Suleiman, A.; Nehdi, M.L. Modeling self-healing of concrete using hybrid genetic algorithm–artificial neural network. Materials 2017, 10, 135. [Google Scholar] [CrossRef] [PubMed]
- Zhang, J.; Huang, Y.; Aslani, F.; Ma, G.; Nener, B. A hybrid intelligent system for designing optimal proportions of recycled aggregate concrete. J. Clean. Prod. 2020, 273, 122922. [Google Scholar] [CrossRef]
- Marani, A.; Nehdi, M.L. Machine learning prediction of compressive strength for phase change materials integrated cementitious composites. Constr. Build. Mater. 2020, 265, 120286. [Google Scholar] [CrossRef]
- Han, Q.; Gui, C.; Xu, J.; Lacidogna, G. A generalized method to predict the compressive strength of high-performance concrete by improved random forest algorithm. Constr. Build. Mater. 2019, 226, 734–742. [Google Scholar] [CrossRef]
- Xu, Y.; Ahmad, W.; Ahmad, A.; Ostrowski, K.A.; Dudek, M.; Aslam, F.; Joyklad, P. Computation of High-Performance Concrete Compressive Strength Using Standalone and Ensembled Machine Learning Techniques. Materials 2021, 14, 7034. [Google Scholar] [CrossRef]
- Lauritsen, S.M.; Kristensen, M.; Olsen, M.V.; Larsen, M.S.; Lauritsen, K.M.; Jørgensen, M.J.; Lange, J.; Thiesson, B. Explainable artificial intelligence model to predict acute critical illness from electronic health records. Nat. Commun. 2020, 11, 3852. [Google Scholar] [CrossRef]
- Johnsen, P.V.; Riemer-Sørensen, S.; DeWan, A.T.; Cahill, M.E.; Langaas, M. A new method for exploring gene–gene and gene–environment interactions in GWAS with tree ensemble methods and SHAP values. BMC Bioinform. 2021, 22, 230. [Google Scholar] [CrossRef]
- Salami, B.A.; Rahman, S.M.; Oyehan, T.A.; Maslehuddin, M.; Al Dulaijan, S.U. Ensemble machine learning model for corrosion initiation time estimation of embedded steel reinforced self-compacting concrete. Measurement 2020, 165, 108141. [Google Scholar] [CrossRef]
- Liu, K.; Dai, Z.; Zhang, R.; Zheng, J.; Zhu, J.; Yang, X. Prediction of the sulfate resistance for recycled aggregate concrete based on ensemble learning algorithms. Constr. Build. Mater. 2022, 317, 125917. [Google Scholar] [CrossRef]
- Zhang, M.; Hao, S.; Hou, A. Study on the Intelligent Modeling of the Blade Aerodynamic Force in Compressors Based on Machine Learning. Mathematics 2021, 9, 476. [Google Scholar] [CrossRef]
- Wang, Q.; Ahmad, W.; Ahmad, A.; Aslam, F.; Mohamed, A.; Vatin, N.I. Application of Soft Computing Techniques to Predict the Strength of Geopolymer Composites. Polymers 2022, 14, 1074. [Google Scholar] [CrossRef] [PubMed]
- Wu, L.-Y.; Weng, S.-S. Ensemble Learning Models for Food Safety Risk Prediction. Sustainability 2021, 13, 12291. [Google Scholar] [CrossRef]
- Lundberg, S.M.; Lee, S.-I. A unified approach to interpreting model predictions. Adv. Neural Inf. Process. Syst. 2017, 30. [Google Scholar] [CrossRef]
- Shapley, L.S.; Roth, A.E. The Shapley Value: Essays in Honor of Lloyd S. Shapley; Cambridge University Press: Cambridge, UK, 1988. [Google Scholar]
- Cohen, S.; Ruppin, E.; Dror, G. Feature selection based on the shapley value. Other Words 2005, 1, 98Eqr. [Google Scholar]
- Molnar, C. Interpretable Machine Learning; Lulu. Com: Morrisville, NC, USA, 2020. [Google Scholar]
- Mahjoubi, S.; Bao, Y. The key material properties of ultra-high-performance concrete (UHPC). Mendeley Data V1 2021, 1. [Google Scholar] [CrossRef]
- Zhu, Y.; Ahmad, A.; Ahmad, W.; Vatin, N.I.; Mohamed, A.M.; Fathi, D. Predicting the Splitting Tensile Strength of Recycled Aggregate Concrete Using Individual and Ensemble Machine Learning Approaches. Crystals 2022, 12, 569. [Google Scholar] [CrossRef]
- Ahmad, A.; Ahmad, W.; Chaiyasarn, K.; Ostrowski, K.A.; Aslam, F.; Zajdel, P.; Joyklad, P. Prediction of geopolymer concrete compressive strength using novel machine learning algorithms. Polymers 2021, 13, 3389. [Google Scholar] [CrossRef]
- Ahmad, W.; Ahmad, A.; Ostrowski, K.A.; Aslam, F.; Joyklad, P.; Zajdel, P. Application of advanced machine learning approaches to predict the compressive strength of concrete containing supplementary cementitious materials. Materials 2021, 14, 5762. [Google Scholar] [CrossRef]
- Ahmad, A.; Ahmad, W.; Aslam, F.; Joyklad, P. Compressive strength prediction of fly ash-based geopolymer concrete via advanced machine learning techniques. Case Stud. Constr. Mater. 2021, 16, e00840. [Google Scholar] [CrossRef]
- Yuan, X.; Tian, Y.; Ahmad, W.; Ahmad, A.; Usanova, K.I.; Mohamed, A.M.; Khallaf, R. Machine Learning Prediction Models to Evaluate the Strength of Recycled Aggregate Concrete. Materials 2022, 15, 2823. [Google Scholar] [CrossRef] [PubMed]
- Shang, M.; Li, H.; Ahmad, A.; Ahmad, W.; Ostrowski, K.A.; Aslam, F.; Joyklad, P.; Majka, T.M. Predicting the Mechanical Properties of RCA-Based Concrete Using Supervised Machine Learning Algorithms. Materials 2022, 15, 647. [Google Scholar] [CrossRef] [PubMed]
- Mahjoubi, S.; Meng, W.; Bao, Y. Auto-tune learning framework for prediction of flowability, mechanical properties, and porosity of ultra-high-performance concrete (UHPC). Appl. Soft Comput. 2022, 115, 108182. [Google Scholar] [CrossRef]
- Mahjoubi, S.; Meng, W.; Bao, Y. Logic-guided neural network for predicting steel-concrete interfacial behaviors. Expert Syst. Appl. 2022, 198, 116820. [Google Scholar] [CrossRef]
- Mahjoubi, S.; Barhemat, R.; Guo, P.; Meng, W.; Bao, Y. Prediction and multi-objective optimization of mechanical, economical, and environmental properties for strain-hardening cementitious composites (SHCC) based on automated machine learning and metaheuristic algorithms. J. Clean. Prod. 2021, 329, 129665. [Google Scholar] [CrossRef]
- Lundberg, S.M.; Erion, G.; Chen, H.; DeGrave, A.; Prutkin, J.M.; Nair, B.; Katz, R.; Himmelfarb, J.; Bansal, N.; Lee, S.-I. Explainable AI for trees: From local explanations to global understanding. arXiv 2019, arXiv:1905.04610. [Google Scholar] [CrossRef]


| Techniques | MAE (MPa) | RMSE (MPa) | R2 |
|---|---|---|---|
| XGBoost | 6.4 | 7.6 | 0.90 |
| Adaboost | 11.0 | 13.1 | 0.82 |
| Bagging | 11.9 | 14.6 | 0.78 |
Publisher’s Note: MDPI stays neutral with regard to jurisdictional claims in published maps and institutional affiliations. |
© 2022 by the authors. Licensee MDPI, Basel, Switzerland. This article is an open access article distributed under the terms and conditions of the Creative Commons Attribution (CC BY) license (https://creativecommons.org/licenses/by/4.0/).
Share and Cite
Shen, Z.; Deifalla, A.F.; Kamiński, P.; Dyczko, A. Compressive Strength Evaluation of Ultra-High-Strength Concrete by Machine Learning. Materials 2022, 15, 3523. https://doi.org/10.3390/ma15103523
Shen Z, Deifalla AF, Kamiński P, Dyczko A. Compressive Strength Evaluation of Ultra-High-Strength Concrete by Machine Learning. Materials. 2022; 15(10):3523. https://doi.org/10.3390/ma15103523
Chicago/Turabian StyleShen, Zhongjie, Ahmed Farouk Deifalla, Paweł Kamiński, and Artur Dyczko. 2022. "Compressive Strength Evaluation of Ultra-High-Strength Concrete by Machine Learning" Materials 15, no. 10: 3523. https://doi.org/10.3390/ma15103523
APA StyleShen, Z., Deifalla, A. F., Kamiński, P., & Dyczko, A. (2022). Compressive Strength Evaluation of Ultra-High-Strength Concrete by Machine Learning. Materials, 15(10), 3523. https://doi.org/10.3390/ma15103523