
Prediction of Mechanical Properties of Fly-Ash/Slag-Based Geopolymer Concrete Using Ensemble and Non-Ensemble Machine-Learning Techniques

 , ,
, ,  , ,
, ,
Abstract
:1. Introduction
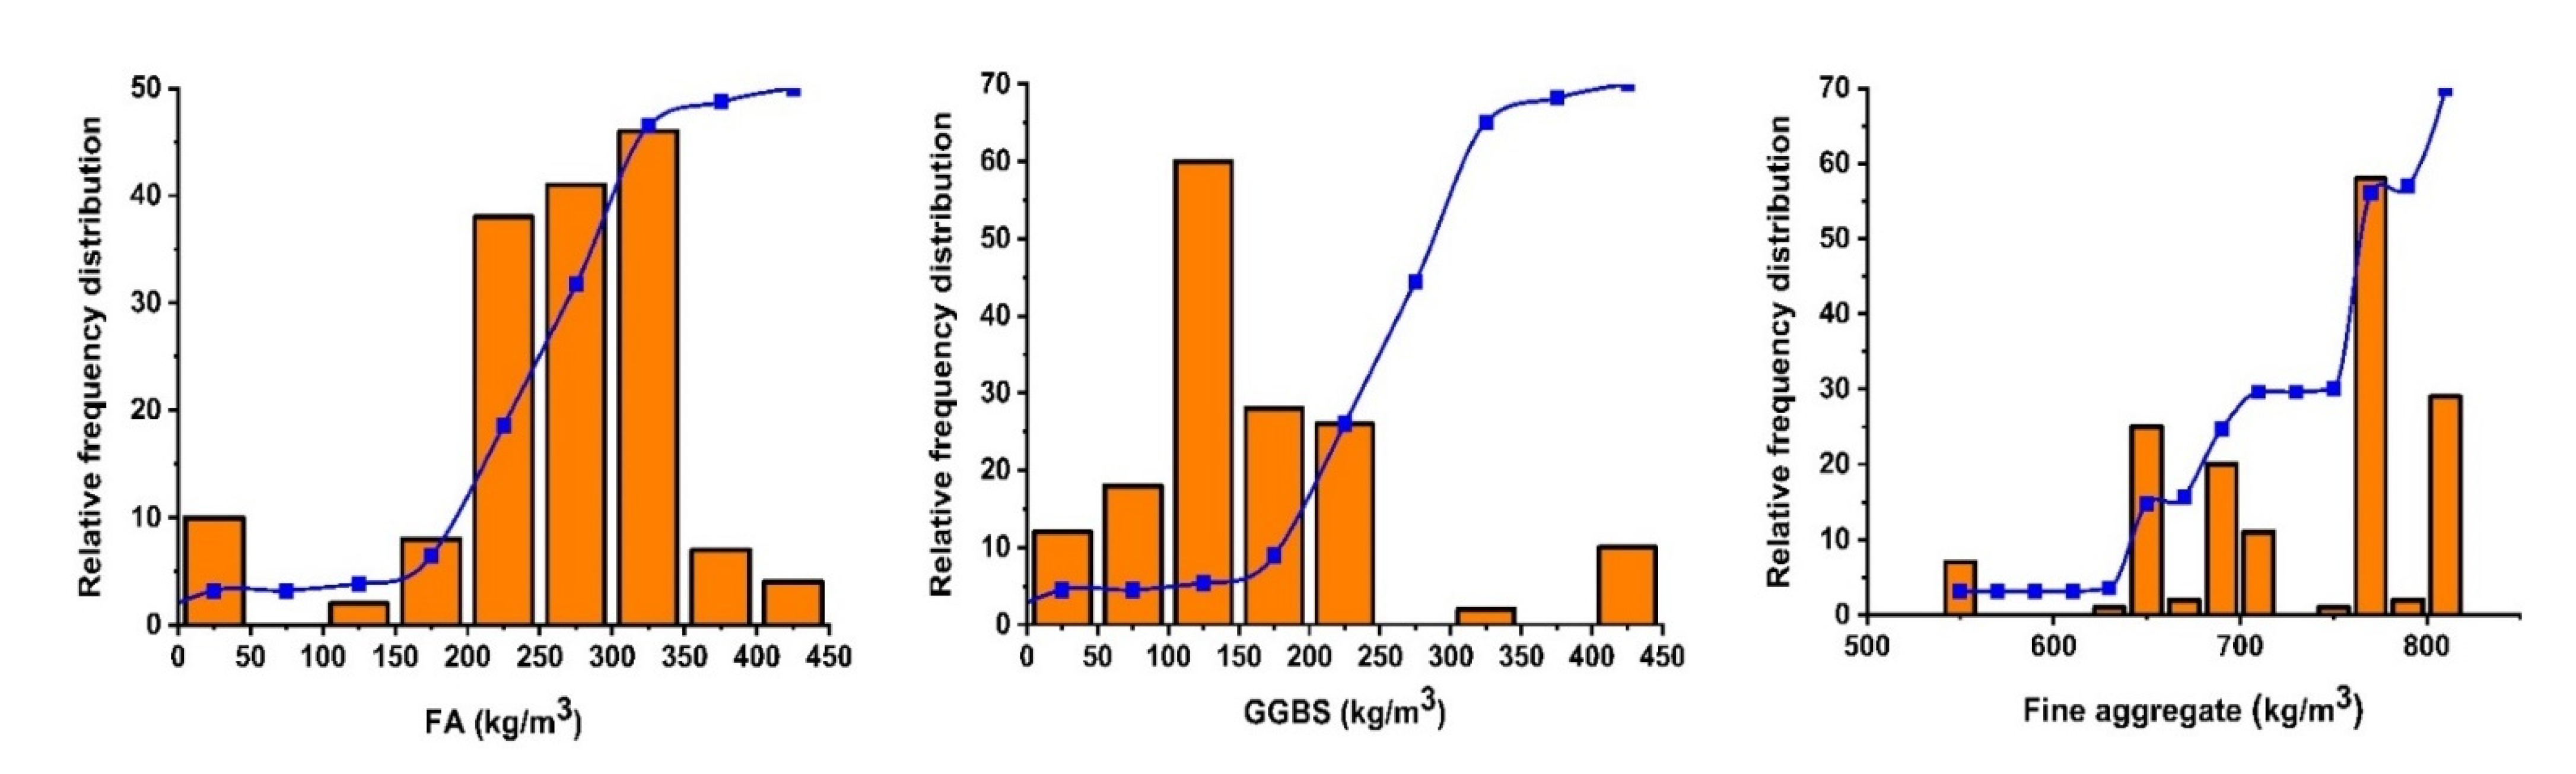
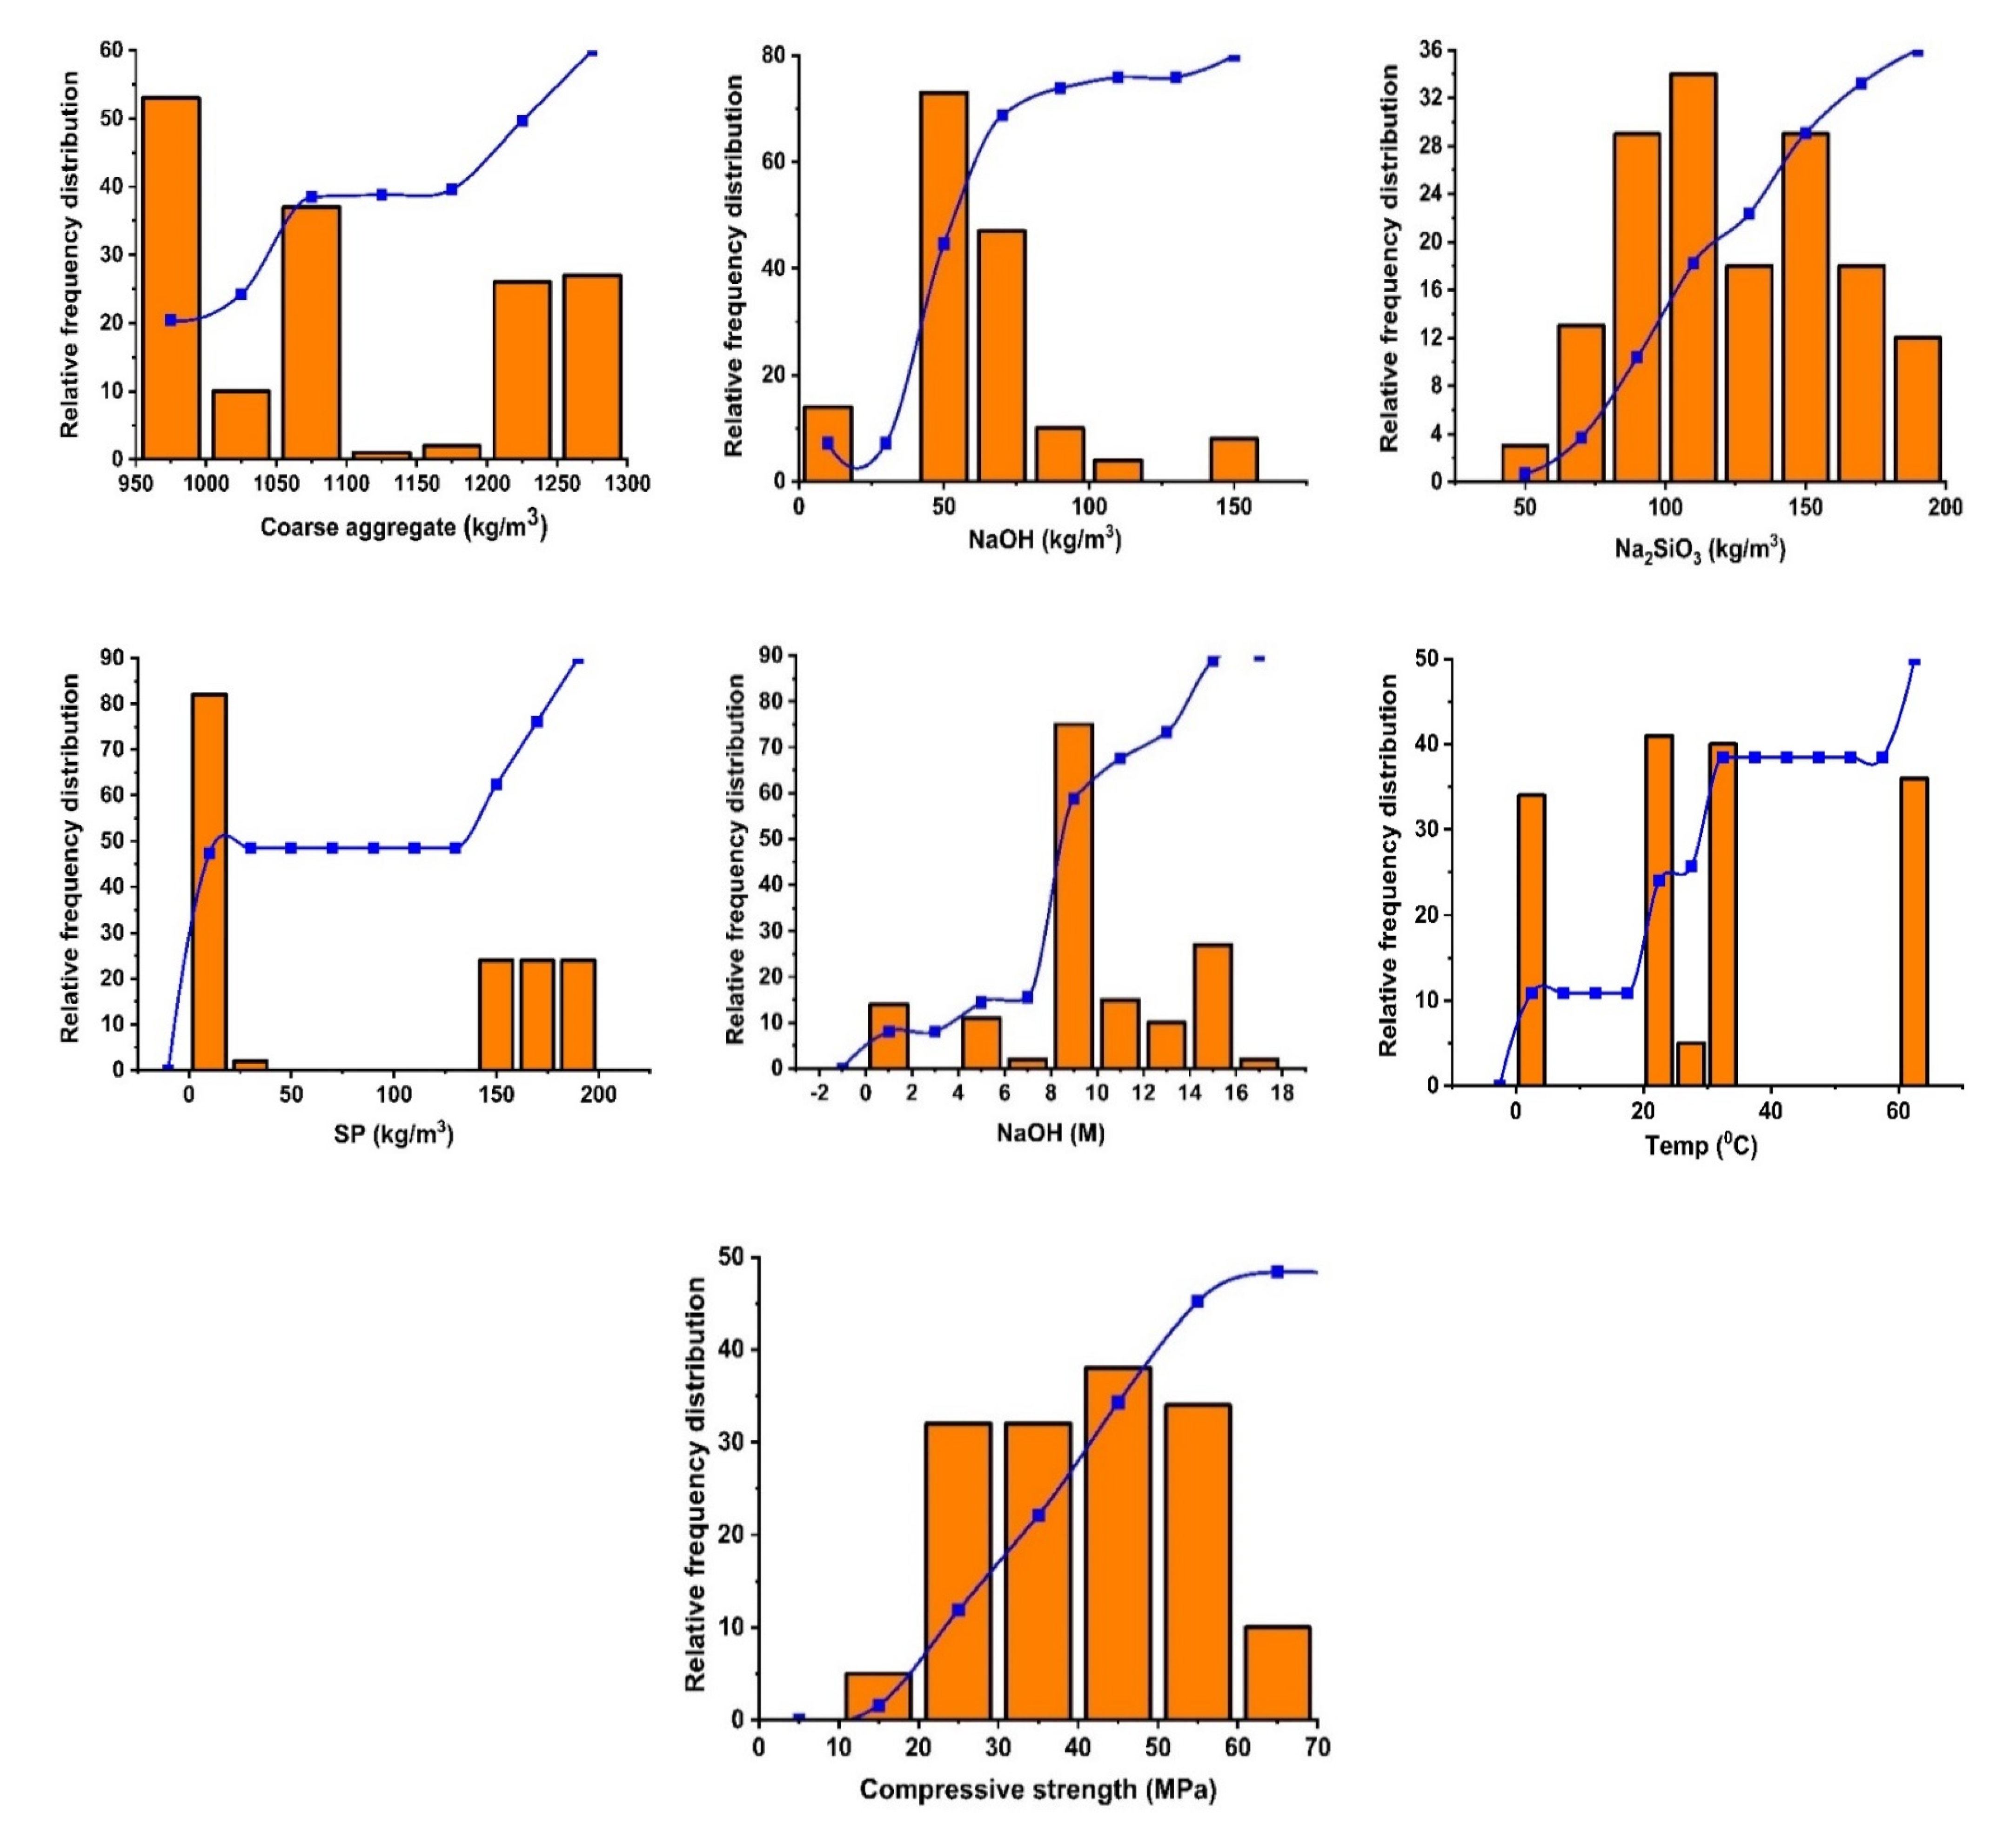
2. Database Presentation Using Python
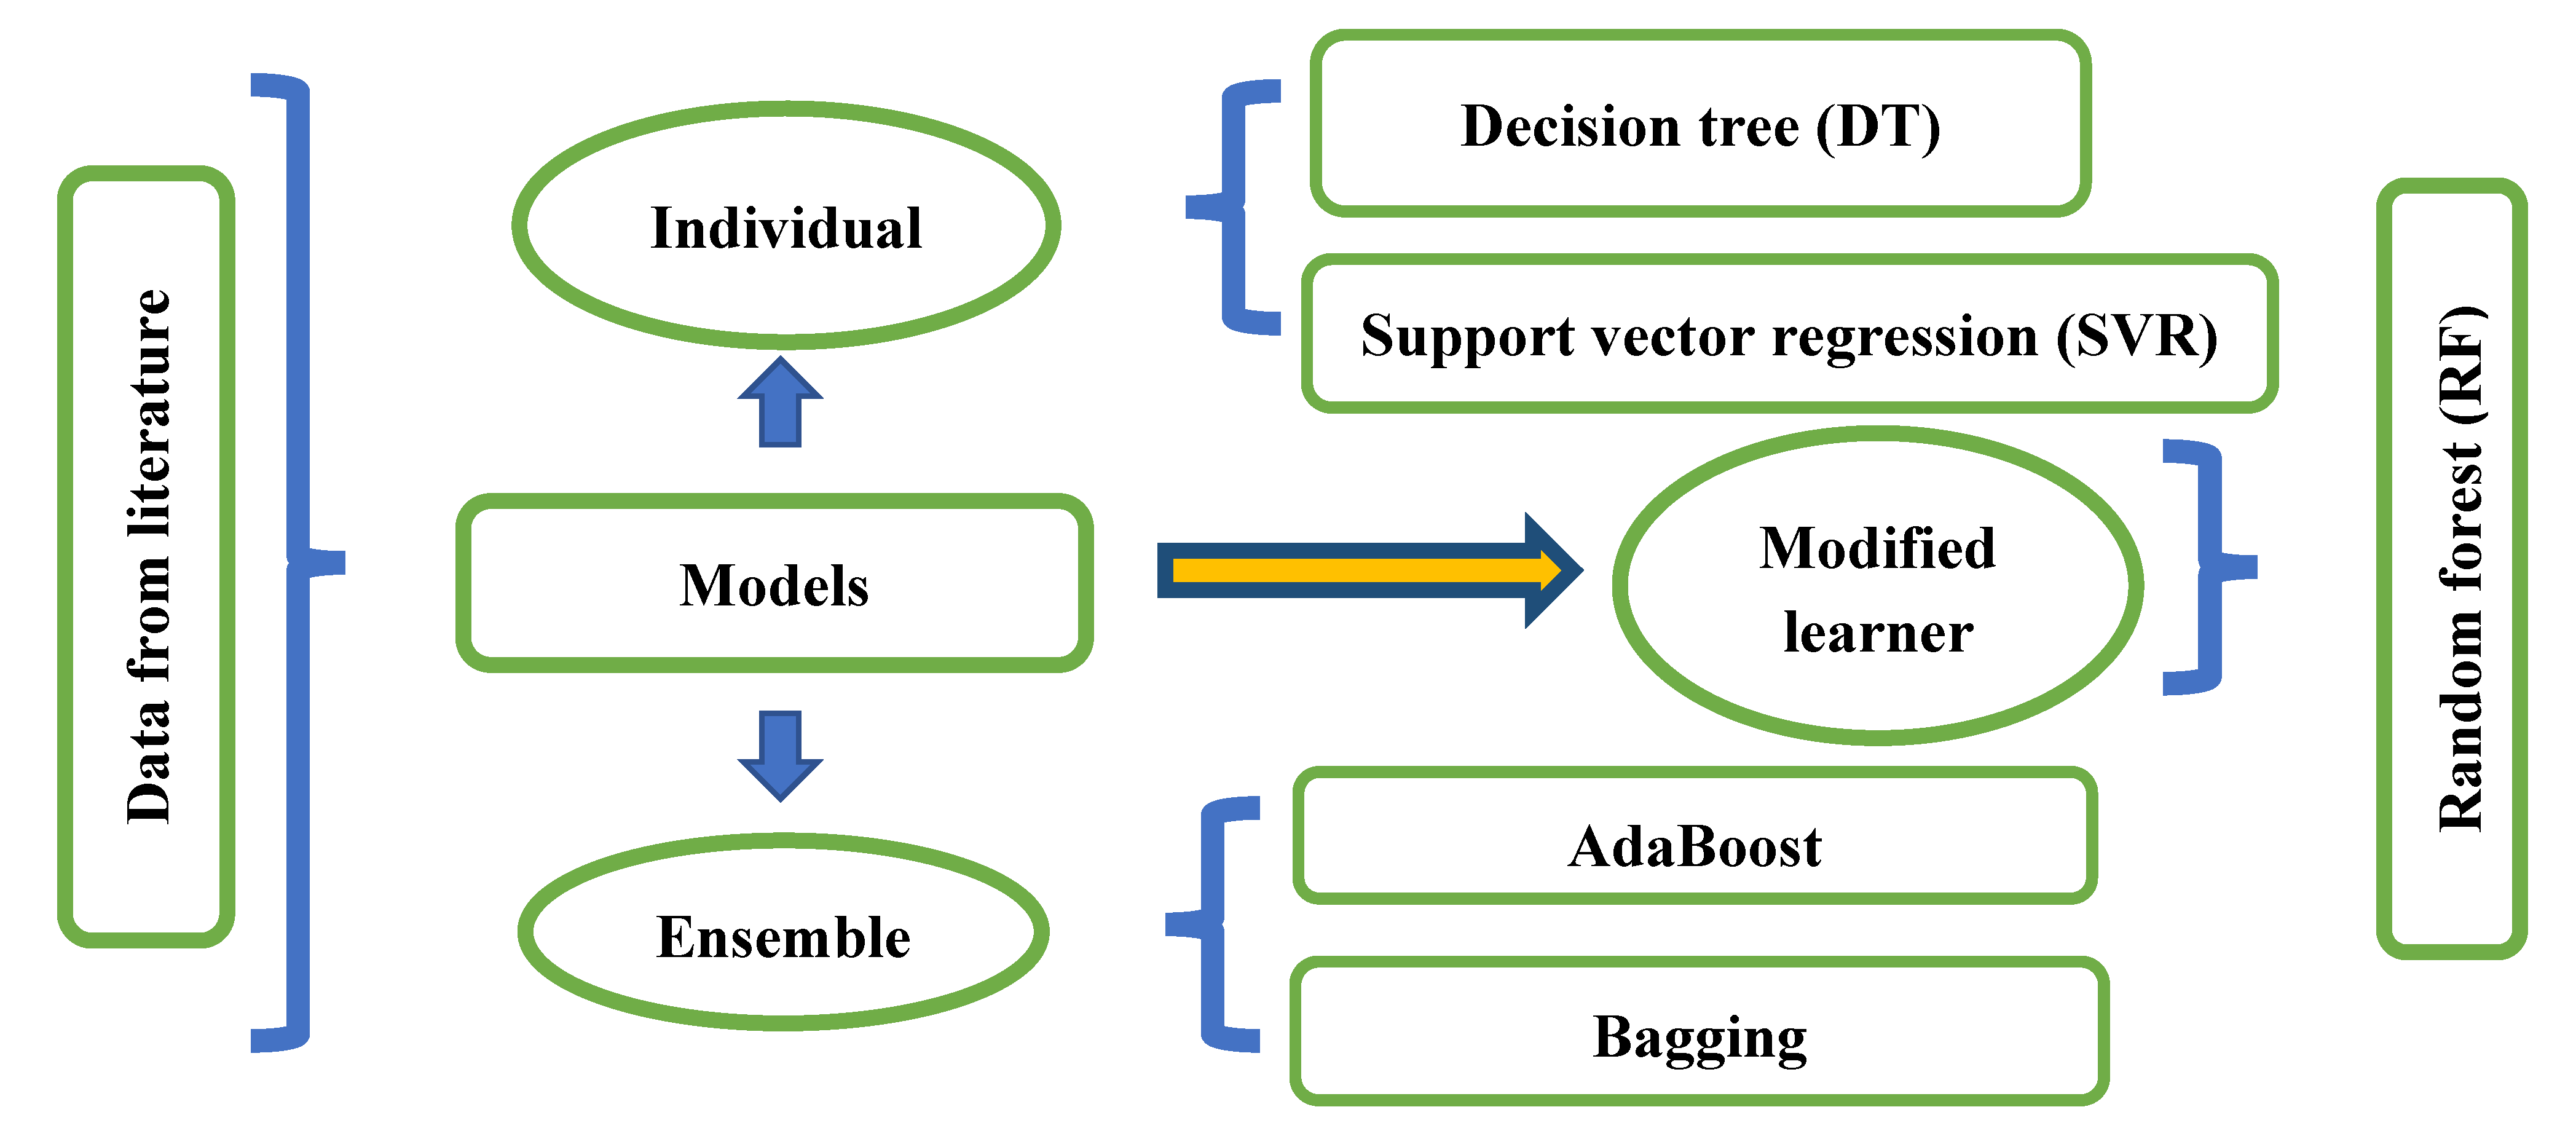
3. Methods
3.1. Decision Tree
3.2. Random Forest
- Approximately two-thirds of the entire dataset is picked at random for each forest and is symbolized by the data frame, a process known as bagging. In order to discover the optimum node-splitting technique, the predictor parameters are chosen at random.
- Out-of-bag error is assessed for all of the trees based on the data that are available. Then, the mistakes from each tree are added together in order to yield the final output for each tree.
- Each tree provides a statistical analysis based on regression, and the algorithm chooses the forest that receives the greatest number of votes. The votes might be 0 or 1. The fraction of 1 s is a prediction probability.
3.3. Support Vector Regression
3.4. Boosting and Bagging Ensemble Approaches
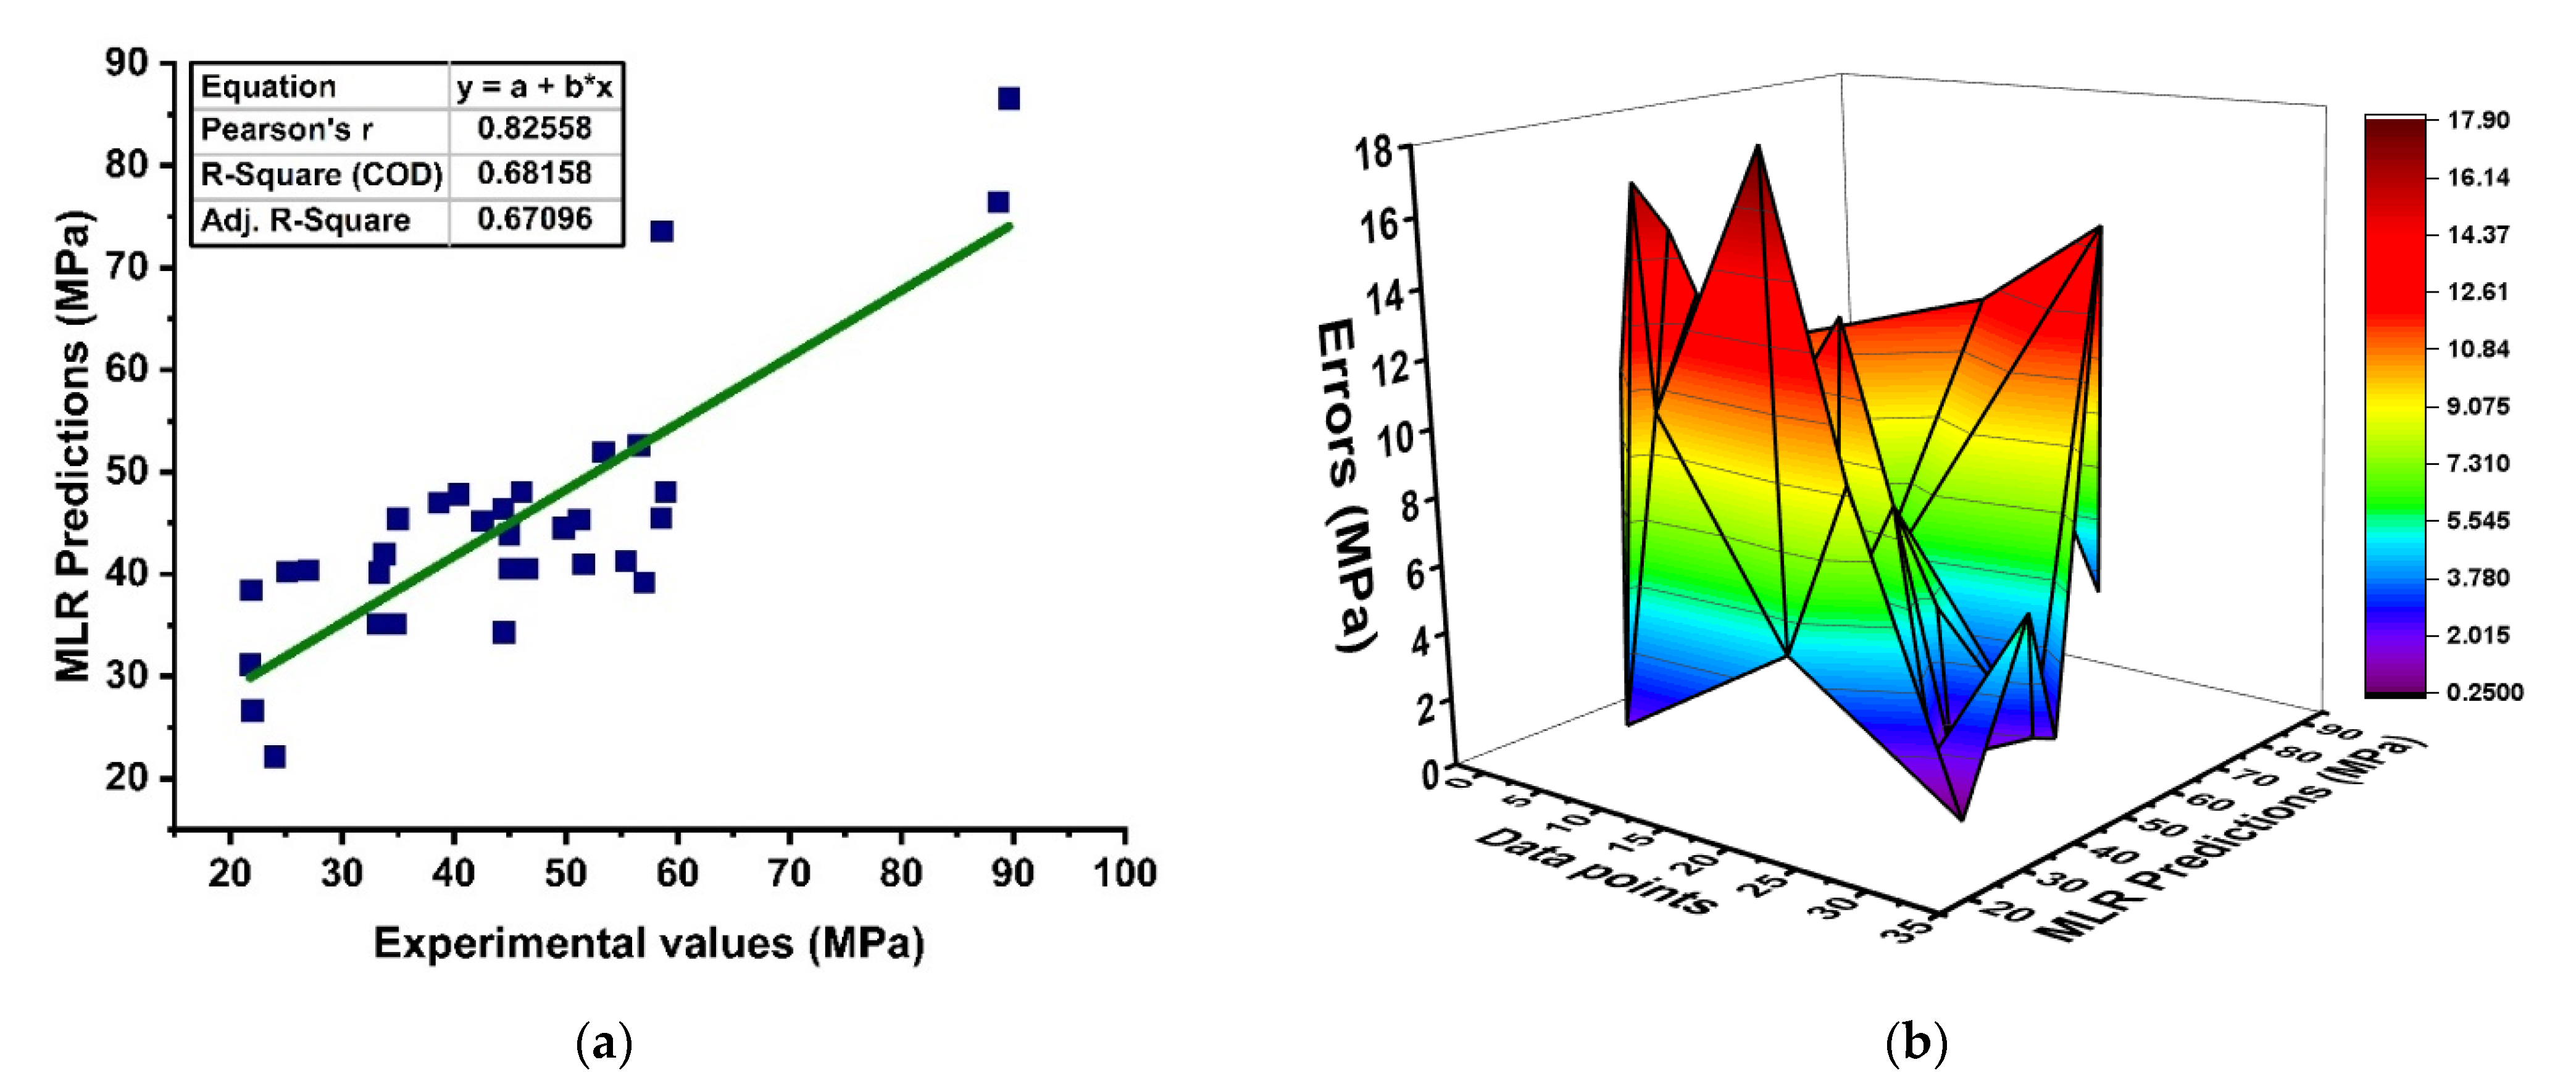
4. Model Assessment Using Statistical Measures
5. Result
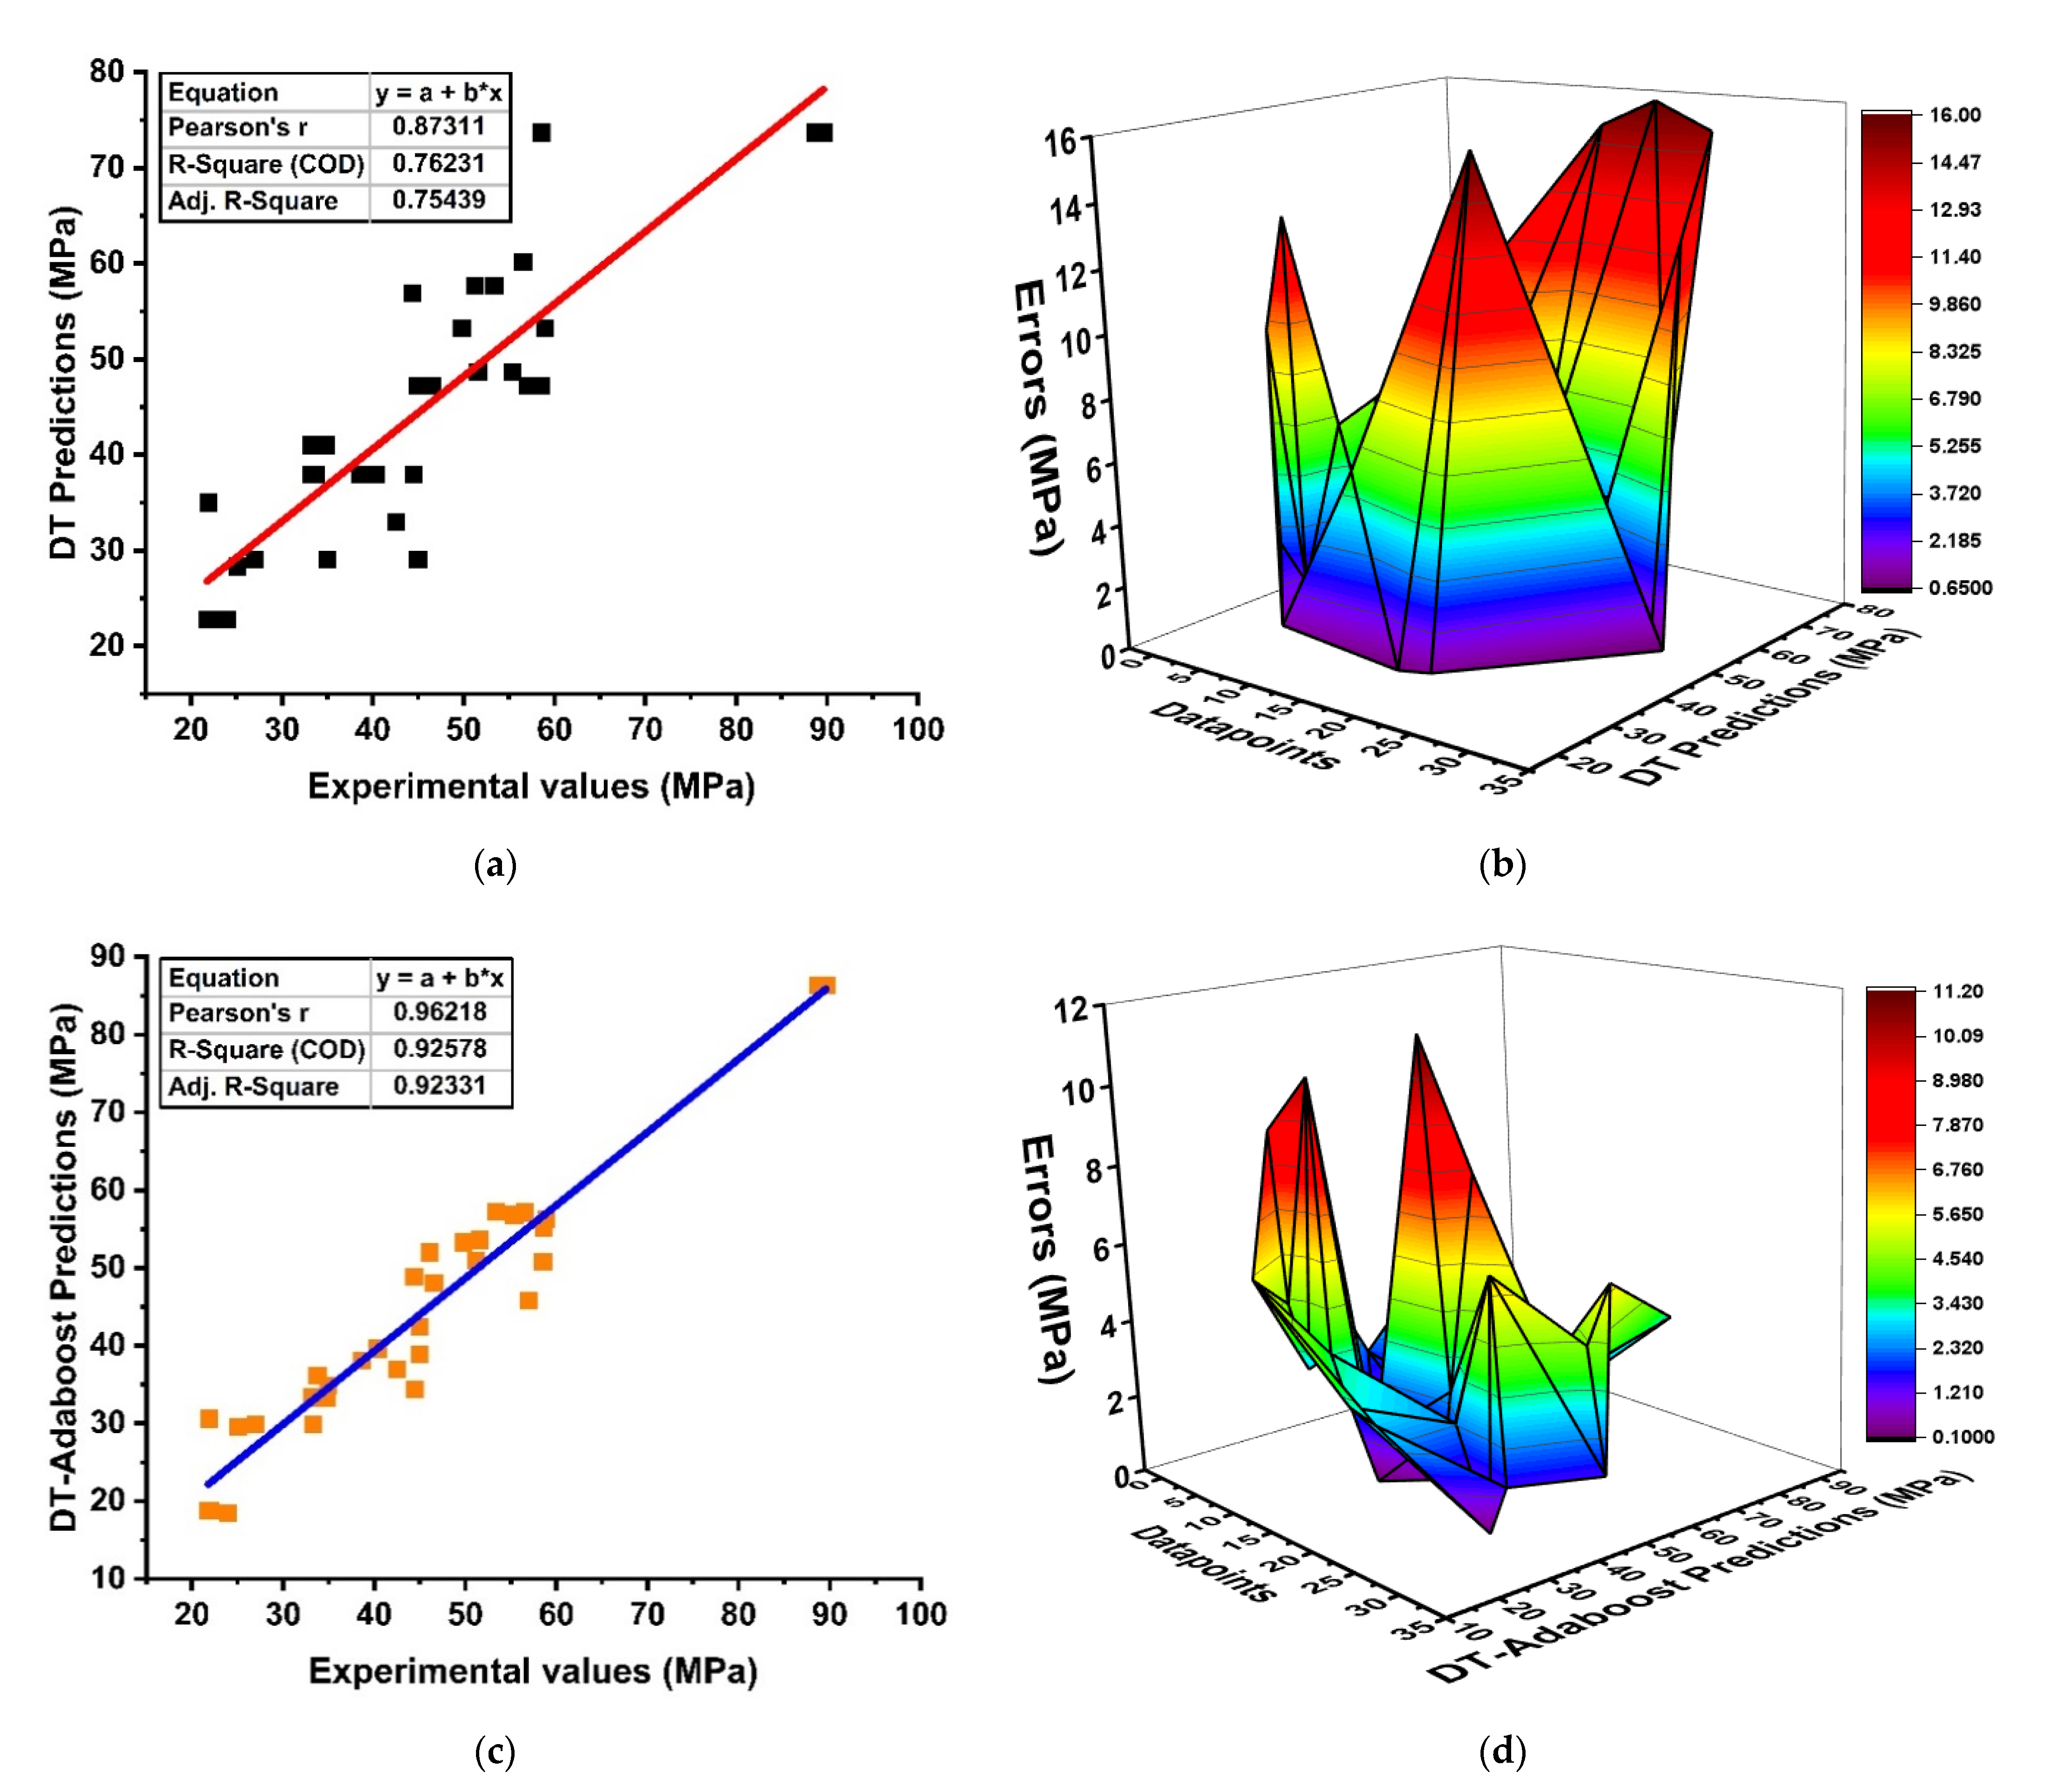
5.1. Decision Tree
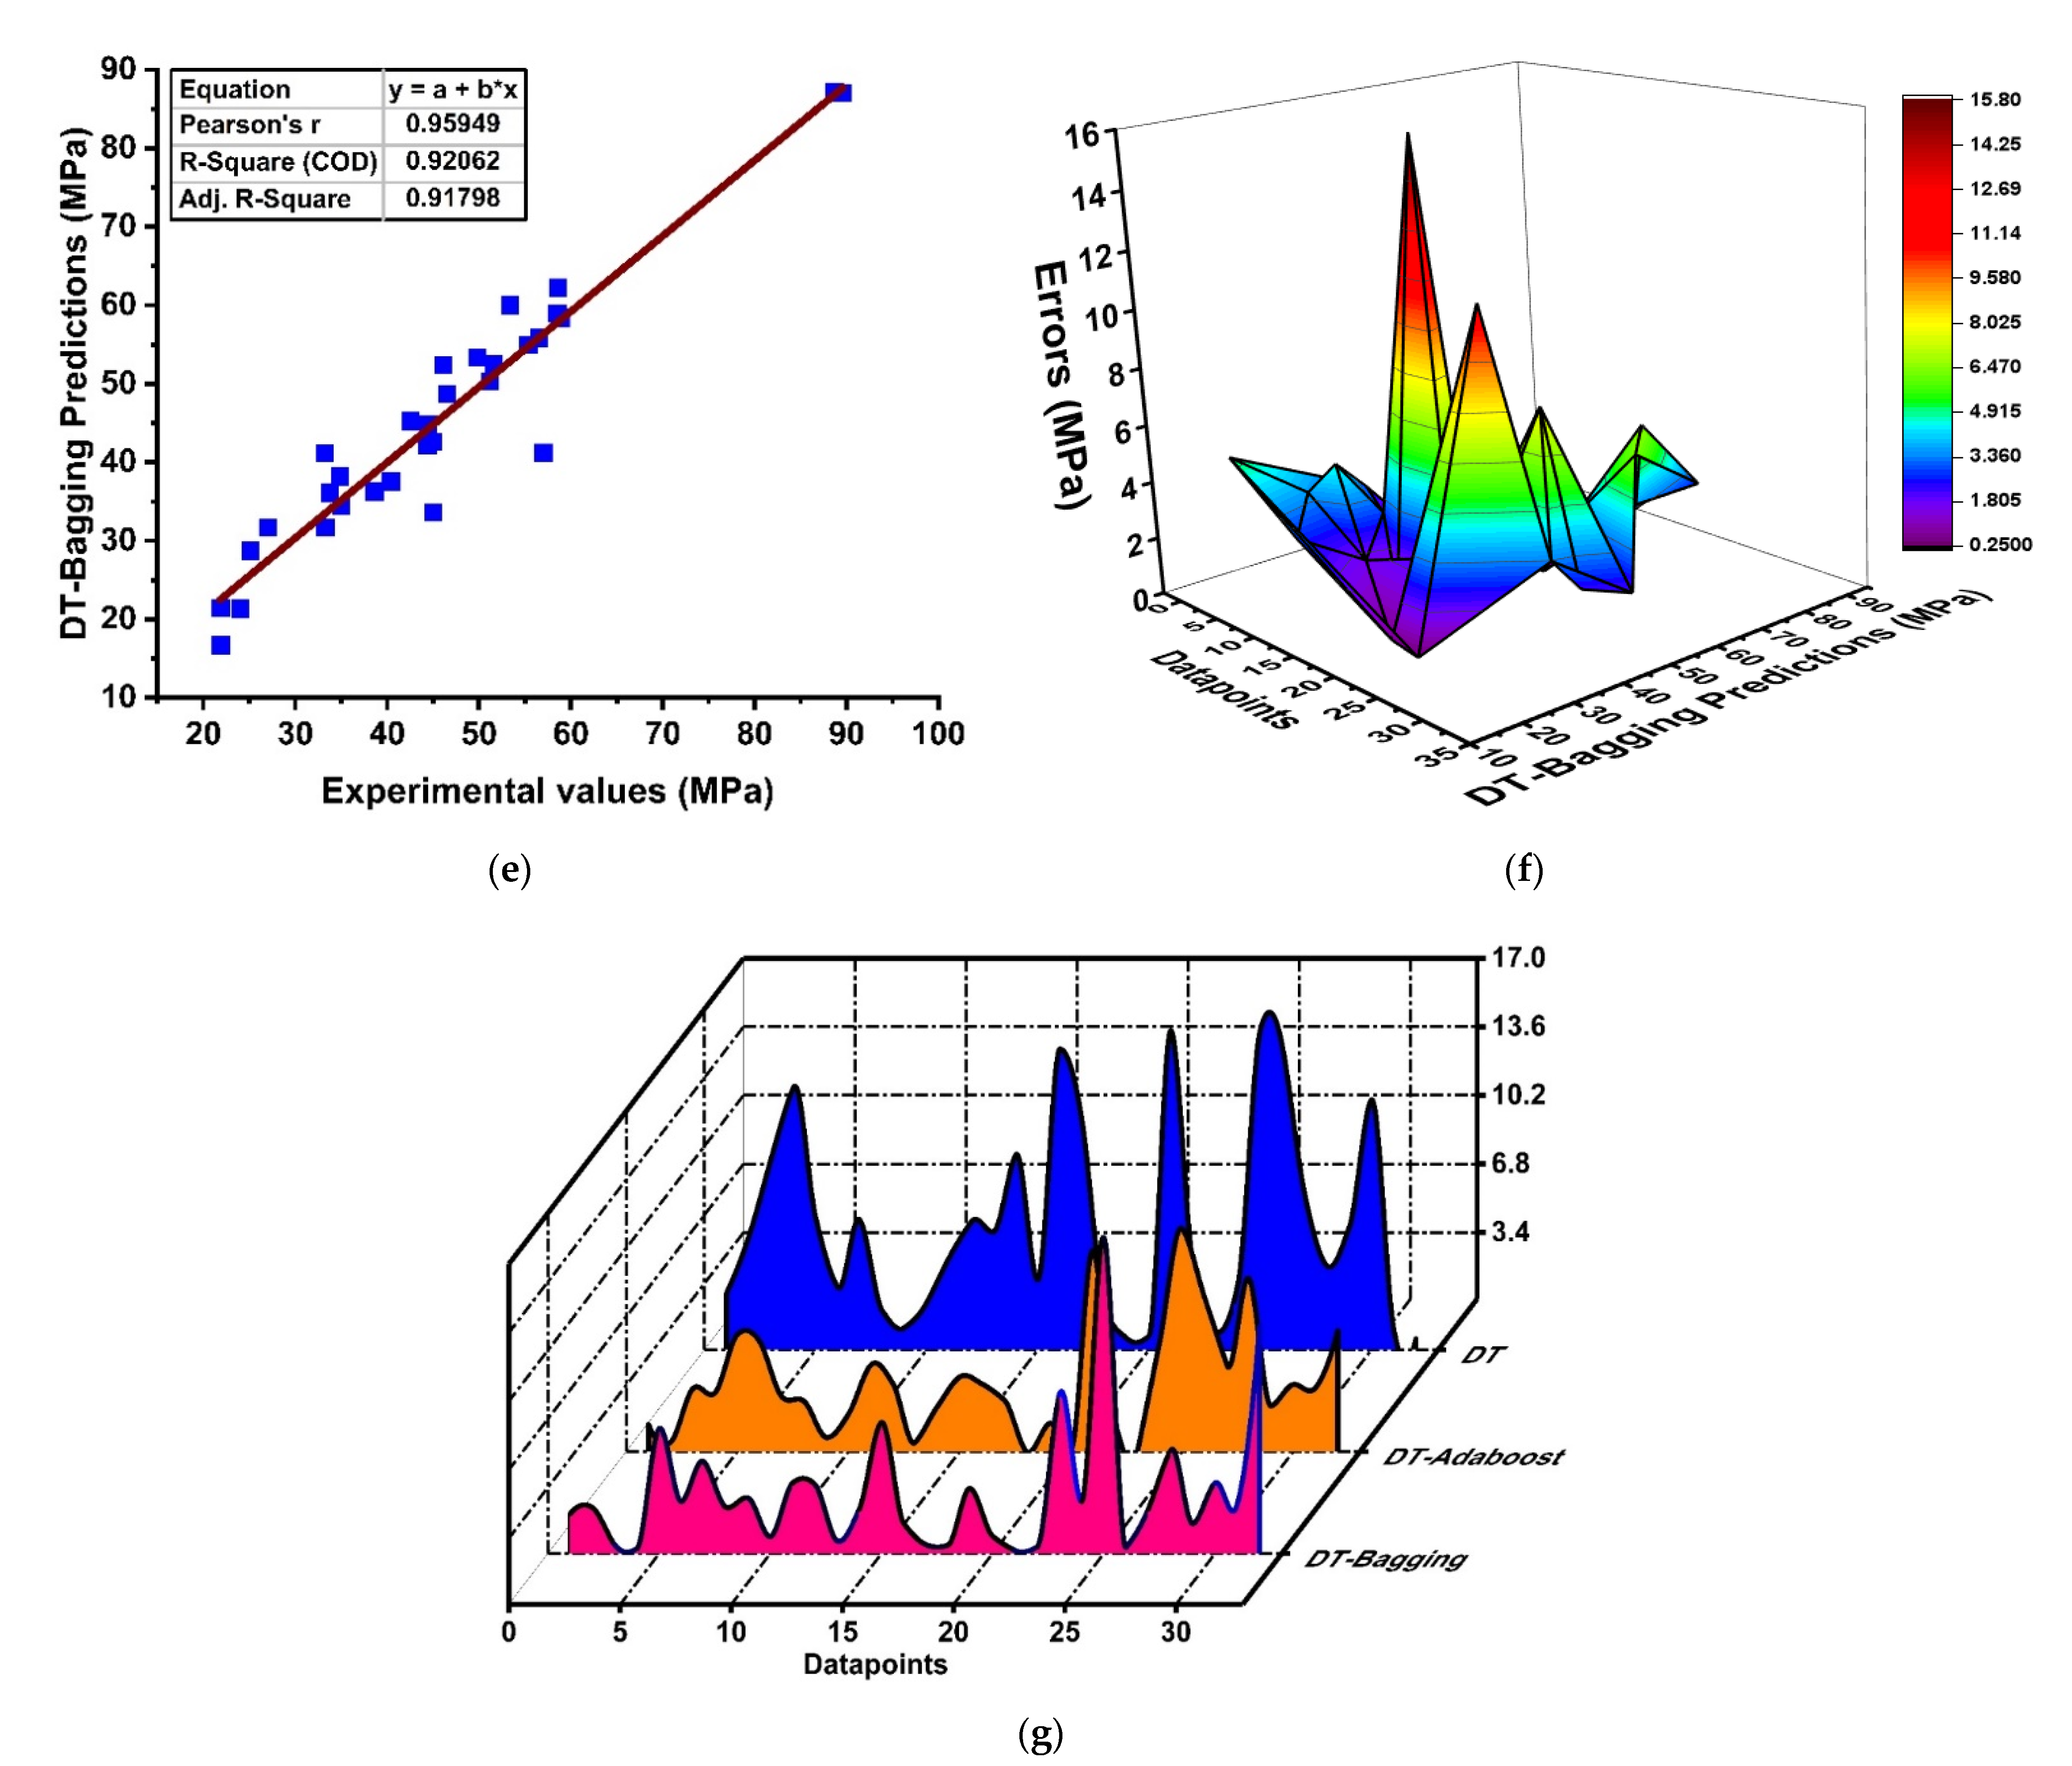
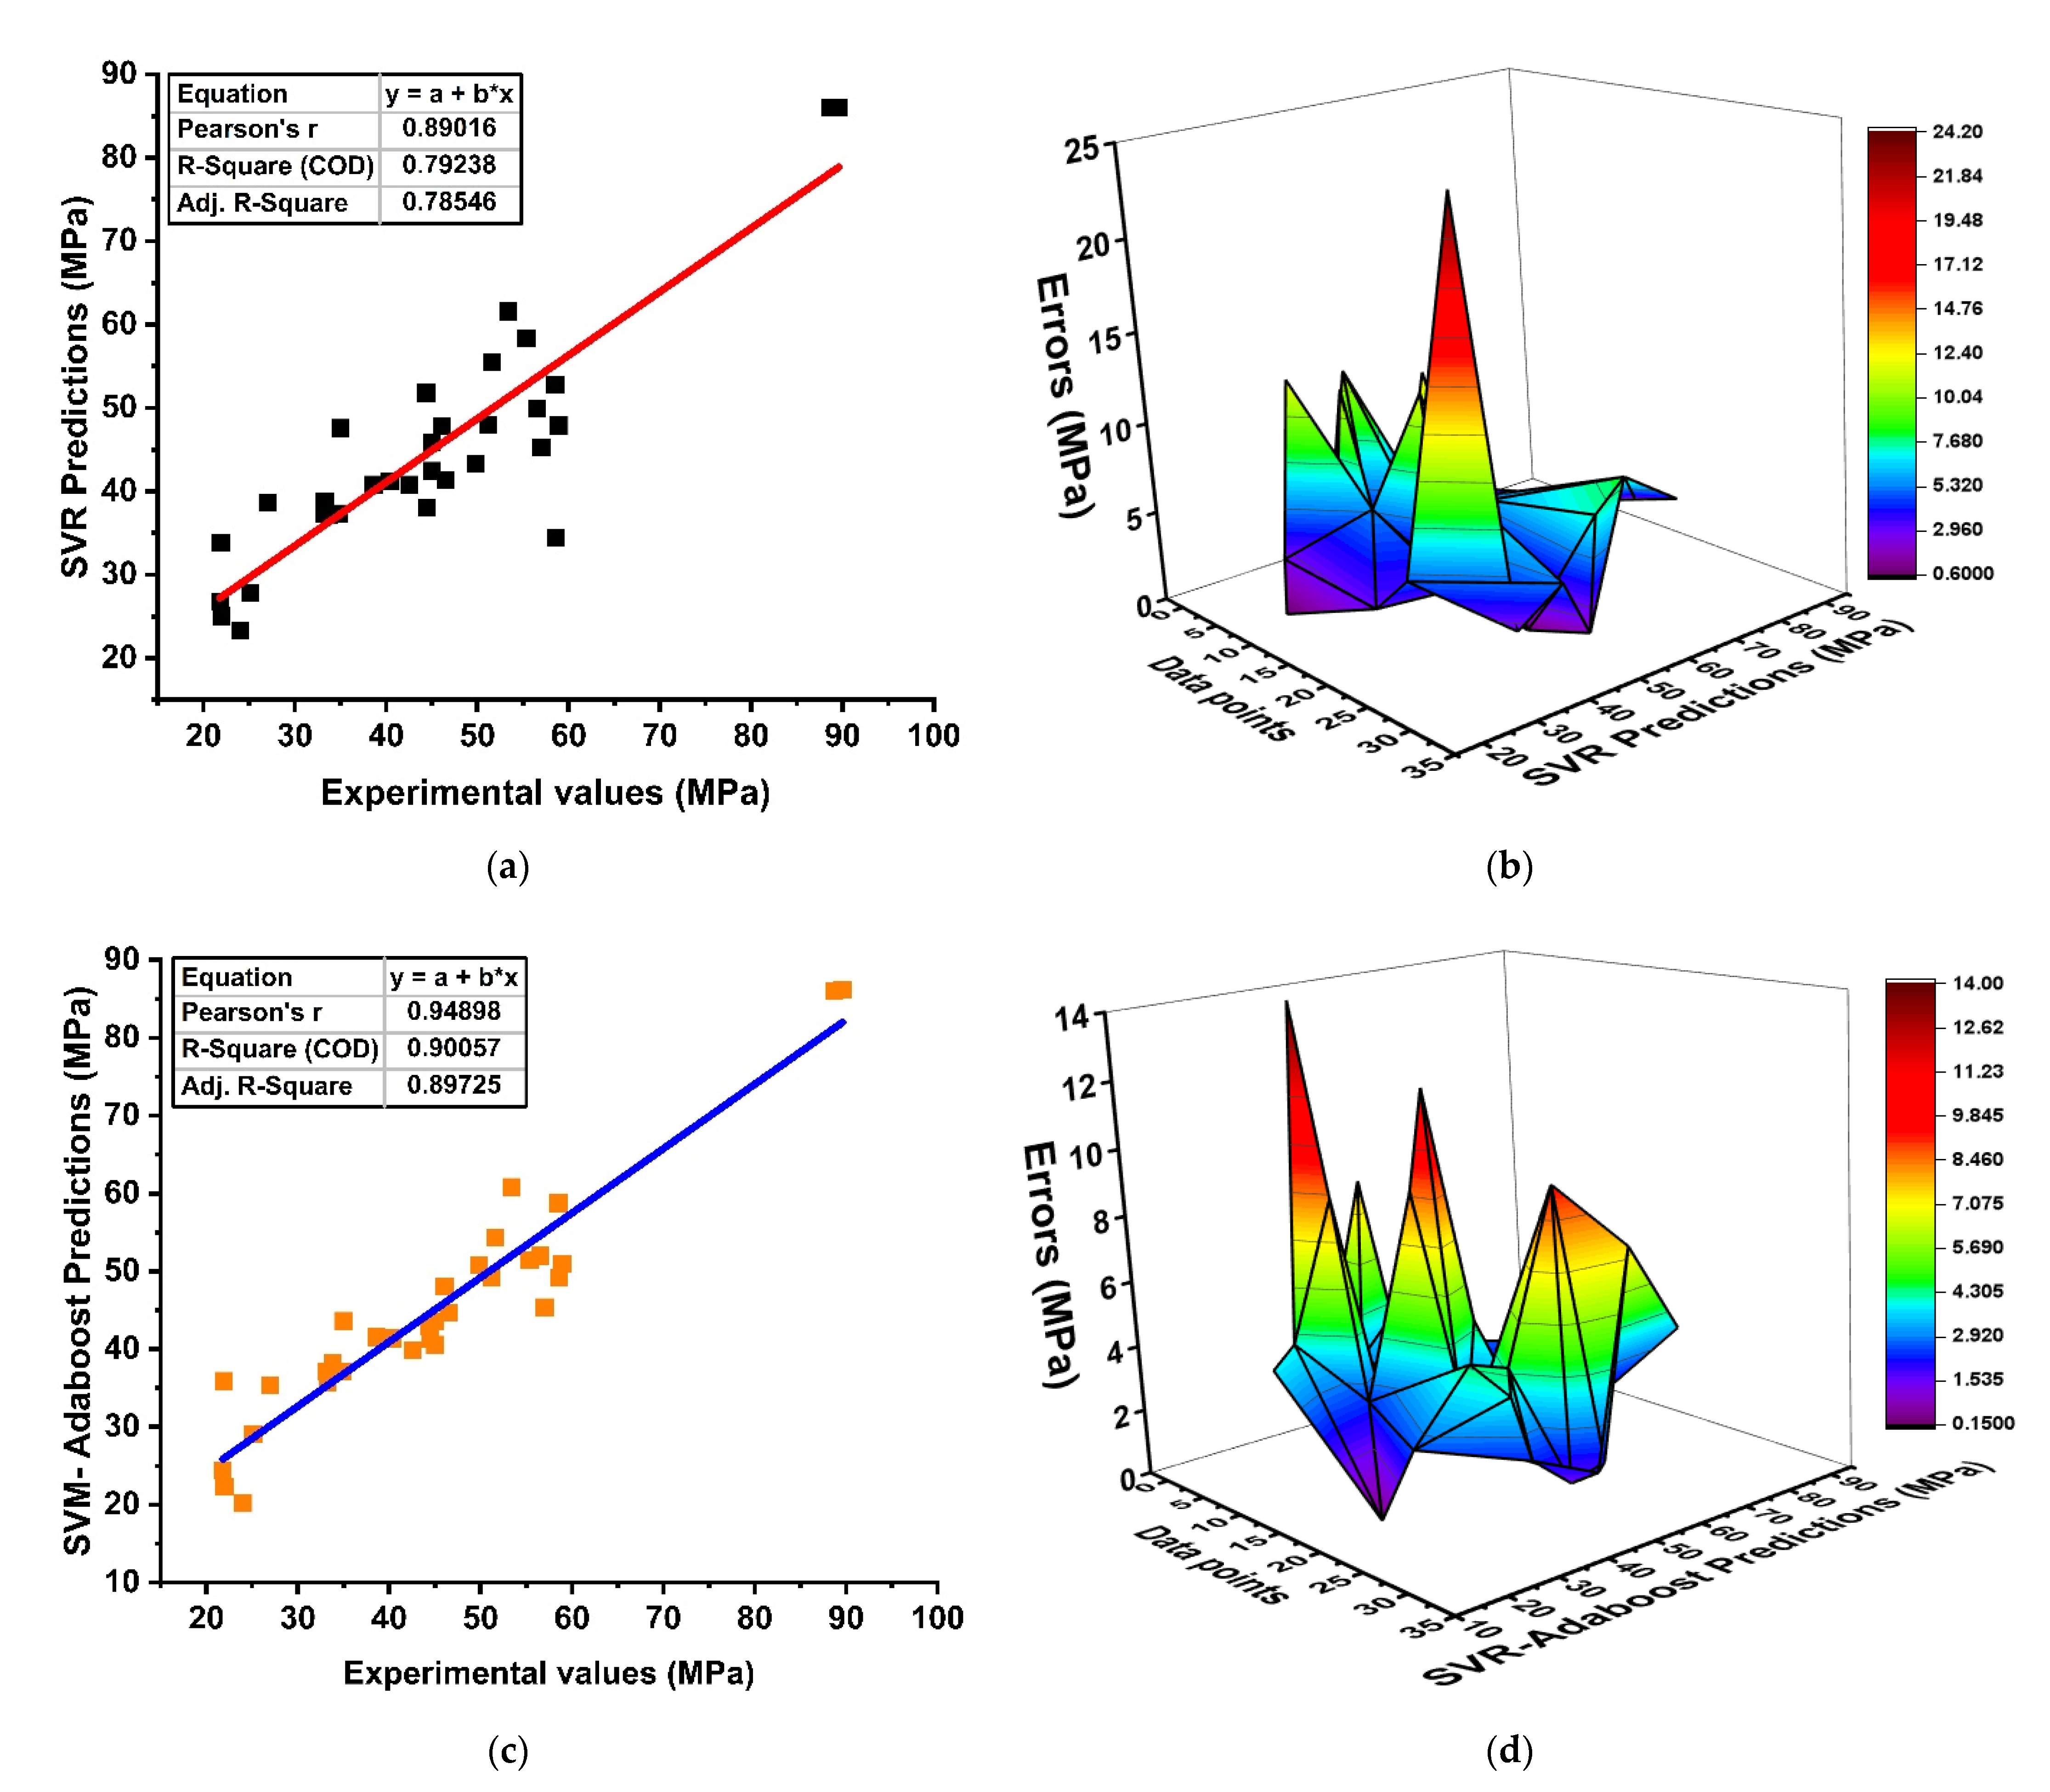
5.2. Support Vector Regression
5.3. Random Forest
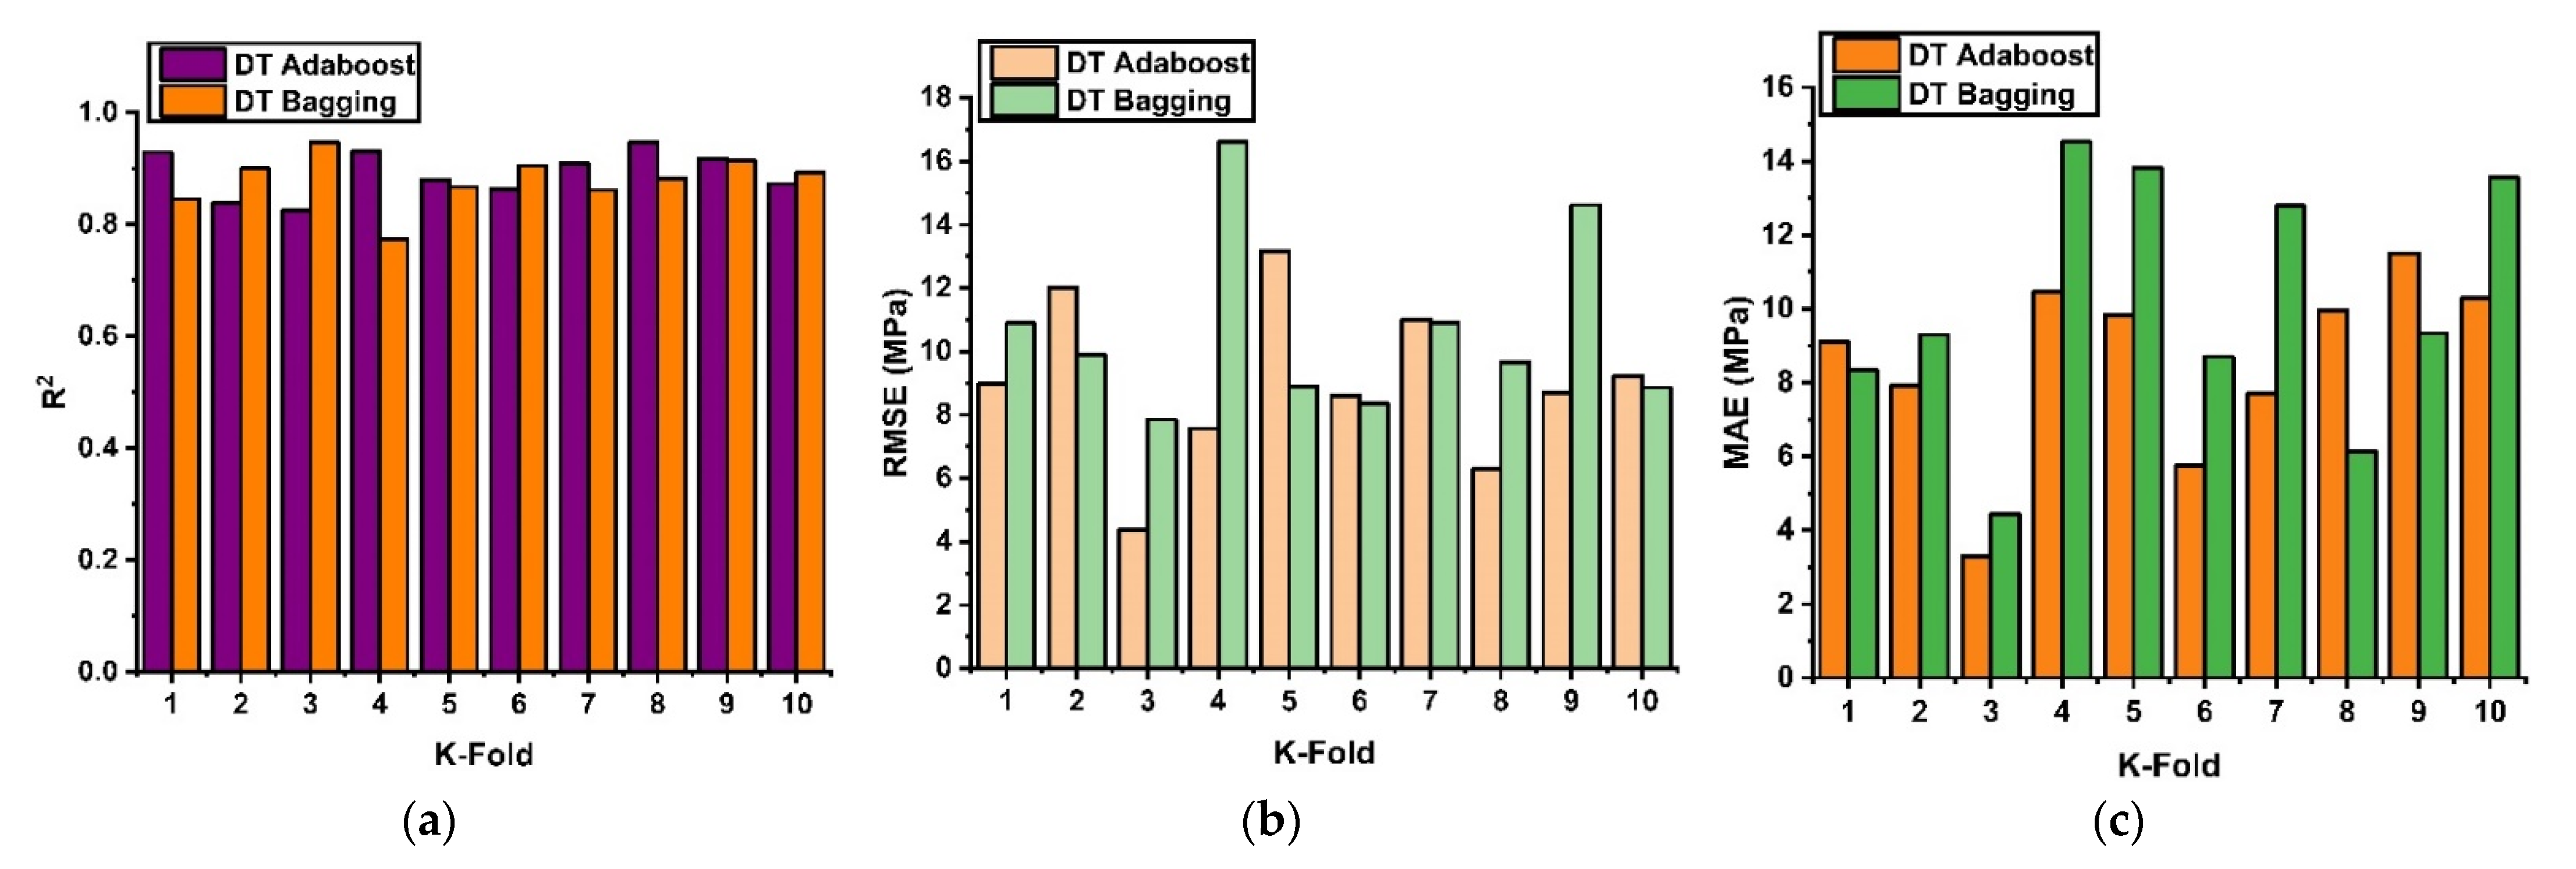
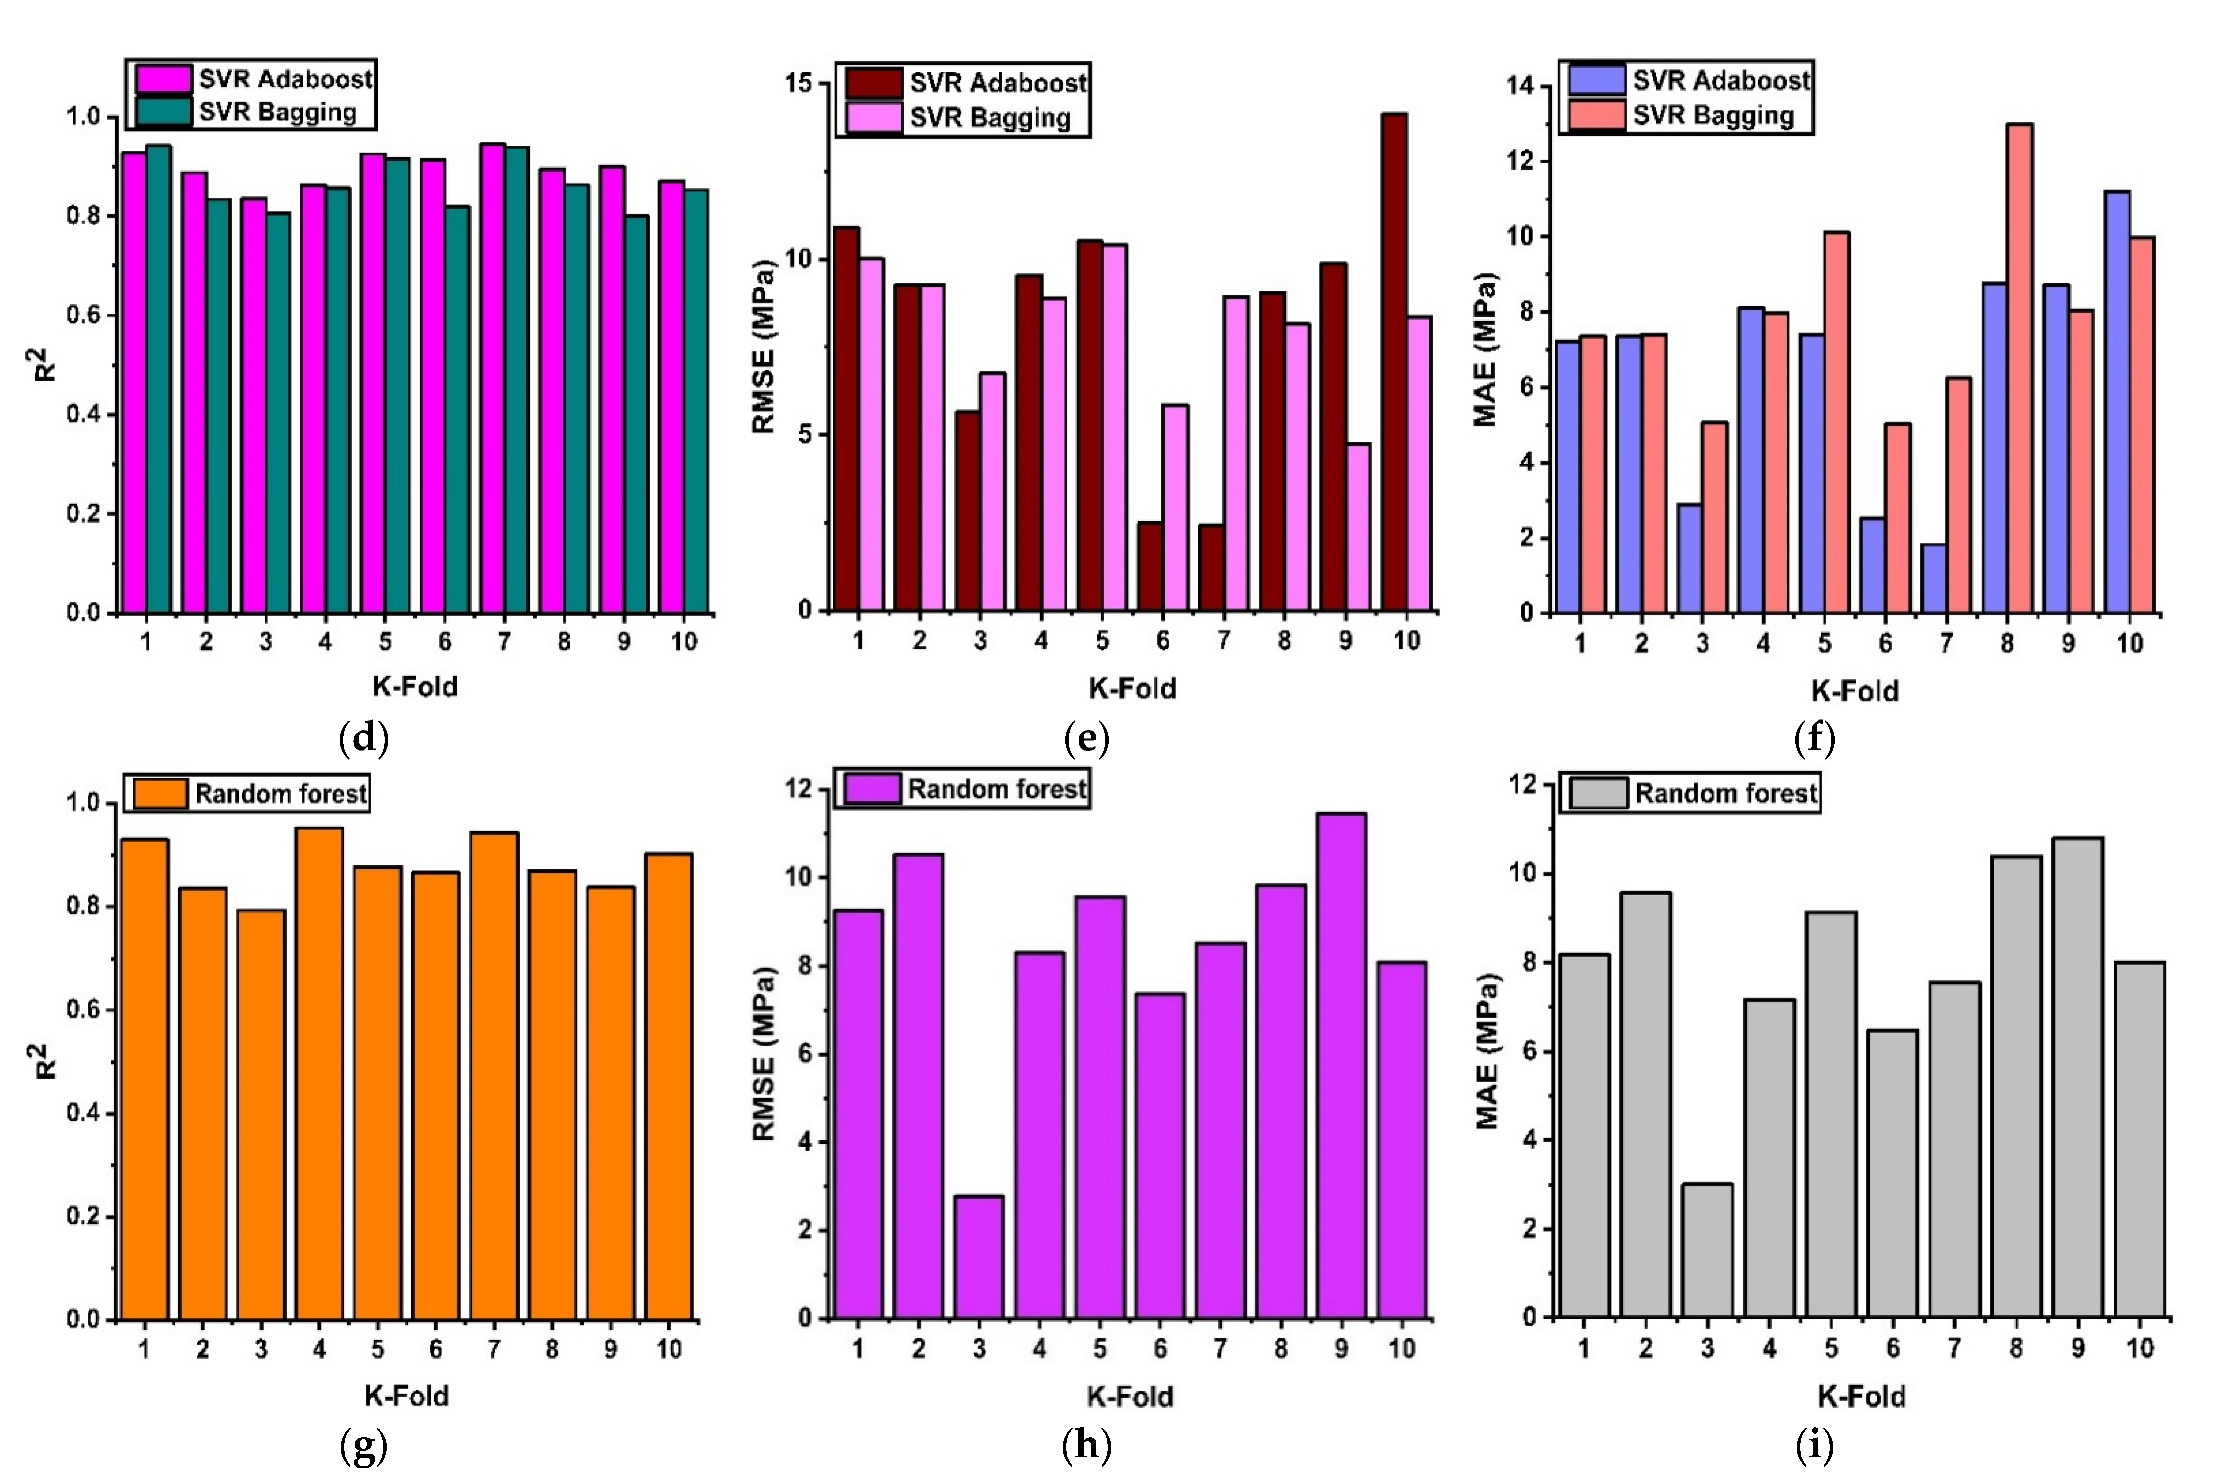
5.4. Cross-Validation Results
5.5. Statistical Analysis of Models
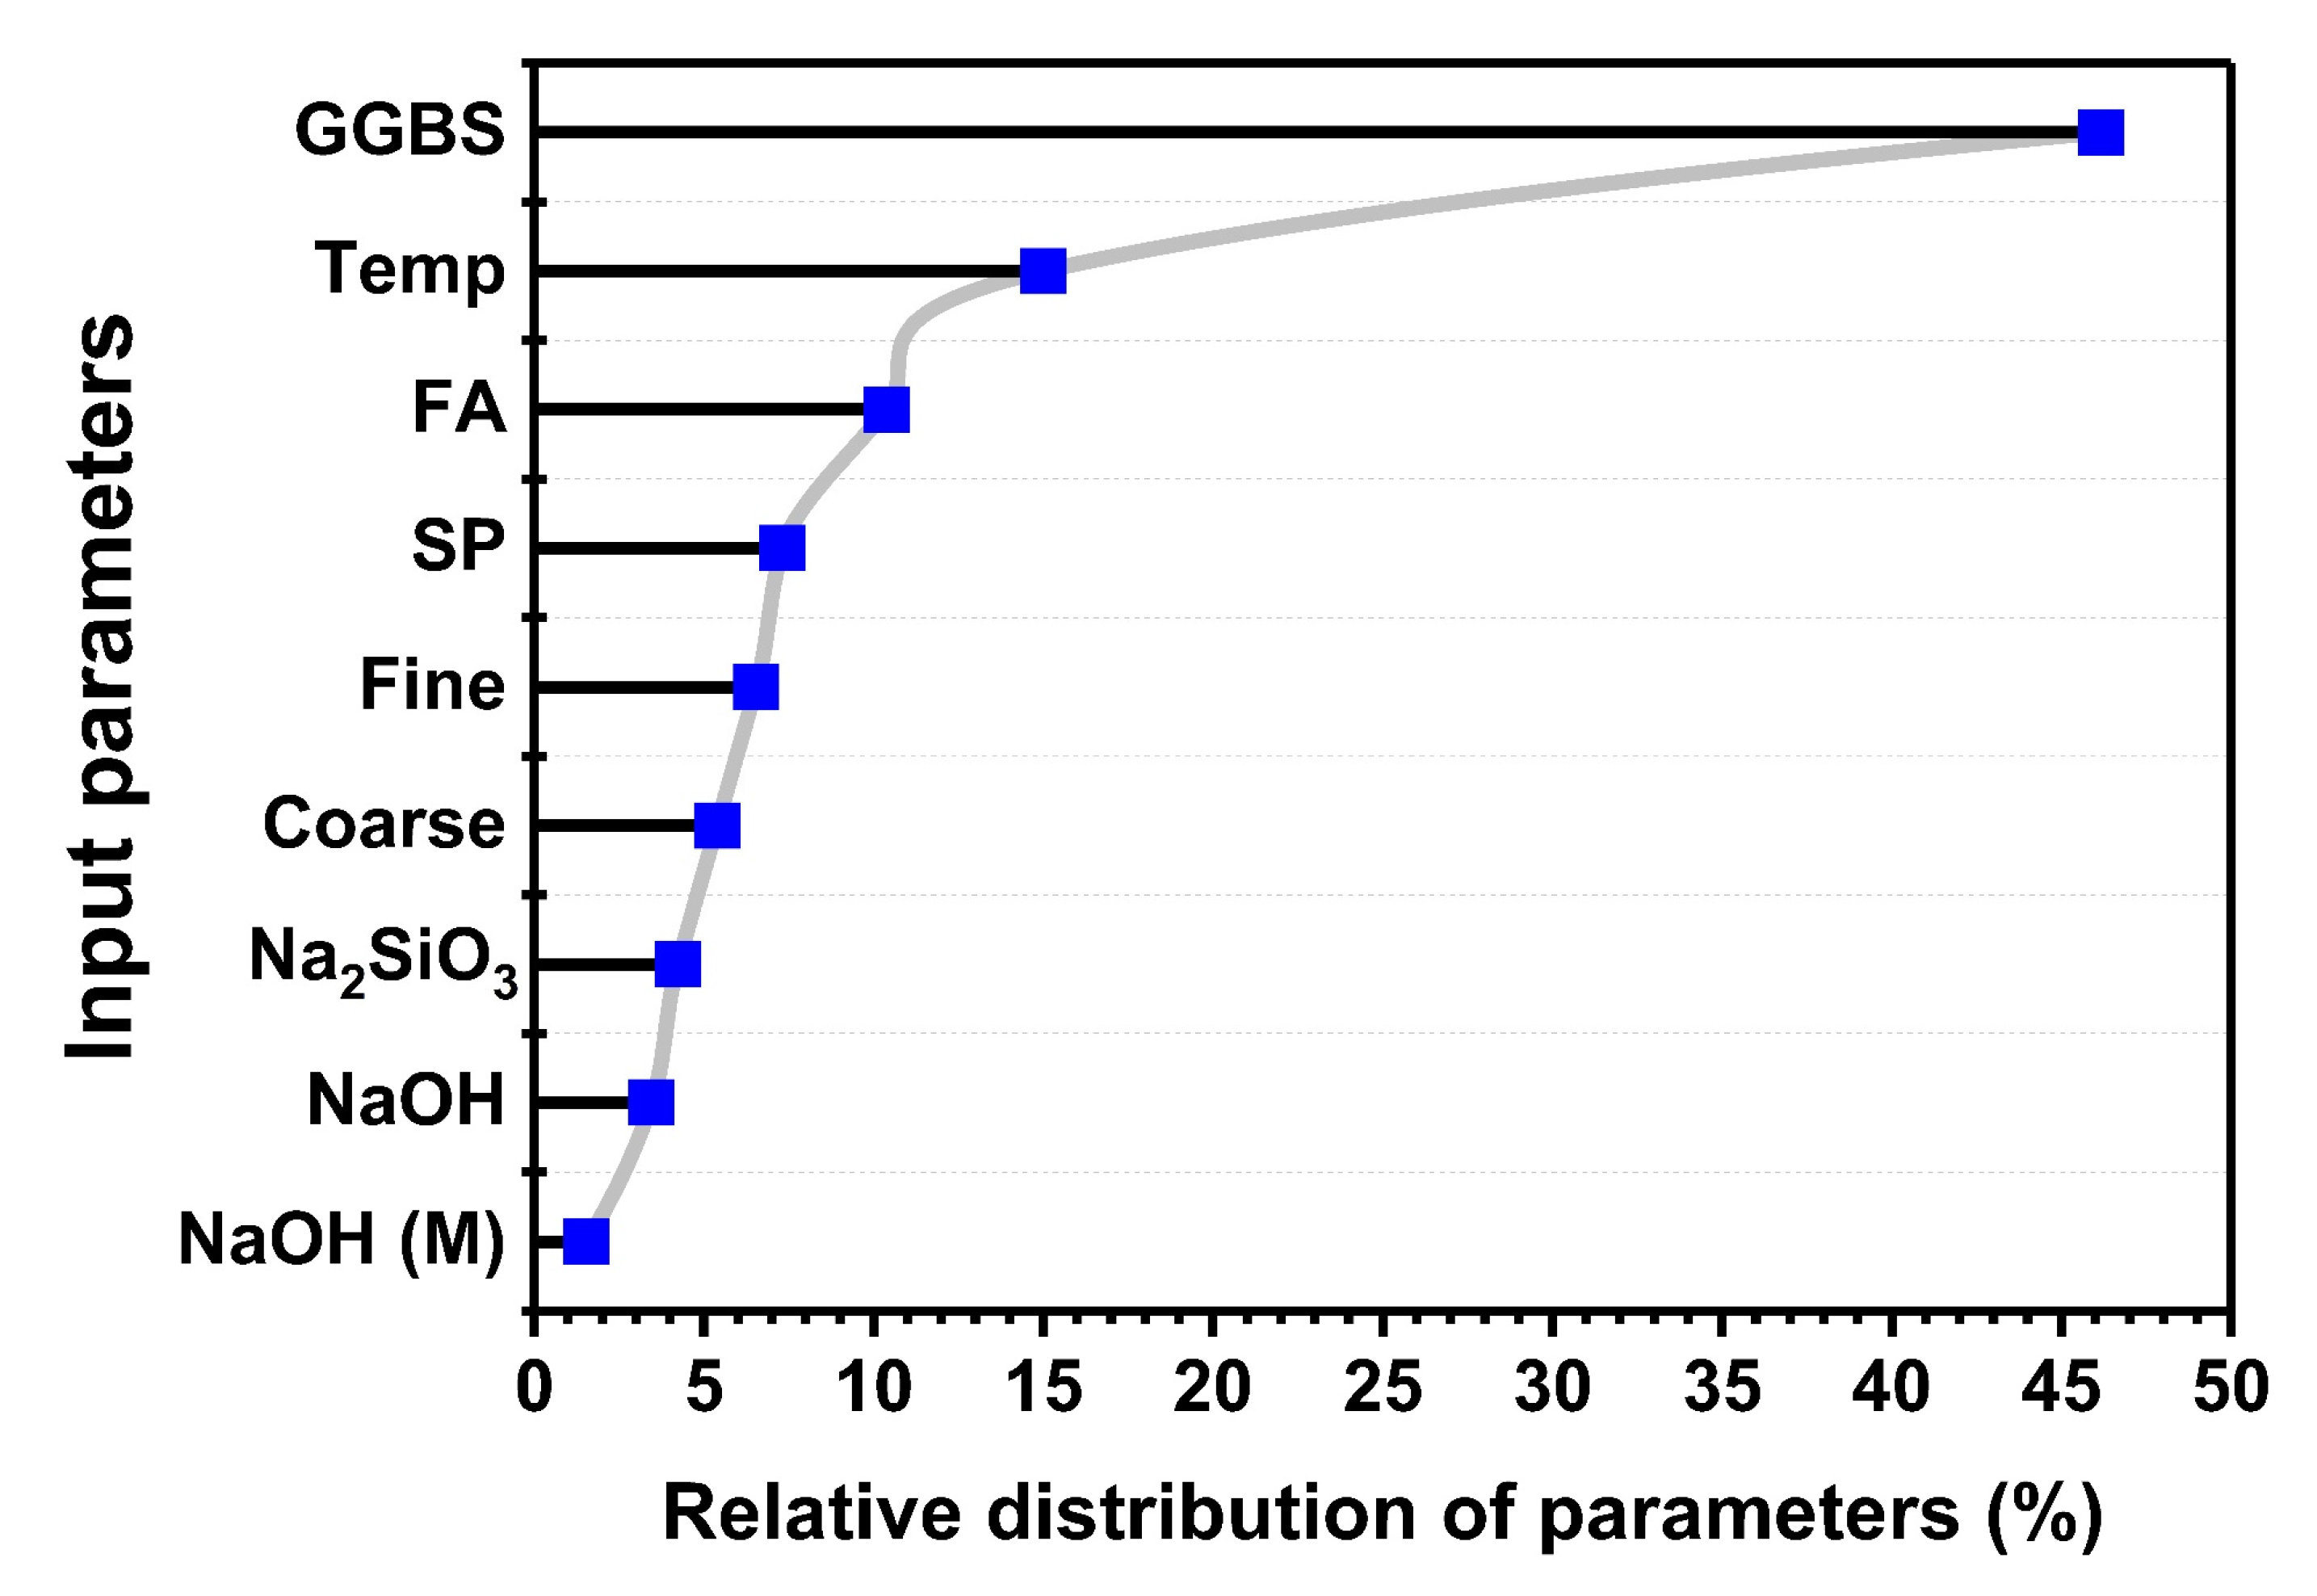
5.6. Permutation Features Analysis of Variables in Geopolymer Concrete
6. Conclusions
- The DT as an individual approach yields a positive outcome with R2 = 0.76. Nevertheless, the ensemble approaches with bagging and boosting depict precise results with R2 = 0.92. These indications make it clear that the ensemble approach yields positive results due to its weak-learner incorporation.
- SVR shows a similar response with ensemble approaches as compared to the individual approach. Moreover, the SVR model shows superior performance by depicting a good coefficient of determination with R2 = 0.90 for boosting and R2= 0.93 for bagging. Similarly, RFR yields better performance with R2 = 0.93 for the testing set. This shows that the ensemble model yields robust performance as compared to non-ensemble approaches.
- Cross-validation of the test set reveals lesser MAE, RMSE errors, and good average correlations of R2 for the DT, SVR, and RF, indicating the accuracy of the model. Statistical-analysis results reveal lesser error for MAE, RMSE and MSE as compared to individual approaches.
- The RF and SVR with bagging were superior to individual and ensemble approaches by showing R2 = 0.93.
- Permutation analysis of variables shows that FA, GGBS, and temperature have a major influence on the strength of GPC.
Supplementary Materials
Author Contributions
Funding
Institutional Review Board Statement
Informed Consent Statement
Data Availability Statement
Acknowledgments
Conflicts of Interest
References
- Latawiec, R.; Woyciechowski, P.; Kowalski, K.J. Sustainable concrete performance—CO2-emission. Environments 2018, 5, 27. [Google Scholar] [CrossRef] [Green Version]
- Liu, G.; Yang, H.; Fu, Y.; Mao, C.; Xu, P.; Hong, J.; Li, R. Cyber-physical system-based real-time monitoring and visualization of greenhouse gas emissions of prefabricated construction. J. Clean. Prod. 2020, 246, 119059. [Google Scholar] [CrossRef]
- Akbarzadeh Bengar, H.; Shahmansouri, A.A. A new anchorage system for CFRP strips in externally strengthened RC continuous beams. J. Build. Eng. 2020, 30, 101230. [Google Scholar] [CrossRef]
- Benhelal, E.; Shamsaei, E.; Rashid, M.I. Novel modifications in a conventional clinker making process for sustainable cement production. J. Clean. Prod. 2019, 221, 389–397. [Google Scholar] [CrossRef]
- Samimi, K.; Kamali-Bernard, S.; Akbar Maghsoudi, A.; Maghsoudi, M.; Siad, H. Influence of pumice and zeolite on compressive strength, transport properties and resistance to chloride penetration of high strength self-compacting concretes. Constr. Build. Mater. 2017, 151, 292–311. [Google Scholar] [CrossRef]
- Taji, I.; Ghorbani, S.; de Brito, J.; Tam, V.W.Y.; Sharifi, S.; Davoodi, A.; Tavakkolizadeh, M. Application of statistical analysis to evaluate the corrosion resistance of steel rebars embedded in concrete with marble and granite waste dust. J. Clean. Prod. 2019, 210, 837–846. [Google Scholar] [CrossRef]
- Tang, Z.; Li, W.; Ke, G.; Zhou, J.L.; Tam, V.W.Y. Sulfate attack resistance of sustainable concrete incorporating various industrial solid wastes. J. Clean. Prod. 2019, 218, 810–822. [Google Scholar] [CrossRef]
- Ma, Z.; Liu, M.; Duan, Z.; Liang, C.; Wu, H. Effects of active waste powder obtained from C&D waste on the microproperties and water permeability of concrete. J. Clean. Prod. 2020, 257, 120518. [Google Scholar] [CrossRef]
- Shah, S.N.; Mo, K.H.; Yap, S.P.; Yang, J.; Ling, T.C. Lightweight foamed concrete as a promising avenue for incorporating waste materials: A review. Resour. Conserv. Recycl. 2021, 164, 105103. [Google Scholar] [CrossRef]
- Sun, C.; Chen, Q.; Xiao, J.; Liu, W. Utilization of waste concrete recycling materials in self-compacting concrete. Resour. Conserv. Recycl. 2020, 161, 104930. [Google Scholar] [CrossRef]
- Tang, Q.; Ma, Z.; Wu, H.; Wang, W. The utilization of eco-friendly recycled powder from concrete and brick waste in new concrete: A critical review. Cem. Concr. Compos. 2020, 114, 103807. [Google Scholar] [CrossRef]
- Farooq, F.; Jin, X.; Faisal Javed, M.; Akbar, A.; Izhar Shah, M.; Aslam, F.; Alyousef, R. Geopolymer concrete as sustainable material: A state of the art review. Constr. Build. Mater. 2021, 306, 124762. [Google Scholar] [CrossRef]
- Qureshi, L.A.; Ali, B.; Ali, A. Combined effects of supplementary cementitious materials (silica fume, GGBS, fly ash and rice husk ash) and steel fiber on the hardened properties of recycled aggregate concrete. Constr. Build. Mater. 2020, 263, 120636. [Google Scholar] [CrossRef]
- Vishnu, N.; Kolli, R.; Ravella, D.P. Studies on Self-Compacting geopolymer concrete containing flyash, GGBS, wollastonite and graphene oxide. Mater. Today Proc. 2020, 43, 2422–2427. [Google Scholar] [CrossRef]
- Prusty, J.K.; Pradhan, B. Effect of GGBS and chloride on compressive strength and corrosion performance of steel in fly ash-GGBS based geopolymer concrete. Mater. Today Proc. 2020, 32, 850–855. [Google Scholar] [CrossRef]
- Bajpai, R.; Choudhary, K.; Srivastava, A.; Sangwan, K.S.; Singh, M. Environmental impact assessment of fly ash and silica fume based geopolymer concrete. J. Clean. Prod. 2020, 254, 120147. [Google Scholar] [CrossRef]
- Ma, C.K.; Awang, A.Z.; Omar, W. Structural and material performance of geopolymer concrete: A review. Constr. Build. Mater. 2018, 186, 90–102. [Google Scholar] [CrossRef]
- Amran, Y.H.M.; Alyousef, R.; Alabduljabbar, H.; El-Zeadani, M. Clean production and properties of geopolymer concrete; A review. J. Clean. Prod. 2020, 251, 119679. [Google Scholar] [CrossRef]
- Almutairi, A.L.; Tayeh, B.A.; Adesina, A.; Isleem, H.F.; Zeyad, A.M. Potential applications of geopolymer concrete in construction: A review. Case Stud. Constr. Mater. 2021, 15, e00733. [Google Scholar] [CrossRef]
- Parathi, S.; Nagarajan, P.; Pallikkara, S.A. Ecofriendly geopolymer concrete: A comprehensive review. Clean Technol. Environ. Policy 2021, 23, 1701–1713. [Google Scholar] [CrossRef]
- Kumar, R.; Verma, M.; Dev, N. Investigation on the Effect of Seawater Condition, Sulphate Attack, Acid Attack, Freeze–Thaw Condition, and Wetting–Drying on the Geopolymer Concrete. Iran. J. Sci. Technol.-Trans. Civ. Eng. 2021, 1–31. [Google Scholar] [CrossRef]
- Nnaemeka, O.F.; Singh, N.B. Durability properties of geopolymer concrete made from fly ash in presence of Kaolin. Mater. Today Proc. 2019, 29, 781–784. [Google Scholar] [CrossRef]
- Guo, X.; Xiong, G. Resistance of fiber-reinforced fly ash-steel slag based geopolymer mortar to sulfate attack and drying-wetting cycles. Constr. Build. Mater. 2021, 269, 121326. [Google Scholar] [CrossRef]
- Hassan, A.; Arif, M.; Shariq, M. Use of geopolymer concrete for a cleaner and sustainable environment—A review of mechanical properties and microstructure. J. Clean. Prod. 2019, 223, 704–728. [Google Scholar] [CrossRef]
- Kotwal, A.R.; Kim, Y.J.; Hu, J.; Sriraman, V. Characterization and Early Age Physical Properties of Ambient Cured Geopolymer Mortar Based on Class C Fly Ash. Int. J. Concr. Struct. Mater. 2015, 9, 35–43. [Google Scholar] [CrossRef] [Green Version]
- Pimraksa, K.; Chindaprasirt, P.; Rungchet, A.; Sagoe-Crentsil, K.; Sato, T. Lightweight geopolymer made of highly porous siliceous materials with various Na2O/Al2O3 and SiO2/Al2O3 ratios. Mater. Sci. Eng. A 2011, 528, 6616–6623. [Google Scholar] [CrossRef]
- Hadi, M.N.S.; Zhang, H.; Parkinson, S. Optimum mix design of geopolymer pastes and concretes cured in ambient condition based on compressive strength, setting time and workability. J. Build. Eng. 2019, 23, 301–313. [Google Scholar] [CrossRef]
- Ukritnukun, S.; Koshy, P.; Rawal, A.; Castel, A.; Sorrell, C.C. Predictive model of setting times and compressive strengths for low-alkali, ambient-cured, fly ash/slag-based geopolymers. Minerals 2020, 10, 920. [Google Scholar] [CrossRef]
- Gholizadeh-Vayghan, A.; Nofallah, M.-H.; Khaloo, A. Technoeconomic Study of Alkali-Activated Slag Concrete with a Focus on Strength, CO2 Emission, and Material Cost. J. Mater. Civ. Eng. 2021, 33. [Google Scholar] [CrossRef]
- Songpiriyakij, S.; Kubprasit, T.; Jaturapitakkul, C.; Chindaprasirt, P. Compressive strength and degree of reaction of biomass- and fly ash-based geopolymer. Constr. Build. Mater. 2010, 24, 236–240. [Google Scholar] [CrossRef]
- Puertas, F.; Martínez-Ramírez, S.; Alonso, S.; Vázquez, T. Alkali-activated fly ash/slag cements. Strength behavior and hydration products. Cem. Concr. Res. 2000, 30, 1625–1632. [Google Scholar] [CrossRef]
- Olivia, M.; Nikraz, H. Properties of fly ash geopolymer concrete designed by Taguchi method. Mater. Des. 2012, 36, 191–198. [Google Scholar] [CrossRef] [Green Version]
- Kurtoğlu, A.E.; Alzeebaree, R.; Aljumaili, O.; Niş, A.; Gülşan, M.E.; Humur, G.; Çevik, A. Mechanical and durability properties of fly ash and slag based geopolymer concrete. Adv. Concr. Constr. 2018, 6, 345–362. [Google Scholar] [CrossRef]
- Podolsky, Z.; Liu, J.; Dinh, H.; Doh, J.H.; Guerrieri, M.; Fragomeni, S. State of the art on the application of waste materials in geopolymer concrete. Case Stud. Constr. Mater. 2021, 15, e00637. [Google Scholar] [CrossRef]
- Kumar, M.L.; Revathi, V. Microstructural Properties of Alkali-Activated Metakaolin and Bottom Ash Geopolymer. Arab. J. Sci. Eng. 2020, 45, 4235–4246. [Google Scholar] [CrossRef]
- Hassan, A.; Arif, M.; Shariq, M. Influence of microstructure of geopolymer concrete on its mechanical properties—A review. In Lecture Notes in Civil Engineering; Springer: Singapore, 2020; Volume 35, pp. 119–129. [Google Scholar]
- Jiang, X.; Xiao, R.; Zhang, M.; Hu, W.; Bai, Y.; Huang, B. A laboratory investigation of steel to fly ash-based geopolymer paste bonding behavior after exposure to elevated temperatures. Constr. Build. Mater. 2020, 254, 119267. [Google Scholar] [CrossRef]
- Salas, D.A.; Ramirez, A.D.; Ulloa, N.; Baykara, H.; Boero, A.J. Life cycle assessment of geopolymer concrete. Constr. Build. Mater. 2018, 190, 170–177. [Google Scholar] [CrossRef]
- Zakka, W.P.; Abdul Shukor Lim, N.H.; Chau Khun, M. A scientometric review of geopolymer concrete. J. Clean. Prod. 2021, 280, 124353. [Google Scholar] [CrossRef]
- Fang, G.; Ho, W.K.; Tu, W.; Zhang, M. Workability and mechanical properties of alkali-activated fly ash-slag concrete cured at ambient temperature. Constr. Build. Mater. 2018, 172, 476–487. [Google Scholar] [CrossRef]
- Yazdi, M.A.; Liebscher, M.; Hempel, S.; Yang, J.; Mechtcherine, V. Correlation of microstructural and mechanical properties of geopolymers produced from fly ash and slag at room temperature. Constr. Build. Mater. 2018, 191, 330–341. [Google Scholar] [CrossRef]
- Farooq, F.; Ahmed, W.; Akbar, A.; Aslam, F.; Alyousef, R. Predictive modeling for sustainable high-performance concrete from industrial wastes: A comparison and optimization of models using ensemble learners. J. Clean. Prod. 2021, 292, 126032. [Google Scholar] [CrossRef]
- Soni, N.; Shukla, D.K. Analytical study on mechanical properties of concrete containing crushed recycled coarse aggregate as an alternative of natural sand. Constr. Build. Mater. 2021, 266, 120595. [Google Scholar] [CrossRef]
- Assi, L.N.; Eddie Deaver, E.; Ziehl, P. Effect of source and particle size distribution on the mechanical and microstructural properties of fly Ash-Based geopolymer concrete. Constr. Build. Mater. 2018, 167, 372–380. [Google Scholar] [CrossRef]
- Song, H.; Ahmad, A.; Farooq, F.; Ostrowski, K.A.; Maślak, M.; Czarnecki, S.; Aslam, F. Predicting the compressive strength of concrete with fly ash admixture using machine learning algorithms. Constr. Build. Mater. 2021, 308, 125021. [Google Scholar] [CrossRef]
- Farooq, F.; Czarnecki, S.; Niewiadomski, P.; Aslam, F.; Alabduljabbar, H.; Ostrowski, K.A.; Śliwa-Wieczorek, K.; Nowobilski, T.; Malazdrewicz, S. A comparative study for the prediction of the compressive strength of self-compacting concrete modified with fly ash. Materials 2021, 14, 4934. [Google Scholar] [CrossRef]
- Khan, M.A.; Memon, S.A.; Farooq, F.; Javed, M.F.; Aslam, F.; Alyousef, R. Compressive Strength of Fly-Ash-Based Geopolymer Concrete by Gene Expression Programming and Random Forest. Adv. Civ. Eng. 2021, 2021, 6618407. [Google Scholar] [CrossRef]
- Ilyas, I.; Zafar, A.; Faisal Javed, M.; Farooq, F.; Aslam, F.; Musarat, M.A.; Vatin, N.I.; Fabbrocino, F. Forecasting Strength of CFRP Confined Concrete Using Multi Expression Programming. Materials 2021, 14, 7134. [Google Scholar] [CrossRef]
- Javed, M.F.; Farooq, F.; Memon, S.A.; Akbar, A.; Khan, M.A.; Aslam, F.; Alyousef, R.; Alabduljabbar, H.; Rehman, S.K.U.; Ur Rehman, S.K.; et al. New prediction model for the ultimate axial capacity of concrete-filled steel tubes: An evolutionary approach. Crystals 2020, 10, 741. [Google Scholar] [CrossRef]
- Farooq, F.; Amin, M.N.; Khan, K.; Sadiq, M.R.; Javed, M.F.; Aslam, F.; Alyousef, R. A comparative study of random forest and genetic engineering programming for the prediction of compressive strength of high strength concrete (HSC). Appl. Sci. 2020, 10, 7330. [Google Scholar] [CrossRef]
- Nafees, A.; Javed, M.F.; Khan, S.; Nazir, K.; Farooq, F.; Aslam, F.; Musarat, M.A.; Vatin, N.I. Predictive Modeling of Mechanical Properties of Silica Fume-Based Green Concrete Using Artificial Intelligence Approaches: MLPNN, ANFIS, and GEP. Materials 2021, 14, 7531. [Google Scholar] [CrossRef]
- Raza, F.; Alshameri, B.; Jamil, S.M. Assessment of triple bottom line of sustainability for geotechnical projects. Environ. Dev. Sustain. 2021, 23, 4521–4558. [Google Scholar] [CrossRef]
- Khan, M.A.; Farooq, F.; Javed, M.F.; Zafar, A.; Ostrowski, K.A.; Aslam, F.; Malazdrewicz, S.; Maślak, M. Simulation of depth of wear of eco-friendly concrete using machine learning based computational approaches. Materials 2022, 15, 58. [Google Scholar] [CrossRef] [PubMed]
- Ahmad, A.; Ostrowski, K.A.; Maślak, M.; Farooq, F.; Mehmood, I.; Nafees, A. Comparative Study of Supervised Machine Learning Algorithms for Predicting the Compressive Strength of Concrete at High Temperature. Materials 2021, 14, 4222. [Google Scholar] [CrossRef] [PubMed]
- Aslam, F.; Farooq, F.; Amin, M.N.; Khan, K.; Waheed, A.; Akbar, A.; Javed, M.F.; Alyousef, R.; Alabdulijabbar, H. Applications of Gene Expression Programming for Estimating Compressive Strength of High-Strength Concrete. Adv. Civ. Eng. 2020, 2020, 8850535. [Google Scholar] [CrossRef]
- Song, H.; Ahmad, A.; Ostrowski, K.A.; Dudek, M. Analyzing the compressive strength of ceramic waste-based concrete using experiment and artificial neural network (Ann) approach. Materials 2021, 14, 4518. [Google Scholar] [CrossRef]
- Ahmad, W.; Ahmad, A.; Ostrowski, K.A.; Aslam, F.; Joyklad, P.; Zajdel, P. Application of advanced machine learning approaches to predict the compressive strength of concrete containing supplementary cementitious materials. Materials 2021, 14, 5762. [Google Scholar] [CrossRef]
- Xu, Y.; Ahmad, W.; Ahmad, A.; Ostrowski, K.A.; Dudek, M.; Aslam, F.; Joyklad, P. Computation of high-performance concrete compressive strength using standalone and ensembled machine learning techniques. Materials 2021, 14, 7034. [Google Scholar] [CrossRef]
- Song, Y.; Zhao, J.; Ostrowski, K.A.; Javed, M.F.; Ahmad, A.; Khan, M.I.; Aslam, F.; Kinasz, R. Prediction of compressive strength of fly-ash-based concrete using ensemble and non-ensemble supervised machine-learning approaches. Appl. Sci. 2022, 12, 361. [Google Scholar] [CrossRef]
- Ahmad, A.; Ahmad, W.; Aslam, F.; Joyklad, P. Compressive strength prediction of fly ash-based geopolymer concrete via advanced machine learning techniques. Case Stud. Constr. Mater. 2022, 16, e00840. [Google Scholar] [CrossRef]
- Zou, Y.; Zheng, C.; Alzahrani, A.M.; Ahmad, W.; Ahmad, A.; Mohamed, A.M.; Khallaf, R.; Elattar, S. Evaluation of Artificial Intelligence Methods to Estimate the Compressive Strength of Geopolymers. Gels 2022, 8, 271. [Google Scholar] [CrossRef]
- Yang, K.; Yang, C.; Magee, B.; Nanukuttan, S.; Ye, J. Establishment of a preconditioning regime for air permeability and sorptivity of alkali-activated slag concrete. Cem. Concr. Compos. 2016, 73, 19–28. [Google Scholar] [CrossRef] [Green Version]
- Sumanth Kumar, B.; Sen, A.; Rama Seshu, D. Shear Strength of Fly Ash and GGBS Based Geopolymer Concrete. In Lecture Notes in Civil Engineering; Springer: Singapore, 2020; Volume 68, pp. 105–117. [Google Scholar]
- Ullah, H.S.; Khushnood, R.A.; Farooq, F.; Ahmad, J.; Vatin, N.I.; Yehia, D.; Ewais, Z. Prediction of Compressive Strength of Sustainable Foam Concrete Using Individual and Ensemble Machine Learning Approaches. Materials 2022, 15, 3166. [Google Scholar] [CrossRef]
- Jithendra, C.; Elavenil, S. Role of superplasticizer on GGBS based Geopolymer concrete under ambient curing. Mater. Today Proc. 2019, 18, 148–154. [Google Scholar] [CrossRef]
- Verma, M.; Dev, N. Sodium hydroxide effect on the mechanical properties of flyash-slag based geopolymer concrete. Struct. Concr. 2021, 22, E368–E379. [Google Scholar] [CrossRef]
- Deb, P.S.; Nath, P.; Sarker, P.K. The effects of ground granulated blast-furnace slag blending with fly ash and activator content on the workability and strength properties of geopolymer concrete cured at ambient temperature. Mater. Des. 2014, 62, 32–39. [Google Scholar] [CrossRef] [Green Version]
- Ding, Y.; Shi, C.J.; Li, N. Fracture properties of slag/fly ash-based geopolymer concrete cured in ambient temperature. Constr. Build. Mater. 2018, 190, 787–795. [Google Scholar] [CrossRef]
- Nath, P.; Sarker, P.K. Fracture properties of GGBFS-blended fly ash geopolymer concrete cured in ambient temperature. Mater. Struct. Constr. 2017, 50, 32. [Google Scholar] [CrossRef]
- Karthik, A.; Sudalaimani, K.; Vijaya Kumar, C.T. Investigation on mechanical properties of fly ash-ground granulated blast furnace slag based self curing bio-geopolymer concrete. Constr. Build. Mater. 2017, 149, 338–349. [Google Scholar] [CrossRef]
- Lee, N.K.; Lee, H.K. Setting and mechanical properties of alkali-activated fly ash/slag concrete manufactured at room temperature. Constr. Build. Mater. 2013, 47, 1201–1209. [Google Scholar] [CrossRef]
- Mallikarjuna Rao, G.; Gunneswara Rao, T.D. A quantitative method of approach in designing the mix proportions of fly ash and GGBS-based geopolymer concrete. Aust. J. Civ. Eng. 2018, 16, 53–63. [Google Scholar] [CrossRef]
- Rashad, A.M. Properties of alkali-activated fly ash concrete blended with slag. Iran. J. Mater. Sci. Eng. 2013, 10, 57–64. [Google Scholar]
- Aydin, S.; Baradan, B. Effect of activator type and content on properties of alkali-activated slag mortars. Compos. Part B Eng. 2014, 57, 166–172. [Google Scholar] [CrossRef]
- Imbabi, M.S.; Carrigan, C.; McKenna, S. Trends and developments in green cement and concrete technology. Int. J. Sustain. Built Environ. 2012, 1, 194–216. [Google Scholar] [CrossRef] [Green Version]


| Attributes | GPC | OPC | Summary | References |
|---|---|---|---|---|
| Tensile strength | Greater | Lower | GPC has higher strength due to presence of aluminosilicate, activators and types of activators that enhance the strength at early age. | [32] |
| Acid attack | More resistance | Less resistance | Presence of aluminosilicate, activators and types of activators show enhanced resistance to acidic attack | [33] |
| Durability | More resistance | Less resistance | Presence of aluminosilicate, activators and types of activators show enhanced resistance to acidic attack | [34] |
| Compressive strength | Higher | Lower | Same factors as tensile strength | [35] |
| Porosity | Significantly less | Moderate | Internal geopolymeric structure and presence of aluminosilicate, activators and types of activators influence GPC porosity. | [36] |
| Fire resistance | Significantly higher | Limited | GPC concrete is more resistant to deterioration caused by high temperatures as compared to OPC. | [37] |
| CO2 emission | Lower | Higher | Utilization of waste materials shows lesser CO2 as compared to OPC | [38] |
| Variables Used | Acronym | Minima | Maxima |
|---|---|---|---|
| Input variables | |||
| Fly ash | FA | 0 | 400 |
| Fine aggregate | FIA | 547 | 810.6 |
| Ground granulated blast furnace slag | GGBS | 0 | 409 |
| Coarse aggregate | CAA | 966 | 1293 |
| Sodium hydroxide | NaOH | 9 | 143.3 |
| Sodium silicate | Na2SiO3 | 54 | 192.9 |
| Super plasticizer | SP | 0 | 180 |
| Temperature | T °C | 0 | 60 |
| Output | |||
| Compressive strength | fc’ | 10.5 | 89.6 |
| Statistical Description | FA | GGBS | Fine | Coarse | NaOH | Na2SiO3 | SP | NaOH | Temp. |
|---|---|---|---|---|---|---|---|---|---|
| Mean | 252.5 | 151.4 | 729.8 | 1096.0 | 60.5 | 123.0 | 77.6 | 8.6 | 28.1 |
| Standard Error | 6.9 | 6.9 | 5.4 | 9.4 | 2.1 | 2.9 | 6.5 | 0.3 | 1.6 |
| Median | 270.0 | 135.0 | 760.5 | 1090.8 | 57.1 | 115.7 | 7.9 | 8.0 | 25.0 |
| Mode | 303.8 | 101.3 | 774.0 | 1090.8 | 81.0 | 81.0 | 0.0 | 8.0 | 30.0 |
| Standard Deviation | 86.3 | 86.7 | 68.0 | 117.9 | 26.8 | 35.7 | 81.0 | 3.9 | 20.6 |
| Sample Variance | 7442.7 | 7522.7 | 4620.5 | 13,889.3 | 720.4 | 1275.1 | 6558.3 | 15.2 | 422.4 |
| Kurtosis | 2.5 | 2.2 | 0.0 | −1.5 | 3.0 | −0.9 | −1.9 | 0.2 | −0.9 |
| Skewness | −1.4 | 1.3 | −0.8 | 0.3 | 1.2 | 0.1 | 0.2 | −0.5 | 0.3 |
| Range | 400.0 | 409.0 | 263.6 | 327.0 | 134.3 | 138.9 | 180.0 | 16.0 | 60.0 |
| Minimum | 0.0 | 0.0 | 547.0 | 966.0 | 9.0 | 54.0 | 0.0 | 0.0 | 0.0 |
| Maximum | 400.0 | 409.0 | 810.6 | 1293.0 | 143.3 | 192.9 | 180.0 | 16.0 | 60.0 |
| Sum | 39,384.5 | 23,624.5 | 113,849.2 | 170,980.4 | 9432.3 | 19,185.4 | 12,100.6 | 1336.0 | 4380.0 |
| Count | 156.0 | 156.0 | 156.0 | 156.0 | 156.0 | 156.0 | 156.0 | 156.0 | 156.0 |
| Technique Used | Ensemble Approaches | Machine-Learning Methods | Ensemble Models | Optimum Estimator | R2-Value |
|---|---|---|---|---|---|
| Individual | - | DT | - | - | 0.7623 |
| - | SVR | - | - | 0.7923 | |
| Ensemble | Bagging | DT - Bagging | (10,20,30….200) | 09 | 0.9206 |
| SVR - Bagging | (10,20,30….200) | 12 | 0.9300 | ||
| Ensemble | Boosting | DT - AdaBoost | (10,20,30….200) | 05 | 0.9257 |
| SVR - AdaBoost | (10,20,30….200) | 04 | 0.9005 | ||
| Modified learner | RF | (10,20,30….200) | 10 | 0.9388 |
| Approaches Use | ML Methods | MAE | MSE | RMSE |
|---|---|---|---|---|
| Individual learner | DT | 7.69 | 63.20 | 7.95 |
| SVR | 5.69 | 55.20 | 7.43 | |
| Ensembling with AdaBoost | DT | 3.59 | 20.70 | 4.55 |
| SVR | 4.14 | 27.87 | 5.28 | |
| Ensembling with bagging | DT | 3.22 | 21.52 | 4.64 |
| SVR | 3.76 | 21.62 | 4.65 | |
| Ensemble model | RF | 3.21 | 16.89 | 4.11 |
Publisher’s Note: MDPI stays neutral with regard to jurisdictional claims in published maps and institutional affiliations. |
© 2022 by the authors. Licensee MDPI, Basel, Switzerland. This article is an open access article distributed under the terms and conditions of the Creative Commons Attribution (CC BY) license (https://creativecommons.org/licenses/by/4.0/).
Share and Cite
Amin, M.N.; Khan, K.; Javed, M.F.; Aslam, F.; Qadir, M.G.; Faraz, M.I. Prediction of Mechanical Properties of Fly-Ash/Slag-Based Geopolymer Concrete Using Ensemble and Non-Ensemble Machine-Learning Techniques. Materials 2022, 15, 3478. https://doi.org/10.3390/ma15103478
Amin MN, Khan K, Javed MF, Aslam F, Qadir MG, Faraz MI. Prediction of Mechanical Properties of Fly-Ash/Slag-Based Geopolymer Concrete Using Ensemble and Non-Ensemble Machine-Learning Techniques. Materials. 2022; 15(10):3478. https://doi.org/10.3390/ma15103478
Chicago/Turabian StyleAmin, Muhammad Nasir, Kaffayatullah Khan, Muhammad Faisal Javed, Fahid Aslam, Muhammad Ghulam Qadir, and Muhammad Iftikhar Faraz. 2022. "Prediction of Mechanical Properties of Fly-Ash/Slag-Based Geopolymer Concrete Using Ensemble and Non-Ensemble Machine-Learning Techniques" Materials 15, no. 10: 3478. https://doi.org/10.3390/ma15103478
APA StyleAmin, M. N., Khan, K., Javed, M. F., Aslam, F., Qadir, M. G., & Faraz, M. I. (2022). Prediction of Mechanical Properties of Fly-Ash/Slag-Based Geopolymer Concrete Using Ensemble and Non-Ensemble Machine-Learning Techniques. Materials, 15(10), 3478. https://doi.org/10.3390/ma15103478