
Study on the Purity of Gold Leaf in a SO2 Atmosphere at Ambient Temperature


Abstract
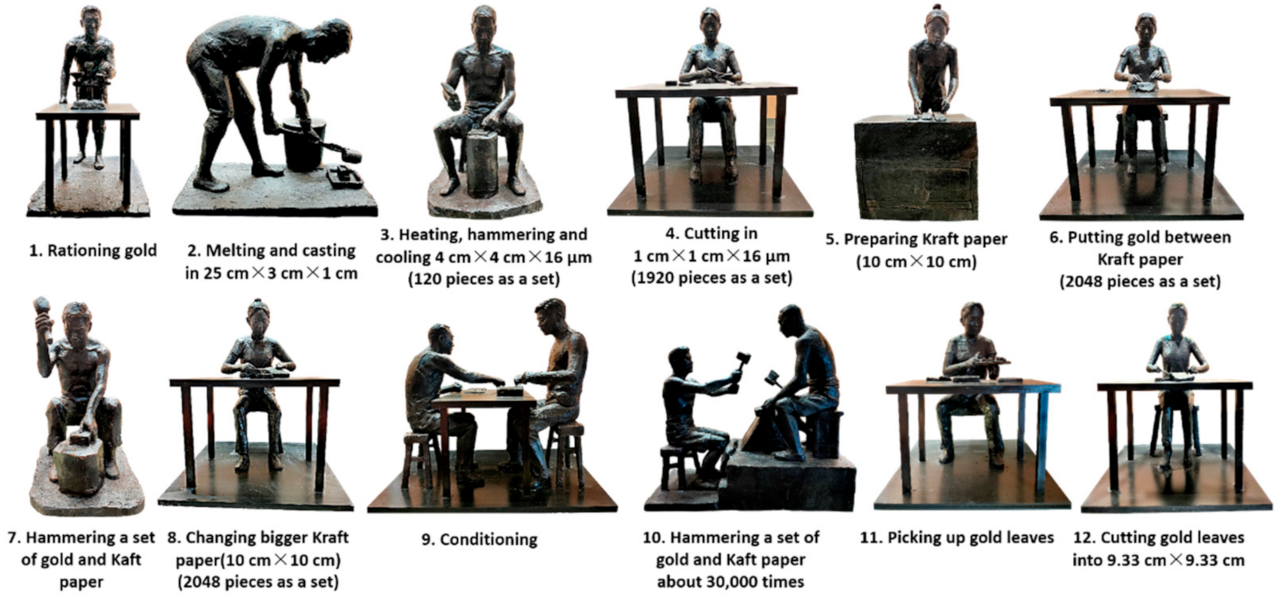
1. Introduction
2. Materials and Methods
2.1. Materials
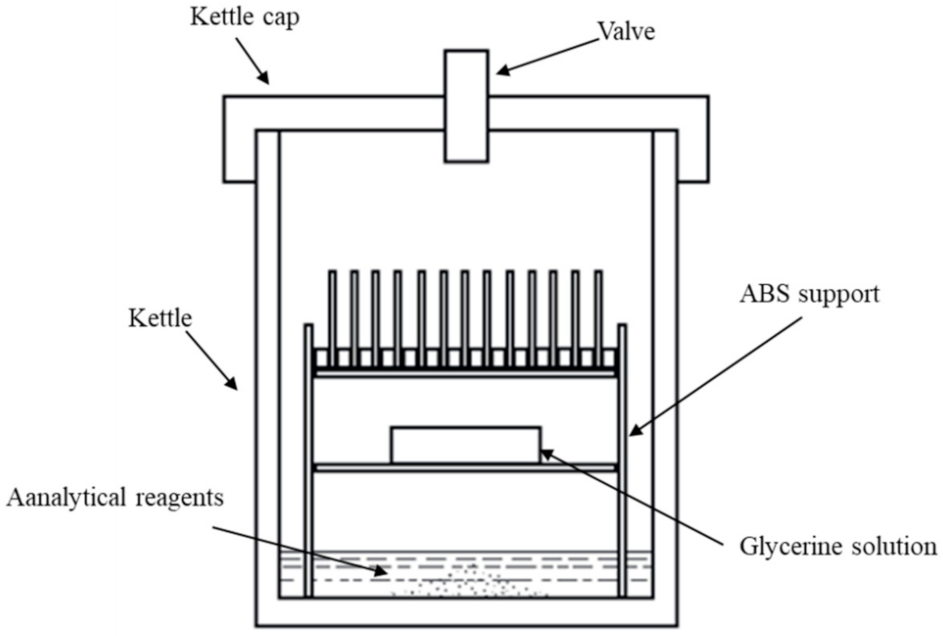
2.2. Corrosion Test
2.3. Corrosion Rate
2.4. Color Measurement
2.5. Gloss Evaluation
2.6. Morphological Characteristics and XPS Analysis
3. Results and Discussion
3.1. Corrosion Rate
3.2. Color Measurement
3.3. Gloss Evaluation
3.4. Morphology
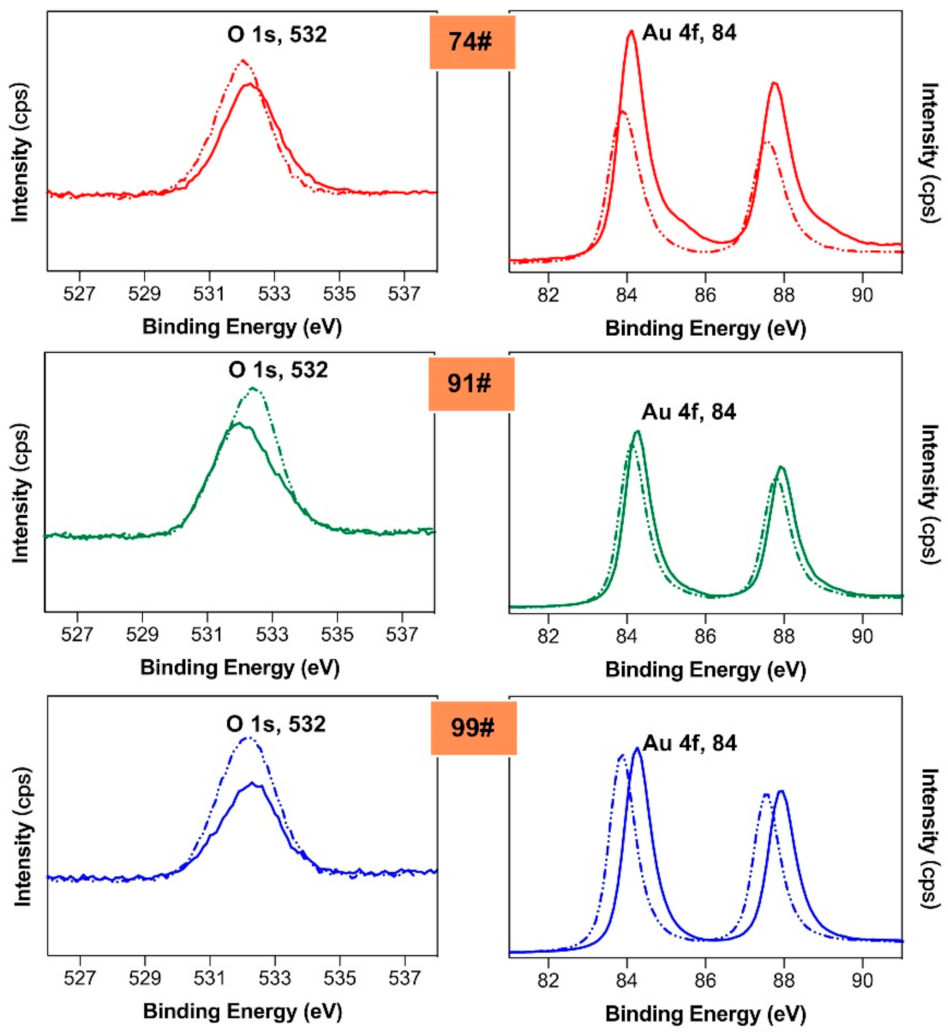
3.5. EDX and XPS Analysis
4. Conclusions
Author Contributions
Funding
Institutional Review Board Statement
Informed Consent Statement
Data Availability Statement
Acknowledgments
Conflicts of Interest
References
- Mei, J.; Wang, P.; Chen, K.; Wang, L.; Wang, Y.; Liu, Y. Archaeometallurgical studies in china: Some recent developments and challenging issues. J. Archaeol. Sci. 2015, 56, 221–232. [Google Scholar] [CrossRef]
- Hu, J.; Wu, Z.; Jin, L. Museum display showcase furniture system research based on internet of things technology in intelligent environment. Complexity 2021, 6689744. [Google Scholar] [CrossRef]
- Zhang, T.; Gao, T.; Wu, Z.; Sun, T. Reinforced Strength Evaluation of Binding Material for the Restoration of Chinese Ancient Lacquer Furniture. BioResources 2019, 14, 7182–7192. [Google Scholar] [CrossRef]
- Xiong, X.; Ma, Q.; Yuan, Y.; Wu, Z.; Zhang, M. Current situation and key manufacturing considerations of green furniture in china: A review. J. Clean. Prod. 2020, 267, 121957. [Google Scholar] [CrossRef]
- Hu, W.; Liu, N.; Xu, L.; Guan, H. Study on cold/warm sensation of materials used in desktop of furniture. Wood Res. 2020, 65, 497–506. [Google Scholar] [CrossRef]
- Hu, W.; Liu, N.; Guan, H. Optimal design of a furniture frame by reducing the volume of wood. Drewno 2019, 62, 85–97. [Google Scholar]
- Gu, Y.; Zhang, J. Tensile properties of natural and synthetic rattan strips used as furniture woven materials. Forests 2020, 11, 1299. [Google Scholar] [CrossRef]
- Chen, C.; Kuang, F.; Tor, O.; Quin, F.; Zhang, J. Ultimate direct withdrawal loads of low shear strength wooden dowels in selected wood species for furniture applications. Bioresources 2019, 14, 8987–9000. [Google Scholar]
- Xiong, X.; Guo, W.; Fang, L.; Zhang, M.; Wu, Z.; Lu, R.; Miyakoshi, T. Current state and development trend of Chinese furniture industry. J. Wood Sci. 2017, 63, 497–506. [Google Scholar] [CrossRef]
- Tian, X.; Ma, Q.; Zheng, M.; Li, Z. Gold Leaf Corrosion in Moisture Acid Atmosphere at Ambient Temperature. Rare Met. Mater. Eng. 2014, 43, 2637–2642. [Google Scholar]
- Rivers, S.; Umney, N. Conservation of Furniture; Butterworth-Heinemann: Burlington, NJ, USA, 2003; pp. 210–213. [Google Scholar]
- Parra, C.; Aristizabal, J.; Arce, B.; Montero-Silva, F.; Lascano, S.; Henriquez, R.; Lazcano, P.; Giraldo-Gallo, P.; Ramírez, C.; Henrique Rodrigues da Cunha, T.; et al. Graphene Coating as an Effective Barrier to Prevent Bacteria-Mediated Dissolution of Gold. Metals 2021, 11, 147. [Google Scholar] [CrossRef]
- Zhong, Q.; Yang, Y.; Chen, L.; Li, Q.; Xu, B.; Jiang, T. Intensification Behavior of Mercury Ions on Gold Cyanide Leaching. Metals 2018, 8, 80. [Google Scholar] [CrossRef]
- Bedogni, R.; Esposito, A.; Gentile, A.; Angelone, M.; Gualdrini, G. Determination and validation of a response matrix for a passive bonner sphere spectrometer based on gold foils. Radiat. Meas. 2008, 43, 1104–1107. [Google Scholar] [CrossRef]
- Skobelev, N.; Kalpakchieva, R.; Astabatyan, R.; Vincour, A.; Kulko, A.; Lobastov, S.; Lukyanov, S.; Markaryan, E.; Maslov, V.; Penionzhkevich, Y.; et al. Exit charge-state distributions of 242.8 Mev and 264.5 Mev 48Ca ions incident on carbon and gold foils. Nucl. Instrum. Methods Phys. Res. Sect. B Beam Interact. Mater. At. 2005, 227, 471–478. [Google Scholar] [CrossRef]
- Yun, S.; Kim, S.; Kim, K.; Lee, Y. A systematic study of the synthesis of monolayer tungsten diselenide films on gold foil. Curr. Appl. Phys. 2016, 16, 1216–1222. [Google Scholar] [CrossRef]
- Gao, F.; Zhou, X.; Zhou, H.; Li, M.; Tong, H.; Liu, S. Characterization and analysis of sandstone substrate, mortar layers, gold foils, and paintings of the Avalokitesvara statues in dazu county (China). J. Cult. Herit. 2016, 21, 881–888. [Google Scholar] [CrossRef]
- Thomas, D.; Bardell, A.; Macaulay, E. Characterisation of a gold foil-based bonner sphere set and measurements of neutron spectra at a medical accelerator. Nucl. Instrum. Methods Phys. Res. Sect. A Accel. Spectrometers Detect. Assoc. Equip. 2002, 476, 31–35. [Google Scholar] [CrossRef]
- Yang, Y.; Lai, M.; Zhong, Q.; Li, Q.; Xu, B.; Jiang, T. Study on Intensification Behavior of Bismuth Ions on Gold Cyanide Leaching. Metals 2019, 9, 362. [Google Scholar] [CrossRef]
- Wang, D.; Zhang, Z.; Fu, L.; Yao, J. Characteristics and distribution of acid rain and its destruction to the statue rock wall in Dazu County. Hydrogeol. Eng. Geol. 1995, 3, 9–24. (In Chinese) [Google Scholar]
- Wong, V.; Graham, S. Effect of repeat use and coating defects of gold foil electrodes on electroretinogram recording. Vis. Res. 1995, 35, 2795. [Google Scholar] [CrossRef][Green Version]
- Chen, A.; Shi, S.; Wang, J.; Liu, F.; Xie, X. Microstructure and electrocatalytic performance of nanoporous gold foils decorated by TiO2 coatings. Surf. Coat. Technol. 2016, 286, 113–118. [Google Scholar] [CrossRef]
- Mathew, F.; Chilian, C.; Montgomery, L.; Kildea, J. Development of a passive gold-foil nested neutron spectrometer to validate the active current-mode he-3 measurements in a high neutron fluence rate radiotherapy environment. Nucl. Instrum. Methods Phys. Res. Sect. A Accel. Spectrometers Detect. Assoc. Equip. 2021, 985, 164662. [Google Scholar] [CrossRef]
- Rieders, N.; Nandasiri, M.; Mogk, D.; Avci, R. New Insights into Sulfide Inclusions in 1018 Carbon Steels. Metals 2021, 11, 428. [Google Scholar] [CrossRef]
- Ortega, M.; Tenorio-Castilleros, D.; Segura-Venzor, I.; Miranda-Hernández, J.; Velasco, M. An archaeometallurgical study of mixtec silver gold alloy foils from tomb No. 7, monte alban, oaxaca, méxico. Mater. Chem. Phys. 2020, 242, 2019242. [Google Scholar]
- Vukanac, I.; Novkovi, D.; Kandi, A.; Naer, L. Determination of impurity content in gold foils. Radiat. Meas. 2005, 39, 417–420. [Google Scholar] [CrossRef]
- Ko, G.; Kim, W.; Kwon, K.; Lee, T.-K. The Corrosion of Stainless Steel Made by Additive Manufacturing: A Review. Metals 2021, 11, 516. [Google Scholar] [CrossRef]
- Panemangalore, D.B.; Shabadi, R.; Gupta, M. Corrosion Behavior, Microstructure and Mechanical Properties of Novel Mg-Zn-Ca-Er Alloy for Bio-Medical Applications. Metals 2021, 11, 519. [Google Scholar] [CrossRef]
- ASTM. ASTM D5032—97, Standard Practice for Maintaining Constant Relative Humidity by Means of Aqueous Glycerin Solutions; ASTM: West Conshohocken, PA, USA, 2003. [Google Scholar]


| Incidence Angles → | 20° | 60° | 85° | |
|---|---|---|---|---|
| Gold Leaf ↓ | Condition ↓ | |||
| 99# | Control | 982.5 ± 8.1 | 715.5 ± 7.8 | 135.5 ± 3.7 |
| 30% | 929.4 ± 7.6 | 696.0 ± 6.4 | 126.8 ± 2.9 | |
| 60% | 856.5 ± 8.3 | 634.8 ± 5.9 | 124.5 ± 3.2 | |
| 90% | 779.7 ± 6.7 | 592.5 ± 5.6 | 121.7 ± 2.3 | |
| 91# | Control | 897.8 ± 5.9 | 712.7 ± 6.3 | 135.9 ± 4.2 |
| 30% | 874.2 ± 5.3 | 629.8 ± 5.2 | 132.6 ± 2.7 | |
| 60% | 779.3 ± 6.1 | 627.8 ± 6.1 | 129.4 ± 2.9 | |
| 90% | 724.9 ± 4.7 | 623.8 ± 6.6 | 127.4 ± 1.9 | |
| 74# | Control | 986.0 ± 9.6 | 746.1 ± 6.4 | 132.8 ± 5.1 |
| 30% | 910.0 ± 10.2 | 720.2 ± 5.9 | 129.8 ± 3.1 | |
| 60% | 896.1 ± 8.7 | 711.9 ± 5.3 | 128.1 ± 3.4 | |
| 90% | 887.0 ± 9.3 | 703.3 ± 6.7 | 127.3 ± 2.1 | |
| Chemical Elements → | Au | Pt | Ag | Cu | O | C | S | |
|---|---|---|---|---|---|---|---|---|
| Gold Leaf ↓ | Condition ↓ | |||||||
| 99# | Control | 95.47 | 1.91 | 1.23 | 1.34 | 0.02 | 0.03 | 0.00 |
| 30% | 88.12 | 1.74 | 1.14 | 1.30 | 5.94 | 1.23 | 0.53 | |
| 60% | 86.88 | 1.73 | 1.11 | 1.24 | 6.04 | 2.11 | 0.89 | |
| 90% | 85.20 | 1.69 | 1.04 | 1.31 | 7.22 | 2.31 | 1.23 | |
| 91# | Control | 86.45 | 2.33 | 5.70 | 4.93 | 0.12 | 0.47 | 0.00 |
| 30% | 81.33 | 2.19 | 5.34 | 5.22 | 3.98 | 0.99 | 0.95 | |
| 60% | 79.24 | 2.14 | 5.22 | 5.06 | 4.73 | 2.34 | 1.27 | |
| 90% | 77.03 | 2.08 | 5.03 | 4.96 | 6.21 | 3.15 | 1.54 | |
| 74# | Control | 68.73 | 4.26 | 20.31 | 5.33 | 0.78 | 0.59 | 0.00 |
| 30% | 63.86 | 3.96 | 19.87 | 5.23 | 4.56 | 1.68 | 0.84 | |
| 60% | 60.43 | 3.75 | 17.86 | 5.89 | 8.47 | 2.53 | 1.07 | |
| 90% | 56.95 | 3.52 | 16.84 | 5.59 | 11.56 | 3.85 | 1.69 | |
Publisher’s Note: MDPI stays neutral with regard to jurisdictional claims in published maps and institutional affiliations. |
© 2021 by the authors. Licensee MDPI, Basel, Switzerland. This article is an open access article distributed under the terms and conditions of the Creative Commons Attribution (CC BY) license (https://creativecommons.org/licenses/by/4.0/).
Share and Cite
Huang, H.; Xu, G.; Liu, X. Study on the Purity of Gold Leaf in a SO2 Atmosphere at Ambient Temperature. Materials 2021, 14, 2425. https://doi.org/10.3390/ma14092425
Huang H, Xu G, Liu X. Study on the Purity of Gold Leaf in a SO2 Atmosphere at Ambient Temperature. Materials. 2021; 14(9):2425. https://doi.org/10.3390/ma14092425
Chicago/Turabian StyleHuang, Houyi, Guanglin Xu, and Xinyou Liu. 2021. "Study on the Purity of Gold Leaf in a SO2 Atmosphere at Ambient Temperature" Materials 14, no. 9: 2425. https://doi.org/10.3390/ma14092425
APA StyleHuang, H., Xu, G., & Liu, X. (2021). Study on the Purity of Gold Leaf in a SO2 Atmosphere at Ambient Temperature. Materials, 14(9), 2425. https://doi.org/10.3390/ma14092425