
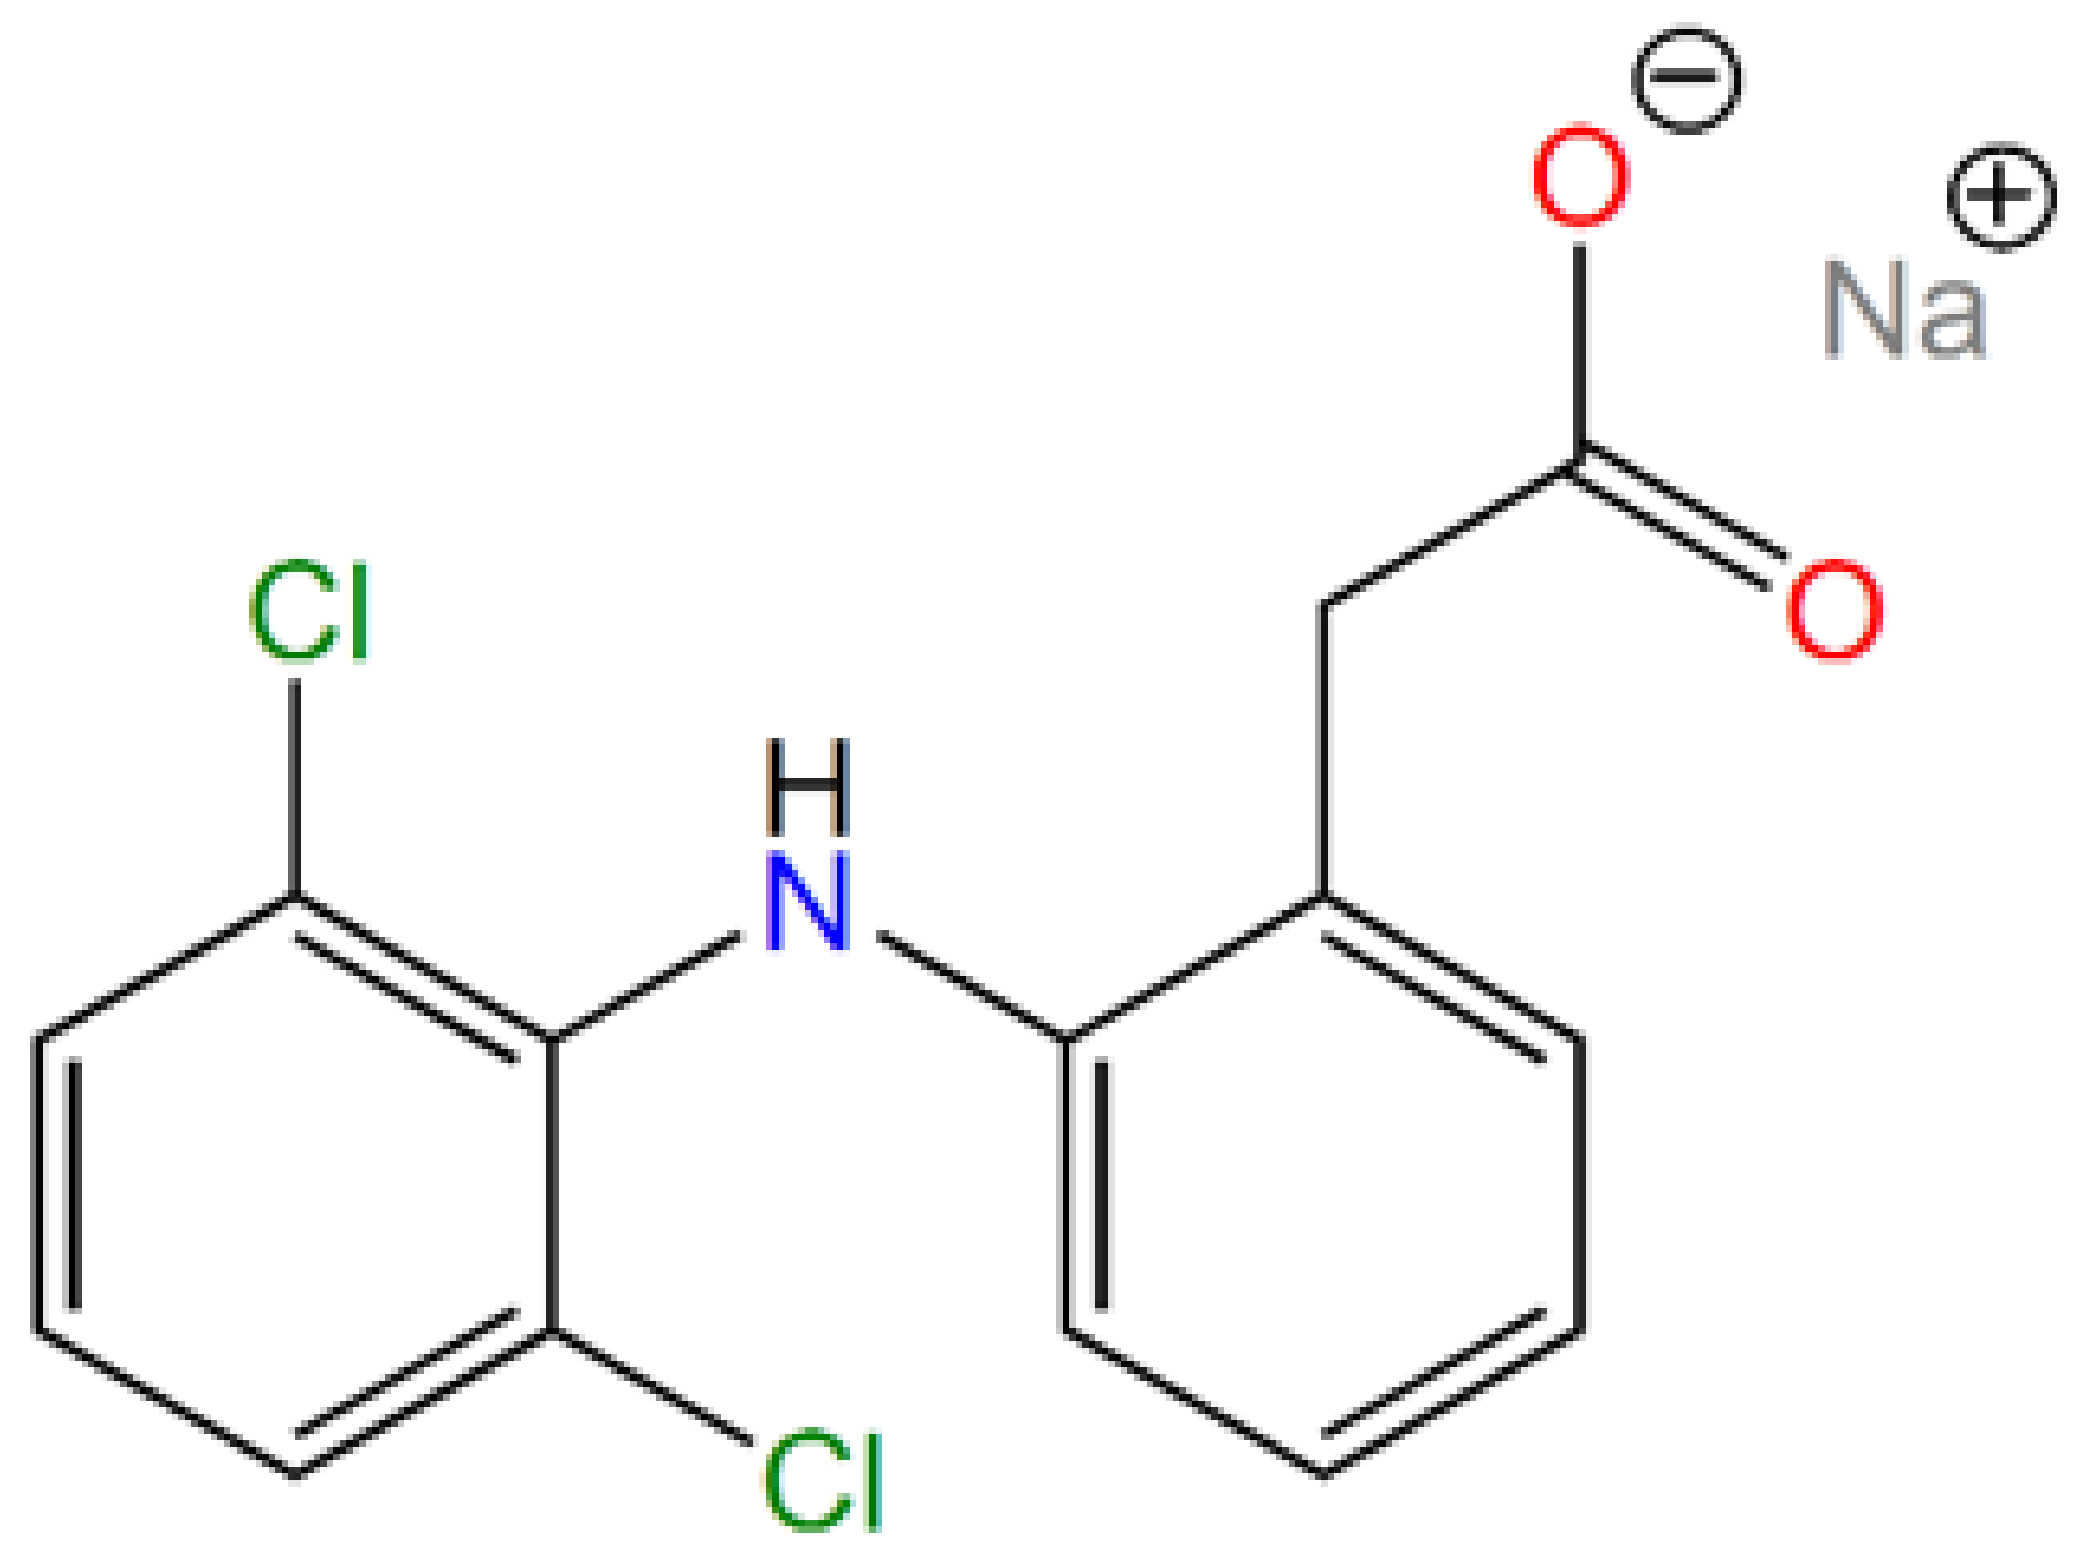
Thermosensitive Drug Delivery System SBA-15-PEI for Controlled Release of Nonsteroidal Anti-Inflammatory Drug Diclofenac Sodium Salt: A Comparative Study

 ,
,  ,
,  ,
, 

Abstract
1. Introduction
2. Materials and Methods
2.1. Used Chemicals
2.2. Preparation of SBA-15
2.3. Extraction/Calcination Process
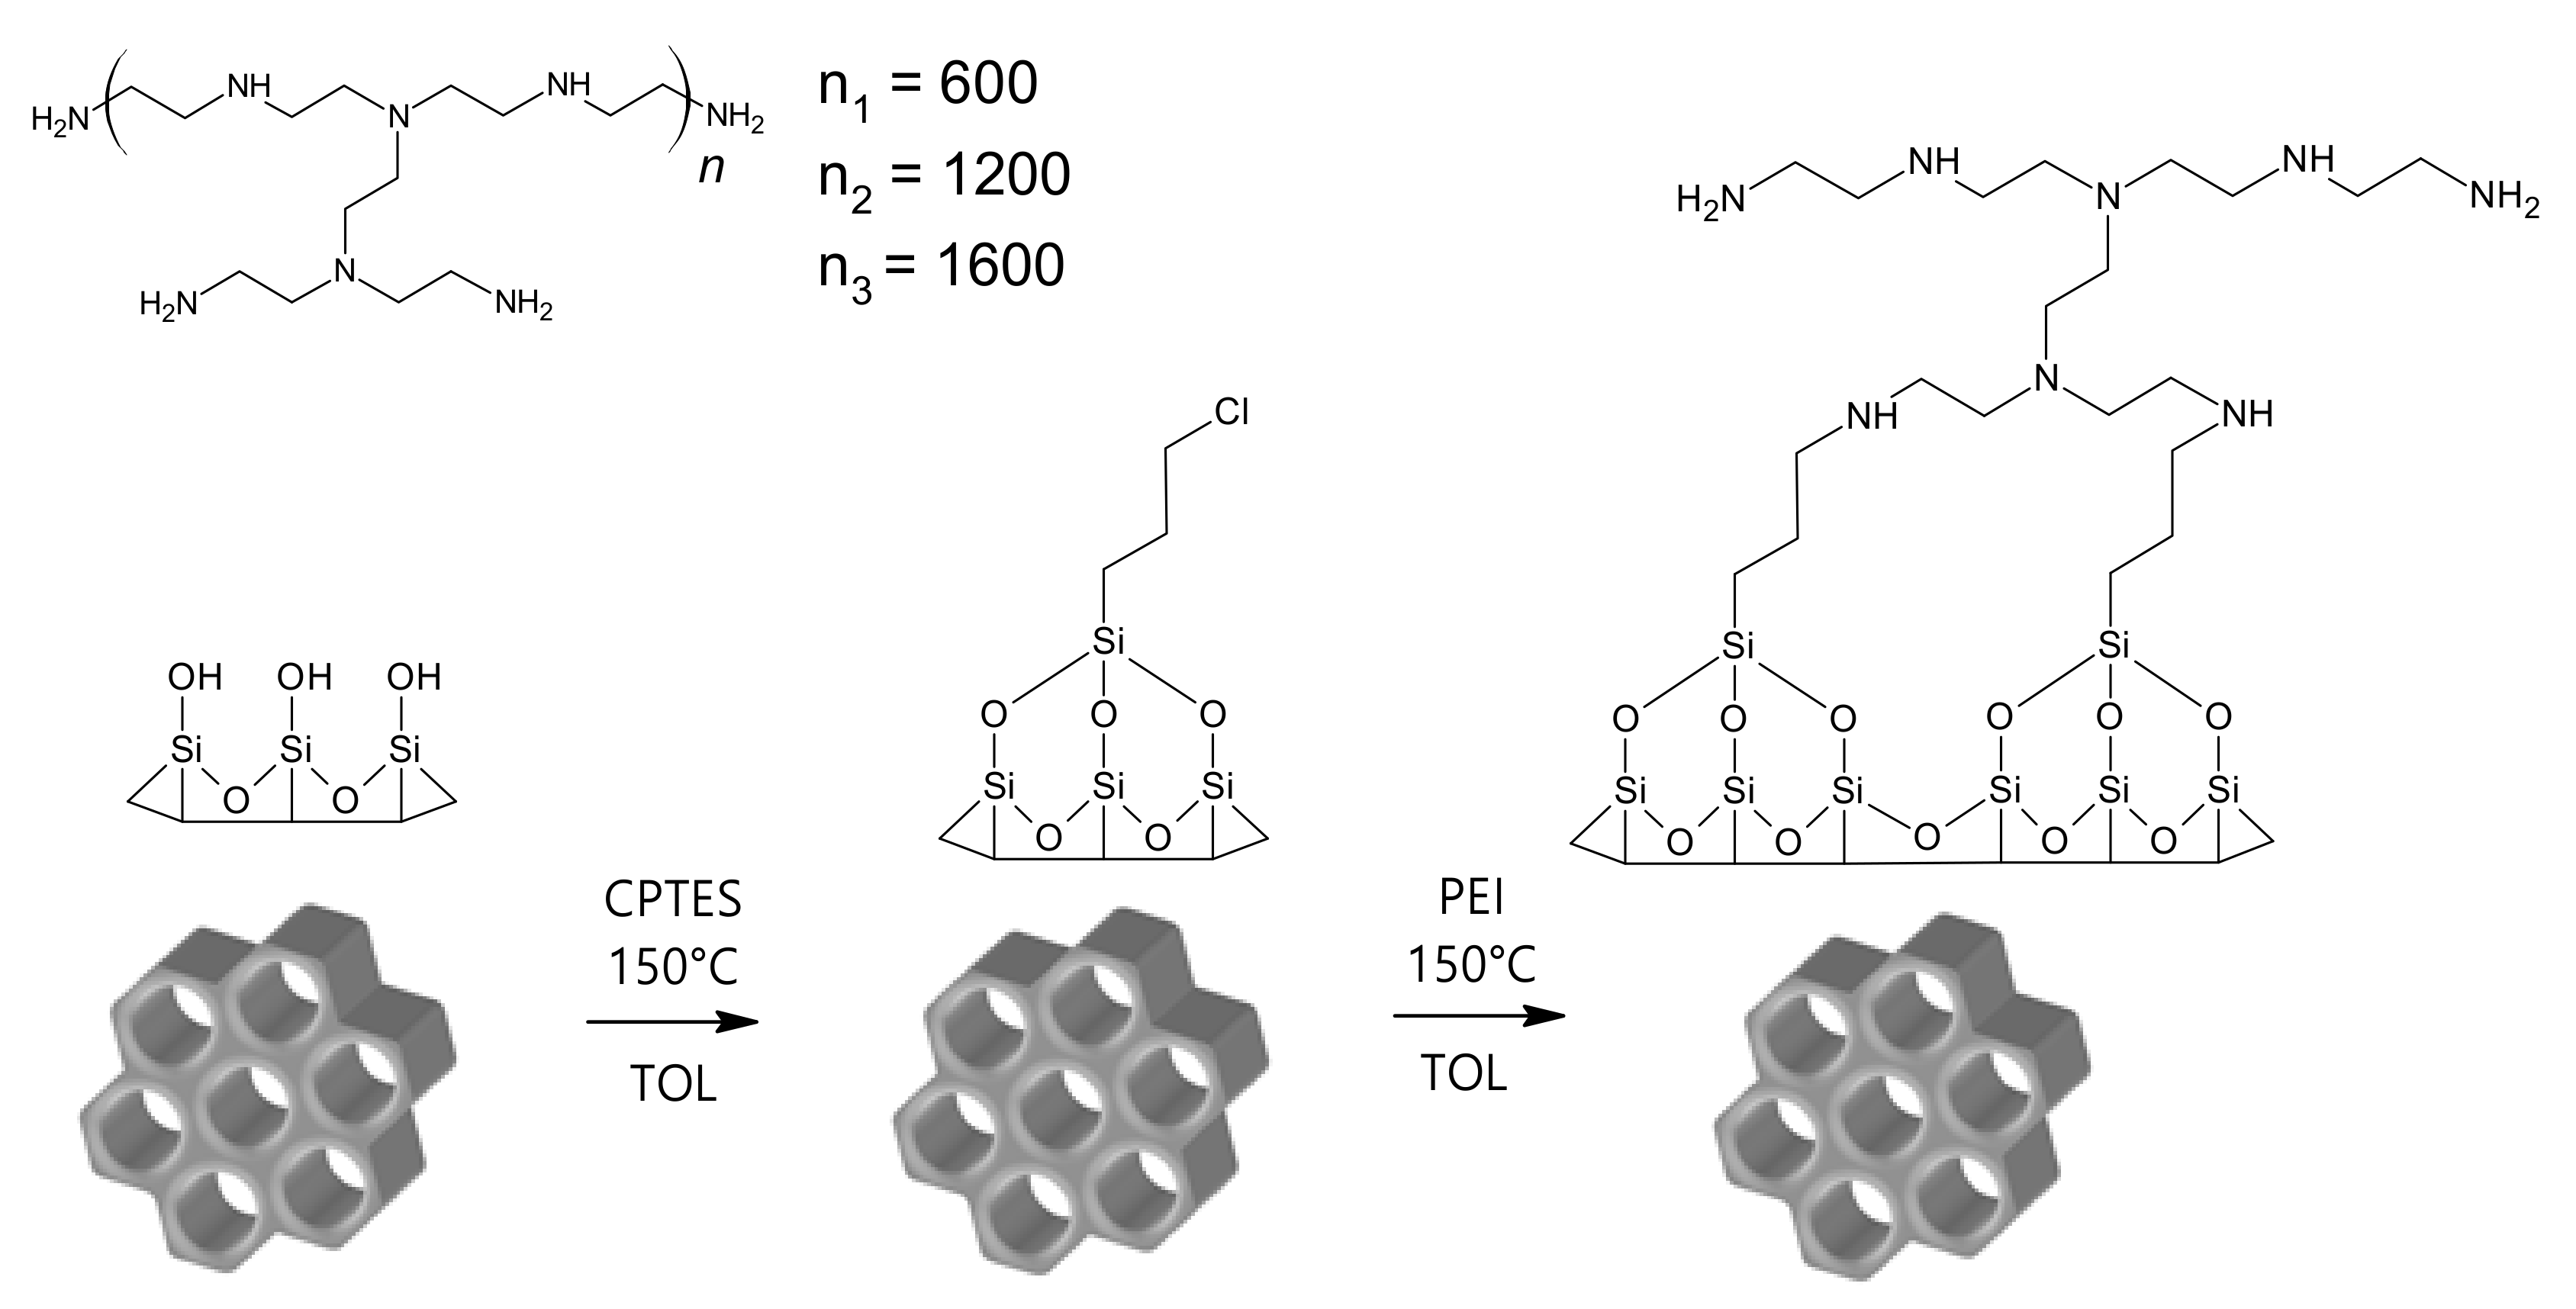
2.4. Surface Grafting and Modification
2.5. Drug Encapsulation
2.6. Drug Release
2.7. Drug Solubility
2.8. Characterization
3. Results and Discussion
3.1. Synthesis of SBA-15 and Surface Modification
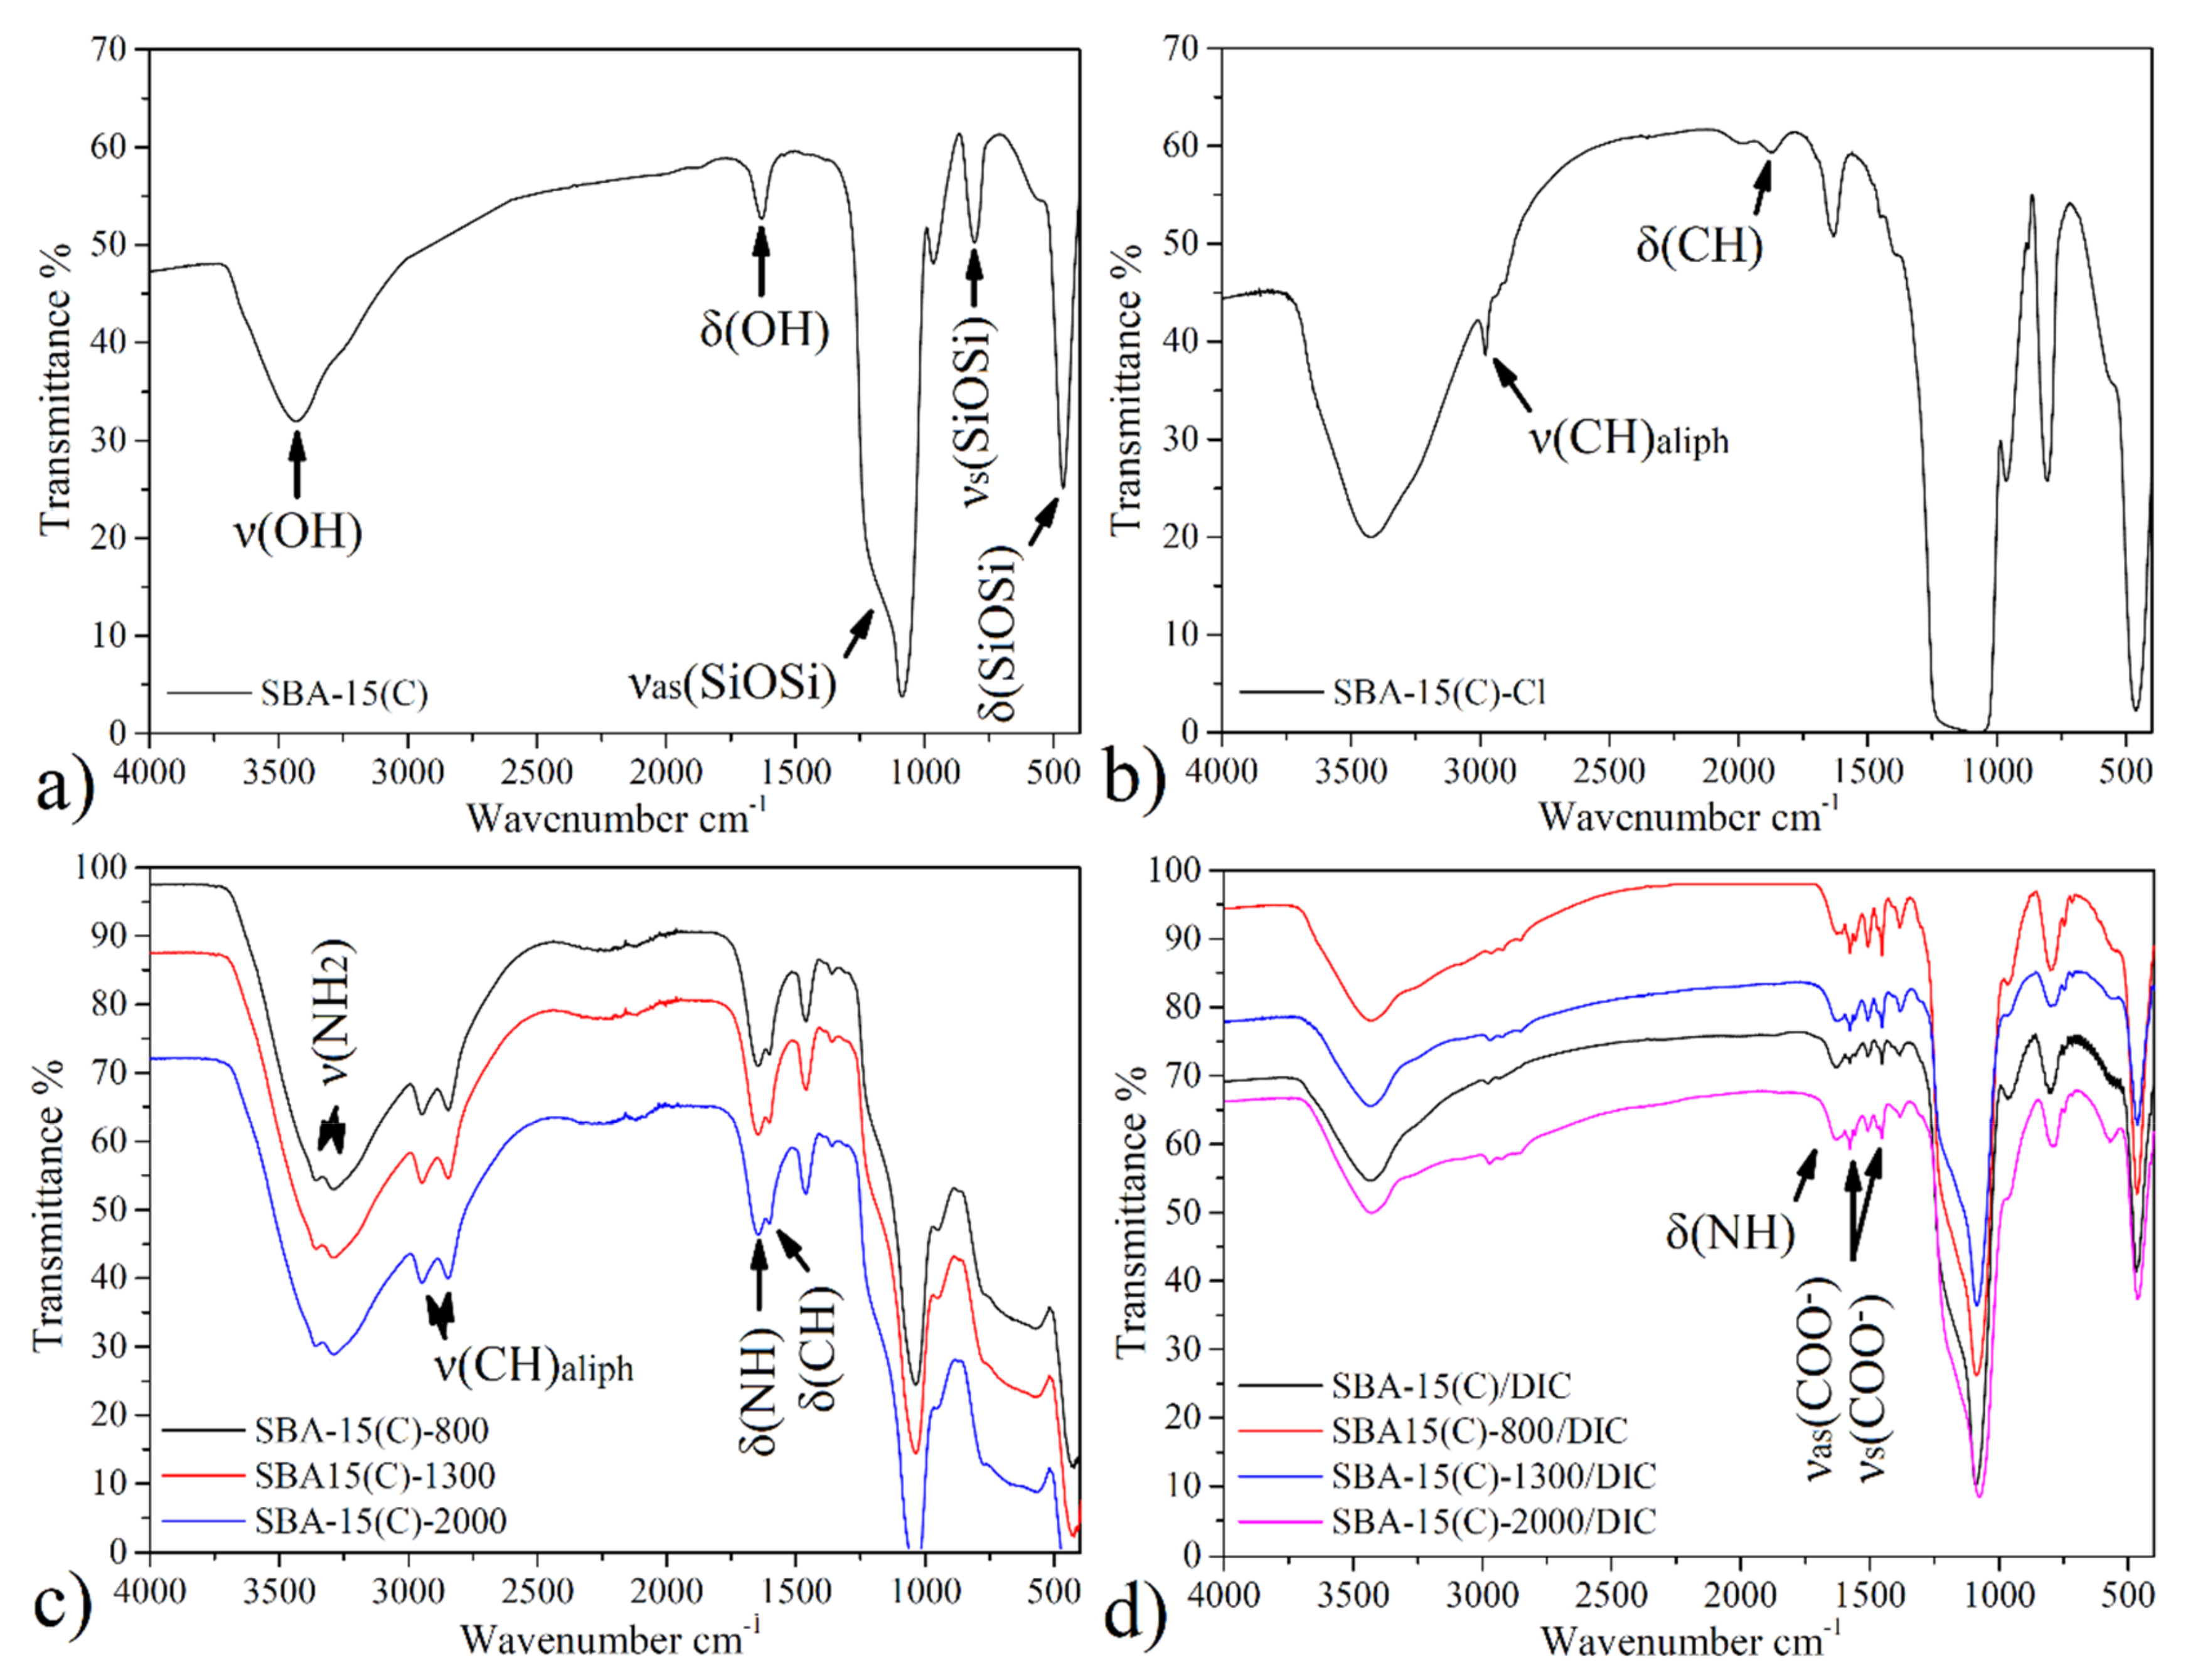
3.2. Infrared Spectroscopy
3.2.1. SBA-15 and Surface-Modified Samples
3.2.2. Diclofenac Sodium and Drug-Loaded Samples
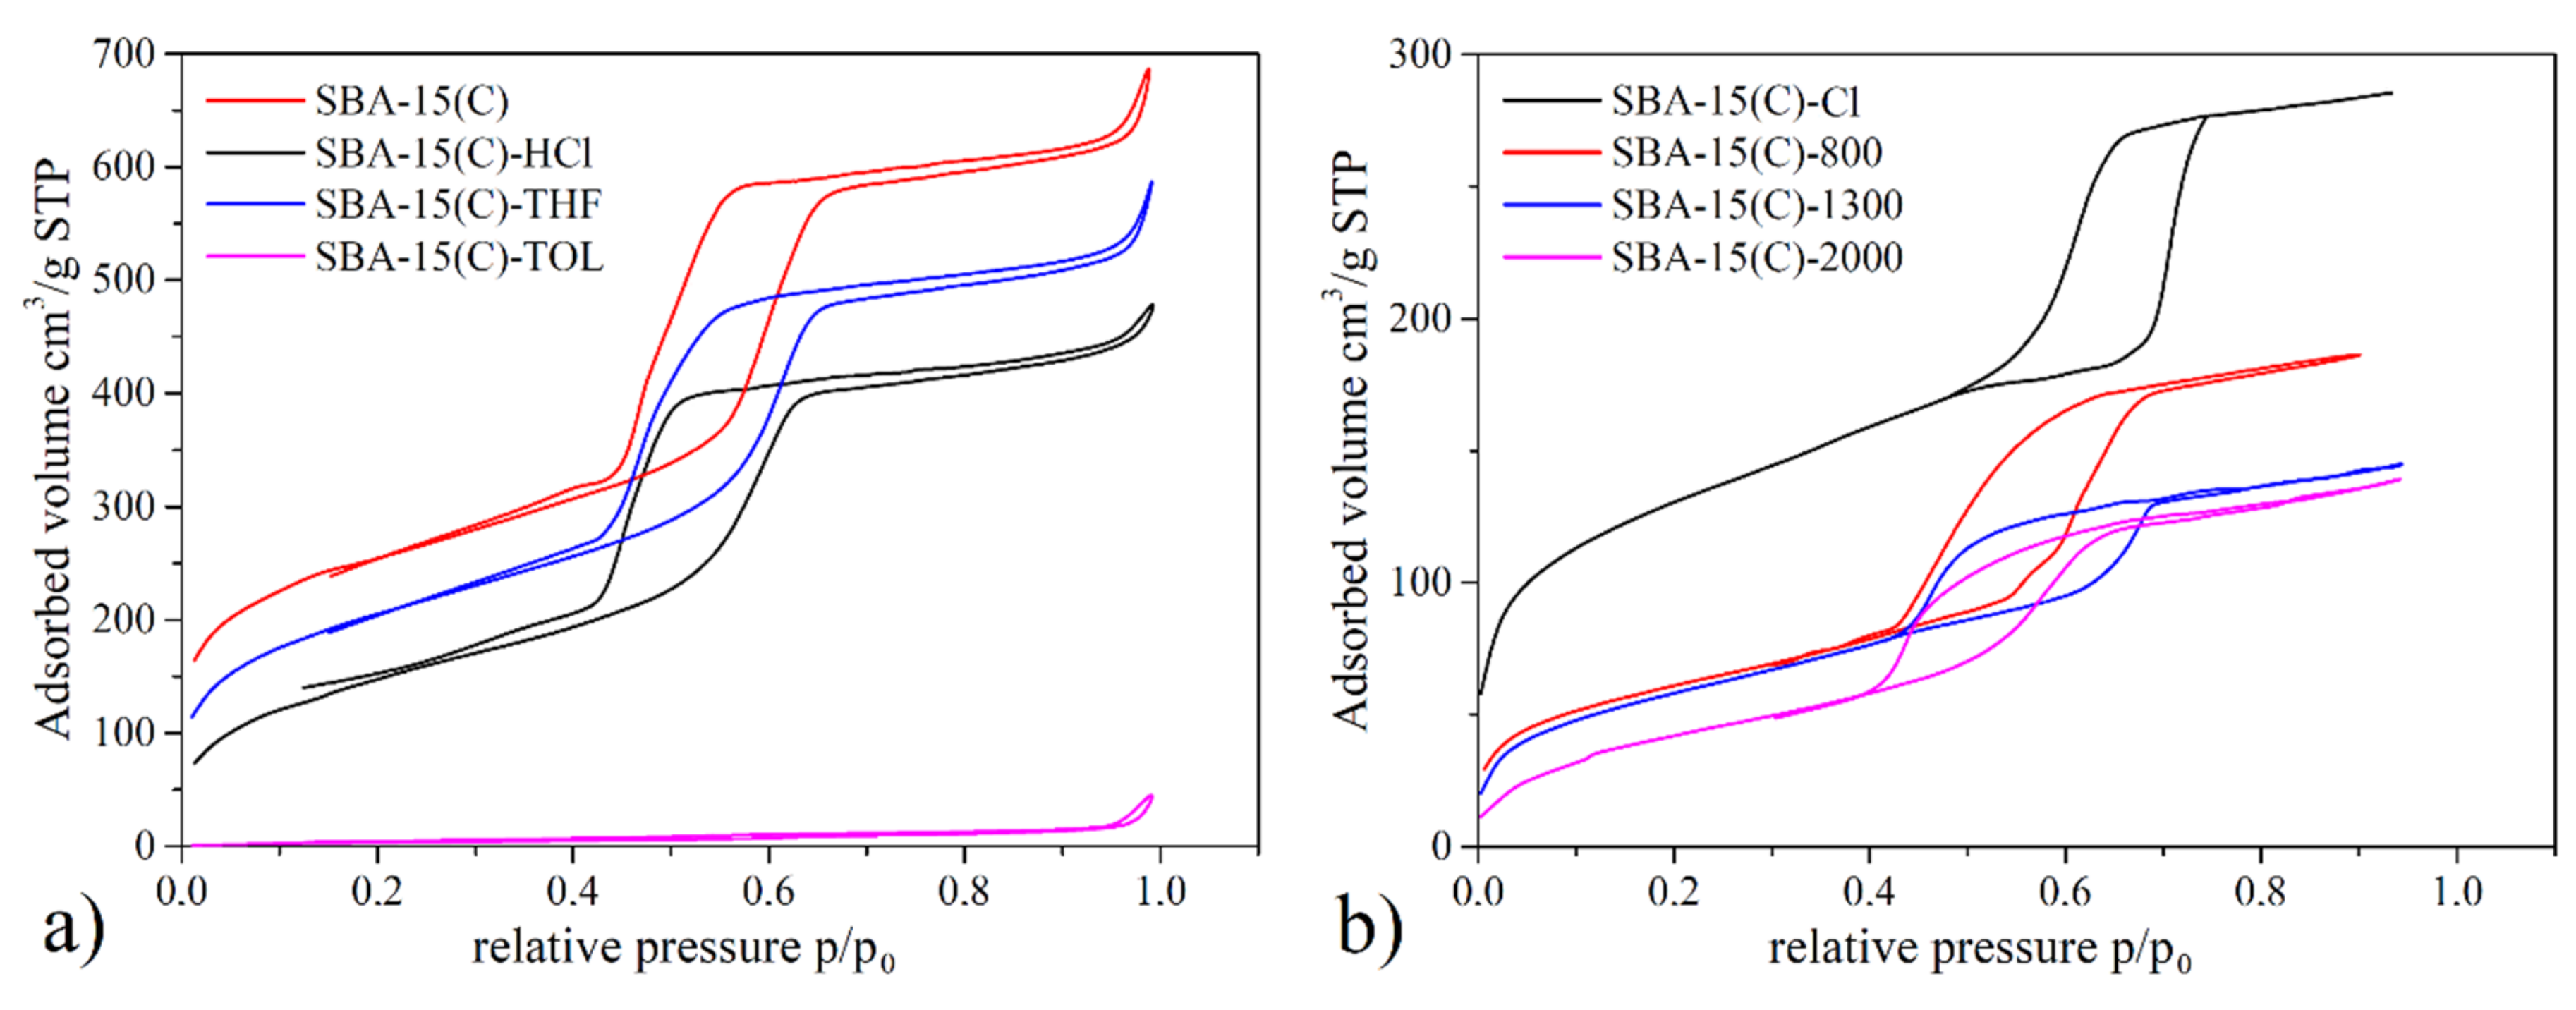
3.3. Nitrogen Adsorption/Desorption Measurements
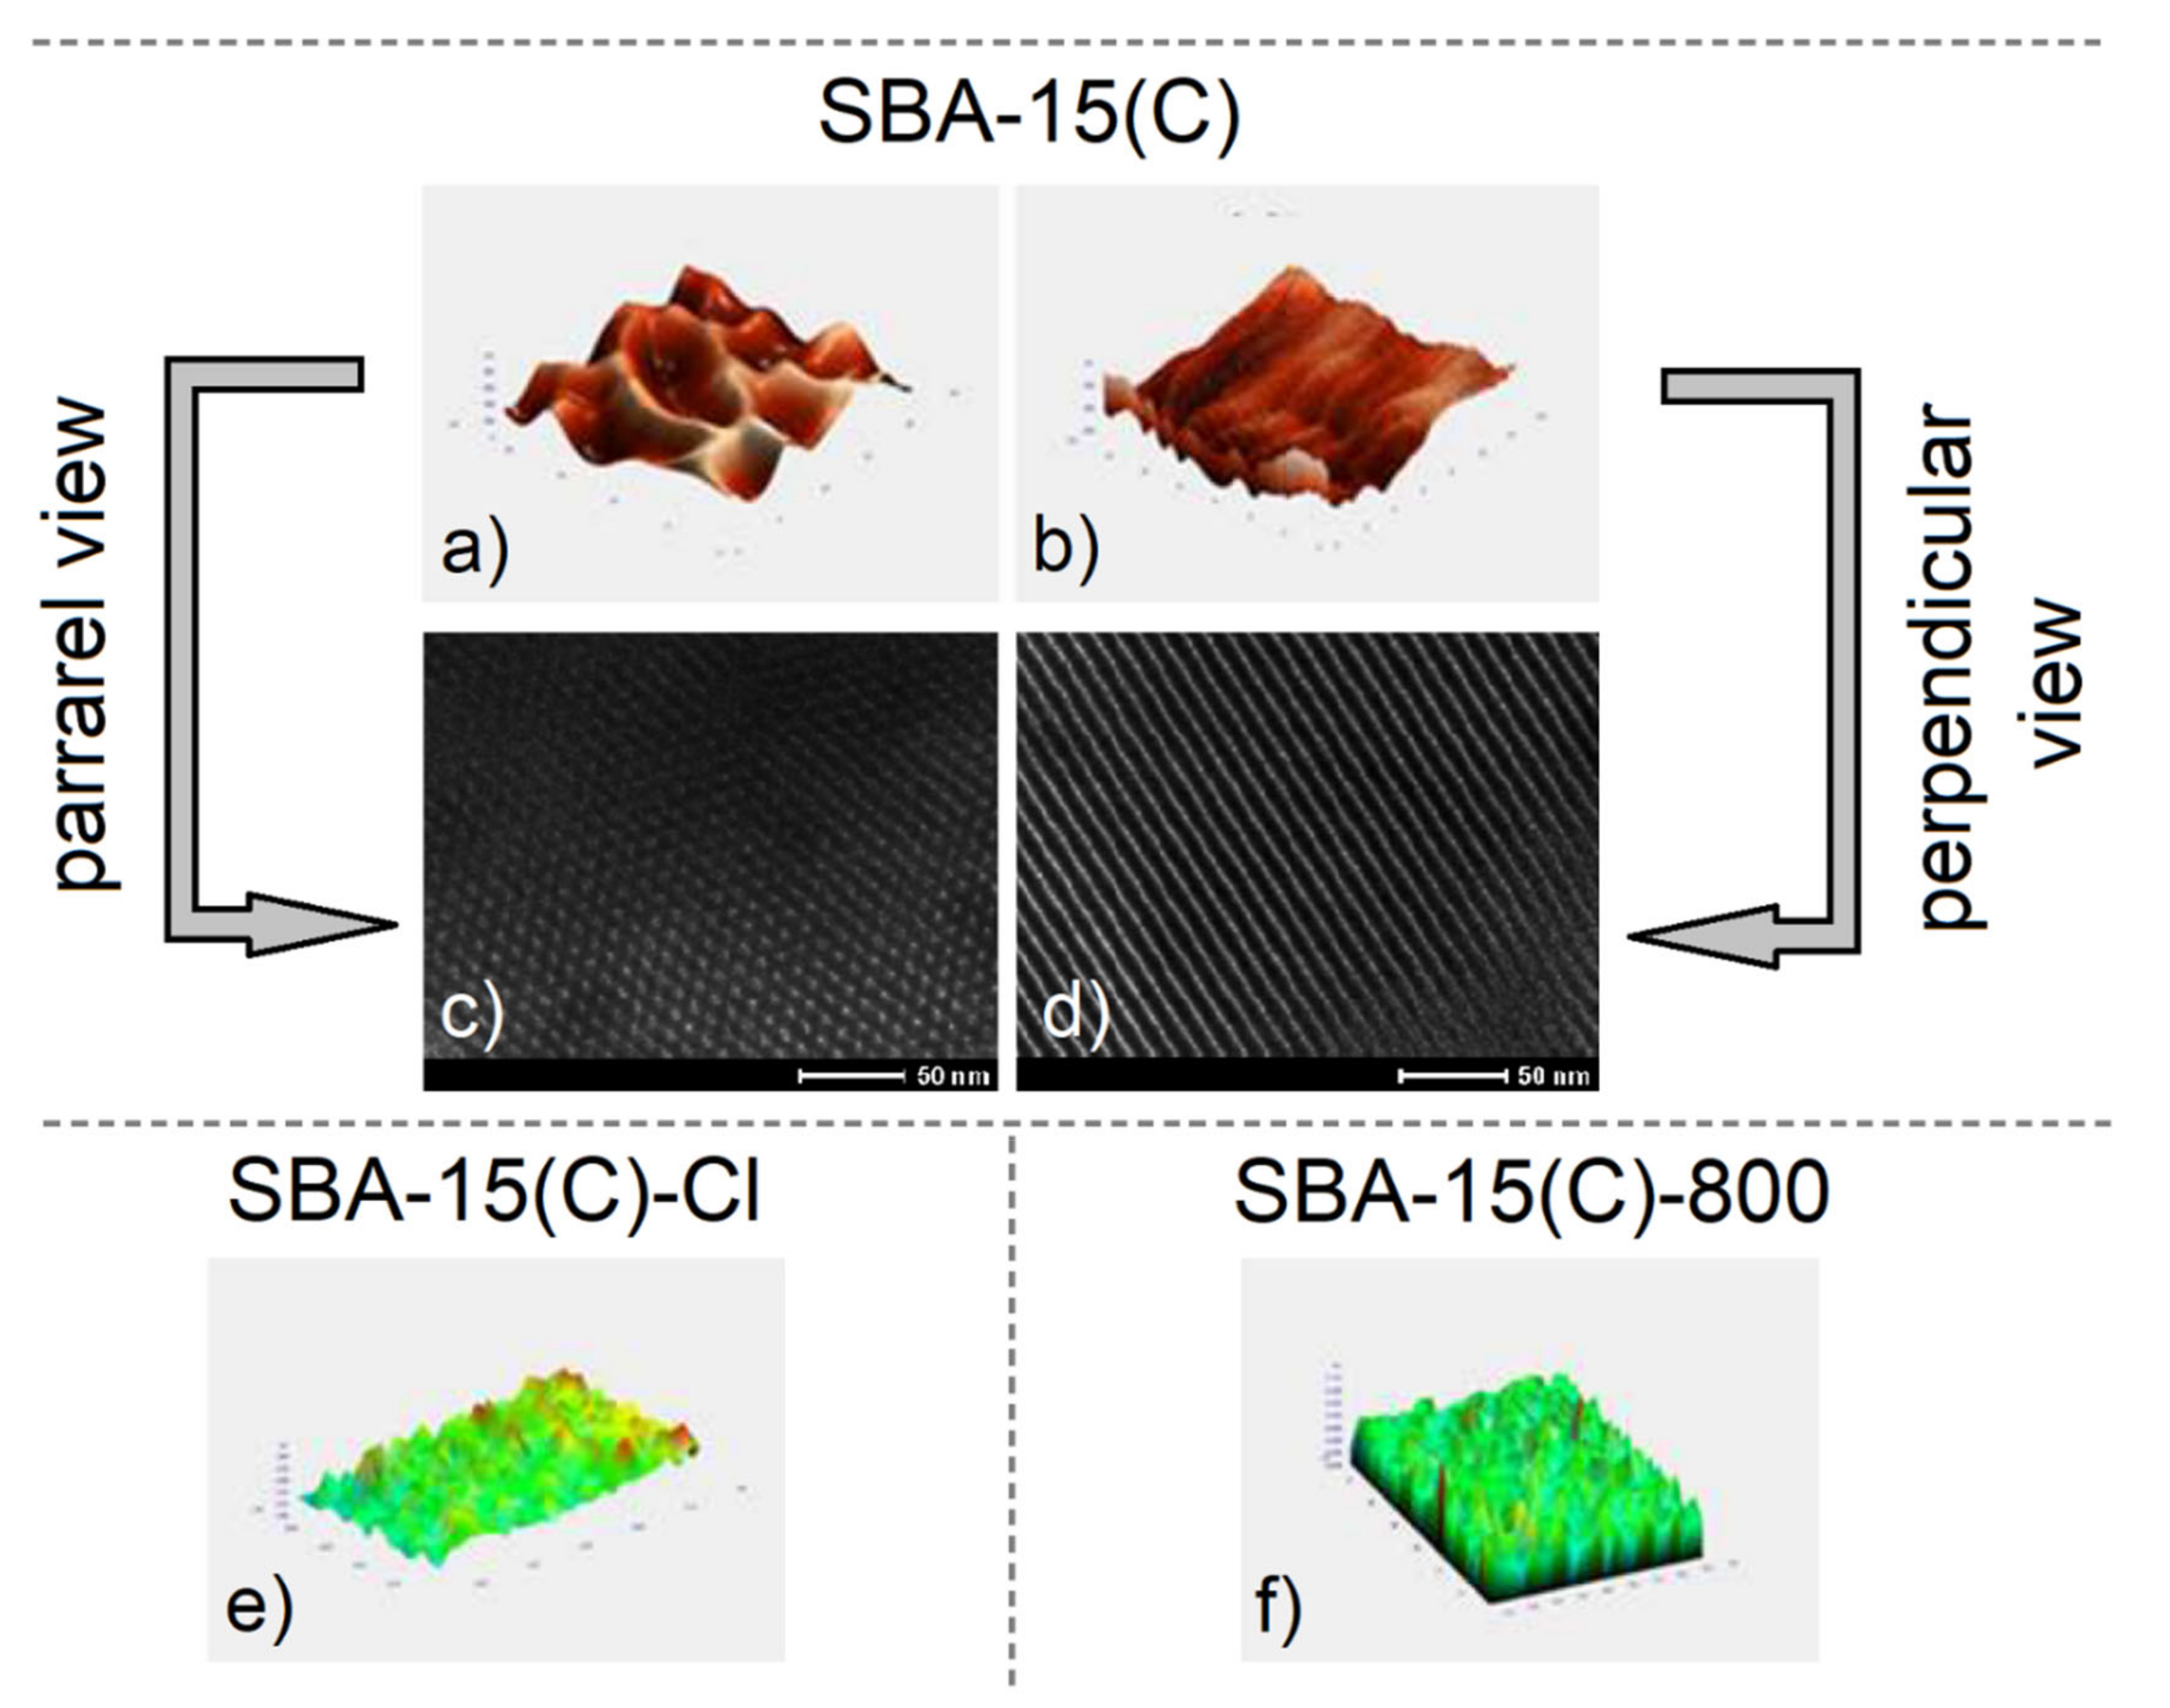
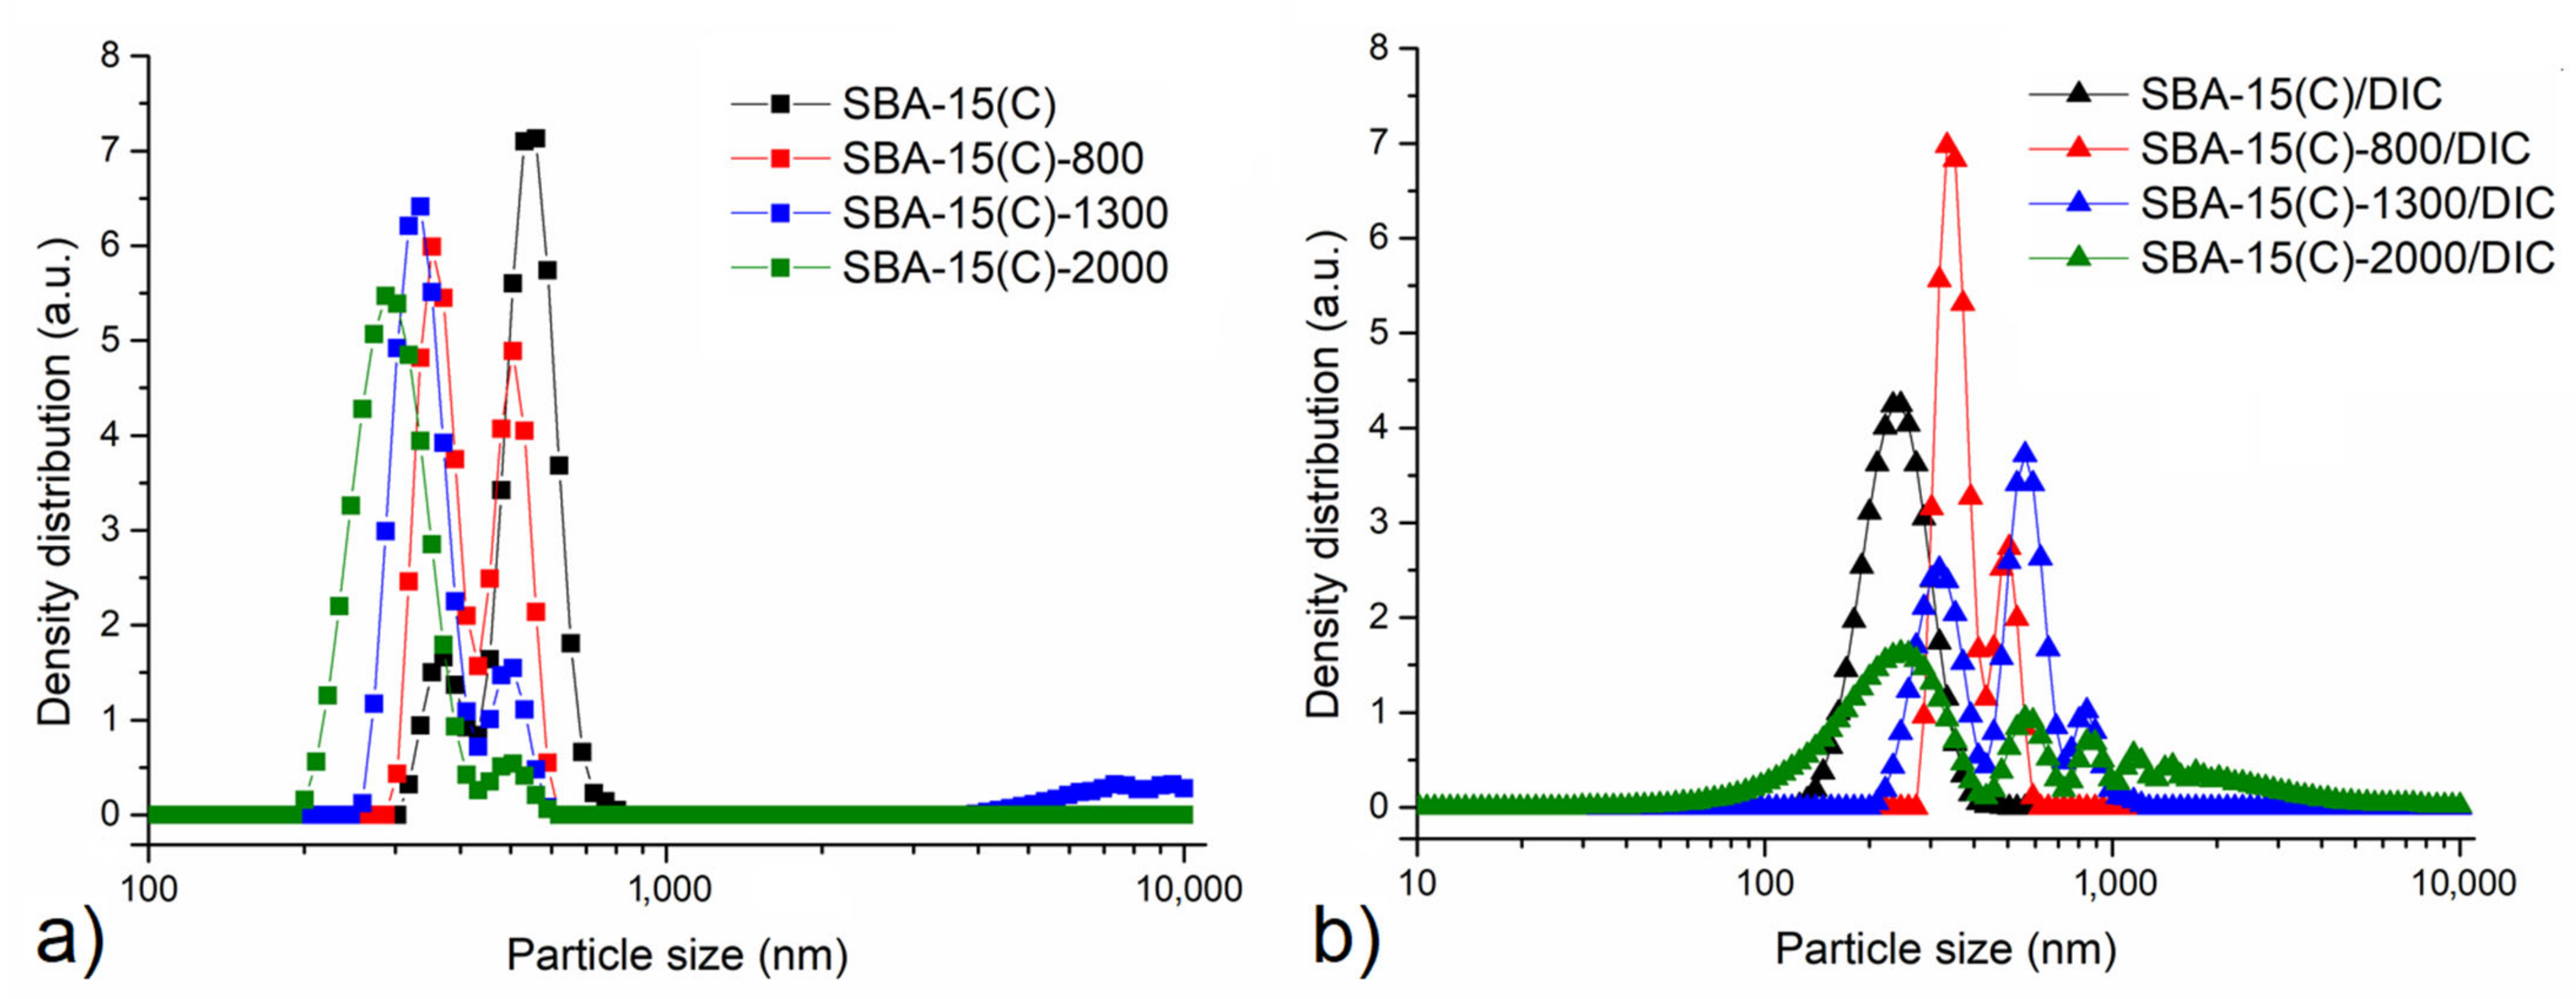
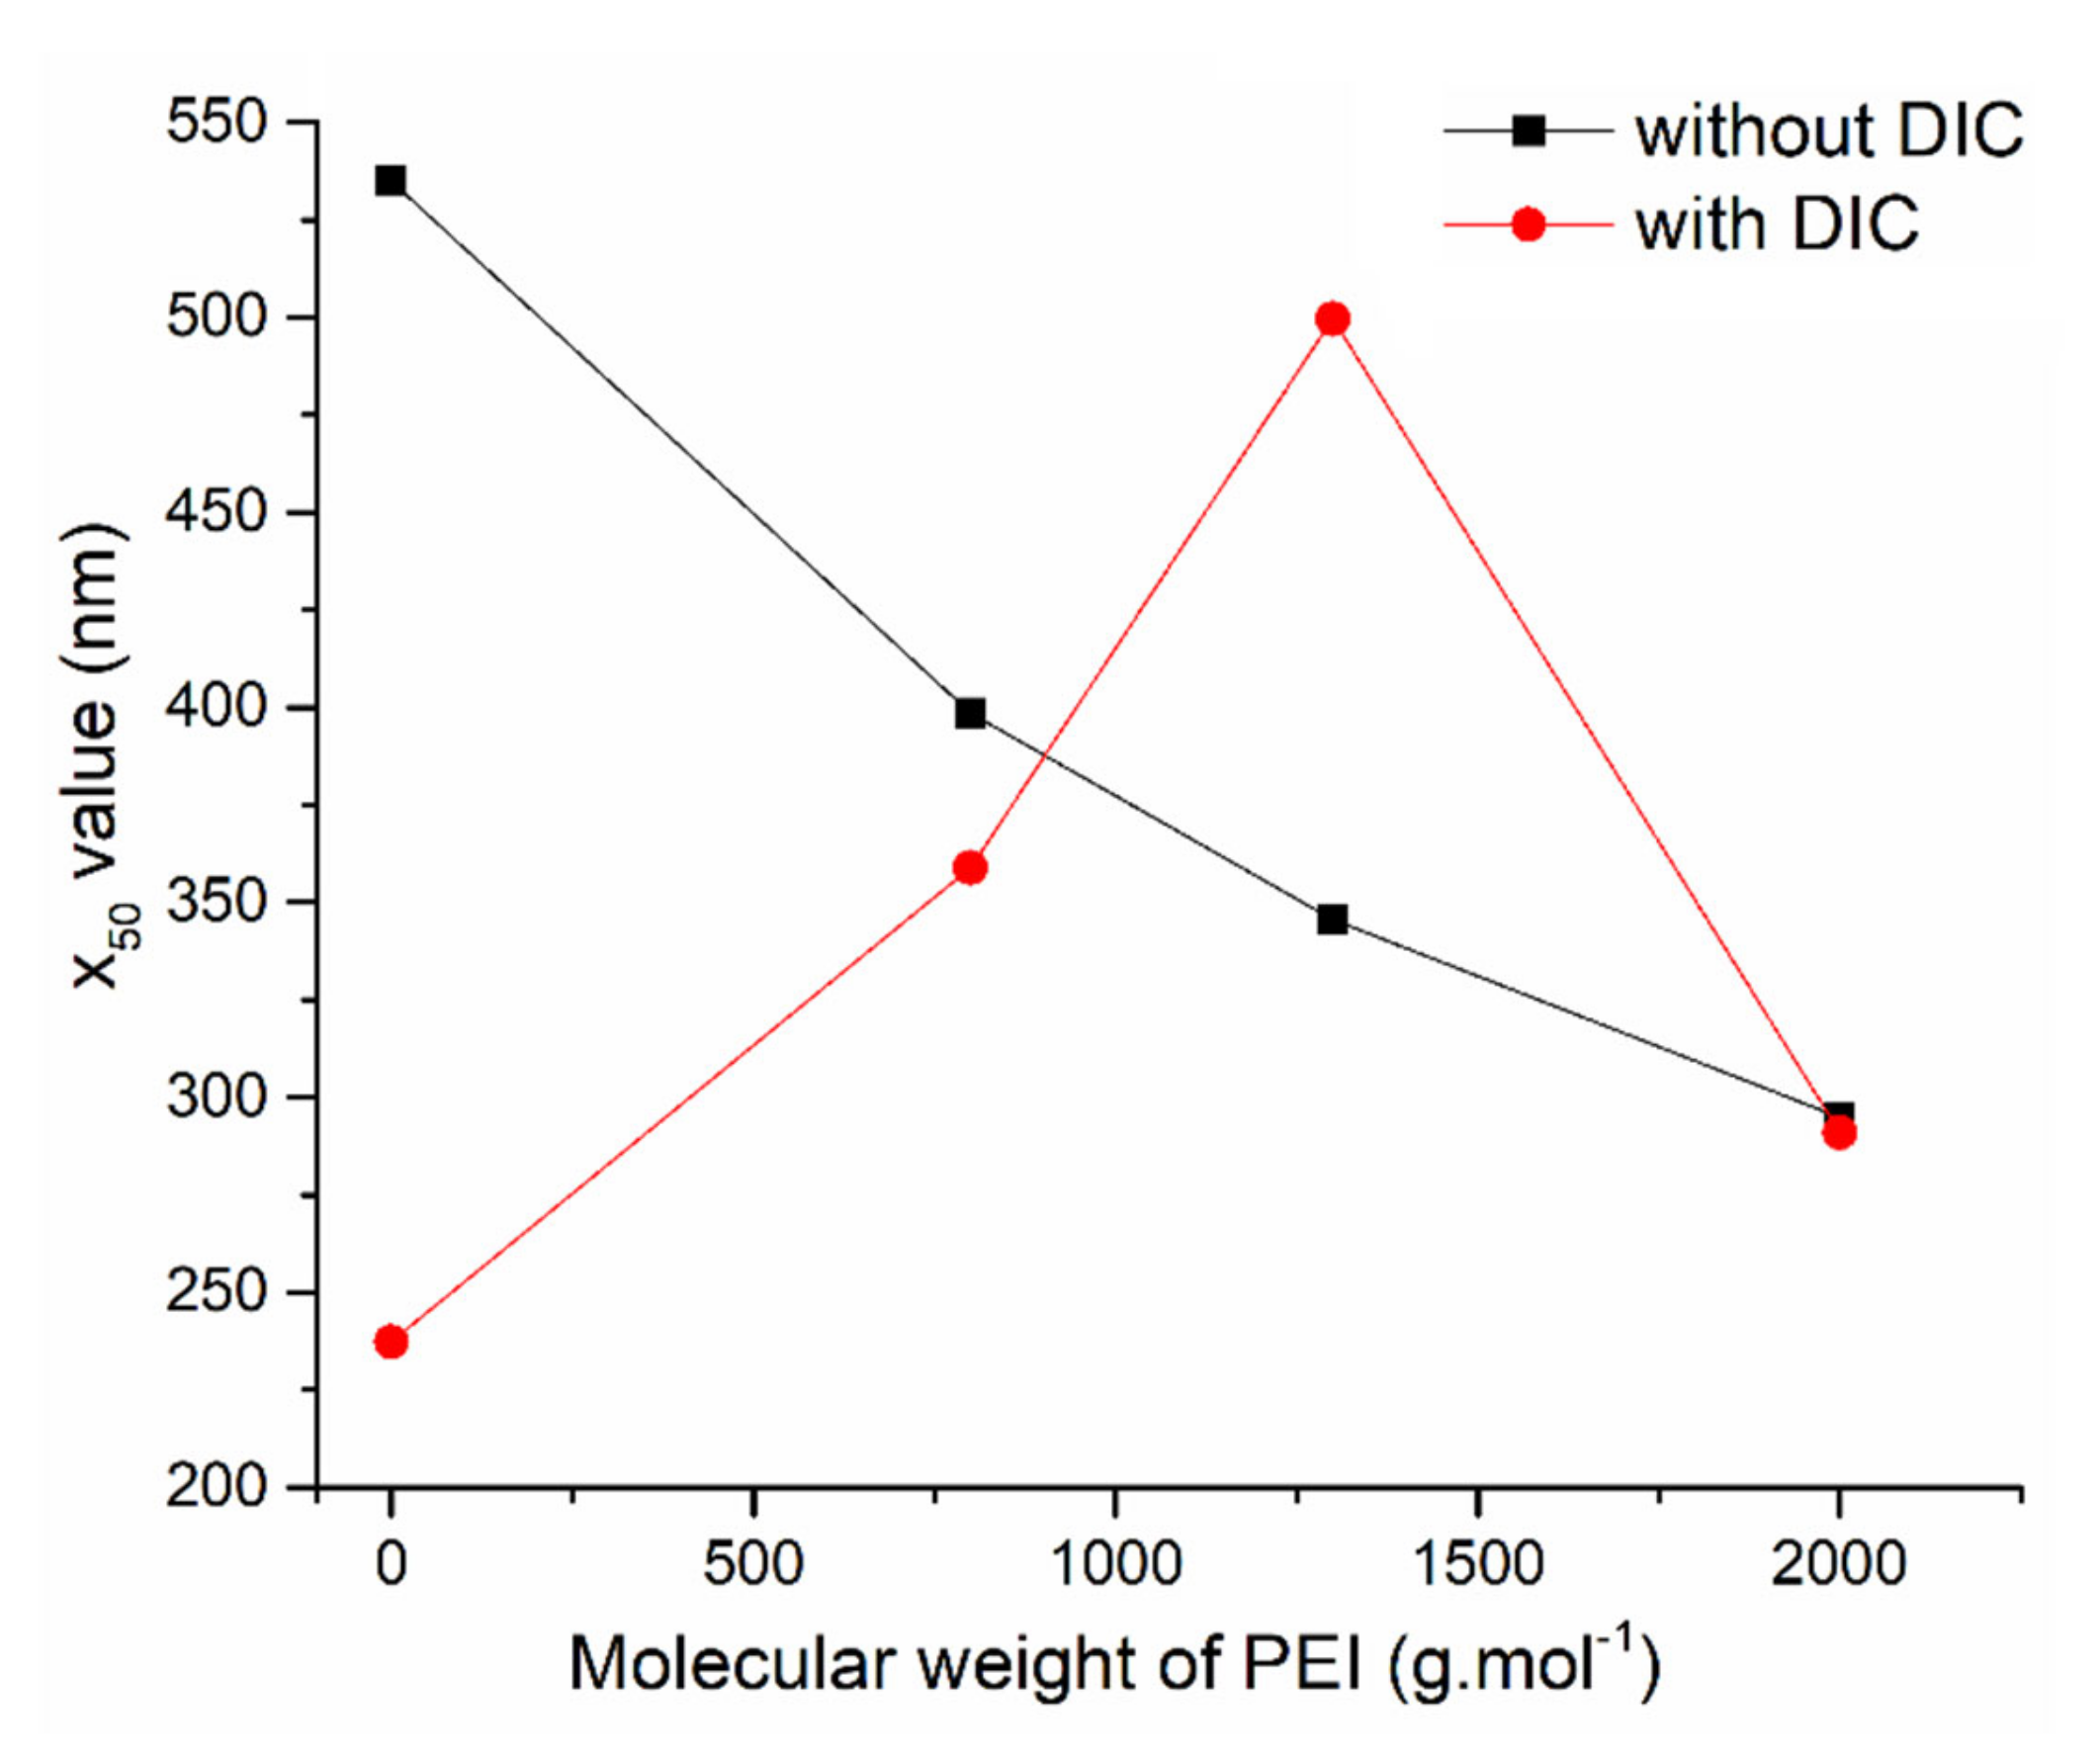
3.4. Surface Morphology and Particle Size
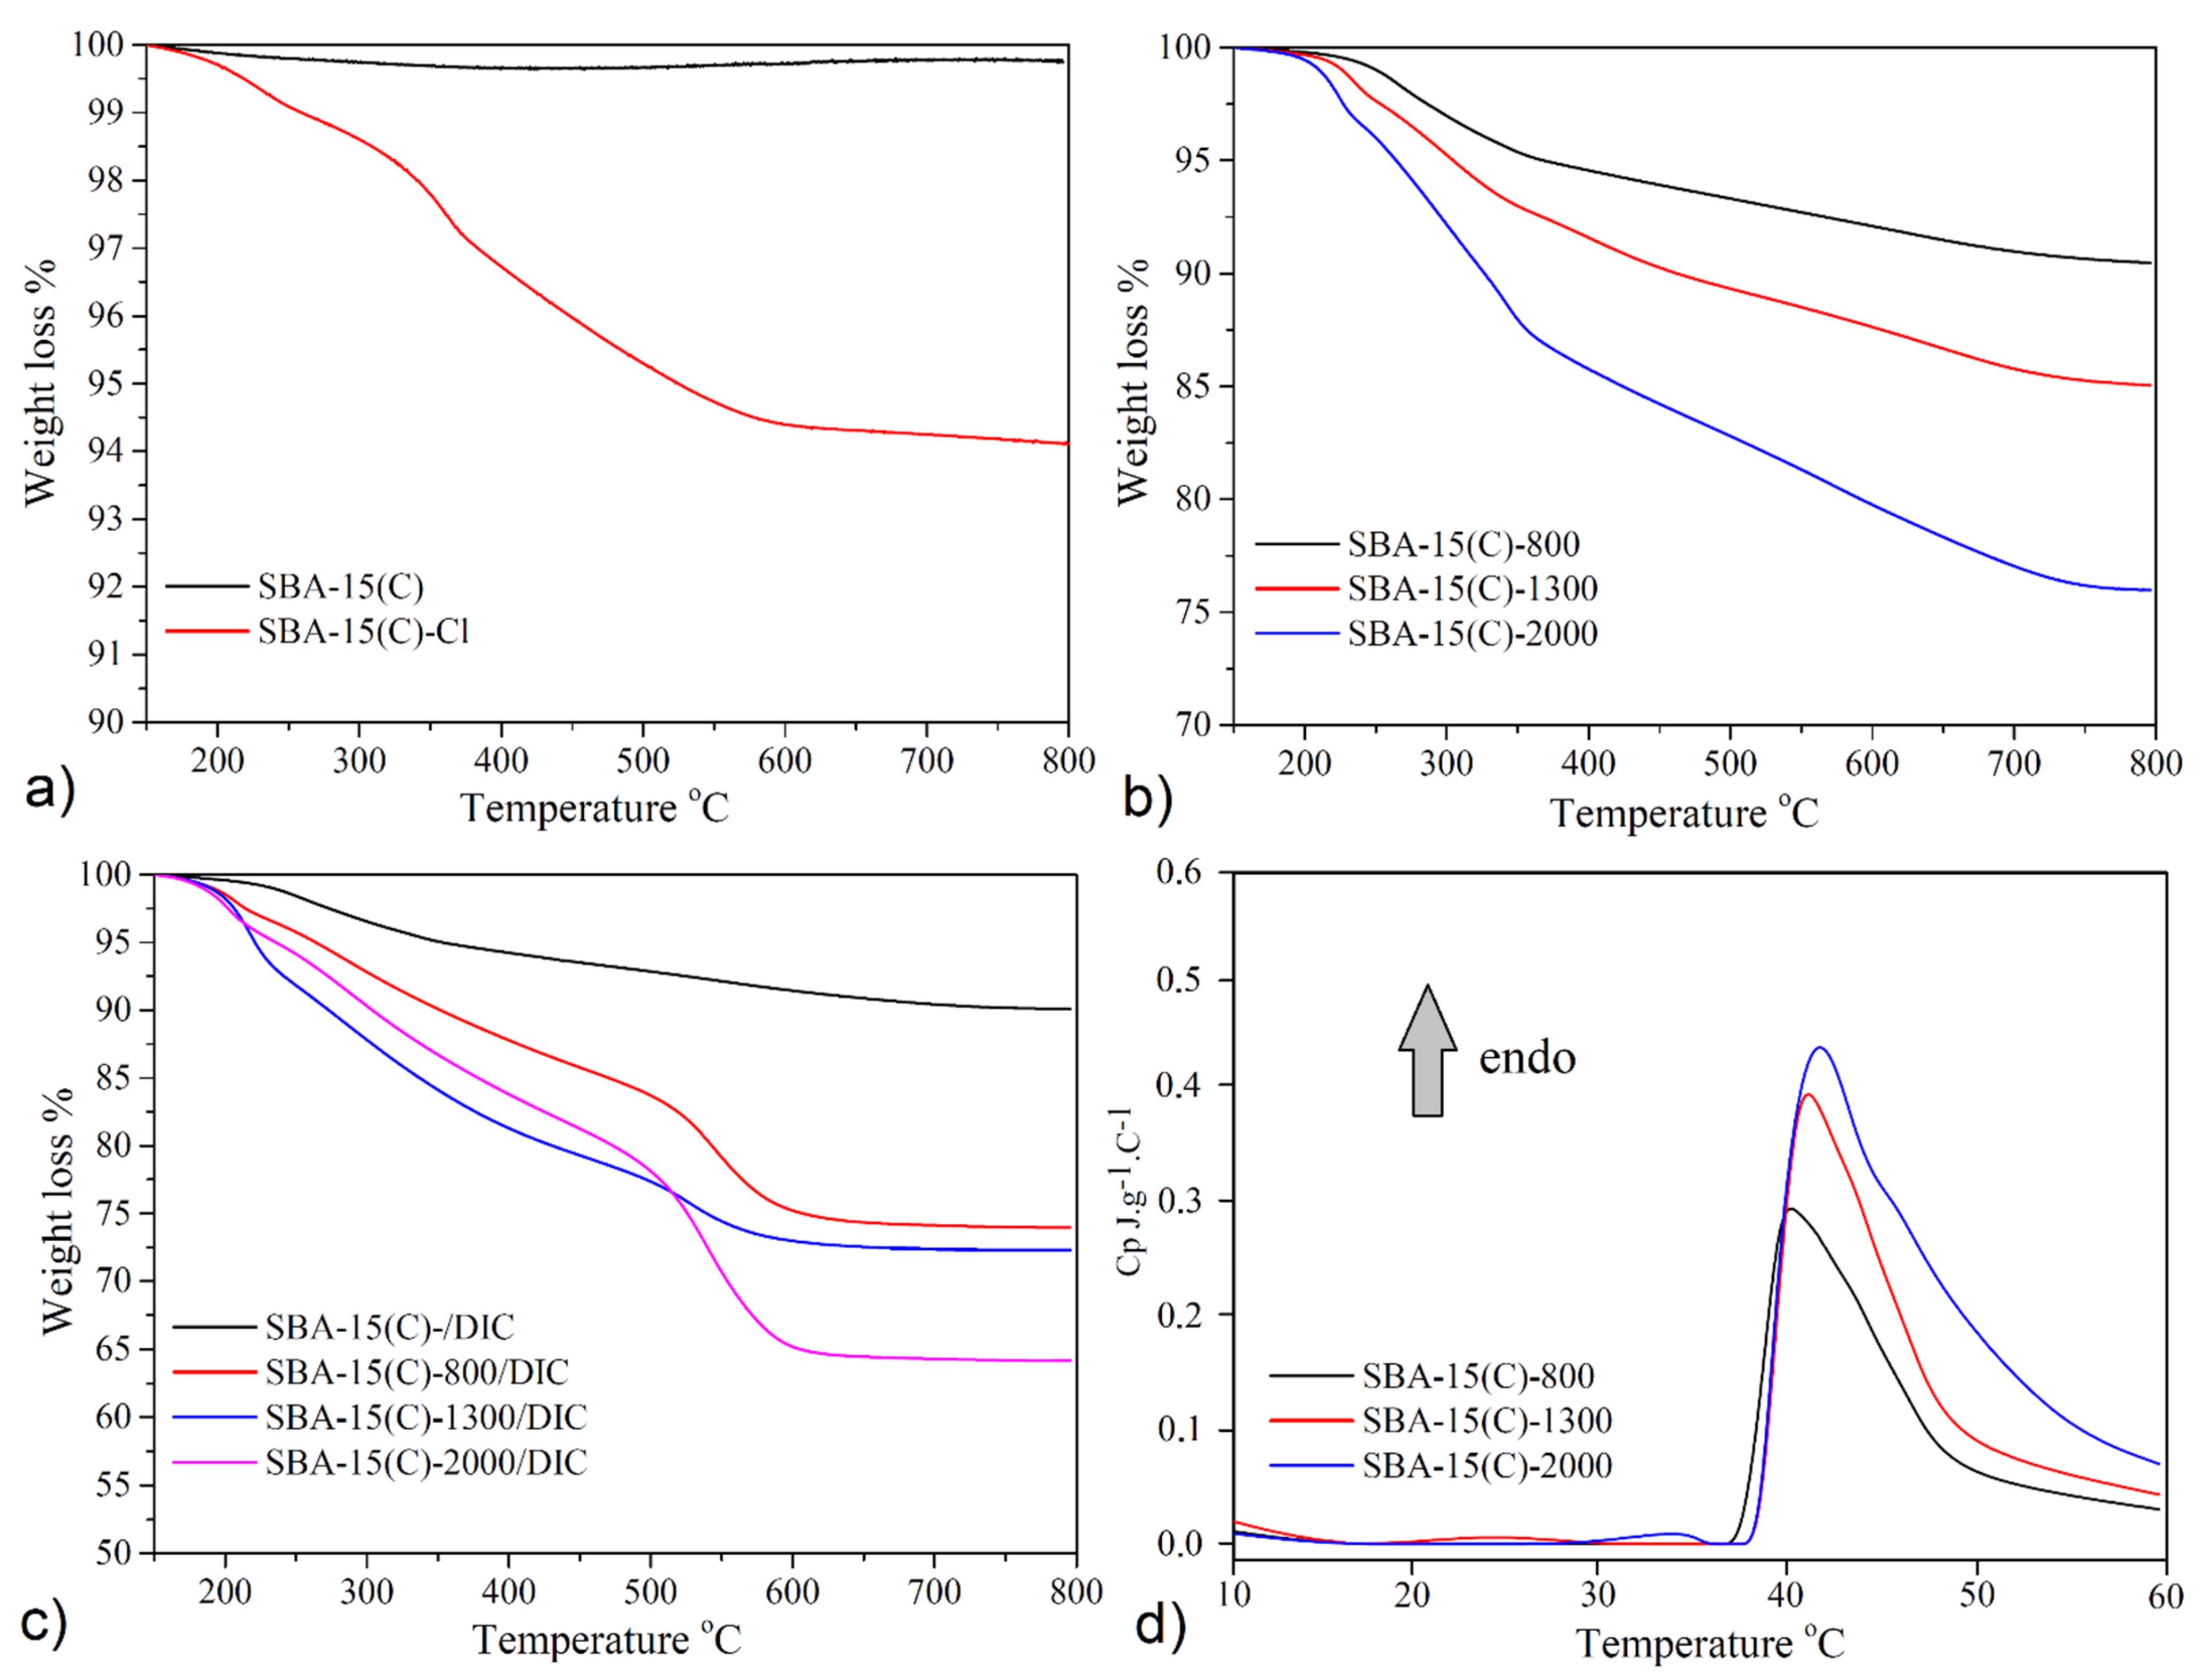
3.5. Thermogravimetric Analysis and Calorimetry
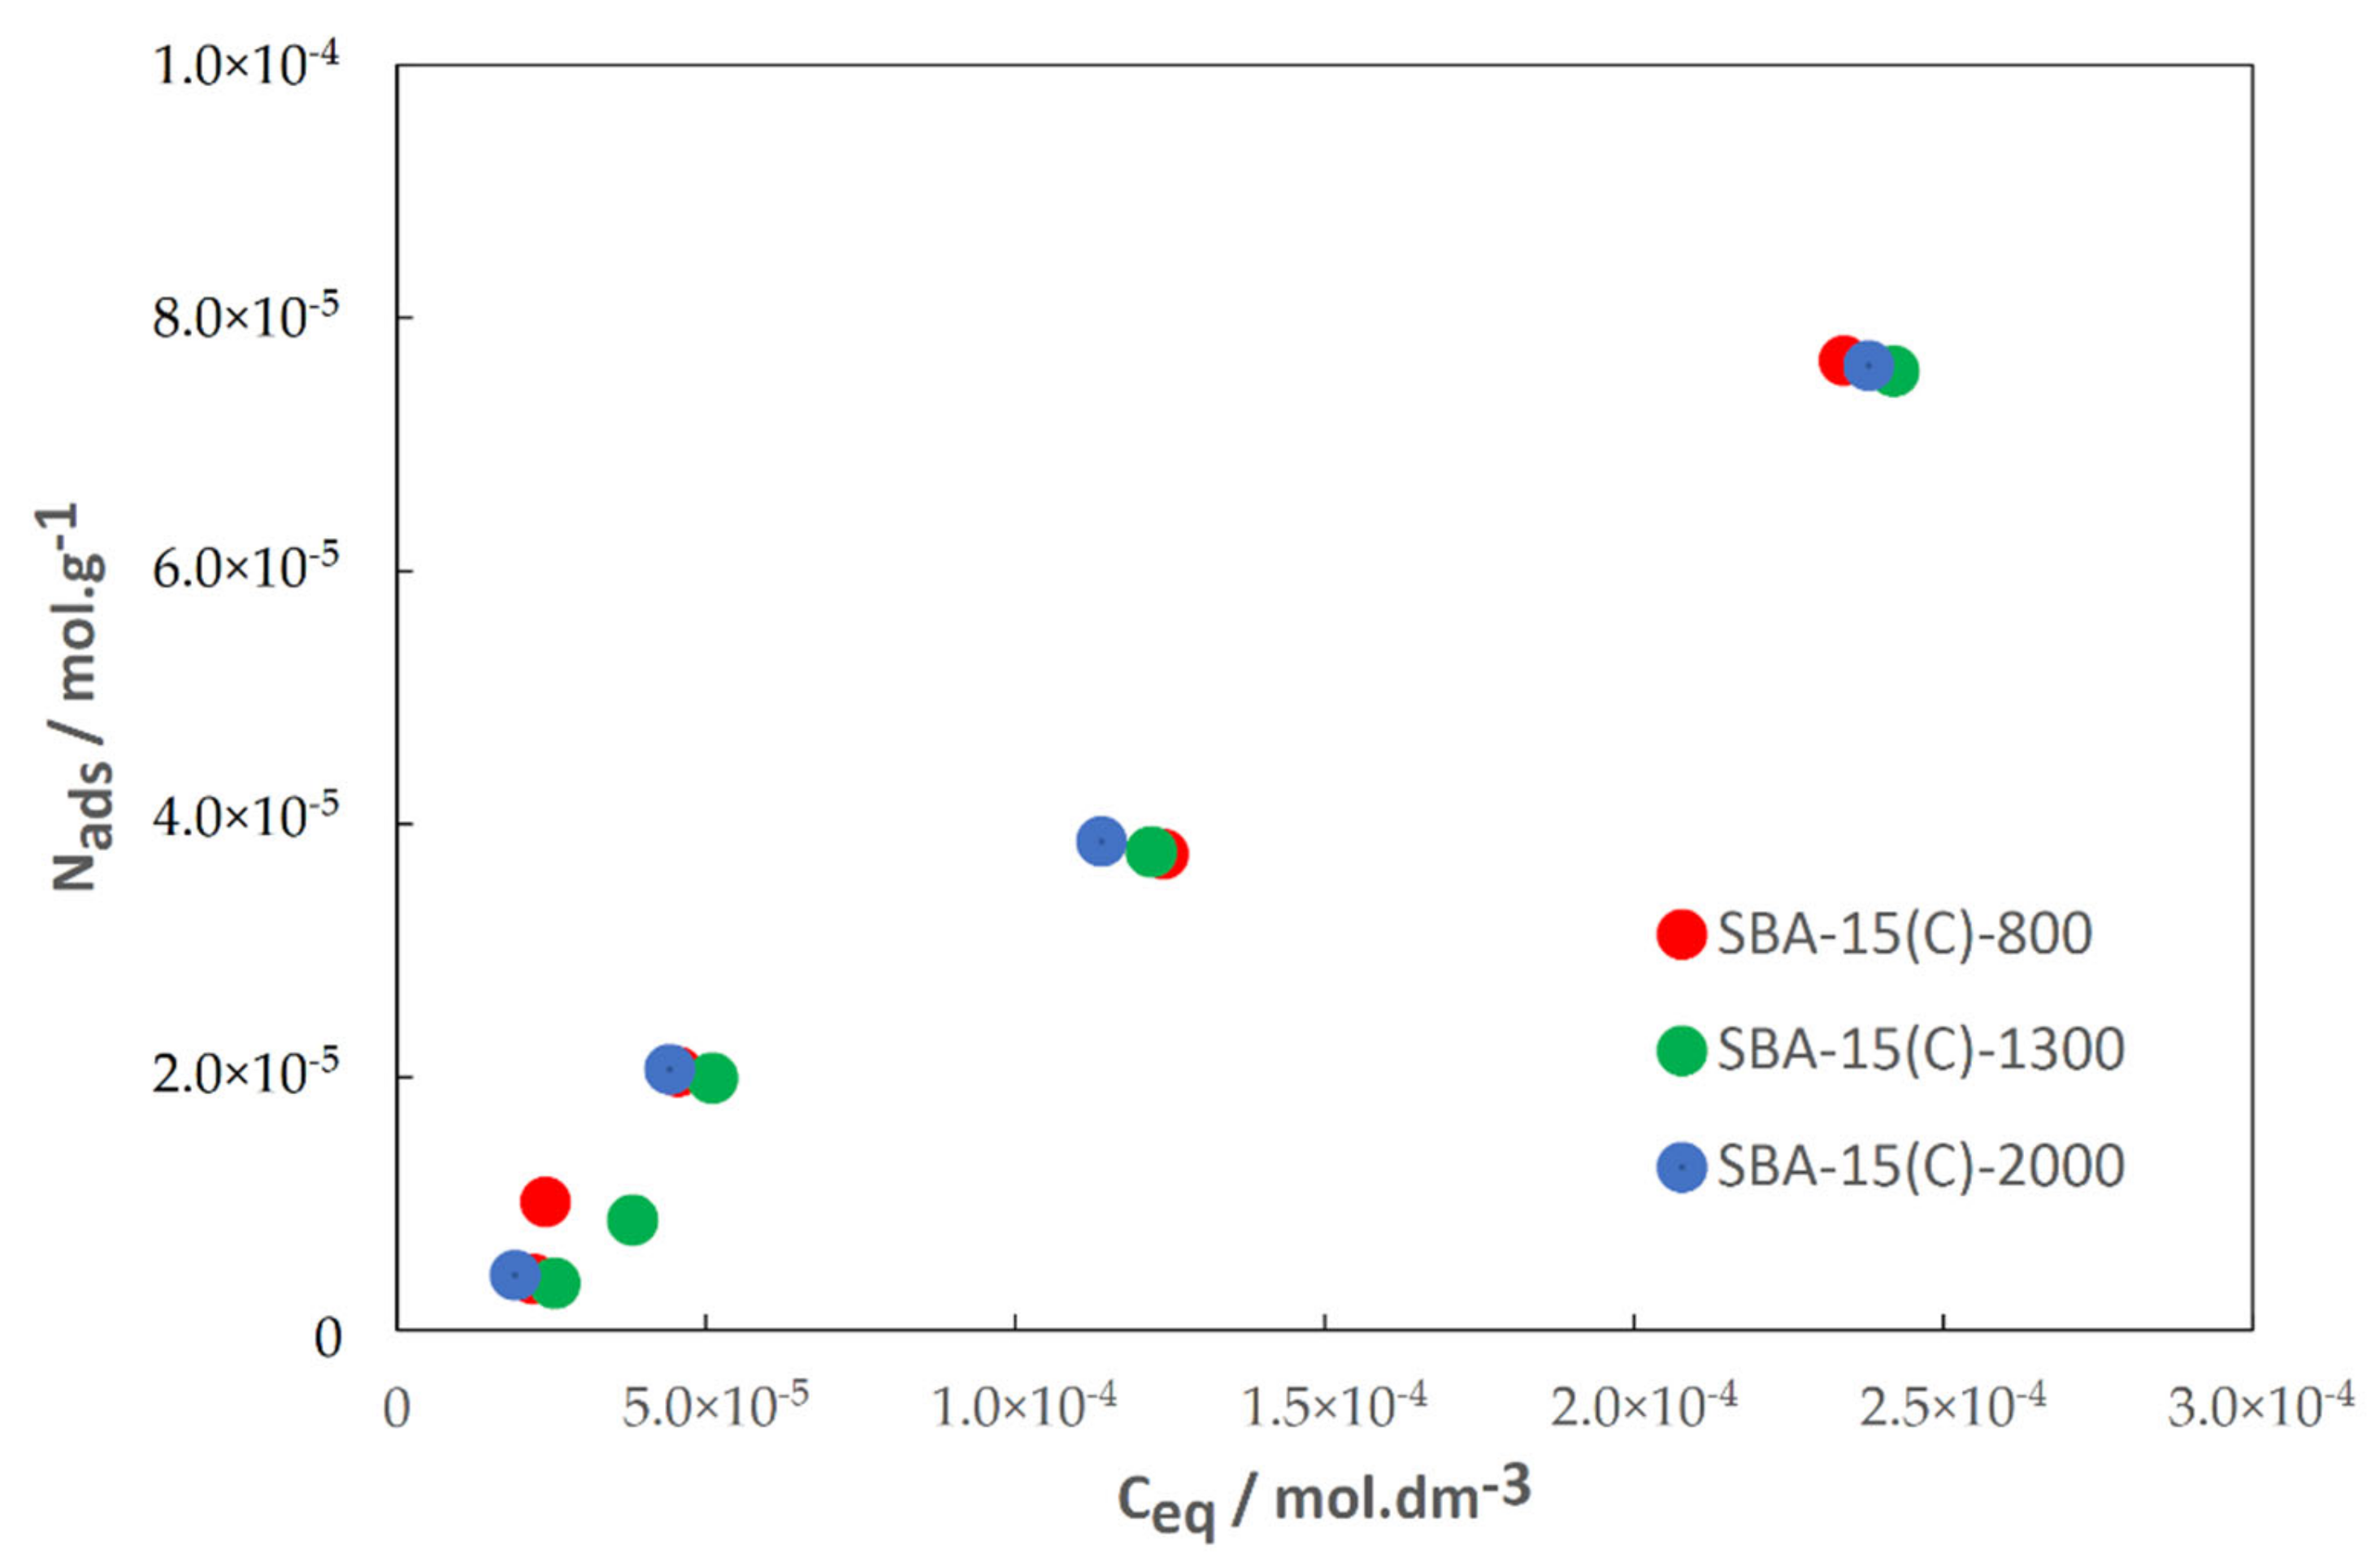
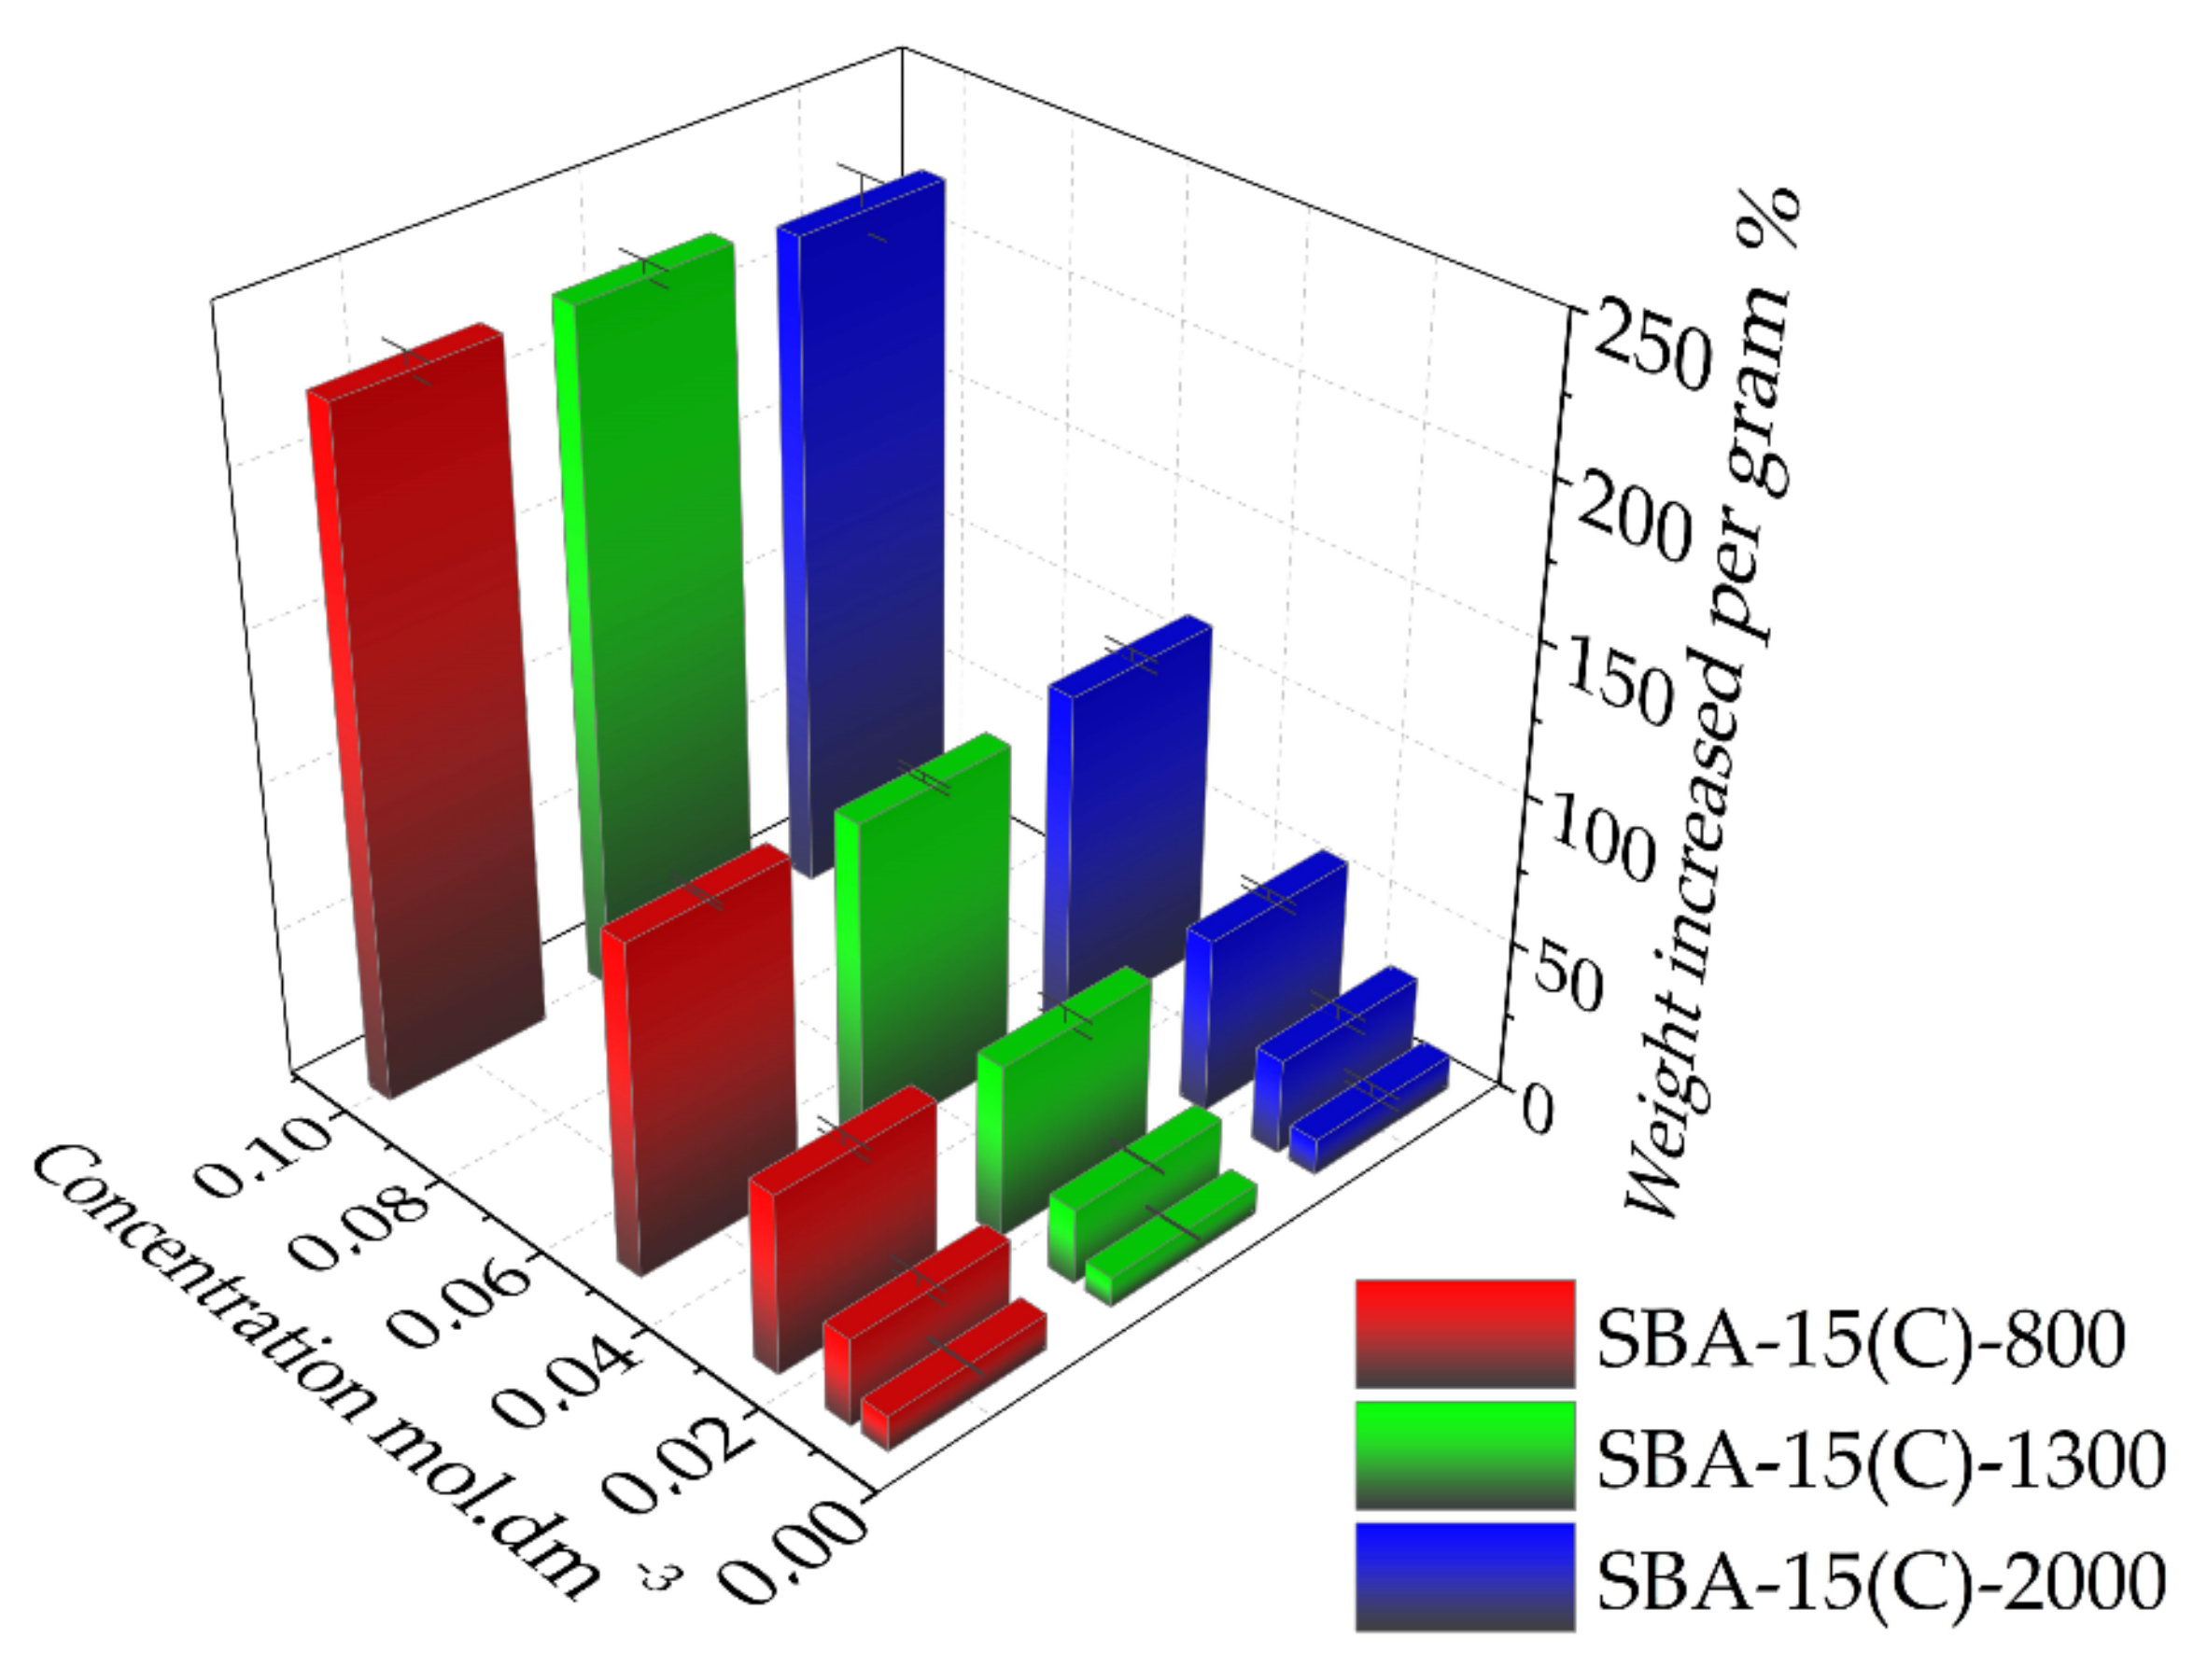
3.6. Drug Adsorption Properties
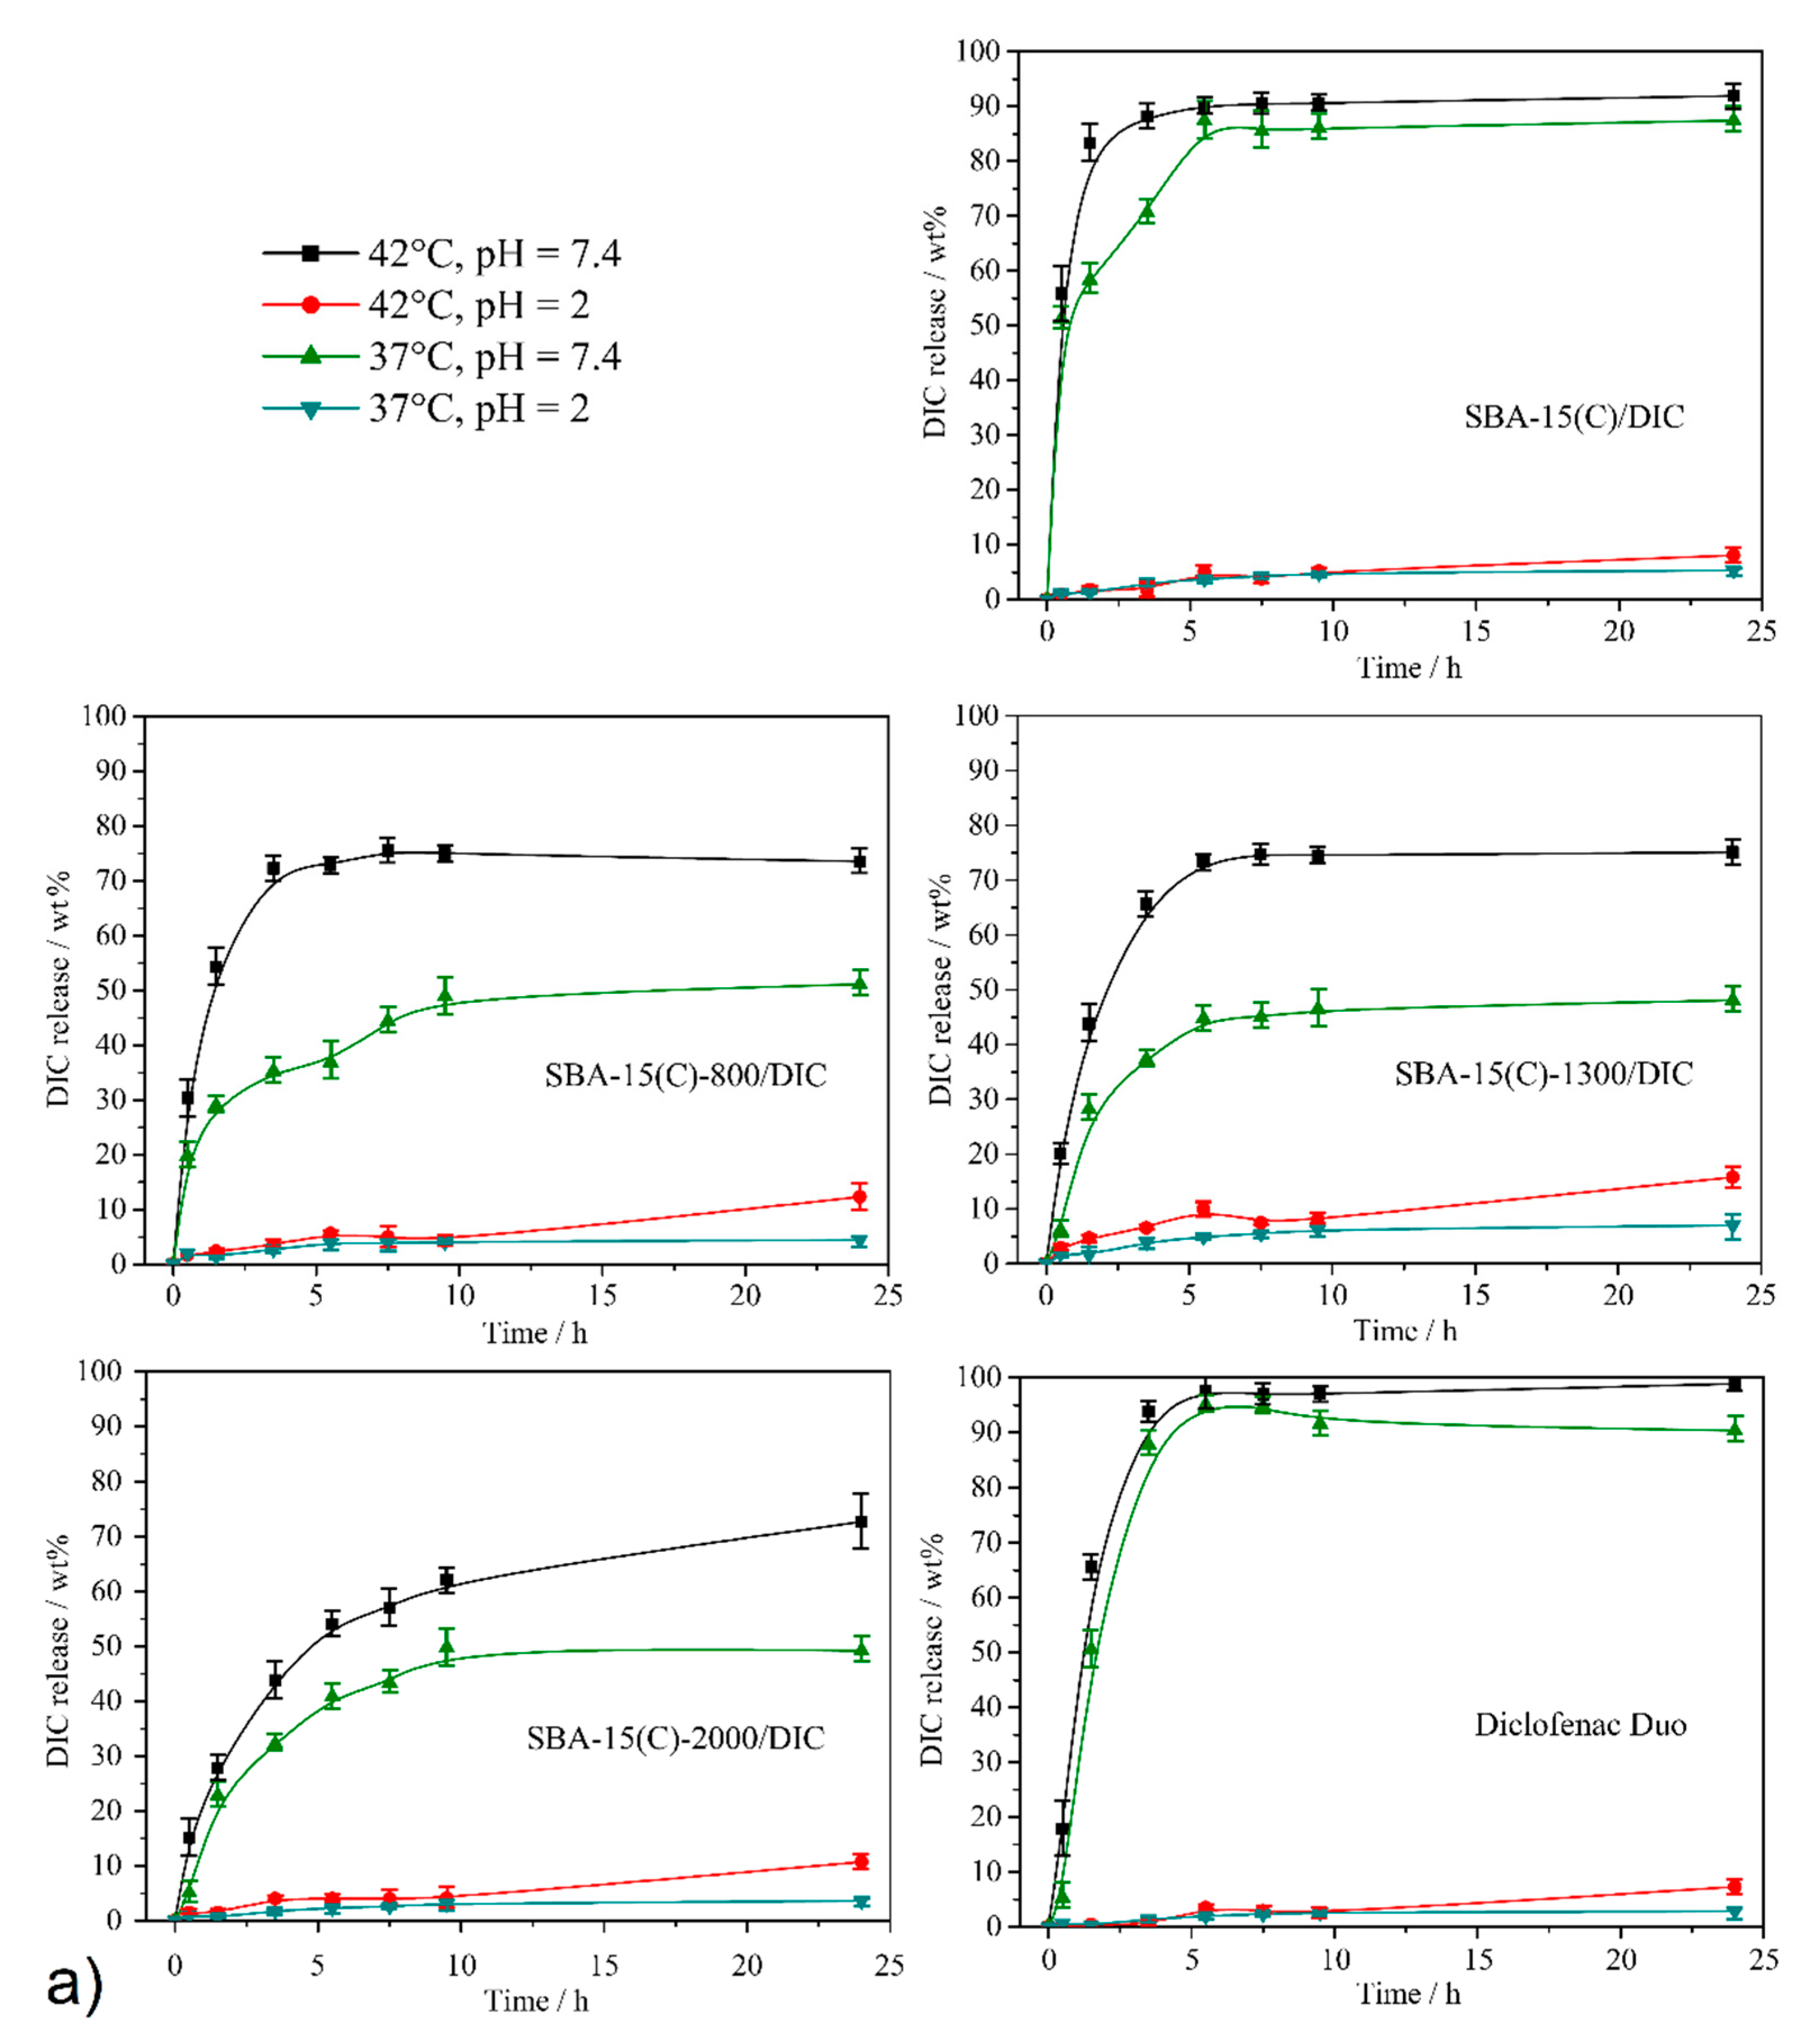
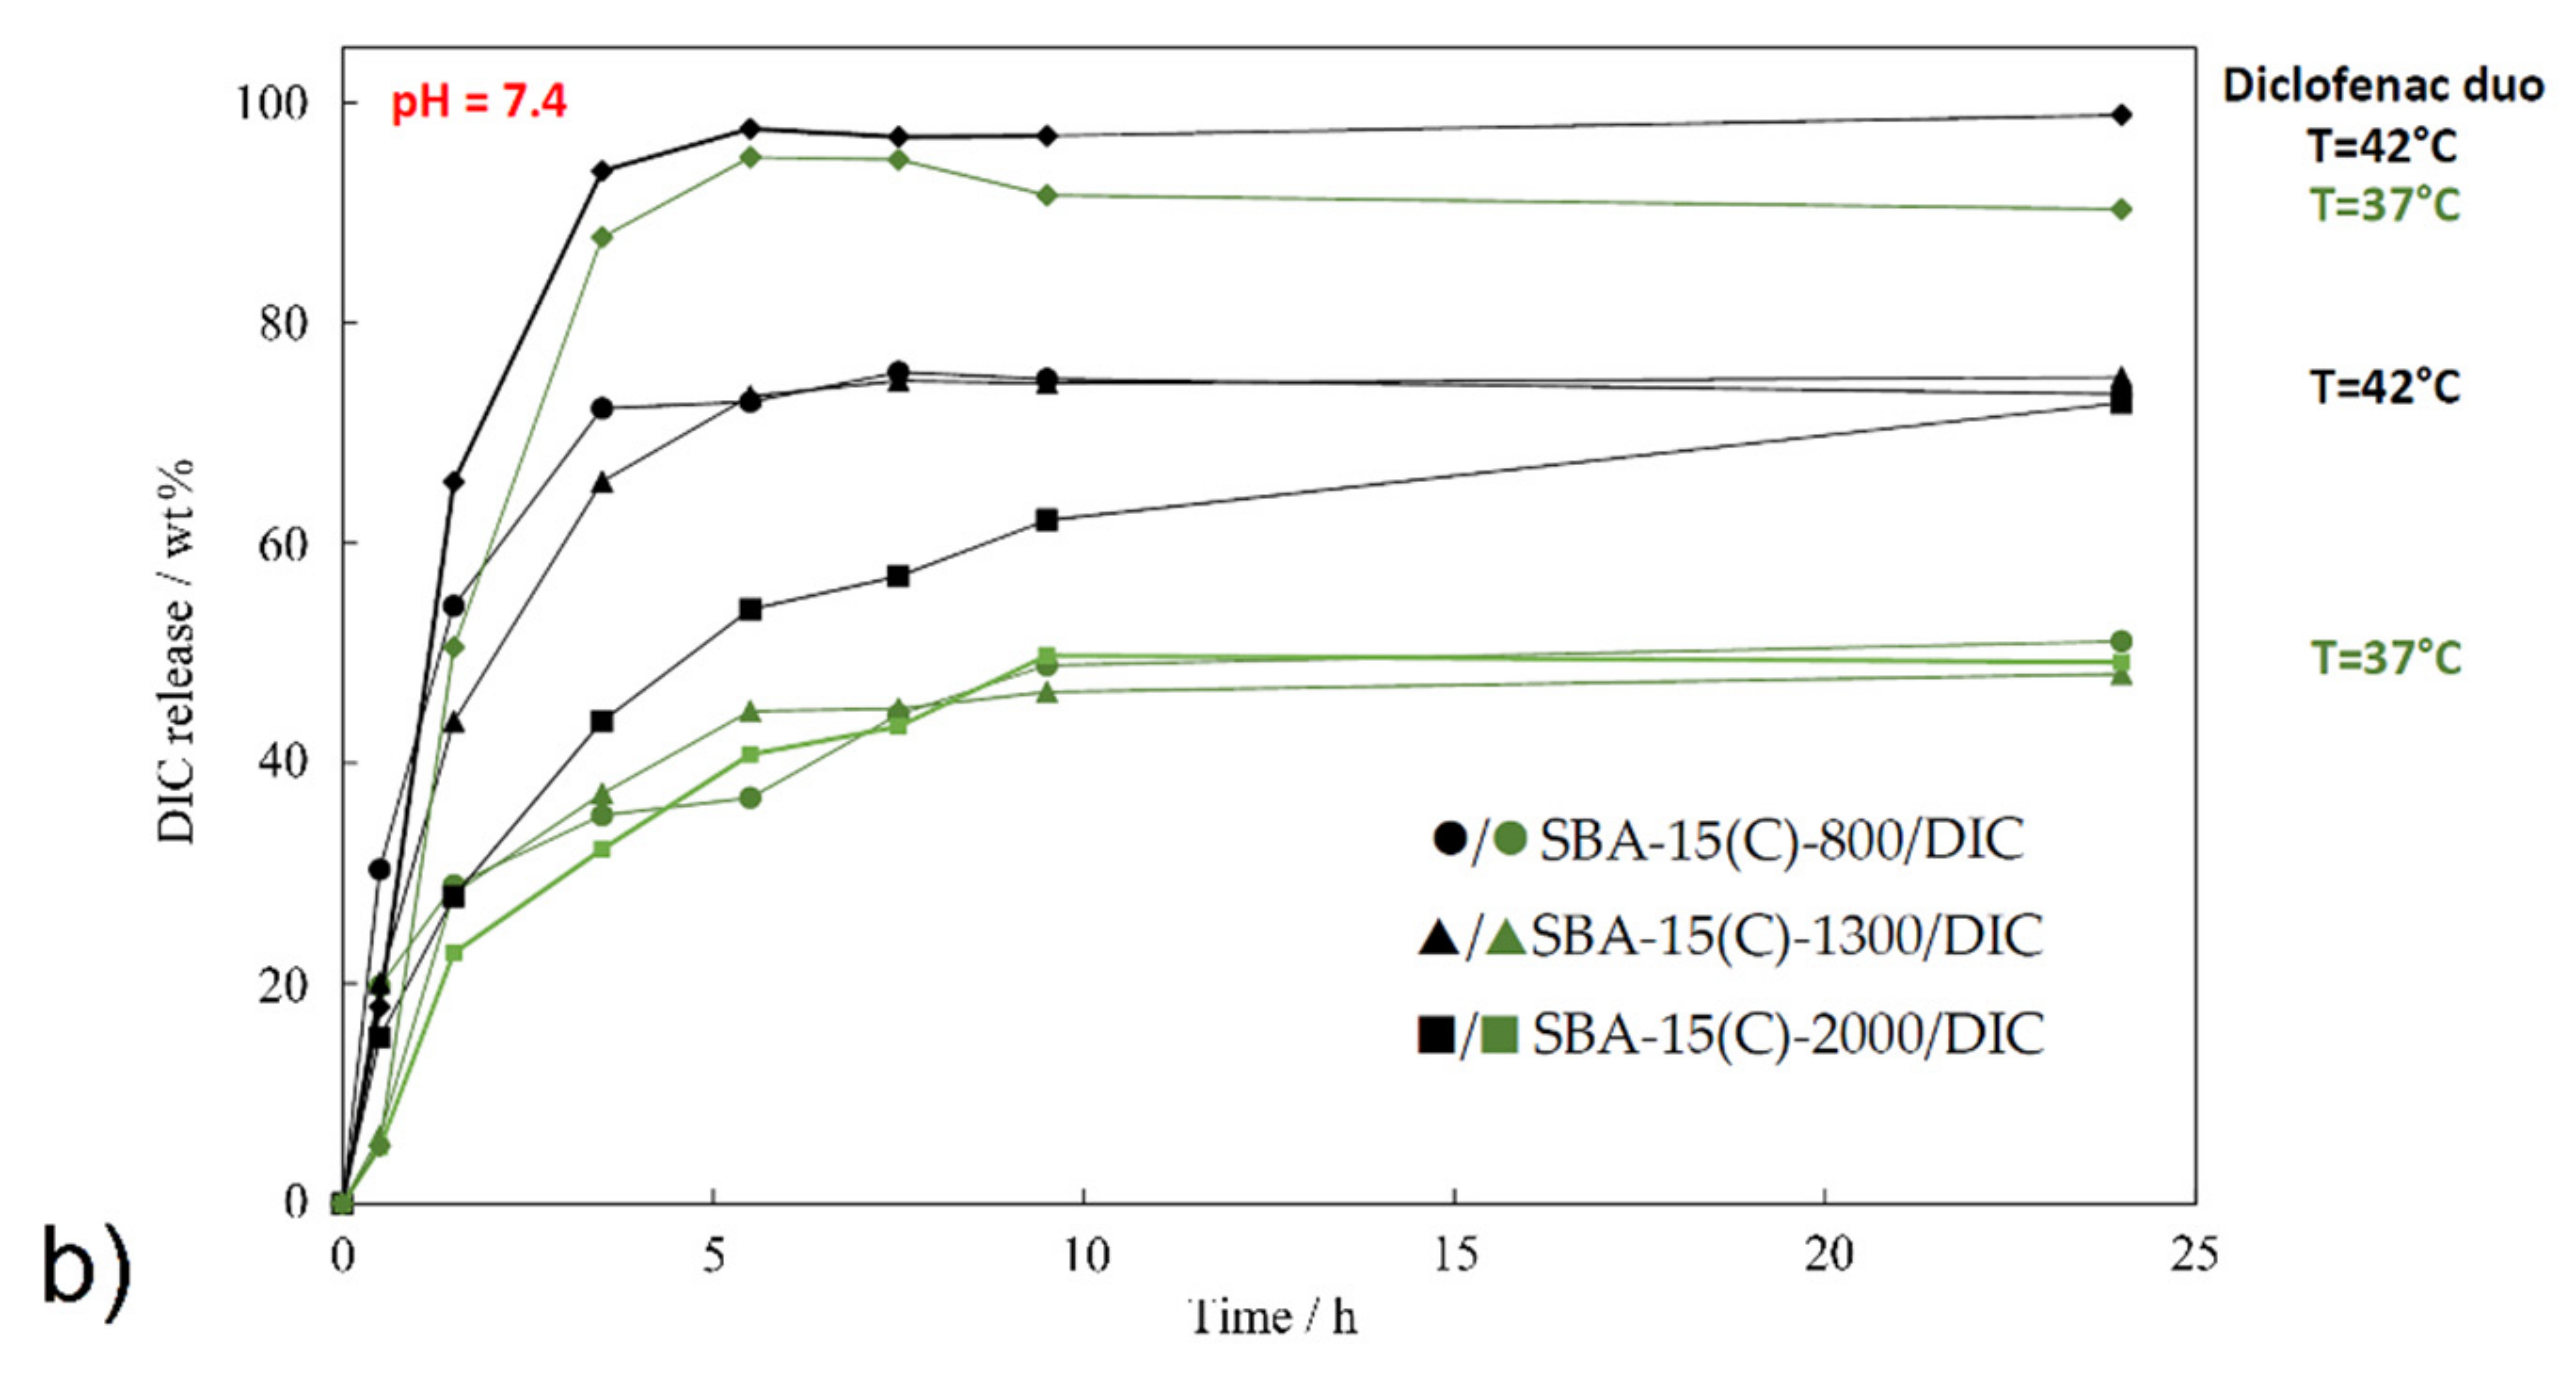
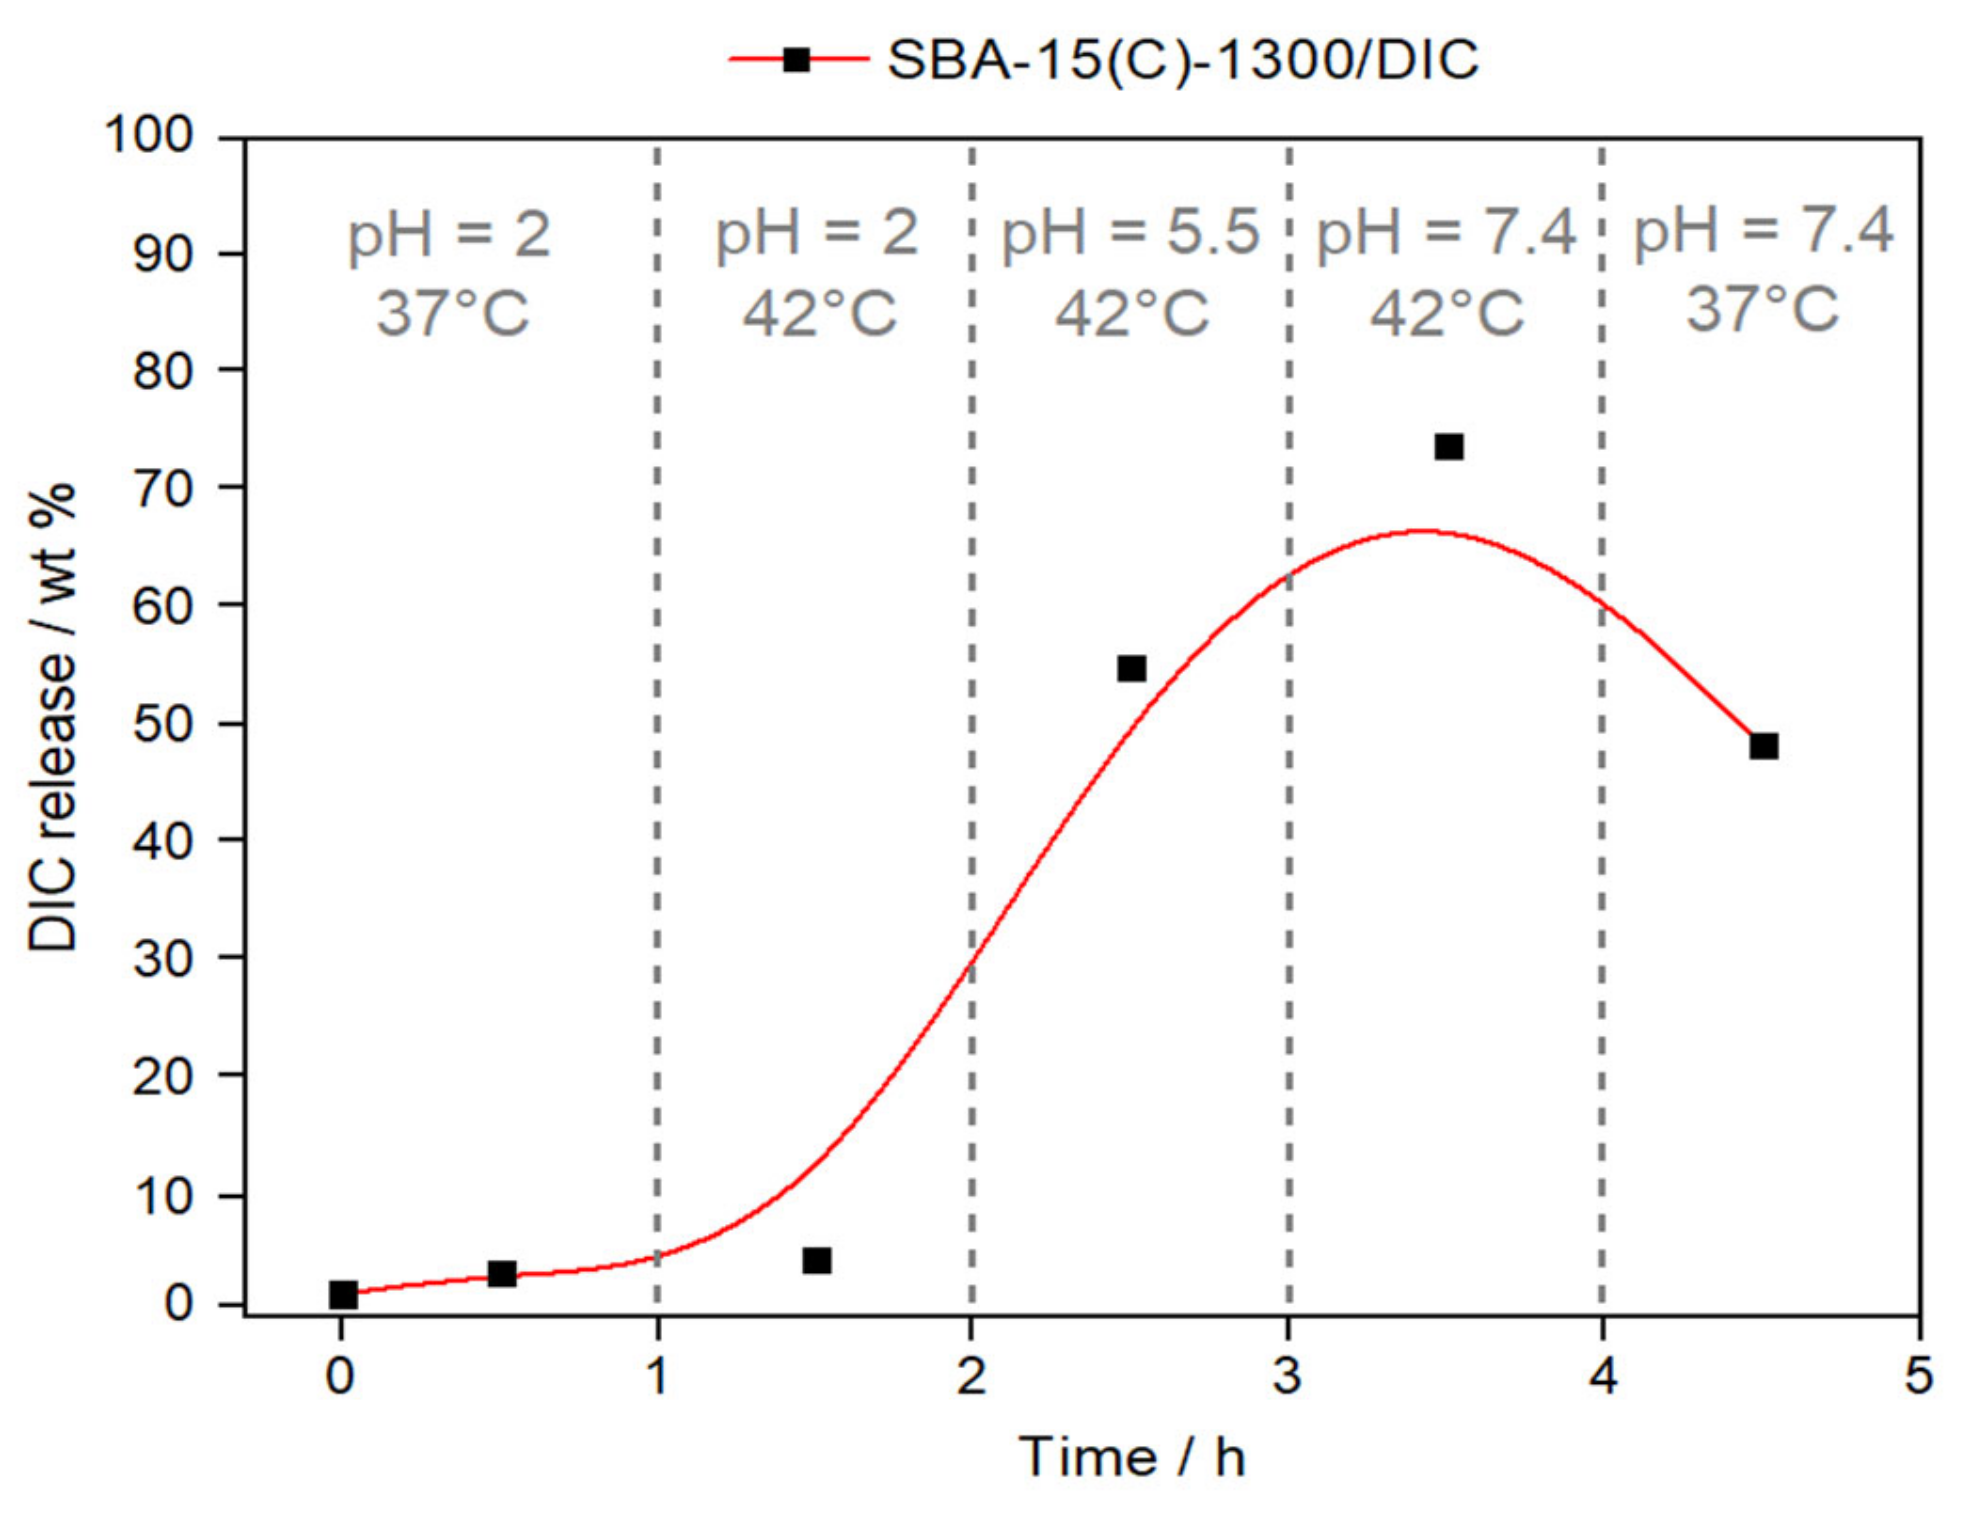
3.7. Drug Release Properties
3.8. Drug Release Kinetics
4. Conclusions
Supplementary Materials
Author Contributions
Funding
Institutional Review Board Statement
Informed Consent Statement
Data Availability Statement
Acknowledgments
Conflicts of Interest
References
- Ferrero-Miliani, L.; Nielsen, O.H.; Andersen, P.S.; Girardin, S.E. Chronic inflammation: Importance of NOD2 and NALP3 in interleukin-1β generation. Clin. Exp. Immunol. 2007, 147, 227–235. [Google Scholar] [CrossRef] [PubMed]
- Balfour, J.A.; Buckley, M.M.T. Etodolac: A reappraisal of its pharmacology and therapeutic use in rheumatic diseases and pain states. Drugs 1991, 42, 274–299. [Google Scholar] [CrossRef]
- Hu, M.; Ge, X.; Chen, X.; Mao, W.; Qian, X.; Yuan, W.E. Micro/nanorobot: A promising targeted drug delivery system. Pharmaceutics 2020, 12, 665. [Google Scholar] [CrossRef]
- Cao, J.; Li, X.; Tian, H. Metal-organic framework (MOF)-based drug delivery. Curr. Med. Chem. 2020, 27, 5949–5969. [Google Scholar] [CrossRef]
- Almáši, M.; Zeleňák, V.; Palotai, P.; Beňová, E.; Zeleňáková, A. Metal-organic framework MIL-101(Fe)-NH2 functionalized with different long-chain polyamines as drug delivery system. Inorg. Chem. Commun. 2018, 93, 115–120. [Google Scholar] [CrossRef]
- Bianco, A.; Kostarelos, K.; Prato, M. Applications of carbon nanotubes in drug delivery. Curr. Opin. Chem. Biol. 2005, 9, 674–679. [Google Scholar] [CrossRef] [PubMed]
- Murakami, T.; Tsuchida, K. Recent advances in inorganic nanoparticle-based drug delivery systems. Mini Rev. Med. Chem. 2008, 8, 175–183. [Google Scholar] [PubMed]
- Shi, J.; Zhang, H.; Wang, L.; Li, L.; Wang, H.; Wang, Z.; Li, Z.; Chen, C.; Hou, L.; Zhang, C.; et al. PEI-derivatized fullerene drug delivery using folate as a homing device targeting to tumor. Biomaterials 2013, 34, 251–261. [Google Scholar] [CrossRef] [PubMed]
- Almomen, A.; El-Toni, A.M.; Badran, M.; Alhowyan, A.; Kalam, M.A.; Alshamsan, A.; Alkholief, M. The design of anionic surfactant-based amino-functionalized mesoporous silica nanoparticles and their application in transdermal drug delivery. Pharmaceutics 2020, 12, 1035. [Google Scholar] [CrossRef] [PubMed]
- Mondal, S.; Das, S.; Nandi, A.K. A review on recent advances in polymer and peptide hydrogels. Soft Matter 2020, 16, 1404–1454. [Google Scholar] [CrossRef] [PubMed]
- Akash, M.S.H.; Rehman, K. Recent progress in biomedical applications of pluronic (P-127): Pharmaceutical perspectives. J. Control. Release 2015, 209, 120–138. [Google Scholar] [CrossRef]
- Venkatasubbu, G.D.; Ramasamy, S.; Ramakrishnan, V.; Kumar, J. Folate targeted PEGylated titanium dioxide nanoparticles as a nanocarrier for targeted paclitaxel drug delivery. Adv. Powder Technol. 2013, 24, 947–954. [Google Scholar] [CrossRef]
- Raza, A.; Hayat, U.; Bilal, M.; Iqbal, H.M.N.; Wang, J.Y. Zein-based micro- and nano-constructs and biologically therapeutic cues with multi-functionalities for oral drug delivery systems. J. Drug Deliv. Sci. Technol. 2020, 58, 101818. [Google Scholar] [CrossRef]
- Cho, I.; Shim, M.K.; Jung, N.; Jang, E.H.; Park, M.; Kang, H.C.; Kim, J. Heat shock responsive drug delivery system based on mesoporous silica nanoparticles coated with temperature sensitive gatekeeper. Microporous Mesoporous Mater. 2017, 253, 96–101. [Google Scholar] [CrossRef]
- Abdo, G.G.; Zagho, M.M.; Khalil, A. Recent advances in stimuli-responsive drug release and targeting concepts using mesoporous silica nanoparticles. Emergent. Mater. 2020, 3, 407–425. [Google Scholar] [CrossRef]
- Abedi, M.; Abolmaali, S.S.; Abedanzadeh, M.; Farjadian, F.; Samani, S.M.; Tamaddon, A.M. Core-shell imidazoline-functionalized mesoporous silica superparamagnetic hybrid manoparticles as a potential theranostic agent for controlled delivery of platinum(II) compound. Int. J. Nanomed. 2020, 15, 2617–2631. [Google Scholar] [CrossRef] [PubMed]
- Xu, C.; Cao, Y.; Lei, C.; Li, Z.; Kumeria, T.; Meka, A.K.; Xu, J.; Liu, J.; Yan, C.; Luo, L.; et al. Polymer–mesoporous silica nanoparticle core–shell nanofibers as a dual-drug-delivery system for guided tissue regeneration. ACS Appl. Nano Mater. 2020, 3, 1457–1467. [Google Scholar] [CrossRef]
- Constantin, M.; Bucatariu, S.M.; Doroftei, F.; Fundueanu, G. Smart composite materials based on chitosan microspheres embedded in thermosensitive hydrogel for controlled delivery of drugs. Carbohydr. Polym. 2017, 157, 493–502. [Google Scholar] [CrossRef]
- Zhao, J.; Zhao, X.; Guo, B.; Ma, P.X. Multifunctional interpenetrating polymer network hydrogels based on methacrylated alginate for the delivery of small molecule drugs and sustained release of protein. Biomacromolecules 2014, 15, 3246–3252. [Google Scholar] [CrossRef] [PubMed]
- Hu, W.; Bai, X.; Wang, Y.; Lei, Z.; Luo, H.; Tong, Z. Upper critical solution temperature polymer-grafted hollow mesoporous silica nanoparticles for near-infrared-irradiated drug release. J. Mater. Chem. B 2019, 7, 5789–5796. [Google Scholar] [CrossRef] [PubMed]
- Yang, J.; Dai, D.; Lou, X.; Ma, L.; Wang, B.; Yang, Y.W. Supramolecular nanomaterials based on hollow mesoporous drug carriers and macrocycle-capped CuS nanogates for synergistic chemo-photothermal therapy. Theranostics 2020, 10, 615–629. [Google Scholar] [CrossRef] [PubMed]
- Cui, Y.; Deng, R.; Li, X.; Wang, X.; Jia, Q.; Bertrand, E.; Meguellati, K.; Yang, Y. Temperature-sensitive polypeptide brushes-coated mesoporous silica nanoparticles for dual-responsive drug release. Chin. Chem. Lett. 2019, 30, 2291–2294. [Google Scholar] [CrossRef]
- Yu, F.; Wu, H.; Tang, Y.; Xu, Y.; Qian, X.; Zhu, W. Temperature-sensitive copolymer-coated fluorescent mesoporous silica nanoparticles as a reactive oxygen species activated drug delivery system. Int. J. Pharm. 2018, 536, 11–20. [Google Scholar] [CrossRef] [PubMed]
- Beňová, E.; Bergé-Lefranc, D.; Zeleňák, V.; Almáši, M.; Huntošová, V.; Hornebecq, V. Adsorption properties, the pH-sensitive release of 5-fluorouracil and cytotoxicity studies of mesoporous silica drug delivery matrix. Appl. Surf. Sci. 2020, 504, 1–12. [Google Scholar] [CrossRef]
- Almáši, M.; Beňová, E.; Zeleňák, V.; Madaj, B.; Huntošová, V.; Brus, J.; Urbanová, M.; Bednarčík, J.; Hornebecq, V. Cytotoxicity study and influence of SBA-15 surface polarity and pH on adsorption and release properties of anticancer agent pemetrexed. Mater. Sci. Eng. C 2019, 109, 110552. [Google Scholar] [CrossRef] [PubMed]
- Žid, L.; Zeleňák, V.; Almáši, M.; Zeleňáková, A.; Szücsová, J.; Bednarčík, J.; Šuleková, M.; Hudák, A.; Váhovská, L. Mesoporous silica as a drug delivery system for naproxen: Influence of surface functionalization. Molecules 2020, 25, 4722. [Google Scholar] [CrossRef]
- Qu, J.; Zhao, X.; Ma, P.X.; Guo, B. Injectable antibacterial conductive hydrogels with dual response to an electric field and pH for localized “smart” drug release. Acta Biomater. 2018, 72, 55–69. [Google Scholar] [CrossRef] [PubMed]
- Zeleňák, V.; Beňová, E.; Almáši, M.; Halamová, D.; Hornebecq, V.; Hronský, V. Photo-switchable nanoporous silica supports for controlled drug delivery. New J. Chem. 2018, 42, 13263–13271. [Google Scholar] [CrossRef]
- Beňová, E.; Zeleňák, V.; Halamová, D.; Almáši, M.; Petruľová, V.; Psotka, M. A drug delivery system based on switchable photo-controlled p-coumaric acid derivatives anchored on mesoporous silica. J. Mater. Chem. B 2017, 5, 817–825. [Google Scholar] [CrossRef] [PubMed]
- Kapusta, O.; Zeleňáková, A.; Hrubovčák, P.; Girman, V.; Zeleňák, V. Fe2O3 and Gd2O3 nanoparticles embedded in mesoporous silica: Magnetic properties comparison. Acta Phys. Pol. A 2017, 131, 860–862. [Google Scholar] [CrossRef]
- Vila, M.; Cicuéndez, M.; Sánchez-Marcos, J.; Fal-Miyar, V.; Manzano, M.; Prieto, C.; Vallet-Regi, M. Electrical stimuli to increase cell proliferation on carbon nanotubes/mesoporous silica composites for drug delivery. J. Biomed. Mater. Res. Part A 2013, 101, 213–221. [Google Scholar] [CrossRef]
- Gu, M.; Wang, X.; Toh, T.B.; Chow, E.K.H. Applications of stimuli-responsive nanoscale drug delivery systems in translational research. Drug Discov. Today 2018, 23, 1043–1052. [Google Scholar] [CrossRef] [PubMed]
- Zhao, J.; Lu, C.; He, X.; Zhang, X.; Zhang, W.; Zhang, X. Polyethylenimine-grafted cellulose nanofibril aerogels as versatile vehicles for drug delivery. ACS Appl. Mater. Interfaces 2015, 7, 2607–2615. [Google Scholar] [CrossRef]
- Sun, X.; Cai, C.; Wang, Q.; Cai, D.; Qian, J.; Chi, Y.; Zheng, K.; Zhang, X.; Zhang, G.; Zhong, K. A polyethylenimine functionalized porous/hollow nanoworm as a drug delivery system and a bioimaging agent. Phys. Chem. Chem. Phys. 2016, 18, 7820–7828. [Google Scholar] [CrossRef] [PubMed]
- Zou, Y.; Li, D.; Shen, M.; Shi, X. Polyethylenimine-based nanogels for biomedical applications. Macromol. Biosci. 2019, 19, 1900272. [Google Scholar] [CrossRef] [PubMed]
- Han, S.C.; He, W.D.; Li, J.; Li, L.Y.; Sun, X.L.; Zhang, B.Y.; Pan, T.T. Reducible polyethylenimine hydrogels with disulfide crosslinkers prepared by Michael addition chemistry as drug delivery carriers: Synthesis, properties, and in vitro release. J. Polym. Sci. Part A Polym. Chem. 2009, 47, 4074–4082. [Google Scholar] [CrossRef]
- Zhou, C.B.; Zhao, L.; Shen, M.; Zhao, J.; Shi, X. Multifunctional polyethylenimine-based nanoplatform for targeted anticancer drug delivery to tumors in vivo. J. Mater. Chem. C 2015, 3, 10715–10722. [Google Scholar] [CrossRef]
- Zhang, J.T.; Xue, Y.N.; Gao, F.Z.; Huang, S.W.; Zhuo, R.X. Preparation of temperature-sensitive poly(N-isopropylacrylamide)/b-cyclodextrin-grafted polyethylenimine hydrogels for drug delivery. J. Appl. Polym. Sci. 2008, 108, 3031–3037. [Google Scholar] [CrossRef]
- Sun, X.; Wang, N.; Yang, L.Y.; Ouyang, X.K.; Huang, F. Folic acid and PEI modified mesoporous silica for targeted delivery of curcumin. Pharmaceutics 2019, 11, 623. [Google Scholar] [CrossRef] [PubMed]
- Todd, P.A.; Sorkin, E.M. Diclofenac sodium. A reappraisal of its pharmacodynamic and pharmacokinetic properties, and therapeutic efficacy. Drugs 1988, 35, 244–285. [Google Scholar] [CrossRef]
- Hench, L.; Larry, L.; West, J.K. The sol-gel process. Chem. Rev. 1990, 90, 33–72. [Google Scholar] [CrossRef]
- Pirez, C.; Morin, J.C.; Manayil, J.C.; Lee, A.F.; Wilson, K. Sol-gel synthesis of SBA-15: Impact of HCl on surface chemistry. Microporous Mesoporous Mater. 2018, 271, 196–202. [Google Scholar] [CrossRef]
- Nobbmann, U.; Morfesis, A. Light scattering and nanoparticles. Mater. Today 2009, 12, 52–54. [Google Scholar] [CrossRef]
- Almáši, M.; Zeleňák, V.; Opanasenko, M.; Čejka, J. Efficient and reusable Pb(II) metal–organic framework for Knoevenagel condensation. Catal. Lett. 2018, 148, 2263–2273. [Google Scholar] [CrossRef]
- Lien, Y.H.; Wu, T.M. Preparation and characterization of thermosensitive polymers grafted onto silica-coated iron oxide nanoparticles. J. Colloid Interface. Sci. 2008, 326, 517–521. [Google Scholar] [CrossRef]
- Gandhi, A.; Paul, A.; Sen, S.O.; Sen, K.K. Studies on thermoresponsive polymers: Phase behaviour, drug delivery and biomedical applications. Asian J. Pharm. Sci. 2015, 10, 99–107. [Google Scholar] [CrossRef]
- Giles, C.H.; Smith, D.; Huitson, A.A. General treatment and classification of the solute adsorption isotherm I. theoretical. J. Colloid Interface Sci. 1974, 47, 755–765. [Google Scholar] [CrossRef]
- Llinas, A.; Burley, J.C.; Box, K.J.; Glen, R.C.; Goodman, J.M. Diclofenac solubility: Independent determination of the intrinsic solubility of three crystal forms. J. Med. Chem. 2007, 50, 979–983. [Google Scholar] [CrossRef]
- Fini, A.; Laus, M.; Orienti, I.; Zecchi, V. Dissolution and partition thermodynamic functions of some nonsteroidal anti-inflammatory drugs. J. Pharm. Sci. 1986, 75, 23–25. [Google Scholar] [CrossRef]
- Žilnik, L.F.; Jazbinšek, A.; Hvala, A.; Vrečer, F.; Klamt, A. Solubility of sodium diclofenac in different solvents. Fluid Phase Equilibria 2007, 261, 140–145. [Google Scholar] [CrossRef]
- Zacher, J.; Altman, R.; Bellamy, N.; Bruhlmann, P.; Da Silva, J.; Huskisson, E.; Taylor, R.S. Topical diclofenac and its role in pain and inflammation: An evidence-based review. Curr. Med. Res. Opin. 2008, 24, 925–950. [Google Scholar] [CrossRef] [PubMed]
- Pathan, S.; Solanki, P.; Patel, A. Functionalized SBA-15 for controlled release of poorly soluble drug, Erythromycin. Microporous Mesoporous Mater. 2018, 258, 114–121. [Google Scholar] [CrossRef]
- Polo, L.; Gómez-Cerezo, N.; Garcia-Fernández, A.; Aznar, E.; Vivancos, J.L.; Arcos, D.; Vallet-Regi, M.; Martinez-Mánez, R. Mesoporous bioactive glasses equipped with stimuli-responsive molecular gates for controlled delivery of levofloxacin against bacteria. Chem. Eur. J. 2018, 24, 18944–18951. [Google Scholar] [CrossRef] [PubMed]
- Doadrio, C.; Sousa, E.M.B.; Izquierdo-Barba, I.; Doadrio, A.L.; Perez-Pariente, J.; Vallet-Regí, M. Functionalization of mesoporous materials with long alkyl chains as a strategy for controlling drug delivery pattern. J. Mater. Chem. 2006, 16, 462–466. [Google Scholar] [CrossRef]
- Merchant, H.A.; Shoaib, H.M.; Tazeen, J.; Yousuf, R. I Once-daily tablet formulation and in vitro release evaluation of cefpodoxime using hydroxypropyl methylcellulose: A technical note. AAPS PharmSciTech 2006, 7, 178–183. [Google Scholar] [CrossRef] [PubMed]
- Madhavi, M.; Madhavi, K.; Jithan, A.V. Preparation and in vitro/in vivo characterization of curcumin microspheres intended to treat colon cancer. J. Pharm. Bioallied Sci. 2012, 4, 164–171. [Google Scholar]
- Marini, V.G.; Martelli, S.M.; Zornio, C.F.; Caon, T.; Simoes, C.M.O.; Micke, G.A.; Oliviera, M.A.L.; Machado, V.G.; Soldi, V. Biodegradable nanoparticles obtained from zein as a drug delivery system for terpinen-4-ol. Quím. Nova 2014, 37, 839–843. [Google Scholar] [CrossRef]
- Gouda, R.; Baishya, H.; Qing, Z. Application of mathematical models in drug release kinetics of Carbidopa and Levodopa ER tablets. J. Dev. Drugs 2017, 6, 1000171. [Google Scholar]


| Sample | ν(OH) | ν(SiOSi)s | ν(SiOSi)as | δ(SiOSi) | δ(OH) | ν(CH)aliph | δ(CH) | δ(NH2) | ν(NH2) |
|---|---|---|---|---|---|---|---|---|---|
| SBA-15(C) | 3437 | 809 | 1088 | 462 | 1638 | - | - | - | - |
| SBA-15(C)-Cl | 3427 | 800 | 1100 | 466 | 1638 | 2981 | 1453 | - | - |
| 2931 | |||||||||
| 2900 | |||||||||
| SBA-15(C)-800 | - | 800 | 1100 | 475 | 1656 | 2954 | 1462 | 1602 | 3360 |
| 2837 | 3300 | ||||||||
| SBA-15(C)-1300 | - | 800 | 1124 | 475 | 1638 | 2952 | 1462 | 1603 | 3283 |
| 2837 | 3301 | ||||||||
| SBA-15(C)-2000 | - | 804 | 1098 | 475 | 1629 | 2953 | 1462 | 1602 | 3251 |
| 2838 | 3300 |
| Sample | ν(CH)ar | δ(CH) | ν(CCl) | ν(C=C)ar | ν(NH) | ν(COO−)s | ν(COO−)as | δ(NH) |
|---|---|---|---|---|---|---|---|---|
| SBA-15(C)/DIC | 3080 | 1454 | 746 | 1555 | 3420 | 1450 | 1509 | 1611 |
| 1580 | 3274 | |||||||
| SBA-15(C)-800/DIC | 3082 | 1454 | 748 | 1555 | 3413 | 1451 | 1510 | 1609 |
| 1580 | 3280 | |||||||
| SBA-15(C)-1300/DIC | 3081 | 1453 | 746 | 1555 | 3421 | 1450 | 1511 | 1612 |
| 1580 | 3274 | |||||||
| SBA-15(C)-2000/DIC | 3080 | 1454 | 748 | 1555 | 3418 | 1453 | 1510 | 1610 |
| 1580 | 3271 |
| Sample | Surface Area | Pore Size | Pore Volume |
|---|---|---|---|
| (m2.g−1) | (nm) | (cm3.g−1) | |
| SBA-15(C)-TOL | 14 | - | 0.21 |
| SBA-15(C)-HCl | 547 | 7.2 | 0.64 |
| SBA-15(C)-THF | 744 | 8.1 | 0.82 |
| SBA-15(C) | 814 | 8.6 | 0.86 |
| SBA-15(C)-Cl | 470 | 6.1 | 0.41 |
| SBA-15(C)-800 | 206 | 5.9 | 0.28 |
| SBA-15(C)-1300 | 184 | 5.6 | 0.24 |
| SBA-15(C)-2000 | 144 | 5.5 | 0.24 |
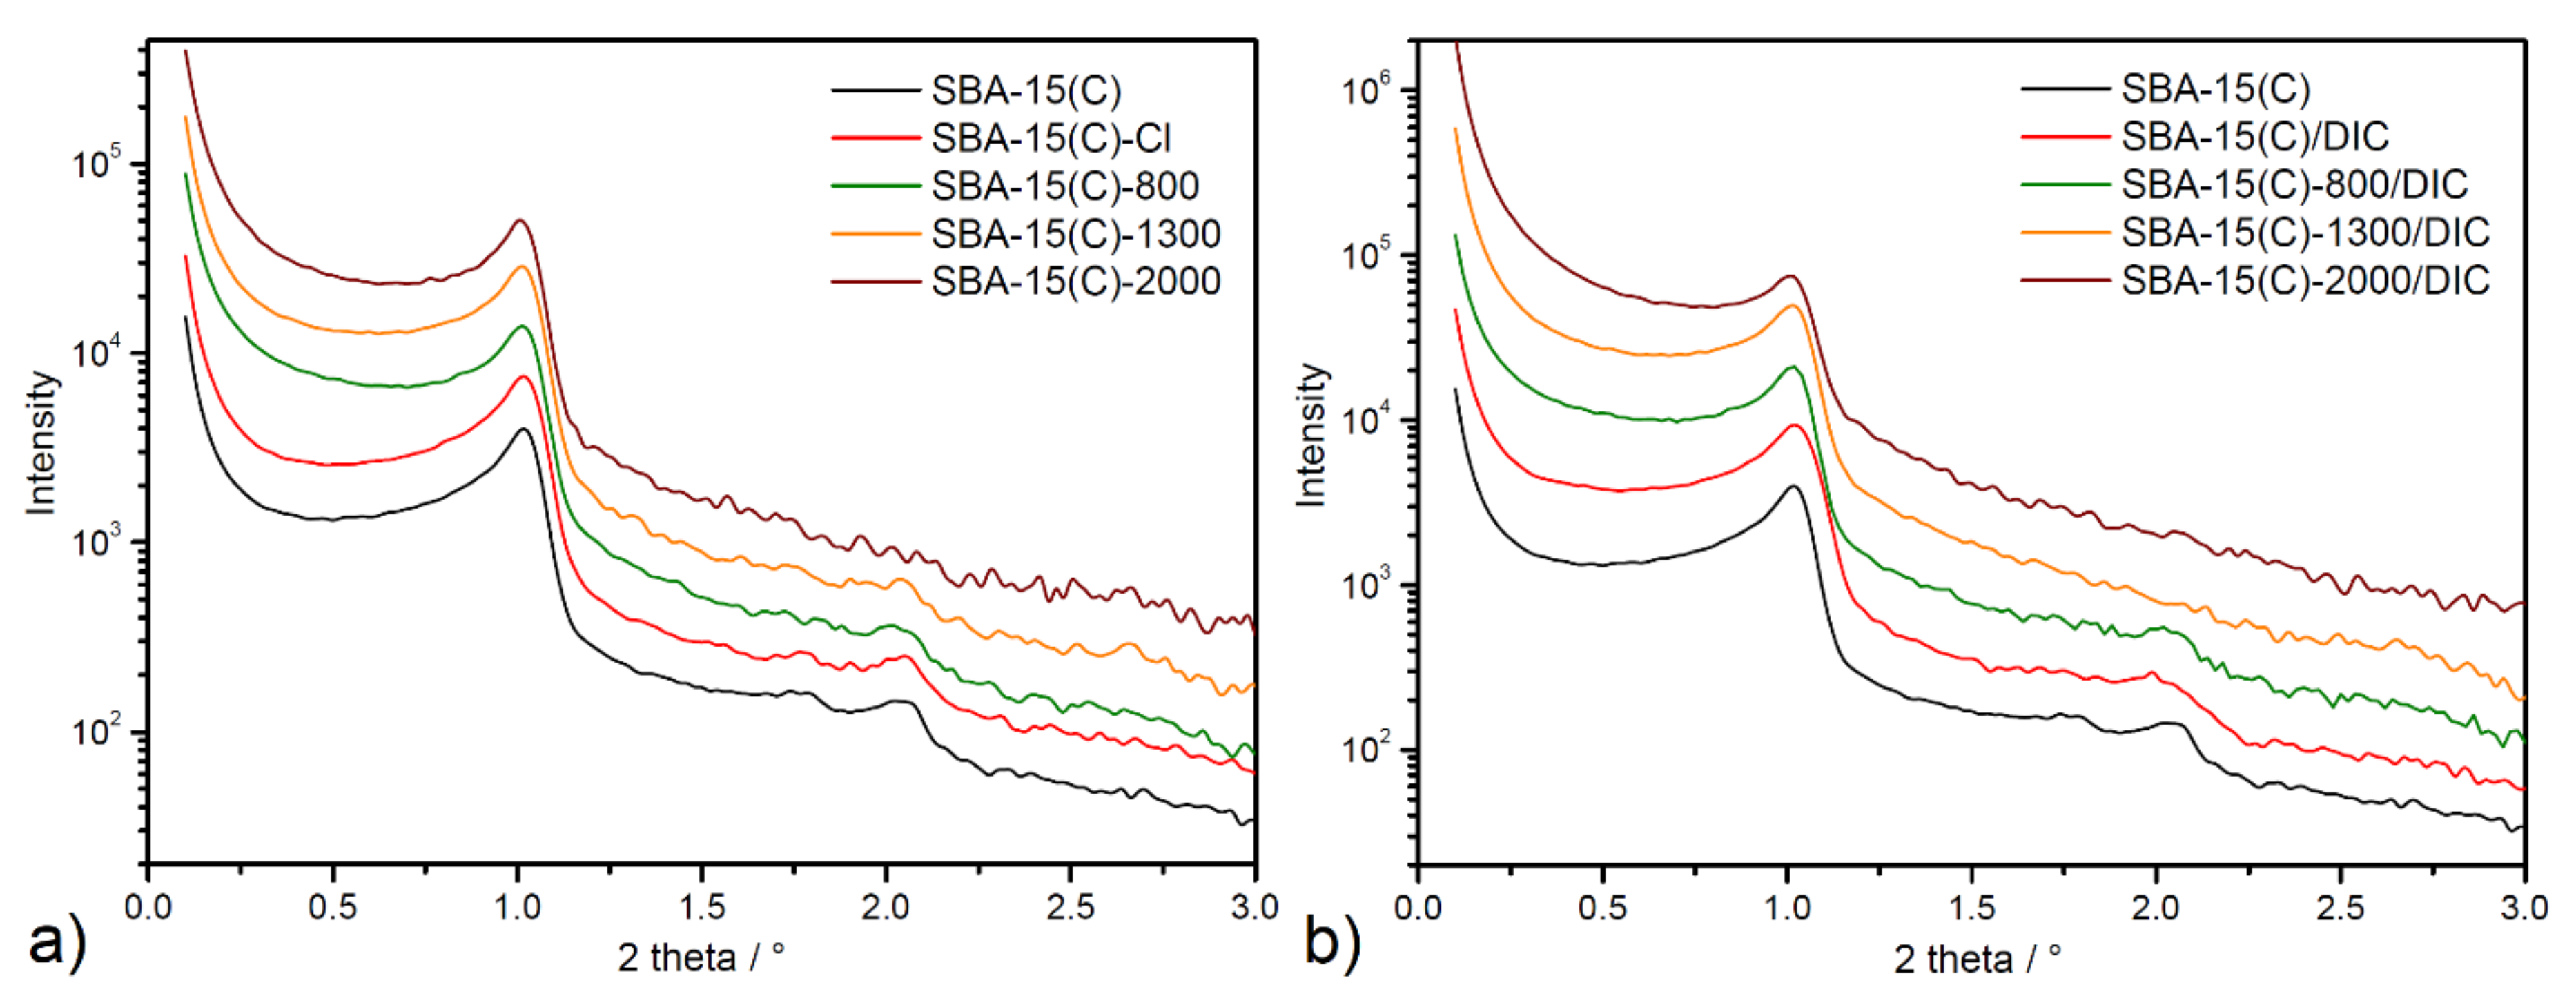
| Sample | 2θ of (100)/° | a/Å |
|---|---|---|
| SBA-15(C) | 1.019 | 100.0 |
| SBA-15(C)-Cl | 1.017 | 100.2 |
| SBA-15(C)-800 | 1.014 | 100.5 |
| SBA-15(C)-1300 | 1.014 | 100.5 |
| SBA-15(C)-2000 | 1.010 | 100.9 |
| SBA-15(C)/DIC | 1.018 | 100.1 |
| SBA-15(C)-800/DIC | 1.019 | 100.0 |
| SBA-15(C)-1300/DIC | 1.018 | 100.1 |
| SBA-15(C)-2000/DIC | 1.010 | 100.9 |
| Sample | Weight Loss a wt.% | Mass of Organic Part b mg·g−1 | Amount of Organic Part c mmol·g−1 |
|---|---|---|---|
| SBA-15(C)-Cl | 6.01 | 58.8 | - |
| SBA-15(C)-800 | 9.80 | 92.6 | 0.116 |
| SBA-15(C)-1300 | 14.95 | 146.5 | 0.113 |
| SBA-15(C)-2000 | 24.02 | 237.5 | 0.118 |
| Sample | Total Weight Loss a wt.% | DIC Weight Loss b wt.% | DIC Mass c mg·g−1 | DIC Mass Per Surface d mg·m−2 |
|---|---|---|---|---|
| SBA-15(C)/DIC | 16.17 | 15.95 | 191.1 | 0.235 |
| SBA-15(C)-800/DIC | 26.95 | 17.15 | 205.6 | 0.998 |
| SBA-15(C)-1300/DIC | 29.85 | 14.90 | 178.7 | 0.971 |
| SBA-15(C)-2000/DIC | 35.85 | 11.83 | 141.8 | 0.985 |
| pH and Temperature (°C) Conditions | ||||
|---|---|---|---|---|
| Sample | pH = 2 | pH = 7.4 | ||
| 37 °C | 42 °C | 37 °C | 42 °C | |
| SBA-15(C)/DIC | 5.3 | 8.1 | 89.4 | 91.6 |
| SBA-15-800(C)/DIC | 4.4 | 12.3 | 51.1 | 73.5 |
| SBA-15-1300(C)/DIC | 7.0 | 15.8 | 48.1 | 75.1 |
| SBA-15-2000(C)/DIC | 3.6 | 10.7 | 49.2 | 72.7 |
| Diclofenac Duo | 2.8 | 7.3 | 90.3 | 98.9 |
| Zero Order | First Order | Korsmeyer– Peppas | Higuchi | Hixson– Crowell | ||
|---|---|---|---|---|---|---|
| Sample | Temperature (°C) | k0 (mol.dm−3·h−1) r2 | k1(h−1) r2 | kKP(h−n) n r2 | kH(h−0.5) r2 | kHC(h−1/3) r2 |
| SBA-15(C) | 37 | 12.126 0.7064 | 0.6909 0.4863 | * | 21.594 0.9603 | 0.3442 0.8632 |
| 42 | 12.437 0.5548 | 0.3732 0.7581 | * | 37.046 0.8144 | 0.3827 0.6893 | |
| SBA-15(C)-800 | 37 | 1.5813 0.5341 | 0.0239 0.6172 | 0.0003 2.7 0.9364 | 10.055 0.8262 | 0.0322 0.5897 |
| 42 | 8.4882 0.6977 | 0.1747 0.8097 | 0.0025 1.7 0.8073 | 27.842 0.9064 | 0.2813 0.8217 | |
| SBA-15(C)-1300 | 37 | 1.6105 0.4397 | 0.0179 0.4459 | 0.0001 3.4 0.9544 | 8.7135 0.6318 | 0.0316 0.4696 |
| 42 | 9.3551 0.8143 | 0.0490 0.4558 | 0.0118 1.4 0.8398 | 29.258 0.9618 | 0.0583 0.4352 | |
| SBA-15(C)-2000 | 37 | 1.7957 0.5268 | 0.0216 0.5467 | 0.0009 2.3 0.9932 | 11.4221 0.8156 | 0.0355 0.5604 |
| 42 | 2.5615 0.6401 | 0.1027 0.9345 | 0.0043 1.8 0.8773 | 13.708 0.8788 | 0.0609 0.7425 | |
| Diclofenac Duo | 37 | 18.435 0.8911 | 0.4511 0.9261 | * | 46.3081 0.9301 | 0.5726 0.9699 |
| 42 | 3.0354 0.3521 | 0.1713 0.6017 | * | 21.2451 0.6599 | 0.6291 0.9502 |
Publisher’s Note: MDPI stays neutral with regard to jurisdictional claims in published maps and institutional affiliations. |
© 2021 by the authors. Licensee MDPI, Basel, Switzerland. This article is an open access article distributed under the terms and conditions of the Creative Commons Attribution (CC BY) license (https://creativecommons.org/licenses/by/4.0/).
Share and Cite
Zauska, L.; Bova, S.; Benova, E.; Bednarcik, J.; Balaz, M.; Zelenak, V.; Hornebecq, V.; Almasi, M. Thermosensitive Drug Delivery System SBA-15-PEI for Controlled Release of Nonsteroidal Anti-Inflammatory Drug Diclofenac Sodium Salt: A Comparative Study. Materials 2021, 14, 1880. https://doi.org/10.3390/ma14081880
Zauska L, Bova S, Benova E, Bednarcik J, Balaz M, Zelenak V, Hornebecq V, Almasi M. Thermosensitive Drug Delivery System SBA-15-PEI for Controlled Release of Nonsteroidal Anti-Inflammatory Drug Diclofenac Sodium Salt: A Comparative Study. Materials. 2021; 14(8):1880. https://doi.org/10.3390/ma14081880
Chicago/Turabian StyleZauska, Lubos, Stefan Bova, Eva Benova, Jozef Bednarcik, Matej Balaz, Vladimir Zelenak, Virginie Hornebecq, and Miroslav Almasi. 2021. "Thermosensitive Drug Delivery System SBA-15-PEI for Controlled Release of Nonsteroidal Anti-Inflammatory Drug Diclofenac Sodium Salt: A Comparative Study" Materials 14, no. 8: 1880. https://doi.org/10.3390/ma14081880
APA StyleZauska, L., Bova, S., Benova, E., Bednarcik, J., Balaz, M., Zelenak, V., Hornebecq, V., & Almasi, M. (2021). Thermosensitive Drug Delivery System SBA-15-PEI for Controlled Release of Nonsteroidal Anti-Inflammatory Drug Diclofenac Sodium Salt: A Comparative Study. Materials, 14(8), 1880. https://doi.org/10.3390/ma14081880