
Experimental Investigations on Interface between Ordinary and Lightweight Aggregate Concretes Cast at Different Times


Abstract
1. Introduction
1.1. Experimental Investigations
1.2. Design Procedures
- in beams ρs,min = 0.20 fctm/fyk > 0.1%,
- in slabs ρs,min = 0.12 fctm/fyk > 0.05%.
2. Materials and Methods
2.1. Test Programme and Test Setup
2.2. Materials
2.3. Preparation of the Test Specimens
- Casting of the substrate parts and their subsequent conditioning in the laboratory,
- preparation of the surface of the interface by gentle grinding (to remove the excess of cement laitance) or graining, carried out approximately 6 months after casting the base elements,
- drilling holes and injecting of the post-installed reinforcement (in selected elements), and
- casting concrete overlay.
2.4. Testing Procedure and Measuring Equipment
3. Results
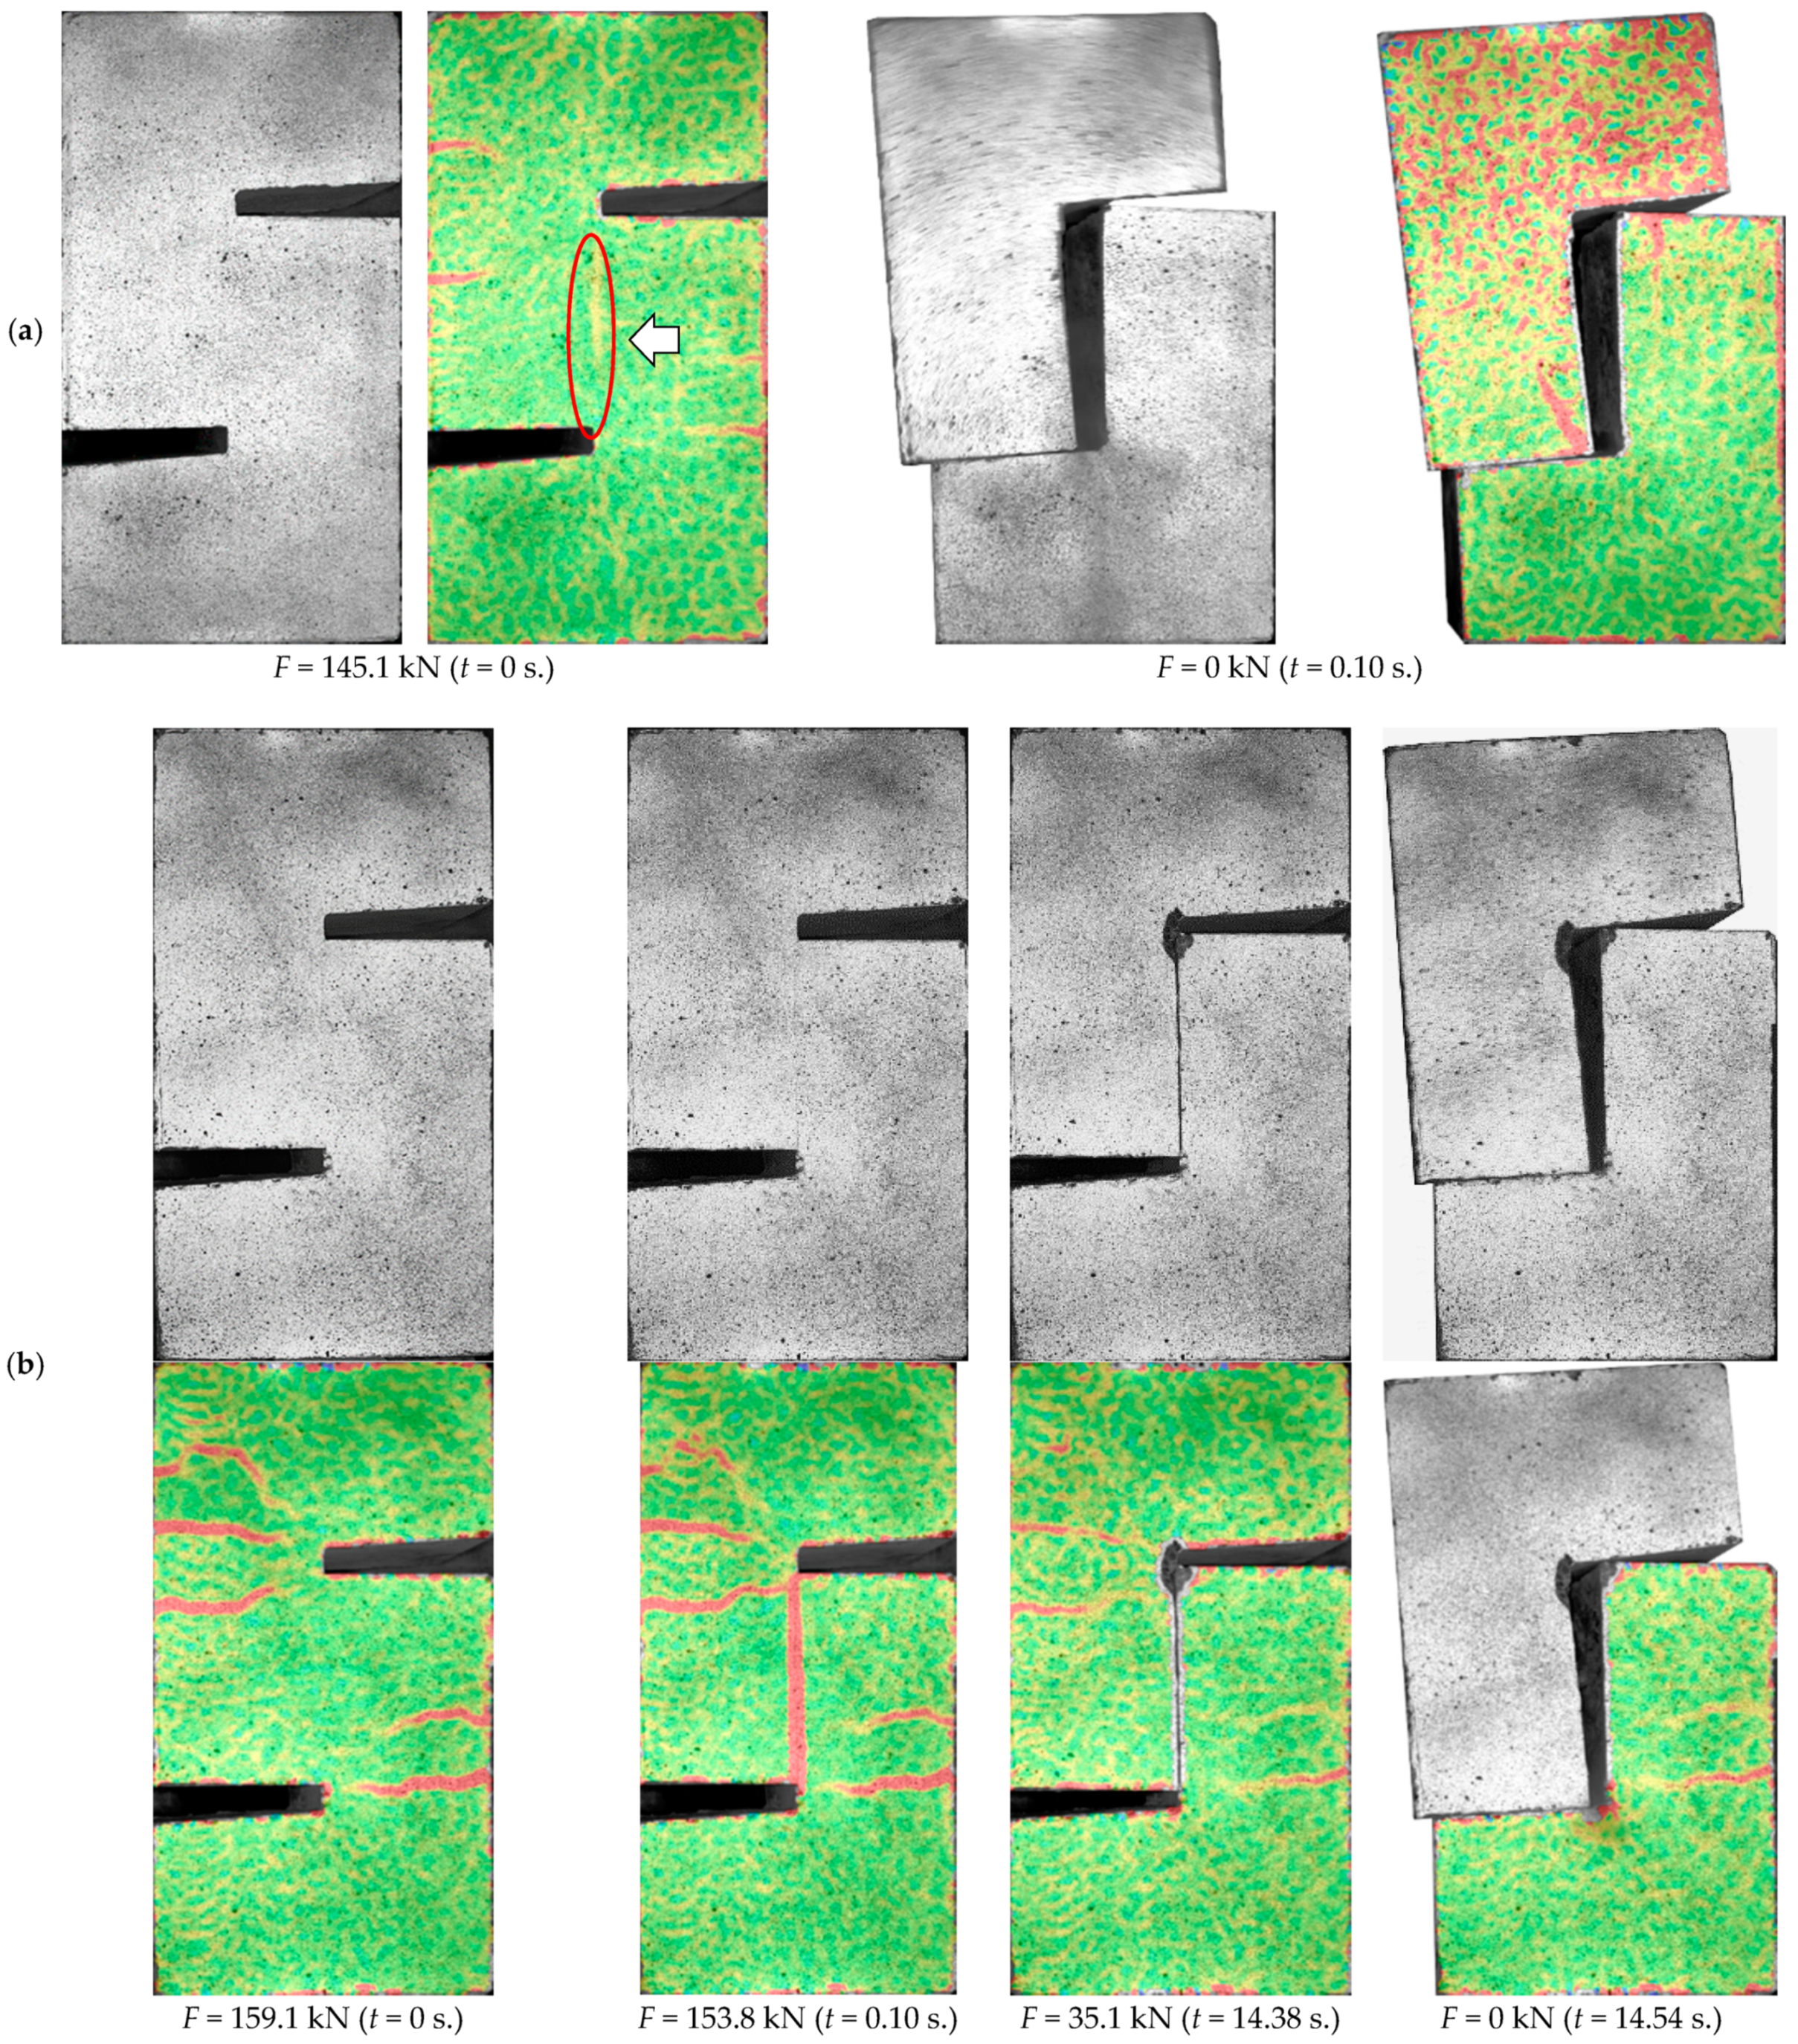
3.1. Crack Pattern
3.2. Slip and Crack Opening
3.3. Strains of the Shear Reinforcement
3.4. Failure Mode
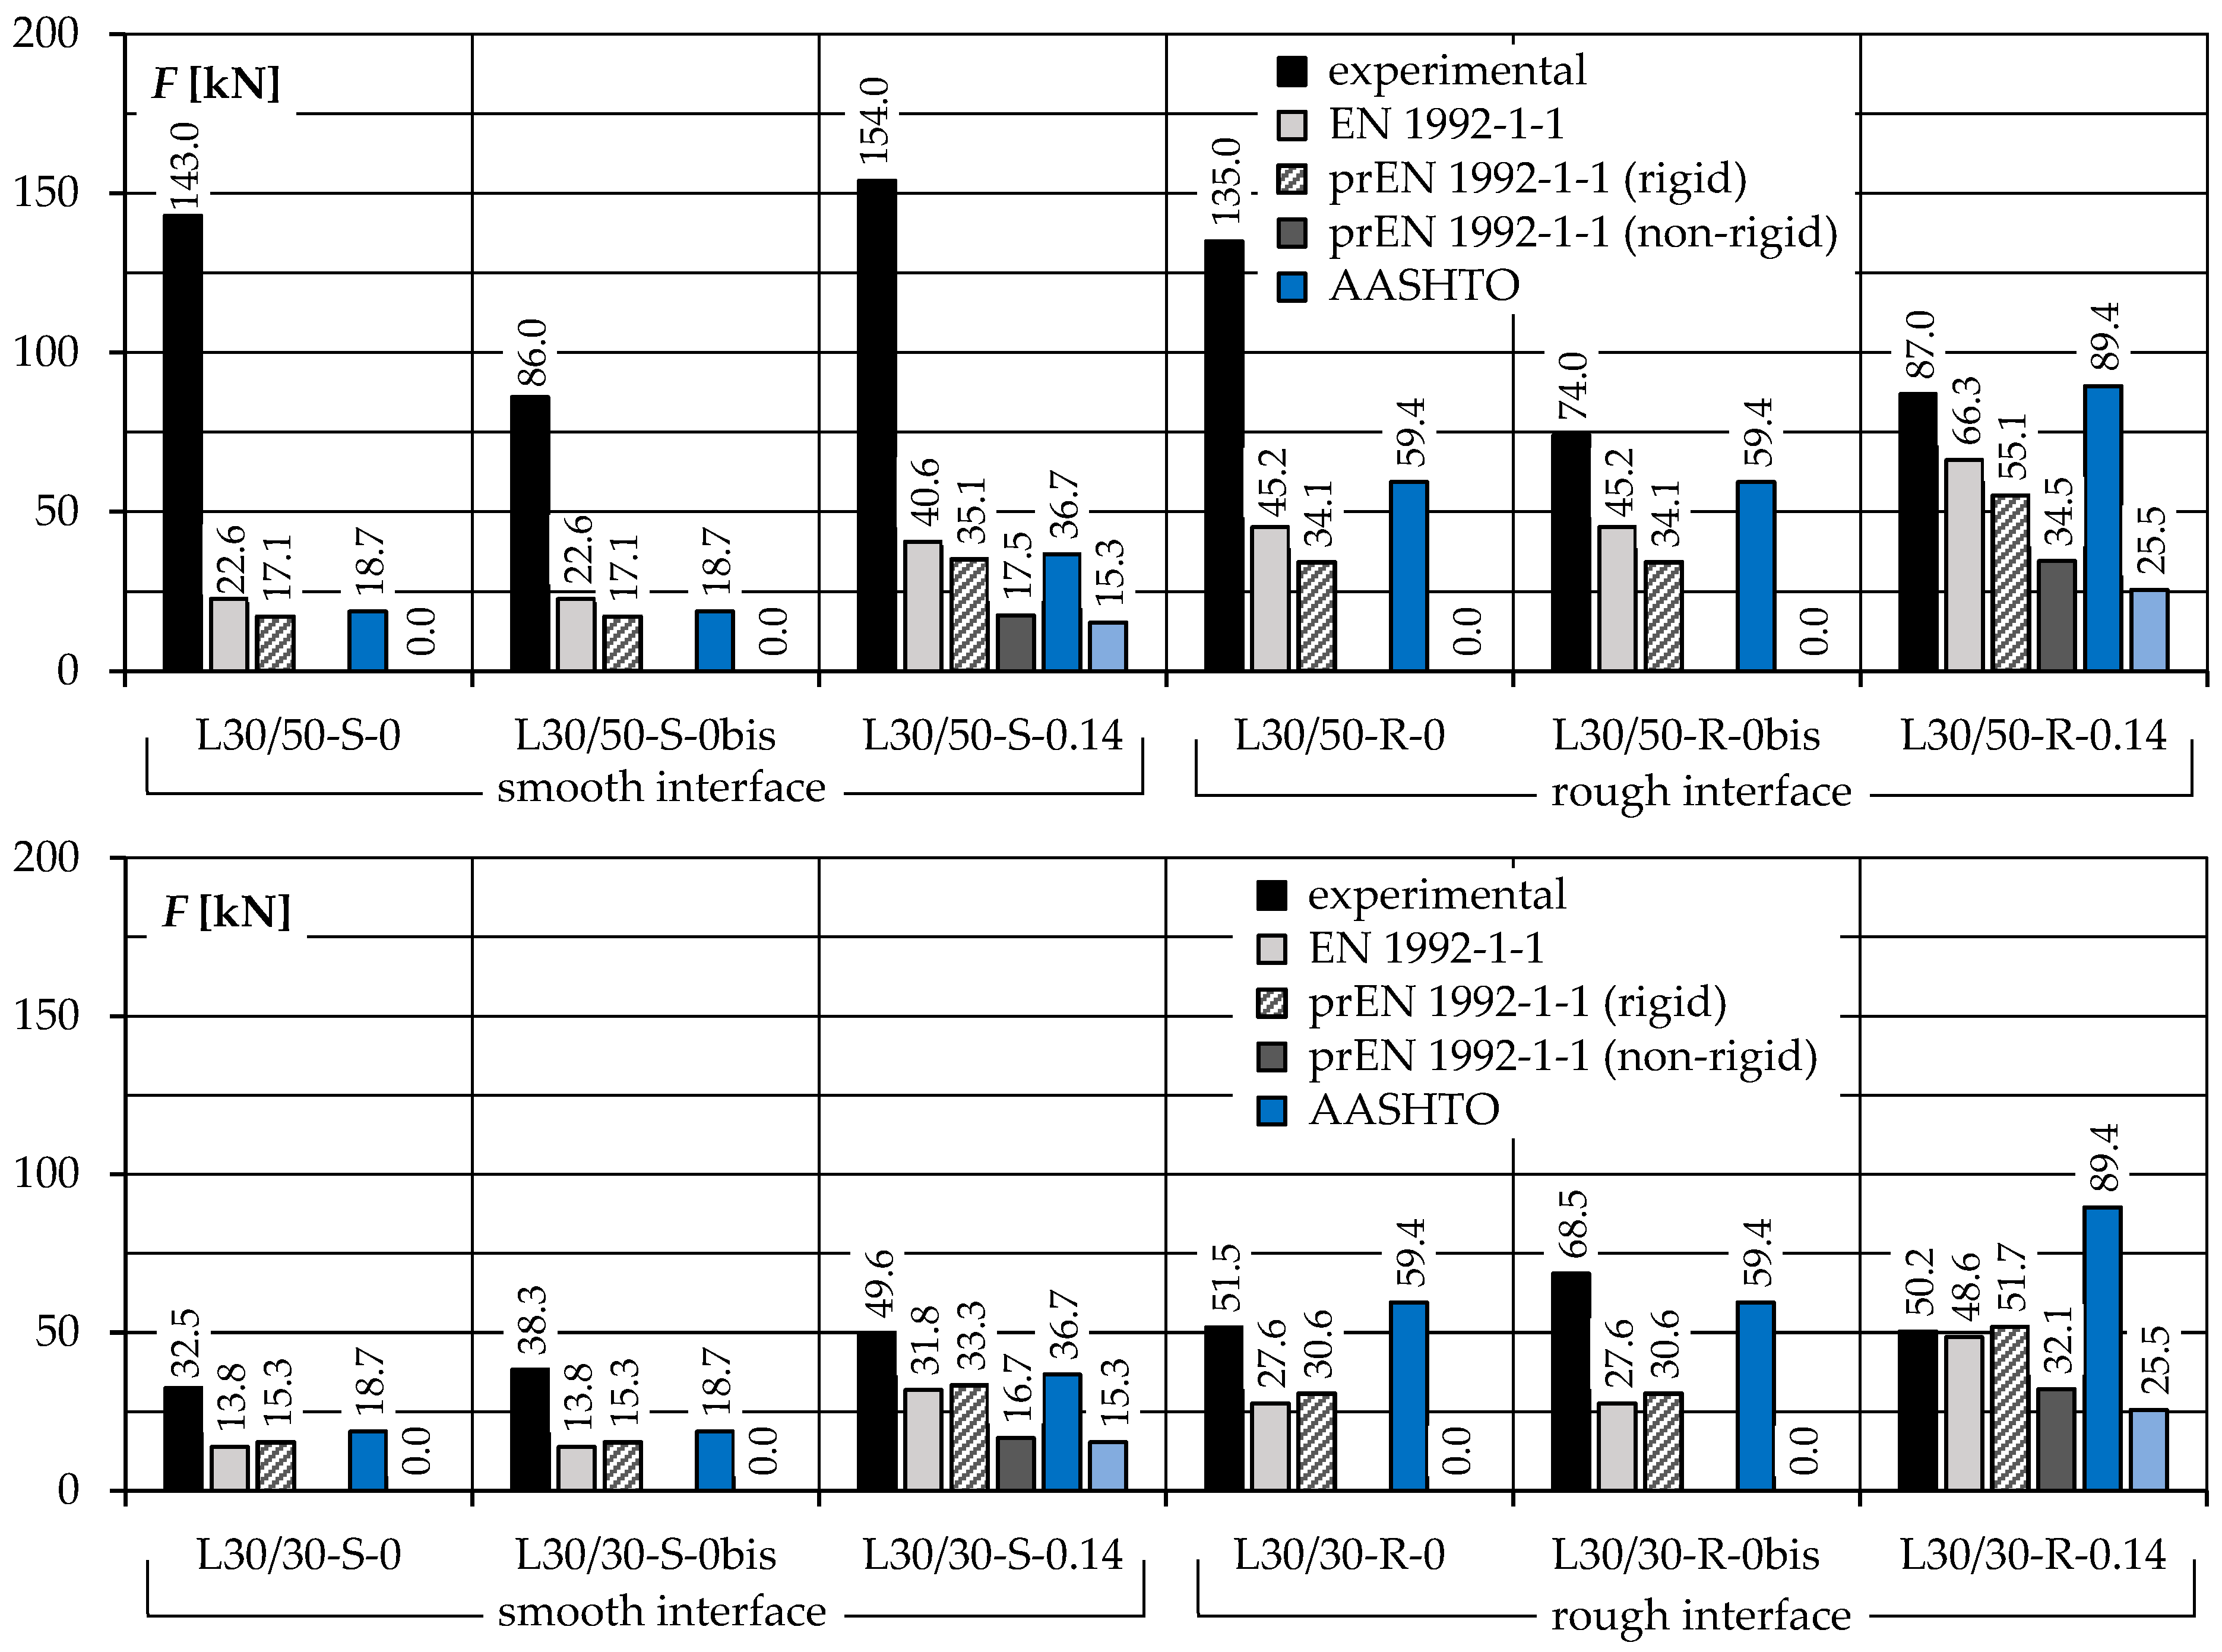
3.5. Experimental Loads
3.6. Mechanism of Shear Transfer
4. Discussion of the Test Results
5. Conclusions
- Differences in failure mode and load carrying capacities depending on the method of surface preparation and the strength of the lightweight aggregate concrete overlay were found—the load capacities of the L30/50 series specimens were higher by about 40% and 70% compared to the corresponding models of the L30/30 series, in case of the roughened and smooth contacts, respectively;
- in elements with a smooth interface (S type models), the failure plane crossed the overlay concrete if it was characterized by a lower strength than the substrate (the failure resembled "peeling off" of a concrete block); however, if the strength of the overlay concrete was higher, then the failure plane was located within the subsurface layer of the substrate;
- in case of the elements with a deliberately roughened interface (R type specimens), the failure plane always crossed the substrate concrete, which can be explained by lower strength due to micro-cracks resulting from an invasive surface preparation method;
- the introduction of shear reinforcement in the form of post-installed ∅8 bars resulted in a change in failure mode from brittle to more ductile, but did not significantly affect the load capacity of the interface;
- after cracking, a drop in load was recorded, which means that the post-installed reinforcement used was insufficient to compensate for the loss of load carrying capacity resulting from breaking the specific adhesion forces, which proves their decisive influence at the low interface reinforcement ratios at the level of ρs = 0.14%—due to the low carrying capacity of the shear reinforcement as well as limited strength of the lightweight aggregate (the tests demonstrated crushing and abrasion of aggregate grains) the resistance resulted from specific adhesion;
- the post-peak load capacity was approximately 23–31% and 65–67% of the maximum load, respectively, in case of L30/50 and L30/30 series specimens and resulted mainly from the contribution of the shear reinforcement (dowel action) and frictional forces;
- strain measurements of the shear reinforcement showed that it did not yield at interface cracking—in case of elements with a smooth surface, the steel stress accounted for about 18–23% of the yield point, while in case of an element with a surface roughened by graining, they were close to zero;
- an intense increase in steel strains was recorded only in the post-peak phase, when rebars acted mainly as dowels (dowel-action mechanism was decisive);
- it was found that most of the existing design procedures [4,33,34,35] allowed for a safe, but sometimes very conservative, estimation of the load carrying capacity of the interfaces between normal and lightweight aggregate concrete, cast at different times; the highest differences were noted in case of L30/50 series elements with smooth contact, when the experimental load capacities were even 10 times higher than the experimental ones;
- the discrepancies between the results of the tests and calculations resulted primarily from the insufficient description of the forces related to adhesion—in case of the AASHTO [35] procedure, the contribution of adhesion depends only on the method of surface preparation and is not related to the strength of concrete, while in the ACI 318-19 [34] procedure, based on the shear-friction theory, these forces are ignored and the theoretical load carrying capacities of the elements without shear reinforcement were equal to zero;
- despite a different design philosophy, adopted in prEN 1992-1-1 [33], where it is assumed that adhesion does not act simultaneously with aggregate interlock and dowel action effect, the slightly worse agreement between results of tests and calculations with respect to the EN 1992-1-1 [4] procedure was obtained—the mean Fexp/Fcalc ratios were equal to 3.66 and 2.66, respectively.
Author Contributions
Funding
Data Availability Statement
Acknowledgments
Conflicts of Interest
List of Designations
| As | cross section of the rebar |
| As,min | minimal reinforcement |
| c | factor reflecting adhesion forces |
| ca, cv1 | coefficient for adhesive bond |
| cr, cv2 | coefficient for aggregate interlock effect |
| D | diameter of the circle formed in sand path method |
| Dg | maximum size of the aggregate |
| Ecm | secant modulus of elasticity of ordinary concrete |
| Elcm | secant modulus of elasticity of lightweight aggregate concrete |
| Es | Young’s modulus of reinforcing steel |
| fcd | concrete compressive strength (design value) |
| fcm | concrete compressive strength (mean value) |
| fck | concrete compressive strength (characteristic value) |
| fctd | tensile strength of ordinary concrete (design value) |
| fctm | tensile strength of ordinary concrete (mean value) |
| fct,spm | tensile splitting strength of concrete (mean value) |
| flcm | compressive strength of lightweight aggregate concrete (mean value) |
| flctm | tensile strength of lightweight aggregate concrete (mean value) |
| fyd | yield strength of the reinforcement (design value) |
| fyk | yield strength of the reinforcement (characteristic value) |
| fym | yield strength of the reinforcement (mean value) |
| fum | tensile strength of the reinforcement (mean value) |
| F | force applied on the test specimen |
| Fc | load capacity resulting from concrete contribution |
| Fcalc | theoretical load carrying capacity (resulting from design procedure) |
| Fexp | maximum load carrying capacity |
| Fres | residual (post-peak) load carrying capacity |
| Fs | load capacity resulting from steel contribution |
| hef | embedment depth of the shear reinforcement |
| kf | coefficient for dowel action |
| kt | coefficient for clamping action |
| K1 | factor reflecting fraction of concrete strength available to resist interface shear |
| Rpm | mean peak height |
| Rt | mean profile depth |
| Rz | mean peak-to-valley height |
| tmin | smaller value of the thickness of new and old concrete layer |
| wm | crack width |
| wmax | crack width at failure |
| v | coefficient for the strength reduction of the compressed struts |
| vm | slip at the interface |
| vmax | slip at failure |
| vRd,i | shear resistance of the interface |
| vu | interface shear resistance |
| vu,max | limiting interface shear resistance |
| V | volume of sand used in sand path method |
| α | inclination of the reinforcement to the shear plane |
| εsi | strain of shear reinforcement |
| εyh | steel strain at the end of yield plateau |
| εym | steel strain at yield point |
| εum | steel strain at peak stress |
| γc | partial safety factor for concrete |
| κ1 | interaction coefficient |
| κ2 | coefficient for flexural resistance |
| λ | coefficient reflecting aggregate composition |
| μ, μv | coefficient of friction |
| ρ | concrete density (oven dry) |
| ρs | ratio of the reinforcement crossing shear plane |
| ρs,min | minimal shear reinforcement ratio |
| σn | stress acting perpendicular to the shear plane |
| σs | steel stress |
| τ | shear stress |
| τRd,i | shear resistance of the interface |
| τRd,max | maximum shear resistance of the interface |
References
- Urban, T.; Gołdyn, M.; Krawczyk, Ł. Błędy Projektowe Żelbetowego Stropu Opartego Na Konstrukcji Stalowej (Design Errors of the Reinforced Concrete Floor Supported on the Steel Structure). In Awarie Budowlane. Zapobieganie Diagnostyka Naprawy Rekonstrukcje; Kaszyńska, M., Ed.; Zachodniopomorski Uniwersytet Technologiczny w Szczecinie: Szczecin-Międzyzdroje, Poland, 2017; pp. 847–854. [Google Scholar]
- Urban, T.; Gołdyn, M.; Krawczyk, Ł. O przyczynach problemów z żelbetowym stropem opartym na konstrukcji stalowej (About Reasons of the Problems with Reinforced Concrete Floor Slab Supported on the Steel Structure—Case Study). Inżynieria i Budownictwo 2017, 73, 644–647. [Google Scholar]
- Jiang, H.; Fang, Z.; Liu, A.; Li, Y.; Feng, J. Interface Shear Behavior between High-Strength Precast Girders and Lightweight Cast-in-Place Slabs. Constr. Build. Mater. 2016, 128, 449–460. [Google Scholar] [CrossRef]
- EN 1992-1-1: Eurocode 2: Design of Concrete Structures. Part 1-1: General Rules and Rules for Buildings; European Committee for Standardisation: Brussels, Belgium, 2004.
- Kriz, L.B.; Raths, C.H. Connections in Precast Concrete Structures: Strength of Corbels; Portland Cement Association, Research and Development Laboratories: Skokie, IL, USA, 1965; pp. 16–61. [Google Scholar]
- Birkeland, P.W.; Birkeland, H.W. Connections in Precast Concrete Construction. Am. Concr. Inst. J. 1966, 63, 345–368. [Google Scholar]
- Mast, R. Auxiliary Reinforcement in Concrete Connections. J. Struct. Div. 1968, 94, 1485–1504. [Google Scholar] [CrossRef]
- Hofbeck, A.J.; Ibrahim, I.O.I.; Mattock, A.H. Shear Transfer in Reinforced Concrete. ACI J. Proc. 1969, 66. [Google Scholar] [CrossRef]
- Mattock, A.H.; Hawkins, N.M. Shear Transfer in Reinforced Concrete—Recent Research. PCI J. 1972, 17, 55–75. [Google Scholar] [CrossRef]
- Harries, K.A.; Zeno, G.; Shahrooz, B.; Wang, D.; Lu, X. Toward an Improved Understanding of Shear-Friction Behavior. ACI Struct. J. 2012, 109, 835–844. [Google Scholar]
- Randl, N.; Wicke, M. Schubübertragung Zwischen Alt-und Neubeton. Experimentelle Untersuchungen, Theoretischer Hintergrund Und Bemessungsansatz. Beton-und Stahlbetonbau 2000, 95, 461–473. [Google Scholar] [CrossRef]
- Kahn, L.; Mitchell, A.D. Shear Friction Test with High-Strength Concrete. ACI Struct. J. 2002, 99, 98–103. [Google Scholar]
- Mattock, A.H.; Li, W.K.; Wang, T.C. Shear Transfer in Lightweight Reinforced Concrete. PCI J. 1976, 21, 20–39. [Google Scholar] [CrossRef]
- Shaw, D.M.; Sneed, L.H. Interface Shear Transfer of Lightweight-Aggregate Concretes Cast at Different Times. PCI J. 2014, 59, 130–144. [Google Scholar] [CrossRef]
- Sneed, L.H.; Krc, K.; Wermager, S.; Meinheit, D. Interface Shear Transfer of Lightweight-Aggregate Concretes with Different Lightweight Aggregates. PCI J. 2016, 61, 38–55. [Google Scholar] [CrossRef]
- Costa, H.; Carmo, R.N.F.; Júlio, E. Influence of Normal Stress and Reinforcement Ratio on the Behavior of LWAC Interfaces. Constr. Build. Mater. 2018, 192, 317–329. [Google Scholar] [CrossRef]
- Rahal, K.N.; Al-Khaleefi, A.L. Shear-Friction Behavior of Recycled and Natural Aggregate Concrete—An Experimental Investigation. ACI Struct. J. 2015, 112, 725–734. [Google Scholar] [CrossRef]
- Xiao, J.; Sun, C.; Lange, D.A. Effect of Joint Interface Conditions on Shear Transfer Behavior of Recycled Aggregate Concrete. Constr. Build. Mater. 2016, 105, 343–355. [Google Scholar] [CrossRef]
- Fang, Z.; Jiang, H.; Liu, A.; Feng, J.; Li, Y. Shear-Friction Behaviour on Smooth Interface between High-Strength and Lightweight Concrete. Mag. Concr. Res. 2020, 72, 68–87. [Google Scholar] [CrossRef]
- Hsu, T.T.C.; Mau, S.T.; Chen, B. Theory of Shear Transfer Strength of Reinforced Concrete. ACI Struct. J. 1987, 84, 149–160. [Google Scholar]
- Ahmad, S.; Bhargava, P.; Chourasia, A. Shear Transfer Strength of Uncracked Interfaces: A Simple Analytical Model. Constr. Build. Mater. 2018, 192, 366–380. [Google Scholar] [CrossRef]
- Halicka, A. Studium Stanu Naprężeń i Odkształceń w Płaszczyźnie Styku i Strefie Przypodporowej Elementów Zespolonych z Udziałem Betonów Skurczowych i Ekspansywnych; Wydawnictwo Politechniki Lubelskiej: Lublin, Poland, 2007. [Google Scholar]
- Júlio, E.N.B.S.; Dias-da-Costa, D.; Branco, F.A.B.; Alfaiate, J.M.V. Accuracy of Design Code Expressions for Estimating Longitudinal Shear Strength of Strengthening Concrete Overlays. Eng. Struct. 2010, 32, 2387–2393. [Google Scholar] [CrossRef]
- Mohamad, M.E.; Ibrahim, I.S.; Abdullah, R.; Rahman, A.B.A.; Kueh, A.B.H.; Usman, J. Friction and Cohesion Coefficients of Composite Concrete-to-Concrete Bond. Cem. Concr. Compos. 2015, 56, 1–14. [Google Scholar] [CrossRef]
- Gohnert, M. Horizontal Shear Transfer across a Roughened Surface. Cem. Concr. Compos. 2003, 25, 379–385. [Google Scholar] [CrossRef]
- Santos, P.M.D.; Júlio, E.N.B.S. Interface Shear Transfer on Composite Concrete Members. ACI Struct. J. 2014, 111, 113–121. [Google Scholar] [CrossRef]
- Halicka, A. Influence New-to-Old Concrete Interface Qualities on the Behaviour of Support Zones of Composite Concrete Beams. Constr. Build. Mater. 2011, 25, 4072–4078. [Google Scholar] [CrossRef]
- Halicka, A.; Jabłoński, Ł. Shear Failure Mechanism of Composite Concrete T-Shaped Beams. Proc. Inst. Civ. Eng. Struct. Build. 2016, 169, 67–75. [Google Scholar] [CrossRef]
- Jabłoński, Ł.; Halicka, A. Influence of the Interface Reinforcement on Static Performance of Concrete Composite T-Shaped Beams. Bud. Archit. 2020, 19, 63–76. [Google Scholar] [CrossRef]
- Gołdyn, M.; Krawczyk, Ł.; Urban, T. Przyczynek Do Rozważań Na Temat Nośności Elementów z Uwagi Na Przecinanie Betonu. J. Civ. Eng. Environ. Archit. 2017, 64, 293–305. [Google Scholar] [CrossRef][Green Version]
- Mishima, T.; Suzuki, A.; Shinoda, Y.; Maekawa, K. Nonelastic Behavior of Axial Reinforcement Subjected to Axial and Slip Deformation at the Crack Surface. ACI Struct. J. 1995, 92, 380–385. [Google Scholar] [CrossRef]
- Model Code 2010—Final Draft; International Federation for Structural Concrete: Lausanne, Switzerland, 2012; Volume 2.
- CEN/TC 250/SC 2. PrEN 1992-1-1:2020 Eurocode 2: Design of Concrete Structures. Part 1-1: General Rules, Rules for Buildings, Bridges and Civil Engineering Structures; Europea Commitiee for Standardization: Brussels, Belgium, 2020. [Google Scholar]
- ACI 318-19 ACI Standard Building Code Requirements for Structural Concrete (ACI 318-19) Commentary on Building Code Requirements for Structural Concrete (ACI 318R-19); American Concrete Institute: Farmington Hills, MI, USA, 2019.
- AASHTO-LRFD Bridge Design Specifications; American Association of State Highway and Transportation Officials: Washington, DC, USA, 2012.
- CEN. EN 206+A1:2016-12 Concrete-Specification, Performance, Production, and Conformity; European Committee for Standardization: Brussels, Belgium, 2016. [Google Scholar]


| Parameter | Source |
|---|---|
| concrete strength | [8,10,11,12] |
| Type of aggregate, composition of the aggregate: ALWC (All-lightweight aggregate concrete), SLWC (Sanded-lightweight aggregate concrete), RAC (Recycled aggregate concrete) | [13,14,15,16,17,18] |
| Interface between ordinary and lightweight aggregate concrete | [3,19] |
| Shear reinforcement ratio, diameter, and location of the reinforcement | [8,11,14,15,16,20,21,22,23] |
| Roughness of the interface | [11,14,15,22,24,25,26] |
| Embedment depth and installation mode of the shear reinforcement | [11,23] |
| External pressure | [16,24] |
| Shape of the composite beam | [27,28,29] |
| Location of the interface within the section of the composite beam | [28,29] |
| Surface Preparation | EN 1992-1-1 [4] | fib Model Code 2010 [32] | PrEN 1992-1-1:2020 [33] | |||||||||
|---|---|---|---|---|---|---|---|---|---|---|---|---|
| μ | c | μ | ca | cr | κ1 | κ2 | μv | cv1 | cv2 | kt | kf | |
| Very rough | 0.9 | 0.5 | 0.8 (1.0) | 0.5 | 0.2 | 0.5 | 0.9 | 0.9 | 0.19 | 0.15 | 0.5 | 0.9 |
| Rough | 0.7 | 0.4 | 0.7 | 0.4 | 0.1 | 0.5 | 0.9 | 0.7 | 0.15 | 0.075 | 0.5 | 0.9 |
| Smooth | 0.6 | 0.2 | 0.6 | 0.2 | 0 | 0.5 | 1.1 | 0.6 | 0.075 | 0 | 0.5 | 1.1 |
| Very smooth | 0.5 | 0.025 –0.10 | 0.5 | 0.025 | 0 | 0 | 1.5 | 0.5 | 0.0095 | 0 | 0 | 1.5 |
| Roughness | Requirements for Surface Preparation |
|---|---|
| Very smooth | Surface against, e.g., steel or plastic formwork |
| Smooth | Surface without treatment after compacting (Rz < 3 mm; Rt < 1.5 mm) |
| Rough | Surface achieved by raking or exposing aggregate (Rz ≥ 3 mm at maximum 40 mm spacing; Rt ≥ 1.5 mm) |
| Very rough | Achieved by raking or exposing aggregate (Rz ≥ 6 mm at maximum 40 mm spacing; Rt ≥ 3 mm) |
| Type of Connection | Normal-Weight Concrete Placed Monolithically | Cast-in-Place Concrete Slab on Clean Concrete Girder Surfaces | Normal-Weight Concrete Placed Against Surface Intentionally Roughened (Rz > 6.4 mm) | Lightweight Aggreg. Concrete Monolithic or Placed Against Surface Intentionally Roughened (Rz > 6.4 mm) | Concrete Placed Against a Clean Concrete Surface Not Intentionally Roughened (Rz < 6.4 mm) |
|---|---|---|---|---|---|
| c (MPa) | 2.76 | 1.93 | 1.65 | 1.65 | 0.52 |
| μ | 1.4 | 1.0 | 1.0 | 1.0 | 0.6 |
| K1 | 0.25 | 0.3 | 0.25 | 0.25 | 0.2 |
| vu,max (MPa) | 10.34 | 12.41 1/8.96 2 | 10.34 | 6.89 | 5.52 |
| Designation of the Specimen | Concrete Overlay | Roughness Rt (mm) | Shear Reinforcement ρs (%) |
|---|---|---|---|
| L30/50-S-0 | Lightweight Aggregate Concrete LC30/33 | <0.1 | none |
| L30/50-S-0 bis | |||
| L30/50-S-0.14 | 0.14 | ||
| L30/50-R-0 | >0.7 | none | |
| L30/50-R-0 bis | |||
| L30/50-R-0.14 | 0.14 | ||
| L30/30-S-0 | Lightweight Aggregate Concrete LC25/28 | <0.1 | none |
| L30/30-S-0 bis | |||
| L30/30-S-0.14 | 0.14 | ||
| L30/30-R-0 | >0.7 | none | |
| L30/30-R-0 bis | |||
| L30/30-R-0.14 | 0.14 |
| Ingredient | Content per 1 m3 (kg) | ||
|---|---|---|---|
| NWC (Substrate) | LWAC (Overlay) | ||
| L30/50 Series | L30/30 Series | ||
| cement | 270 (CEM I 52.5N) | 270 (CEM I 52.5N) | 280 (CEM I 42.5N) |
| Water | 180 | 185 | 190 |
| Sand 0–2 mm | 800 | 605 | 610 |
| Crushed granite 2–8 mm | 1070 | – | – |
| Aggregate “Certyd” 4–9 mm | – | 620 | 650 |
| Zeolite 50 | – | 15 | – |
| Fly ash | – | 70 | 130 |
| Plasticizer | 1.5% c.m. | 1.8% c.m. | 0.5% c.m. |
| Substrate (NWC) | Overlay—L30/50 Series (LWAC) | Overlay—L30/30 Series (LWAC) | ||||||||
|---|---|---|---|---|---|---|---|---|---|---|
| fcm (MPa) | fctm (MPa) | Ecm (GPa) | flcm (MPa) | flctm (MPa) | Elcm (GPa) | ρ (kg/m3) | flcm (MPa) | flctm (MPa) | Elcm (GPa) | ρ (kg/m3) |
| 39.9 (25/2.0%) | 3.49 (28/4.2%) | 30.0 (23/4.2%) | 51.6 (6/2.8%) | 4.04 (10/5.2%) | 19.8 (3/1.1%) | 1787 (4/0.5%) | 32.2 (6/4.5%) | 2.13 (5/8.5%) | 18.2 (3/2.5%) | 1659 (3/0.6%) |
| Series Designation | L30/50 Series | L30/30 Series | ||||||||||
|---|---|---|---|---|---|---|---|---|---|---|---|---|
| Smooth Interface | Rough Interface | Smooth Interface | Rough Interface | |||||||||
| L30/50-S-0 | L30/50-S-0 bis | L30/50-S-0.14 | L30/50-R-0 | L30/50-R-0 bis | L30/50-R-0.14 | L30/30-S-0 | L30/30-S-0 bis | L30/30-S-0.14 | L30/30-R-0 | L30/30-R-0 bis | L30/30-R-0.14 | |
| Fexp (kN) | 143.0 | 86.0 | 154.0 | 135.0 | 74.0 | 87.0 | 32.5 | 38.3 | 50.0 | 51.5 | 68.5 | 50.0 |
| vm (mm) | 0.021 | 0.012 | 0.012 | 0.016 | 0.018 | 0.020 | 0.004 | 0.004 | 0.004 | 0.006 | 0.012 | 0.007 |
| wm (mm) | 0.008 | 0.005 | 0.011 | 0.006 | 0.005 | 0.007 | 0.004 | 0.004 | 0.005 | 0.004 | 0.004 | 0.008 |
| Fres (kN) | 35.1 | 27.2 | 32.4 | 33.4 | ||||||||
| vmax (mm) | 7.268 | 11.510 | 11.848 | 6.973 | ||||||||
| wmax (mm) | 2.188 | 1.777 | 2.002 | 1.696 | ||||||||
| Interface Condition | Smooth | Rough | ||
|---|---|---|---|---|
| Specimen | L30/30-S0.14 | L30/50-S0.14 | L30/30-R0.14 | L30-50-R0.14 |
| εsi (%) | 0.551 | 0.686 | gauge failure | −0.032 |
| σs (MPa) | 106.8 | 132.9 | −6.2 | |
| σs/fym | 0.18 | 0.23 | 0.01 | |
Publisher’s Note: MDPI stays neutral with regard to jurisdictional claims in published maps and institutional affiliations. |
© 2021 by the authors. Licensee MDPI, Basel, Switzerland. This article is an open access article distributed under the terms and conditions of the Creative Commons Attribution (CC BY) license (http://creativecommons.org/licenses/by/4.0/).
Share and Cite
Gołdyn, M.; Urban, T. Experimental Investigations on Interface between Ordinary and Lightweight Aggregate Concretes Cast at Different Times. Materials 2021, 14, 1664. https://doi.org/10.3390/ma14071664
Gołdyn M, Urban T. Experimental Investigations on Interface between Ordinary and Lightweight Aggregate Concretes Cast at Different Times. Materials. 2021; 14(7):1664. https://doi.org/10.3390/ma14071664
Chicago/Turabian StyleGołdyn, Michał, and Tadeusz Urban. 2021. "Experimental Investigations on Interface between Ordinary and Lightweight Aggregate Concretes Cast at Different Times" Materials 14, no. 7: 1664. https://doi.org/10.3390/ma14071664
APA StyleGołdyn, M., & Urban, T. (2021). Experimental Investigations on Interface between Ordinary and Lightweight Aggregate Concretes Cast at Different Times. Materials, 14(7), 1664. https://doi.org/10.3390/ma14071664