Synergistic Effects of Pr6O11 and Co3O4 on Electrical and Microstructure Features of ZnO-BaTiO3 Varistor Ceramics

 ,
,  , ,
, ,  , ,
, ,
Abstract
1. Introduction
2. Materials and Methods
2.1. Preparation of Powder and Ceramics
2.2. Characterizations
3. Results and Discussions
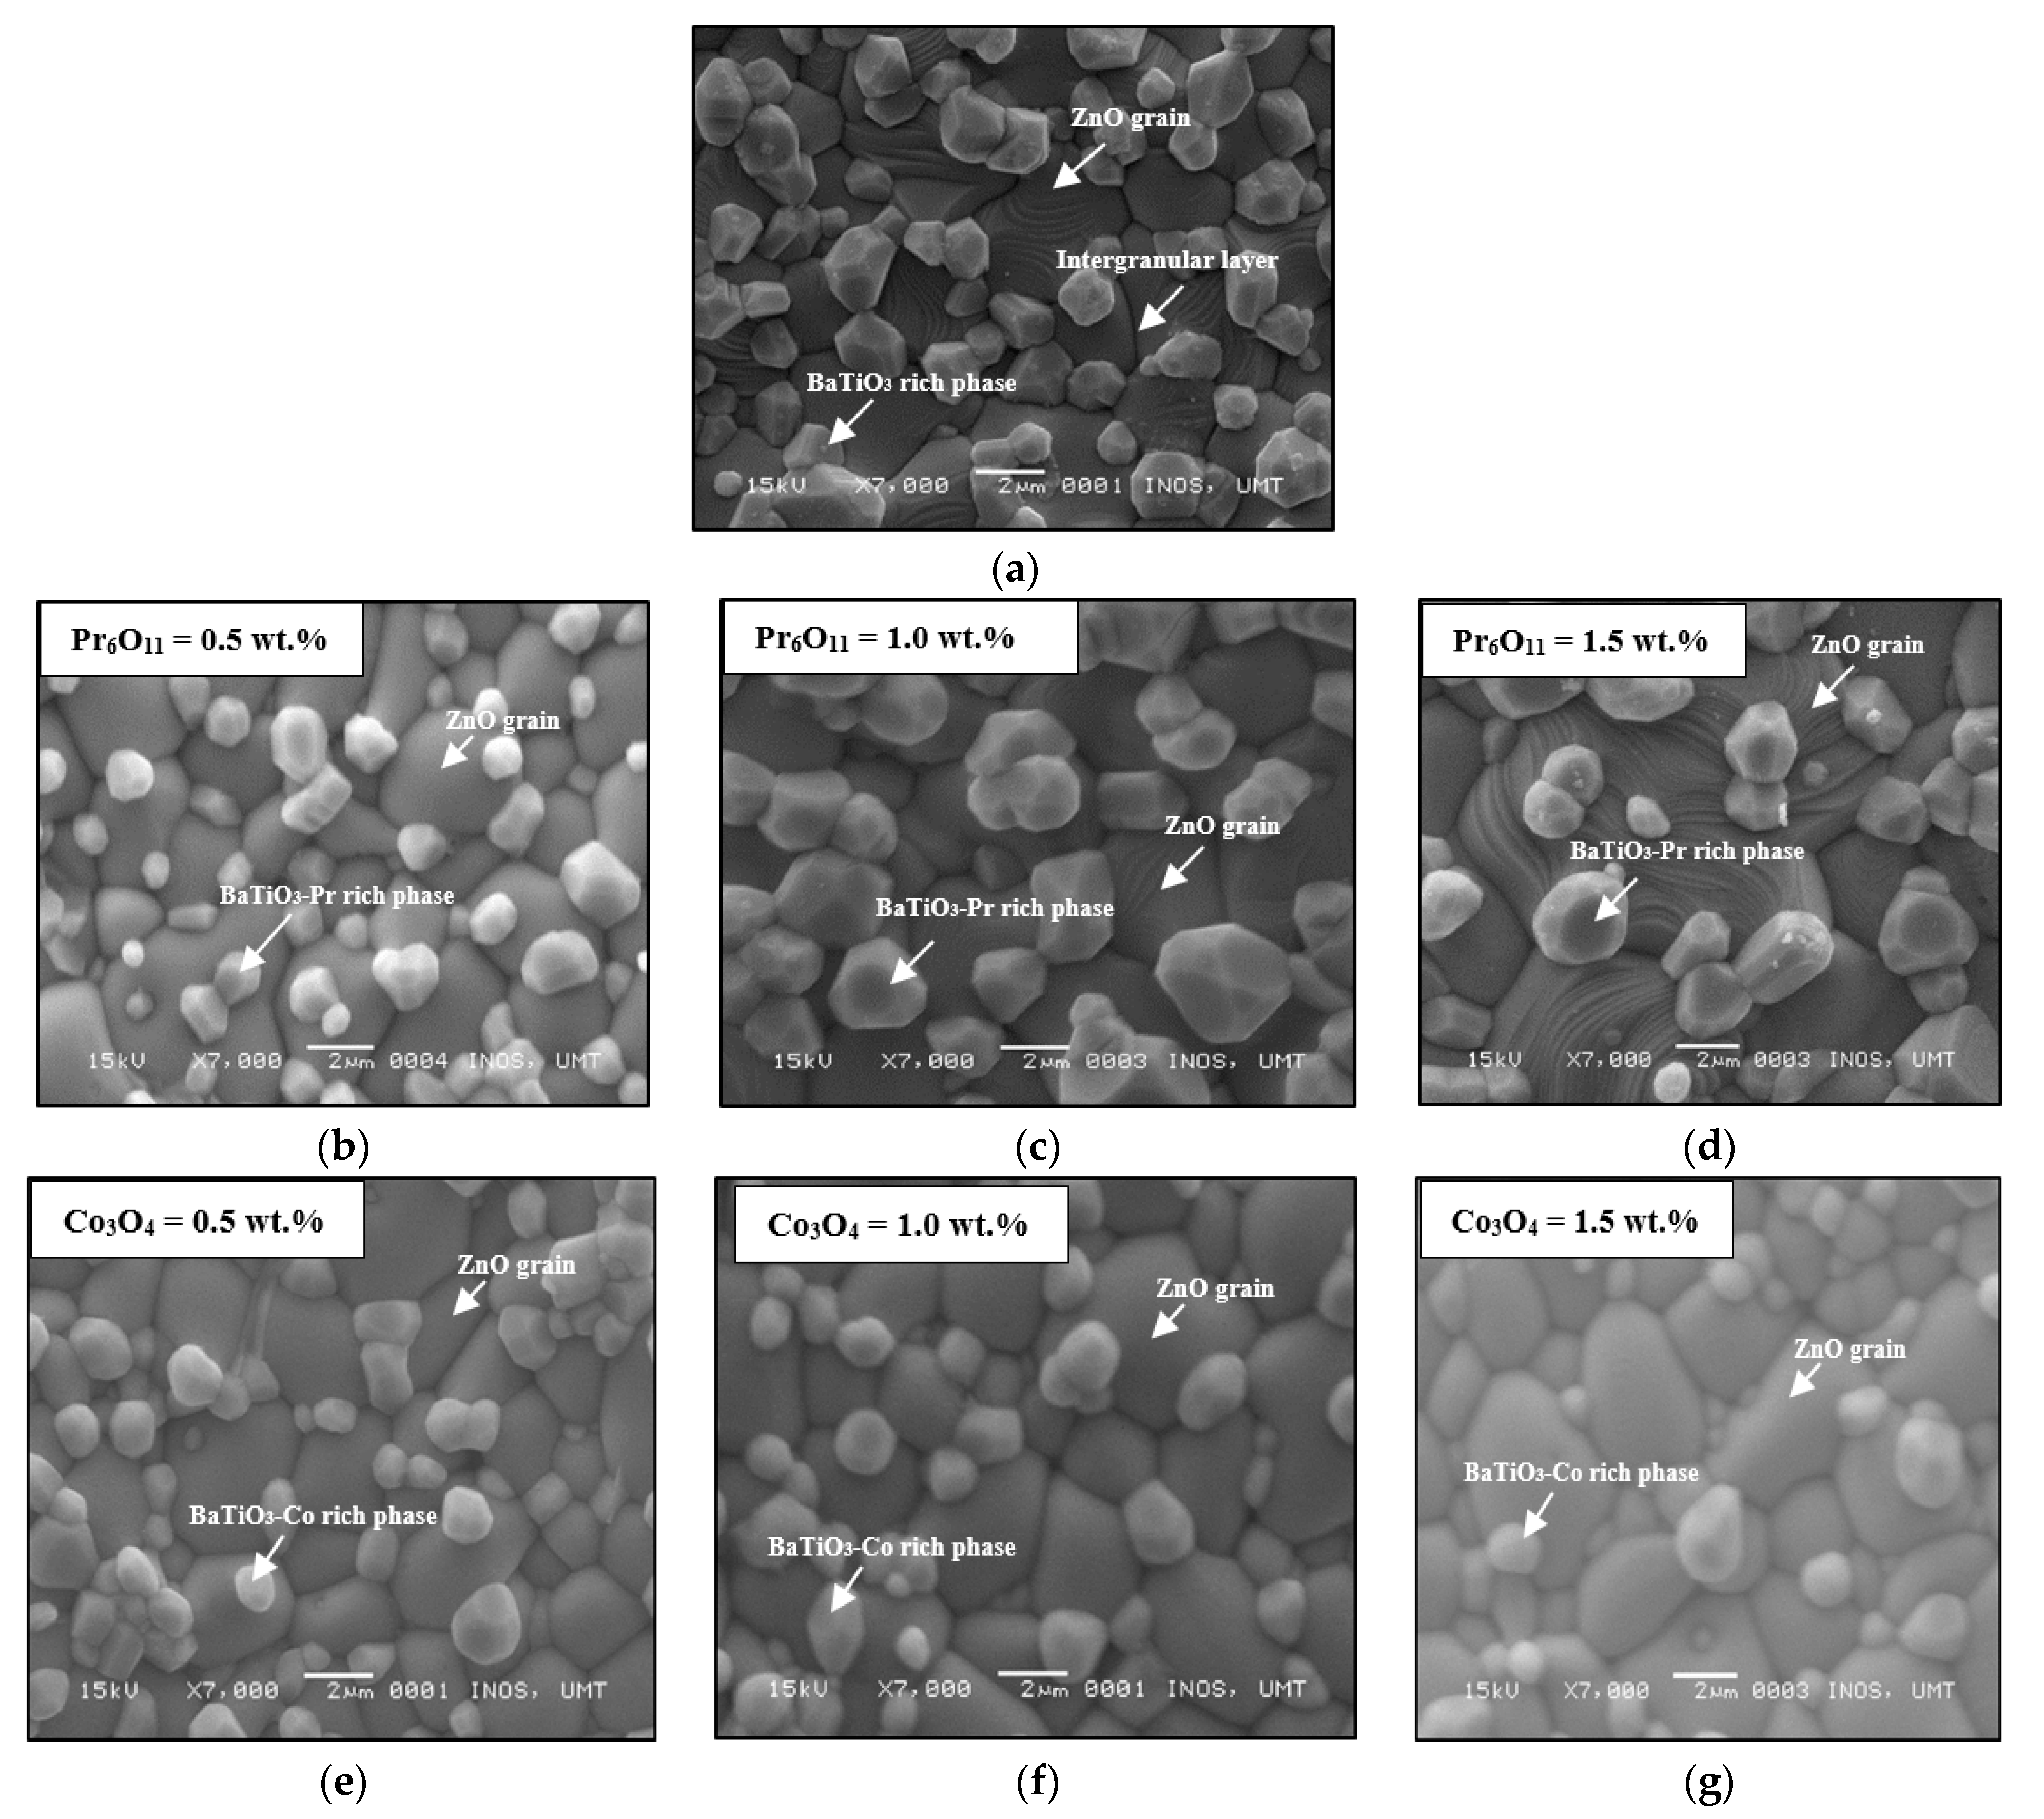
3.1. Scanning Electron Microscopy (SEM)
3.2. Energy Dispersive Spectroscopy (EDS)
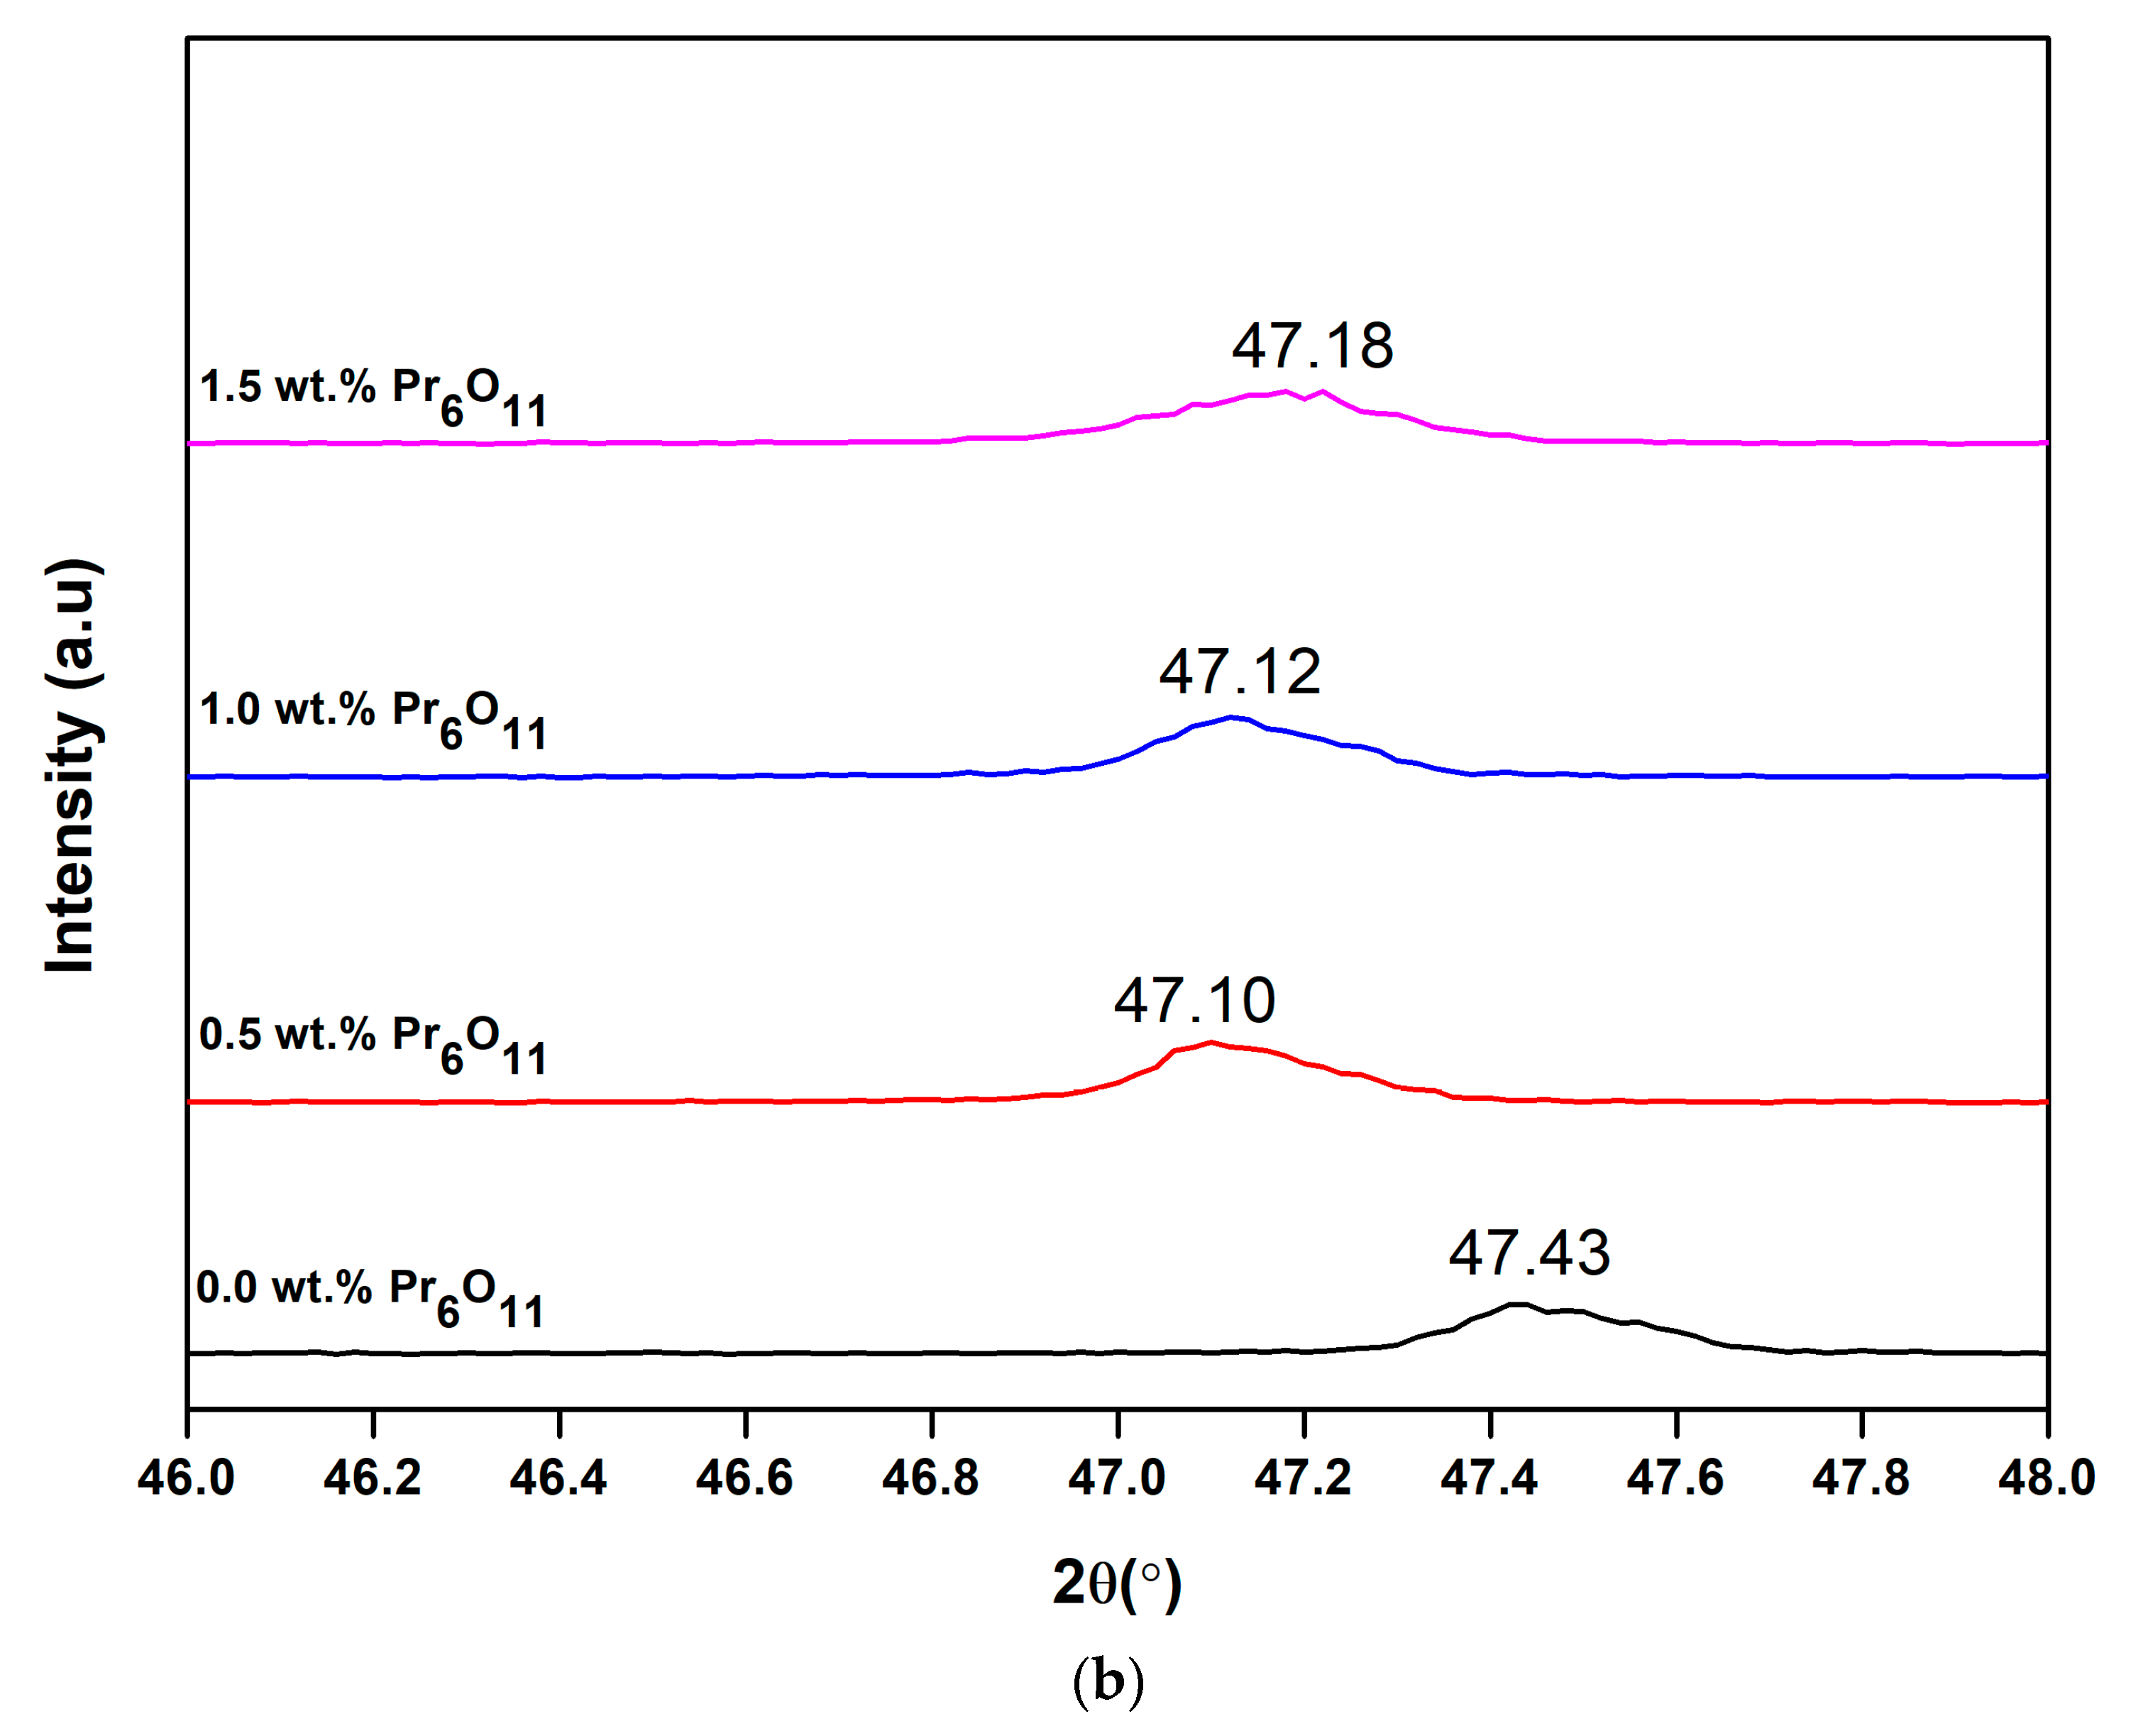
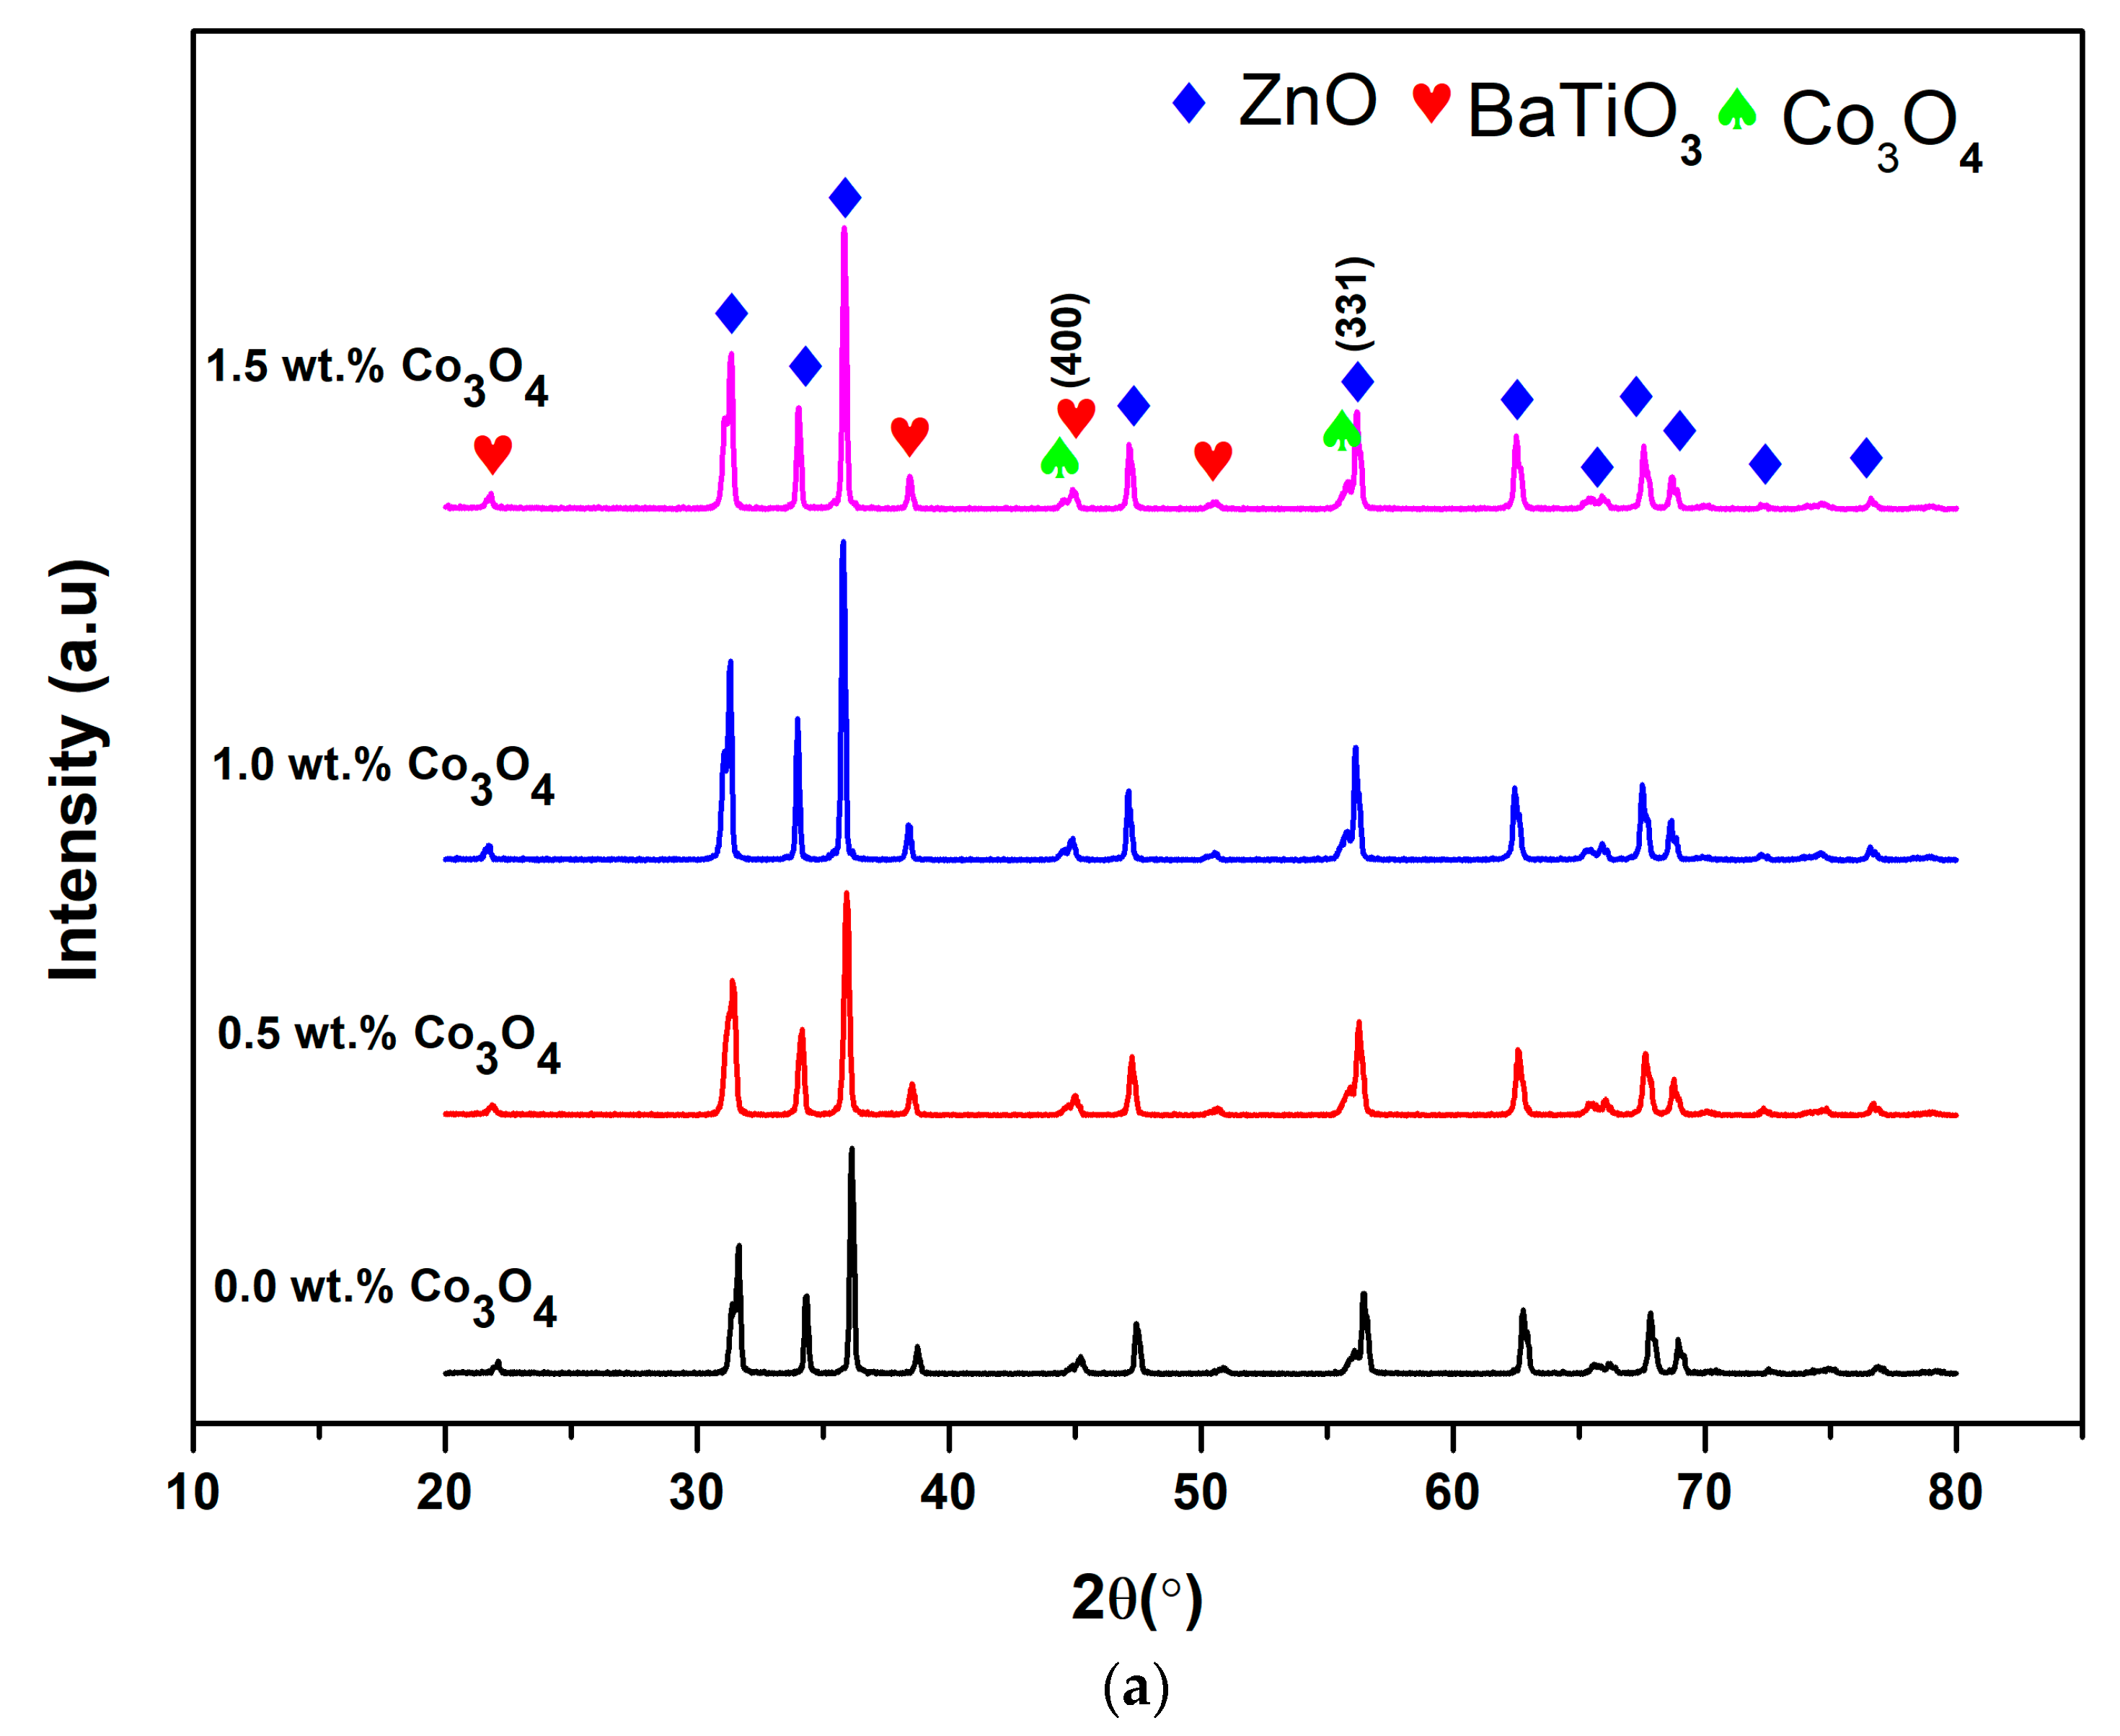
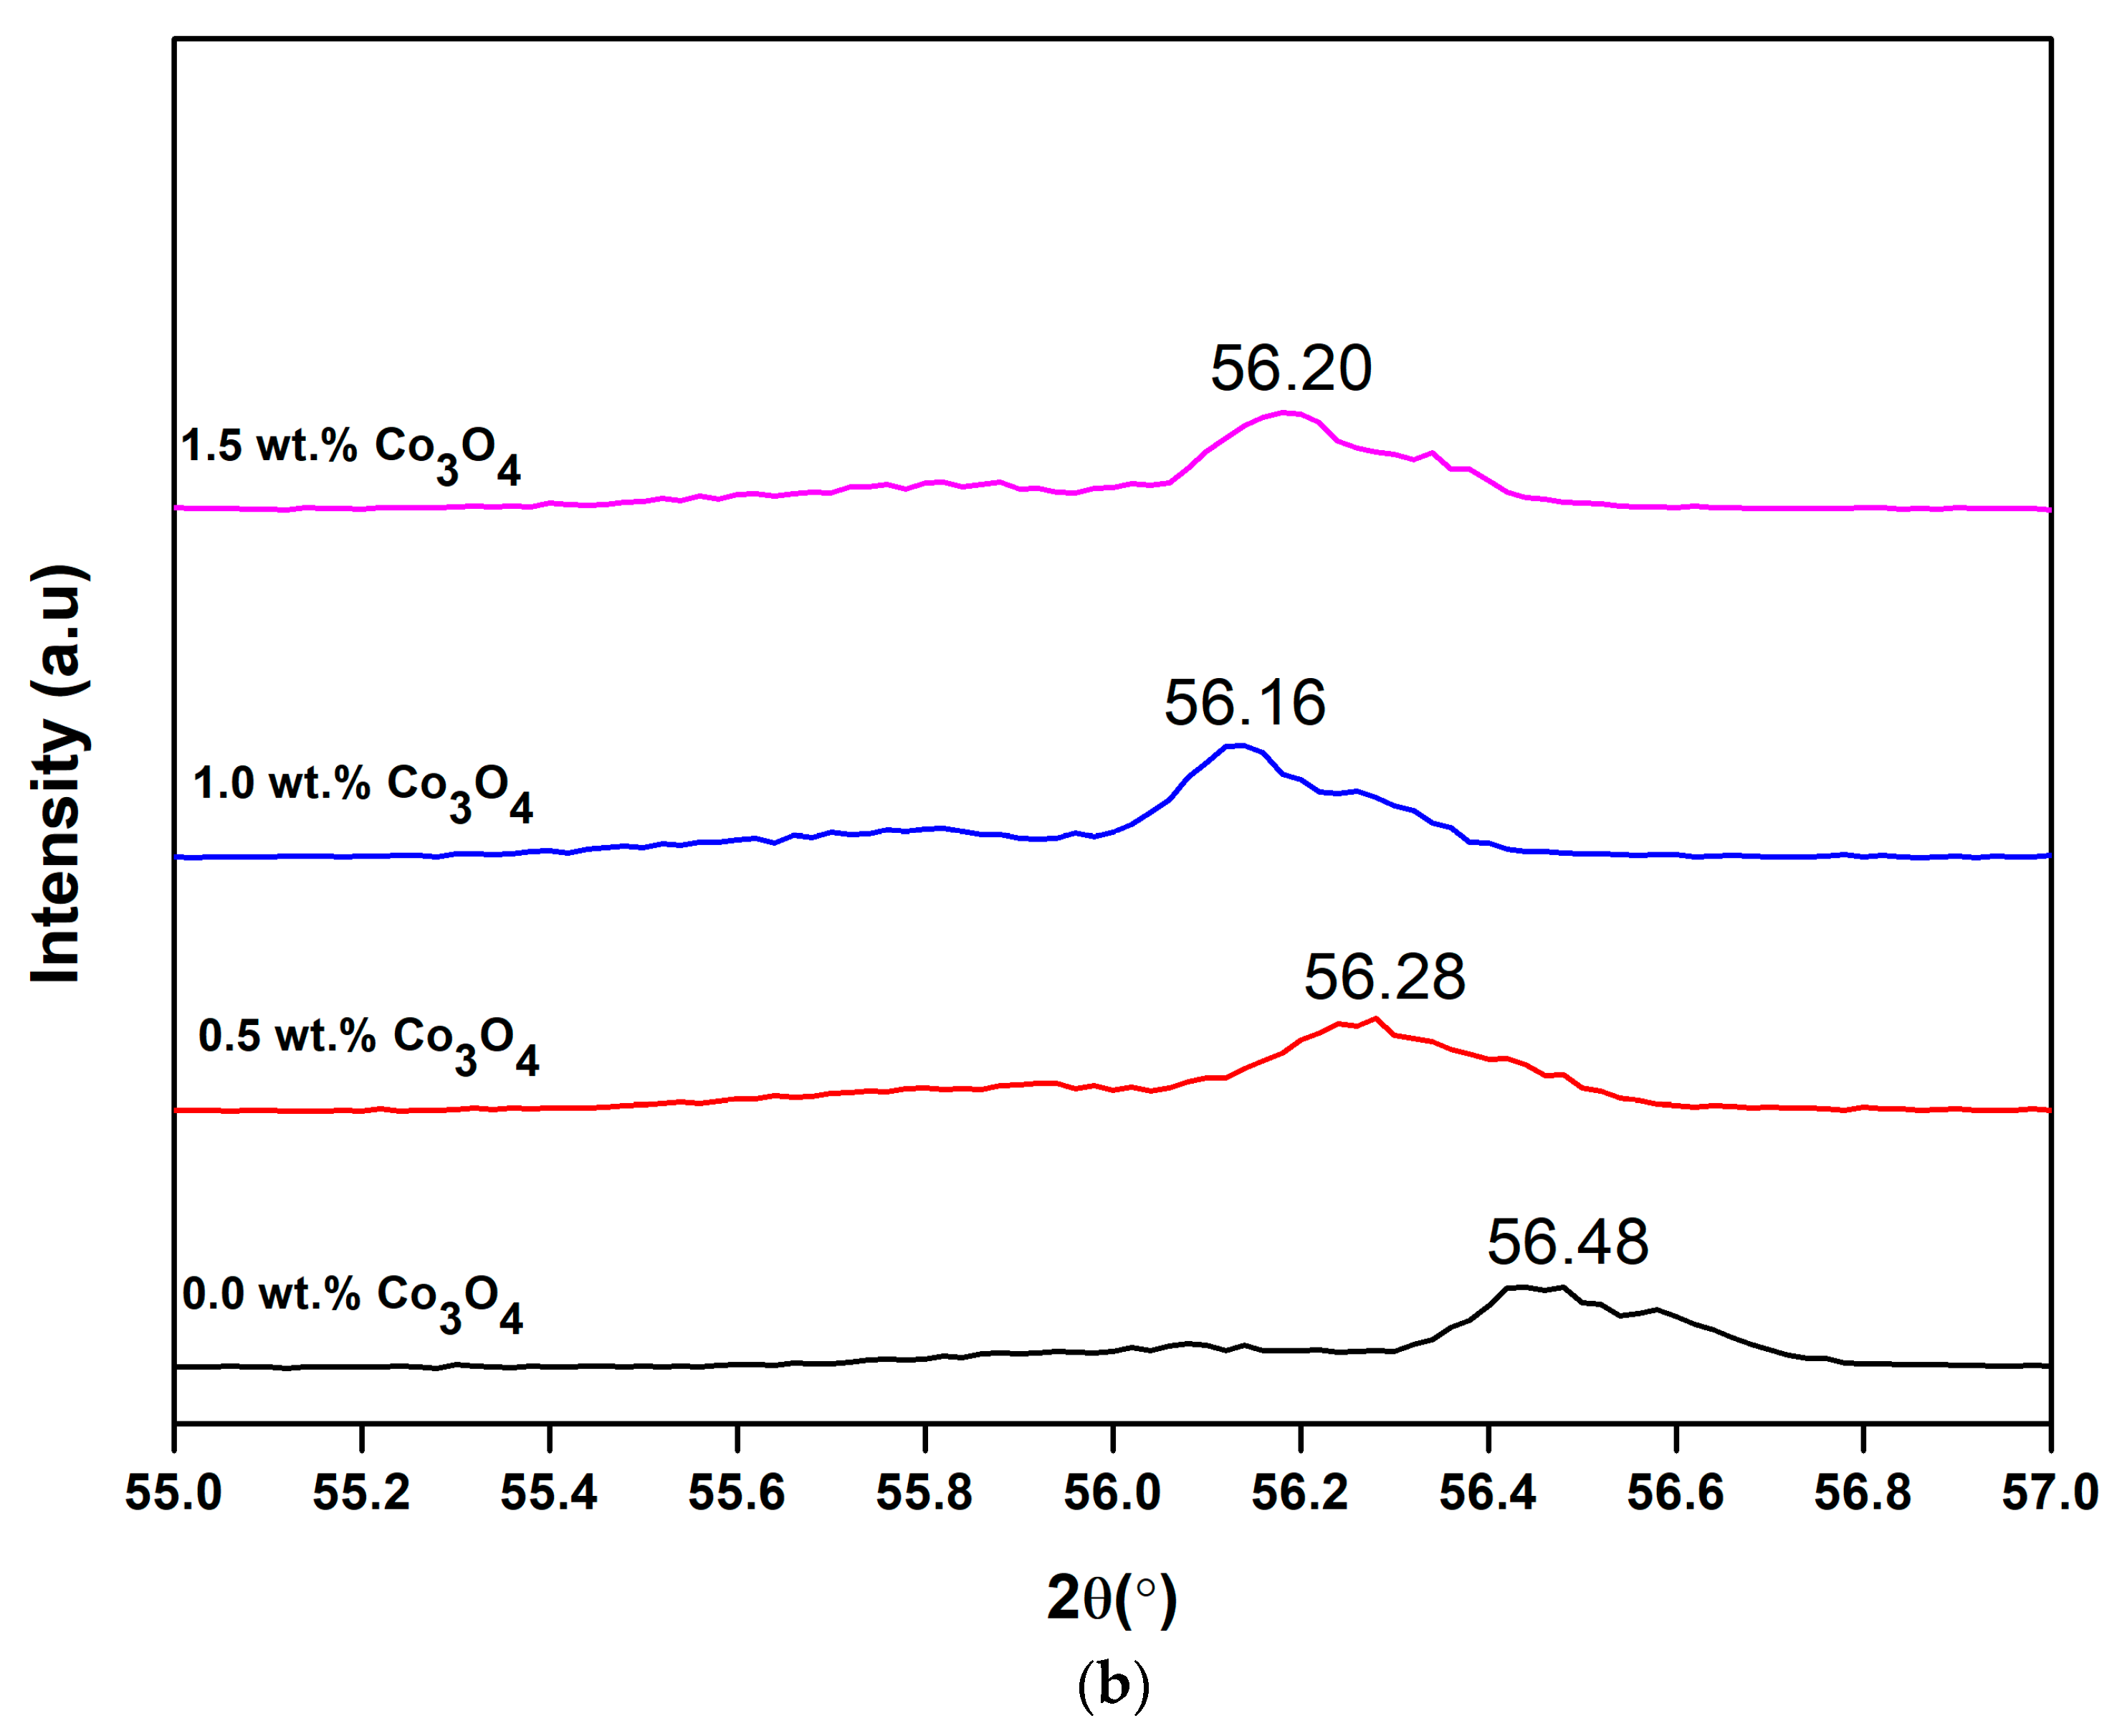
3.3. X-Ray Diffraction (XRD)
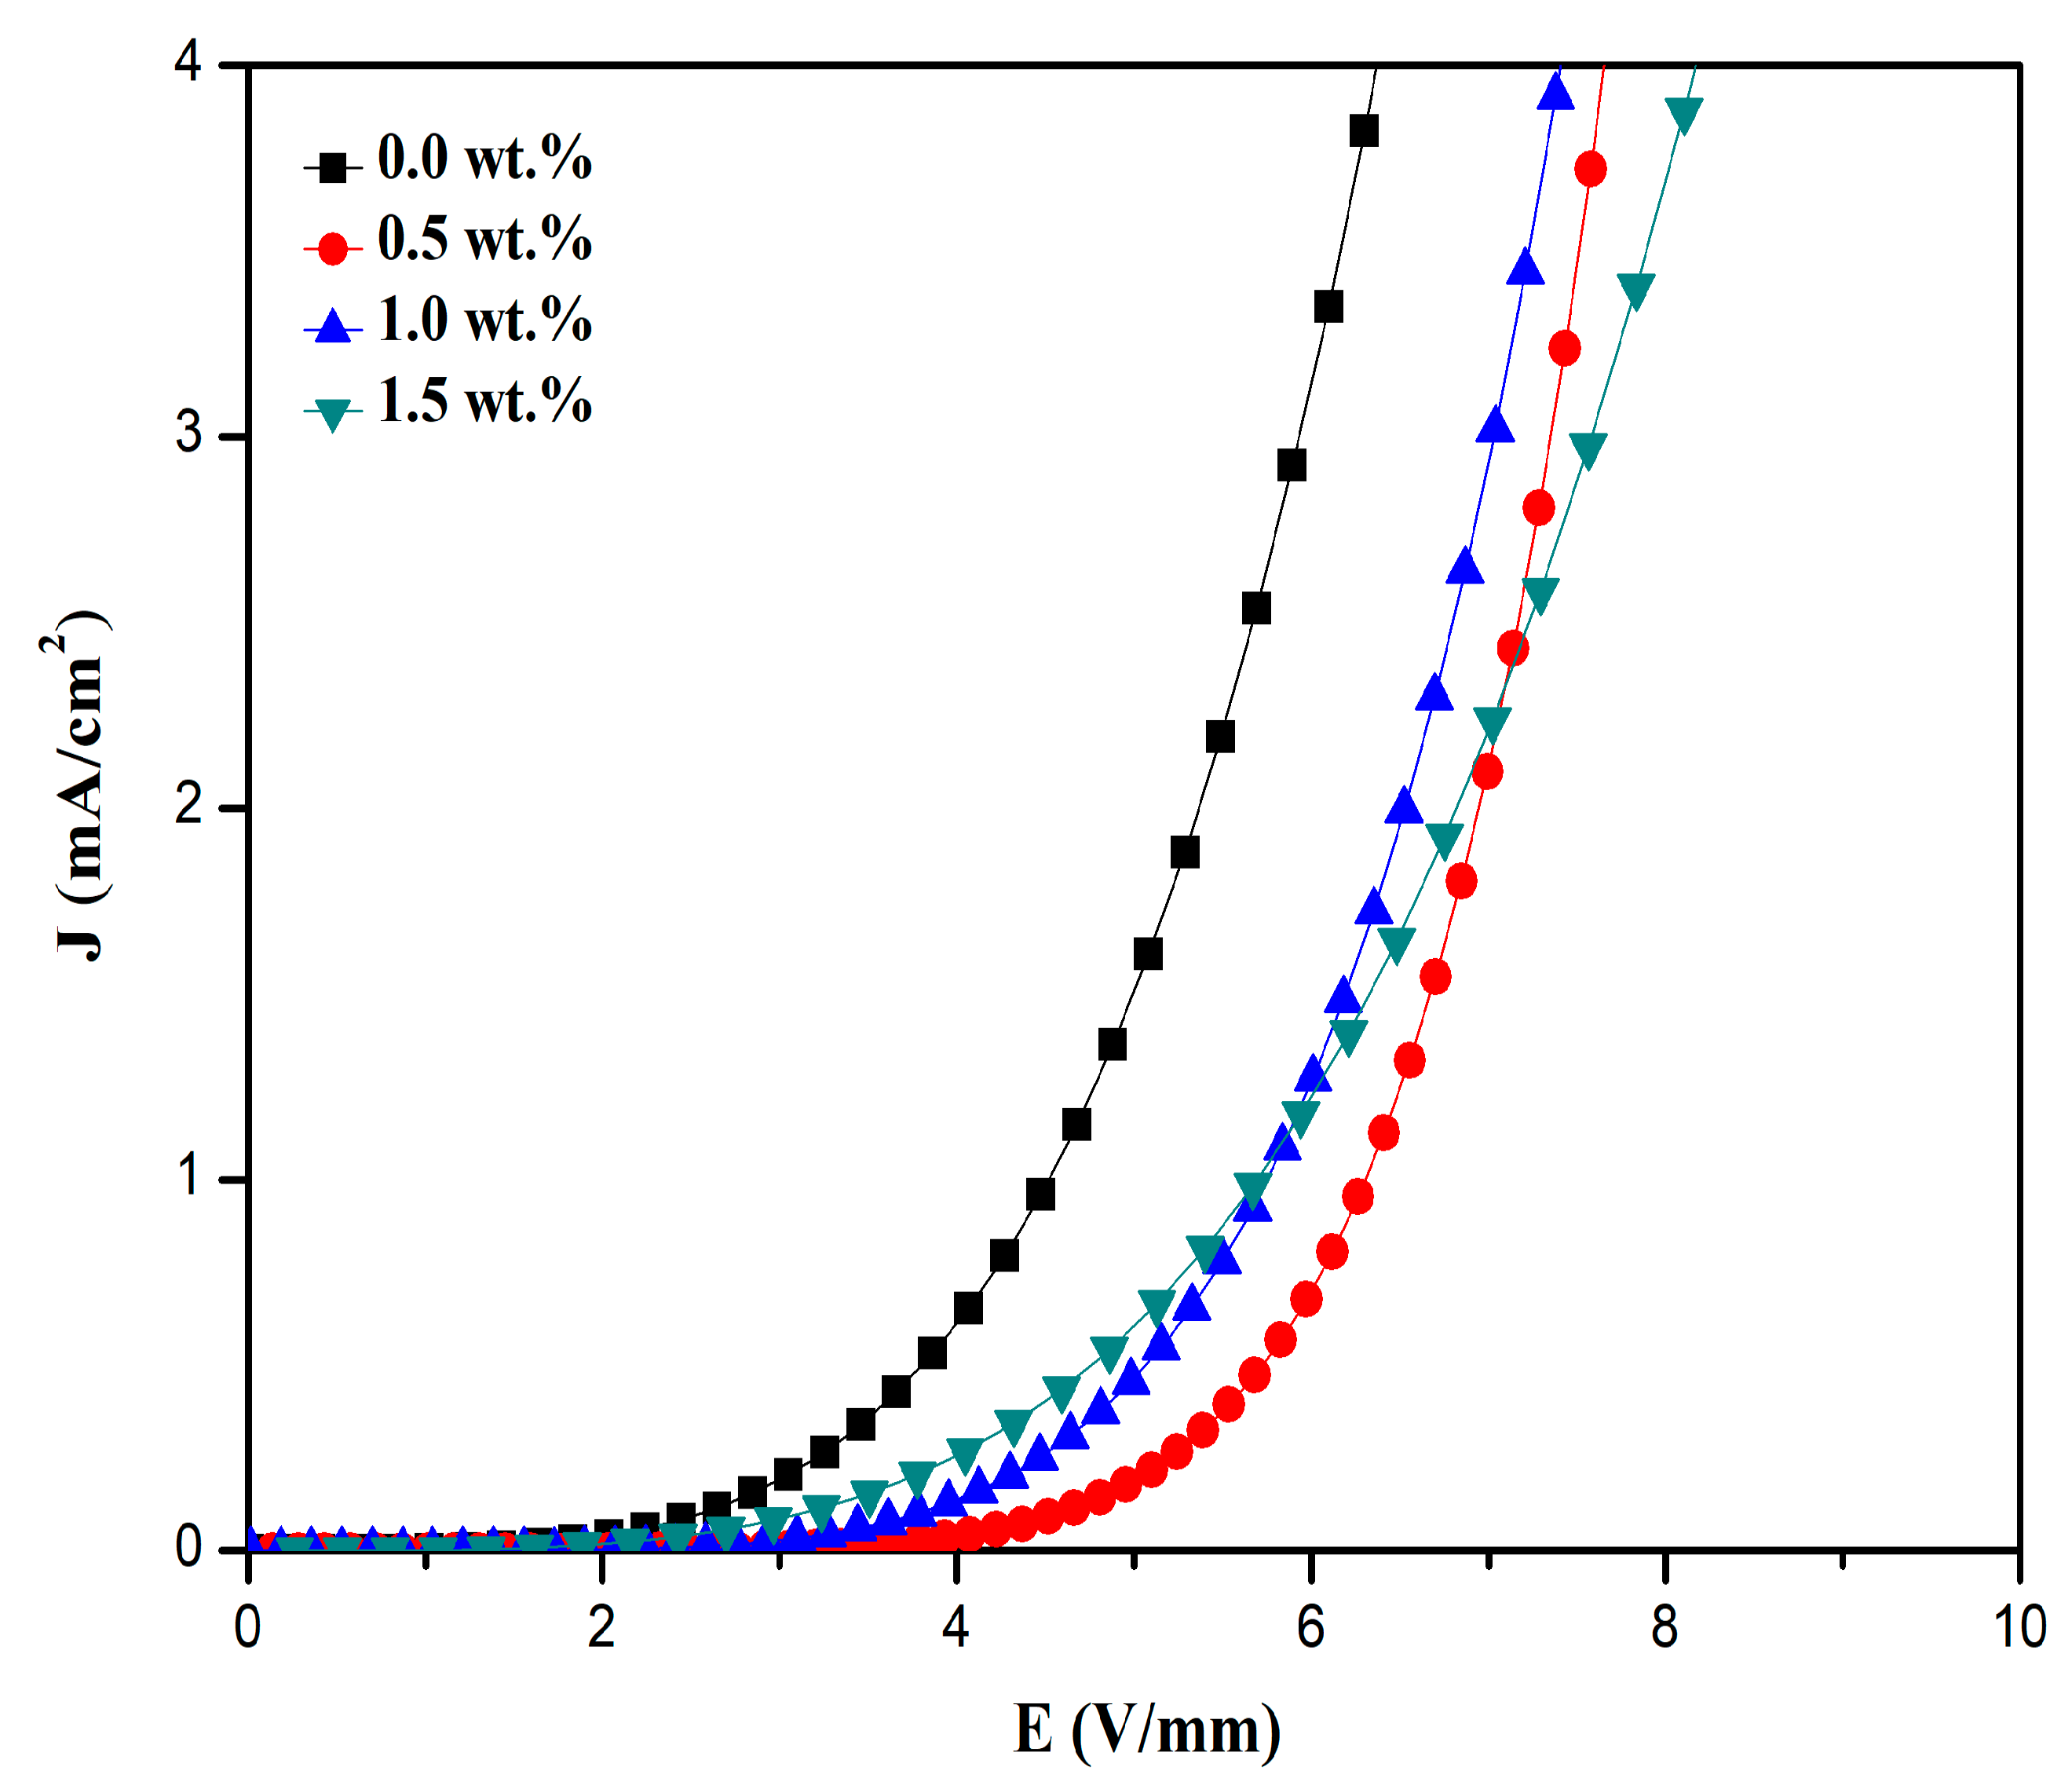
3.4. Current Density-Electric Field (J-E) Characteristics
4. Conclusions
Author Contributions
Funding
Institutional Review Board Statement
Informed Consent Statement
Data Availability Statement
Acknowledgments
Conflicts of Interest
References
- Cao, W.; Xie, X.; Wang, Y.; Chen, M.; Qiao, Y.; Wang, P.; Zhang, Y.; Liu, J. Effect of Pr6O11 doping on the microstructure and electrical properties of ZnO varistors. Ceram. Int. 2019, 45, 24777–24783. [Google Scholar] [CrossRef]
- Shreevats, P.; Devendra, K.; Om, P. Electrical impedance spectroscopy and structural characterization of liquid-phase sintered ZnO–V2O5–Nb2O5 varistor ceramics doped with MnO. Ceram. Int. 2016, 42, 9686–9696. [Google Scholar]
- Zhao, M.; Wang, Y.-H.; Sun, T.-T.; Song, H.-H. Effect of bismuth and vanadium as the varistor forming element in ZnO-based ceramics. J. Mater. Sci. Mater. Electron. 2020, 31, 8206–8211. [Google Scholar] [CrossRef]
- Ortíz-Trejo, F.; Trejo-Valdez, M.; Campos-López, J.P.; Castro-Chacón, J.H.; Torres-Torres, C. Multipath Data Storage by Third-Order Nonlinear Optical Properties in Zinc Oxide Nanostructures. Appl. Sci. 2020, 10, 5688. [Google Scholar] [CrossRef]
- Tonkoshkur, A.S.; Glot, A.B.; Ivanchenko, A.V. Percolation effects in dc degradation of ZnO varistors. J. Adv. Dielectr. 2015, 5, 1–8. [Google Scholar] [CrossRef]
- Fan, J.; Poosimma, P.; Freer, R. Phase development in ZnO varistors. Adv. Appl. Ceram. 2015, 114, 14–17. [Google Scholar] [CrossRef]
- Anas, S.; Mangalaraja, R.; Poothayal, M.; Shukla, S.K.; Ananthakumar, S. Direct synthesis of varistor-grade doped nanocrystalline ZnO and its densification through a step-sintering technique. Acta Mater. 2007, 55, 5792–5801. [Google Scholar] [CrossRef]
- Higashi, Y.; Koga, E. Barrier formation of single junctions with oxidation in SrCoO3-doped ZnO varistors sintered in a reducing atmosphere. J. Ceram. Soc. Jpn. 2019, 127, 912–917. [Google Scholar] [CrossRef]
- Viswanath, N.; Pandey, S.; Kumar, D. Effect of sintering temperature on electrical characteristics of ZnO-0.5 mol% V2O5-2 mol% MnO varistors. Adv. Mater. Sci. Res. 2016, 1, 14–19. [Google Scholar]
- Li, Z.; Yang, Z.; Du, B. Surface Charge Transport Characteristics of ZnO/Silicone Rubber Composites Under Impulse Superimposed on DC Voltage. IEEE Access 2018, 7, 3008–3017. [Google Scholar] [CrossRef]
- Clarke, D.R. Varistor ceramics. J. Am. Ceram. Soc. 1999, 82, 485–502. [Google Scholar] [CrossRef]
- Godavarti, U.; Mote, V.D.; Dasari, M. Role of cobalt doping on the electrical conductivity of ZnO nanoparticles. J. Asian Ceram. Soc. 2017, 5, 391–396. [Google Scholar] [CrossRef]
- Akinnifesi, J.; Akinwunmi, O. Fabrication and Electrical Characterization of Pb2+-Mn2+-Zinc oxide based varistor ceramics. Int. J. Innov. Res. Technol. Sci. 2017, 5, 1–5. [Google Scholar]
- Huang, Y.; Guo, M.; Li, J. Multiscale defect responses in understanding degradation in zinc oxide varistor ceramics. Ceram. Int. 2020, 42, 22134–22139. [Google Scholar] [CrossRef]
- Lao, Y.; Kuo, S.; Tuan, W. Influence of ball milling on the sintering behaviour of ZnO powder. Ceram. Int. 2009, 35, 1317–1320. [Google Scholar] [CrossRef]
- Daneu, N.; Bernik, S.; Rečnik, A. Inversion boundary induced grain growth in ZnO ceramics: From atomic-scale investigations to microstructural engineering. J. Phys. Conf. Ser. 2011, 326, 012003. [Google Scholar] [CrossRef]
- Muhammad, Q.K.; Waqar, M.; Rafiq, M.A.; Rafiq, M.N.; Usman, M.; Anwar, M.S. Structural, dielectric, and impedance study of ZnO-doped barium zirconium titanate (BZT) ceramics. J. Mater. Sci. 2016, 51, 10048–10058. [Google Scholar] [CrossRef]
- Kharchouche, F.; Belkhiat, S.; Belkhiat, D.E.C. Non-linear coefficient of BaTiO3-doped ZnO varistor. IET Sci. Meas. Technol. 2013, 7, 326–333. [Google Scholar] [CrossRef]
- Wang, M.-h.; Yao, C.; Zhang, N.-F. Degradation characteristics of low-voltage ZnO varistor manufactured by chemical coprecipitation processing. J. Mater. Process. 2008, 202, 406–411. [Google Scholar] [CrossRef]
- Shaifudin, M.S.; Ghazali, M.S.M.; Abdullah, W.R.W.; Kassim, S.; Kamaruzzaman, W.M.I.W.M. Microstructure and Electrical Properties of Low-Voltage Barium Titanate Doped Zinc Oxide Varistor Ceramics. J. Recent Technol. 2019, 8, 2713–2718. [Google Scholar]
- Pillai, S.C.; Kelly, J.M.; Ramesh, R.; McCormack, D.E. Advances in the synthesis of ZnO nanomaterials for varistor devices. J. Mater. Chem. 2013, 1, 3268–3281. [Google Scholar] [CrossRef]
- Hembram, K.; Rao, T.; Ramakrishna, M.; Srinivasa, R.; Kulkarni, A. A novel economical grain boundary engineered ultra-high performance ZnO varistor with lesser dopants. J. Eur. Ceram. Soc. 2018, 38, 5021–5029. [Google Scholar] [CrossRef]
- Hembram, K.; Sivaprahasam, D.; Rao, T. Combustion synthesis of doped nanocrystalline ZnO powders for varistors applications. J. Eur. Ceram. 2011, 31, 1905–1913. [Google Scholar] [CrossRef]
- Zhu, J.F.; Gao, J.Q.; Wang, F.; Chen, P. Influence of Pr6O11 on the characteristics and microstructure of zinc varistors. Key Eng. Mater. 2008, 368–372, 500–502. [Google Scholar] [CrossRef]
- Lakin, I.; Zakaria, A.; Abdollah, Y.; Umaru, D. Effect of sintering temperature on microstructure and electrical properties of ZnO+ CaMnO3 ceramics used in low voltage varistors. Dig. J. Nanomater. Bios. 2015, 10, 189–197. [Google Scholar]
- Rečnik, A.; Bernik, S.; Daneu, N. Microstructural engineering of ZnO-based varistor ceramics. J. Mater. Sci. 2012, 47, 1655–1668. [Google Scholar] [CrossRef]
- Wurst, J.; Nelson, J. Lineal intercept technique for measuring grain size in two-phase polycrystalline ceramics. J. Am. Ceram. Soc. 1972, 55, 109. [Google Scholar] [CrossRef]
- Xu, D.; Shi, L.; Wu, Z.; Zhong, Q.; Wu, X. Microstructure and electrical properties of ZnO-Bi2O3-based varistor ceramics by different sintering processes. J. Eur. Ceram. 2009, 29, 1789–1794. [Google Scholar] [CrossRef]
- Abdullah, W.; Rafizah, W.; Zakaria, A.; Ghazali, M.S.M. Synthesis Mechanism of Low-Voltage Praseodymium Oxide doped Zinc Oxide Varistor Ceramics Prepared Through Modified Citrate Gel Coating. Int. J. Mol. Sci. 2012, 13, 5278–5289. [Google Scholar] [CrossRef]
- Ma, S.; Xu, Z.; Chu, R.; Hao, J.; Cheng, L.; Li, G. Low-temperature sintering and electrical properties of Co-doped ZnO varistors. J. Mater. Sci. Mater. Electron. 2014, 25, 3878–3884. [Google Scholar] [CrossRef]
- Wang, M.-H.; Zhao, Z.-Y.; Liu, T.-T. Synthesis of Pr-doped ZnO nanoparticles by sol–gel method and varistor properties study. J. Alloys Compd. 2015, 621, 220–224. [Google Scholar] [CrossRef]
- Liu, L.; Ge, M.; Liu, H.; Guo, C.; Wang, Y.; Zhou, Z. Controlled synthesis of ZnO with adjustable morphologies from nanosheets to microspheres. Colloid Surf. A 2009, 348, 124–129. [Google Scholar] [CrossRef]
- Selim, F.; Gupta, T.; Hower, P.; Carlson, W.G. Low voltage ZnO varistor: Device process and defect model. J. Appl. Phys. 1980, 51, 765–768. [Google Scholar] [CrossRef]
- Alim, M.A.; Li, S.; Liu, F.; Cheng, P. Electrical barriers in the ZnO varistor grain boundaries. Phys. Status Solidi A 2006, 203, 410–427. [Google Scholar] [CrossRef]
- Nahm, C.-W. Al doping effect on electrical and dielectric aging behavior against impulse surge in ZPCCYA-based varistors. Mater. Sci. Eng. B 2010, 170, 123–128. [Google Scholar] [CrossRef]
- Nahm, C.-W. Electrical behavior against current impulse in ZnO–Pr6O11-based varistor ceramics with terbium addition. Ceram. Int. 2010, 36, 1495–1501. [Google Scholar] [CrossRef]
- Sendi, R.K. Effects of Different Compositions from Magnetic and Nonmagnetic Dopants on Structural and Electrical Properties of ZnO Nanoparticles-based Varistor Ceramics. Solid State Sci. 2018, 77, 54–61. [Google Scholar] [CrossRef]
- Furtado, J.G.D.M.; Saléh, L.A.; Serra, E.T.; Oliveira, G.S.G.D.; Nóbrega, M.C.D.S. Microstructural evaluation of rare-earth-zinc oxide-based varistor ceramics. Mater. Res. 2005, 8, 425–429. [Google Scholar] [CrossRef]
- Leite, E.; Varela, J.A.; Longo, E. A new interpretation for the degradation phenomenon of ZnO varistors. J. Mater. Sci. 1992, 27, 5325–5329. [Google Scholar] [CrossRef]
- Lei, M.; Li, S.; Jiao, X.; Li, J.; Alim, M.A. The influence of CeO2 on the microstructure and electrical behaviour of ZnO–Bi2O3 based varistors. J. Phys. D Appl. Phys. 2004, 37, 804. [Google Scholar] [CrossRef]
- Kutty, T.; Philip, S. Low voltage varistors based on SrTiO3 ceramics. Mat. Sci. Eng. B 1995, 33, 58–66. [Google Scholar] [CrossRef]
- Ke, L.; Hu, M.; Ma, X. Preparation of Ultrahigh Potential Gradient of ZnO Varistors by Rare-Earth Doping and Low-Temperature Sintering. J. Mater. 2013, 2013, 726314. [Google Scholar] [CrossRef]
- Dong, X.; Cheng, X.-N.; Yan, X.-H.; Xu, H.-X.; Shi, L.-Y. Sintering process as relevant parameter for Bi2O3 vaporization from ZnO-Bi2O3-based varistor ceramics. Trans. Nonferr. Met. Soc. 2009, 19, 1526–1532. [Google Scholar]
- Norailiana, A.; Azmi, B.; Ismayadi, I.; Hashim, M.; Ibrahim, I.; Nazlan, R.; Mohd Idris, F. Parallel development of microstructure and electrical properties in doped-zinc oxide. J. Mater. Sci. Surf. Eng. 2017, 5, 528–532. [Google Scholar]
- Hamdelou, S.; Guergouri, K.; Arab, L. The effect of the starting powders particle size on the electrical properties of sintered Co doped ZnO varistors. Appl. Nanosci. 2015, 5, 817–825. [Google Scholar] [CrossRef]
- Onreabroy, W.; Sirikulrat, N. Effects of cobalt doping on nonlinearity of zinc oxide. Mat. Sci. Eng. B 2006, 130, 108–113. [Google Scholar] [CrossRef]
- Wong, J. Microstructure and phase transformation in a highly non−ohmic metal oxide varistor ceramic. J. Appl. Phys. 1975, 46, 1653–1659. [Google Scholar] [CrossRef]


| Pr6O11 Content (wt.%) | Element | Mass (%) |
|---|---|---|
| 0.5 | O K | 19.82 |
| Ti K | 6.49 | |
| Zn K | 54.65 | |
| Ba L | 17.90 | |
| Pr L | 1.13 | |
| Total | 100.00 | |
| 1.0 | O K | 19.82 |
| Ti K | 4.85 | |
| Zn K | 61.84 | |
| Ba L | 12.20 | |
| Pr L | 1.30 | |
| Total | 100.00 | |
| 1.5 | O K | 19.66 |
| Ti K | 4.28 | |
| Zn K | 63.12 | |
| Ba L | 11.33 | |
| Pr L | 1.62 | |
| Total | 100.00 |
| Co3O4 Content (wt.%) | Element | Mass (%) |
|---|---|---|
| 0.5 | O K | 20.23 |
| Ti K | 7.52 | |
| Co K | 0.37 | |
| Zn K | 52.48 | |
| Ba L | 19.40 | |
| Total | 100.00 | |
| 1.0 | O K | 20.42 |
| Ti K | 10.47 | |
| Co K | 0.87 | |
| Zn K | 40.84 | |
| Ba L | 27.41 | |
| Total | 100.00 | |
| 1.5 | O K | 20.24 |
| Ti K | 8.09 | |
| Co K | 0.91 | |
| Zn K | 49.51 | |
| Ba L | 21.25 | |
| Total | 100.00 |
| Pr6O11 Content (wt.%) | FWHM, β (Degree) | 2θ (Degree) | Crystallite Size (nm) | Micro-Strain, ε (10−4) |
|---|---|---|---|---|
| 0.0 | 0.154 | 47.43 | 56.28 | 21.90 |
| 0.5 | 0.149 | 47.10 | 57.95 | 20.90 |
| 1.0 | 0.168 | 47.12 | 51.57 | 21.20 |
| 1.5 | 0.234 | 47.18 | 36.94 | 9.15 |
| Co3O4 Content (wt.%) | FWHM, β (Degree) | 2θ (Degree) | Crystallite Size (nm) | Micro-Strain, ε (10−4) |
|---|---|---|---|---|
| 0.0 | 0.264 | 56.48 | 34.17 | 21.90 |
| 0.5 | 0.244 | 56.28 | 36.89 | 15.90 |
| 1.0 | 0.245 | 56.16 | 36.67 | 24.10 |
| 1.5 | 0.256 | 56.20 | 35.11 | 20.10 |
| Pr6O11 Content (wt.%) | d (µm) | Relative Density (%) | α ± SE | Eb (V/mm) | JL (µA/cm2) | ΦB (eV) |
|---|---|---|---|---|---|---|
| 0.0 | 1.5 | 89.3 | 4.83 ± 0.16 | 6.09 | 348.00 | 0.88 |
| 0.5 | 2.0 | 96.8 | 2.29 ± 0.01 | 12.36 | 599.33 | 0.81 |
| 1.0 | 1.8 | 97.5 | 2.66 ± 0.01 | 33.67 | 553.33 | 0.84 |
| 1.5 | 1.6 | 97.8 | 2.69 ± 0.02 | 68.36 | 548.16 | 0.86 |
| Co3O4 Content (wt.%) | d (µm) | Relative Density (%) | α ± SE | Eb (V/mm) | JL (µA/cm2) | ΦB (eV) |
|---|---|---|---|---|---|---|
| 0.0 | 1.5 | 89.3 | 4.83 ± 0.16 | 6.09 | 348.00 | 0.88 |
| 0.5 | 1.7 | 99.2 | 7.15 ± 0.42 | 7.58 | 202.41 | 0.94 |
| 1.0 | 2.2 | 99.1 | 5.62 ± 0.18 | 7.38 | 294.76 | 0.92 |
| 1.5 | 2.5 | 97.9 | 5.50 ± 0.33 | 8.10 | 302.71 | 0.91 |
Publisher’s Note: MDPI stays neutral with regard to jurisdictional claims in published maps and institutional affiliations. |
© 2021 by the authors. Licensee MDPI, Basel, Switzerland. This article is an open access article distributed under the terms and conditions of the Creative Commons Attribution (CC BY) license (http://creativecommons.org/licenses/by/4.0/).
Share and Cite
Shaifudin, M.S.; Ghazali, M.S.M.; Kamaruzzaman, W.M.I.W.M.; Wan Abdullah, W.R.; Kassim, S.; Ismail, N.Q.A.; Sa’at, N.K.; Mohd Zaid, M.H.; Mohd Fekeri, M.F.; Matori, K.A. Synergistic Effects of Pr6O11 and Co3O4 on Electrical and Microstructure Features of ZnO-BaTiO3 Varistor Ceramics. Materials 2021, 14, 702. https://doi.org/10.3390/ma14040702
Shaifudin MS, Ghazali MSM, Kamaruzzaman WMIWM, Wan Abdullah WR, Kassim S, Ismail NQA, Sa’at NK, Mohd Zaid MH, Mohd Fekeri MF, Matori KA. Synergistic Effects of Pr6O11 and Co3O4 on Electrical and Microstructure Features of ZnO-BaTiO3 Varistor Ceramics. Materials. 2021; 14(4):702. https://doi.org/10.3390/ma14040702
Chicago/Turabian StyleShaifudin, Muhamad Syaizwadi, Mohd Sabri Mohd Ghazali, Wan Mohamad Ikhmal Wan Mohamad Kamaruzzaman, Wan Rafizah Wan Abdullah, Syara Kassim, Nur Quratul Aini Ismail, Nor Kamilah Sa’at, Mohd Hafiz Mohd Zaid, Maria Fazira Mohd Fekeri, and Khamirul Amin Matori. 2021. "Synergistic Effects of Pr6O11 and Co3O4 on Electrical and Microstructure Features of ZnO-BaTiO3 Varistor Ceramics" Materials 14, no. 4: 702. https://doi.org/10.3390/ma14040702
APA StyleShaifudin, M. S., Ghazali, M. S. M., Kamaruzzaman, W. M. I. W. M., Wan Abdullah, W. R., Kassim, S., Ismail, N. Q. A., Sa’at, N. K., Mohd Zaid, M. H., Mohd Fekeri, M. F., & Matori, K. A. (2021). Synergistic Effects of Pr6O11 and Co3O4 on Electrical and Microstructure Features of ZnO-BaTiO3 Varistor Ceramics. Materials, 14(4), 702. https://doi.org/10.3390/ma14040702