
Hyperelastic Material Parameter Determination and Numerical Study of TPU and PDMS Dampers


Abstract
:1. Introduction
2. Materials and Methods
2.1. Materials
2.2. Methods
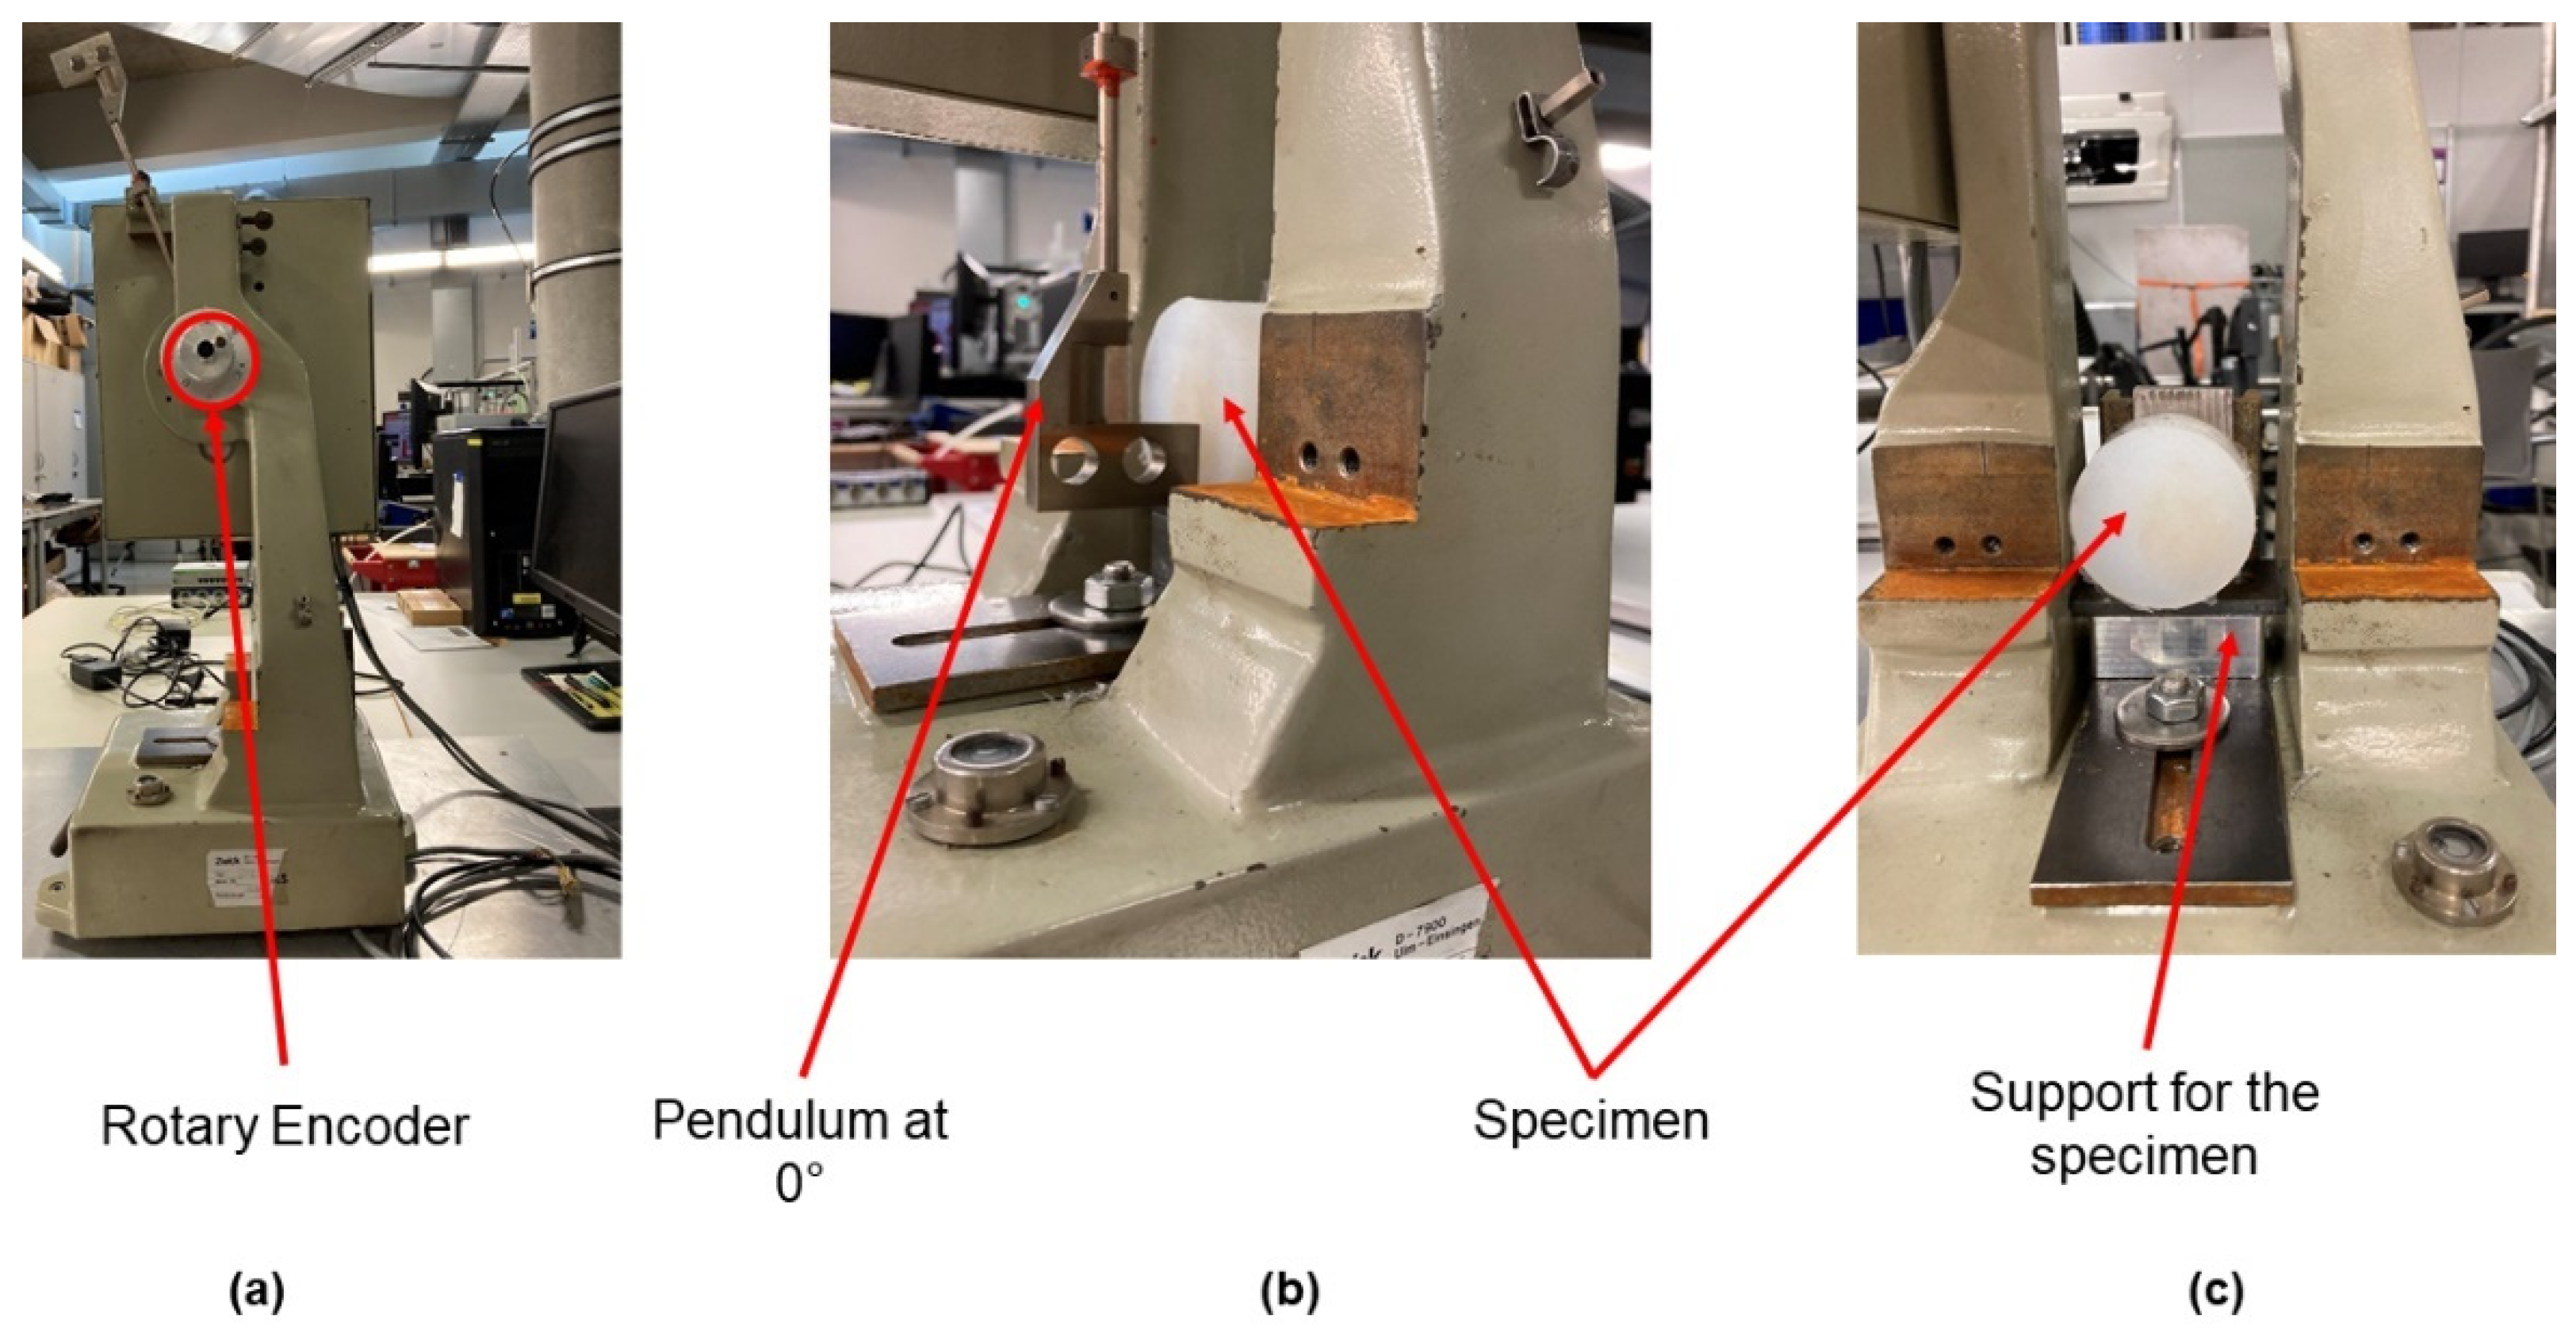
- h—actual height (m).
- h0—height of the start position (m).
- L—length of the pendulum (m).
- B—measured angular data (rad).
2.3. FE-Calculations
3. Results
4. Discussion
5. Conclusions
Author Contributions
Funding
Institutional Review Board Statement
Informed Consent Statement
Data Availability Statement
Acknowledgments
Conflicts of Interest
References
- Dong, G.; Tessier, D.; Zhao, Y.F. Design of shoe soles using lattice structures fabricated by additive manufacturing. In Proceedings of the Design Society: International Conference on Engineering Design; Cambridge University Press: Cambridge, UK, 2019; Volume 1, pp. 719–728. [Google Scholar]
- Cakmak, U.D.; Hiptmaier, F.; Major, Z. Applicability of elastomer time-dependent behavior. In Mech Time-Dependent Mater; Springer Science+Business Media: Dordrecht, The Netherlands, 2013. [Google Scholar]
- Sciulli, D. Dynamics and Control for Vibration Isolation Design. Ph.D. Thesis, Virginia Polytechnic Institute and State University, Blacksburg, VA, USA, 1997. [Google Scholar]
- Lamborghini, Lamborghini Palm Beach, Lamborghini. 6 November 2018. Available online: https://www.lamborghinipalmbeach.com/blog/what-is-a-lamborghini-active-suspension/ (accessed on 20 August 2021).
- Lokander, M.; Stenberg, B. Performance of isotropic magnetorheological rubber materials. Polym. Test. 2003, 22, 245–251. [Google Scholar] [CrossRef] [Green Version]
- Hiptmair, F.J.; Major, Z.; Barroso, V.C.; Hild, S. Experimental charcterization of magnetoelastomers and determination of material model parameters for simulations. In Proceedings of the 10th Youth Symposium on Experimental Solid Mechanics (YSESM2011), Chemnitz, Germany, 25–28 May 2011. [Google Scholar]
- Cakmak, U.D.; Major, Z. Experimental thermomechanical analysis of elastomers under uni-and biaxial tensile stress state. Exp. Mech. 2014, 54, 653–663. [Google Scholar] [CrossRef]
- Bassi, A.C. Dynamic modulus of rubber by impact and rebound measurements. Polym. Eng. Sci. 1978, 18, 750–754. [Google Scholar] [CrossRef]
- Niu, C.; Dong, X.; Qi, M. Damping mechanism and theoretical model of electrorheological elastomers. Soft Matter 2017, 13, 5409–5420. [Google Scholar] [CrossRef] [PubMed]
- Auad, M.L.; Mosiewicki, M.A.; Uzunpinar, C.; Wiliams, R.J. Single-wall carbon nanotubes/epoxy elastomers exhibiting high damping capacity in an extended temperature range. Compos. Sci. Technol. 2009, 69, 1088–1092. [Google Scholar] [CrossRef]
- Yang, J.; Gong, X.; Deng, H.; Qin, L.; Xuan, S. Investigation on the mechanism of damping behavior of magnetorhelogical elastomers. Smart Mater. Struct. 2012, 21, 125015. [Google Scholar] [CrossRef]
- Zehetbauer, T.; Plöckinger, A.; Emminger, C.; Cakmak, U.D. Mechanical design and performance analyses of a rubber-based peristaltic micro-dosing pump. Actuators 2021, 10, 198. [Google Scholar] [CrossRef]
- Cakmak, U.D.; Kallai, I.; Major, Z. Temperature dependent bulge test for elastomers. Mech. Res. Commun. 2014, 60, 27–32. [Google Scholar] [CrossRef]
- Zhou, R.; Gao, W.; Xia, L.; Wu, H.; Guo, S. The study of damping property and mechanism of thermoplastic polyurethane/phenolic resin through a combined experiment and molecular dynamics simulation. J. Mater. Sci. 2018, 53, 9350–9362. [Google Scholar] [CrossRef]
- Ilg, J.; Rupitsch, S.J.; Sutor, A.; Lerch, R. Determination of Dynamic Material Properties of Silicone Rubber Using One-Point Measurements and Finite Element Simulations. IEEE Trans. Instrum. Meas. 2012, 61, 3031–3038. [Google Scholar] [CrossRef]
- Zhao, J.; Jiang, N.; Zhang, D.; He, B.; Chen, X. Study on Optimization of Damping Performance and Damping Temperature Range of Silicone Rubber by Polyborosiloxane Ge. Polymers 2020, 12, 1196. [Google Scholar] [CrossRef] [PubMed]
- Schneider, F.; Fellner, T.; Wilde, J.; Wallrabe, U. Mechanical proberties of silicones for MEMS. J. Micromech. Microeng. 2008, 18, 065008. [Google Scholar] [CrossRef]
- Moser, R.; Kettlgruber, G.; Siket, C.M.; Drack, M.; Graz, I.; Cakmak, U.D.; Major, Z.; Kaltenbrunner, M.; Bauer, S. From Playroom to Lab: Tough Stretchable Electronics Analyzed with a Tabletop Tensile Tester Made from Toy-Bricks. January 2016. Available online: https://onlinelibrary.wiley.com/doi/full/10.1002/advs.201500396 (accessed on 22 August 2021).
- Tschoegl, N.W.; Knauss, W.G.; Emri, I. The effect of temperature and pressure on the mechanical properties of thermo-and/or piezorheologically simple polymeric materials in thermodynamic equilibrium-A critical review. Mech. Time-Depend. Mater. 2002, 6, 53–99. [Google Scholar] [CrossRef]
- Liu, M.; Gorman, D.G. Formulation of Rayleigh damping and its extensions. Comput. Struct. 1995, 57, 277–285. [Google Scholar] [CrossRef]


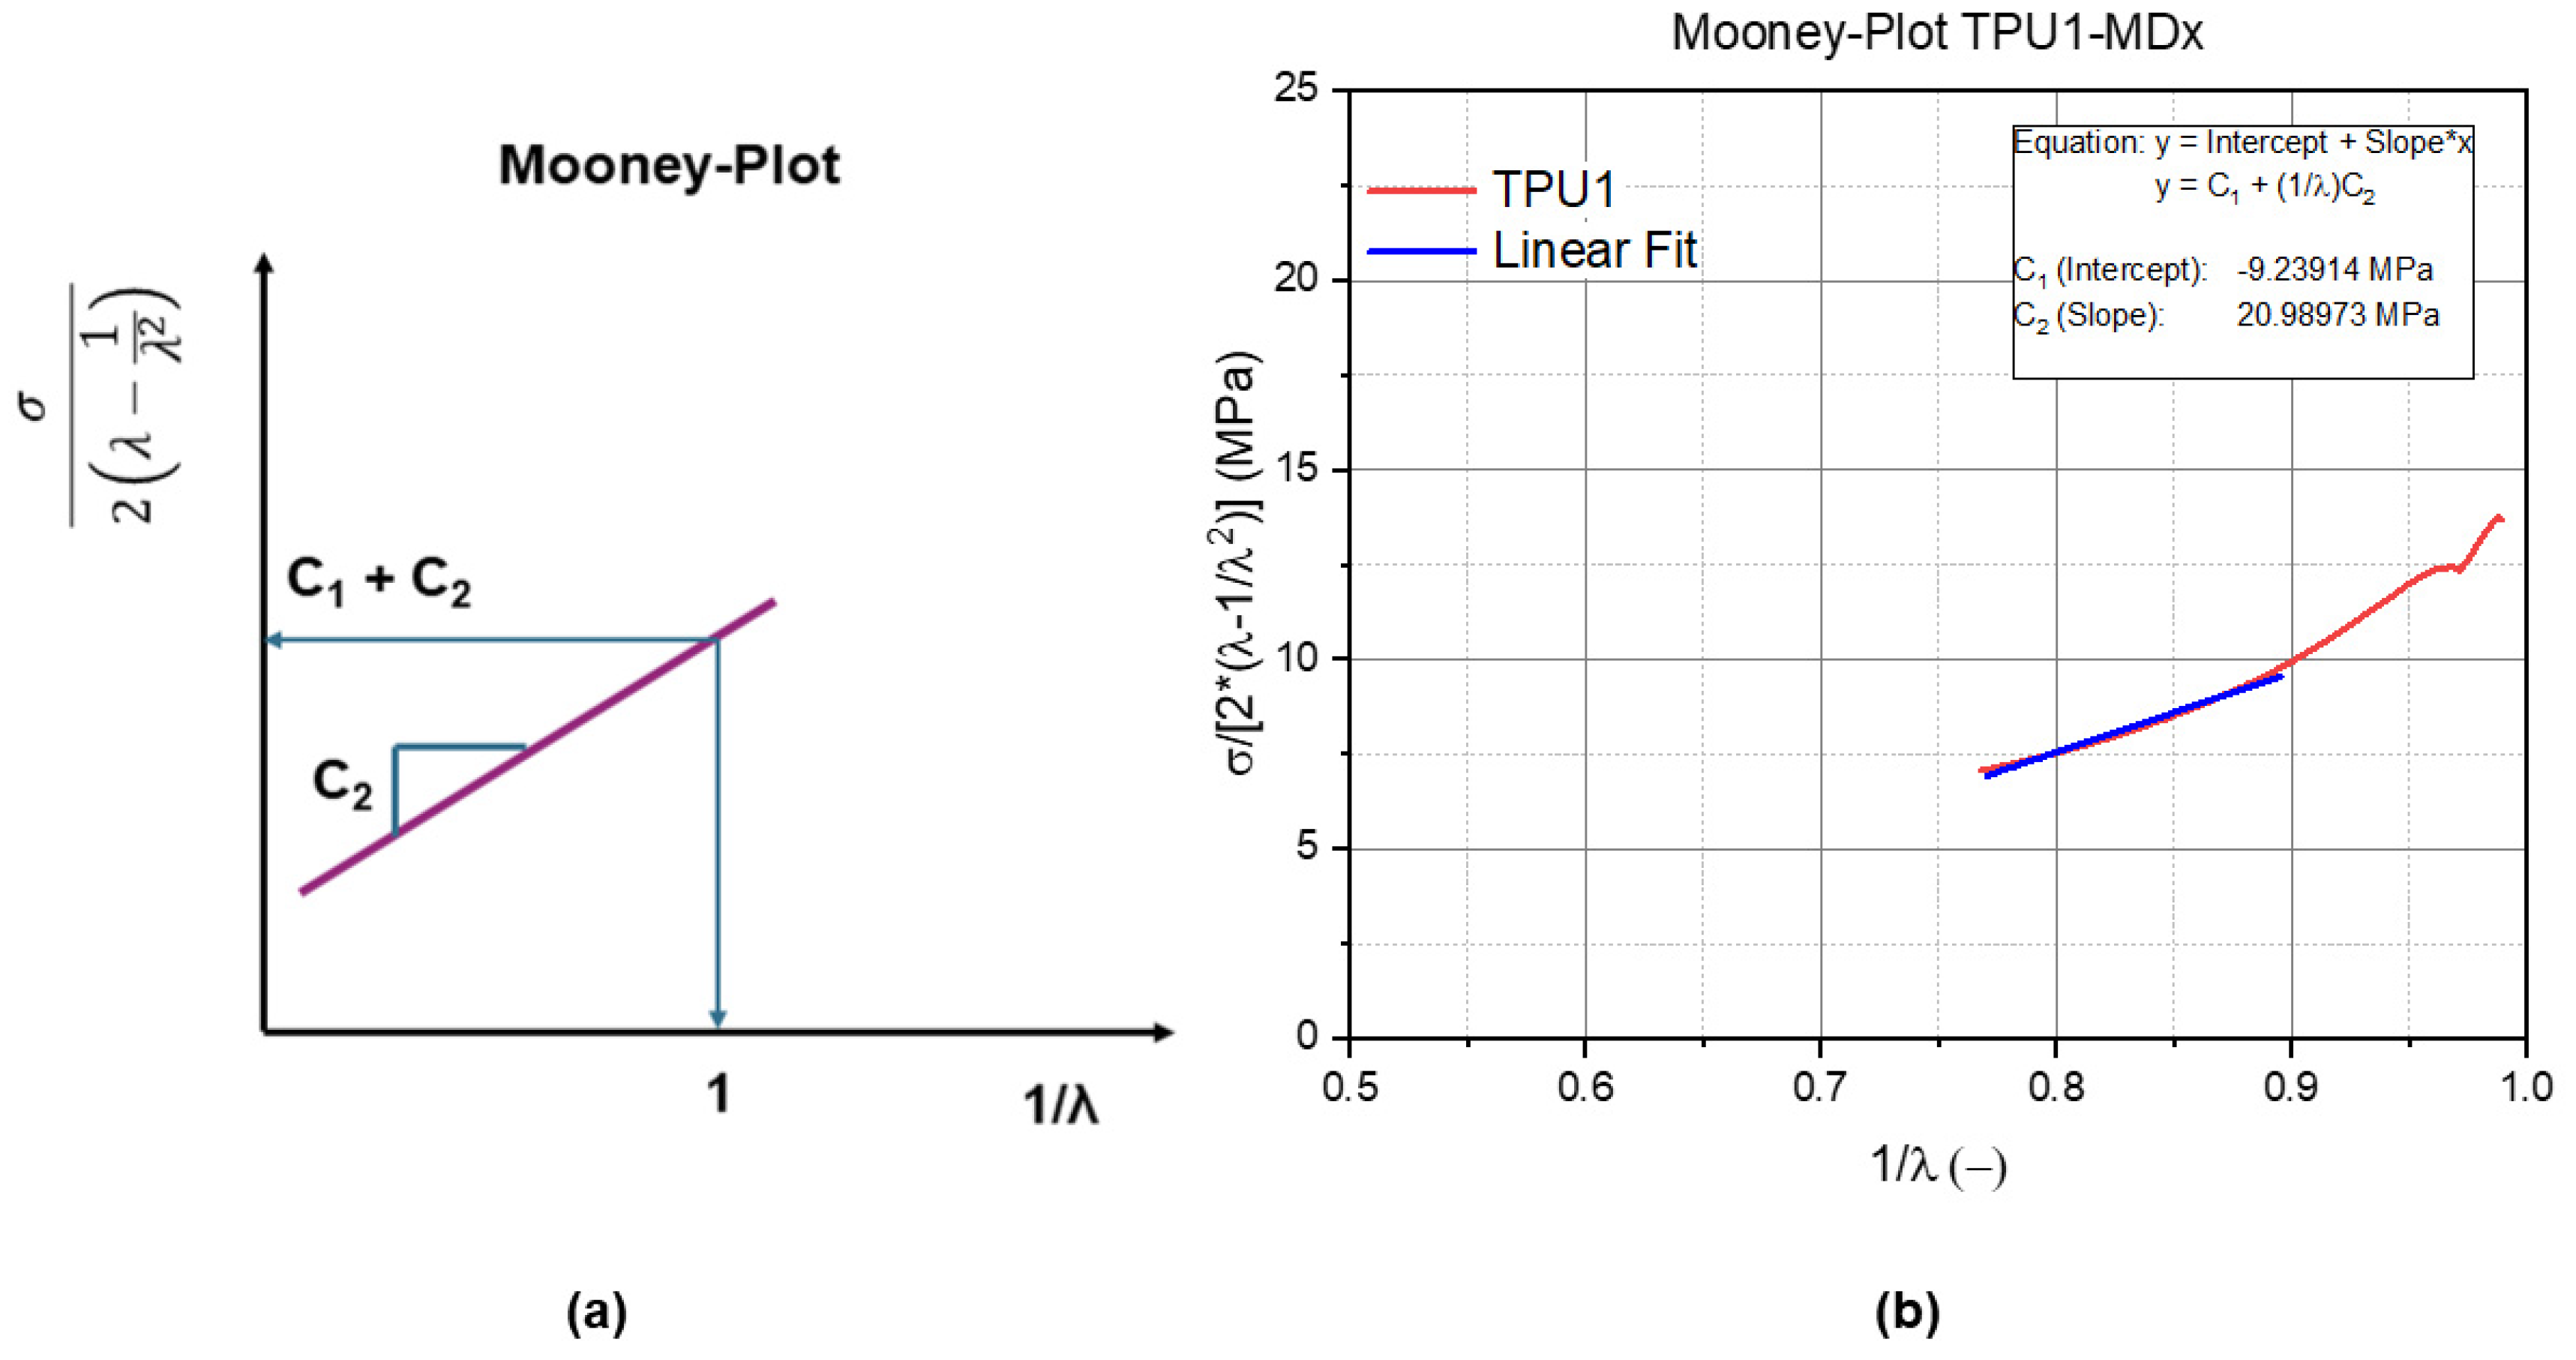
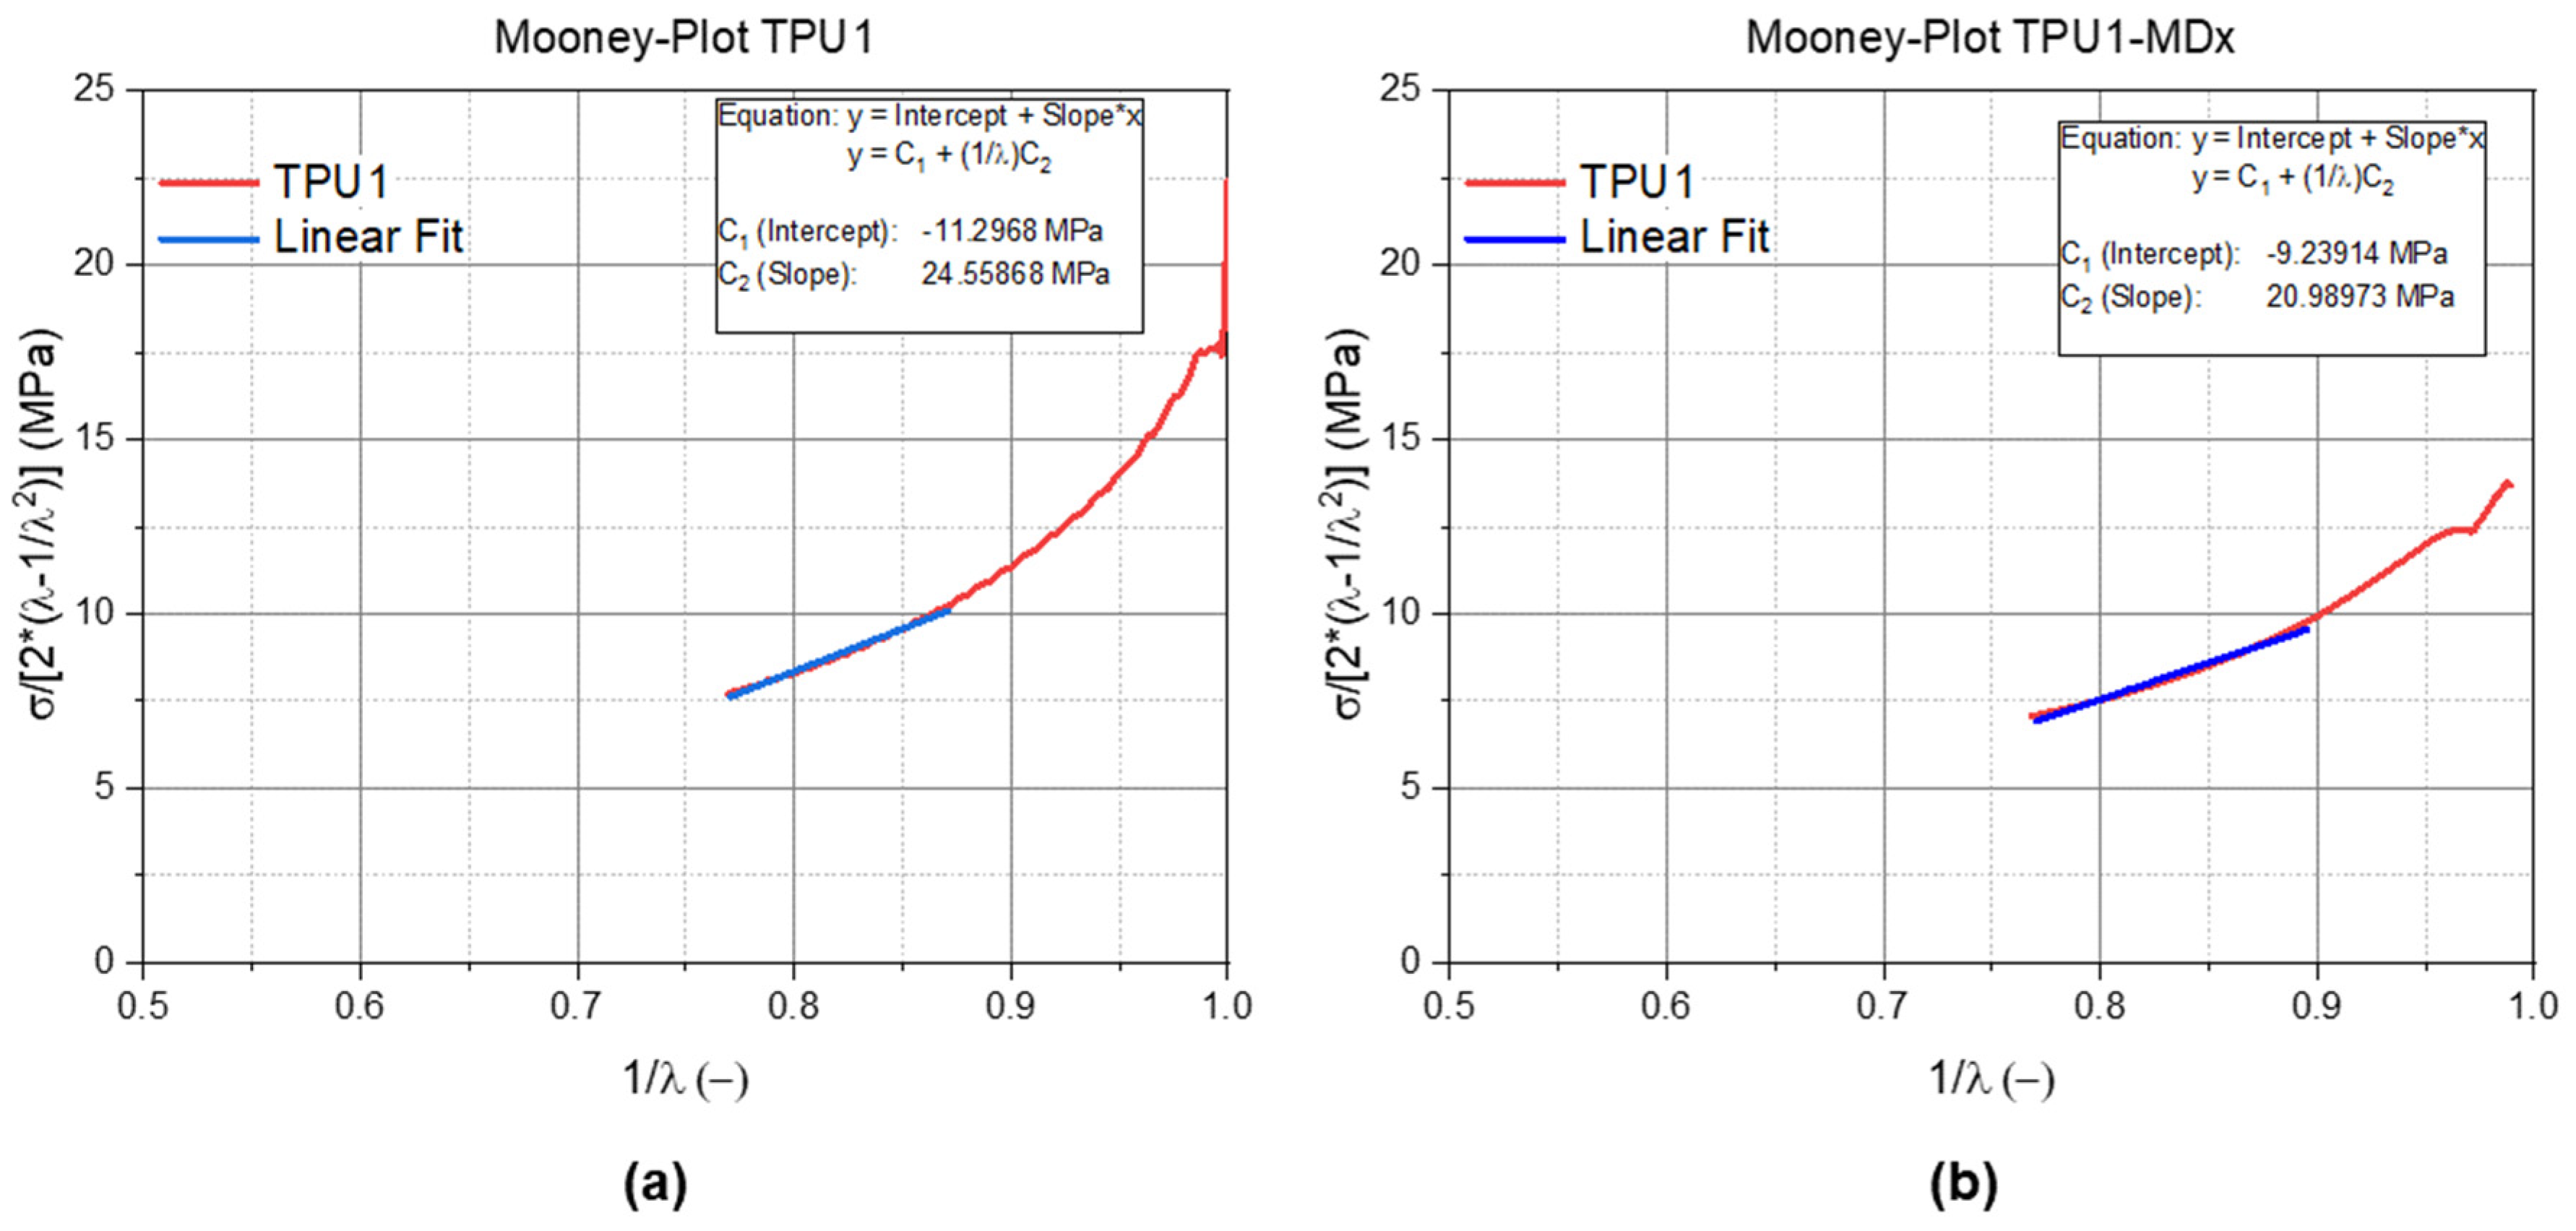
| Mooney–Rivlin Parameter | TPU1 | TPU1-MDx |
|---|---|---|
| C1 | −11.30 | −9.24 |
| C2 | 24.56 | 20.99 |
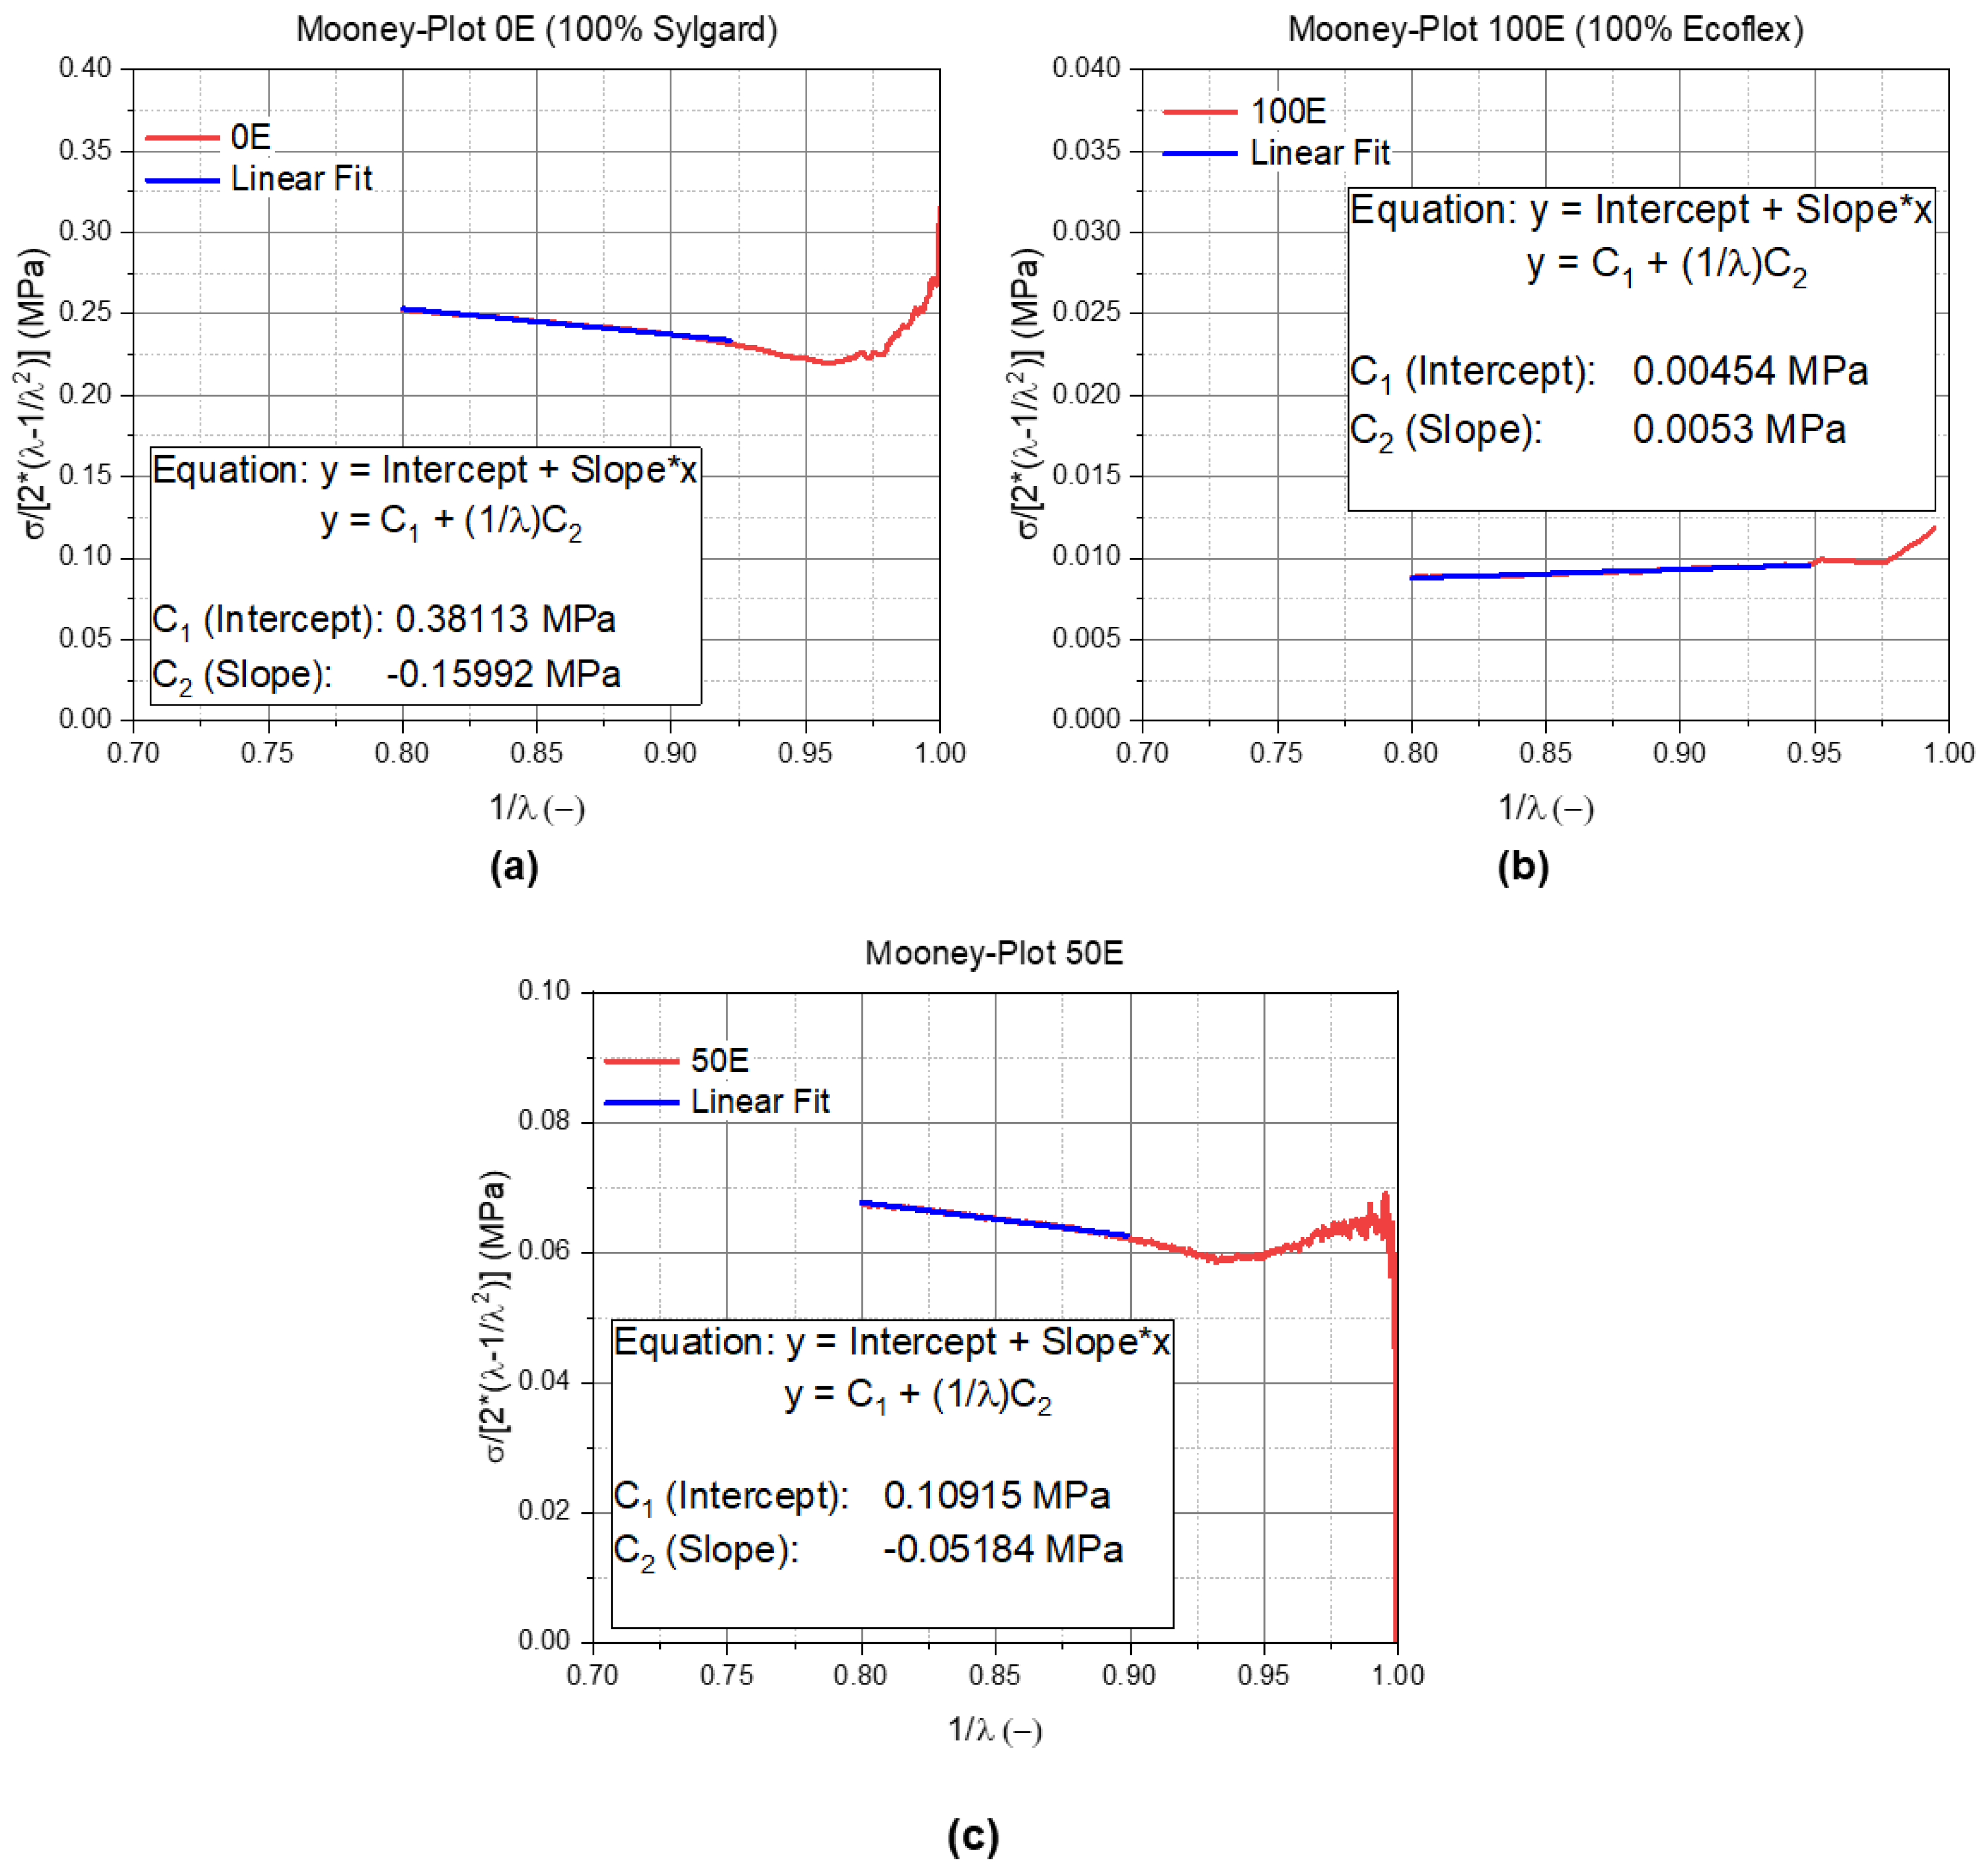
| Mooney–Rivlin Parameter | 0E (100% Sylgard) | 50E (50 wt% Ecoflex) | 100E (100% Ecoflex) |
|---|---|---|---|
| C1 | 0.38 | 0.11 | 0.0045 |
| C2 | −0.16 | −0.05 | 0.0053 |
Publisher’s Note: MDPI stays neutral with regard to jurisdictional claims in published maps and institutional affiliations. |
© 2021 by the authors. Licensee MDPI, Basel, Switzerland. This article is an open access article distributed under the terms and conditions of the Creative Commons Attribution (CC BY) license (https://creativecommons.org/licenses/by/4.0/).
Share and Cite
Emminger, C.; Çakmak, U.D.; Preuer, R.; Graz, I.; Major, Z. Hyperelastic Material Parameter Determination and Numerical Study of TPU and PDMS Dampers. Materials 2021, 14, 7639. https://doi.org/10.3390/ma14247639
Emminger C, Çakmak UD, Preuer R, Graz I, Major Z. Hyperelastic Material Parameter Determination and Numerical Study of TPU and PDMS Dampers. Materials. 2021; 14(24):7639. https://doi.org/10.3390/ma14247639
Chicago/Turabian StyleEmminger, Carina, Umut D. Çakmak, Rene Preuer, Ingrid Graz, and Zoltán Major. 2021. "Hyperelastic Material Parameter Determination and Numerical Study of TPU and PDMS Dampers" Materials 14, no. 24: 7639. https://doi.org/10.3390/ma14247639
APA StyleEmminger, C., Çakmak, U. D., Preuer, R., Graz, I., & Major, Z. (2021). Hyperelastic Material Parameter Determination and Numerical Study of TPU and PDMS Dampers. Materials, 14(24), 7639. https://doi.org/10.3390/ma14247639