
Artificial Ageing, Chemical Resistance, and Biodegradation of Biocomposites from Poly(Butylene Succinate) and Wheat Bran


Abstract
:1. Introduction
2. Experimental Procedures
2.1. Test Stand
2.2. Materials
2.3. Research Programme and Methodology
- Performing accelerated ageing test in Xenotest Alpha+ accelerated ageing chamber (Atlas, Chicago, IL, USA). The test lasted 1000 h, the samples were irradiated with a xenon lamp emitting radiation imitating solar radiation. The irradiance of 60 W/m2 and the daylight filter system were used. The temperature in the chamber was kept at 38 °C, humidity 50%. During irradiation, the samples were sprayed with distilled water for 18 min every 102 min. The measurement conditions were in accordance with the standard: ISO 4892-2:2013 [92]. Before and after the test, and for selected tests also during the test, the following properties, which are the determinants of resistance to artificial ageing, were measured:
- ◦
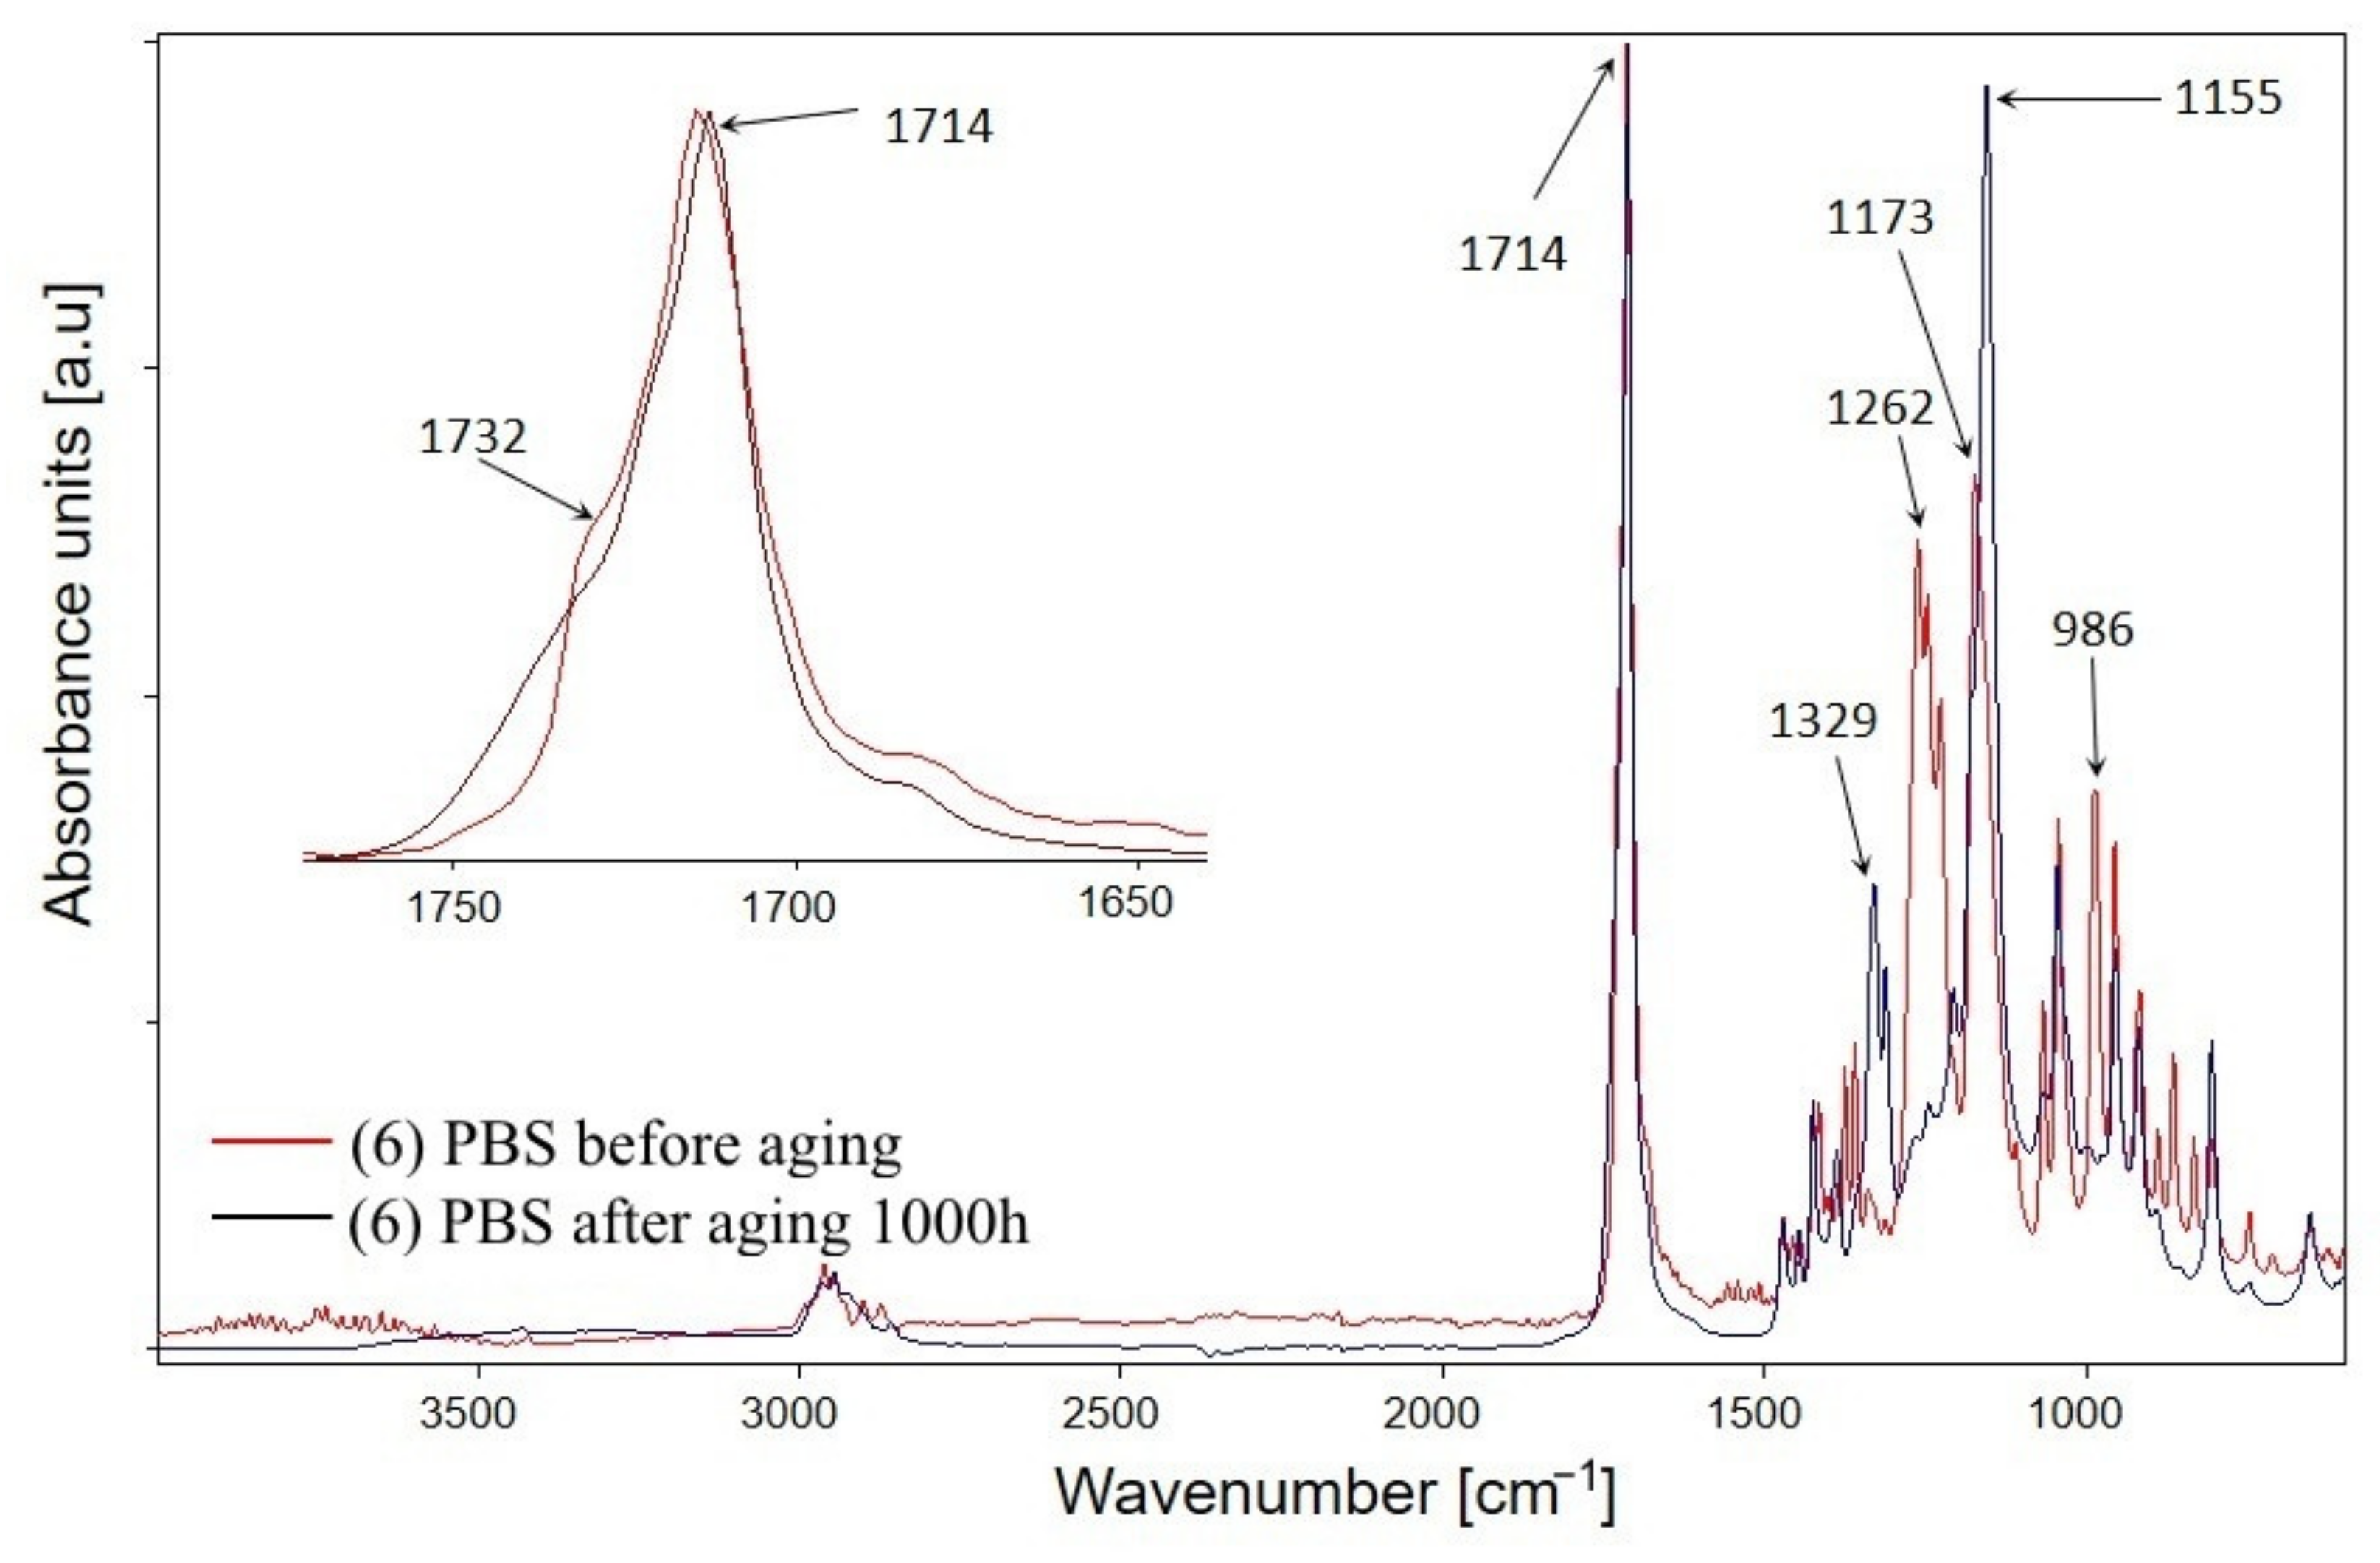
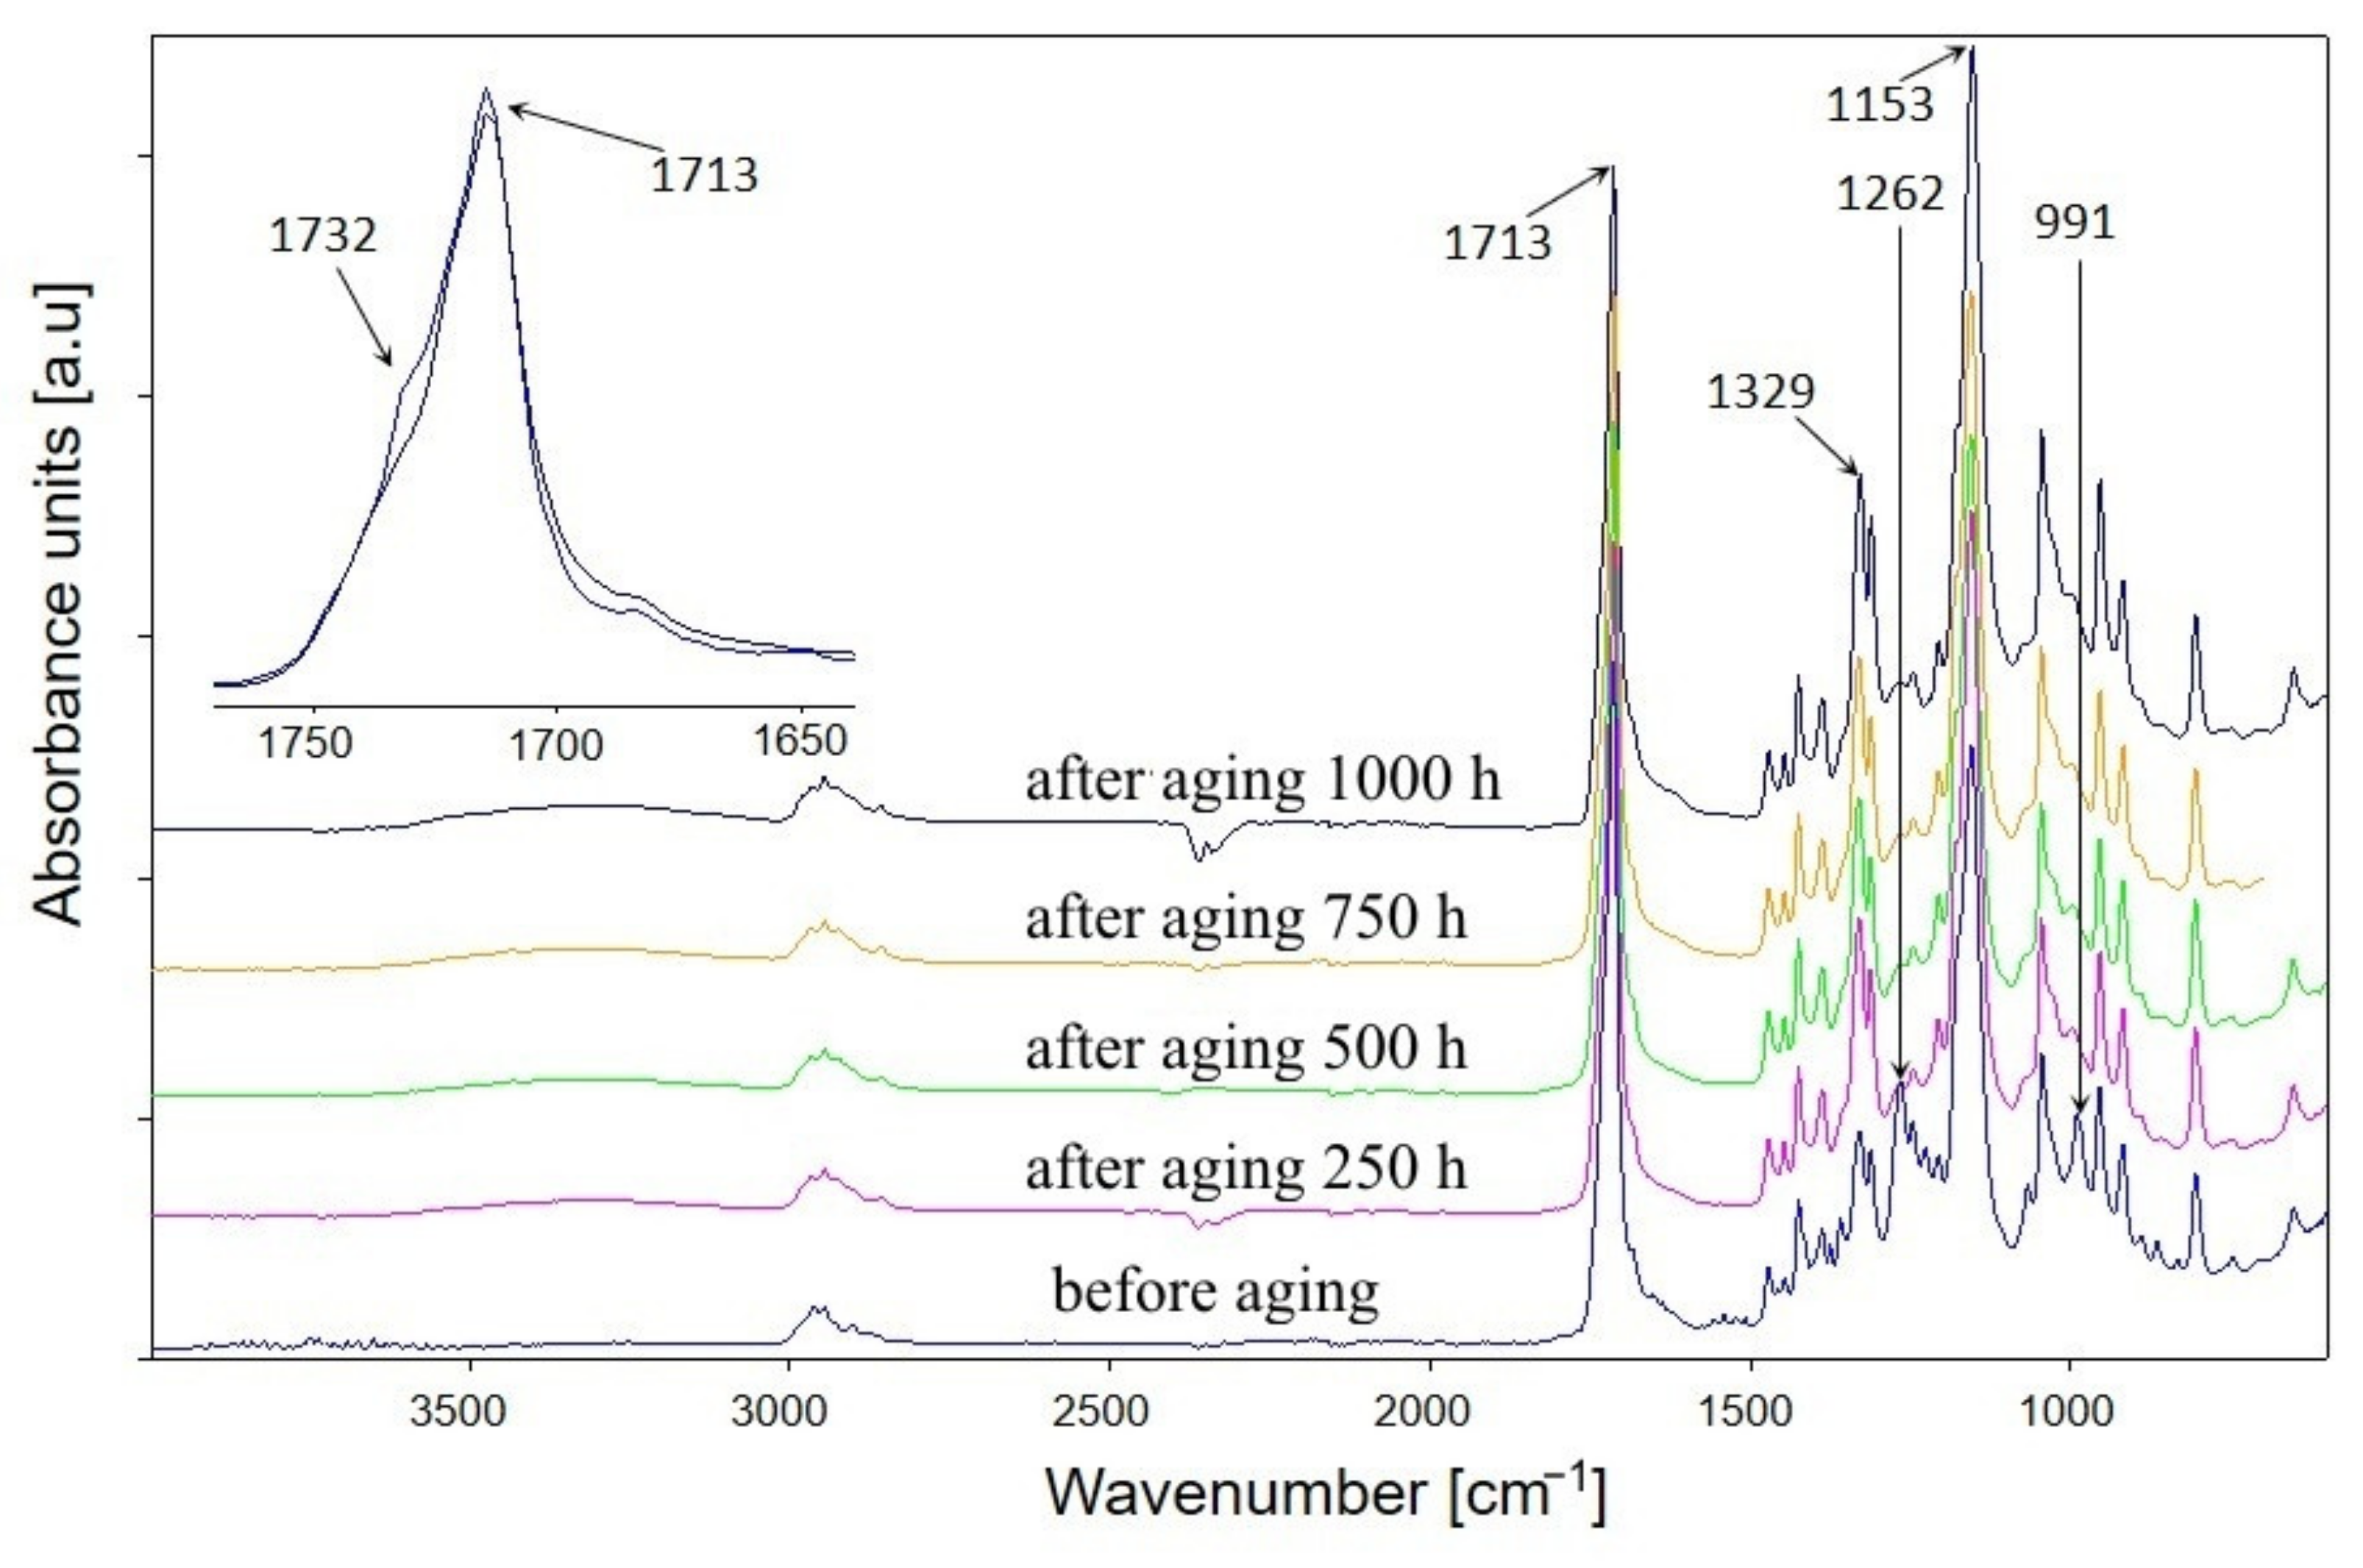
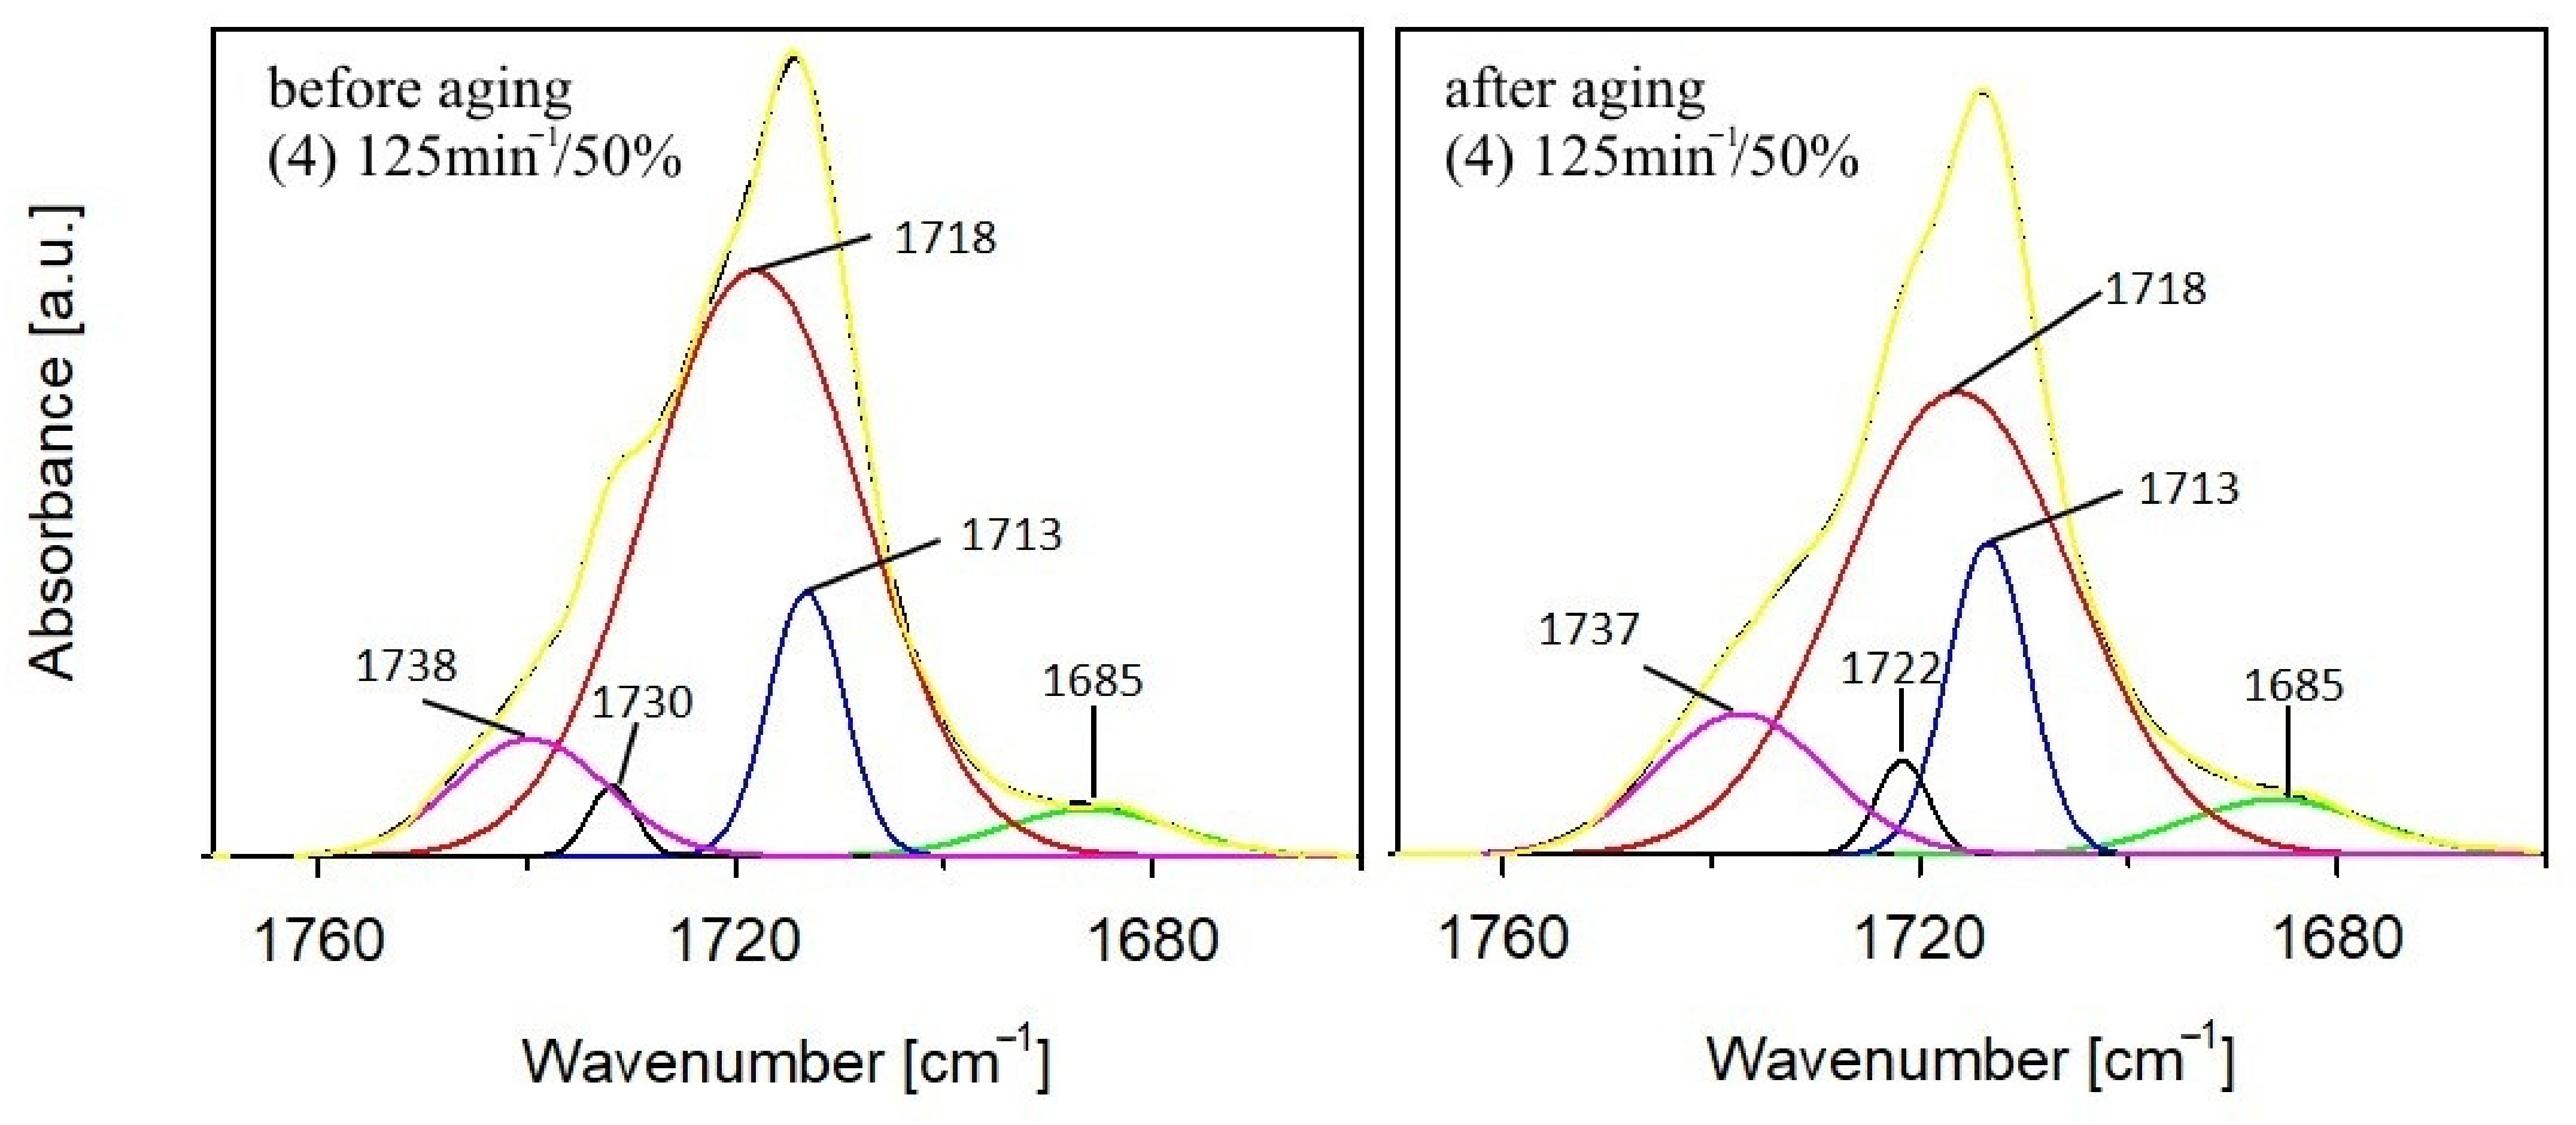
- The infrared spectra (FTIR) analysis of the samples. The accelerated ageing test was stopped for 10 min each time at 250, 500, and 750 h in order to obtain the FTIR spectra of the test samples. The used parameters of the ageing test allow us to assess the behaviour of composites in artificial weathering conditions. The FTIR of tested samples were taken using Tensor 27 spectrometer (Bruker, Germany) equipped with ATR (attenuated total reflectance) module with diamond crystal. The FTIR spectra were recorded from 600 to 4000 cm−1 with 32 scans per spectrum and the resolution of 4 cm−1. The infrared carbonyl stretching region was deconvoluted into the Gaussian curves using OPUS 7.0 software;
- ◦
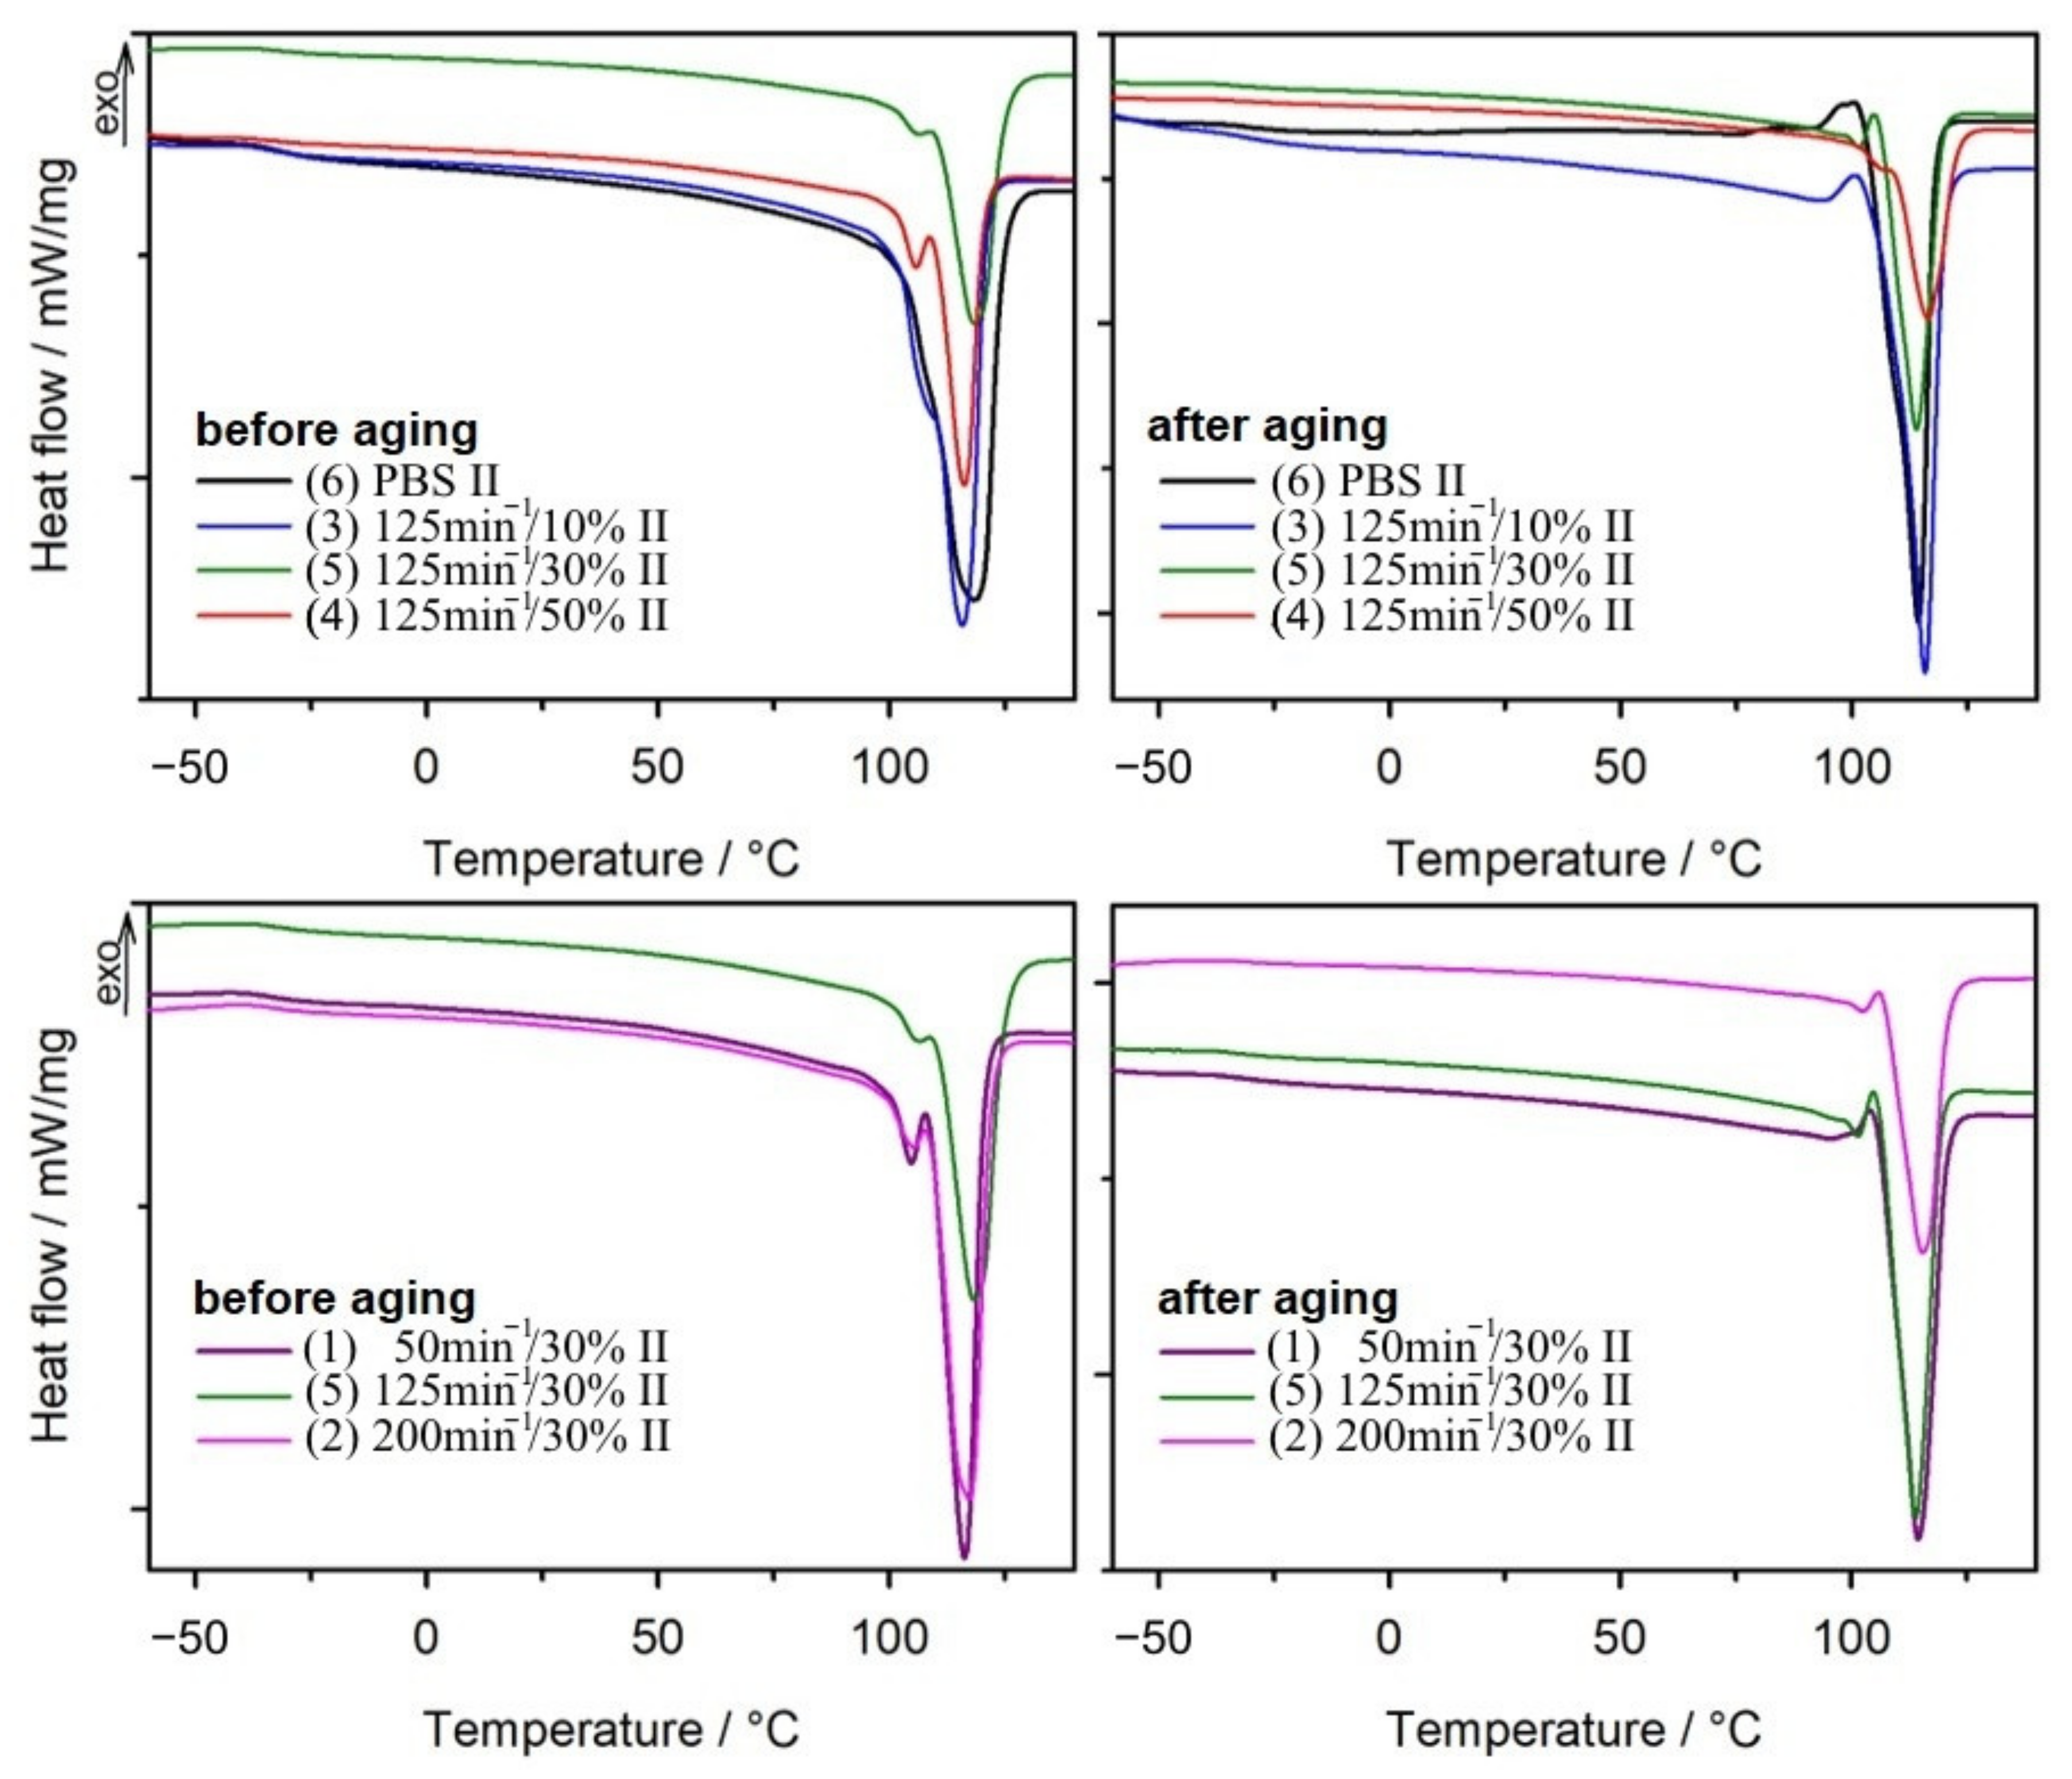
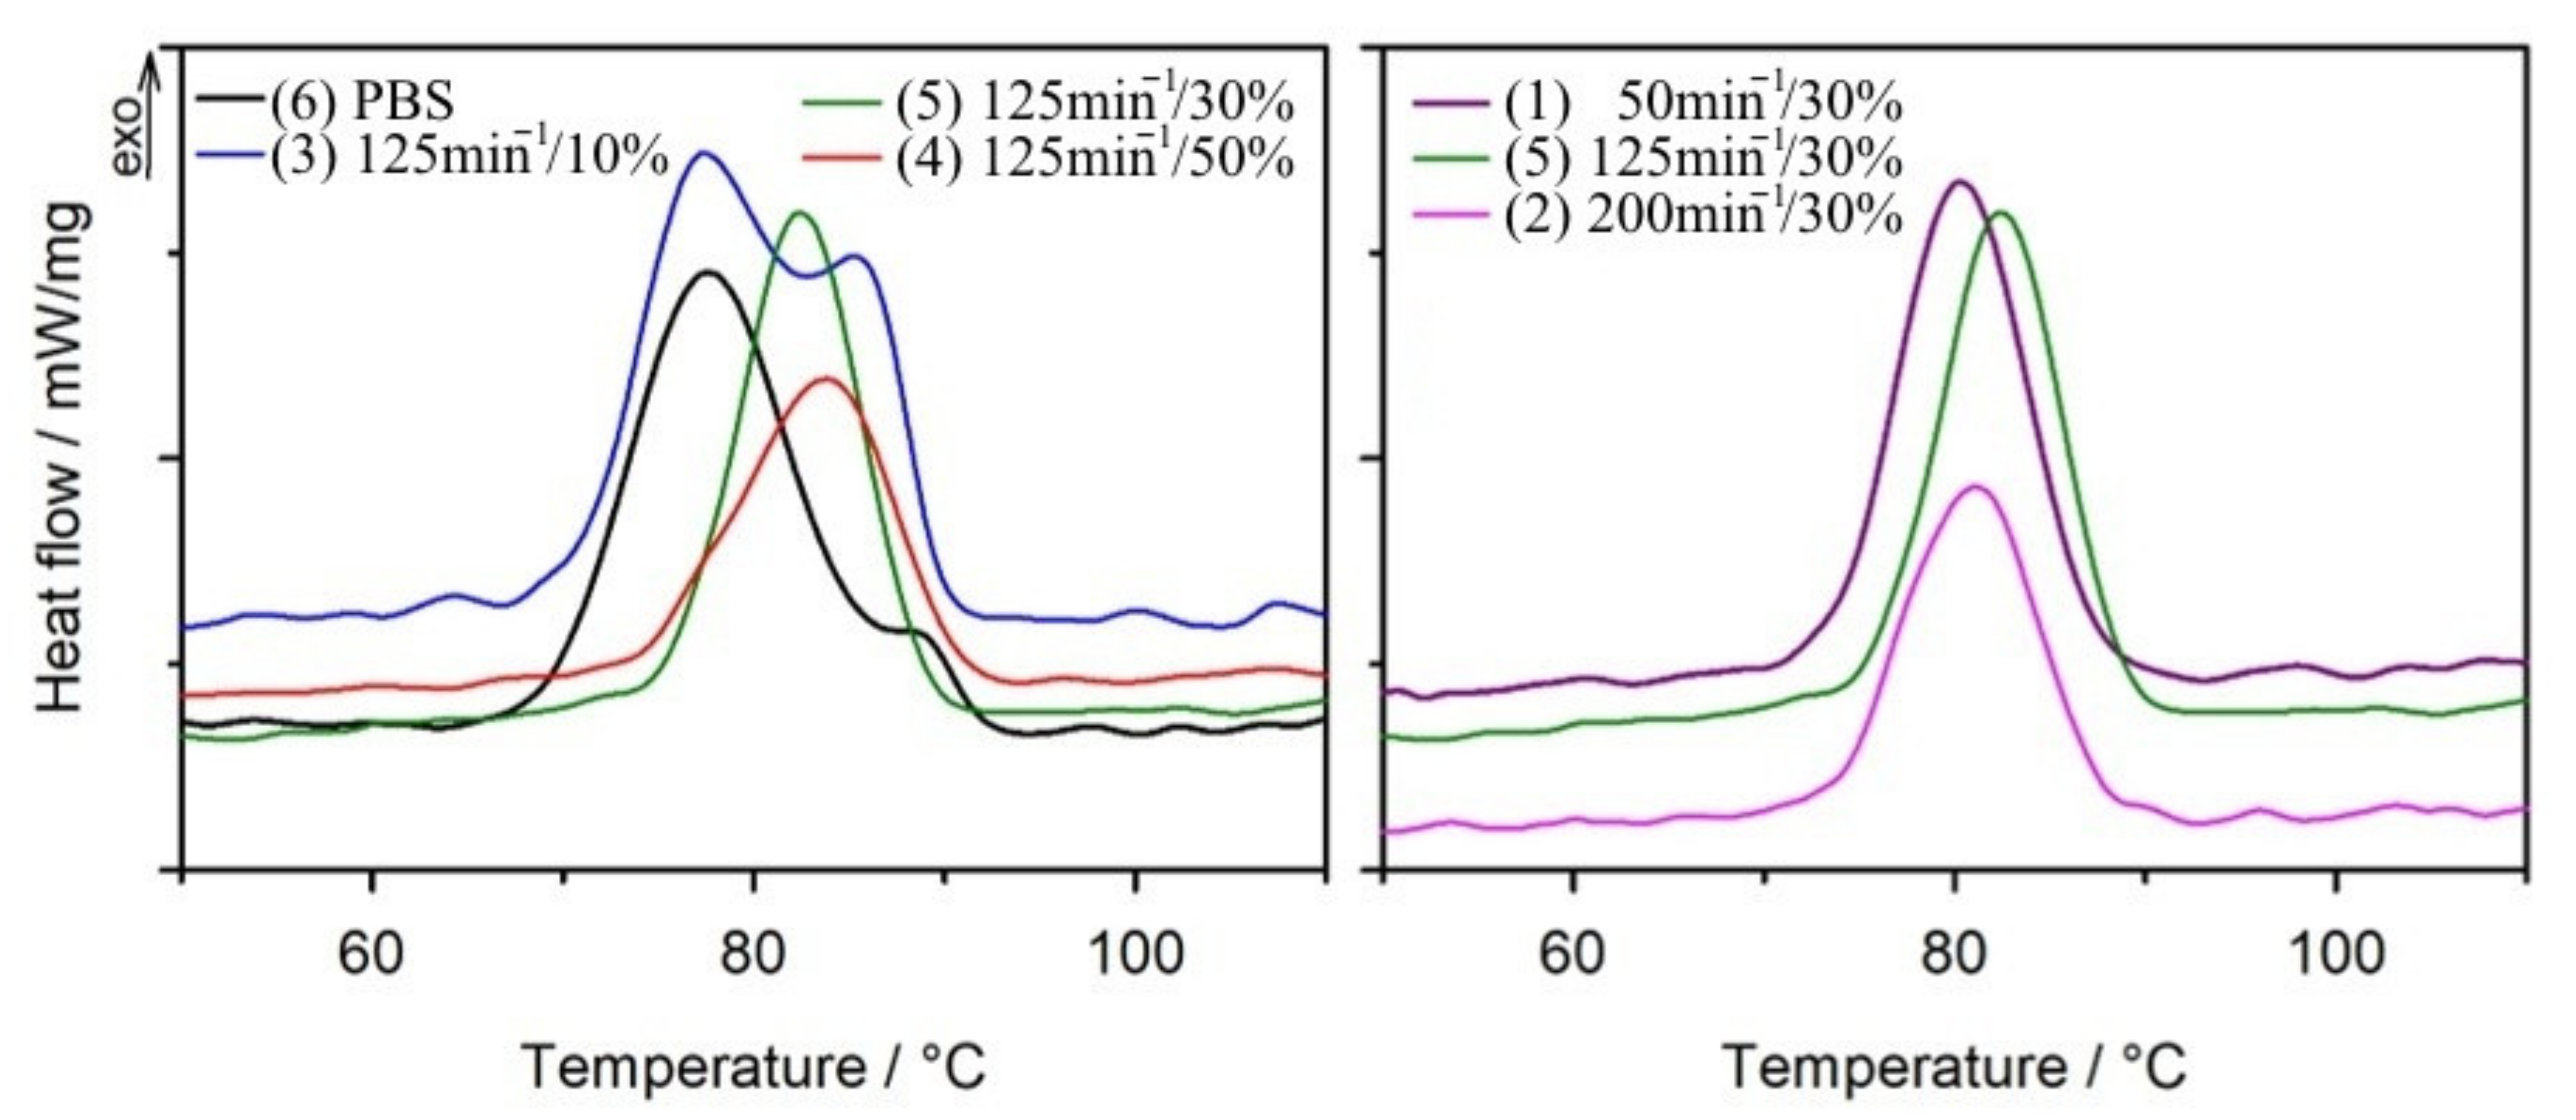
- Differential scanning calorimetric (DSC) studies were performed on DSC 204 F1 Phoenix (NETZSCH, Günzbung, Germany) working with the NETZSCH Proteus software, in accordance with standard ISO 11357-1:2016 [93]. Each measurement was carried in three cycles: heating from −150 °C to 140 °C with heating rate of 10 K/min (I heating), cooling from 140 °C to −150 °C with cooling rate of 10 K/min, heating from −150 °C to 140 °C with heating rate of 10 K/min (II heating). Samples with mass about 10 mg were analysed in closed pierced aluminium pans in argon atmosphere with flow rate of 25 mL/min. Parameters such as melting enthalpy (ΔHm), melting temperature (Tm), crystallization temperature (Tc), glass transition temperature (Tg), and crystallinity degree (Xc) were calculated based on the obtained thermograms. The Tg value was adopted as the inflection point of the DSC curve in the area of the glass transition. The Xc parameter was calculated from the equation:assuming that for pure PBS, ΔH100% = 110.3 J/g [94];
- ◦
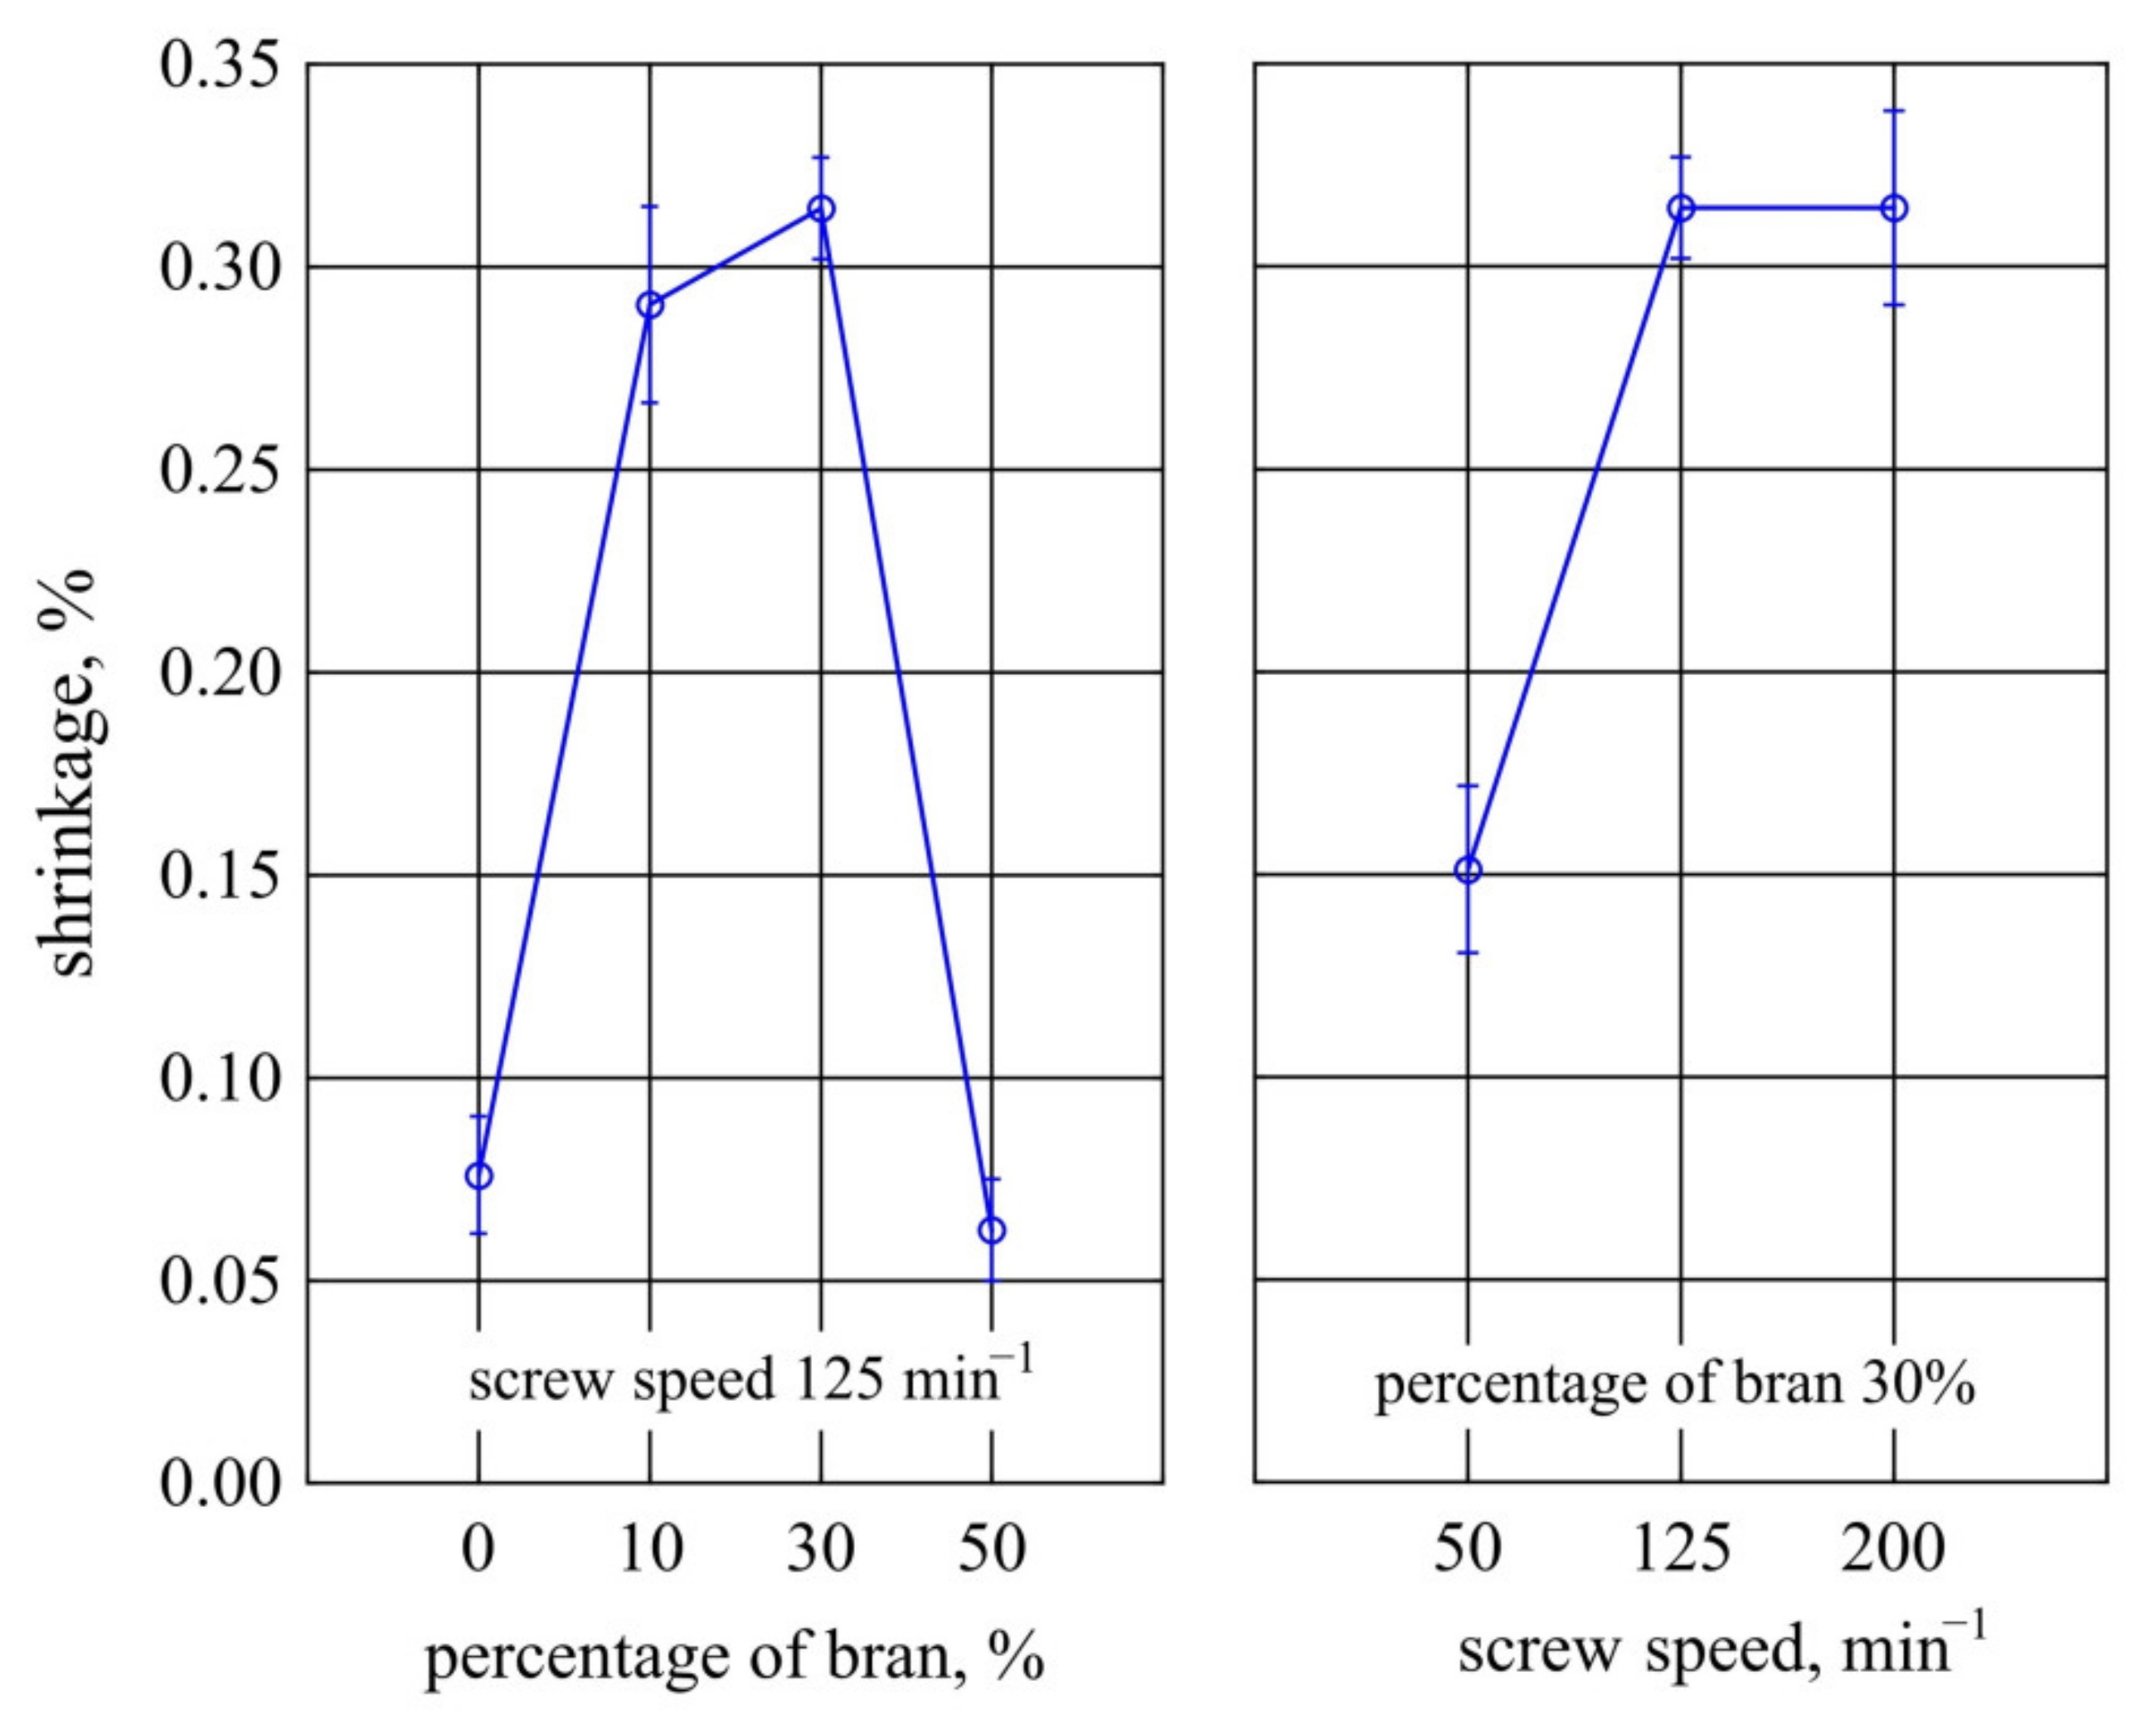
- Measurements of transverse shrinkage, determined as the percentage difference in linear dimension of the specimen before accelerated ageing and after the completed accelerated ageing cycle. Recommendations were applied from the standard ISO 294-4:2018 [95];
- ◦
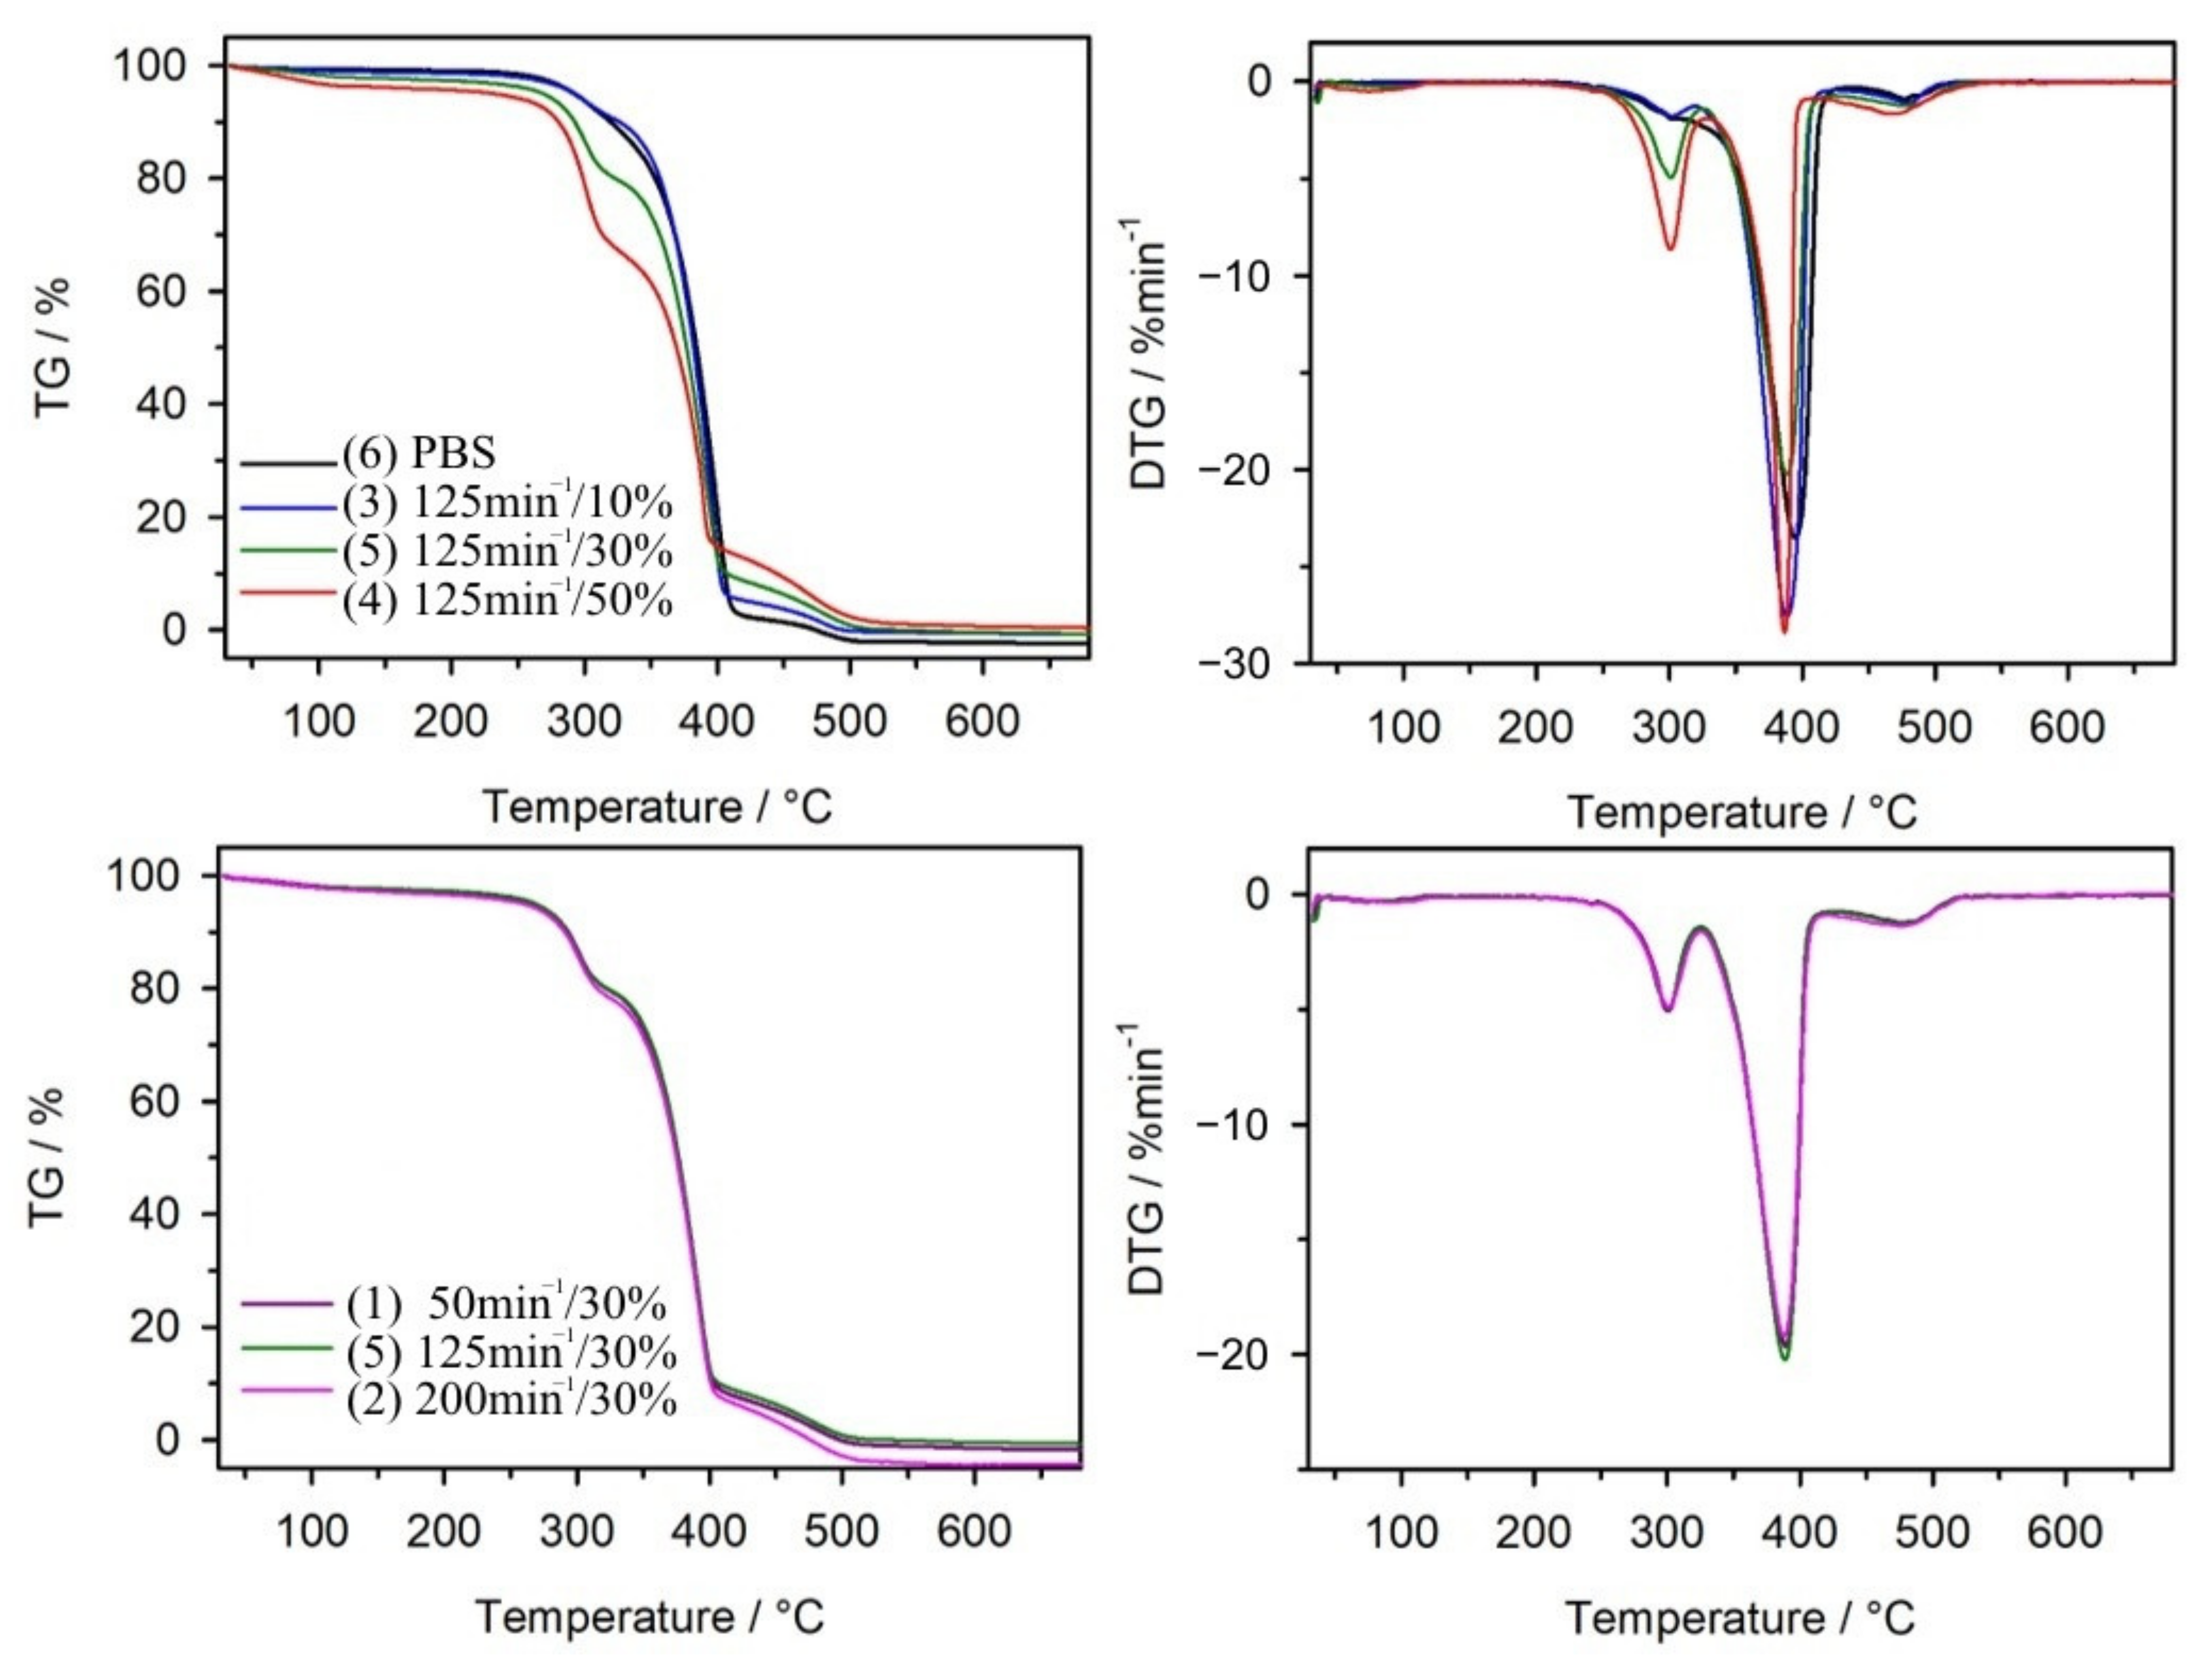
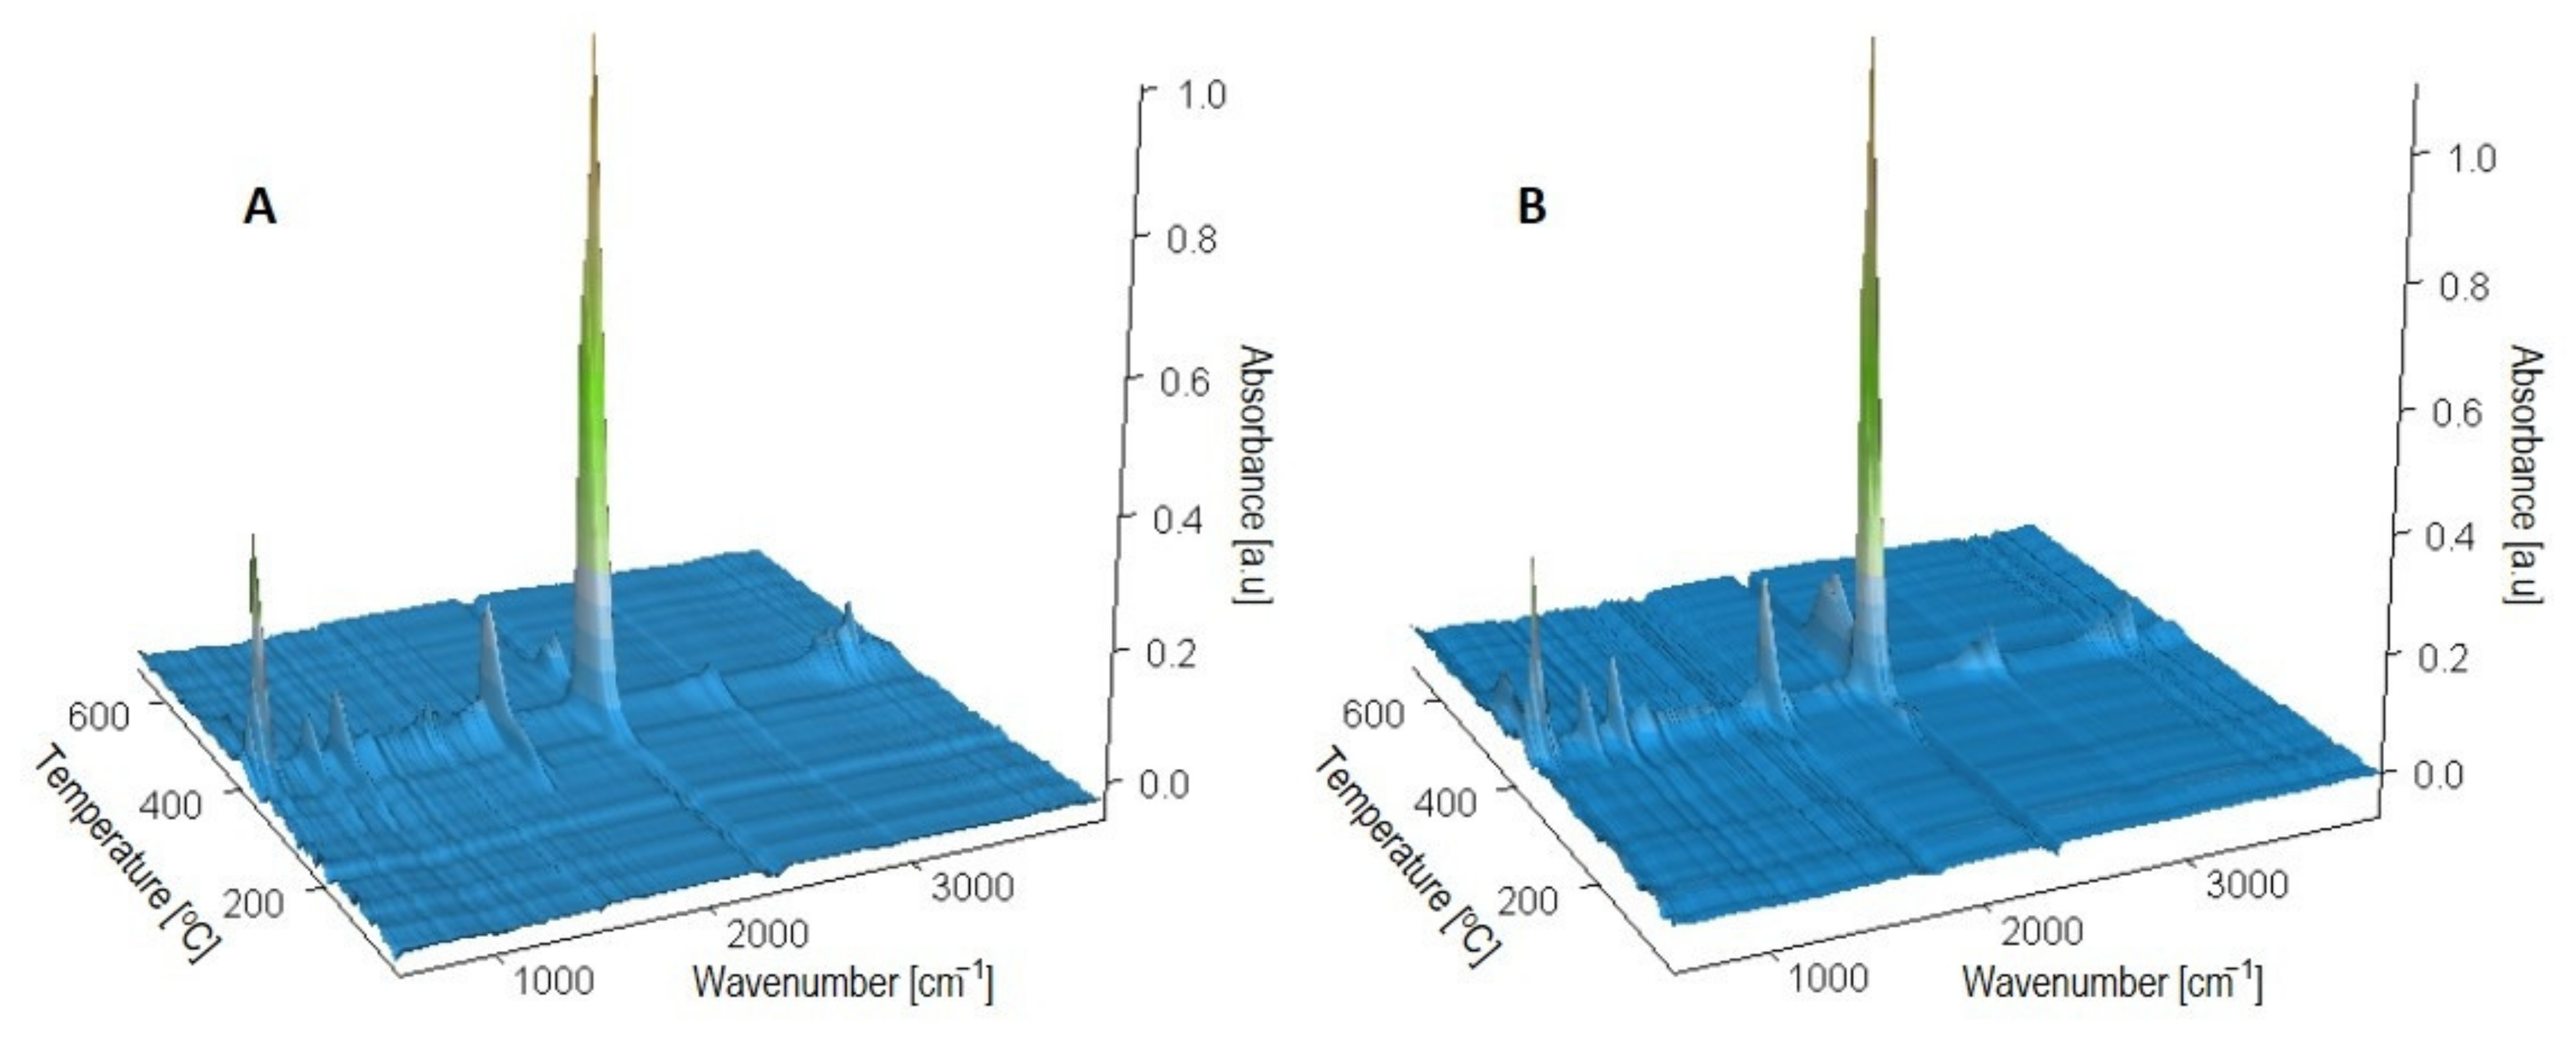
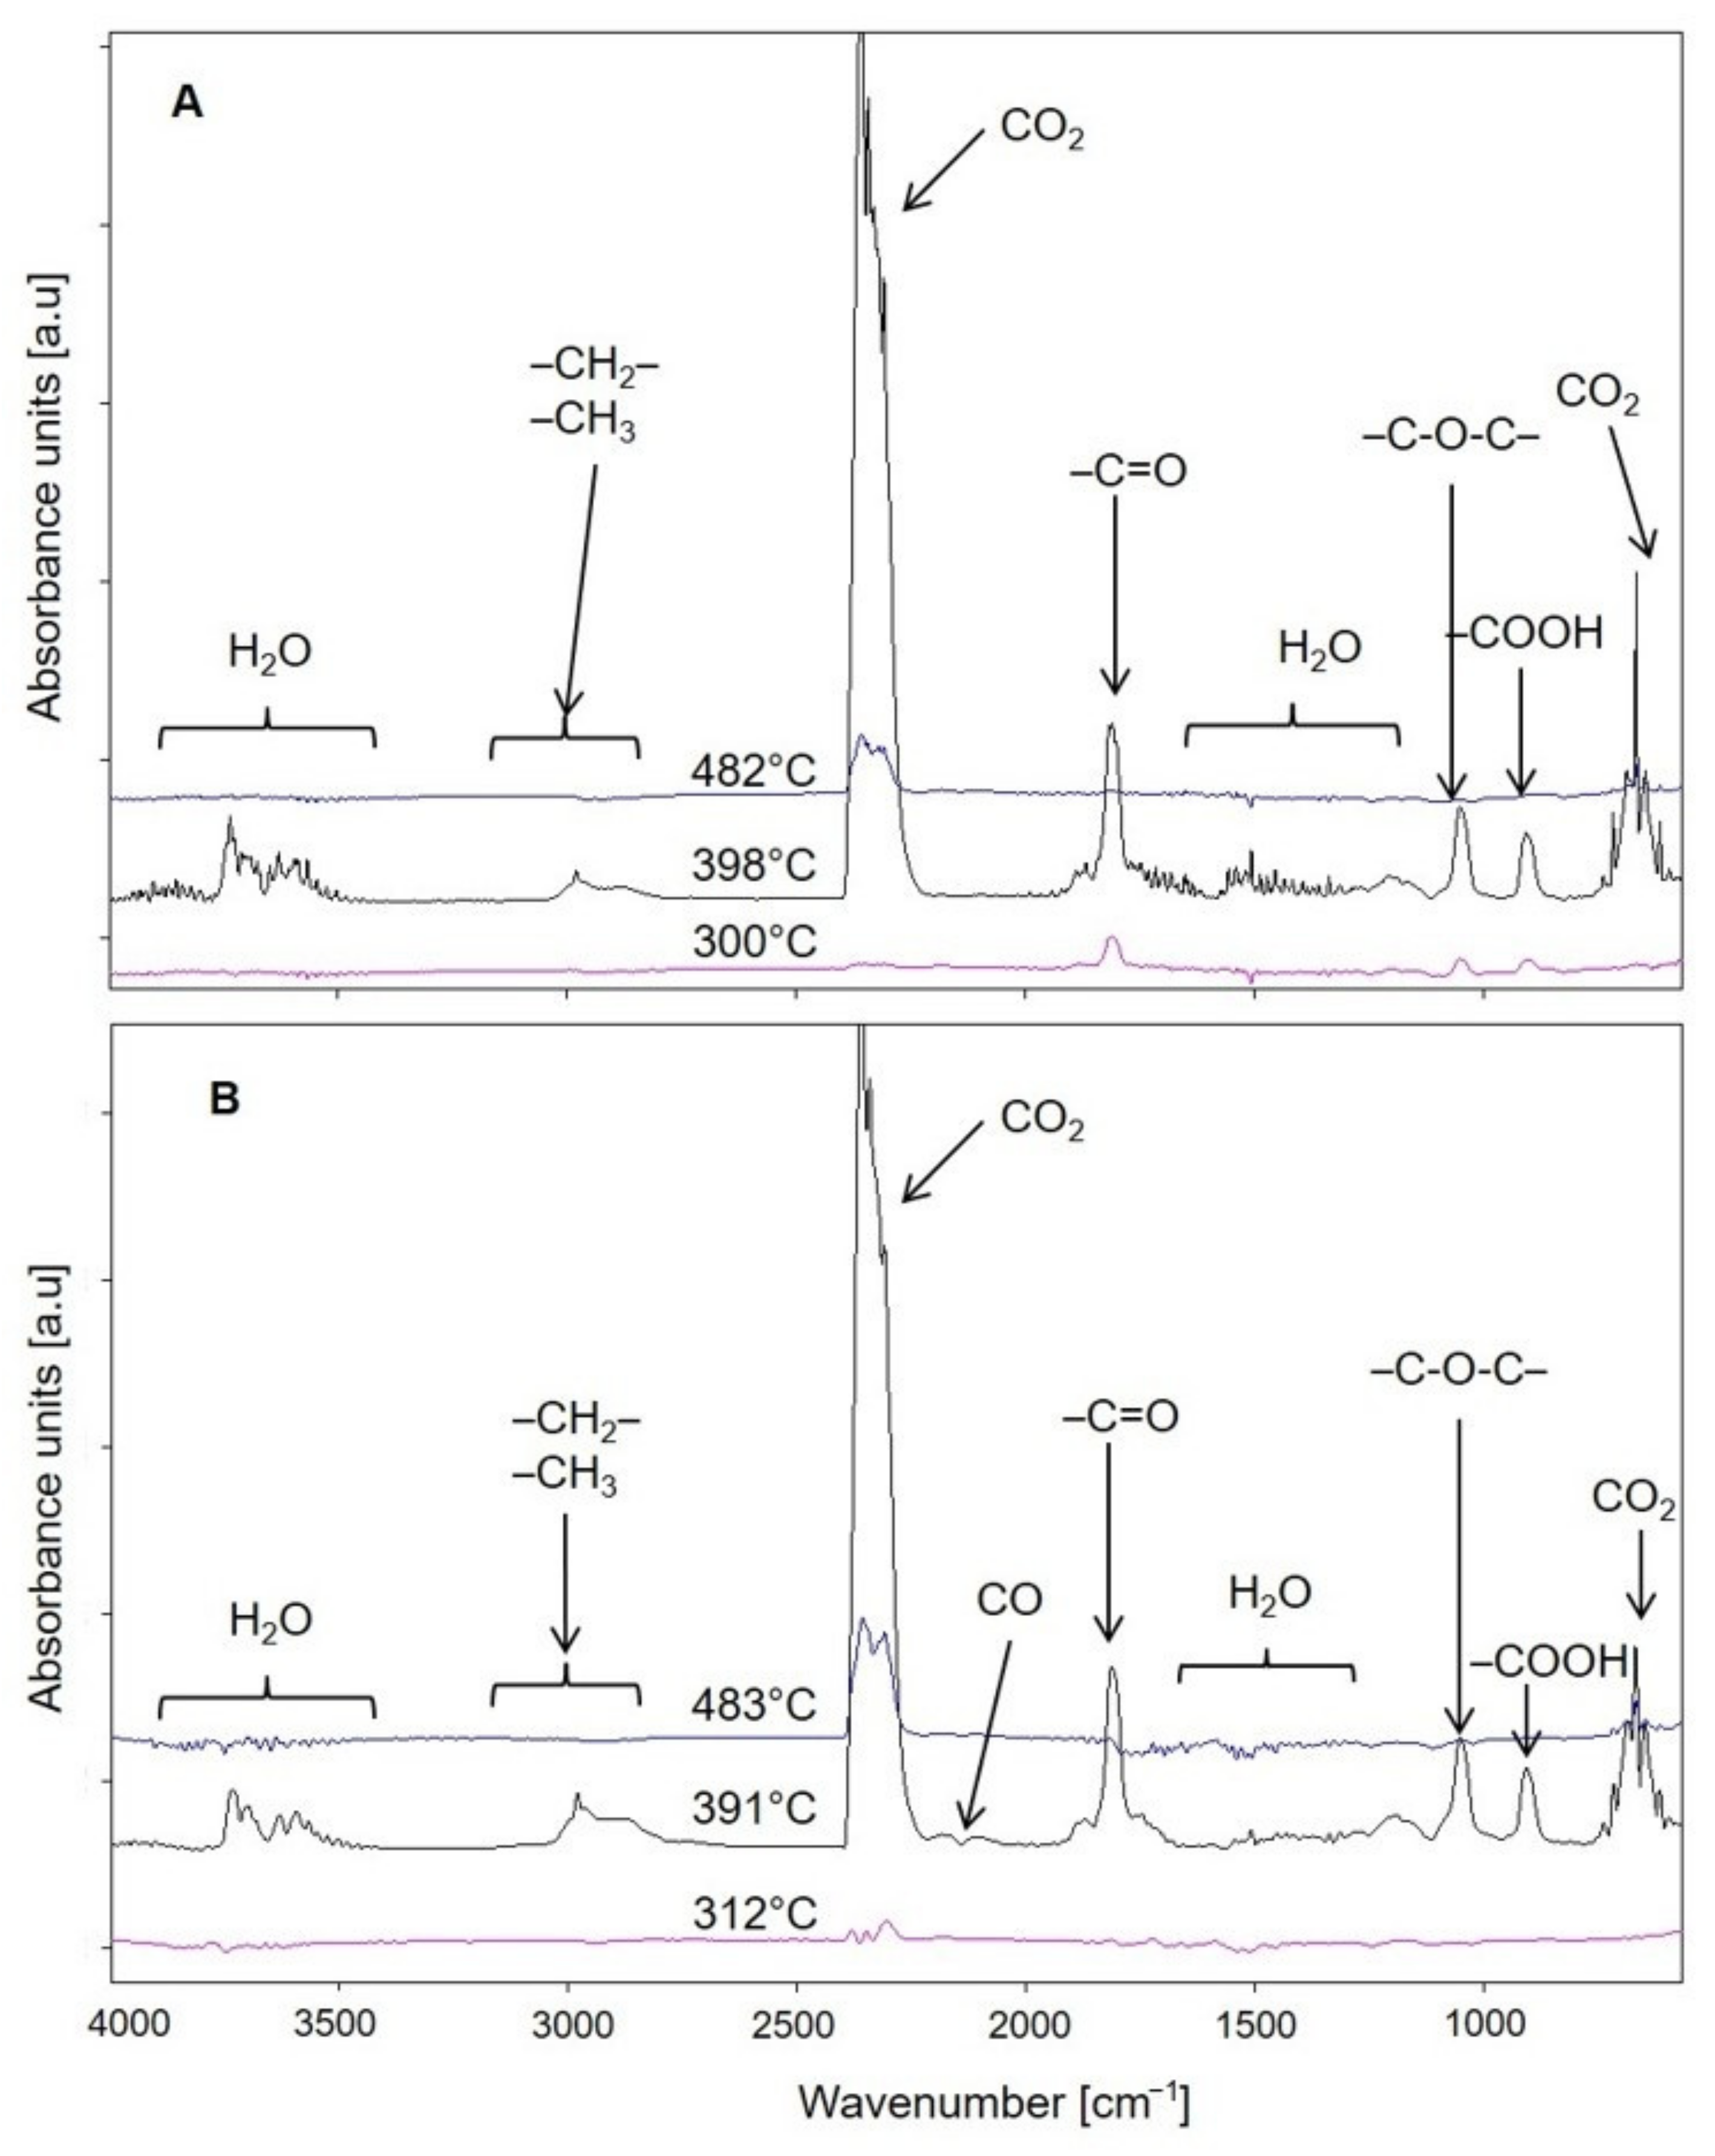
- Thermogravimetric analysis was performed in synthetic air with the use of STA 449 F1 Jupiter (Netzsch, Günzbung, Germany) coupled with FTIR TENSOR 27 spectrometer (Bruker, Germany). The measurement conditions were as follows: temperature range of 40–800 °C, heating rate 10 K/min gas flow 25 mL/min, and sample mass approximately 10 mg. Samples were analysed in Al2O3 opened crucibles;
- ◦
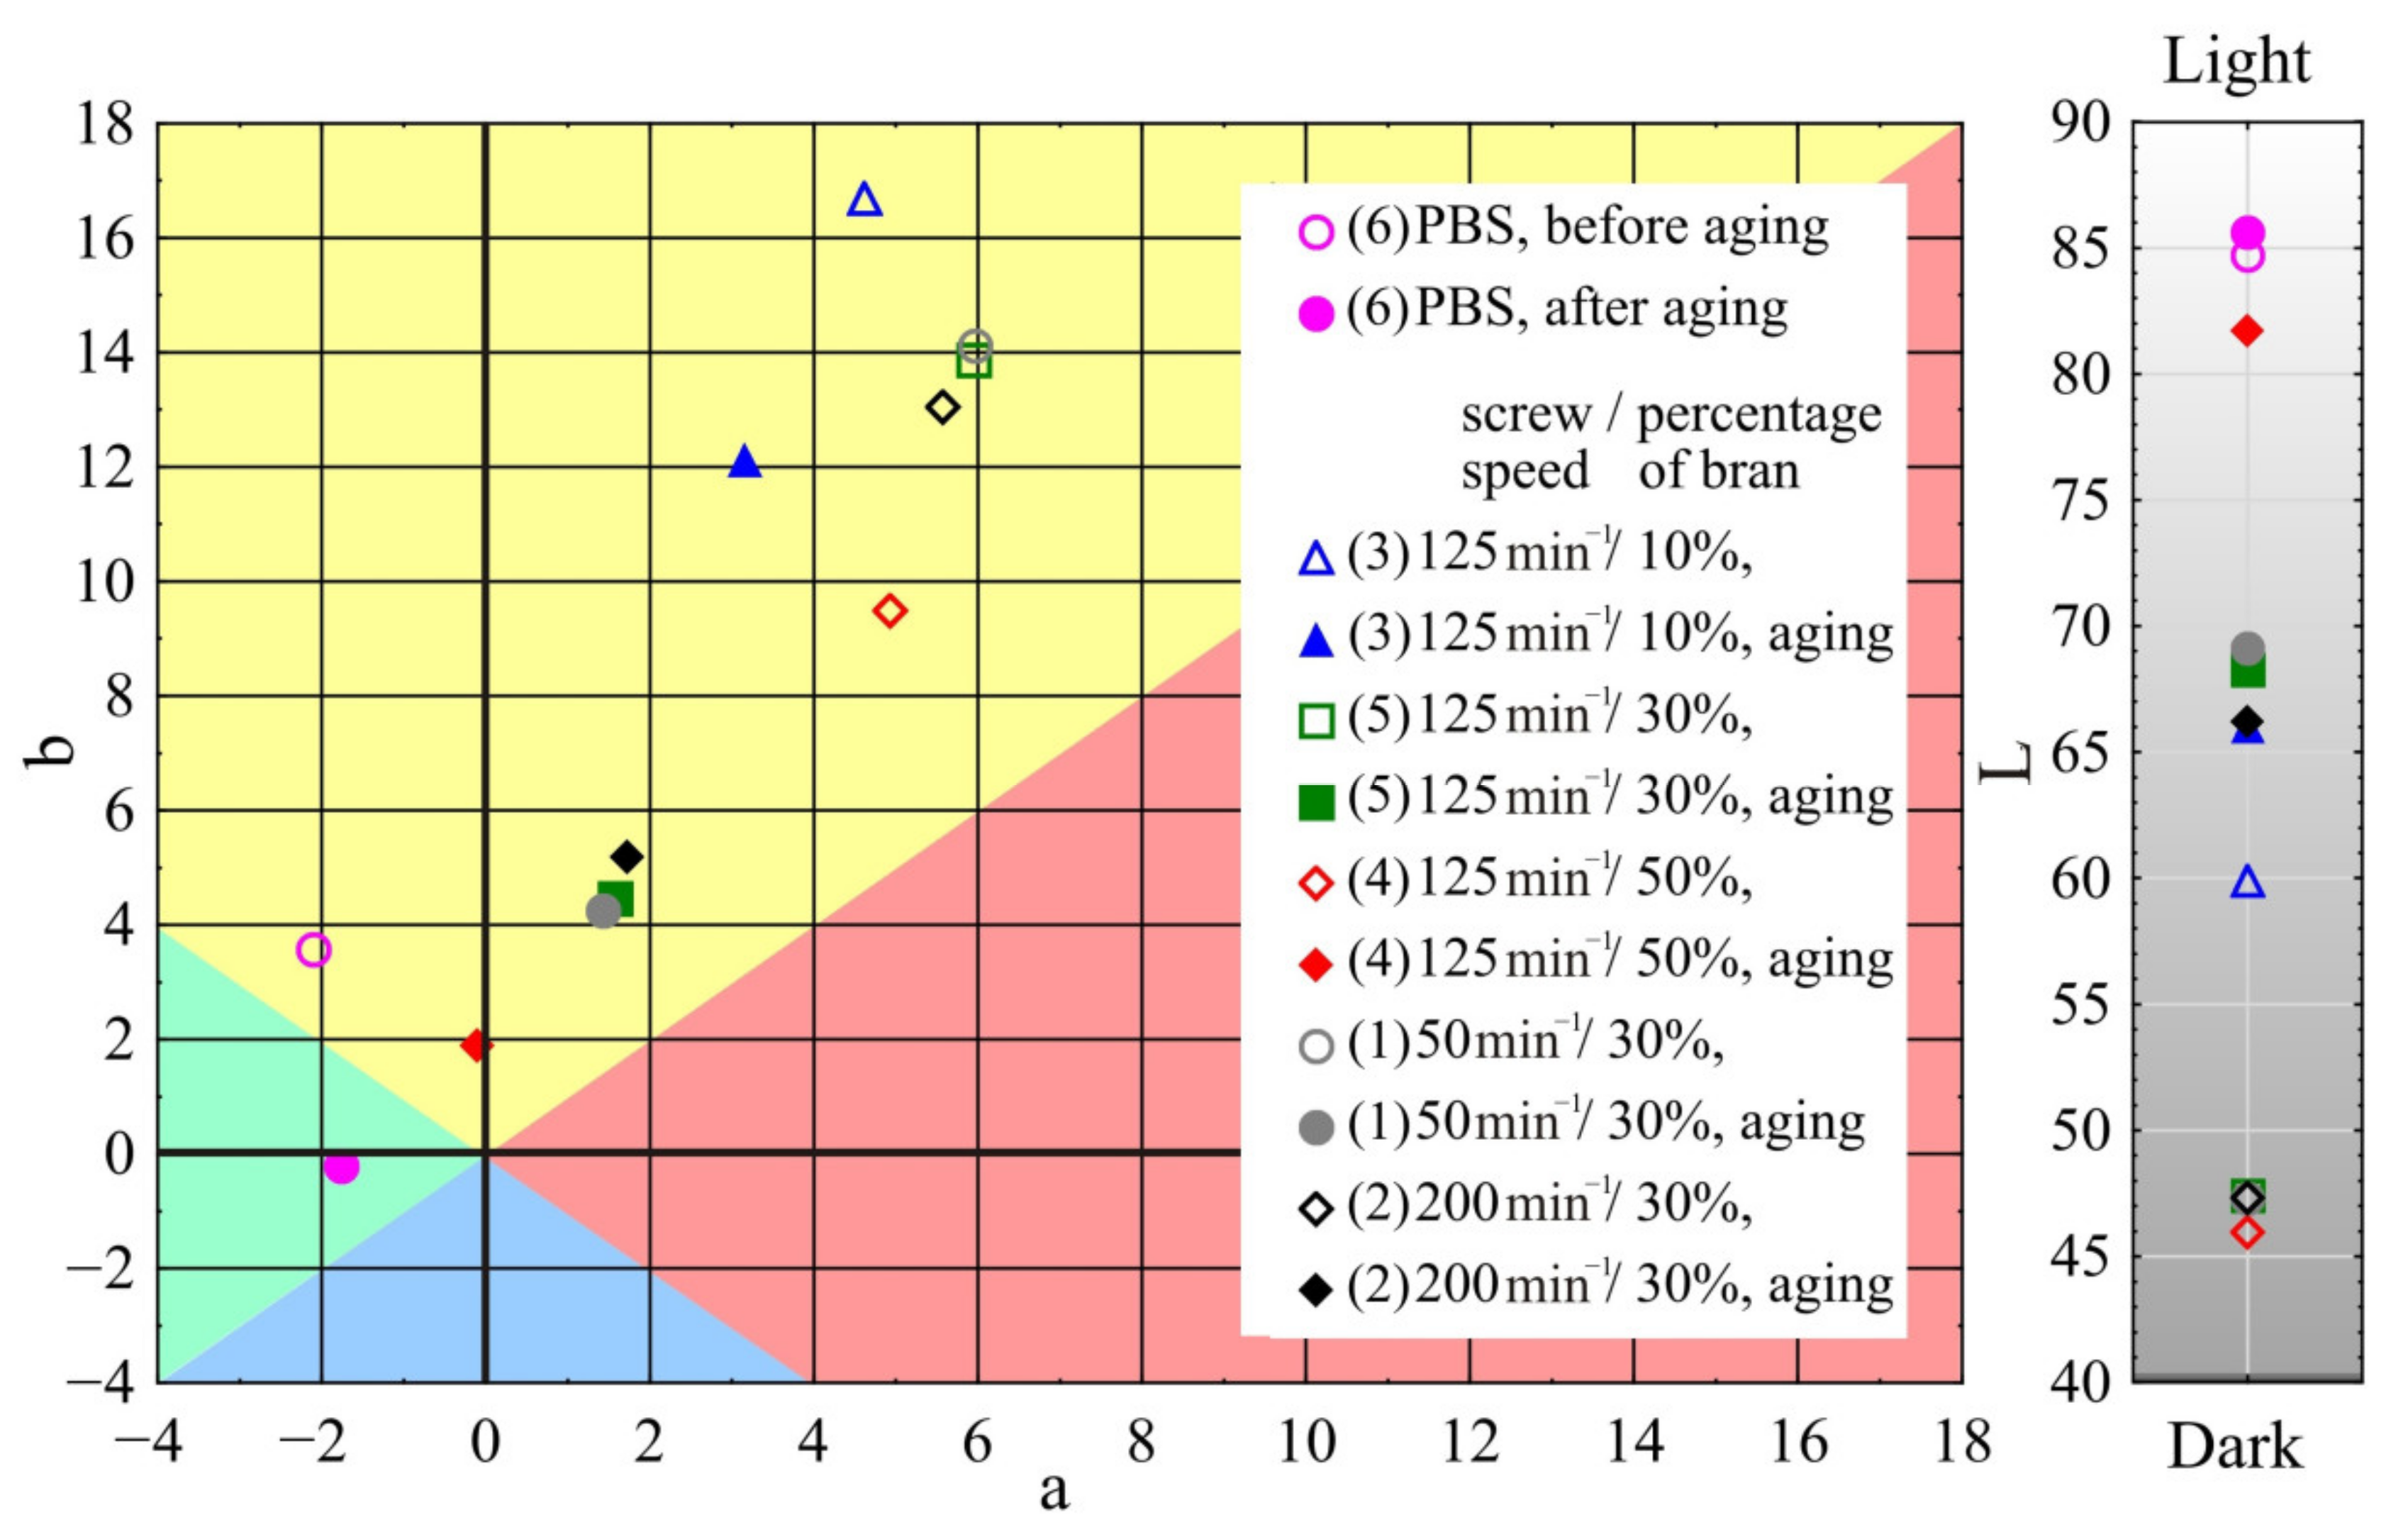
- Colour measurement of samples according to ASTM E308 [96], for which X-Rite Ci4200 spectrophotometer was used. The colour is described in the CIELab system, where it is specified in L*, a*, b* space. Parameter a describes the colour from green (negative values) to red (positive values), parameter b—the colour from blue (negative values) to yellow (positive values), and parameter L is the luminance—brightness, representing the grey scale from black to white (value 0 corresponds to black and 100 to white). The difference between two colours—two points in the three-dimensional space L*, a*, b*—is described by the relation:in which: ΔL, Δa, and Δb denote the difference in colour parameters between the compared samples, respectively.
- ◦
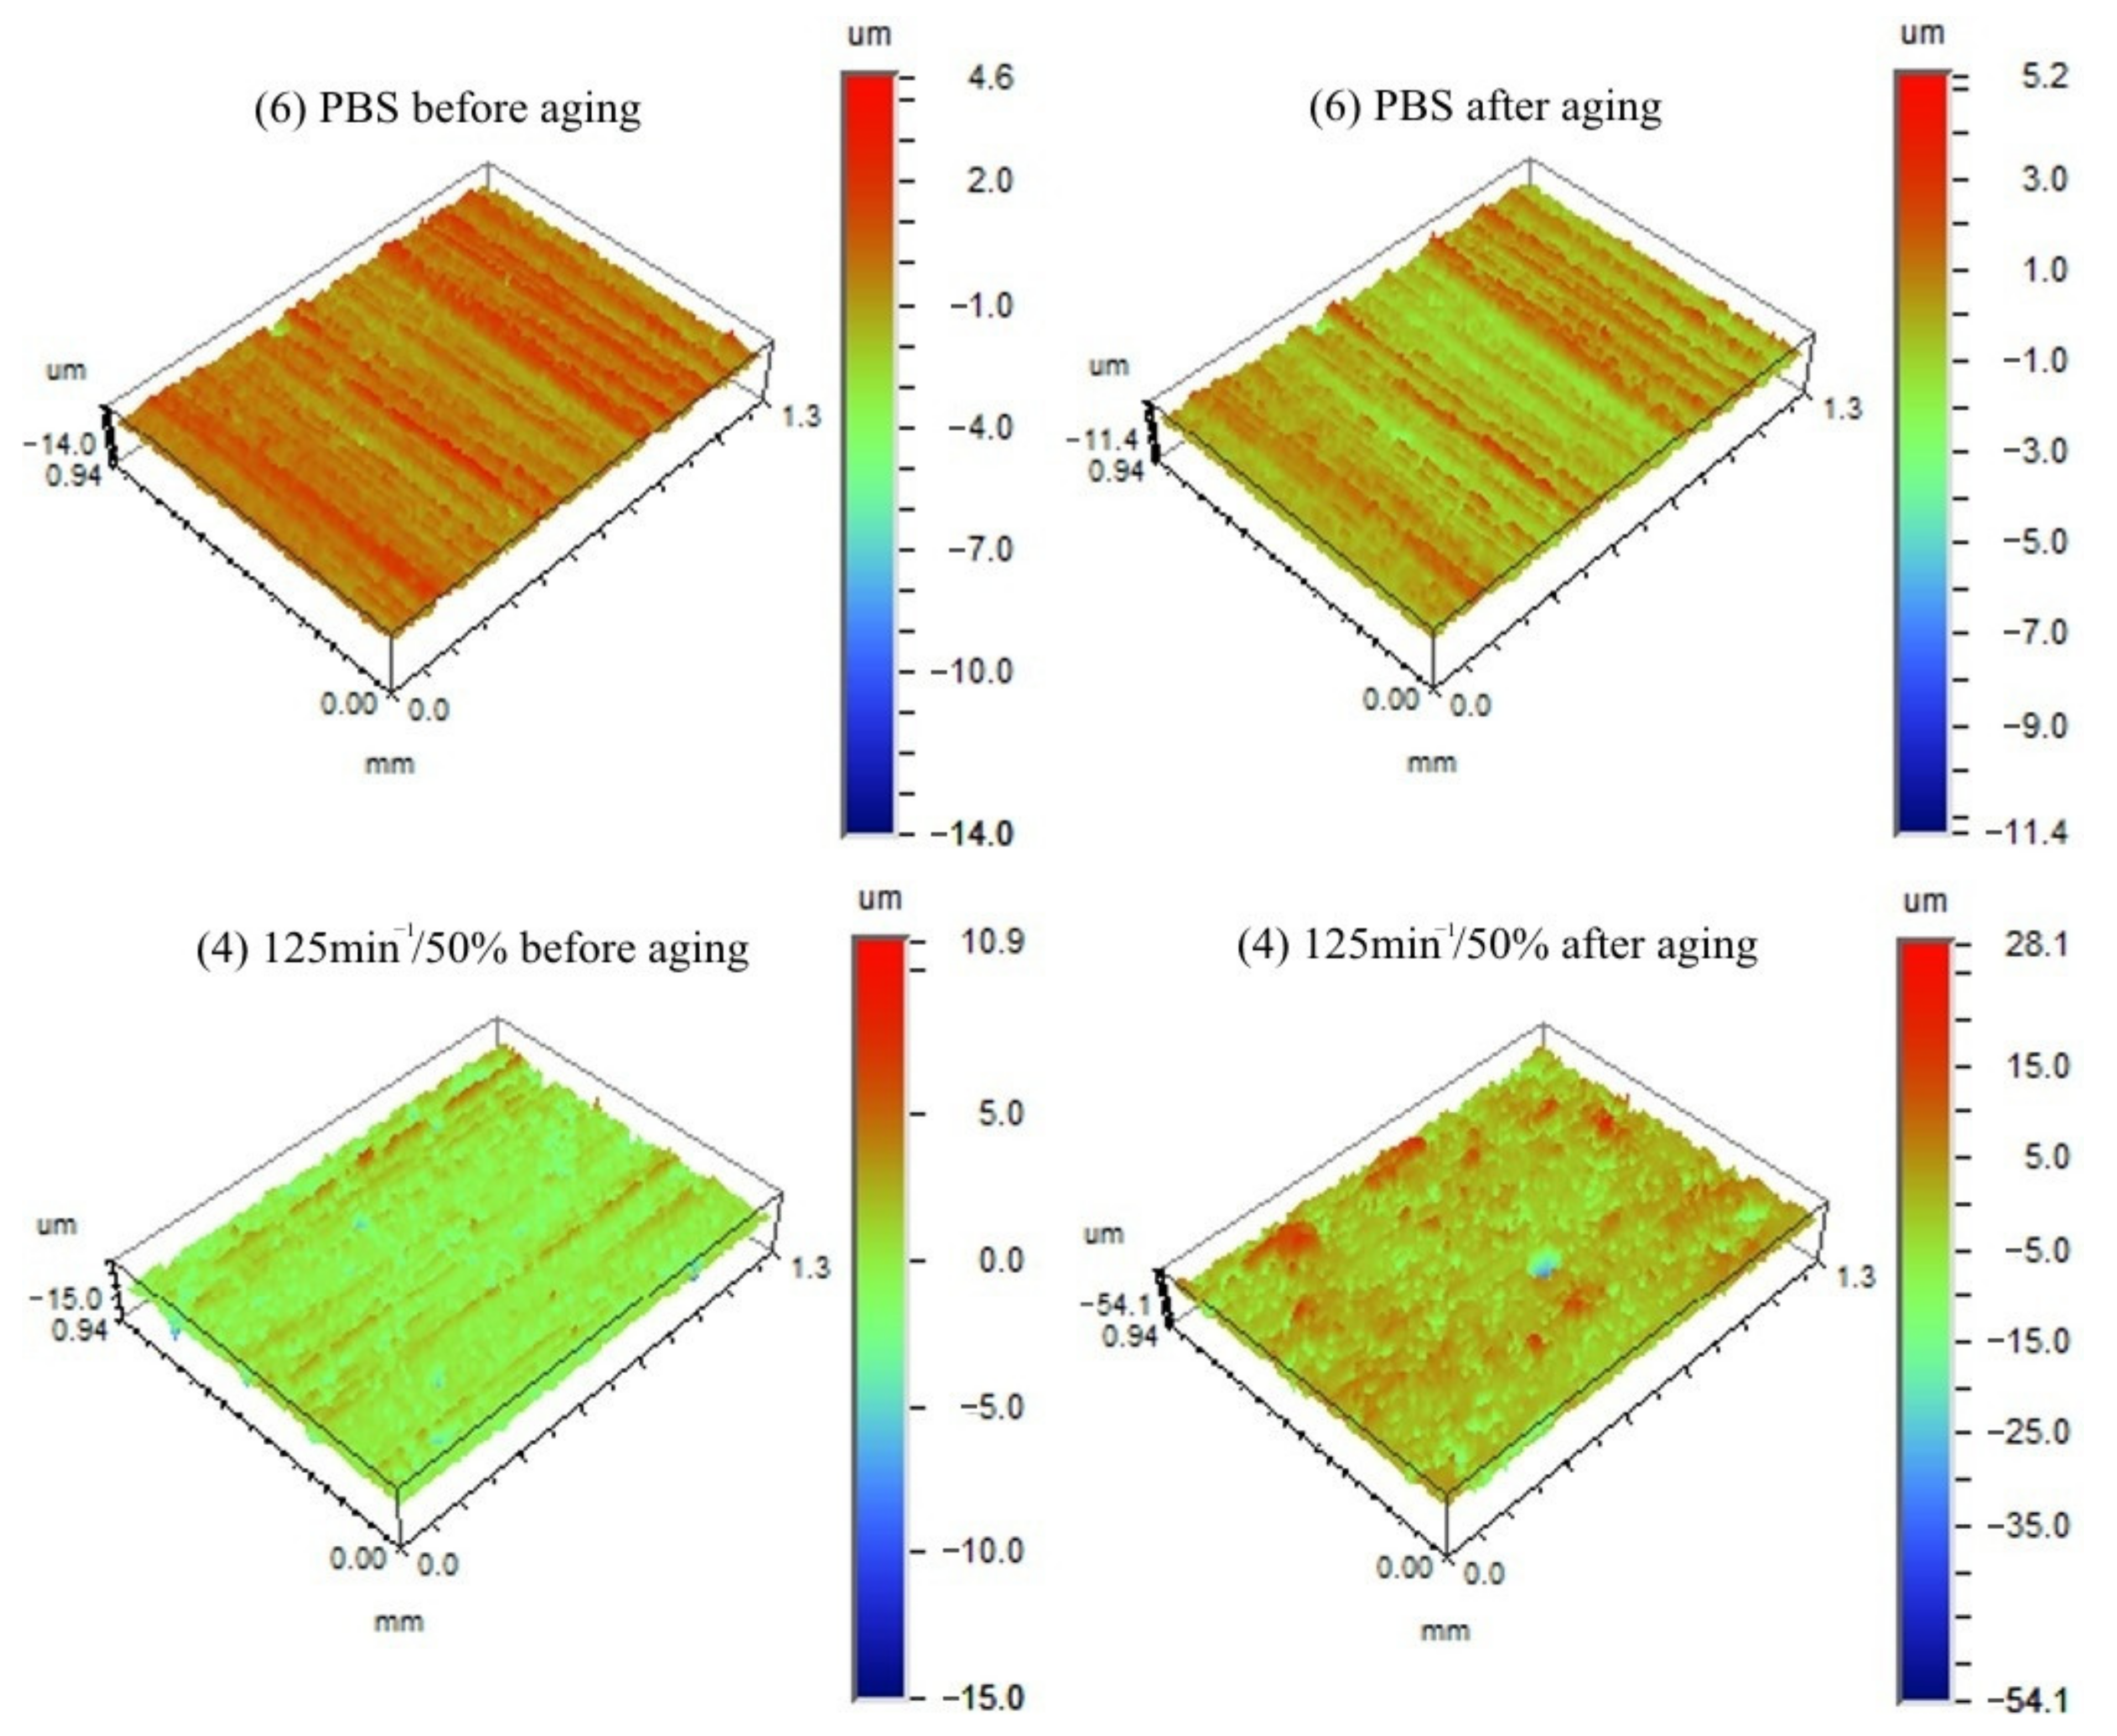
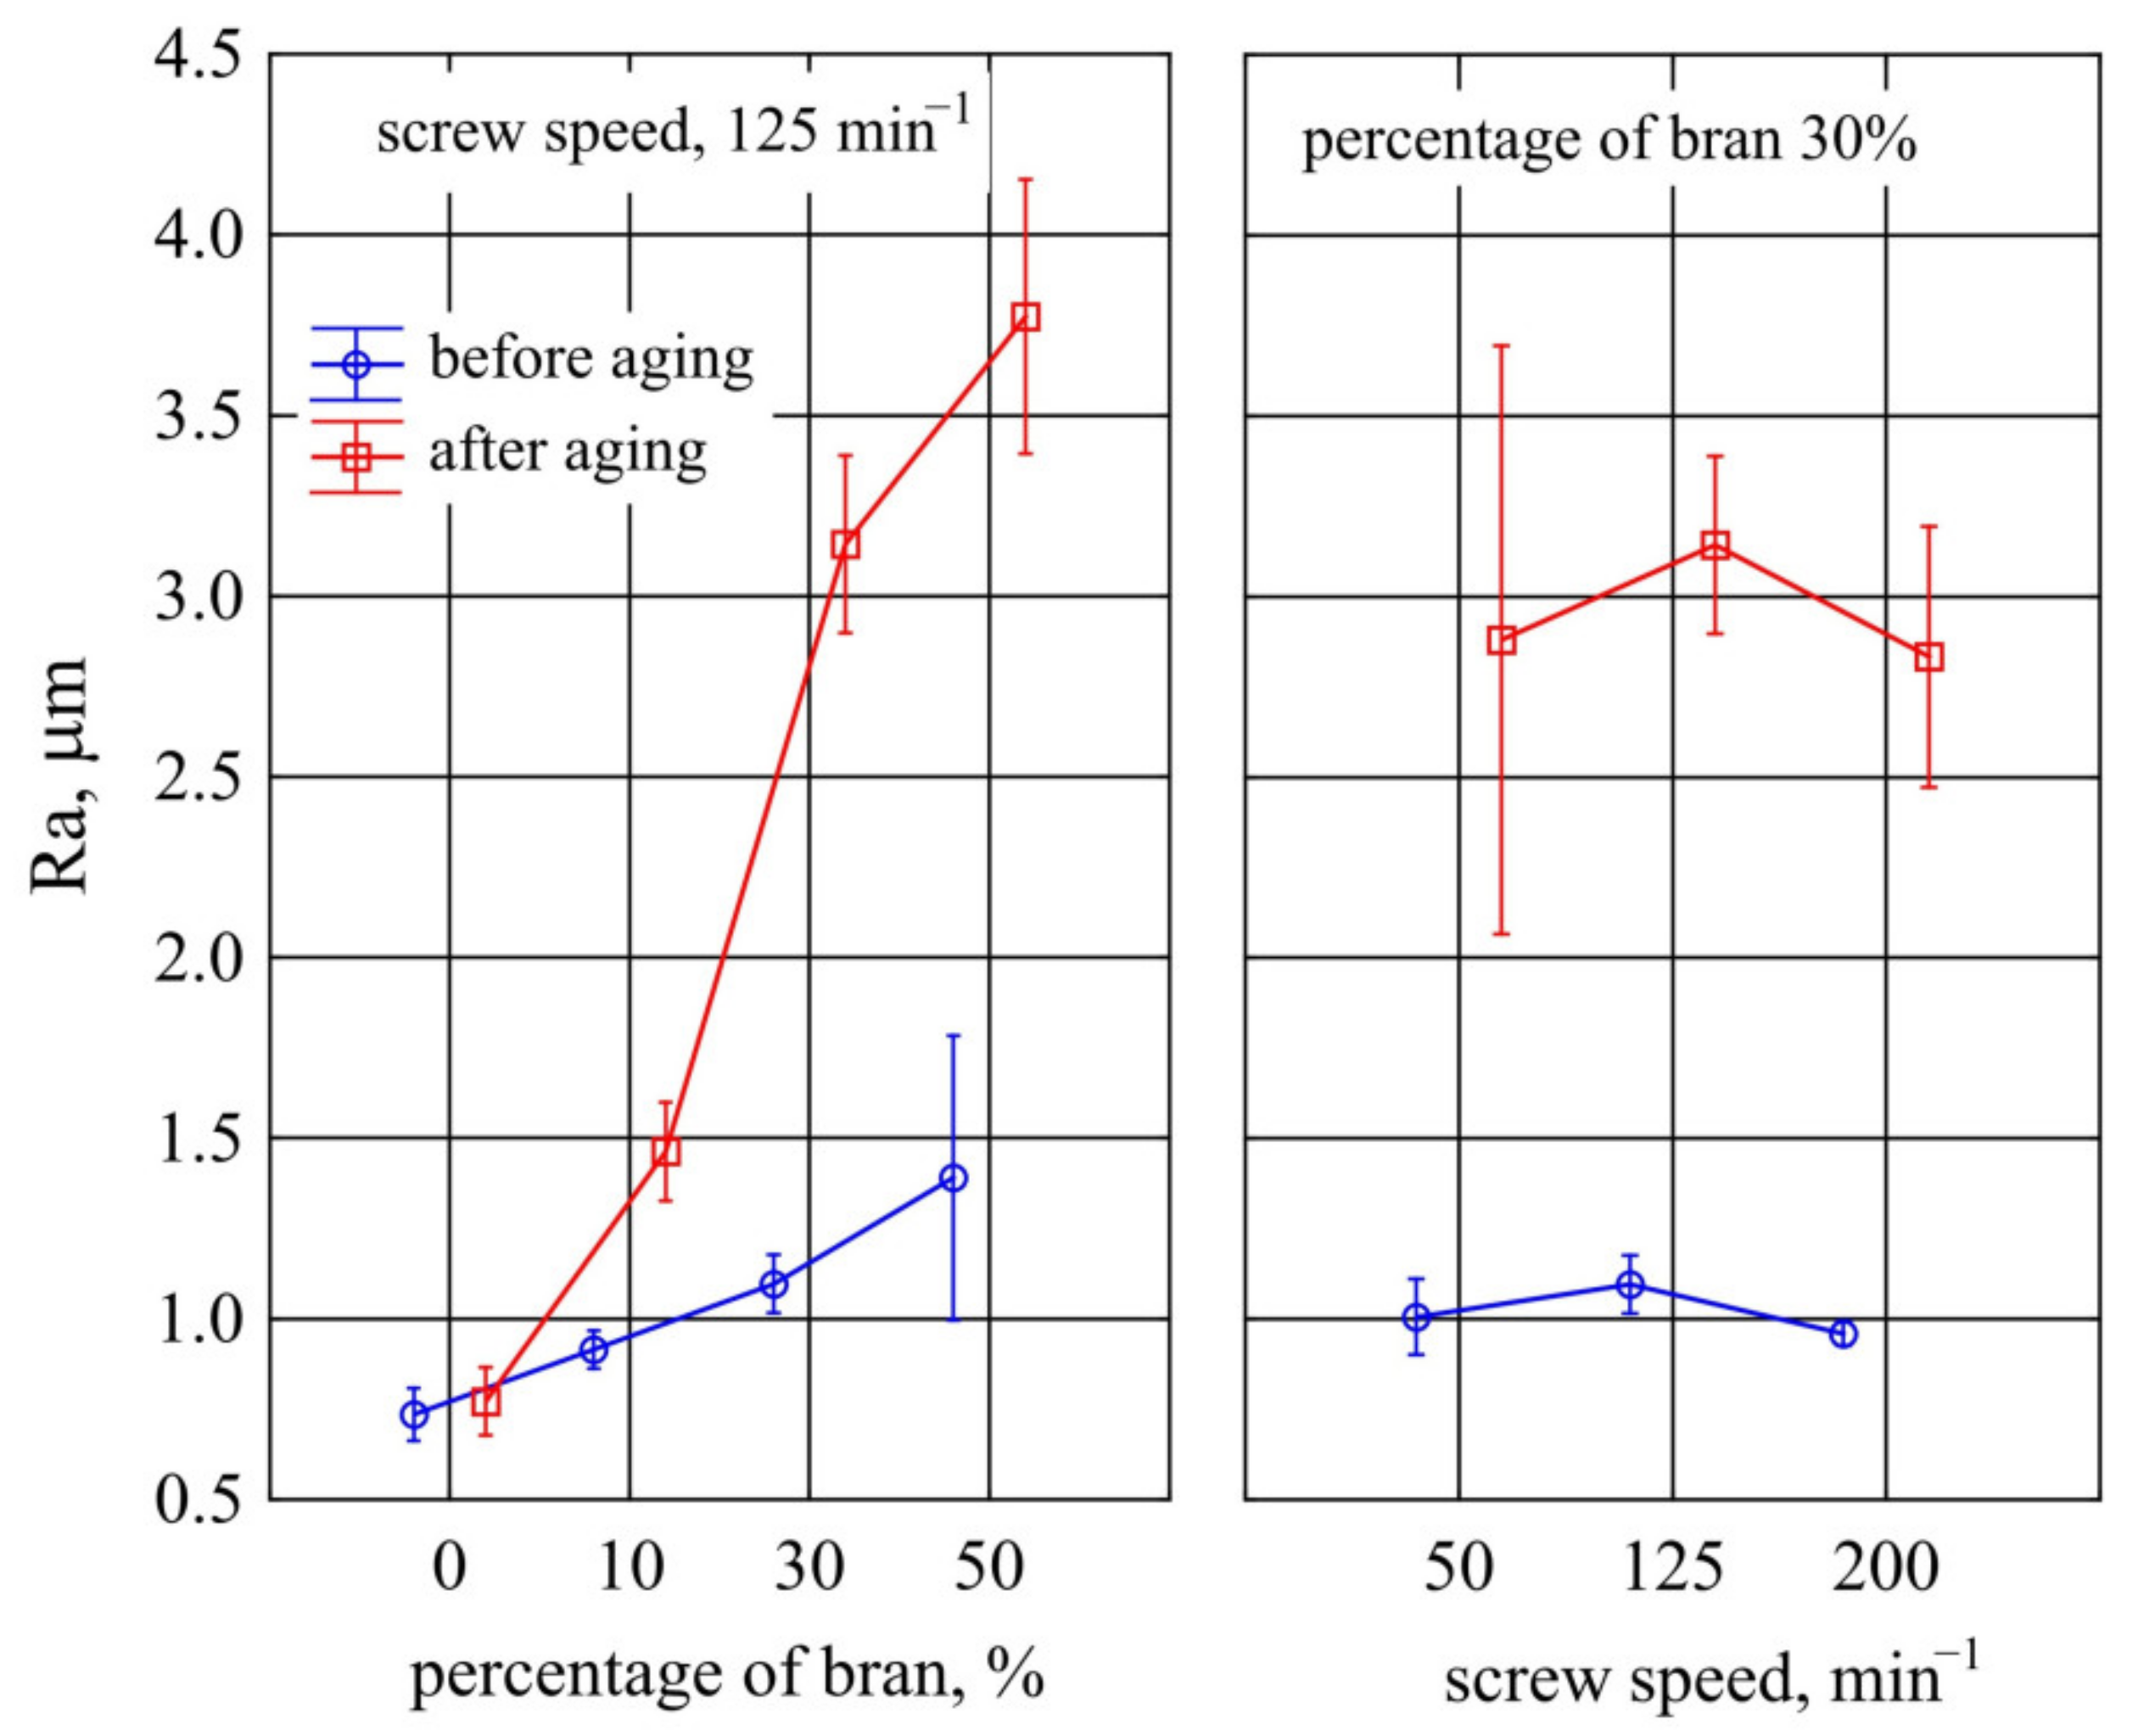
- The roughness parameters of samples before and after ageing were given on the basis of results obtained from the optical profiler Contur GT (Bruker, Karlsruhe, Germany). Average roughness parameter (Ra) was calculated in accordance with ASME B46.1 [97], with the use of Vision 4.20 software. Measurements were performed at room temperature, the area of 156 µm × 117 µm was scanned in three different places for each sample. After the accelerated ageing test, the exact same sections of the surface of the samples were analysed.
- ◦
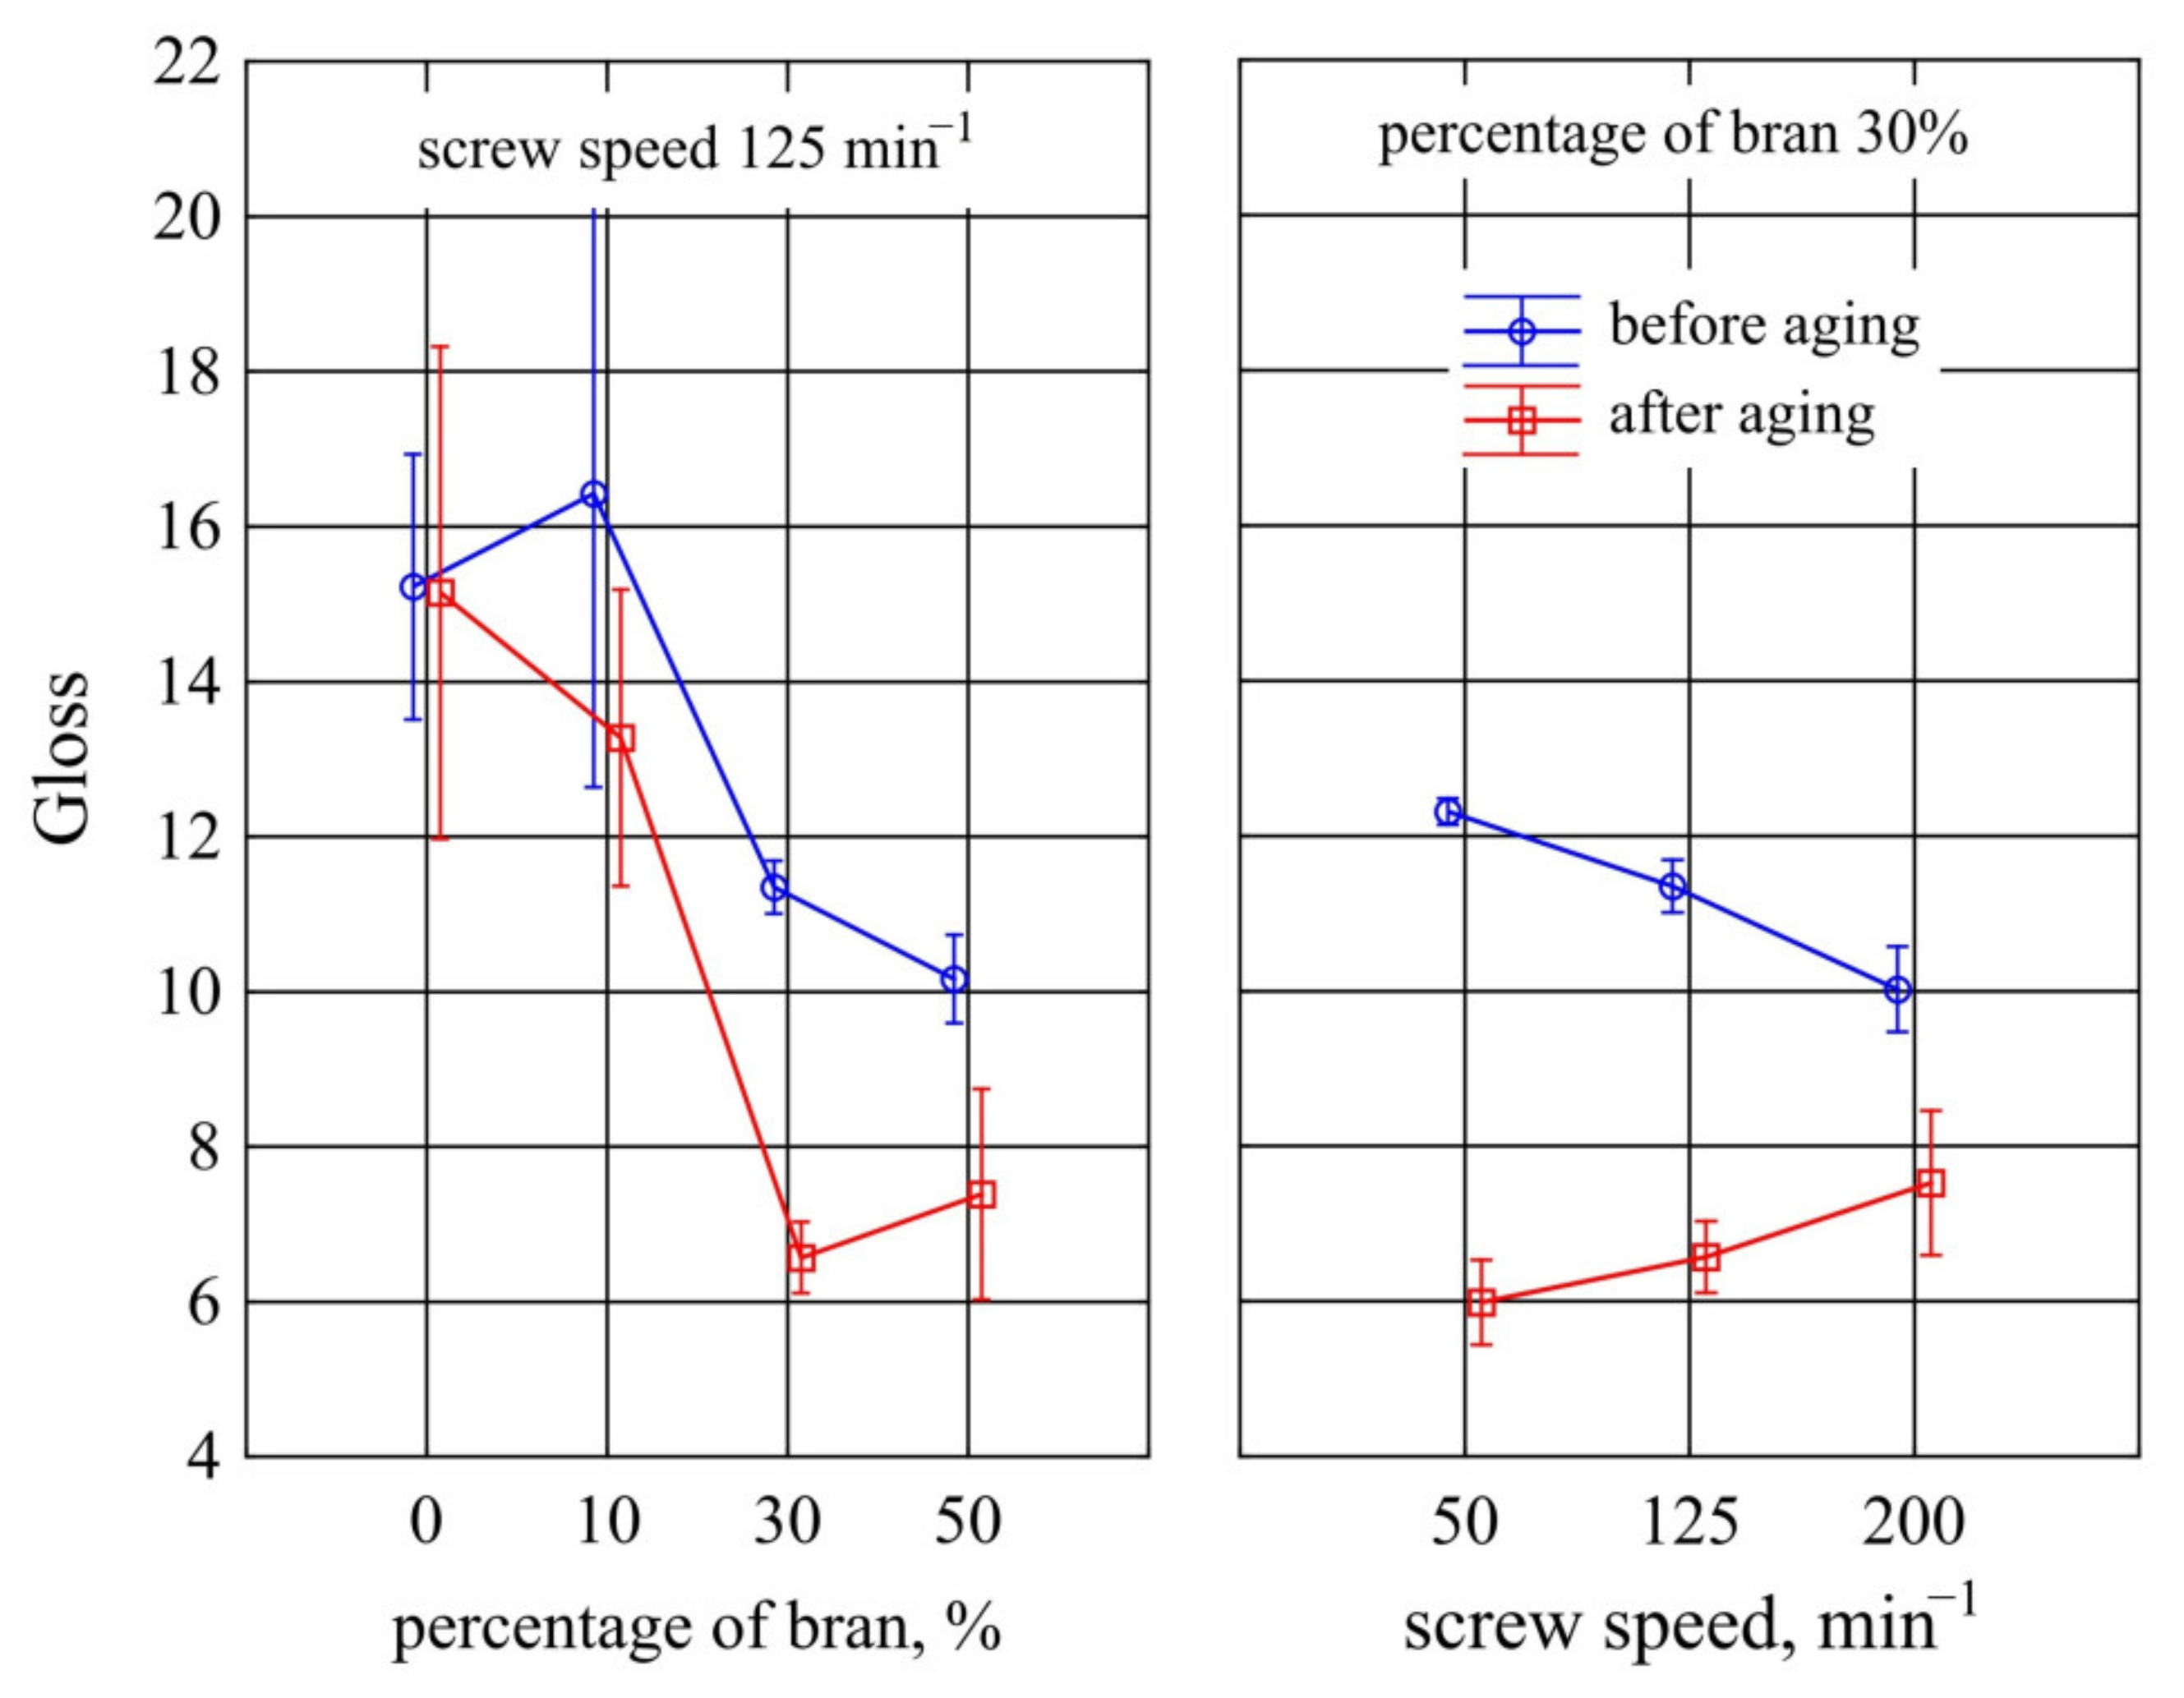
- Measurement of the surface gloss of the samples using an X-Rite Ci4200 spectrophotometer (X-Rite, Grand Rapids, MI, USA), performed in accordance with ISO 2813:2001 [98] at the 60° image slit opening angle for the light source and receiver.
- ◦
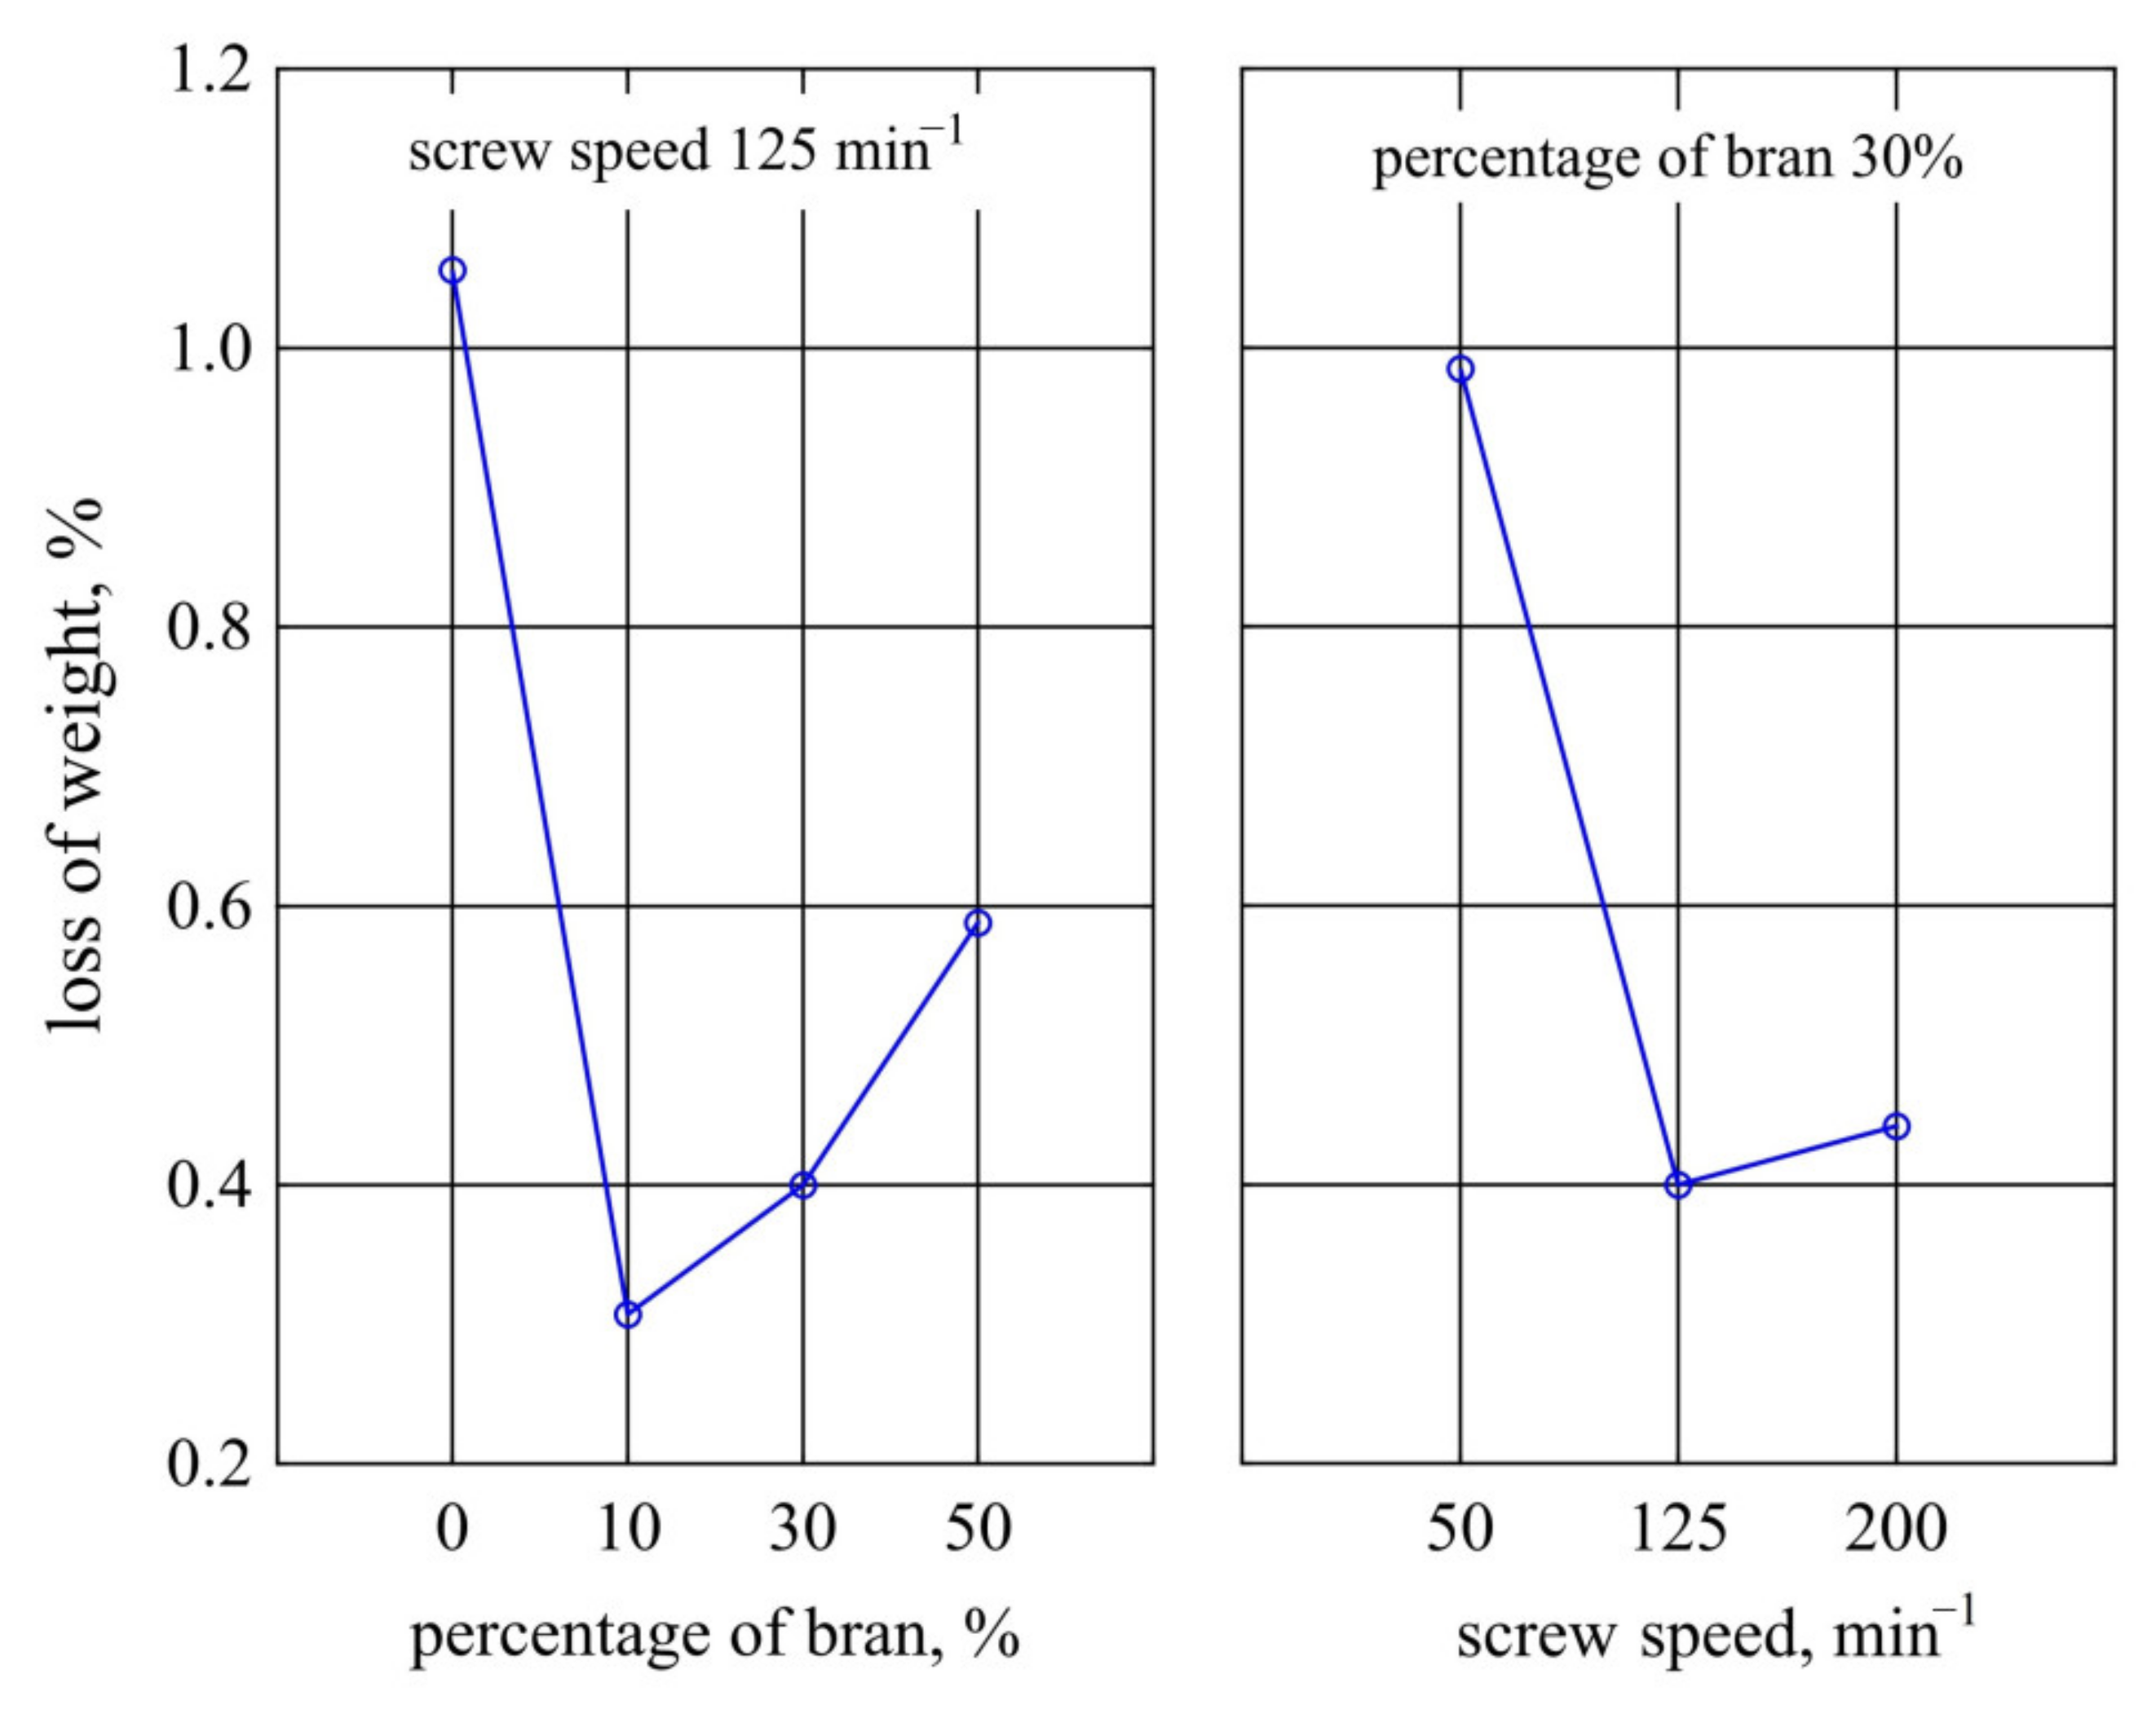
- Weight loss measurements, determined as the percentage difference between the initial weight of dry samples and the weight of dry samples after completion of the accelerated ageing cycle;
- ◦
- Hardness test using ball indentation method. The measurement was carried out in accordance with ISO 2039-1:2004 [99] using an HPK 8411 hardness tester with a ball-shaped indenter of 5 ± 0.025 mm diameter.
- ◦
- Shore D hardness test was performed as per ISO 868:2003 [100] with the use of Shore durometer model ART.13 by Affri System (Induno Olona, Italy) with a cone-shaped indenter with a rounded tip.
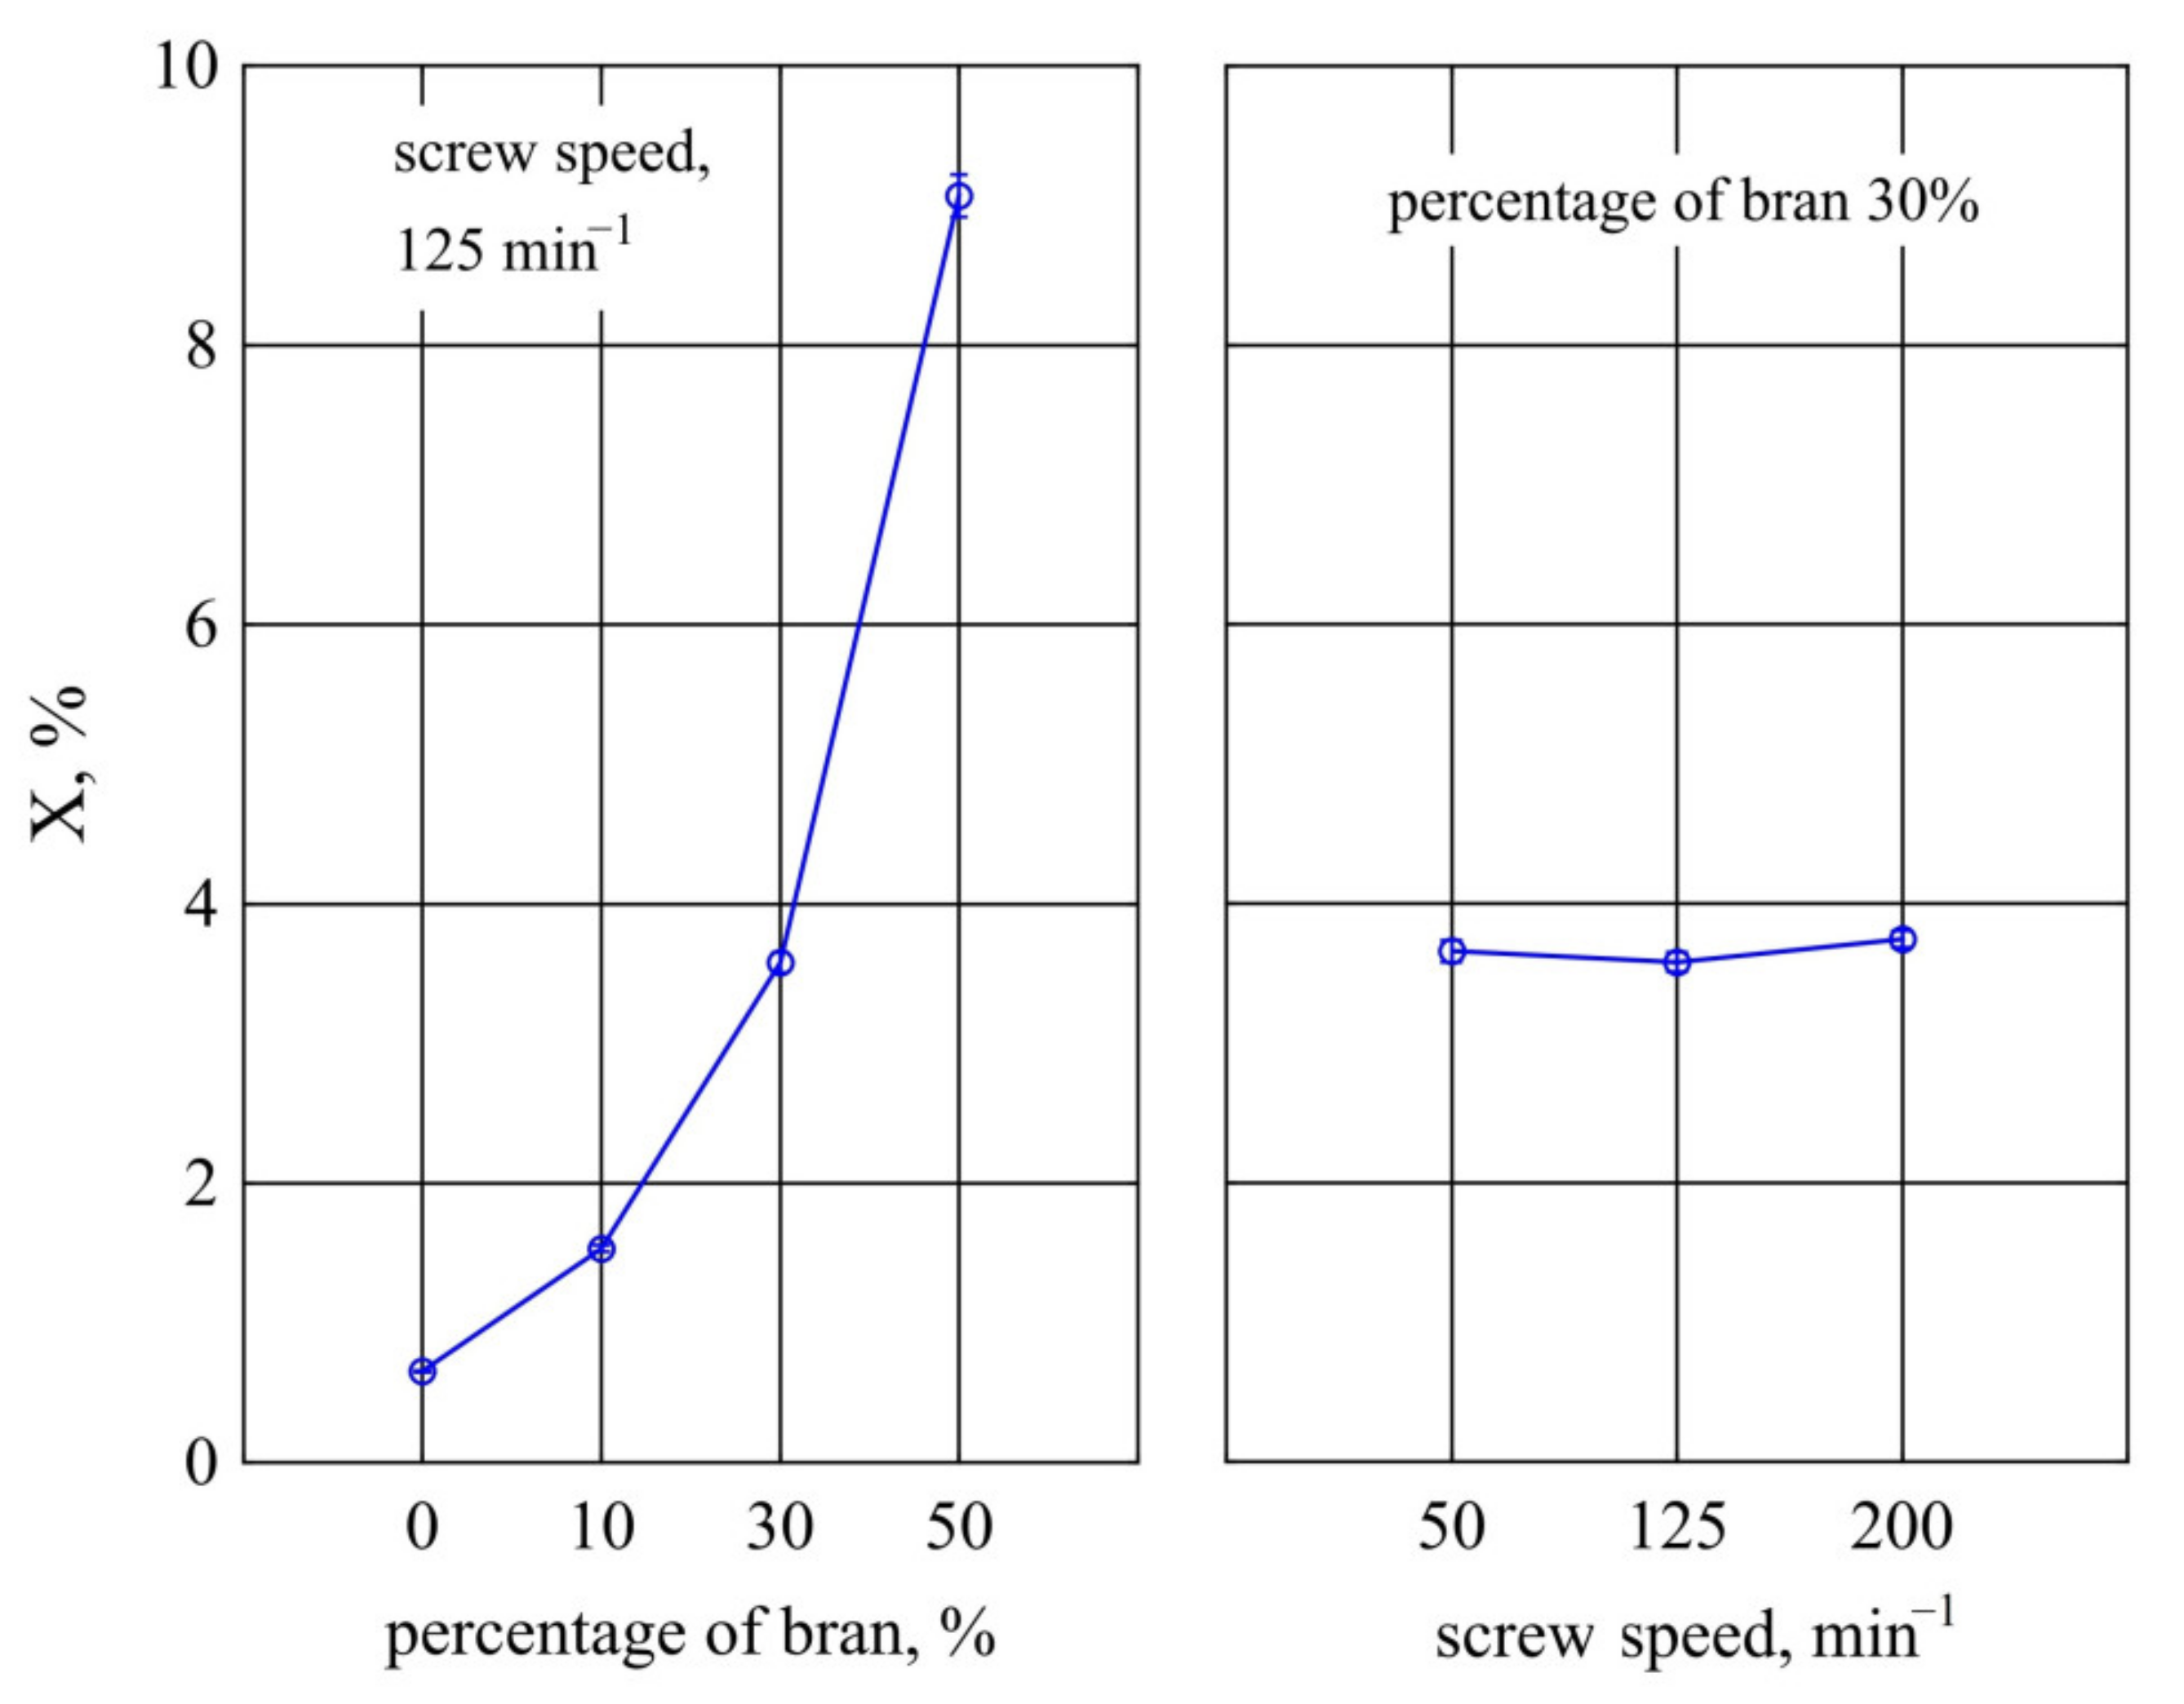
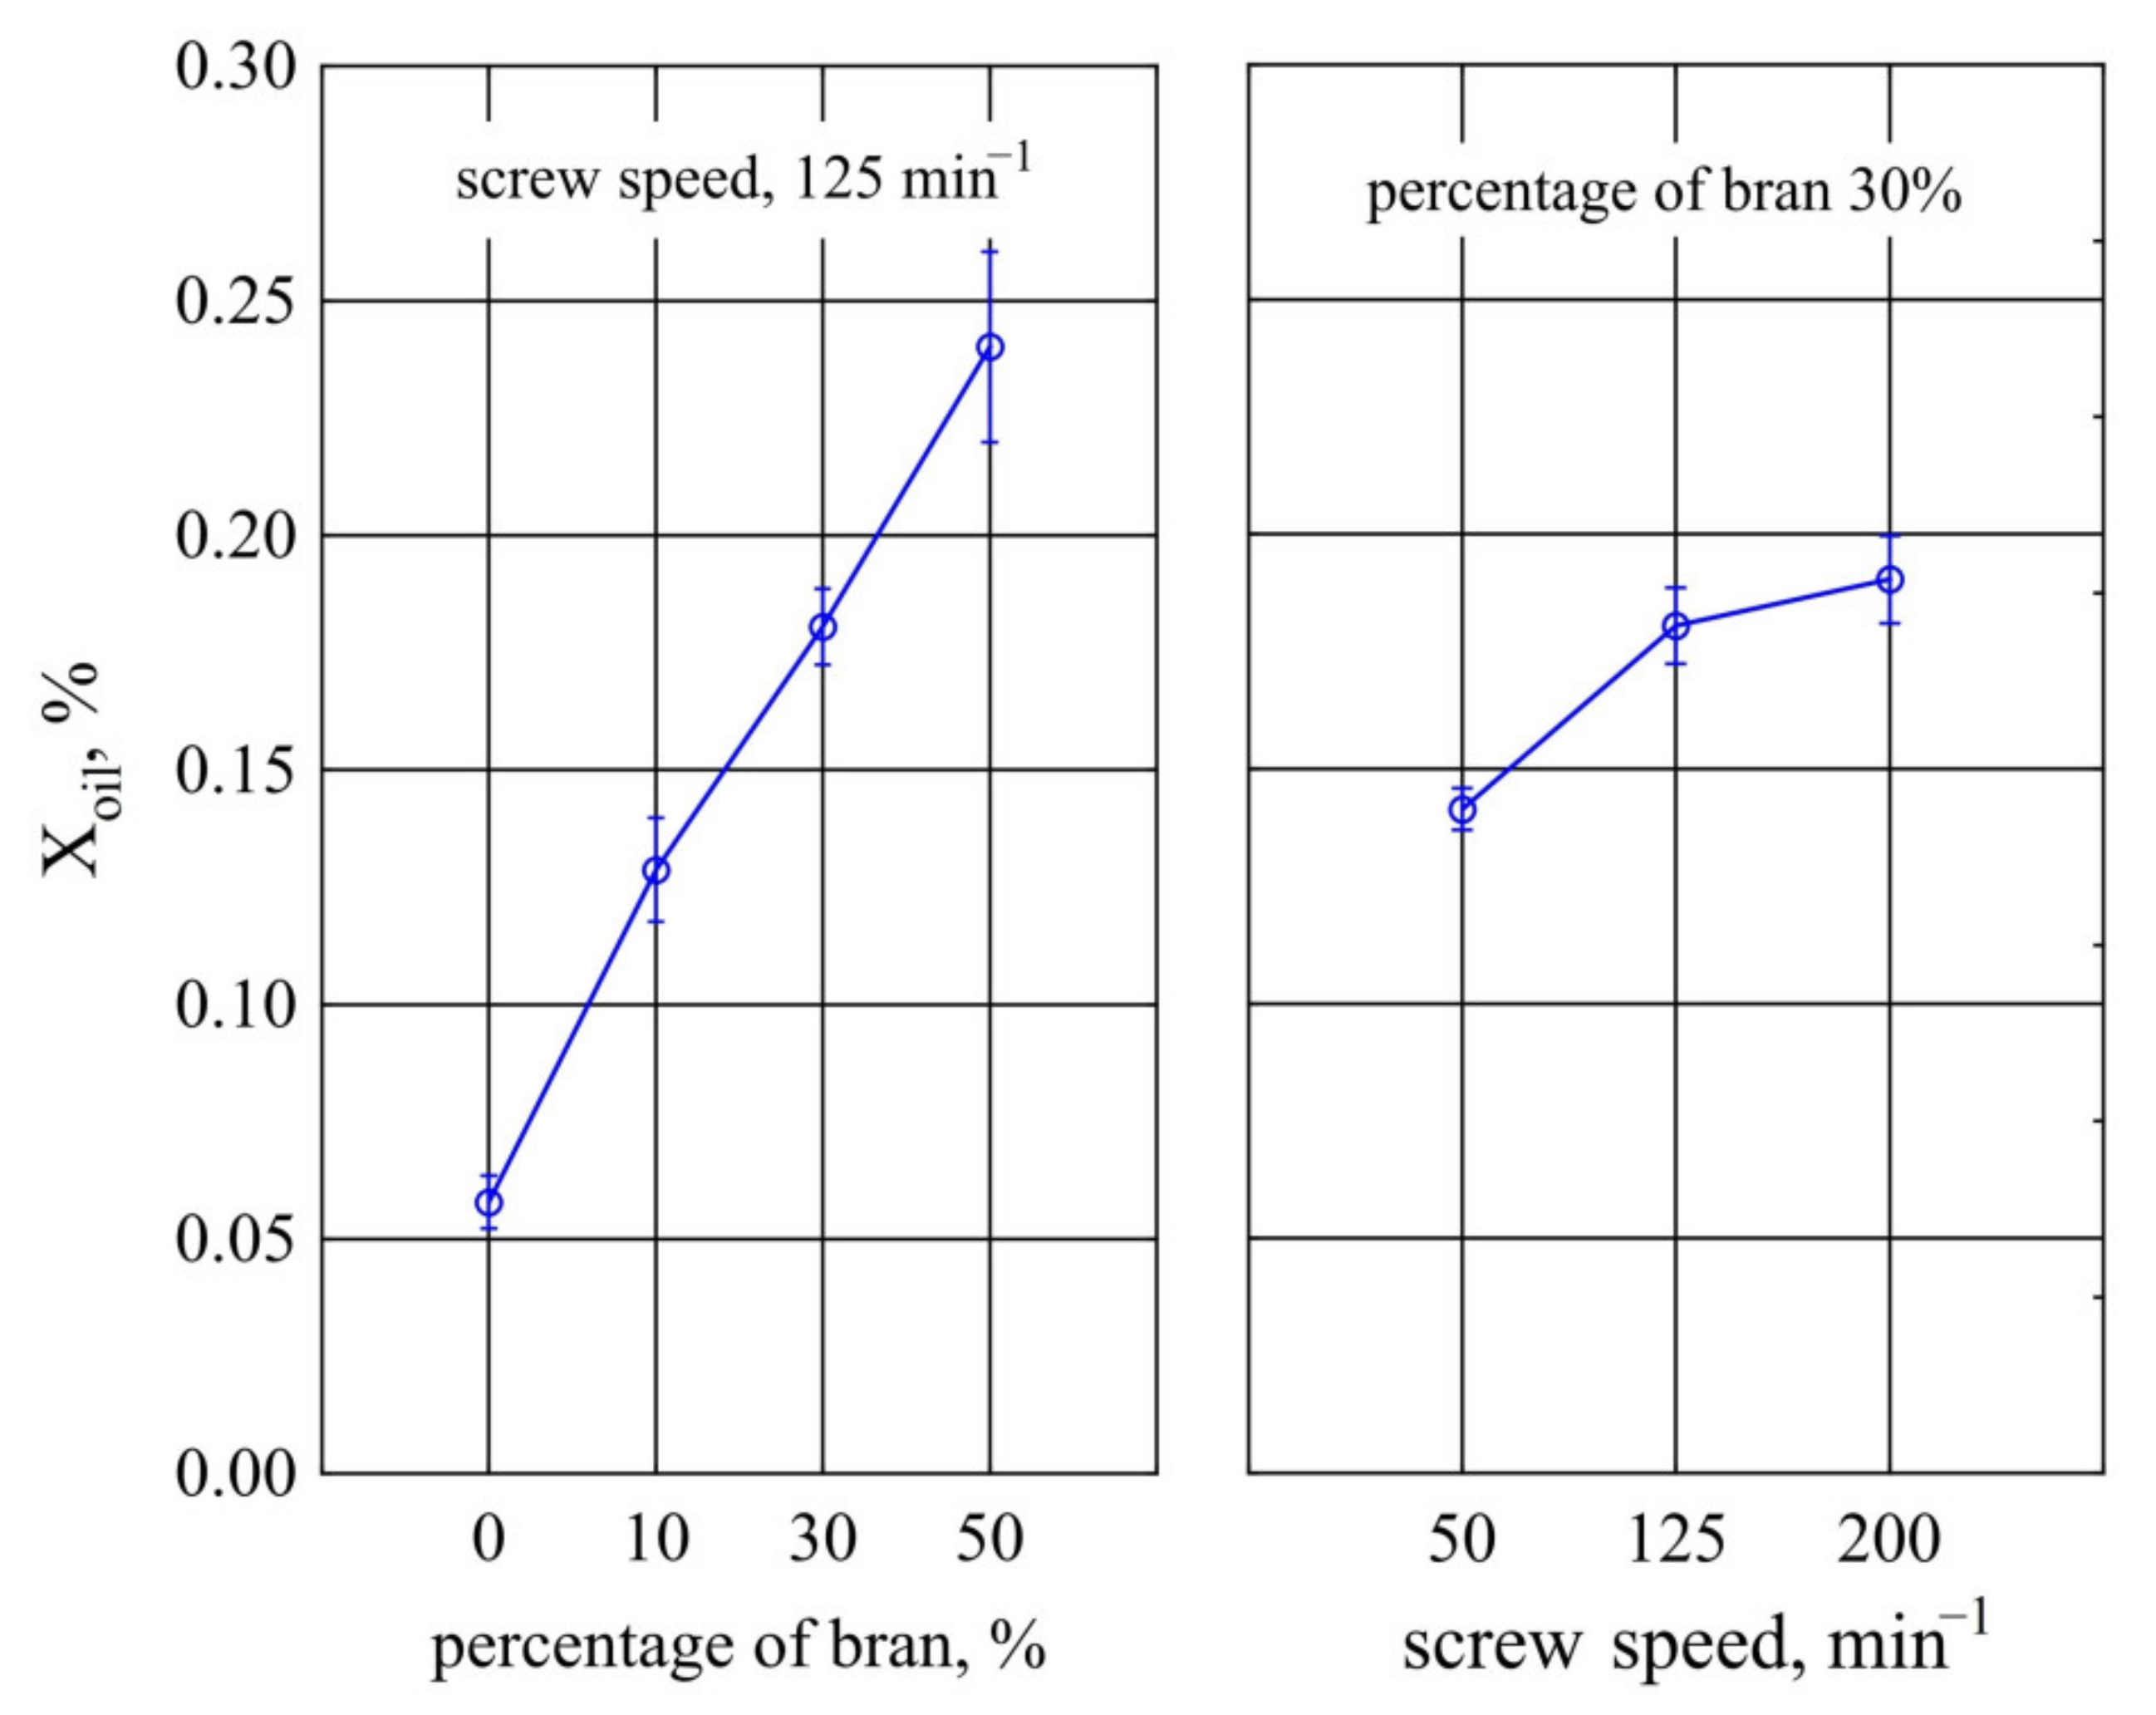
- Assessing the absorption of polar and non-polar fluids. The tested biocomposite samples were completely immersed in water and vegetable oil for 7 days. The percentage difference in mass and linear dimensions after immersion and before immersion in the fluid was then specified to determine the values of fluid absorption and swelling. The test procedure was in accordance with ISO 175:2010 [101];
- The chemical resistance of PBS and its biocomposites was assessed in 1 M solution of NaOH and 1 M solution of HCl at room temperature. The test consisted in placing the samples (10 mm × 10 mm × 4 mm) dried to constant weight in glass bottles containing the above-mentioned solutions. The samples were taken out from solutions at specified intervals, dried on blotting paper and then weighed. The percent change of the mass was calculated according to the equation:where m is the final mass of the sample; m0—is the initial mass of the sample.
- Laboratory biodegradation tests conducted under controlled conditions as per ISO 20200:2015 [102]. Samples were placed in separate polypropylene bioreactors filled with commercially available compost from a local waste management facility. Then the bioreactors were placed in a climate chamber with a temperature of 58 °C and air humidity of 60%. At the intervals specified in the standard, water was replenished in the bioreactors and the compost was homogenized. After fixed incubation periods of 7, 14, 21, 28, 42, 56, and 70 days, respectively, the samples were extracted, washed, dried to constant weight, and weighed. On the basis of mass measurements, its loss was determined, which is an indicator of biodegradation rate.
3. Results
3.1. Accelerated Artificial Ageing
3.1.1. Chemical Structure
3.1.2. Differential Scanning Calorimetry
3.1.3. Transverse Shrinkage
3.1.4. Thermal Resistance
3.1.5. Colour
3.1.6. Surface Roughness
3.1.7. Gloss
3.1.8. Weight Loss
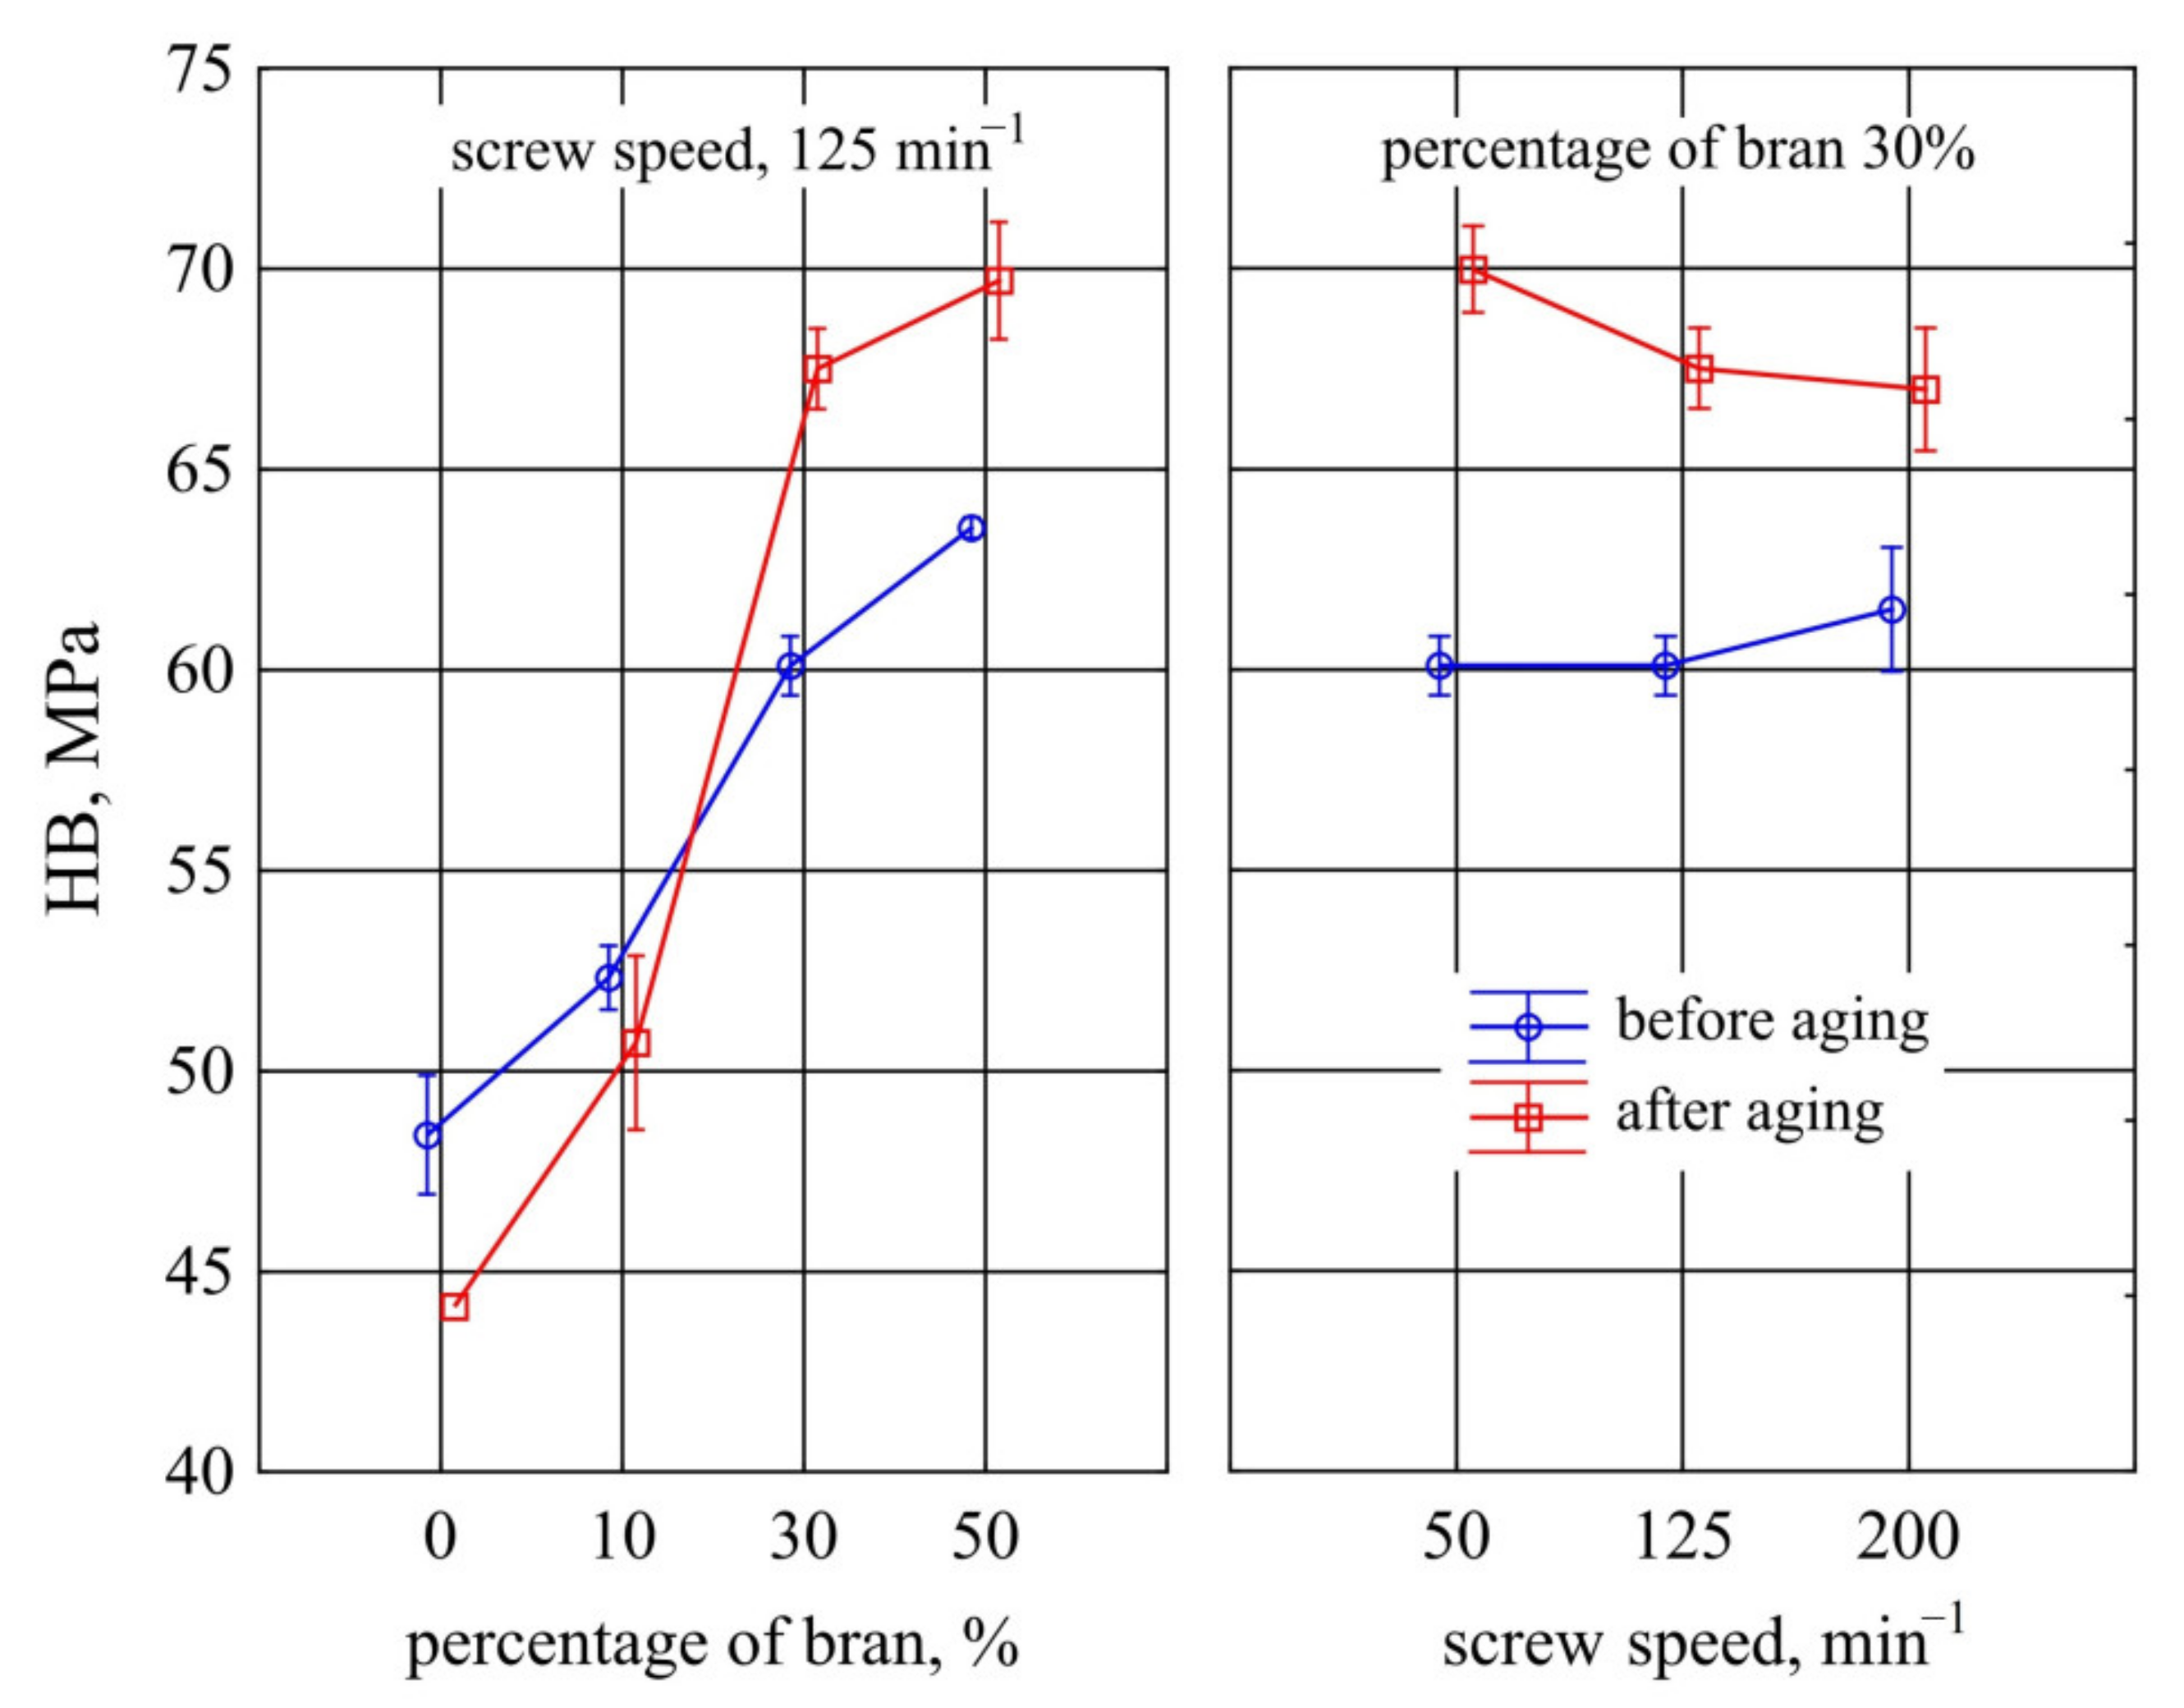
3.1.9. Hardness
3.2. Absorption of Polar and Non-Polar Fluids
3.2.1. Water Absorption
3.2.2. Oil Absorption
3.3. Chemical Resistance
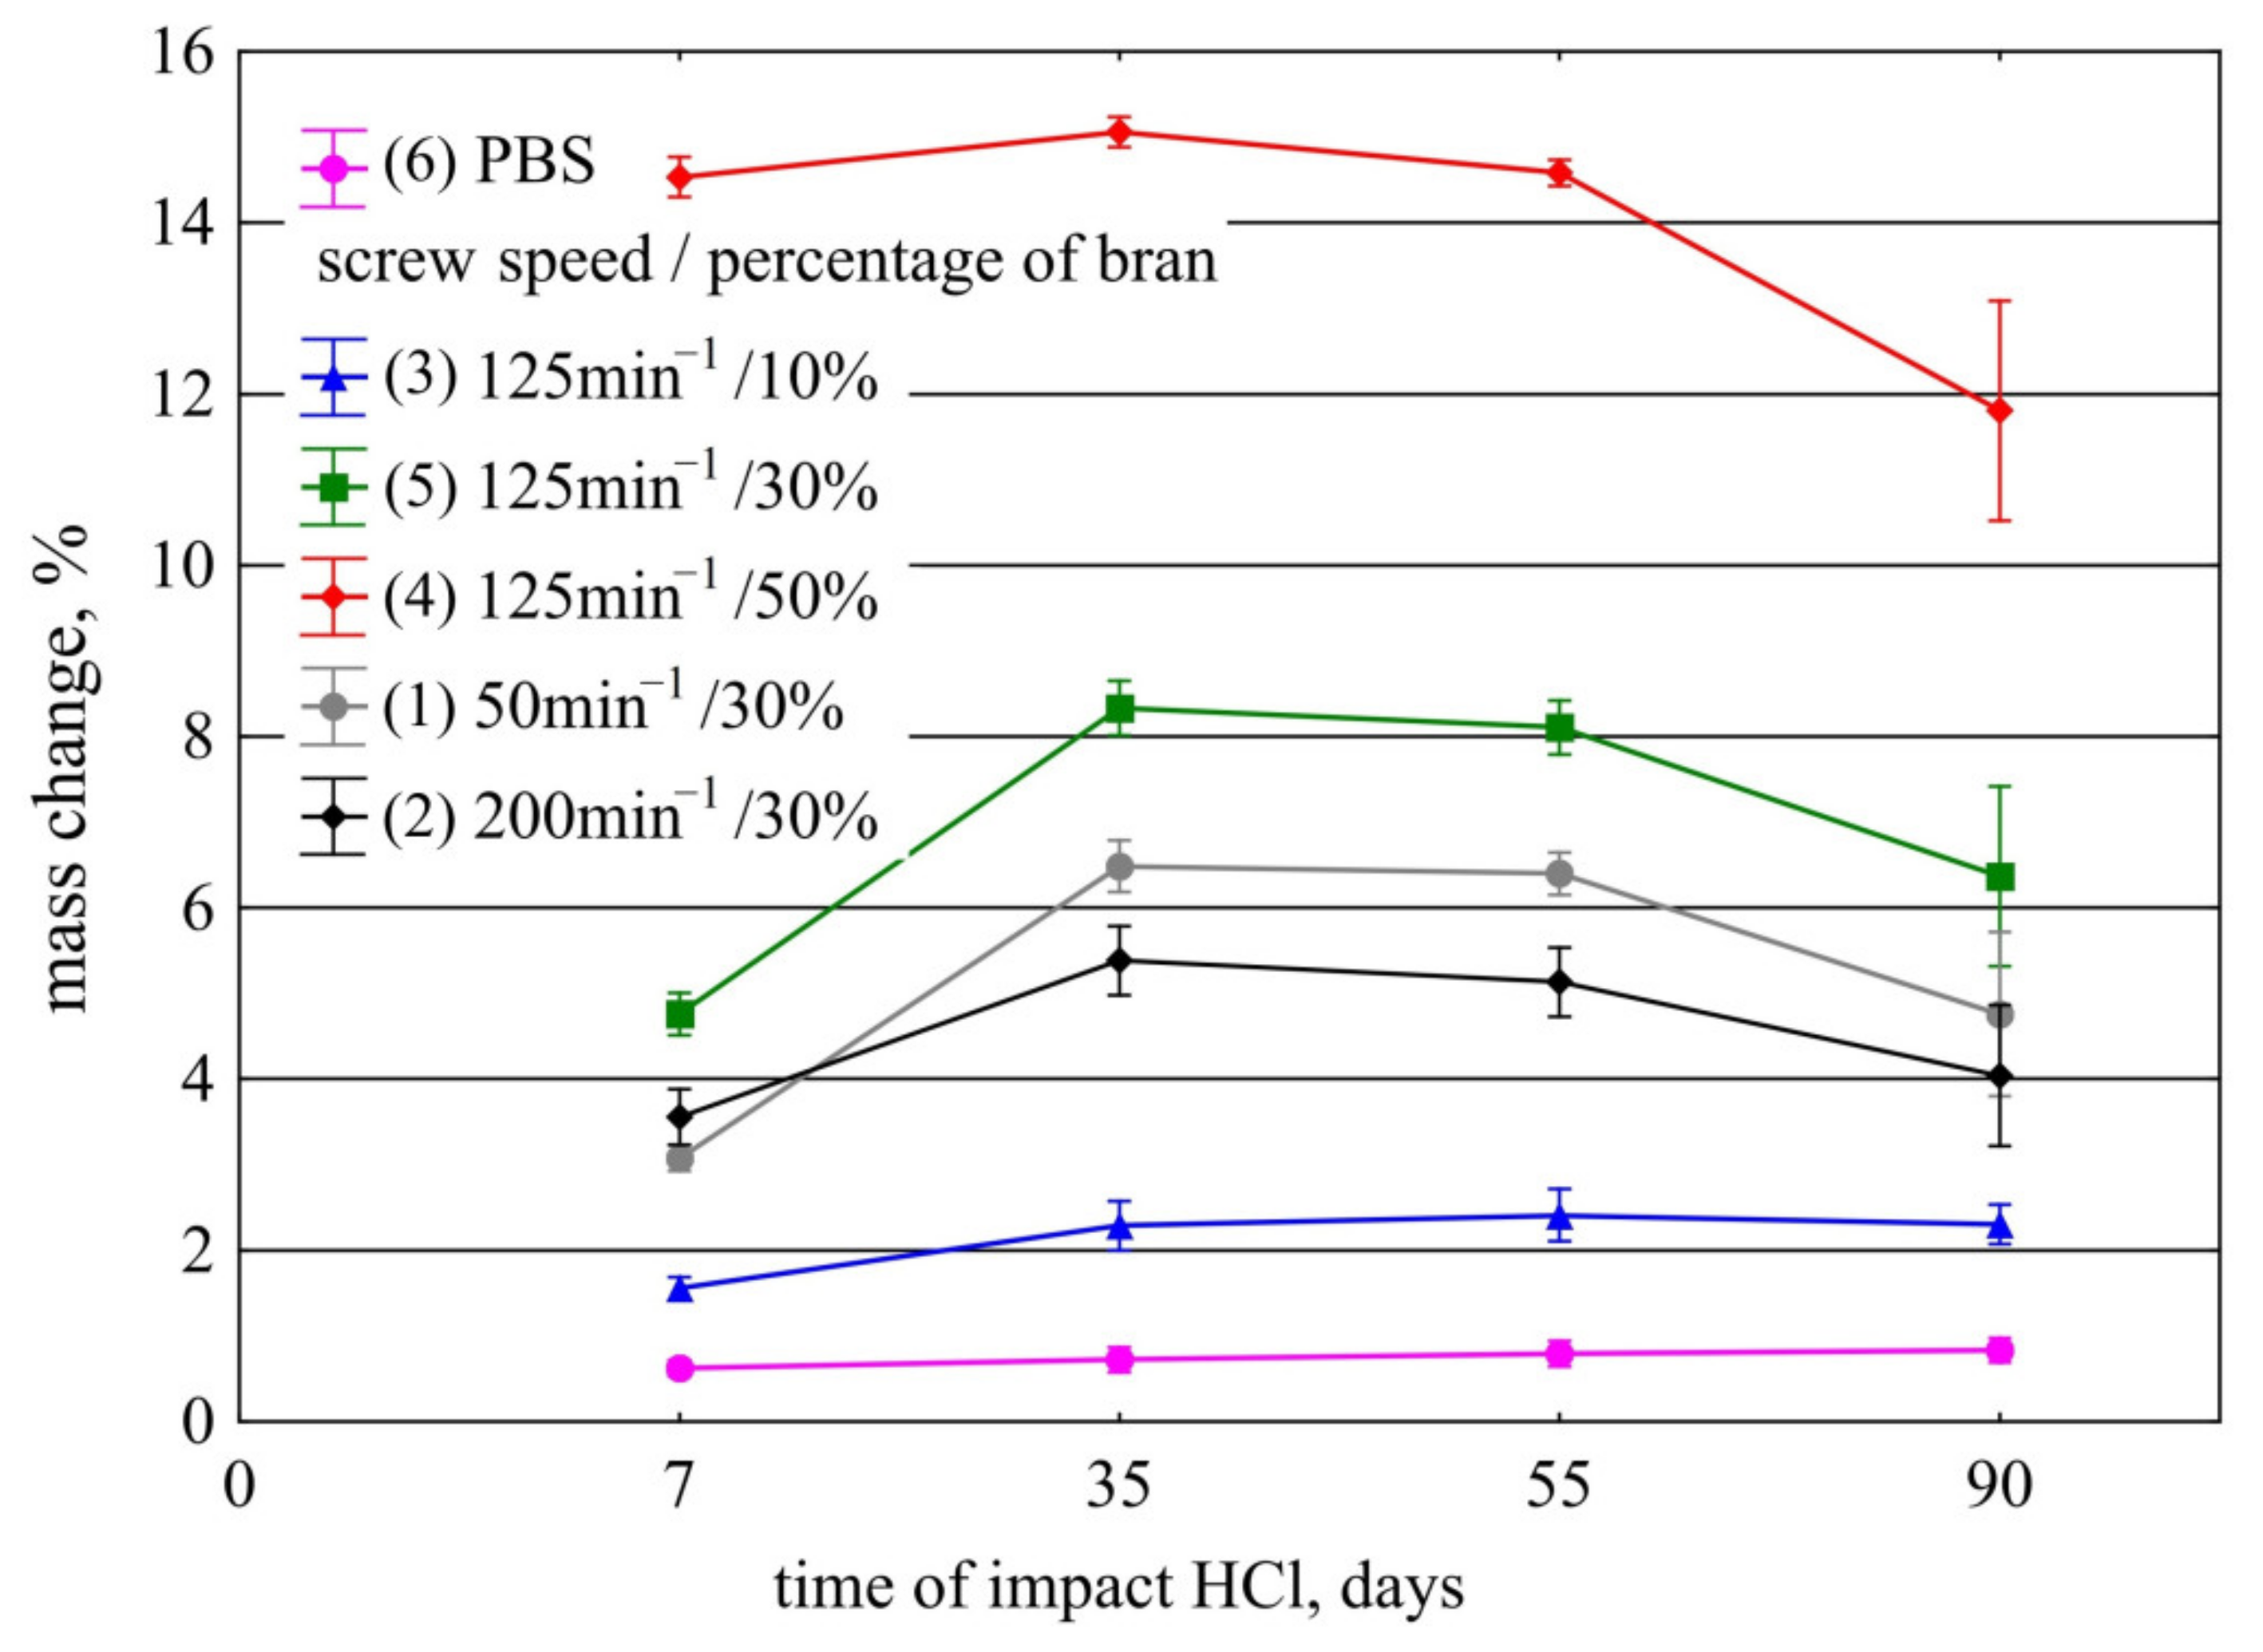
3.3.1. Resistance to Acids
3.3.2. Resistance to Bases
3.4. Biodegradation in Compost
4. Conclusions
Author Contributions
Funding
Institutional Review Board Statement
Informed Consent Statement
Data Availability Statement
Conflicts of Interest
Abbreviations
| PBS | Poly(butylene succinate) |
| WB | Wheat bran |
| UV | Ultraviolet |
| LCF | Lignocellulosic filler |
| u | Wheat bran content |
| n | Extruder screw rotational speed |
| FTIR | Fourier transform infrared (spectroscopy) |
| DSC | Differential scanning calorimetry |
| Xc | Degree of crystallinity |
| ΔHm | Melting enthalpy |
| Tm | Melting point |
| Tc | Crystallization temperature |
| Tg | Glass transition temperature |
| TG | Thermogravimetry |
| DTG | Derivative thermogravimetry |
| T5%, T50% | Temperature of 5% and 50% of mass loss |
| Tmax | Temperature of the maximum rate of mass loss |
| Δm | Mass loss corresponding to Tmax |
| Rm | Residual mass |
| L* | Luminance/brightness |
| a* | Colour from green to red |
| b* | Colour from blue to yellow |
| ΔE | Difference between the two colors |
| Ra | Average roughness parameter |
| Ejc | Specific energy consumption |
| p-v-T | Relationship between pressure p, specific volume v and temperature T |
| HB | Ball indentation hardness |
| H | Shore D hardness |
| X | Water absorption |
| SW | Swelling |
| XOil | Oil absorption |
References
- Babu, R.P.; O’Connor, K.; Seeram, R. Current progress on bio-based polymers and their future trends. Prog. Biomater. 2013, 2, 8. [Google Scholar] [CrossRef] [Green Version]
- Hamad, K.; Kaseem, M.; Deri, F. Recycling of waste from polymer materials: An overview of the recent works. Polym. Degrad. Stab. 2013, 98, 2801–2812. [Google Scholar] [CrossRef]
- Muniyadi, M.; Yit Siew Ng, T.; Munusamy, Y.; Xian Ooi, Z. Mimusops elengi seed Shell powder as a new bio-filler for polypropylene-based bio-composites. Bioresources 2018, 13, 272–289. [Google Scholar] [CrossRef] [Green Version]
- Danso, D.; Chow, J.; Streit, W.R. Plastics: Environmental and biotechnological perspectives on microbial degradation. Appl. Environ. Microbiol. 2019, 85, e01095-19. [Google Scholar] [CrossRef] [PubMed] [Green Version]
- Väisänen, T.; Das, O.; Tomppo, L. A review on new bio-based constituents for natural fiber-polymer composites. J. Clean. Prod. 2017, 149, 582–592. [Google Scholar] [CrossRef]
- Vilaplana, F.; Strömberg, E.; Karlsson, S. Environmental and resource aspects of sustainable biocomposites. Polym. Degrad. Stab. 2010, 95, 2147–2161. [Google Scholar] [CrossRef]
- Korol, J.; Burchart-Korol, D.; Pichlak, M. Expansion of environmental impact assessment for eco-efficiency evaluation of biocomposites for industrial application. J. Clean. Prod. 2016, 113, 144–152. [Google Scholar] [CrossRef]
- Nielsen, T.D.; Hasselbalch, J.; Holmbetg, K.; Stripple, J. Politics and the plastic crisis: A review throughout the plastic life cycle. WIREs Energy Environ. 2020, 9, e360. [Google Scholar] [CrossRef] [Green Version]
- De Oliveira, C.C.N.; Zotin, M.Z.; Rochedo, P.R.R.; Szklo, A. Achieving negative emissions in plastics life cycles through the conversion of biomass feedstock. Biofuels Bioprod. Biorefin. 2021, 15, 430–453. [Google Scholar] [CrossRef]
- Aretoulaki, E.; Ponis, S.; Plakas, G.; Agalianos, K. Marine plastic littering: A review of socio economic impacts. J. Sustain. Sci. Manag. 2021, 16, 276–300. [Google Scholar] [CrossRef]
- Syberg, K.; Nielsen, M.B.; Clausen, L.P.W.; van Calster, G.; van Wezel, A.; Rochman, C.; Koelmans, A.A.; Cronin, R.; Pahl, S.; Hanses, S.F. Regulation of plastic from a circular economy perspective. Curr. Opin. Green Sustain. Chem. 2021, 29, 100462. [Google Scholar] [CrossRef]
- Sheldon, R.A.; Norton, M. Green chemistry, and the plastic pollution challenge: Towards a circular economy. Green Chem. 2020, 22, 6310–6322. [Google Scholar] [CrossRef]
- Xanthos, D.; Walker, T.R. International policies to reduce plastic marine pollution from single-use plastics (plastic bags and microbeads): A review. Mar. Pollut. Bull. 2017, 118, 17–26. [Google Scholar] [CrossRef] [PubMed]
- Jiang, J.Q. Occurrence of microplastics and its pollution in the environment: A review. Sustain. Prod. Consum. 2018, 13, 16–23. [Google Scholar] [CrossRef]
- Wei, L.; McDonald, A.G. A review on grafting of biofibres for biocomposites. Materials 2016, 9, 303. [Google Scholar] [CrossRef] [PubMed]
- Hamad, K.; Kaseem, M.; Ko, Y.G.; Deri, F. Biodegradable polimer blends and composites: An overwiew. Polym. Sci. Ser. A 2014, 56, 812–829. [Google Scholar] [CrossRef]
- Pivsa-Art, W.; Chaiyasat, A.; Pivsa-Art, S.; Yamane, H.; Ohara, H. Preparation of polymer blends between poly(lactic acid) and poly(butylene adipate-co-terephthalate) and biodegradable polymers as compatibilisers. Energy Procedia 2013, 34, 549–554. [Google Scholar] [CrossRef] [Green Version]
- Meeks, D.; Hottle, T.; Bilec, M.M.; Landis, A.E. Compostable biopolymer use in the real world: Stakeholder interviews to better understand the motivations and realities of use and disposal in US. Resour. Conserv. 2015, 105, 134–142. [Google Scholar] [CrossRef] [Green Version]
- Thakur, S.; Chaudhary, J.; Sharma, B.; Verma, A.; Tamulevicius, S.; Thakur, V.K. Sustainability of bioplastics: Opportunities and challenges. Curr. Opin. Green Sustain. Chem. 2018, 13, 68–75. [Google Scholar] [CrossRef] [Green Version]
- Tokiwa, Y.; Calabia, B.P.; Ugwu, C.U.; Aiba, S. Biodegradability of plastics. Mol. Sci. 2009, 10, 3722–3742. [Google Scholar] [CrossRef]
- Artham, T.; Doble, M. Biodegradation of aliphatic and aromatic polycarbonates. Macromol. Biosci. 2007, 8, 14–24. [Google Scholar] [CrossRef]
- Tnag, X.Z.; Kumar, P.; Alavi, S.; Sandeep, K.P. Recent advances in biopolymers and biopolymer-based nanocomposites for food packaging materials. Crit. Rev. Food Sci. Nutr. 2012, 52, 426–442. [Google Scholar] [CrossRef] [PubMed]
- Noorunnisa Khanam, P.; Abdul Khalil, H.P.S.; Ramachandra Reddy, G.; Venkata Naidu, S. Tensile, flexural and chemical resistance properties of sisal fibre reinforced polymer composites: Effect of fibre surface treatment. J. Polym. Environ. 2011, 19, 115–119. [Google Scholar] [CrossRef]
- Krishna Mohan, S.; Srivastava, T. Microbial deterioration and degradation of polymeric materials. J. Biochem. Technol. 2011, 2, 210–215. [Google Scholar]
- Loredo-Treviño, A.; Gutiérrez-Sánchez, G.; Rodríguez-Herrera, R.; Aguilar, C.N. Microbial enzymes involved in polyurethane biodegradation: A review. J. Polym. Environ. 2012, 20, 258–265. [Google Scholar] [CrossRef]
- Pathak, V.M. Review on the current status of polymer degradation: A microbial approach. Bioresour. Bioprecess. 2017, 4, 15. [Google Scholar] [CrossRef]
- Brebu, M. Environmental degradation of plastic composites with natural fillers—A review. Polymers 2020, 12, 166. [Google Scholar] [CrossRef] [PubMed] [Green Version]
- Siracusa, V. Microbial degradation of synthetic biopolymers waste. Polymers 2019, 11, 1066. [Google Scholar] [CrossRef] [PubMed] [Green Version]
- Shah, A.A.; Hasan, F.; Hameed, A.; Ahmed, S. Biological degradation of plastics: A comprehensive review. Biotechnol. Adv. 2008, 26, 246–265. [Google Scholar] [CrossRef] [PubMed]
- Siracusa, V.; Rocculi, P.; Romani, S.; Rosa, M.D. Biodegradable polymers for food packaging: A review. Trends Food Sci. Technol. 2008, 19, 634–643. [Google Scholar] [CrossRef]
- Chamas, A.; Moon, H.; Zheng, J.; Qiu, Y.; Tabassum, T.; Jang, J.H.; Abu-Omar, M.; Scott, S.L.; Suh, S. Degradation rates of plastics in the environment. ACS Sustain. Chem. Eng. 2020, 8, 3494–3511. [Google Scholar] [CrossRef] [Green Version]
- Larché, J.F.; Bussiére, P.O.; Thérias, S.; Gardette, J.L. Photooxidation of polymers: Relating material properties to chemical changes. Polym. Degrad. Stab. 2012, 97, 25–34. [Google Scholar] [CrossRef]
- Singh, B.; Sharma, N. Mechanistic implications of plastic degradation. Polym. Degrad. Stab. 2008, 93, 561–584. [Google Scholar] [CrossRef]
- Banerjee, A.; Chatterjee, K.; Madras, G. Enzymatic degradation of polymers: A brief review. Mater. Sci. Technol. 2013, 30, 567–573. [Google Scholar] [CrossRef]
- Lu, T.; Solis-Ramos, E.; Yi, Y.; Kumosa, M. UV degradation model for polymers and polimer matrix composites. Polym. Degrad. Stab. 2018, 154, 203–210. [Google Scholar] [CrossRef]
- Jamshidian, M.; Tehrany, E.A.; Imran, M.; Jacquot, M.; Desobry, S. Poly-lactic acid: Production, applications, nanocomposites, and release studies. Compr. Rev. Food Sci. Food Saf. 2010, 9, 552–571. [Google Scholar] [CrossRef]
- Kale, G.; Auras, R.; Singh, S.P.; Narayan, R. Biodegradability of polylactide bottles in real and simulated composting conditions. Polym. Test. 2007, 26, 1049–1061. [Google Scholar] [CrossRef]
- Pastorelli, G.; Cucci, C.; Garcia, O.; Piantanida, G.; Elnaggar, A.; Cassar, M.; Strlič, M. Environmentally induced color change during natural degradation of selected polymers. Polym. Degrad. Stab. 2014, 107, 198–209. [Google Scholar] [CrossRef]
- Sinyavsky, N.; Korneva, I. Study of optical properties of polymeric materials subjected to degradation. J. Polym. Environ. 2017, 25, 1280–1287. [Google Scholar] [CrossRef]
- Bond, T.; Ferrandiz-Mas, V.; Felipe-Sotelo, M.; van Sebille, E. The occurrence and degradation of aquatic plastic litter based on polymer physicochemical properties: A review. Crit. Rev. Environ. Sci. Technol. 2018, 48, 685–722. [Google Scholar] [CrossRef]
- Salomez, M.; George, M.; Fabre, P.; Touchaleaume, F.; Cesar, G.; Lajarrige, A.; Gastaldi, E. A comparative study of degradation mechanisms of PHBV and PBSA under laboratory-scale composting conditions. Polym. Degrad. Stab. 2019, 167, 102–113. [Google Scholar] [CrossRef]
- Eubeler, J.P.; Bernhard, M.; Knepper, T.P. Environmental biodegradation of synthetic polymers II. Biodegradation of different polymer groups. TrAC Trends Anal. Chem. 2010, 29, 84–100. [Google Scholar] [CrossRef]
- Emadian, S.M.; Onay, T.T.; Demirel, B. Biodegradation of bioplastics in natural environments. Waste Manag. 2017, 59, 526–536. [Google Scholar] [CrossRef] [PubMed]
- Chiellini, E.; Corti, A.; D’Antone, S.; Solaro, R. Biodegradation of poly(vinyl alcohol) based materials. Prog. Polym. Sci. 2003, 28, 963–1014. [Google Scholar] [CrossRef]
- Corti, A.; Solaro, R.; Chiellini, E. Biodegradation of poly(vinyl alcohol) in selected mixed microbial culture and relevant culture filtrate. Polym. Degrad. Stab. 2002, 75, 447–458. [Google Scholar] [CrossRef]
- Tosin, M.; Weber, M.; Siotto, M.; Lott, C.; Innocenti, F.D. Laboratory test methods to determine the degradation of plastics in marine environment conditions. Front. Microbiol. 2012, 3, 225. [Google Scholar] [CrossRef] [PubMed] [Green Version]
- Arcos-Hernandez, M.V.; Laycock, B.; Pratt, S.; Donose, B.C.; Nikolić, M.A.L.; Luckman, P.; Werker, A.; Lant, P.A. Biodegradation in a soil environment of activated sludge derived polyhydroxyalkanoate (PHBV). Polym. Degrad. Stab. 2012, 97, 2301–2312. [Google Scholar] [CrossRef]
- Wu, C.S. Preparation and characterization of polyhydroxyalkanoate bioplastic-based green renewable composites from rice husk. J. Polym. Environ. 2014, 22, 384–392. [Google Scholar] [CrossRef]
- Nakasaki, K.; Matsuura, H.; Tanaka, H.; Sakai, T. Synergy of two thermophiles enables decomposition of poly-ε-caprolactone under composting conditions. FEMS Microbiol. Ecol. 2006, 58, 373–383. [Google Scholar] [CrossRef] [PubMed]
- Tabasi, R.Y.; Ajji, A. Selective degradation of biodegradable blends in simulated laboratory composting. Polym. Degrad. Stab. 2015, 120, 435–442. [Google Scholar] [CrossRef]
- Mihai, M.; Legros, N.; Alemdar, A. Formulation-properties versatility of wood fiber biocomposites based on polylactide and polylactide/thermoplastic starch blends. Polym. Eng. Sci. 2014, 54, 1325–1340. [Google Scholar] [CrossRef]
- Anstey, A.; Muniyasamy, S.; Reddy, M.M.; Misra, M.; Mohanty, A. Processability and biodegradability evaluation of composites from poly(butylene succinate) (PBS) bioplastic and biofuel co-products from Ontario. J. Polym. Environ. 2014, 22, 209–218. [Google Scholar] [CrossRef]
- Kale, S.K.; Deshmukh, A.G.; Dudhare, M.S.; Patil, V.B. Microbial degradation of plastic: A review. J. Biochem. Technol. 2015, 6, 952–961. [Google Scholar]
- Bishop, G.; Styles, D.; Lens, P.N.L. Environmental performance comparison of bioplastics and petrochemical plastics: A review of life cycle assessment (LCA) methodological decisions. Resour. Conserv. Recycl. 2021, 168, 105451. [Google Scholar] [CrossRef]
- Spierling, S.; Venkatachalam, V.; Mudersbach, M.; Becker, N.; Herrmann, C.; Endres, H.J. End-of-life options for biobased plastics in a circular economy—Status quo and potential from a life cycle assessment perspective. Resources 2020, 9, 90. [Google Scholar] [CrossRef]
- Hottle, T.A.; Bilec, M.M.; Landis, A.E. Biopolymer production and end of life comparisons using life cycle assessment. Resour. Conserv. Recycl. 2017, 122, 295–306. [Google Scholar] [CrossRef] [Green Version]
- Lambert, S.; Sinclair, C.; Boxall, A. Occurrence, degradation, and effect of polymer-based materials in the environment. Rev. Environ. Contam. Toxicol. 2014, 227, 1–53. [Google Scholar] [PubMed]
- Ramesh, P.; Vinodh, S. State of the art review on life cycle assessment of polymers. Int. J. Sustain. Eng. 2020, 13, 411–422. [Google Scholar] [CrossRef]
- Lewis, H.; Verghese, K.; Fitzpatrick, L. Evaluating the sustainability impacts of packaging: The plastic carry bag dilemma. Packag. Technol. Sci. Int. J. 2010, 23, 145–160. [Google Scholar] [CrossRef]
- Saling, P.; Gyuzeleva, L.; Wittstock, K.; Wessolowski, V.; Griesshammer, R. Life cycle impact assessment of microplastics as one component of marine plastic debris. Int. J. Life Cycle Assess. 2020, 25, 2008–2026. [Google Scholar] [CrossRef]
- Agarwal, S. Biodegradable polymers: Present opportunities and challenges in providing a microplastic-free environment. Macromol. Chem. Phys. 2020, 221, 2000017. [Google Scholar] [CrossRef] [Green Version]
- Puchalski, M.; Szparaga, G.; Biela, T.; Gutkowska, A.; Sztajnowski, S.; Krucińska, I. Molecular and supramolecular changes in polybutylene succinate (PBS) and polybutylene succinate adipate (PBSA) copolymer during degradation in various envirnomental conditions. Polymers 2018, 10, 251. [Google Scholar] [CrossRef] [Green Version]
- Kim, H.S.; Yang, H.S.; Kim, H.J. Biodegradability and mechanical properties of agro-flour-filled polybutylene succinate biocomposites. J. Appl. Polym. Sci. 2005, 97, 1513–1521. [Google Scholar] [CrossRef]
- Xu, J.; Guo, B.H. Poly(butylene succinate) and its copolymers: Research development and industrialization. Biotechnol. J. 2010, 5, 1149–1163. [Google Scholar] [CrossRef] [PubMed]
- Shih, Y.F.; Lee, W.C.; Jeng, R.J.; Huang, M.H. Water bamboo husk-reinforced poly(butylenes succinate) biodegradable composites. J. Appl. Polym. Sci. 2006, 99, 188–190. [Google Scholar] [CrossRef]
- Fujimaki, T. Processability and properties of aliphatic polyester BIONOLLE synthesized by polycondensation reaction. Polym. Degrad. Stab. 1998, 59, 209–214. [Google Scholar] [CrossRef]
- Bechthold, I.; Bretz, K.; Kabasci, S.; Kopitzky, R.; Springer, A. Succinic acid: A new platform chemical for biobased polymers from renewable sources. Chem. Eng. Technol. 2008, 31, 647–654. [Google Scholar] [CrossRef]
- McKinlay, J.B.; Vielle, C.; Zeikus, J.G. Prospects for bio-based succinate industry. Appl. Microbiol. Biotechnol. 2007, 76, 727–740. [Google Scholar] [CrossRef] [PubMed]
- Cukalovic, A.; Stevens, C.V. Feasibility of production methods for succinic acid derivatives: A marriage of renewable resources and chemical technology. Biofuels Bioprod. Biorefin. 2008, 2, 505–529. [Google Scholar] [CrossRef]
- Ioannidou, S.M.; Ladakis, D.; Moutousidi, E.; Dheskali, E.; Kookos, I.K.; Câmara-Salim, I.; Moreira, M.T.; Koutinas, A. Techno-economic risk assessment, life cycle analysis and life cycle costing for poly(butylene succinate) and poly(lactic acid) production using renewable resources. Sci. Total Environ. 2021, 806, 150594. [Google Scholar] [CrossRef] [PubMed]
- Mousa, H.I.; Young, S.B. Polybutylene succinate life cycle assessment variations and variables. In Proceedings of the American Institute of Chemical Engineers 2012 Annual Meeting, Pittsburgh, PA, USA, 28 October–2 November 2012. [Google Scholar]
- Zini, E.; Scandola, M. Green composites: An overview. Polym. Compos. 2011, 32, 1905–1915. [Google Scholar] [CrossRef]
- Totaro, G.; Sisti, L.; Vannini, M.; Marchese, P.; Tassoni, A.; Lenucci, M.S.; Lamborghini, M.; Kalia, S.; Celli, A. A new route of valorization of rice endosperm by-product: Production of polymeric biocomposites. Compos. Part B 2018, 139, 195–202. [Google Scholar] [CrossRef]
- Yap, S.Y.; Sreekantan, S.; Hassan, M.; Sudesh, K.; Ong, M.T. Characterization and biodegradability of rice husk-filled polymer composites. Polymers 2021, 13, 104. [Google Scholar] [CrossRef]
- Sasimowski, E.; Majewski, Ł.; Grochowicz, M. Efficiency of twin-screw extrusion of biodegradable poly(butylene succinate)-wheat bran blend. Materials 2021, 14, 424. [Google Scholar] [CrossRef] [PubMed]
- Rojas-Lema, S.; Arevalo, J.; Gomez-Caturla, J.; Garcia-Garcia, D.; Torres-Giner, S. Peroxide-induced synthesis of maleic anhydride grafted poly(butylene succinate) and its compatibilizing effect on poly(butylene succinate)/pistachio shell flour composites. Molecules 2021, 26, 5927. [Google Scholar] [CrossRef] [PubMed]
- Hongsriphan, N.; Kamsantia, P.; Sillapasangloed, P.; Loychuen, S. Bio-based composite from poly(butylene succinate) and peanut shell waste adding maleinized linseed oil. IOP Conf. Ser. Mater. Sci. Eng. 2020, 773, 012046. [Google Scholar] [CrossRef]
- Liminana, P.; Garcia-Sanoguera, D.; Quiles-Carrillo, L.; Balart, R.; Montanes, N. Optimization of maleinized linseed oil loading as a biobased compatibilizer in poly(butylene succinate) composites with almond shell flour. Materials 2019, 12, 685. [Google Scholar] [CrossRef] [PubMed] [Green Version]
- Nanni, A.; Messori, M. Thermo-mechanical properties and creep modeling of wine lees filled polyamide 11 (PA11) and polybutylene succinate (PBS) bio-composites. Compos. Sci. Technol. 2020, 188, 107974. [Google Scholar] [CrossRef]
- Picard, M.C.; Rodriguez-Uribe, A.; Thimmanagari, M.; Misra, M.; Mohanty, A.K. Sustainable biocomposites from poly(butylenes succinate) and apple pomace: A study on compatibilization performance. Waste Biomass Valorizat. 2020, 11, 3775–3787. [Google Scholar] [CrossRef]
- Gowman, A.; Wang, T.; Rodriguez-Uribe, A.; Mohanty, A.K.; Misra, M. Bio-poly(butylene succinate) and its composites with grape pomace: Mechanical performance and thermal properties. ACS Omega 2018, 3, 15205–15216. [Google Scholar] [CrossRef] [PubMed] [Green Version]
- Frollini, E.; Bartolucci, N.; Sisti, L.; Celli, A. Poly(butylene succinate) reinforced with different lignocellulosic fibers. Ind. Crops Prod. 2013, 45, 160–169. [Google Scholar] [CrossRef]
- Feng, Y.H.; Zhang, D.W.; Qu, J.P.; He, H.Z.; Xu, B.P. Rheological properties of sisal fiber/poly(butylene succinate) composites. Polym. Test. 2011, 30, 124–130. [Google Scholar] [CrossRef]
- Avérous, L.; Le Digabel, F. Properties of biocomposites based on lignocellulosic fillers. Carbohydr. Polym. 2006, 66, 480–493. [Google Scholar] [CrossRef]
- Sirichalarmkul, A.; Kaewpirom, S. Enhanced biodegradation and processability of biodegradable package from poly(lactic acid)/poly(butylene succinate)/rice-husk green composites. J. Appl. Polym. Sci. 2021, 138, 50652. [Google Scholar] [CrossRef]
- Laurichesse, S.; Avérous, L. Chemical modification of lignins: Towards biobased polymers. Prog. Polym. Sci. 2014, 39, 1266–1290. [Google Scholar] [CrossRef]
- Sasimowski, E.; Majewski, Ł. Biodegradable polymer composition. Polish Patent No. PL239238B1, 13 October 2021. [Google Scholar]
- Plastics—Injection Moulding of Test Specimens of Thermoplastic Materials—Part 1: General Principles, and Moulding of Multipurpose and Bar Test Specimens; ISO 294-1:2017; ISO: Geneva, Switzerland, 2017.
- BioPBS FZ91PB—Technical Data Sheet. Available online: https://www.mcpp-global.com/en/mcpp-asia/products/product/biopbsTM-general-properties/ (accessed on 5 October 2021).
- Greffeuille, V.; Abecassis, J.; Lapierre, C.; Lullien-Pellerin, V. Bran size distribution at milling and mechanical and biochemical characterization of common wheat grain outer layers: A relationship assessment. Cereal Chem. 2006, 83, 641–646. [Google Scholar] [CrossRef]
- Kamal-Eldin, A.; Lærke, H.N.; Knudsen, K.E.B.; Lampi, A.M.; Piironen, V.; Adlercreutz, H.; Katina, K.; Poutanen, K.; Åman, P. Physical, microscopic and chemical characterization of industrial rye and wheat brans from the Nordic countries. Food Nutr. Res. 2009, 53, 1912. [Google Scholar] [CrossRef] [PubMed] [Green Version]
- Plastics—Methods of Exposure to Laboratory Light Sources—Part 2: Xenon-Arc Lamps; ISO 4892-2:2013; ISO: Geneva, Switzerland, 2013.
- Plastics—Differential Scanning Calorimetry (DSC)—Part 1:General Principles; ISO 11357-1:2016; ISO: Geneva, Switzerland, 2016.
- Huang, Z.; Qian, L.; Yin, Q.; Yu, N.; Liu, T.; Tian, D. Biodegradability studies of poly(butylene succinate) composites filled with sugarcane rind fiber. Polym. Test. 2018, 66, 319–326. [Google Scholar] [CrossRef]
- Plastics—Injection Moulding of Test Specimens of Thermoplastic Materials—Part 4: Determination of Moulding Shrinkage; ISO 294-4:2018; ISO: Geneva, Switzerland, 2018.
- Standard Practice for Computing the Color of Objects by Using the CIE System; ASTM E308; ASTM International: West Conshohocken, PA, USA, 2018.
- Surface Texture (Surface Roughness, Waviness and Lay); ASME B46.1; American Society of Mechanical Engineers (ASME): London, UK, 2019.
- Paints and Varnishes—Determination of Gloss Value at 20 Degrees, 60 Degrees and 85 Degrees; ISO 2813:2001; ISO: Geneva, Switzerland, 2001.
- Plastics—Thermoplastic Materials—Determination of Vicat Softening Temperature (VST); ISO 306:2013; ISO: Geneva, Switzerland, 2013.
- Plastics and Ebonite—Determination of Indentation Hardness by Means of a Durometer (Shore Hardness); ISO 868:2003; ISO: Geneva, Switzerland, 2001.
- Plastics—Methods of Test for the Determination of the Effects of Immersion in Liquid Chemicals; ISO 175:2010; ISO: Geneva, Switzerland, 2010.
- Plastics—Determination of the Degree of Disintegration of Plastic Materials under Simulated Composting Conditions in a Laboratory-Scale Test; ISO 20200:2015; ISO: Geneva, Switzerland, 2015.
- Cai, L.; Qi, Z.; Xu, J.; Guo, B.; Huang, Z. Study on the photodegradation stability of poly(butylene succinate-co-butylene adipate)/TiO2 nanocomposites. J. Chem. 2019, 2019, 5036019. [Google Scholar] [CrossRef]
- Zhang, Y.; Xu, J.; Guo, B. Photodegradation behavior of poly(butylene succinate-co-butyleneadipate)/ZnO nanocomposites. Colloids Surf. A Physicochem. Eng. Asp. 2016, 489, 173–181. [Google Scholar] [CrossRef]
- Carroccio, S.; Rizzarelli, P.; Puglisi, C.; Montaudo, G. MALDI investigation of photooxidation in aliphatic polyesters: Poly(butylene succinate). Macromolecules 2004, 37, 6576–6586. [Google Scholar] [CrossRef]
- Yao, S.F.; Chen, X.T.; Ye, H.M. Investigation of structure and crystallization behavior of poly(butylene succinate) by fourier transform infrared spectroscopy. J. Phys. Chem. B 2017, 121, 9476–9485. [Google Scholar] [CrossRef]
- Schick, C.; Wurm, A.; Mohamed, A. Vitrification and devitrification of the rigid amorphous fraction of semicrystalline polymers revealed from frequency-dependent heat capacity. Colloid Polym. Sci. 2001, 279, 800–806. [Google Scholar] [CrossRef]
- Ratto, J.A.; Stenhouse, P.J.; Auerbach, M.; Mitchell, J.; Farrell, R. Processing, performance and biodegradability of a thermoplastic aliphatic polyester starch system. Polymer 1999, 40, 6777–6788. [Google Scholar] [CrossRef]
- Sasimowski, E.; Majewski, Ł.; Grochowicz, M. Analysis of selected properties of injection moulded sustainable biocomposites from poly(butylene succinate) and wheat bran. Materials 2021, 14, 7049. [Google Scholar] [CrossRef] [PubMed]
- Pegoretti, A.; Penati, A. Recycled poly(ethylene terephthalate) and its shortglass fibres composites: Effects of hygrothermal aging on thethermo-mechanical behavior. Polymer 2004, 45, 7995–8004. [Google Scholar] [CrossRef]
- Kim, H.S.; Kim, H.J.; Lee, J.W.; Choi, I.G. Biodegradability of bio-flour filled biodegradable poly(butylene succinate) bio-composites in natural and compost soil. Polym. Degrad. Stab. 2006, 91, 1117–1127. [Google Scholar] [CrossRef]
- Yasuniwa, M.; Satou, T. Multiple melting behavior of poly(butylene succinate). I. Thermal analysis of melt-crystallized samples. J. Polym. Sci. Part B Polym. Phys. 2002, 40, 2411–2420. [Google Scholar] [CrossRef]
- Yoo, E.S.; Im, S.S. Melting behavior of poly(butylene succinate) during heating scan by DSC. J. Polym. Sci. Part B Polym. Phys. 1999, 37, 1357–1366. [Google Scholar] [CrossRef]
- Qiu, Z.; Komura, M.; Ikehara, T.; Nishi, T. DSC and TMDSC study of melting behaviour of poly(butylene succinate) and poly(ethylene succinate). Polymer 2003, 44, 7781–7785. [Google Scholar] [CrossRef]
- Signoria, F.; Pelagaggi, M.; Bronco, S.; Righetti, M.C. Amorphous/crystal and polymer/filler interphases in biocomposites from poly(butylene succinate). Thermochim. Acta 2012, 543, 74–81. [Google Scholar] [CrossRef]
- Henke, L.; Zarrinbakhsh, N.; Endres, H.J.; Misra, M.; Mohanty, A.K. Biodegradable and bio-based green blends from carbon dioxide-derived bioplastic and poly(butylene succinate). J. Polym. Environ. 2017, 25, 499–509. [Google Scholar] [CrossRef]
- Ou-Yang, Q.; Guo, B.; Xu, J. Preparation and characterization of poly(butylene succinate)/polylactide blends for fused deposition modeling 3D printing. ACS Omega 2018, 3, 14309–14317. [Google Scholar] [CrossRef]
- Shahzad, A.; Isaac, D.H. Weathering of lignocellulosic polymer composites. In Lignocellulosic Polymer Composites: Processing, Characterisation and Properties; Thakur, V.K., Ed.; John Willey & Sons: Hoboken, NJ, USA, 2014. [Google Scholar]
- Sasimowski, E.; Majewski, Ł.; Grochowicz, M. Analysis of selected properties of biocomposites based on polyethylene with a natural origin filler. Materials 2020, 13, 4182. [Google Scholar] [CrossRef] [PubMed]
- Kim, H.S.; Lee, B.H.; Lee, S.; Kim, H.J.; Dorgan, J.R. Enhanced interfacial adhesion, mechanical, and thermal properties of natural flour-filled biodegradable polymer bio-composites. J. Therm. Anal. Calorim. 2011, 104, 331–338. [Google Scholar] [CrossRef]
- Sahoo, S.; Misra, M.; Mohanty, A.K. Effect of compatinilizer and fillers on the properties of injection molded lignin-based hybrid green composites. J. Appl. Polym. Sci. 2013, 127, 4110–4121. [Google Scholar] [CrossRef]
- National Institute of Standards and Technology. Chemistry WebBook—Succinic Acid. Available online: https://webbook.nist.gov/cgi/inchi?ID=C2338456&Mask=80 (accessed on 2 November 2021).
- National Institute of Standards and Technology. Chemistry WebBook—1,4-Butanediol. Available online: https://webbook.nist.gov/cgi/cbook.cgi?ID=C110634&Mask=80 (accessed on 2 November 2021).
- Robledo-Ortíz, J.R.; González-López, M.E.; Martín del Campo, A.S.; Pérez-Fonseca, A.A. Lignocellulosic materials as reinforcement of polyhydroxybutyrate and its copolymer with hydroxyvalerate: A review. J. Polym. Environ. 2021, 29, 1350–1364. [Google Scholar] [CrossRef]
- Williams, R.S.; Knaebe, M.T.; Feist, W.C. Erosion rates of wood during natural weathering. Part II. Earlywood and latewood erosion rates. Wood Fiber Sci. 2001, 33, 43–49. [Google Scholar]
- Stark, N.M. Effect of weathering cycle and manufacturing method on performance of wood flour and high-density polyethylene composites. J. Appl. Polym. Sci. 2006, 100, 3131–3140. [Google Scholar] [CrossRef] [Green Version]
- Azwa, Z.N.; Yousif, B.F.; Manalo, A.C.; Karunasena, W. A review on the degradability of polymeric composites based on natural fibres. Mater. Des. 2013, 47, 424–442. [Google Scholar] [CrossRef] [Green Version]
- Asif, M.; Liaqat, M.A.; Khan, M.A.; Ahmed, H.; Quddusi, M.; Hussain, Z.; Liaqat, U. Studying the effect of nHAP on the mechanical and surface properties of PBS matrix. J. Polym. Res. 2021, 28, 349. [Google Scholar] [CrossRef]
- Patwary, F.; Matsko, N.; Mittal, V. Biodegradation properties of melt processed PBS/chitosan bio-nanocomposites with silica, silicate, and thermally reduced grapheme. Polym. Compos. 2018, 39, 386–397. [Google Scholar] [CrossRef]
- Palai, B.; Mohanty, S.; Nayak, S.K. Synergistic effect of polylactic acid (PLA) and poly(butylene succinate-co-adipate) (PBSA) based sustainable, reactive, super toughened Eco-compoasite blown fims for flexible packaging applications. Polym. Test. 2020, 83, 106130. [Google Scholar] [CrossRef]
- Quiles, L.G.; Vidal, J.; Luzi, F.; Dominici, F.; Cuello, Á.F.; Castell, P. Color fixation strategies on sustainable poly-butylene succinate using biobased itaconic acid. Polymers 2021, 13, 79. [Google Scholar] [CrossRef] [PubMed]
- Matuana, L.M.; Jin, S.; Stark, N.M. Ultraviolet weathering of HDPE/wood-flour composites coextruded with clear HDPE cap layer. Polym. Degrad. Stab. 2011, 96, 97–106. [Google Scholar] [CrossRef]
- Müller, U.; Rätzsch, M.; Schwanninger, M.; Steiner, M.; Zöbl, H. Yellowing and IR-changes of spruce wood as a result of UV-irradiation. J. Photochem. Photobiol. B Biol. 2003, 69, 97–105. [Google Scholar] [CrossRef]
- Nordlund, E.; Aura, A.M.; Mattila, I.; Kössö, T.; Rouau, X.; Poutanen, K. Formation of phenolic microbial metabolites and short-chain fatty acids from rye, wheat, and oat bran and their fractions in the metabolical in vitro colon model. J. Agric. Food Chem. 2012, 60, 8134–8145. [Google Scholar] [CrossRef]
- Mert, B.; Tekin, A.; Demirkesen, I.; Kocak, G. Production of microfluidized wheat bran fibers and evaluation as an ingredient in reduced flour bakery product. Food Bioprocess Technol. 2014, 7, 2889–2901. [Google Scholar] [CrossRef]
- De Bondt, Y.; Rosa-Sibakov, N.; Liberloo, I.; Roye, C.; Van de Walle, D.; Dewettinck, K.; Goos, P.; Nordlund, E.; Courtin, C.M. Study into the effect of microfluidisation processing parameters on the physicochemical properties of wheat (Triticum aestivum L.) bran. Food Chem. 2020, 305, 125436. [Google Scholar] [CrossRef]
- Thurber, H.; Curtzwiler, G.W. Suitability of poly(butylene succinate) as a coating for paperboard convenience food packaging. Int. J. Biobased Plast. 2020, 2, 1–12. [Google Scholar] [CrossRef]
- Mizuno, S.; Maeda, T.; Kanemura, C.; Hotta, A. Biodegradability, reprocessability, and mechanical properties of polybutylene succinate (PBS) photografted by hydrophilic or hydrophobic membranes. Polym. Degrad. Stab. 2015, 117, 58–65. [Google Scholar] [CrossRef]
- Kanemura, C.; Nakashima, S.; Hotta, A. Mechanical properties and chemical structures of biodegradable poly(butylene-succinate) for material reprocessing. Polym. Degrad. Stab. 2012, 97, 972–980. [Google Scholar] [CrossRef]
- Jin, T.X.; Liu, C.; Zhou, M.; Chai, S.G.; Chen, F.; Fu, Q. Crystallization, mechanical performance and hydrolytic degradation of poly(butylene succinate)/graphene oxide nanocomposites obtained via in situ polymerization. Compos. Part A Appl. Sci. Manuf. 2015, 68, 193–201. [Google Scholar] [CrossRef]
- Cho, K.; Lee, J.; Kwon, K. Hydrolytic degradation behavior of poly(butylene succinate)s with different crystalline morphologies. J. Appl. Polym. Sci. 2001, 79, 1025–1033. [Google Scholar] [CrossRef]
- Muniyasamy, S.; Anstey, A.; Reddy, M.M.; Misra, M.; Mohanty, A. Biodegradability and compostabilityof lignocellulosic based composite materials. J. Renew. Mater. 2013, 1, 253–272. [Google Scholar] [CrossRef]
- Da Silva, A.M.B.; Martins, A.B.; Santana, R.M.C. Biodegradability studiem of lignocellulosic fiber reinforced composites. In Fiber Reinforced Composites; Woodhead Publishing: Sawston, UK, 2021; pp. 241–271. [Google Scholar]
- Soccio, M.; Dominici, F.; Quattrosoldi, S.; Luzi, F.; Munari, A.; Torre, L.; Lotti, N.; Puglia, D. PBS-based green copolymer as an efficient compatibilizer in thermoplastic inedible wheat flour/poly(butylene succinate) blends. Biomacromolecules 2020, 21, 3254–3269. [Google Scholar] [CrossRef]


| Experimental Design Layout | n, min−1 | u, % |
|---|---|---|
| 1 | 50 | 30.0 |
| 2 | 200 | 30.0 |
| 3 | 125 | 10.0 |
| 4 | 125 | 50.0 |
| 5 | 125 | 30.0 |
| 6 PBS | - | 0 |
| Sample | Heating I | Cooling | Heating II | ||||||
|---|---|---|---|---|---|---|---|---|---|
| Tg (°C) | Tm (°C) | ΔHm (J/g) | Xc (%) | Tc (°C) | Tg (°C) | Tm (°C) | ΔHm (J/g) | Xc (%) | |
| PBS b PBS a | −25.6 −25.7 | 121.3 116.3 | 72.1 94.9 | 65.4 86.0 | 86.4 77.6/88.9 | −31.7 −27.6 | 118.5 113.5 | 66.7 84.4 | 60.5 76.5 |
| 1(50/30) b 1(50/30) a | −31.3 - | 118.9 118.5 | 51.1 71.9 | 66.2 93.1 | 82.2 80.3 | −32.1 −32.0 | 116.3 115.3 | 38.2 55.6 | 49.5 72.0 |
| 2(200/30) b 2(200/30) a | −31.5 - | 118.9 117.7 | 51.7 49.5 | 67.0 64.1 | 81.3 81.8 | −32.4 −32.2 | 117.2 116.3 | 39.4 44.3 | 51.0 57.4 |
| 3(125/10) b 3(125/10) a | −33.3 −26.6 | 118.8 118.8 | 63.3 98.2 | 63.8 98.9 | 86.4 77.4/85.3 | −33.4 −33.5 | 115.8 115.0 | 55.3 81.9 | 55.7 82.5 |
| 4(125/50) b 4(125/50) a | −32.5 −15.3 | 117.6 118.8 | 39.0 48.1 | 70.7 87.2 | 83.3 83.8 | −32.5 −32.4 | 116.6 116.6 | 30.6 35.3 | 54.5 64.0 |
| 5(125/30) b 5(125/30) a | −31.4 - | 118.0 117.7 | 41.9 65.5 | 54.3 84.8 | 79.6 82.5 | −32.3 −31.5 | 118.2 114.7 | 38.8 49.8 | 50.3 64.5 |
| Sample | T5% (°C) | T50% (°C) | Tmax1 (°C) | Δm1 (%) | Tmax2 (°C) | Δm2 (%) | Tmax3 (°C) | Δm3 (%) | Rm (%) |
|---|---|---|---|---|---|---|---|---|---|
| bran | 201 | 303 | 296 | 68.0 | - | - | 459 | 29.7 | 2.3 |
| PBS b PBS a | 307 297 | 386 384 | - 300 | - 8.9 | 395 394 | 97.9 88.6 | 463 477 | 2.0 2.4 | 0.1 0.1 |
| 1(50 30) b 1(50 30) a | 274 260 | 380 376 | 303 300 | 20.5 20.5 | 392 389 | 70.3 71.1 | 476 476 | 9.1 8.2 | 0.1 0.2 |
| 2(200 30) b 2(200 30) a | 276 259 | 379 375 | 303 301 | 20.1 21.8 | 390 388 | 70.0 71.1 | 476 476 | 9.7 7.1 | 0.2 0.0 |
| 3(125 10) b 3(125 10) a | 299 288 | 383 382 | 303 301 | 8.5 9.5 | 391 388 | 87.0 85.1 | 475 478 | 4.5 5.3 | 0.3 0.1 |
| 4(125 50) b 4(125 50) a | 261 231 | 372 369 | 300 302 | 31.5 33.5 | 386 387 | 53.5 52.0 | 462 469 | 14.7 14.2 | 0.3 0.3 |
| 5(125 30) b 5(125 30) | 274 260 | 381 377 | 303 300 | 19.8 20.5 | 391 388 | 71.1 70.4 | 476 476 | 9.0 9.1 | 0.1 0 |
Publisher’s Note: MDPI stays neutral with regard to jurisdictional claims in published maps and institutional affiliations. |
© 2021 by the authors. Licensee MDPI, Basel, Switzerland. This article is an open access article distributed under the terms and conditions of the Creative Commons Attribution (CC BY) license (https://creativecommons.org/licenses/by/4.0/).
Share and Cite
Sasimowski, E.; Majewski, Ł.; Grochowicz, M. Artificial Ageing, Chemical Resistance, and Biodegradation of Biocomposites from Poly(Butylene Succinate) and Wheat Bran. Materials 2021, 14, 7580. https://doi.org/10.3390/ma14247580
Sasimowski E, Majewski Ł, Grochowicz M. Artificial Ageing, Chemical Resistance, and Biodegradation of Biocomposites from Poly(Butylene Succinate) and Wheat Bran. Materials. 2021; 14(24):7580. https://doi.org/10.3390/ma14247580
Chicago/Turabian StyleSasimowski, Emil, Łukasz Majewski, and Marta Grochowicz. 2021. "Artificial Ageing, Chemical Resistance, and Biodegradation of Biocomposites from Poly(Butylene Succinate) and Wheat Bran" Materials 14, no. 24: 7580. https://doi.org/10.3390/ma14247580
APA StyleSasimowski, E., Majewski, Ł., & Grochowicz, M. (2021). Artificial Ageing, Chemical Resistance, and Biodegradation of Biocomposites from Poly(Butylene Succinate) and Wheat Bran. Materials, 14(24), 7580. https://doi.org/10.3390/ma14247580