
Effect of Cooling Rate during Glazing on the Mechanical and Optical Properties of Monolithic Zirconia with 3 mol% Yttria Content


Abstract
:1. Introduction
2. Materials and Methods
2.1. Specimen Preparation
2.2. Glazing Heat Treatment
2.3. Flexural Strength Testing
2.4. Hardness Testing
2.5. Field Emission Scanning Electron Microscopy (FE-SEM)
2.6. Optical Property Analysis
2.7. X-ray Diffractometry (XRD)
2.8. Statistical Analysis
3. Results
3.1. Flexural Strength
3.2. Hardness
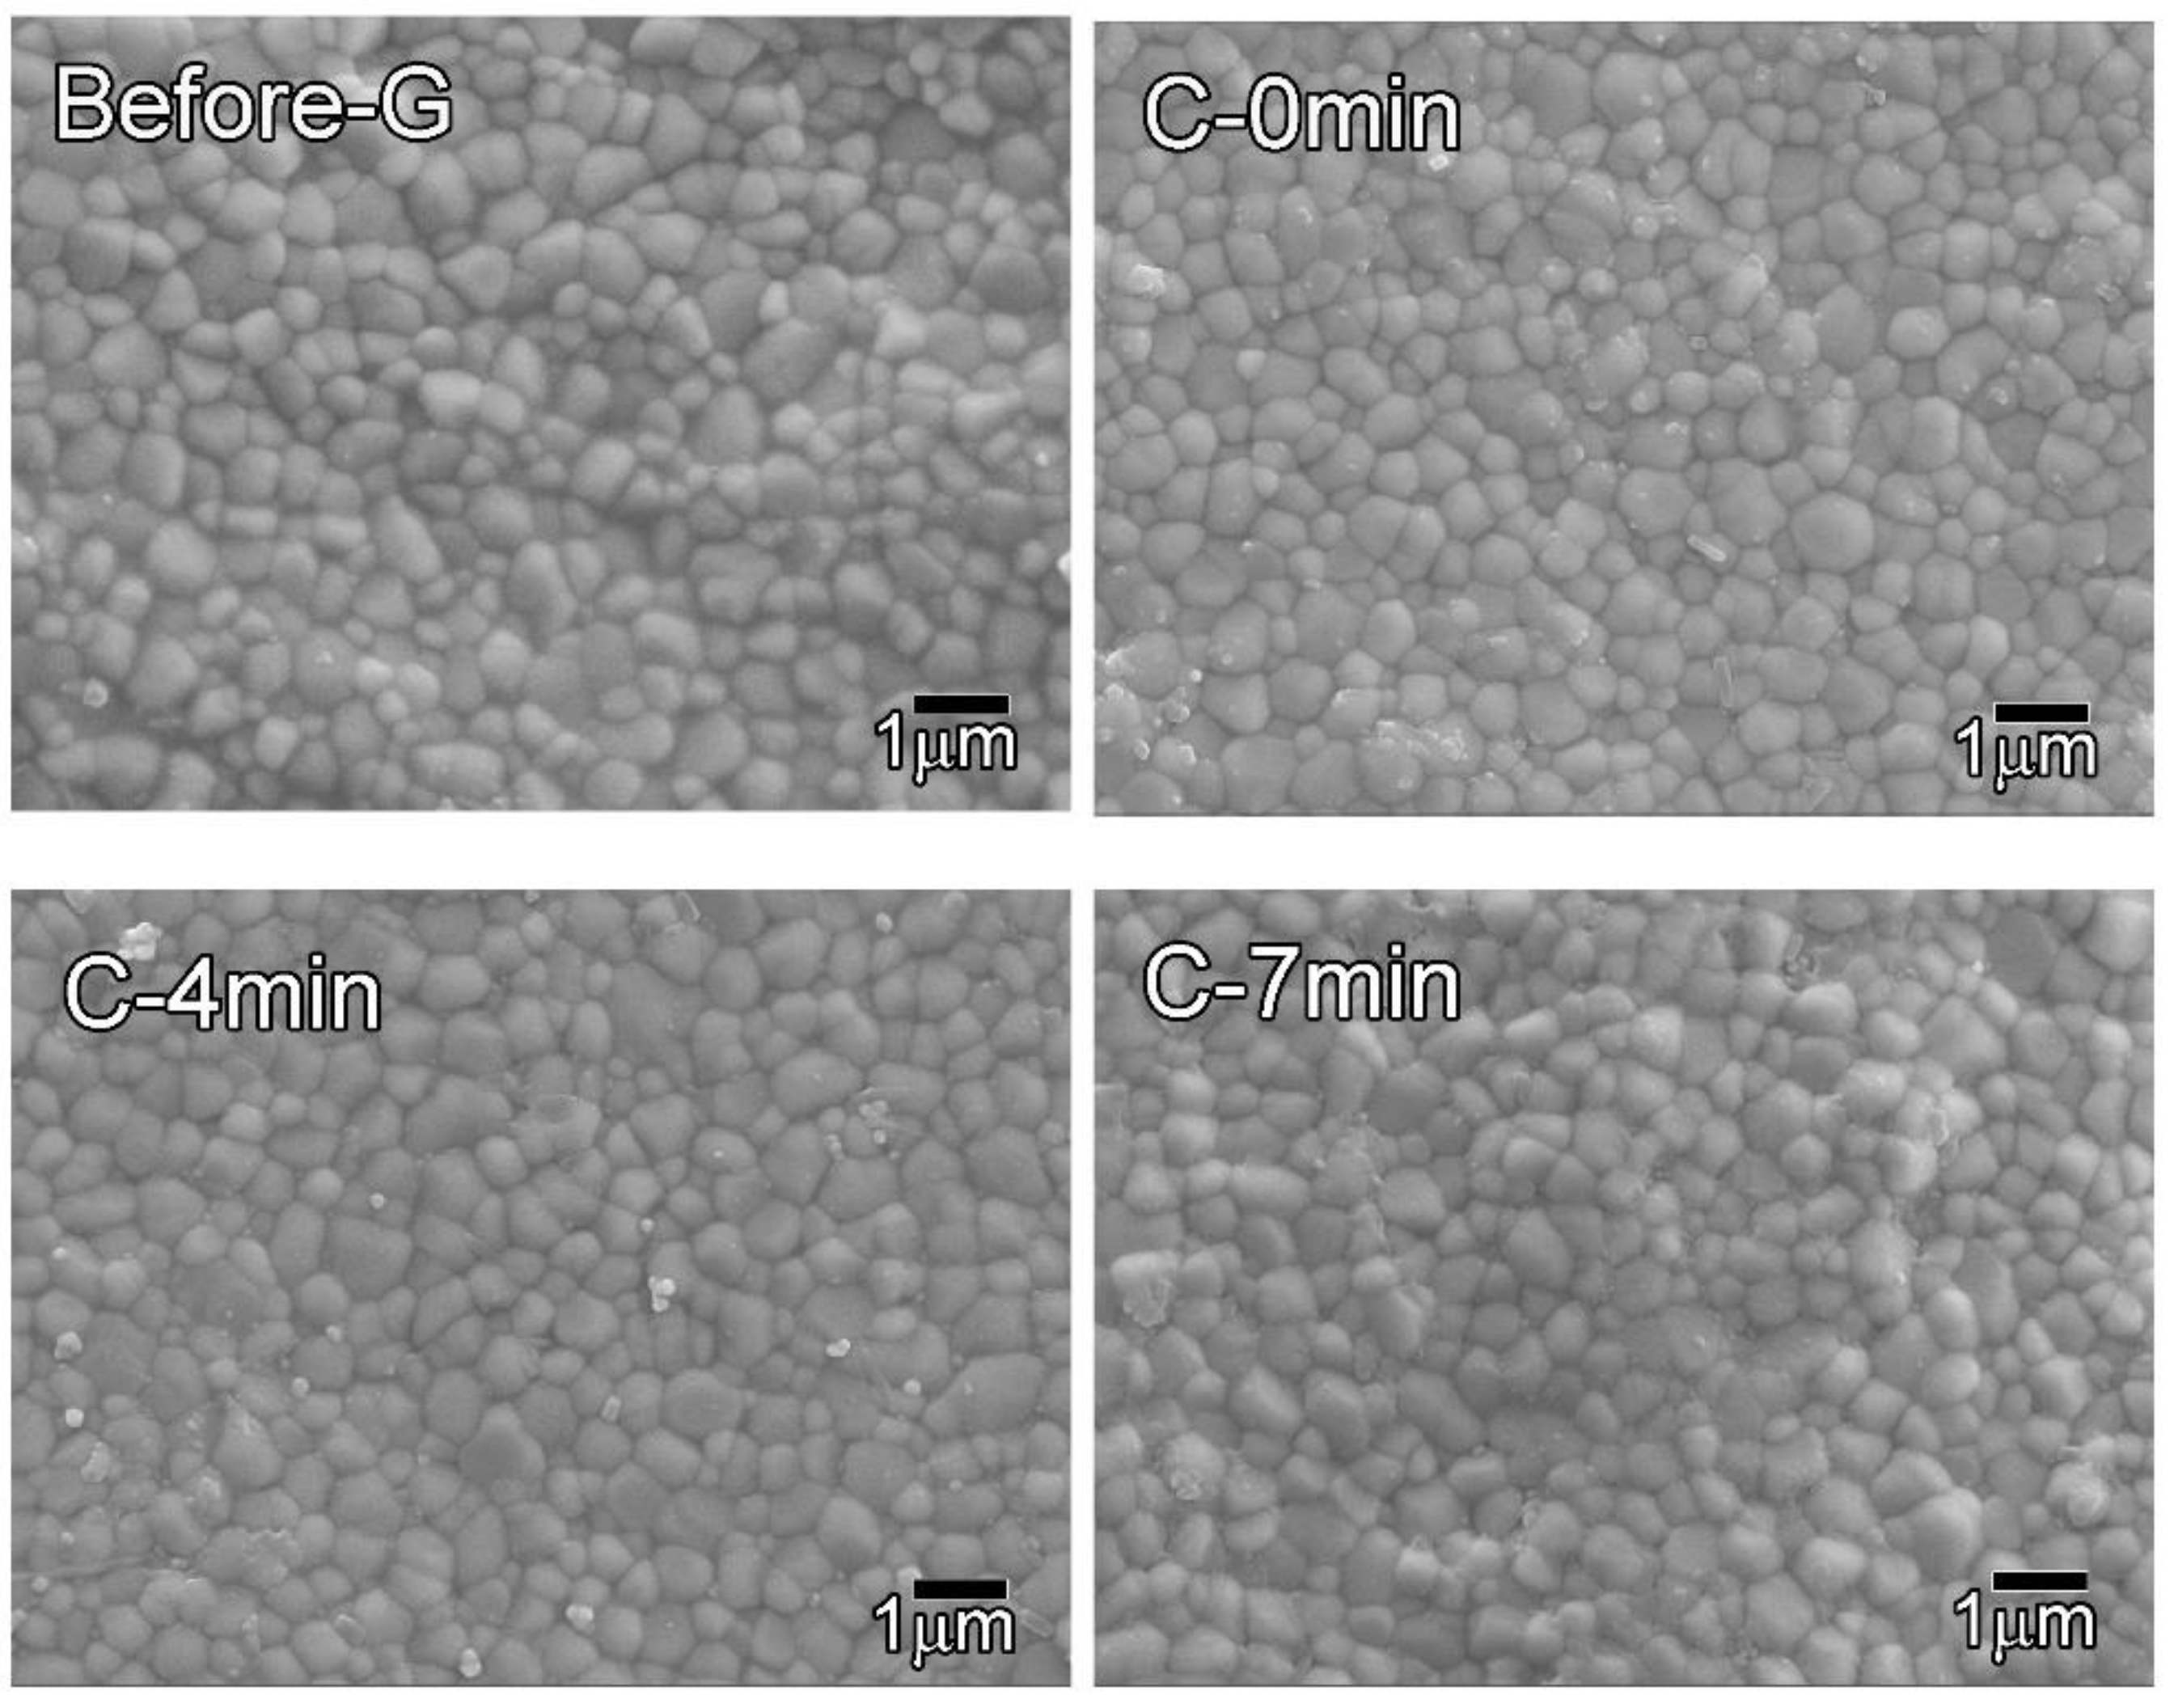
3.3. Microstructure
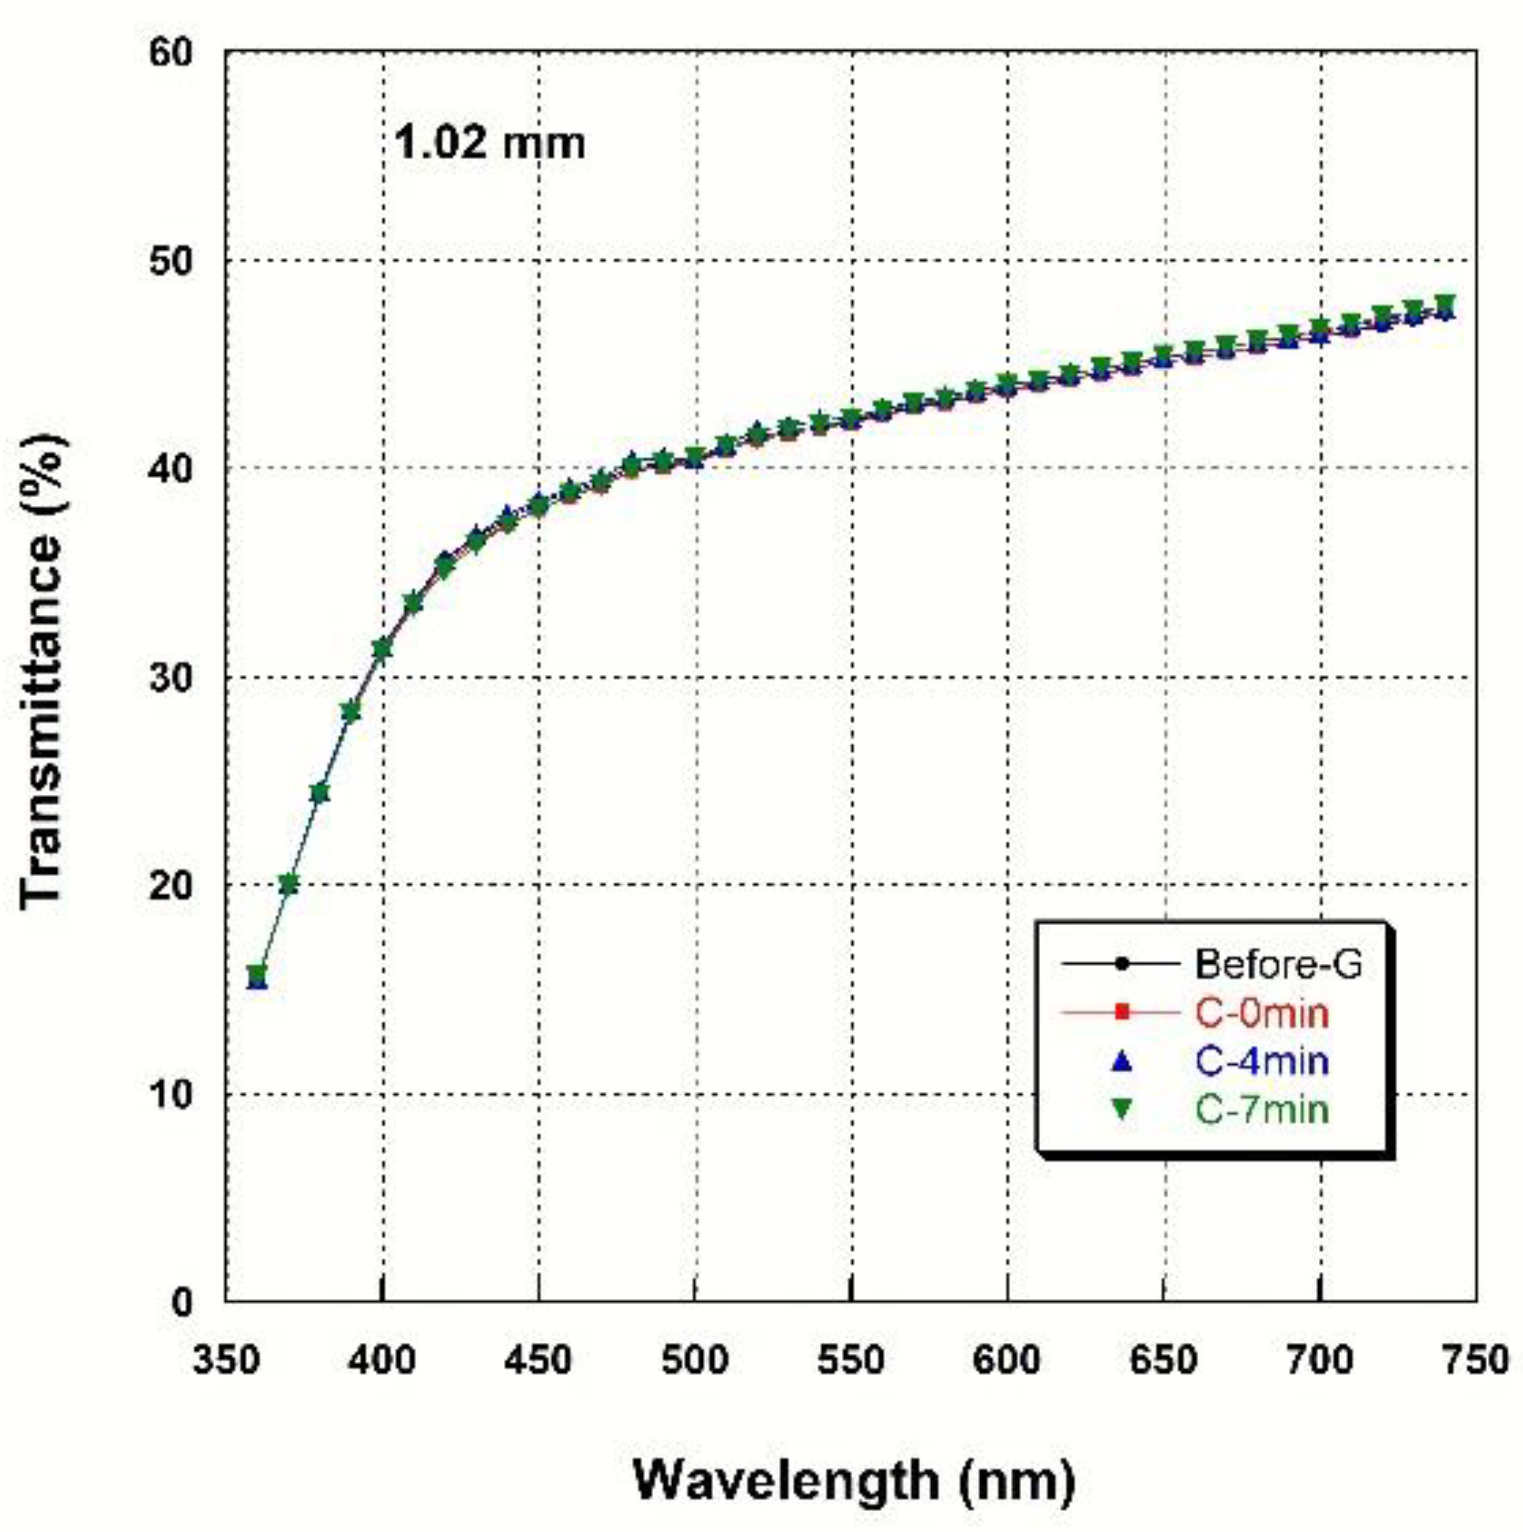
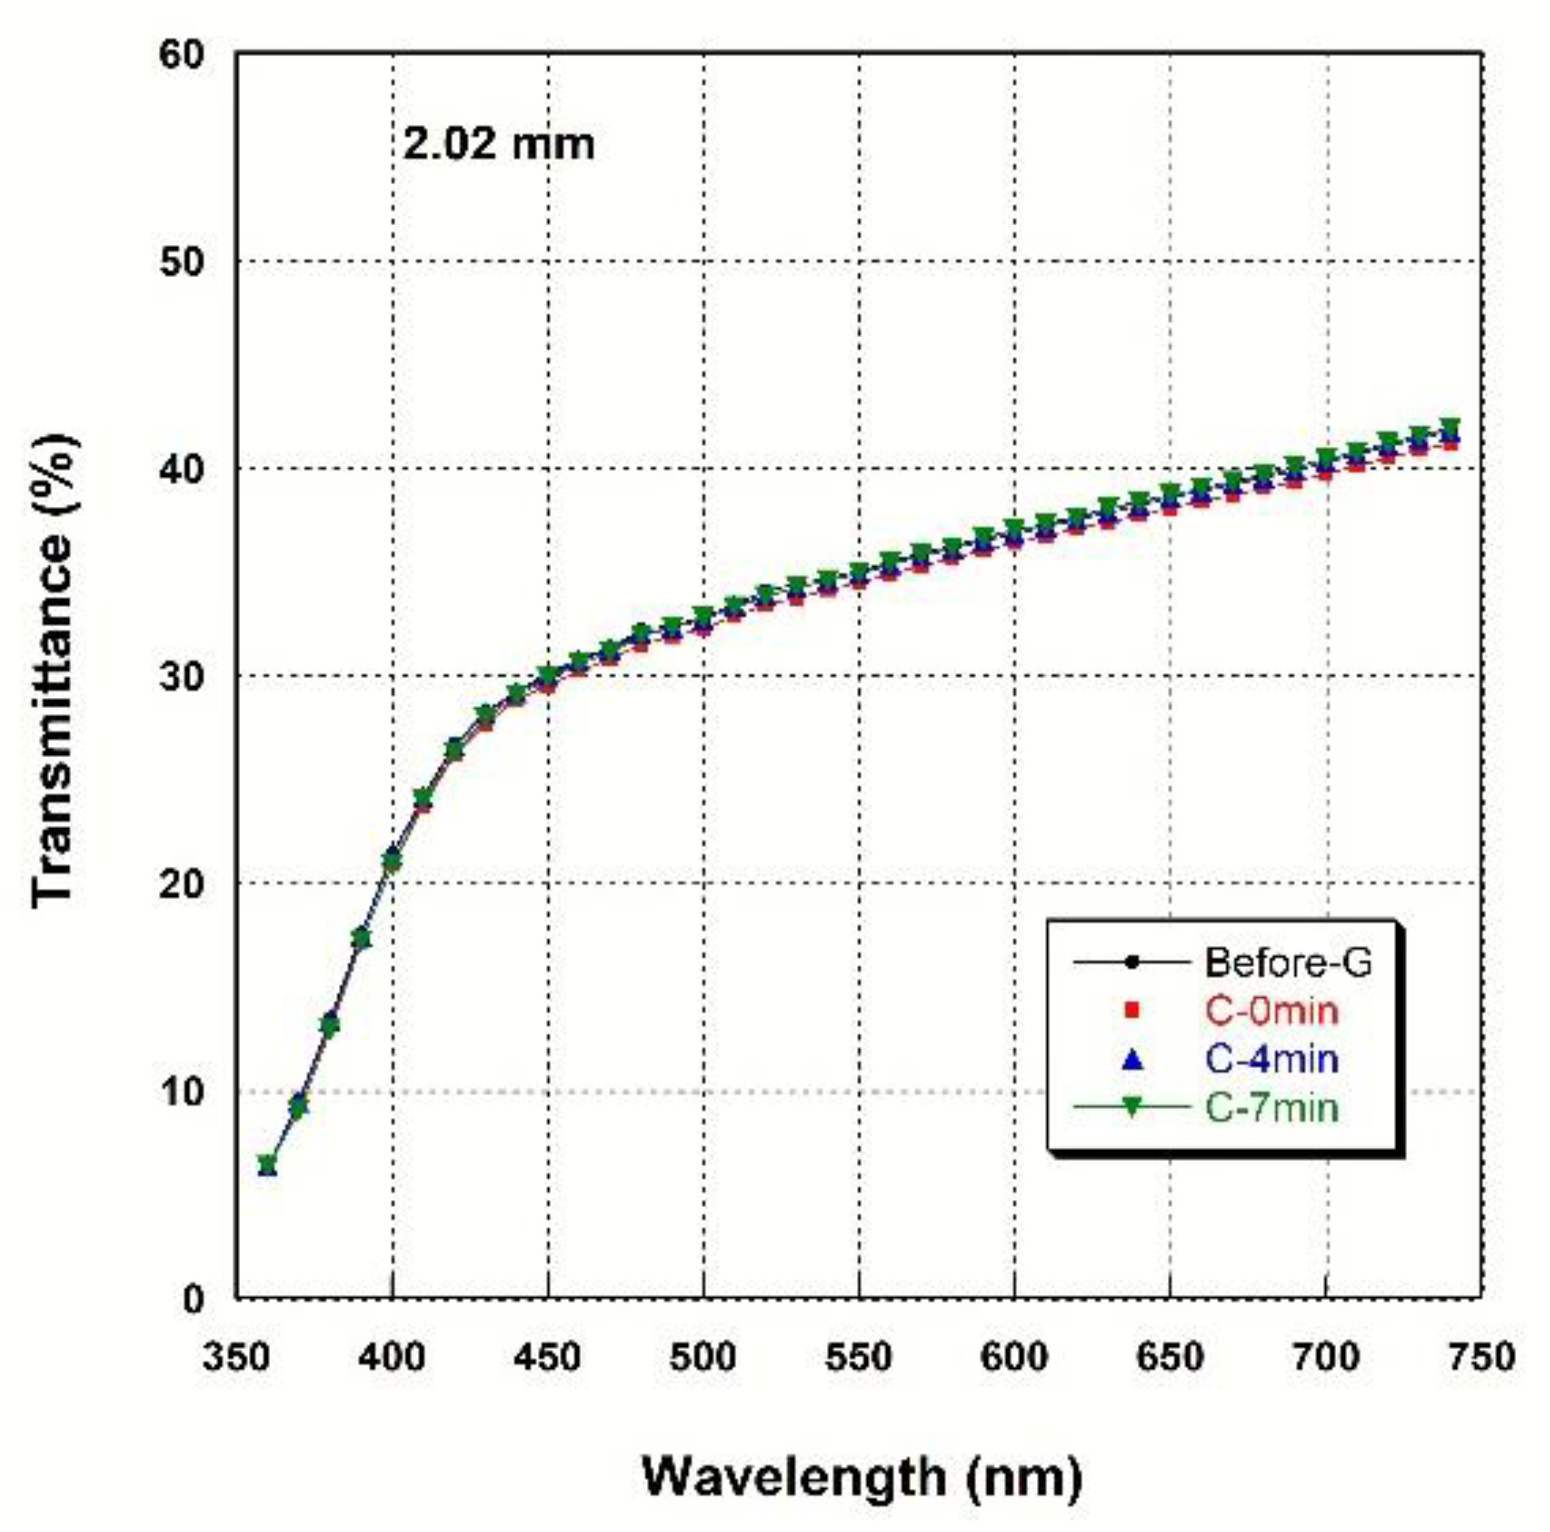
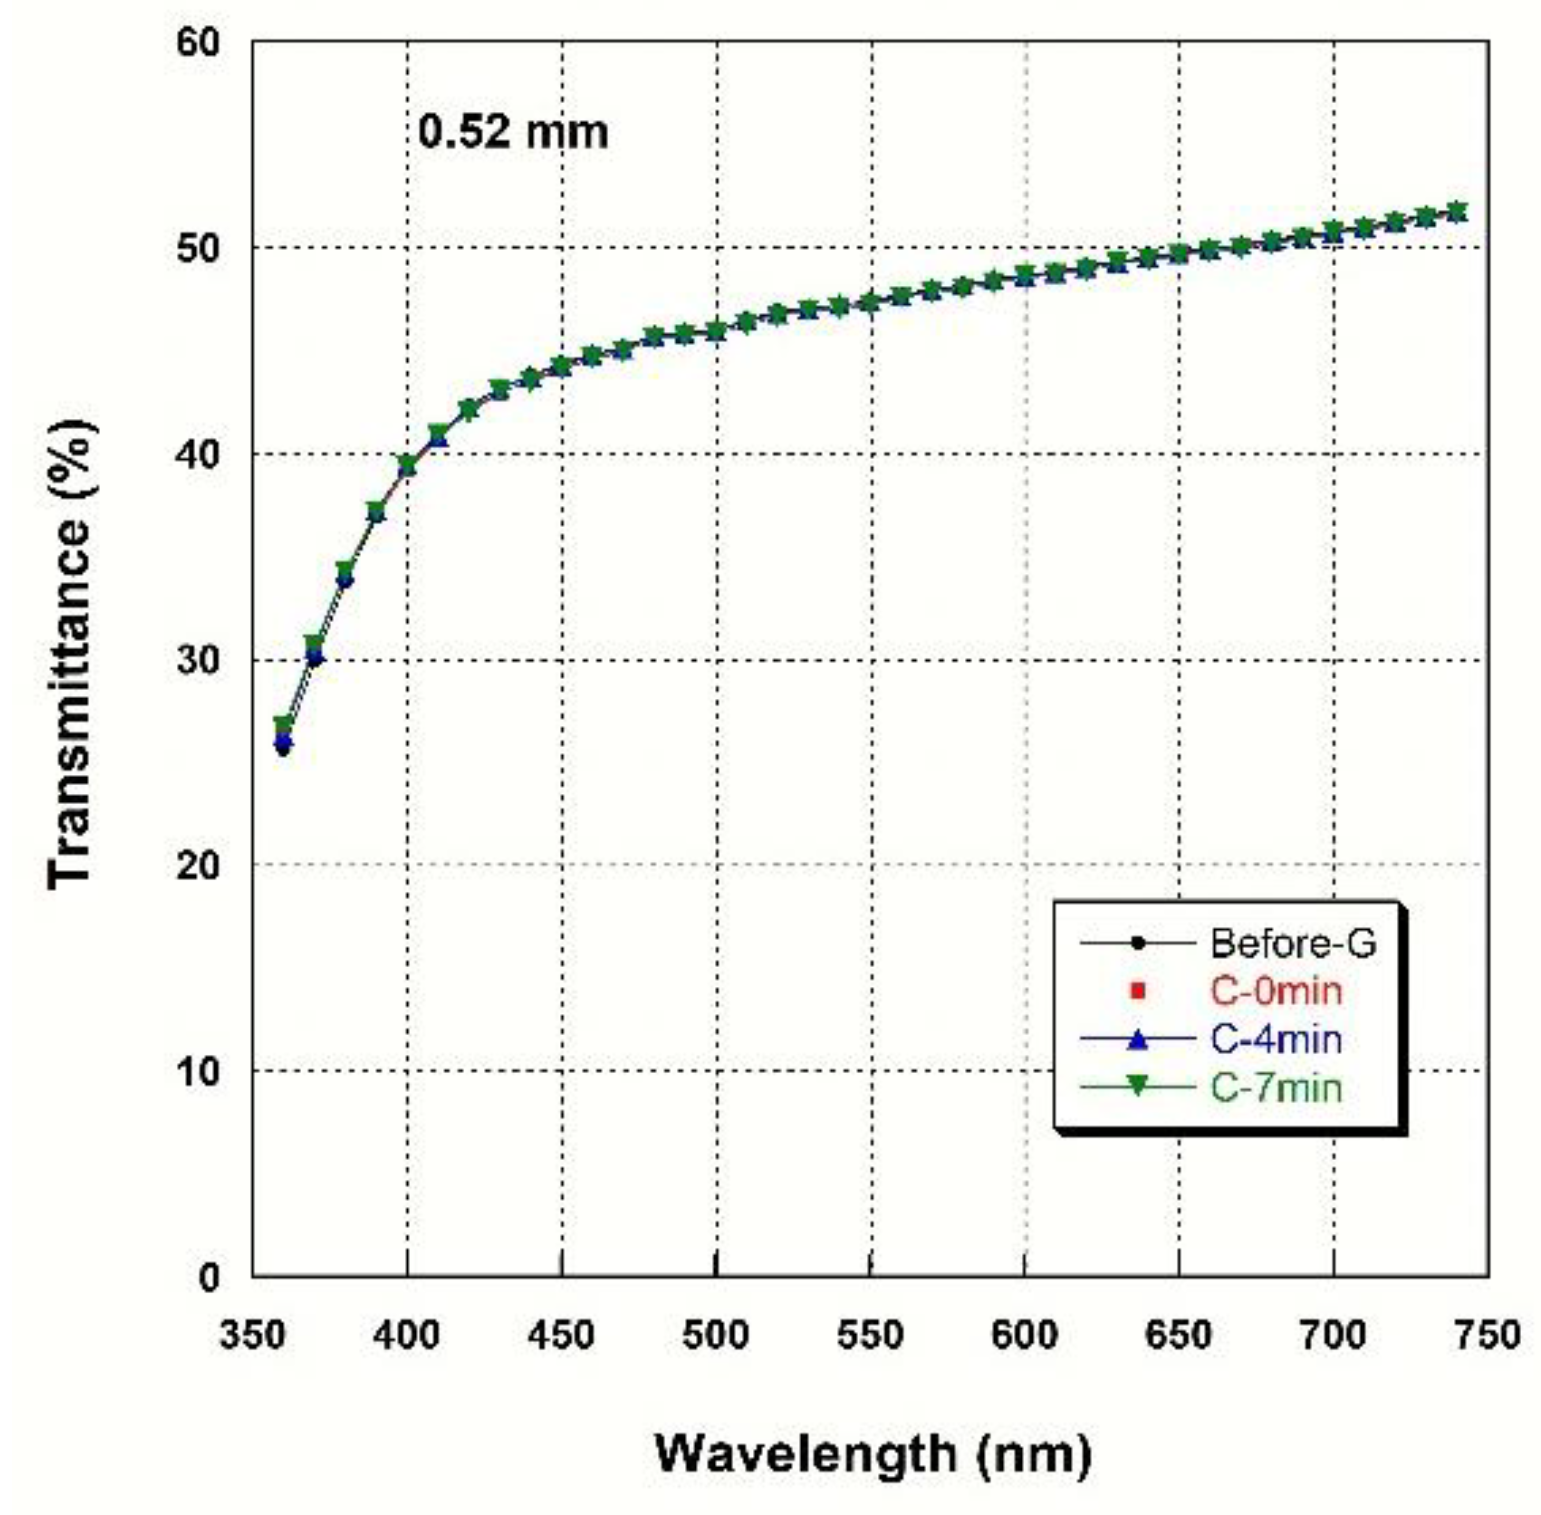
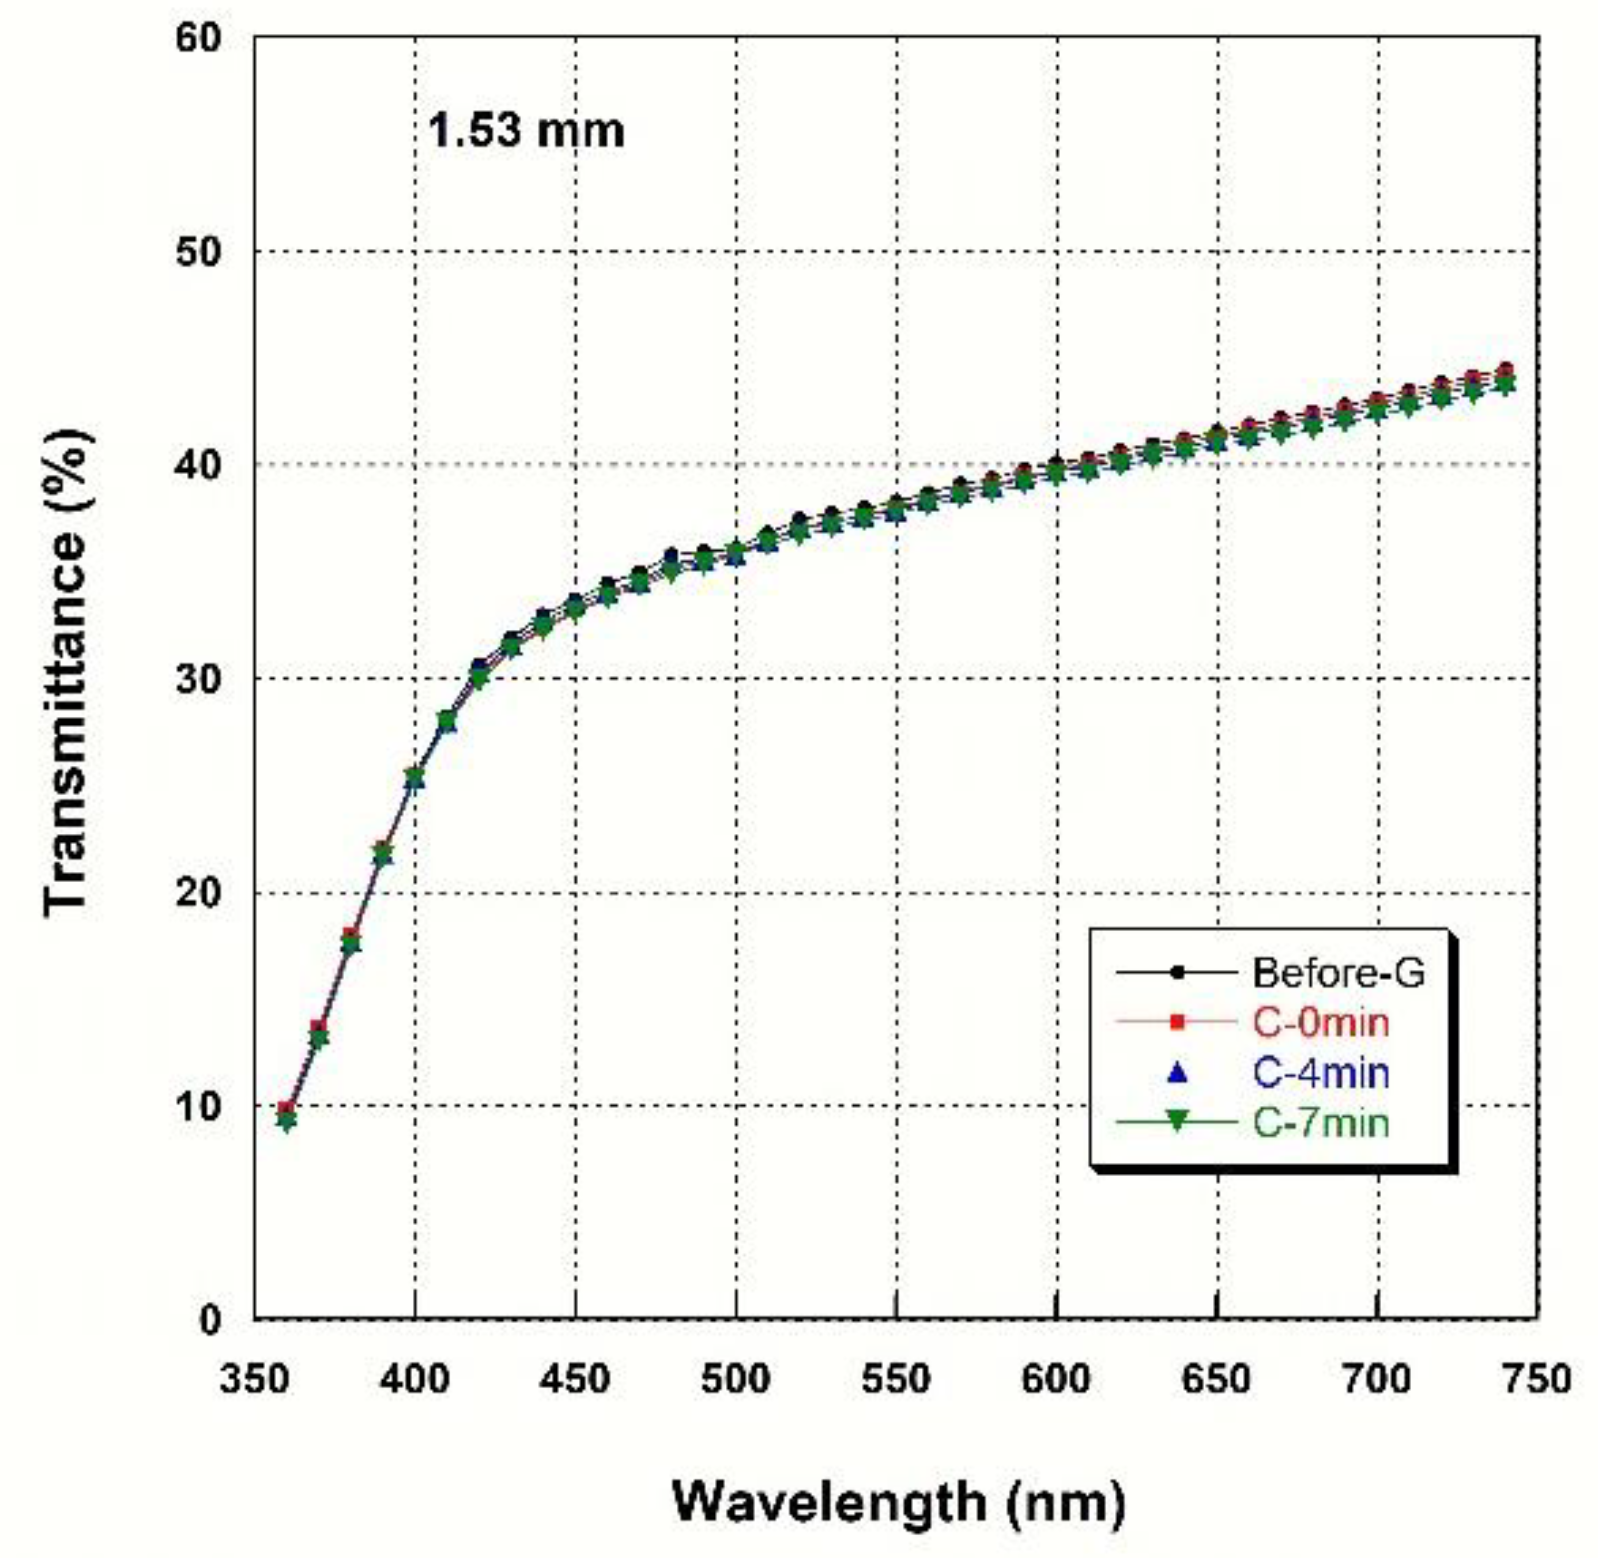
3.4. Light Transmittance
3.5. Translucency Parameter (TP)
3.6. Opalescence Parameter (OP)
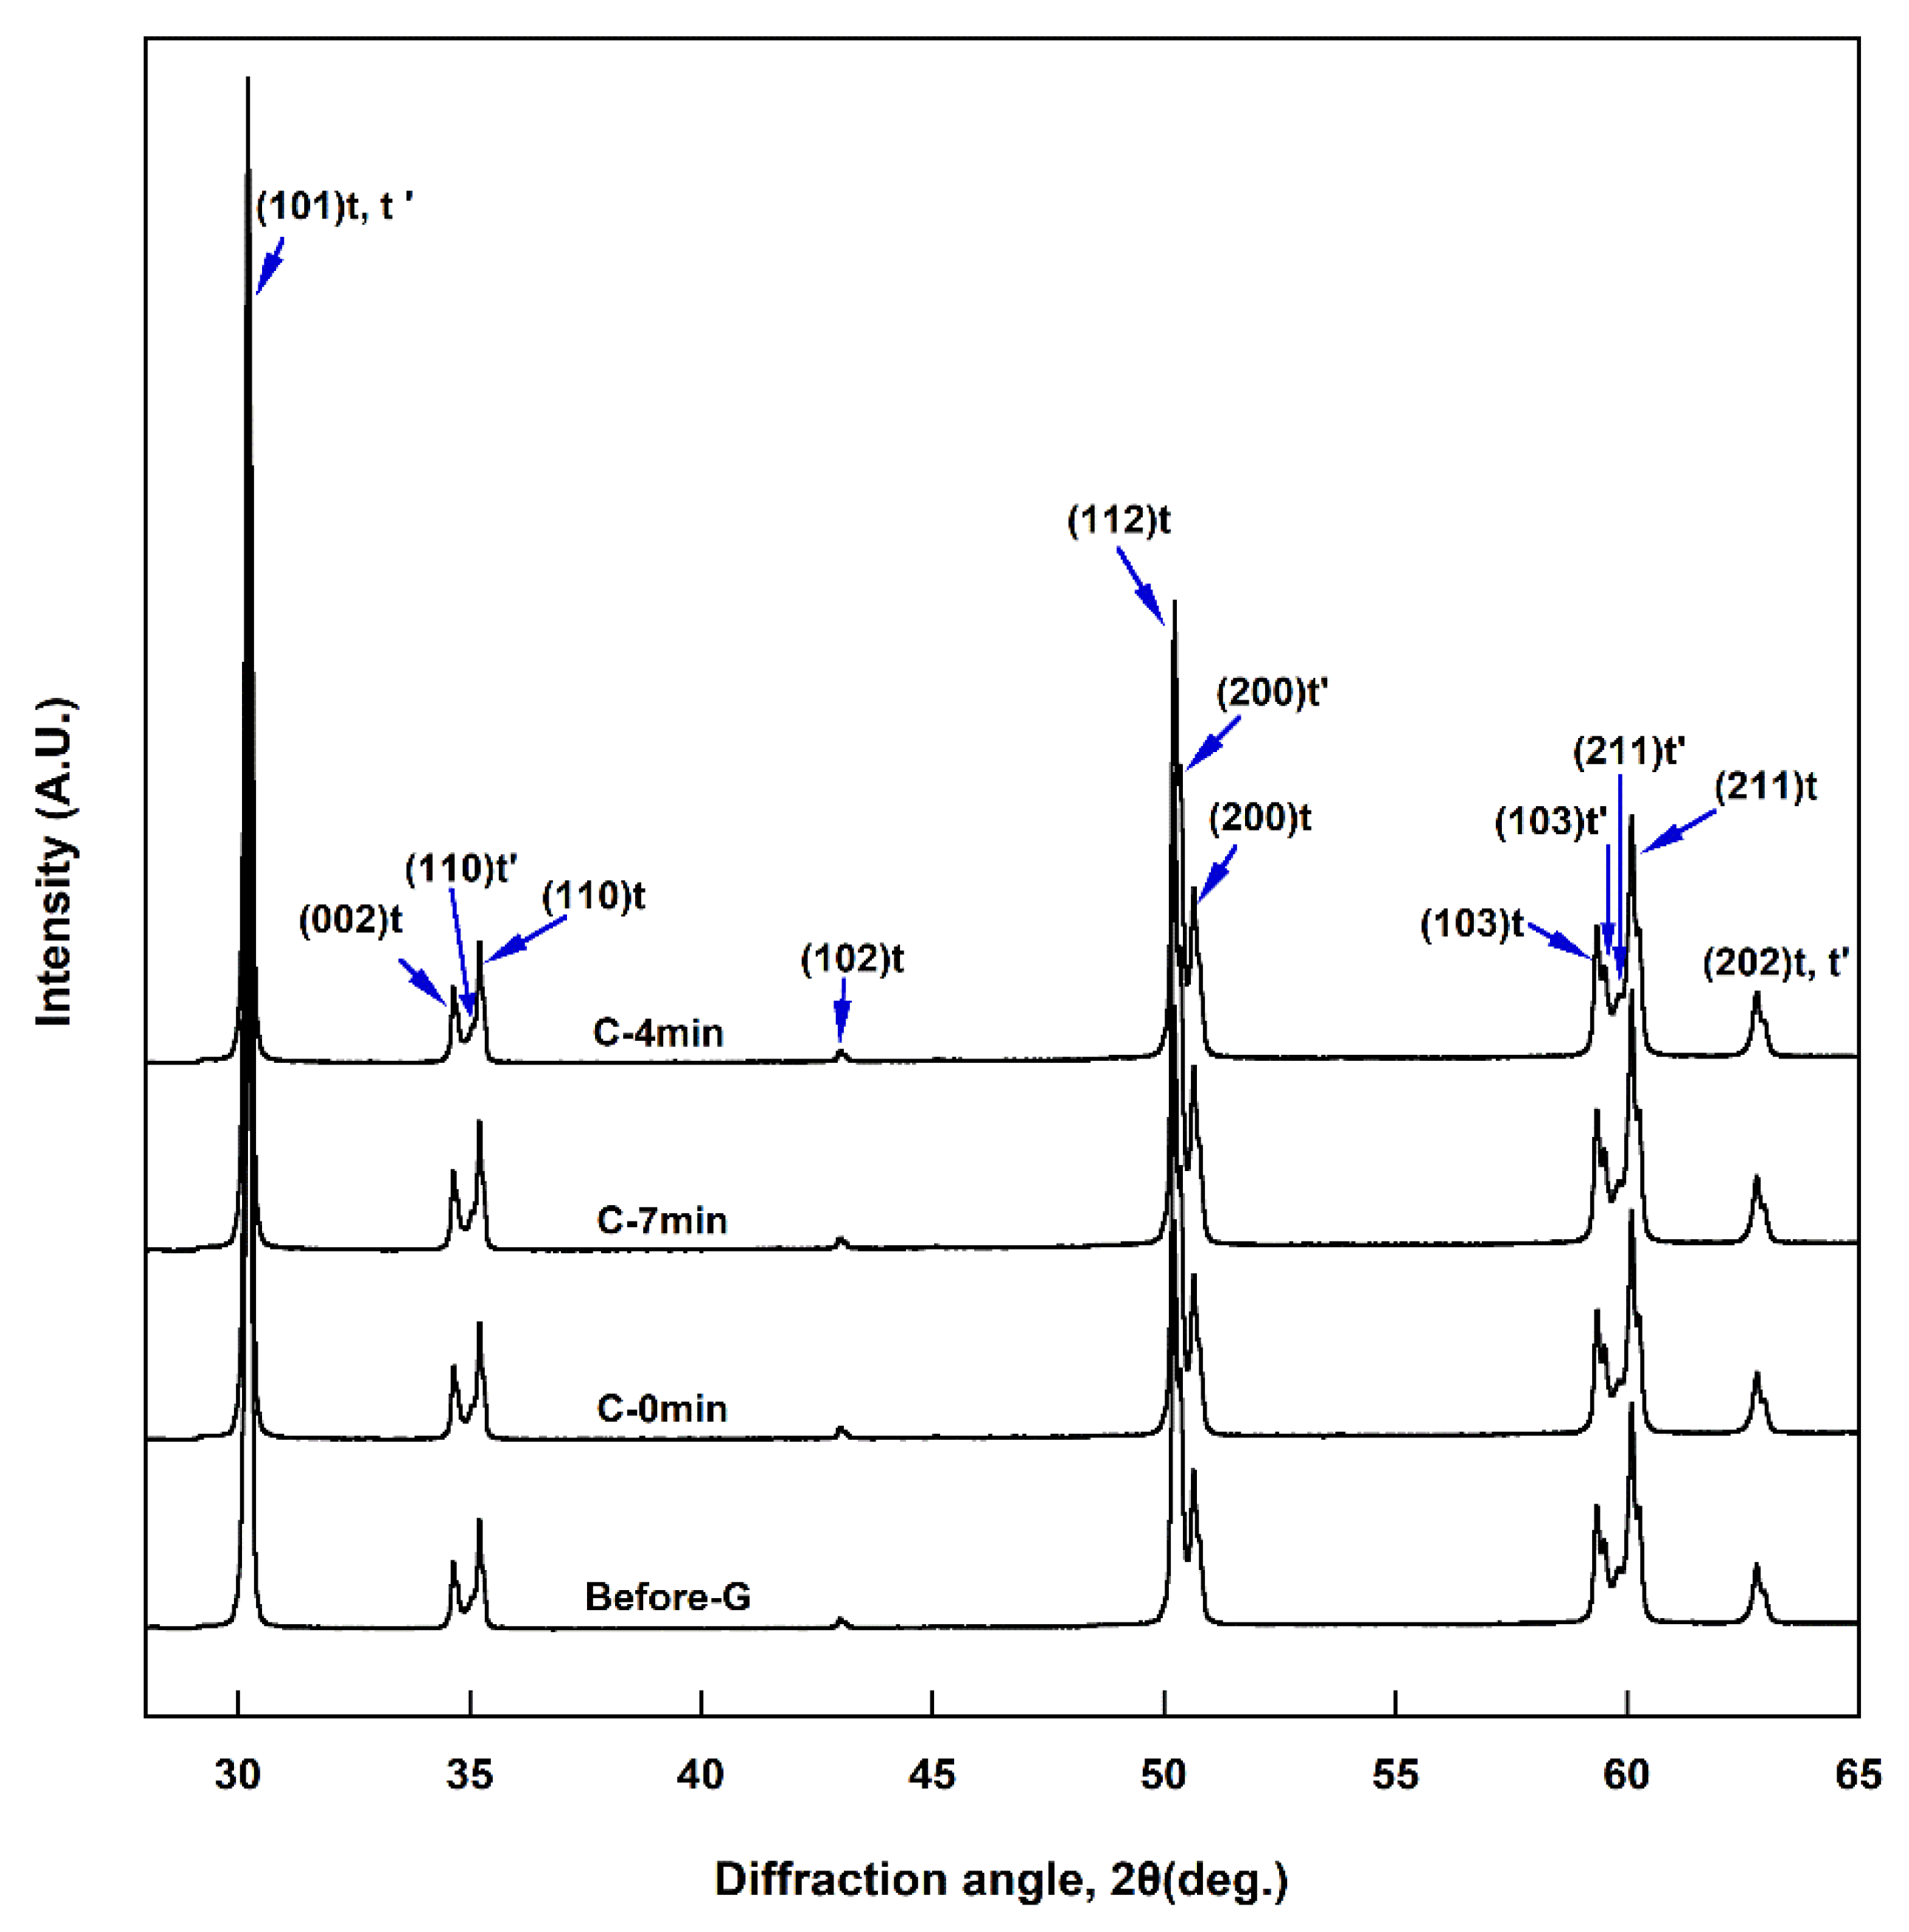
3.7. XRD Study
4. Discussion
5. Conclusions
Author Contributions
Funding
Institutional Review Board Statement
Informed Consent Statement
Data Availability Statement
Conflicts of Interest
References
- Ege, D.; Duru, I.; Kamali, A.R.; Boccaccini, A.R. Nitride, zirconia, alumina, and carbide coatings on Ti6Al4V femoral heads: Effect of deposition techniques on mechanical and tribological properties. Adv. Eng. Mater. 2017, 19, 1700177. [Google Scholar] [CrossRef]
- Pantoja-Pertegal, J.L.; Díaz-Parralejo, A.; Macías-García, A.; Sanchez-González, J.; Cuerda-Correa, E.M. Design, preparation, and characterization of Yttria-Stabilized Zirconia (YSZ) coatings obtained by electrophoretic deposition (EPD). Ceram. Int. 2021, 47, 13312–13321. [Google Scholar] [CrossRef]
- Kaluđerović, M.R.; Schreckenbach, J.P.; Graf, H.L. Zirconia coated titanium for implants and their interactions with osteoblast cells. Mater. Sci. Eng. C Mater. Biol. Appl. 2014, 44, 254–261. [Google Scholar] [CrossRef]
- Chang, E.; Chang, W.J.; Wang, B.C.; Yang, C.Y. Plasma spraying of zirconia-reinforced hydroxyapatite composite coatings on titanium: Part I Phase, microstructure and bonding strength. J. Mater. Sci. Mater. Med. 1997, 8, 193–200. [Google Scholar] [CrossRef]
- Jemata, A.; Ghazali, M.; Razali, M.; Otsuka, Y.; Rajabi, A. Effects of TiO2 on microstructural, mechanical properties and in-vitro bioactivity of plasma sprayed yttria stabilised zirconia coatings for dental application. Ceram. Int. 2018, 44, 4271–4281. [Google Scholar] [CrossRef]
- Kaliaraj, G.S.; A.M., K.K.; Alagarsamy, K.; M., S.P.; Vishwakarma, V. Silver-ceria stabilized zirconia composite coatings on titanium for potential implant applications. Surf. Coat. Technol. 2019, 368, 224–231. [Google Scholar] [CrossRef]
- De Jager, N.; Pallav, P.; Feilzer, A.J. The influence of design parameters on the FEA-determined stress distribution in CAD/CAM produced all-ceramic dental crowns. Dent. Mater. 2005, 21, 242–251. [Google Scholar] [CrossRef] [PubMed]
- Anusavice, K.; Shen, C.; Rawls, H.R. Phillips’ Science of Dental Materials, 12nd ed.; Elsevier Saunders: St. Louis, MO, USA, 2013; p. 439. [Google Scholar]
- Gostemeyer, G.; Jendras, M.; Dittmer, M.P.; Bach, F.W.; Stiesch, M.; Kohorst, P. Influence of cooling rate on zirconia/veneer interfacial adhesion. Acta. Biomater. 2010, 6, 4532–4538. [Google Scholar] [CrossRef]
- Lunt, A.; Salvati, E.; Baimpas, N.; Dolbnya, I.; Neo, T.K.; Korsunsky, A.M. Investigations into the interface failure of yttria partially stabilised zirconia-porcelain dental prostheses through microscale residual stress and phase quantification. Dent. Mater. 2019, 35, 1576–1593. [Google Scholar] [CrossRef] [PubMed]
- Kim, M.J.; Shin, H.J.; Kwon, Y.H.; Kim, H.I.; Seol, H.J. Effect of ice-quenching after oxidation treatment on hardening of a Pd-Cu-Ga-Zn alloy for bonding porcelain. J. Mech. Behav. Biomed. Mater. 2018, 79, 83–91. [Google Scholar] [CrossRef] [PubMed]
- Shin, H.J.; Kwon, Y.H.; Seol, H.J. Effect of ice quenching after oxidation with or without vacuum on the hardness of Pd-Ag-Au-In alloy during porcelain firing simulation. J. Mech. Behav. Biomed. Mater. 2019, 94, 93–109. [Google Scholar] [CrossRef]
- Chevailer, J.; Cales, B.; Drouin, J.M. Low-temperature aging of Y-TZP ceramics. J. Am. Ceram. Soc. 1999, 82, 2150–2154. [Google Scholar] [CrossRef]
- Gibson, I.R.; Irvine, J.T.S. Qualitative X-ray diffraction analysis of metastable tetragonal (t’) zirconia. J. Am. Ceram. Soc. 2001, 84, 615–618. [Google Scholar] [CrossRef]
- Sánchez-Bajo, F.; Cumbrera, F.L.; Guiberteau, F.; Domínguez-Rodriguez, A. Microstructural characterization of Y-PSZ (4 mol%) polycrystals by means of X-ray diffraction experiments. Mater. Lett. 1992, 15, 39–44. [Google Scholar] [CrossRef]
- Bhattacharjee, S.; Syamaprasad, U.; Galgali, R.K.; Mohanty, B.C. Preparation of stable t’-zirconia. Mater. Lett. 1992, 15, 281–284. [Google Scholar] [CrossRef]
- Jue, J.F.; Chen, J.; Virkar, A.V. Low-temperature aging of t’-zirconia: The role of microstructure on phase stability. J. Am. Ceram. Soc. 1991, 74, 1811–1820. [Google Scholar] [CrossRef]
- Qeblawi, D.M.; Muñoz, C.A.; Brewer, J.D.; Monaco, E.A. The effect of zirconia surface treatment on flexural strength and shear bond strength to a resin cement. J. Prosthet. Den. 2010, 103, 210–220. [Google Scholar] [CrossRef]
- Soylemez, B.; Sener, E.; Yurdakul, A.; Yurdakul, H. Fracture toughness enhancement of yttria-stabilized tetragonal zirconia polycrystalline ceramics through magnesia-partially stabilized zirconia addition. J. Sci. Adv. Mater. Dev. 2020, 5, 527–534. [Google Scholar] [CrossRef]
- Mohammadi-Bassir, M.; Babasafari, M.; Rezvani, M.B.; Jamshidian, M. Effect of coarse grinding, overglazing, and 2 polishing systems on the flexural strength, surface roughness, and phase transformation of yttrium-stabilized tetragonal zirconia. J. Prosthet. Dent. 2017, 118, 658–665. [Google Scholar] [CrossRef]
- Zhang, F.; Inokoshi, M.; Batuk, M.; Hadermann, J.; Naert, I.; Van Meerbeek, B.; Vleugels, J. Strength, toughness and aging stability of highly-translucent Y-TZP ceramics for dental restorations. Dent. Mater. 2016, 32, e327–e337. [Google Scholar] [CrossRef] [PubMed]
- Zhang, C.; Luo, Z.; Cao, J.; Yuan, J.; Jiang, M.; Wang, P.; Liu, C.; Jiang, C.P.; Chen, Z. Mechanical reinforcement of 3D printed cordierite-zirconia composites. Ceram. Int. 2021, in press. [Google Scholar] [CrossRef]
- Li, Q.L.; Jiang, Y.Y.; Wei, Y.R.; Swain, M.V.; Yao, M.F.; Li, D.S.; Wei, T.; Jian, Y.T.; Zhao, K.E.; Wang, X.D. The influence of yttria content on the microstructure, phase stability and mechanical properties of dental zirconia. Ceram. Int. 2021, in press. [Google Scholar] [CrossRef]
- Liu, Y.C.; Lin, T.H.; Lin, Y.Y.; Hu, S.W.; Liu, J.F.; Yang, C.C.; Yan, M. Optical properties evaluation of rapid sintered translucent zirconia with two dental colorimeters. J. Dent. Sci. 2021, in press. [Google Scholar] [CrossRef]
- Hayashi, K.; Kobayashi, O.; Toyoda, S.; Morinaga, K. Transmission optical properties of polycrystalline alumina with submicron grains. Mater. Trans. JIM 1991, 32, 1024–1029. [Google Scholar] [CrossRef] [Green Version]
- Lümkemann, N.; Stawarczyk, B. Impact of hydrothermal aging on the light transmittance and flexural strength of colored yttria-stabilized zirconia materials of different formulations. J. Prosthet. Dent. 2020, 125, 518–526. [Google Scholar] [CrossRef]
- Cho Too, T.D.; Inokoshi, M.; Nozaki, K.; Shimizubata, M.; Nakai, H.; Liu, H.; Minakuchi, S. Influence of sintering conditions on translucency, biaxial flexural strength, microstructure, and low-temperature degradation of highly translucent dental zirconia. Dent. Mater. J. 2021, 40, 1320–1328. [Google Scholar] [CrossRef]
- Zhang, Y. Making yttria-stabilized tetragonal zirconia translucent. Dent. Mater. 2014, 30, 1195–1203. [Google Scholar] [CrossRef] [Green Version]
- Zhang, Y.; Lawn, B.R. Novel zirconia materials in dentistry. J. Dent. Res. 2018, 97, 140–147. [Google Scholar] [CrossRef] [PubMed]
- Kim, H.K. Effect of a rapid-cooling protocol on the optical and mechanical properties of dental monolithic zirconia containing 3–5 mol% Y2O3. Materials 2020, 13, 1923. [Google Scholar] [CrossRef] [Green Version]
- Li, L.; Zhao, C.; Du, Z.; Qiu, Y.; Si, S. Rapid-sintered dental zirconia for chair-side one-visit application. Int. J. Appl. Ceram. Technol. 2019, 16, 1830–1835. [Google Scholar] [CrossRef]
- Salamon, D.; Maca, K.; Shen, Z. Rapid sintering of crack-free zirconia ceramics by pressure-less spark plasma sintering. Scr. Mater. 2012, 66, 899–902. [Google Scholar] [CrossRef]
- Shiraishi, T.; Watanabe, I. Thickness dependence of light transmittance, translucency and opalescence of a ceria-stabilized zirconia/alumina nanocomposite for dental applications. Dent. Mater. 2016, 32, 660–667. [Google Scholar] [CrossRef] [PubMed]
- Shiraishi, T.; Wood, D.J.; Shinozaki, N.; Van Noort, R. Optical properties of base dentin ceramics for all-ceramic restorations. Dent. Mater. 2011, 27, 165–172. [Google Scholar] [CrossRef] [Green Version]
- Lee, Y.K.; Lu, H.; Powers, J.M. Measurement of opalescence of resin composites. Dent. Mater. 2005, 21, 1068–1074. [Google Scholar] [CrossRef] [PubMed]
- Wang, F.; Takahashi, H.; Iwasaki, N. Translucency of dental ceramics with different thicknesses. J. Prosthet. Dent. 2013, 110, 14–20. [Google Scholar] [CrossRef]
- Teufer, G. The crystal structure of tetragonal ZrO2. Acta. Cryst. 1962, 15, 1187. [Google Scholar] [CrossRef]
- Nam, M.G.; Park, M.G. Changes in the flexural strength of translucent zirconia due to glazing and low-temperature degradation. J. Prosthet. Dent. 2018, 120, 969.e1–969.e6. [Google Scholar] [CrossRef] [PubMed]
- Weibull, W. A statistical distribution function of wide applicability. J. Appl. Mech. ASME 1951, 18, 293–297. [Google Scholar] [CrossRef]
- Sen, N.; Isler, S. Microstructural, physical, and optical characterization of high-translucency zirconia ceramics. J. Prosthet. Dent. 2019, 123, 761–768. [Google Scholar] [CrossRef]
- Rice, R.W. Effects of environment and temperature on ceramic tensile strength-grain size relations. J. Mater. Sci. 1997, 32, 3071–3087. [Google Scholar] [CrossRef]
- Cekic-Nagas, I.; Egilmez, F.; Ergun, G.; Kaya, B.M. Light transmittance of zirconia as a function of thickness and microhardness of resin cements under different thicknesses of zirconia. Med. Oral. Patol. Oral. Cir. Bucal. 2013, 18, e212–e218. [Google Scholar] [CrossRef] [PubMed]
- Tilley, R.J.D. Colour and the Optical Properties of Materials, 2nd ed.; John Wiley & Sons, Ltd.: Hoboken, NJ, USA, 2011; pp. 33–36. [Google Scholar]
- Vichi, A.; Louca, C.; Corciolani, G.; Ferrari, M. Color related to ceramic and zirconia restorations: A review. Dent. Mater. 2011, 27, 97–108. [Google Scholar] [CrossRef]
- Elsaka, S.E. Optical and Mechanical Properties of Newly Developed Monolithic Multilayer Zirconia. J. Prosthodont. 2019, 28, e279–e284. [Google Scholar] [CrossRef] [PubMed] [Green Version]
- Alghazzawi, T.F. The effect of extended aging on the optical properties of different zirconia materials. J. Prosthodont. Res. 2017, 61, 305–314. [Google Scholar] [CrossRef] [PubMed]


| Elements | ZrO2 + HfO2 + Y2O3 | Y2O3 | HfO2 | Al2O3 + Other Oxides |
|---|---|---|---|---|
| Content (wt.%) | ≥99.0 | >4.5–≤6.0 | ≤5 | ≤1.0 |
| Pre- Drying (min) | Heat Rate (°C/min) | Start Temp. (°C) | Final Temp. (°C) | Hold Time (min) | Vacuum Level (cm/HG) | Start Vacuum (°C) | Vacuum Release (°C) | Cooling Rate (°C/min) |
|---|---|---|---|---|---|---|---|---|
| 5 | 65 | 600 | 850 | 1 | 72 | 600 | 850 | >250 (C-0 min) 62.5 (C-4 min) 35.7 (C-7 min) |
| Code | Sample Number | Mean Flexural Strength ± SD (MPa) | Weibull Modulus (m) (95% Confidence Interval) | Characteristic Strength, σ0 (MPa) (95% Confidence Interval) | Mean, HV (±SD) | Mean Grain Size ±SD (μm) |
|---|---|---|---|---|---|---|
| Before-G | 25 | 904.0 a (99.9) | 9.3 (7.0–12.3) | 949.0 (907.2–992.7) | 1325.7 ab (36.6) | 0.47 a (0.17) |
| C-0 min | 25 | 848.9 a (149.2) | 7.2 (5.2–9.9) | 909.0 (858.2–962.7) | 1327.6 ab (26.3) | 0.45 a (0.17) |
| C-4 min | 25 | 858.0 a (128.1) | 8.5 (6.2–11.5) | 909.2 (866.0–955.0) | 1338.9 b (23.0) | 0.47 a (0.19) |
| C-7 min | 25 | 887.0 a (114.2) | 9.4 (6.8–13.0) | 935.9 (895.5–978.1) | 1308.1 a (30.7) | 0.51 b (0.17) |
| Thickness (mm) | Before-G | C-0 min | C-4 min | C-7 min |
|---|---|---|---|---|
| 0.52 | 45.82 D,a (0.32) | 45.78 D,a (0.17) | 45.84 D,a (0.04) | 45.72 D,a (0.41) |
| 1.02 | 40.10 C,a (0.59) | 40.04 C,a (0.21) | 40.30 C,a (0.18) | 40.16 C,a (0.35) |
| 1.53 | 35.88 B,a (0.33) | 35.61 B,a (0.56) | 35.54 B,a (0.56) | 35.26 B,a (0.83) |
| 2.02 | 32.66 A,a (0.49) | 32.09 A,a (0.72) | 32.53 A,a (0.35) | 32.50 A,a (0.51) |
| Code | Regression Equation | R2 | P |
|---|---|---|---|
| Before-G | y = 50.774exp−0.225x | 0.988 | <0.001 |
| C-0 min | y =51.145exp−0.237x | 0.989 | <0.001 |
| C-4 min | y =51.024exp−0.231x | 0.989 | <0.001 |
| C-7 min | y =50.826exp−0.231x | 0.980 | <0.001 |
| Thickness (mm) | Before-G | C-0 min | C-4 min | C-7 min |
|---|---|---|---|---|
| 0.52 | 17.24 D,a (0.20) | 17.48 D,ab (0.18) | 17.57 D,b (0.08) | 17.59 D,b (0.05) |
| 1.02 | 12.11 C,a (0.47) | 12.25 C,a (0.19) | 12.15 C,a (0.36) | 12.26 C,a (0.14) |
| 1.53 | 8.70 B,a (0.26) | 8.72 B,a (0.05) | 8.86 B,a (0.10) | 8.74 B,a (0.06) |
| 2.02 | 6.27 A,a (0.07) | 6.07 A,a (0.26) | 6.11 A,a (0.10) | 6.16 A,a (0.05) |
| Code | Regression Equation | R2 | P |
|---|---|---|---|
| Before-G | y = 23.936exp−0.673x | 0.996 | <0.001 |
| C-0 min | y = 24.844exp−0.703x | 0.997 | <0.001 |
| C-4 min | y = 24.771exp−0.697x | 0.998 | <0.001 |
| C-7 min | y = 24.803exp−0.697x | 1.0 | <0.001 |
| Thickness (mm) | Before-G | C-0 min | C-4 min | C-7 min |
|---|---|---|---|---|
| 0.52 | 6.20 A,a (0.16) | 6.42 A,a (0.13) | 6.33 A,a (0.27) | 6.39 A,a (0.36) |
| 1.02 | 8.89 B,a (0.21) | 8.94 B,a (0.05) | 8.74 B,a (0.19) | 9.01 B,a (0.14) |
| 1.53 | 10.77 C,a (0.22) | 10.83 C,a (0.11) | 10.74 C,a (0.27) | 10.97 C,a (0.12) |
| 2.02 | 12.31 D,a (0.10) | 11.69 D,a (0.61) | 11.93 D,a (0.22) | 12.17 D,a (0.17) |
Publisher’s Note: MDPI stays neutral with regard to jurisdictional claims in published maps and institutional affiliations. |
© 2021 by the authors. Licensee MDPI, Basel, Switzerland. This article is an open access article distributed under the terms and conditions of the Creative Commons Attribution (CC BY) license (https://creativecommons.org/licenses/by/4.0/).
Share and Cite
Cho, M.-H.; Seol, H.-J. Effect of Cooling Rate during Glazing on the Mechanical and Optical Properties of Monolithic Zirconia with 3 mol% Yttria Content. Materials 2021, 14, 7474. https://doi.org/10.3390/ma14237474
Cho M-H, Seol H-J. Effect of Cooling Rate during Glazing on the Mechanical and Optical Properties of Monolithic Zirconia with 3 mol% Yttria Content. Materials. 2021; 14(23):7474. https://doi.org/10.3390/ma14237474
Chicago/Turabian StyleCho, Mi-Hyang, and Hyo-Joung Seol. 2021. "Effect of Cooling Rate during Glazing on the Mechanical and Optical Properties of Monolithic Zirconia with 3 mol% Yttria Content" Materials 14, no. 23: 7474. https://doi.org/10.3390/ma14237474
APA StyleCho, M.-H., & Seol, H.-J. (2021). Effect of Cooling Rate during Glazing on the Mechanical and Optical Properties of Monolithic Zirconia with 3 mol% Yttria Content. Materials, 14(23), 7474. https://doi.org/10.3390/ma14237474