
Mechanical Properties of Low-Performance Concrete (LPC) and Shear Capacity of Old Unreinforced LPC Squat Walls

Abstract
:1. Introduction
2. Experimental Program
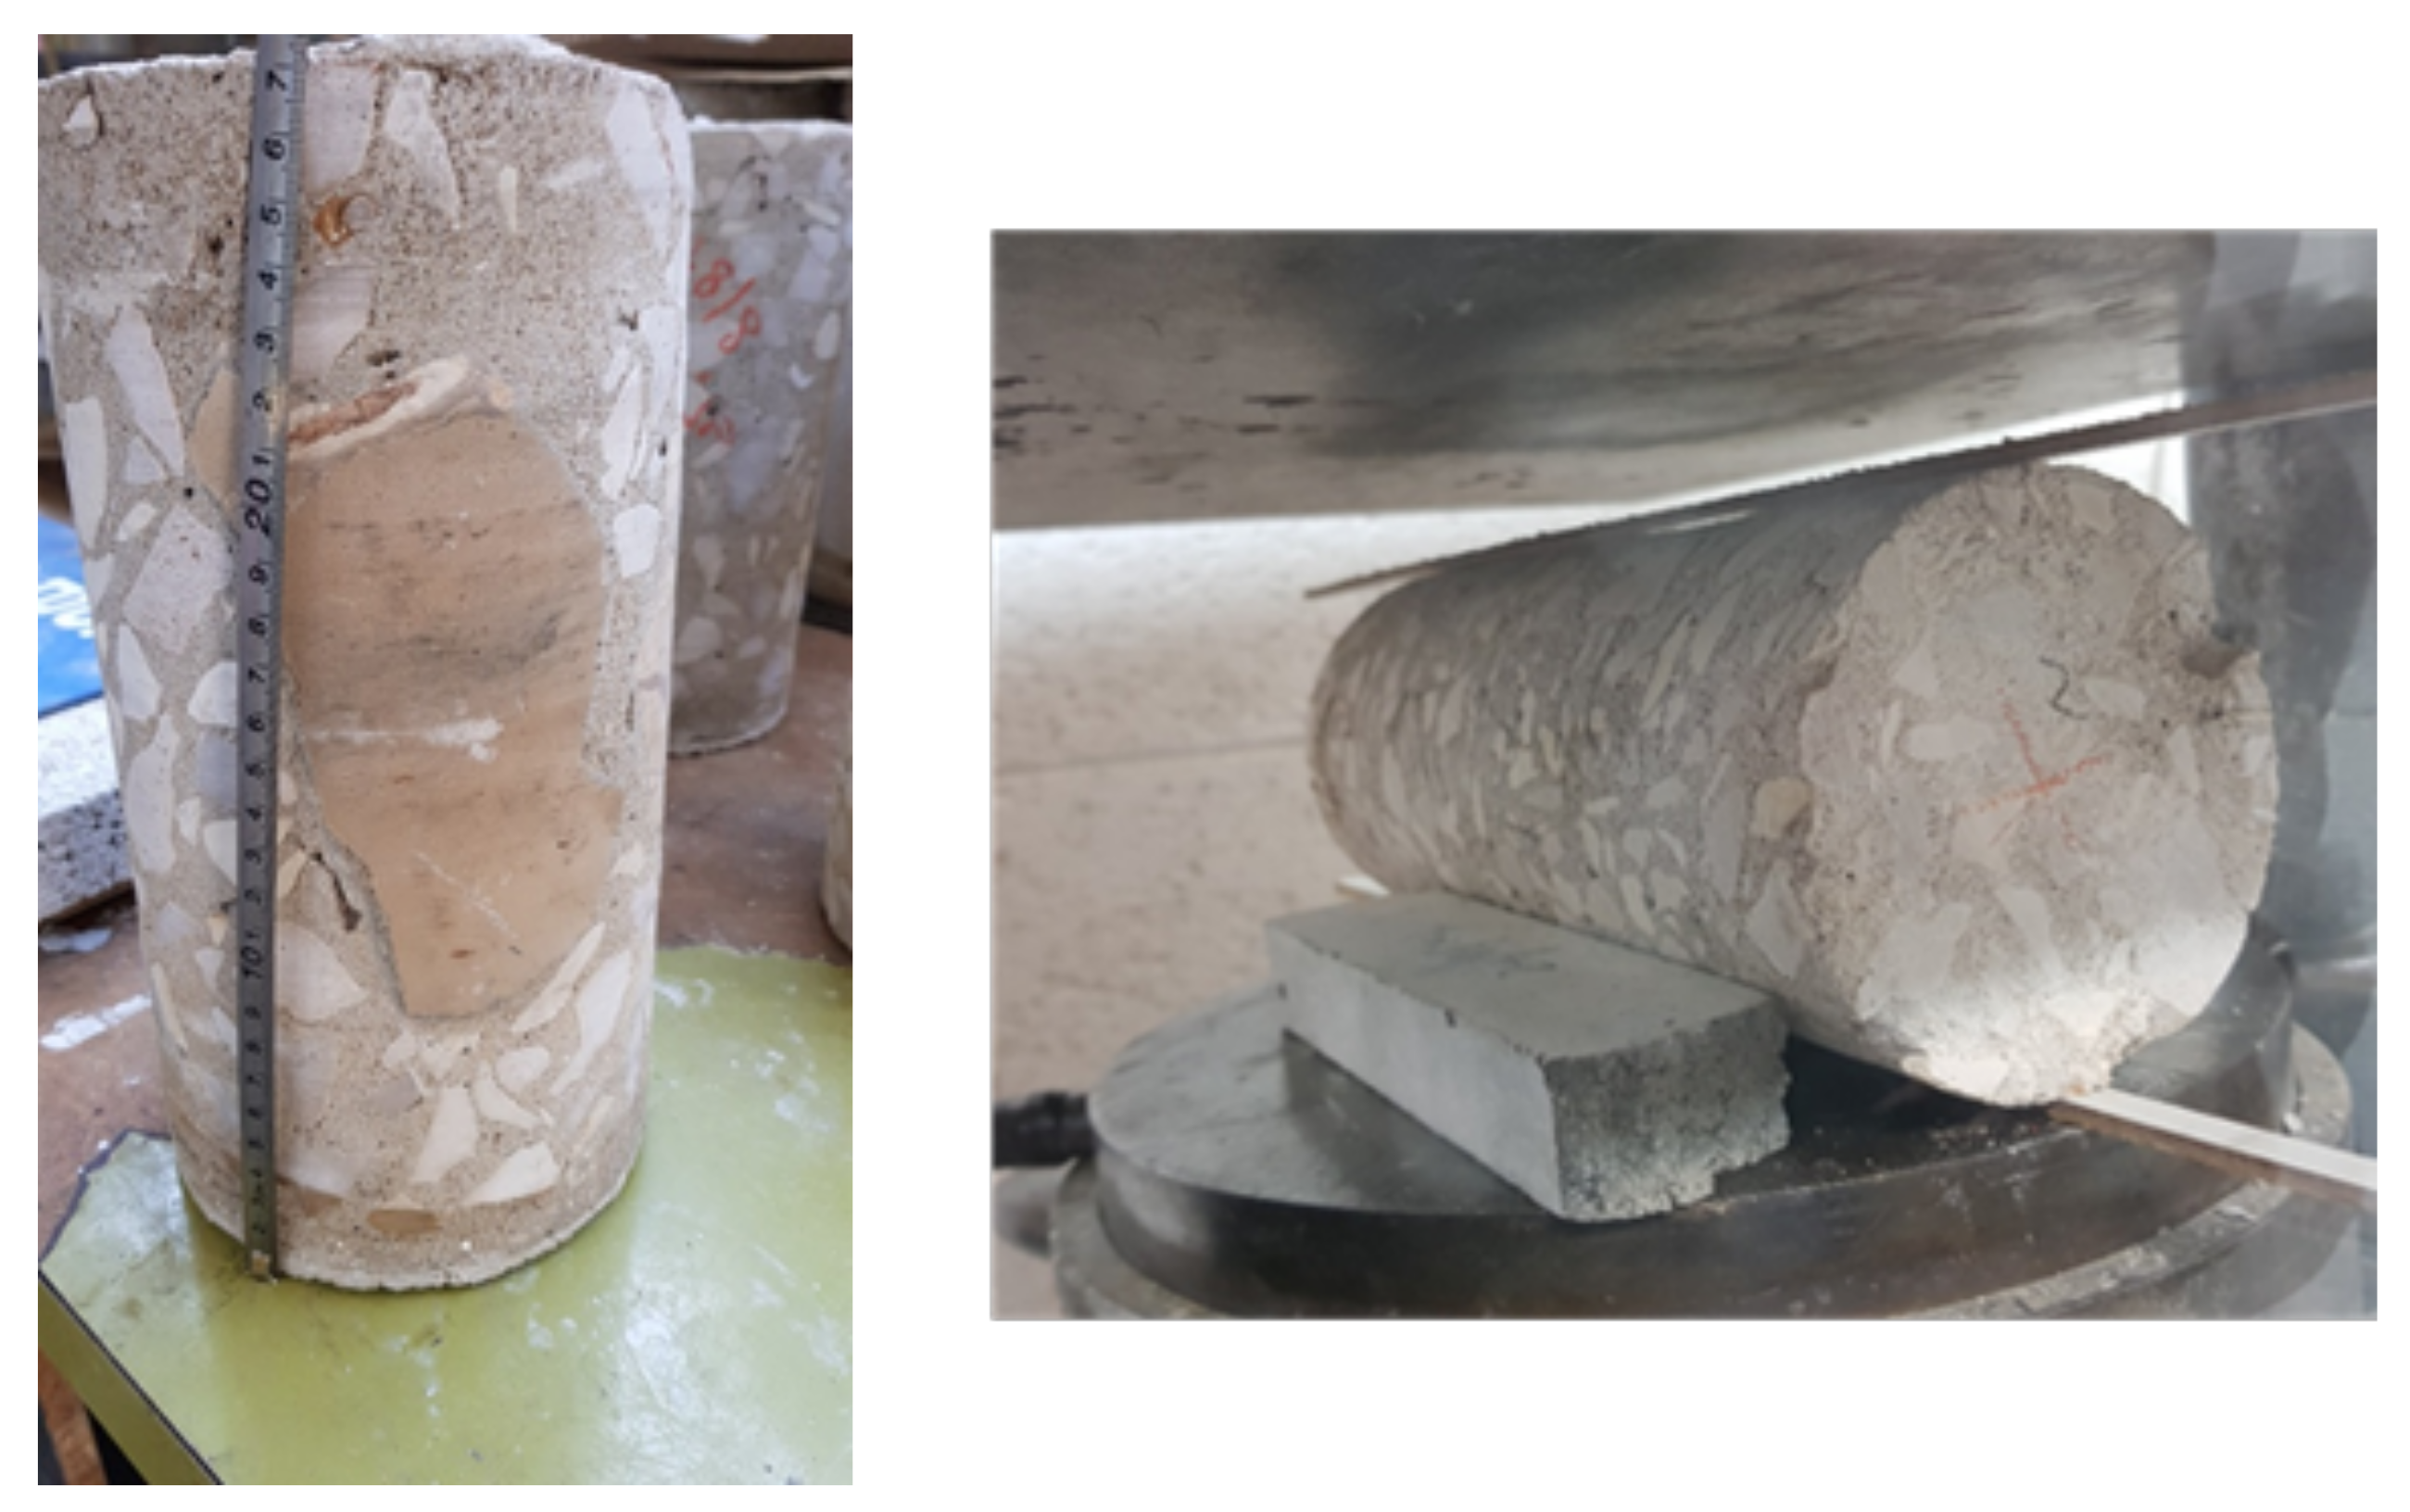
2.1. Compressive Strength
2.2. Splitting Tensile Tests
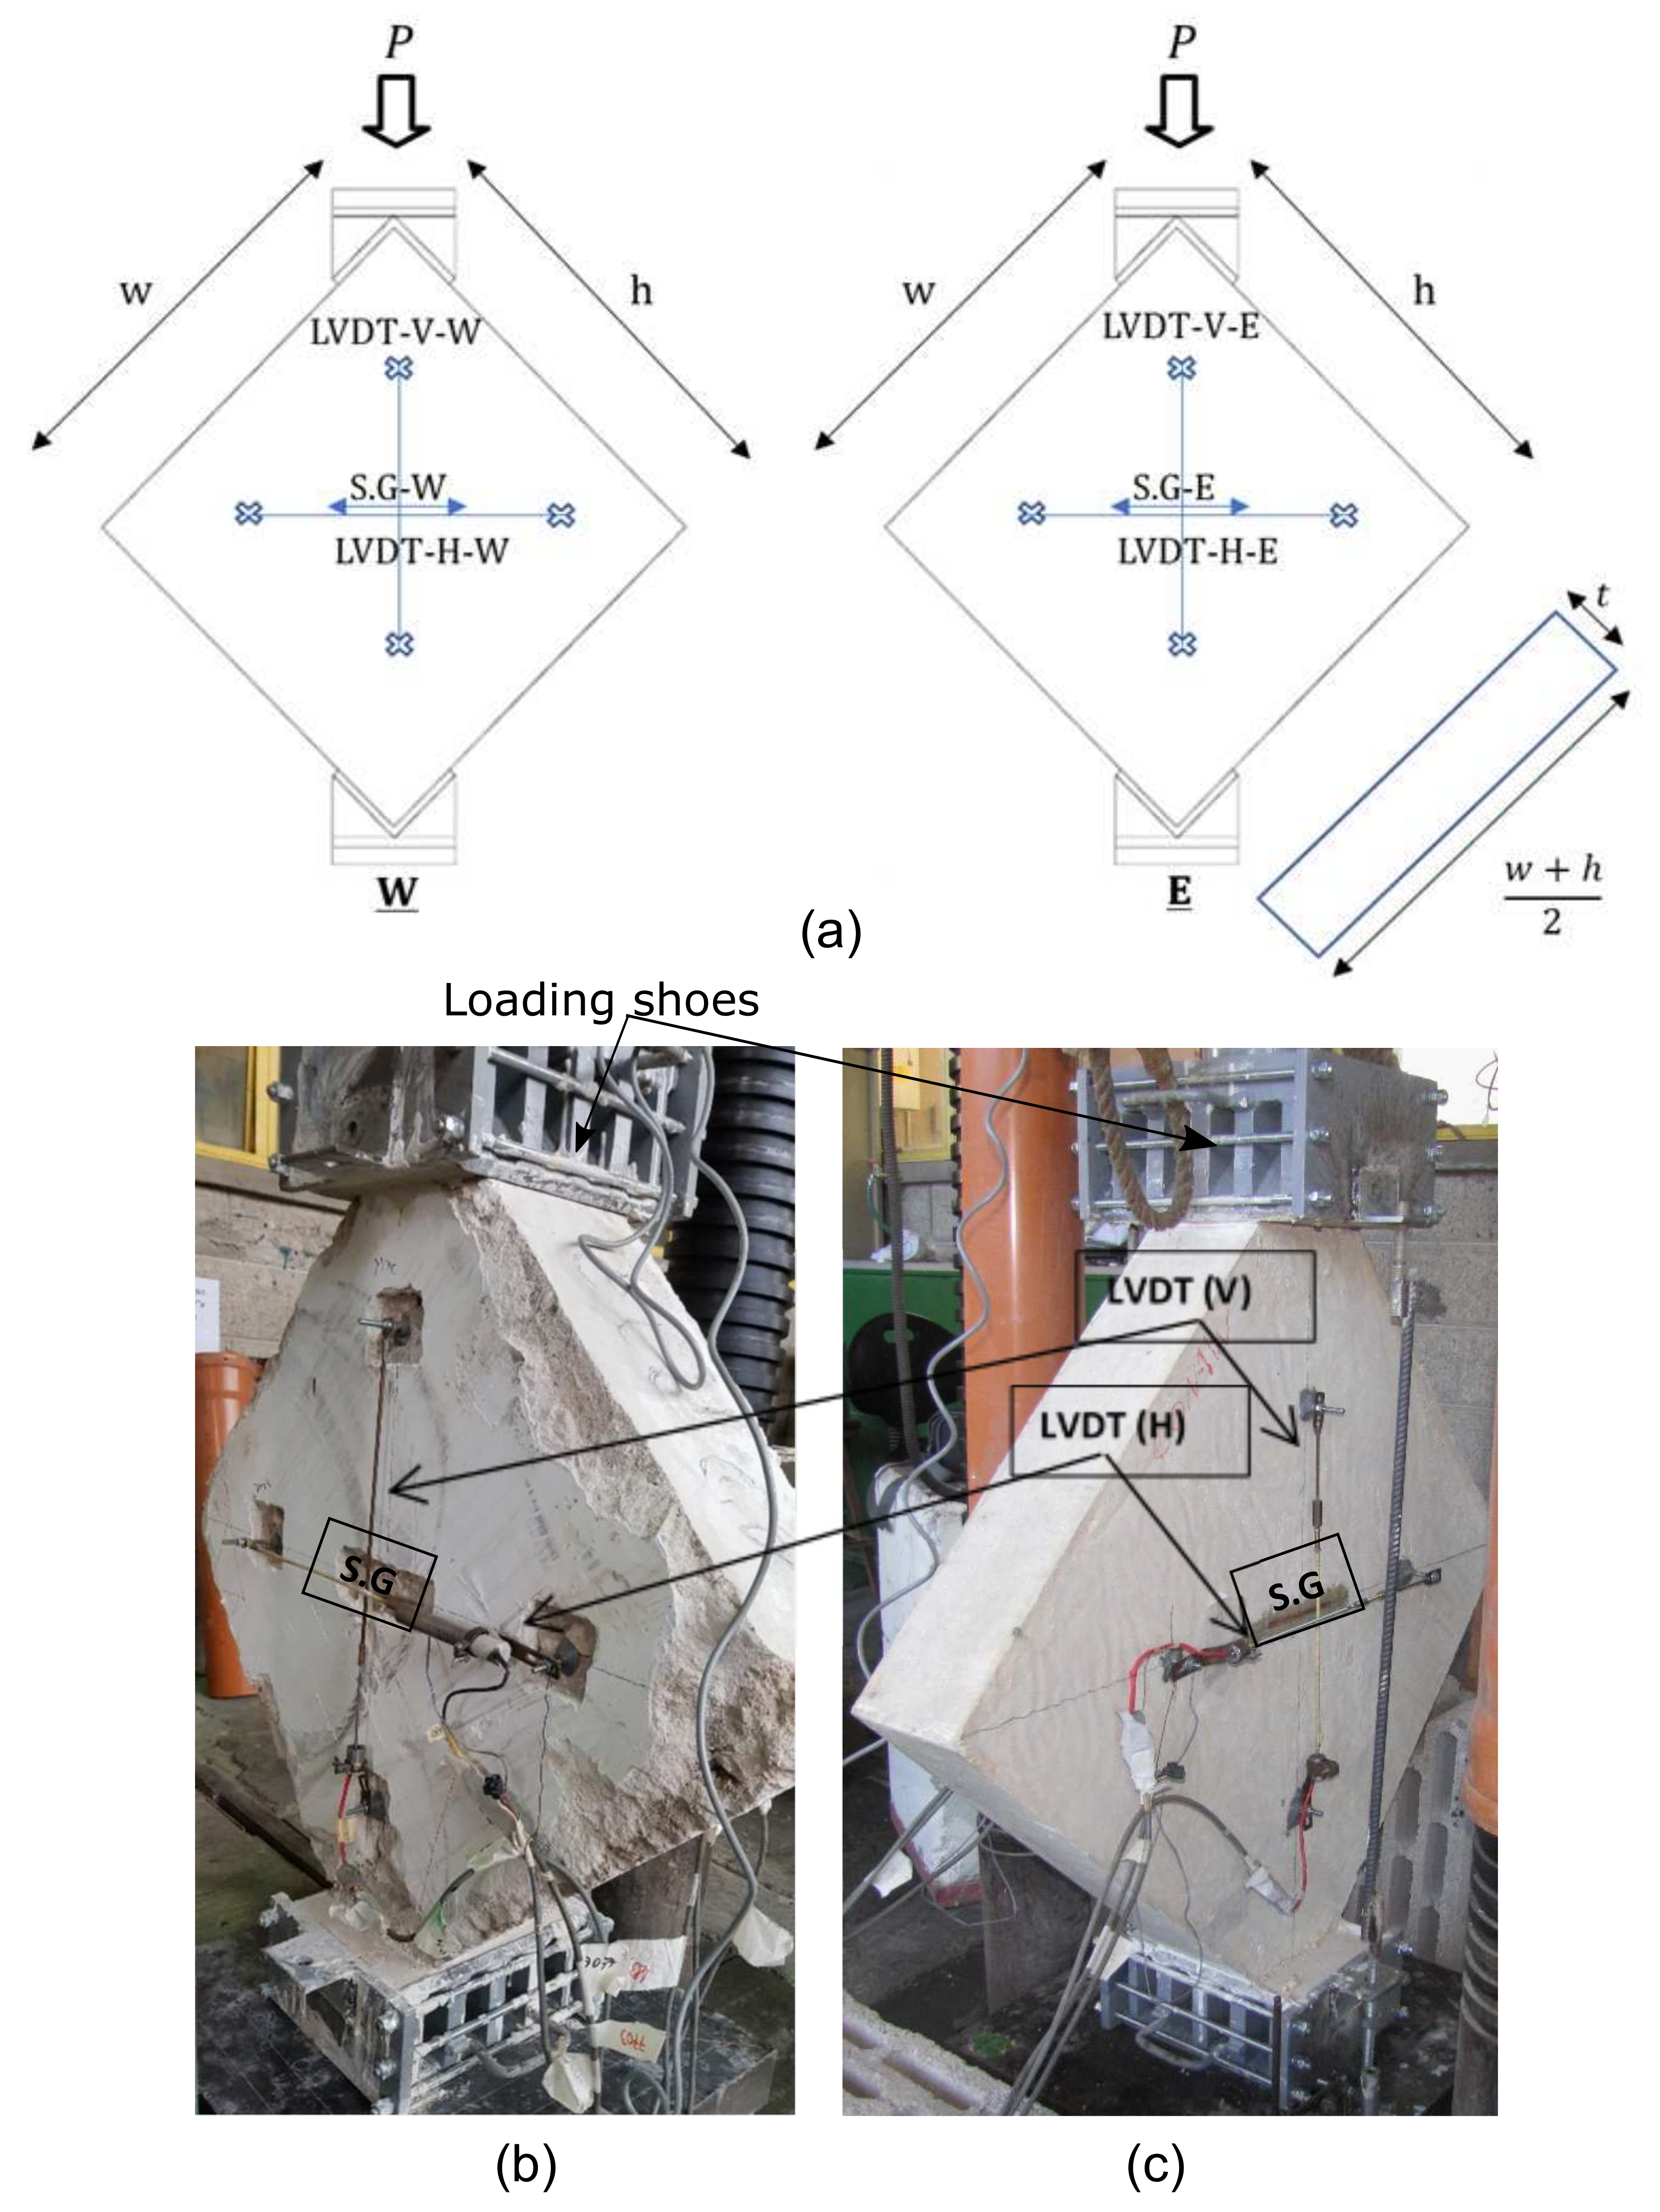
2.3. Diagonal Compression Tests (DCT)
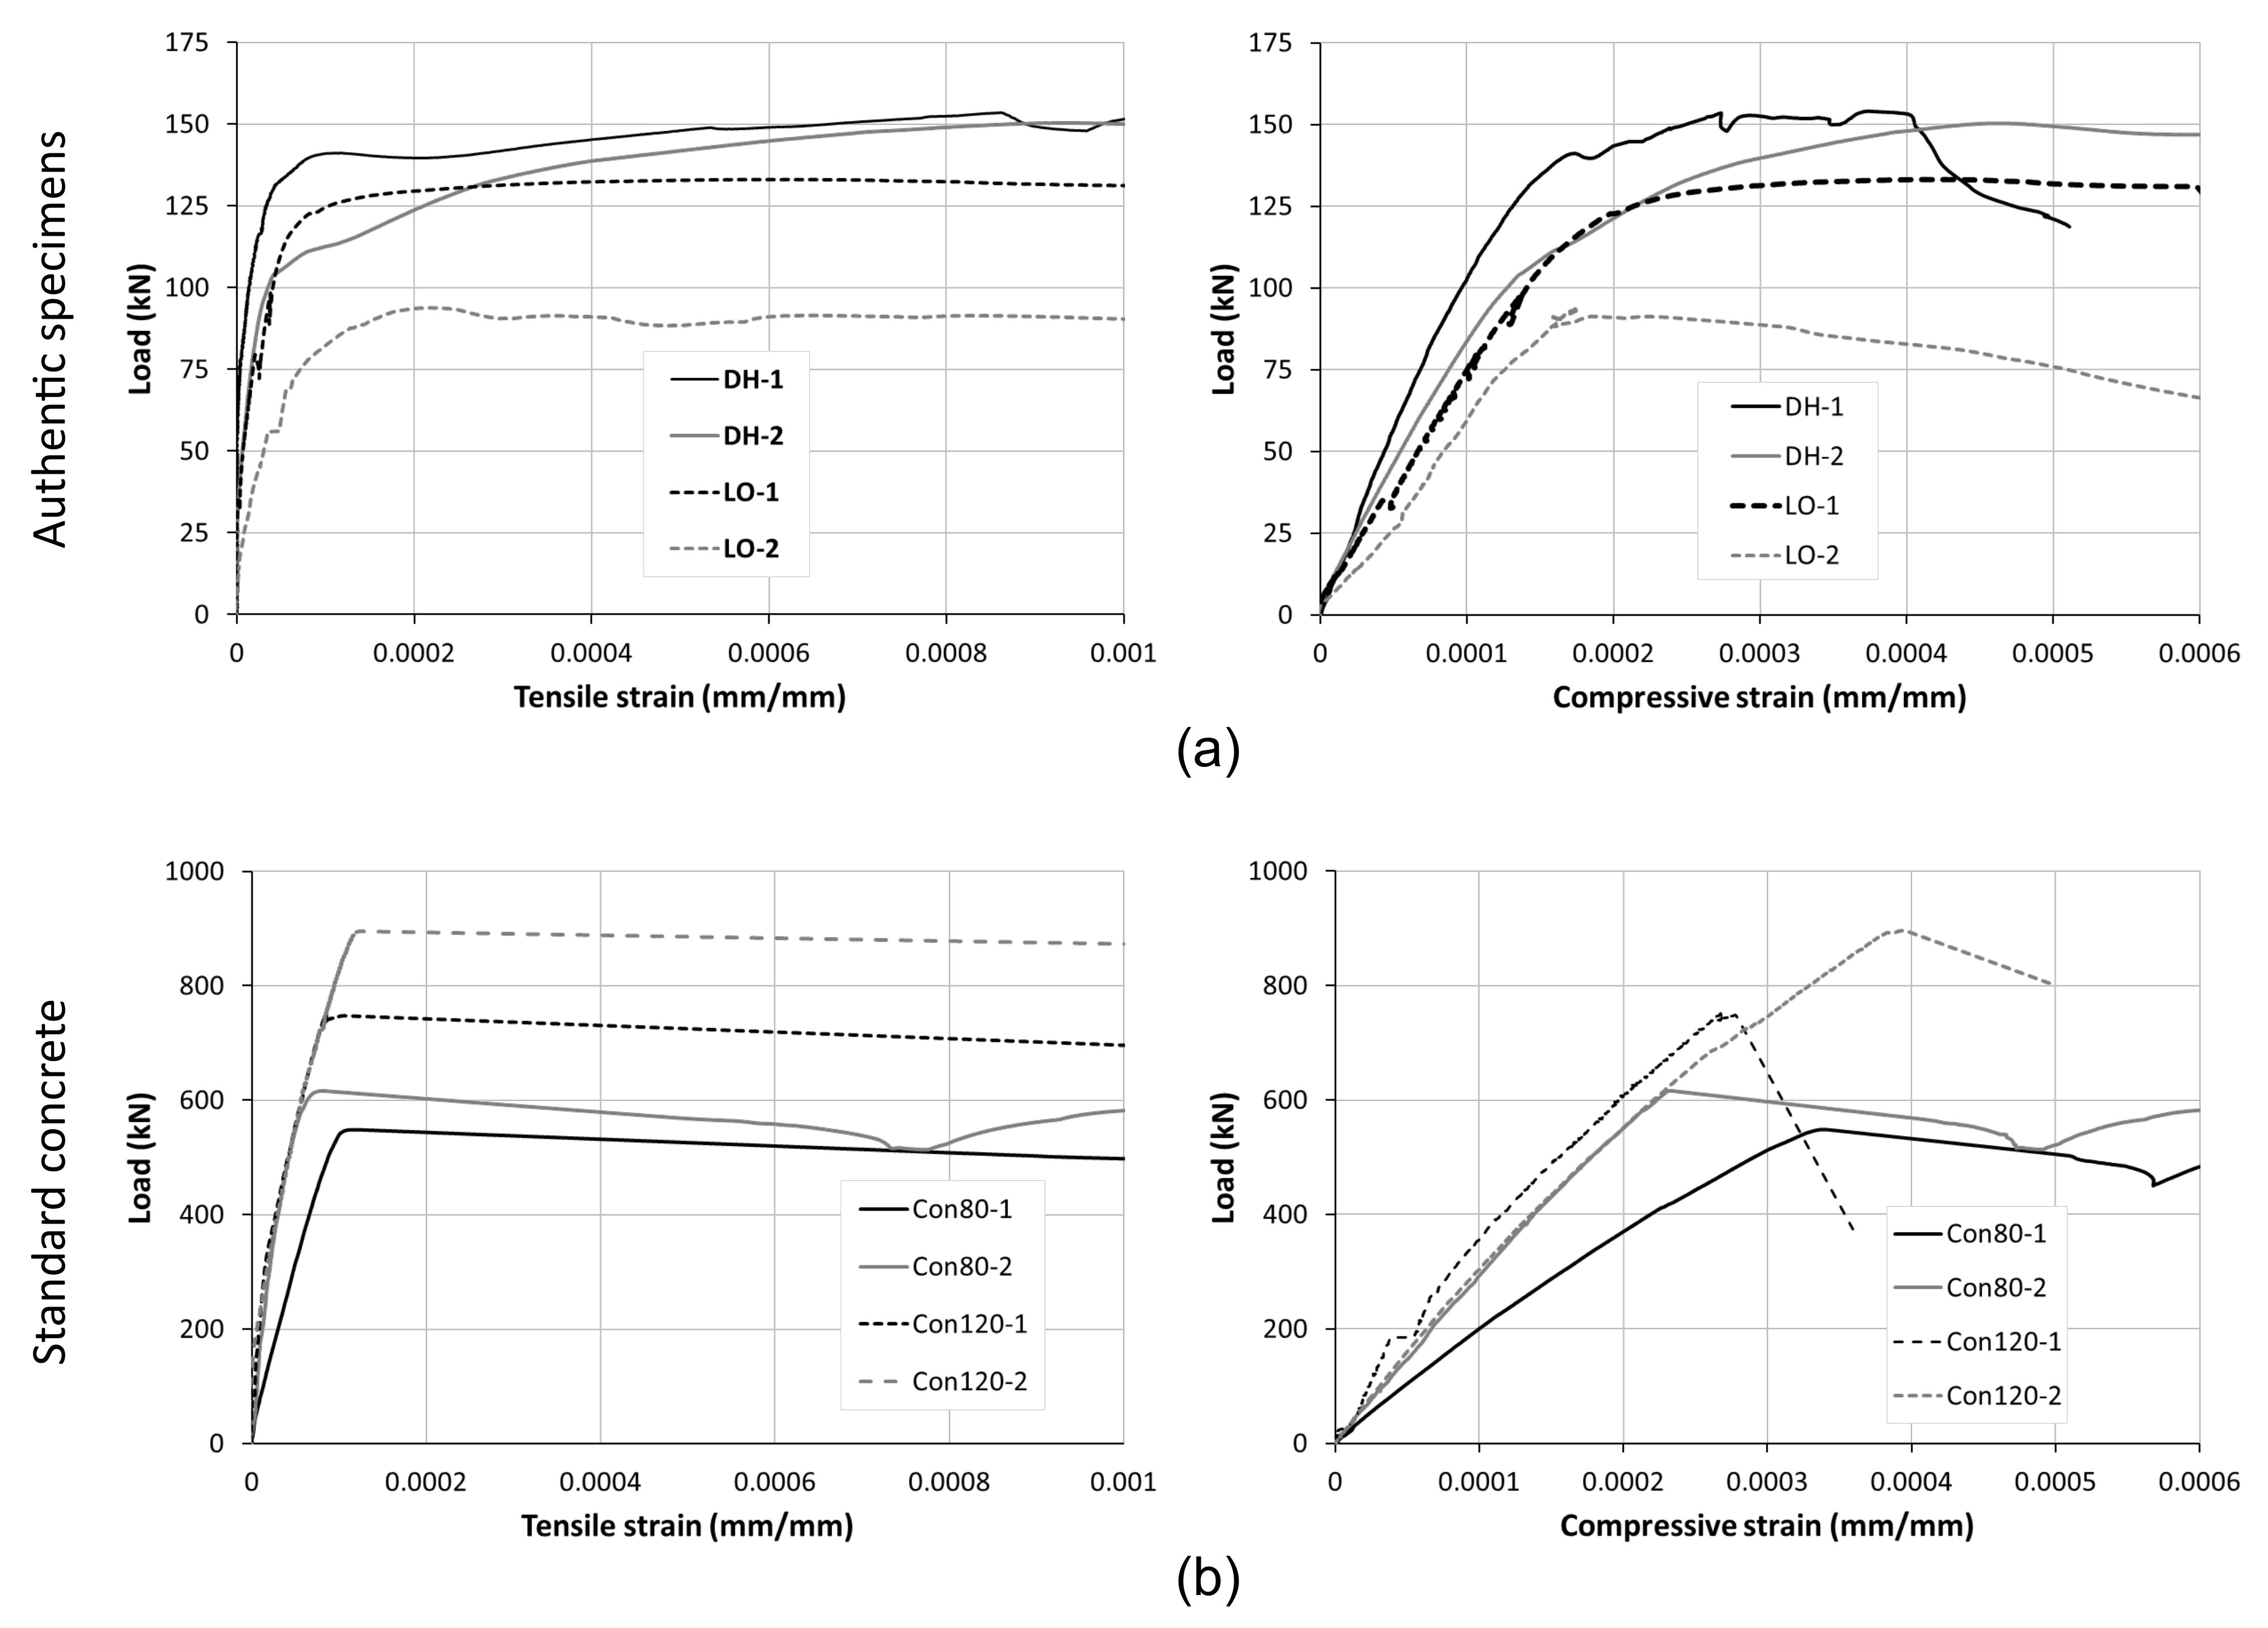
3. Results
4. Analysis of Test Results
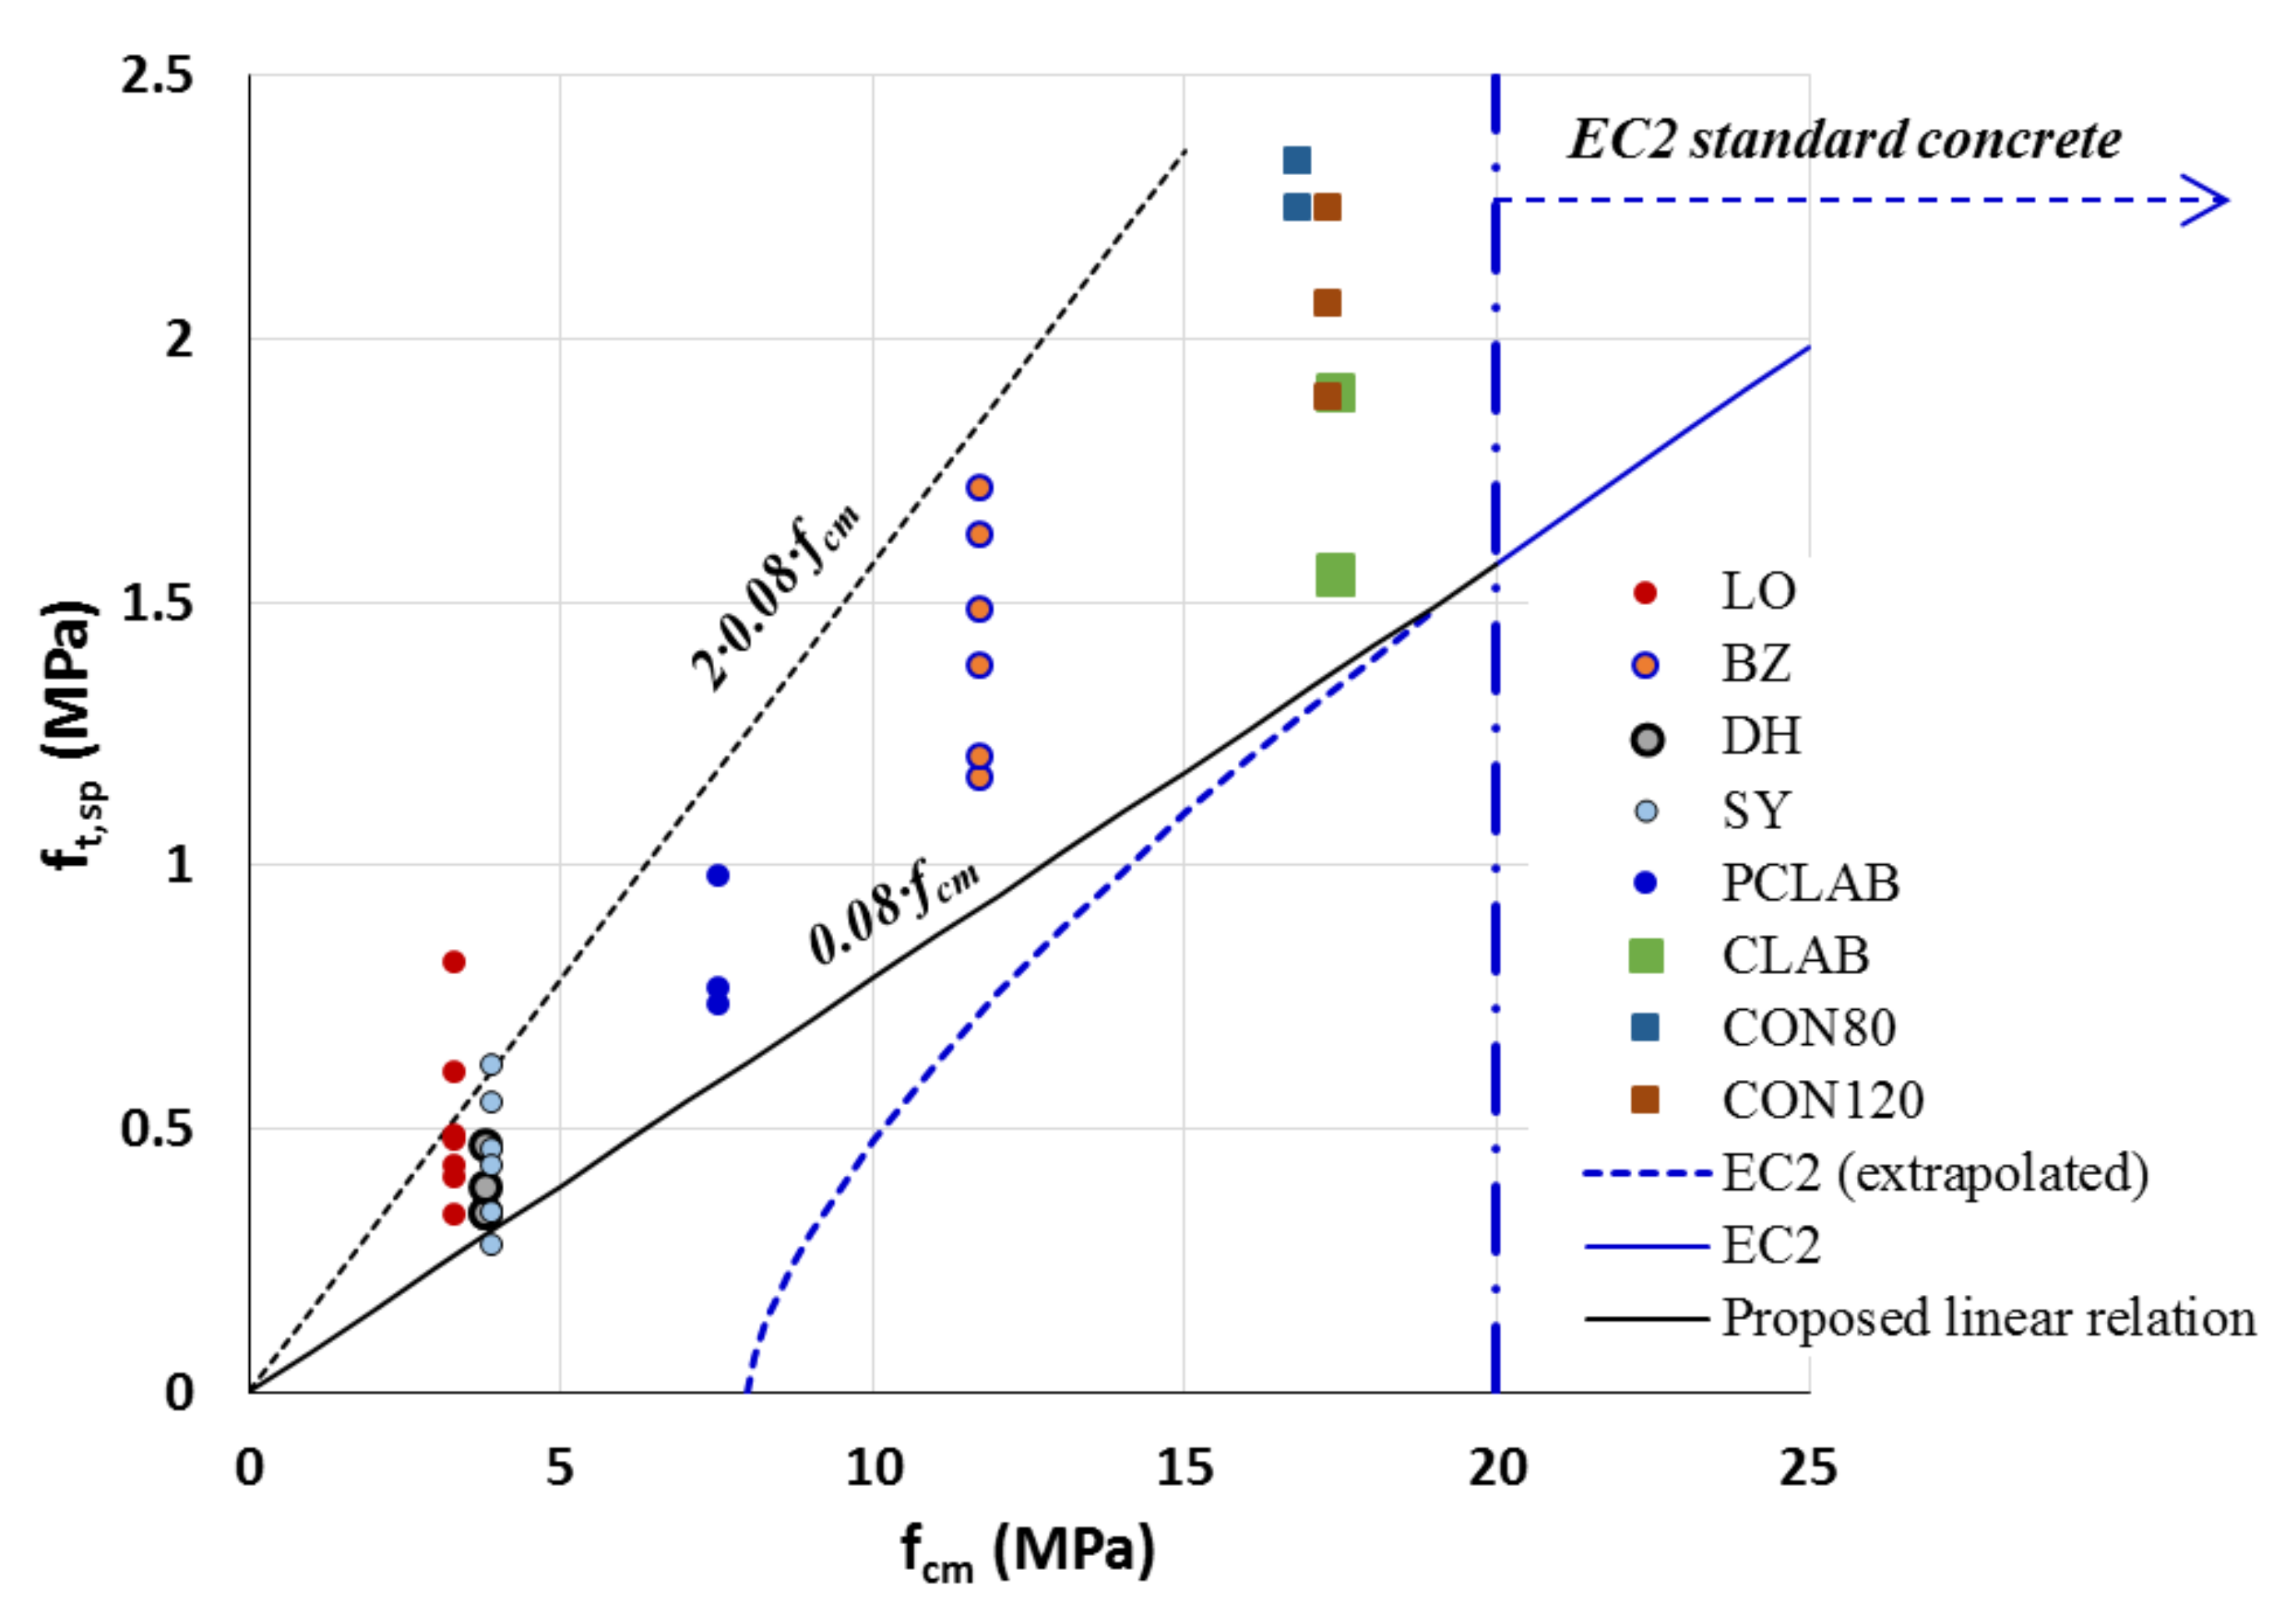
4.1. Compressive–Tensile Strength Relations
4.2. Strength Based on Diagonal Compression Tests
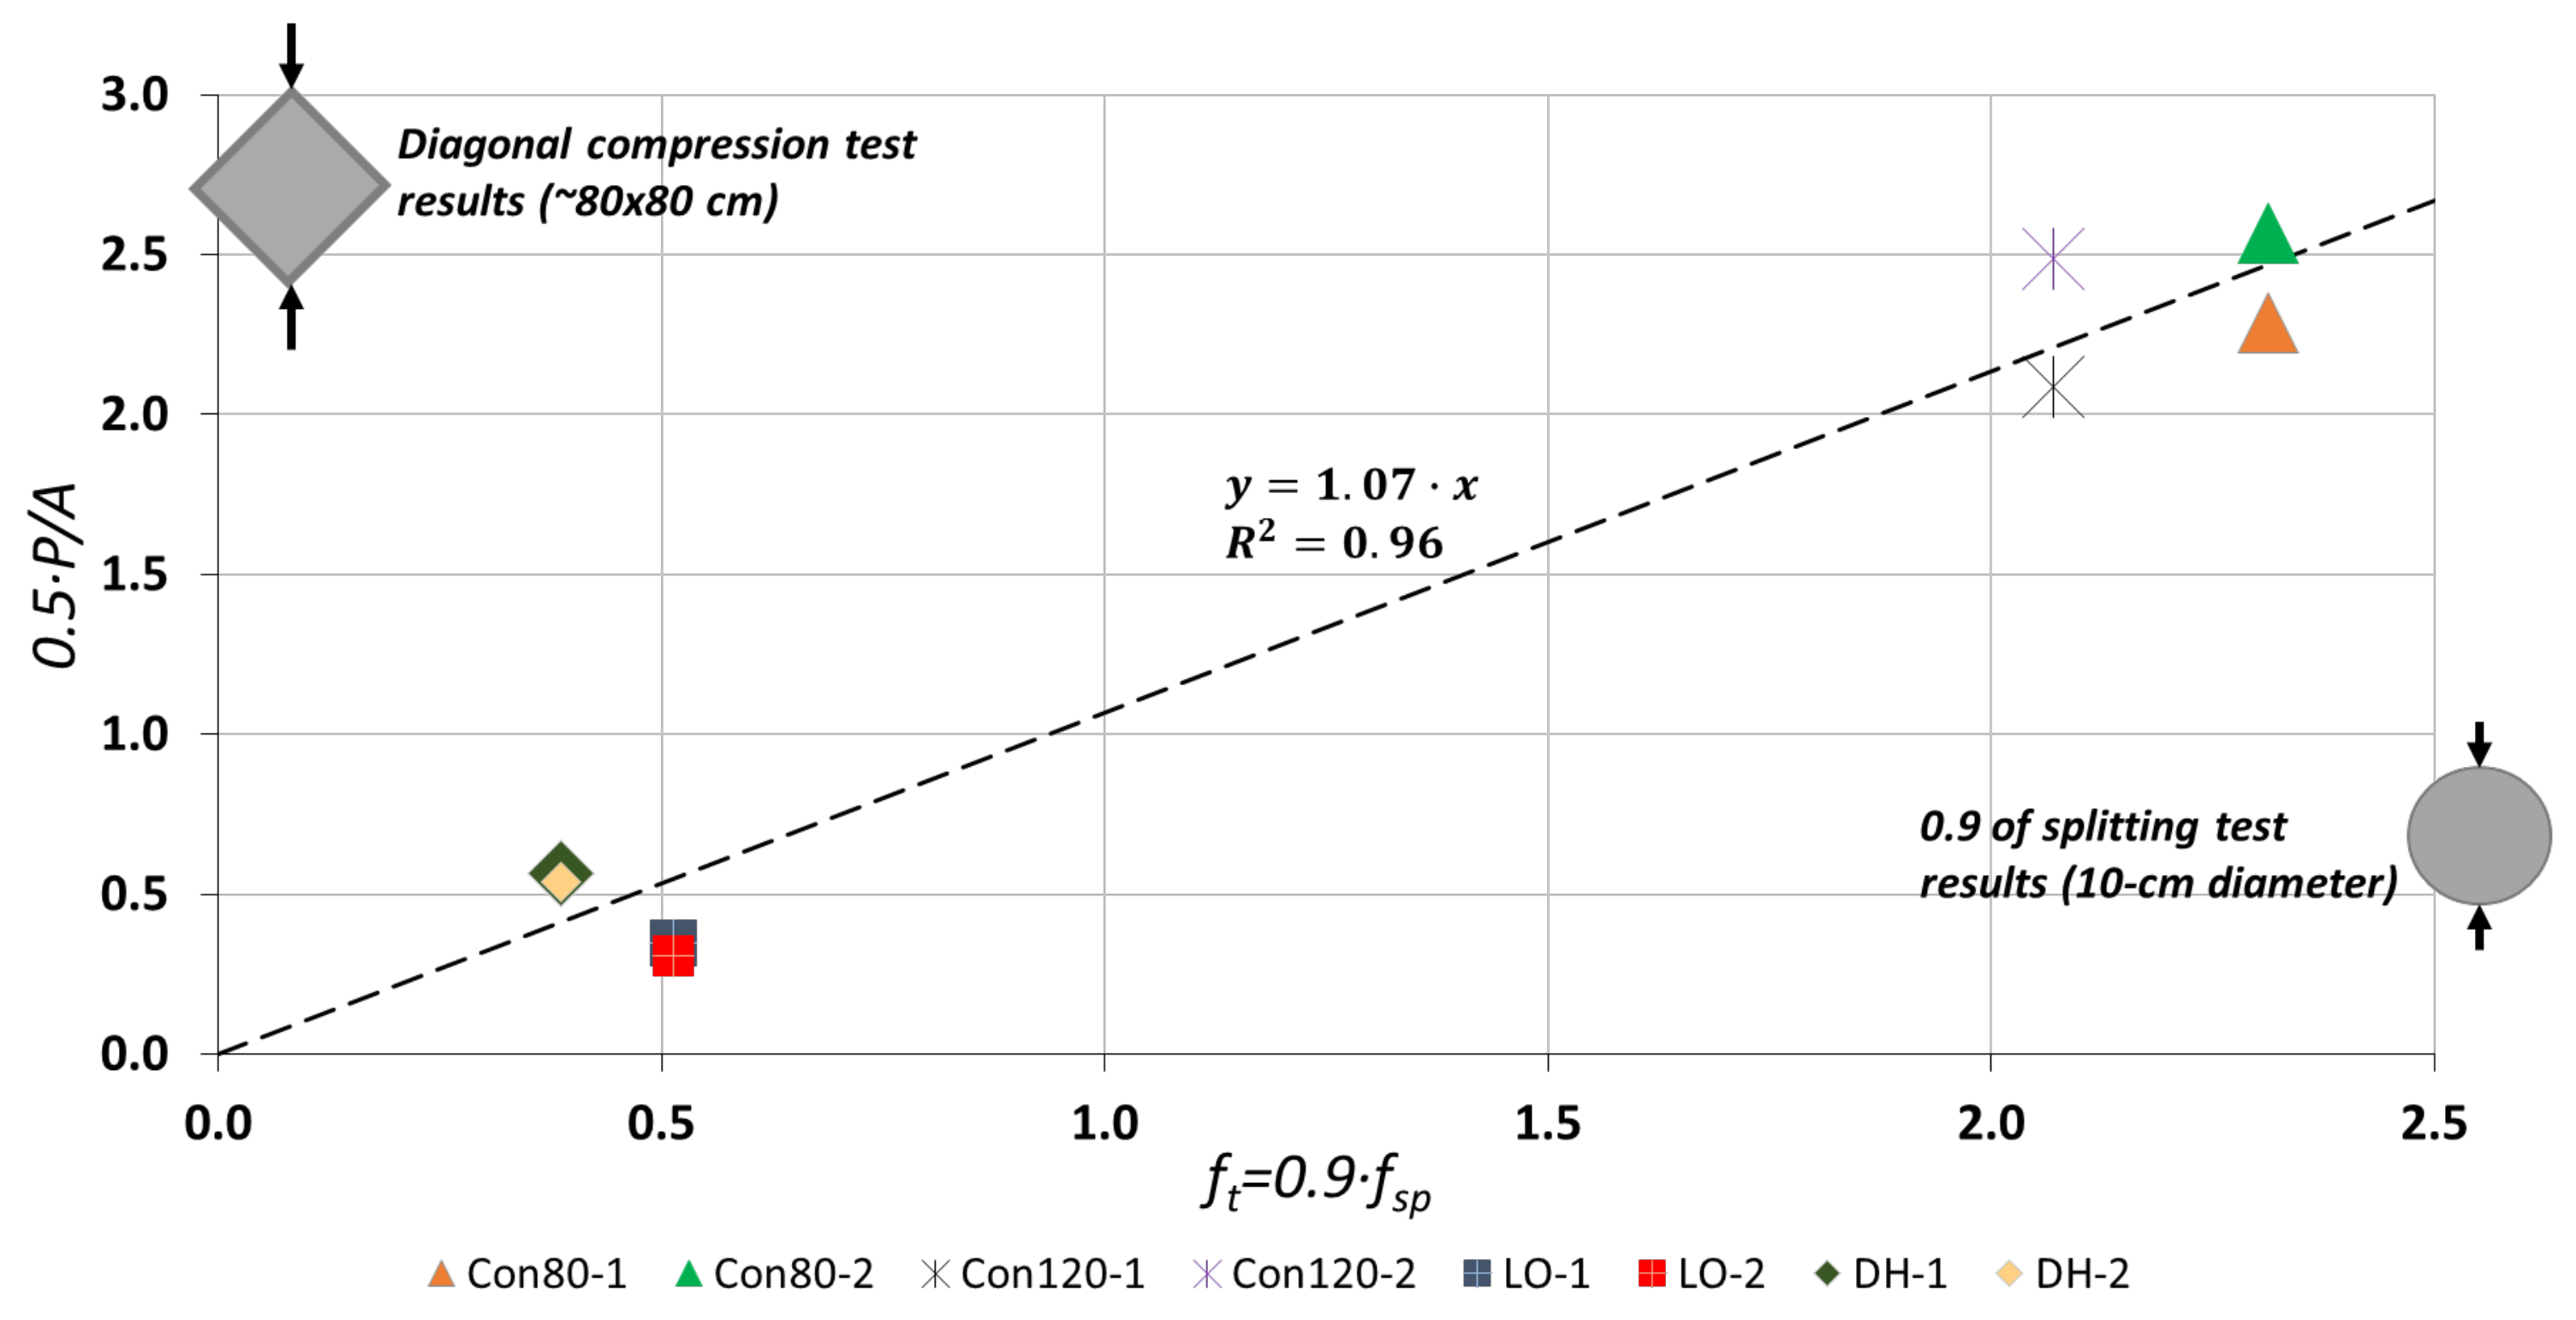
4.2.1. Tensile Strength
4.2.2. Structural Shear Capacity
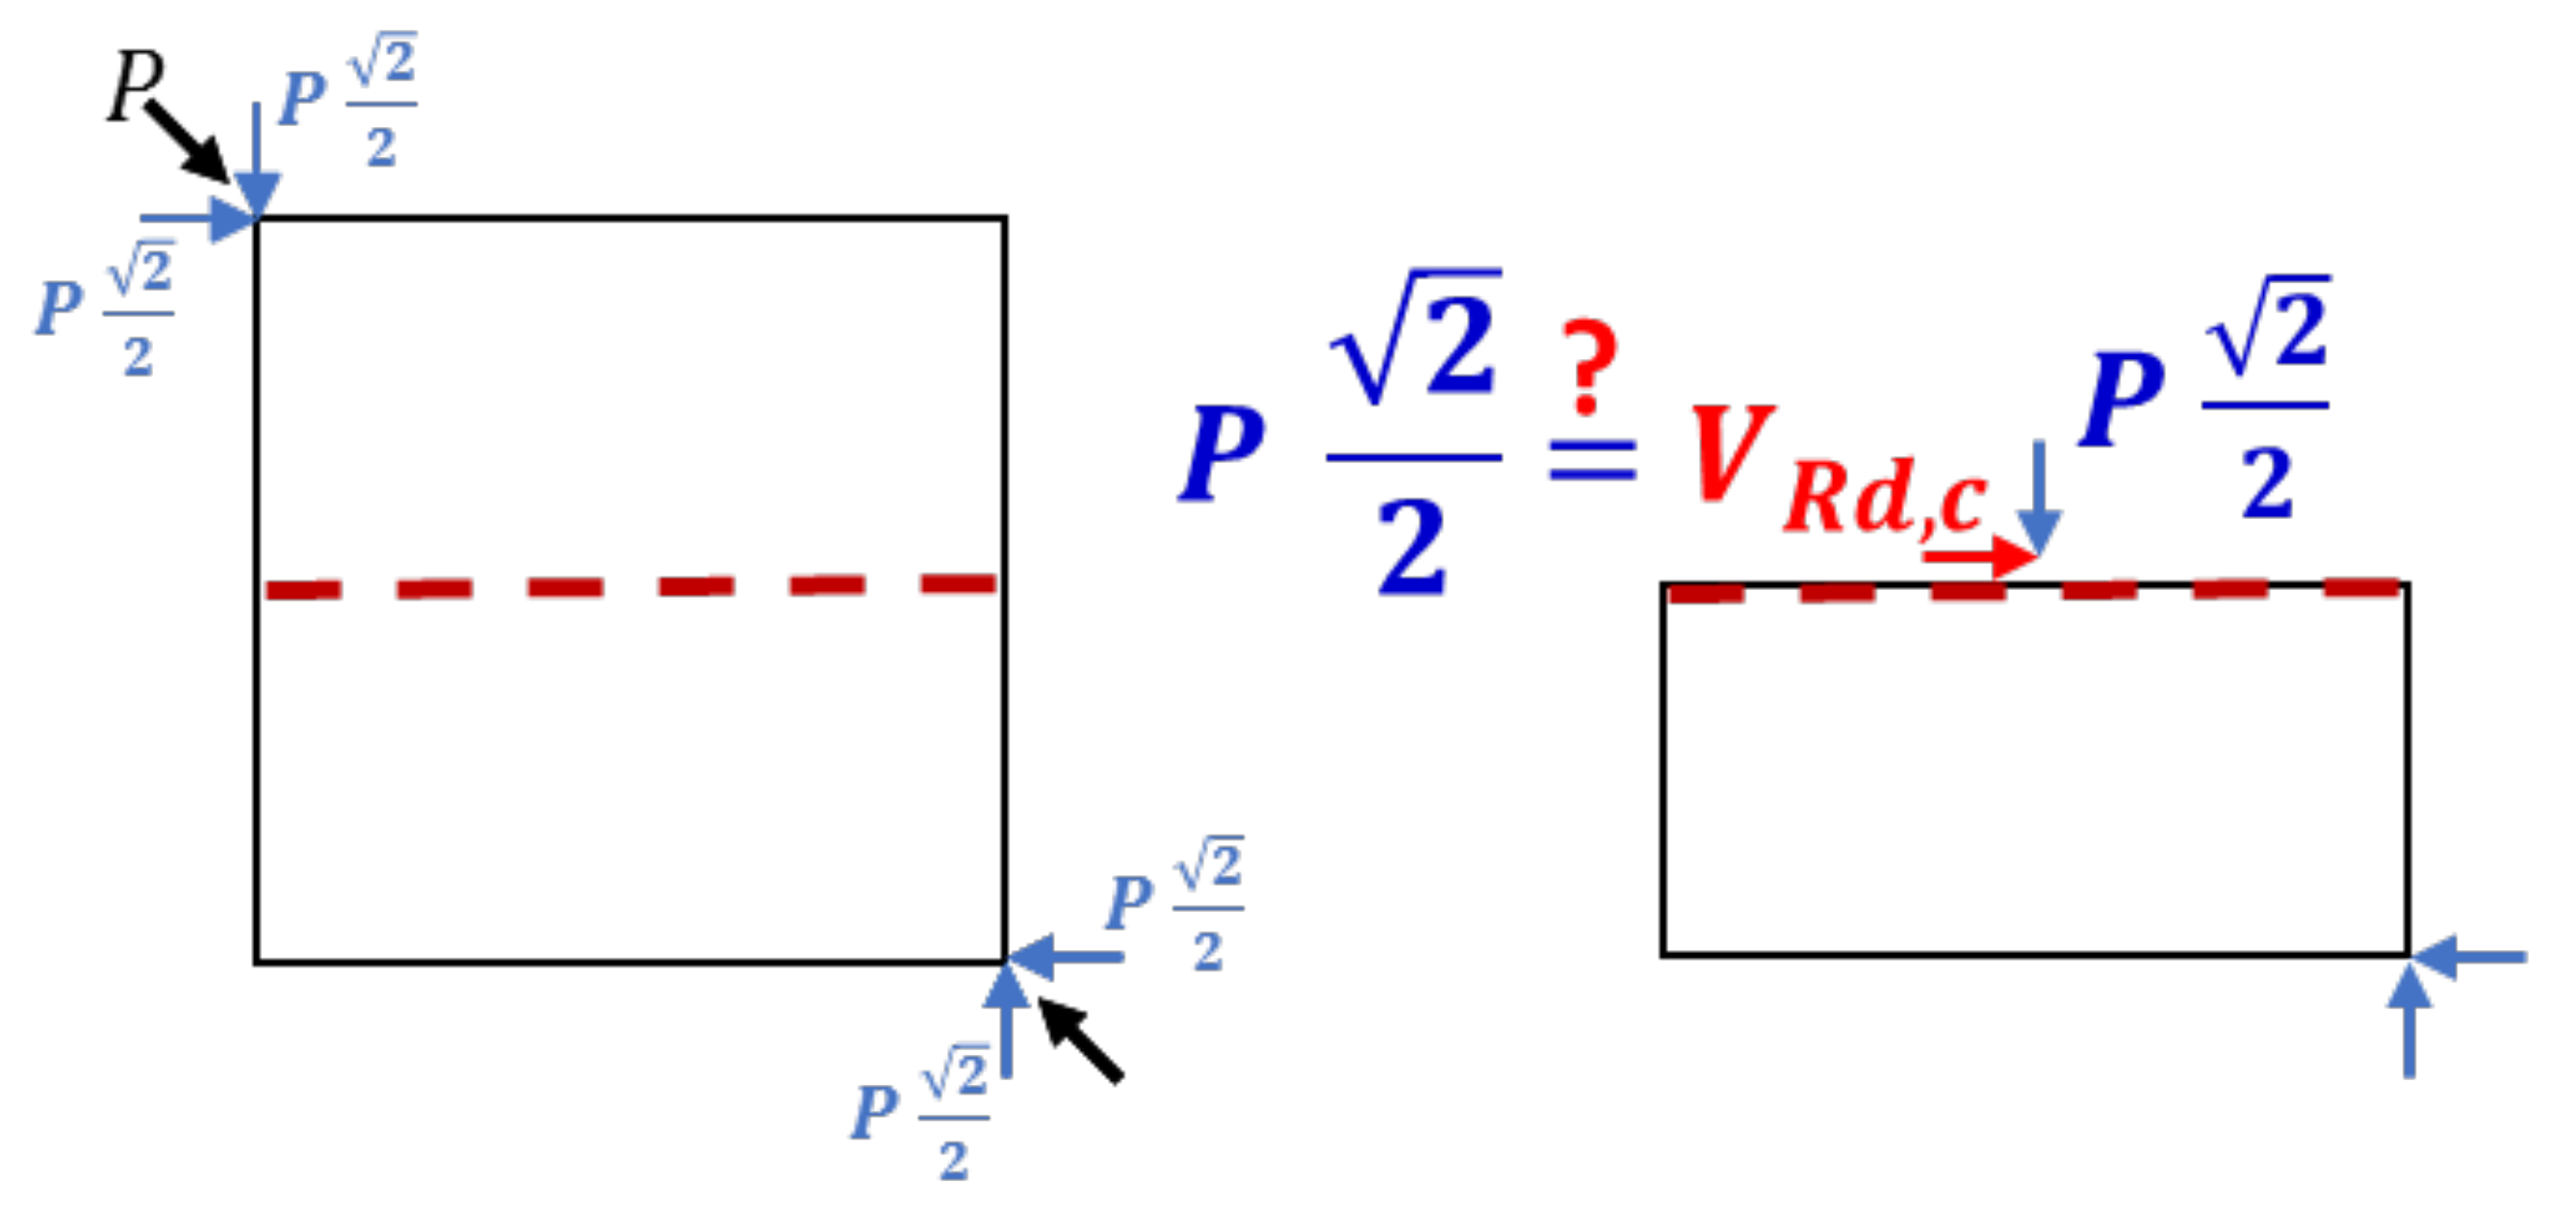
Irrelevance of the Flexural Shear Capacity
Horizontal Force Bearing Capacity and the Current Results
5. Conclusions
- Compressive and splitting tensile strengths of authentic and reproduced LPC specimens were measured.
- Based on these measurements, a relation between the tensile and compressive strengths is proposed, pointing also to the range of possible scatter, which should be examined by the designer when coming to assess the capacity of an existing wall. Note that this new relation is different than that of standard concrete and therefore the findings of this study allow engineers to properly evaluate the mechanical properties of LPC.
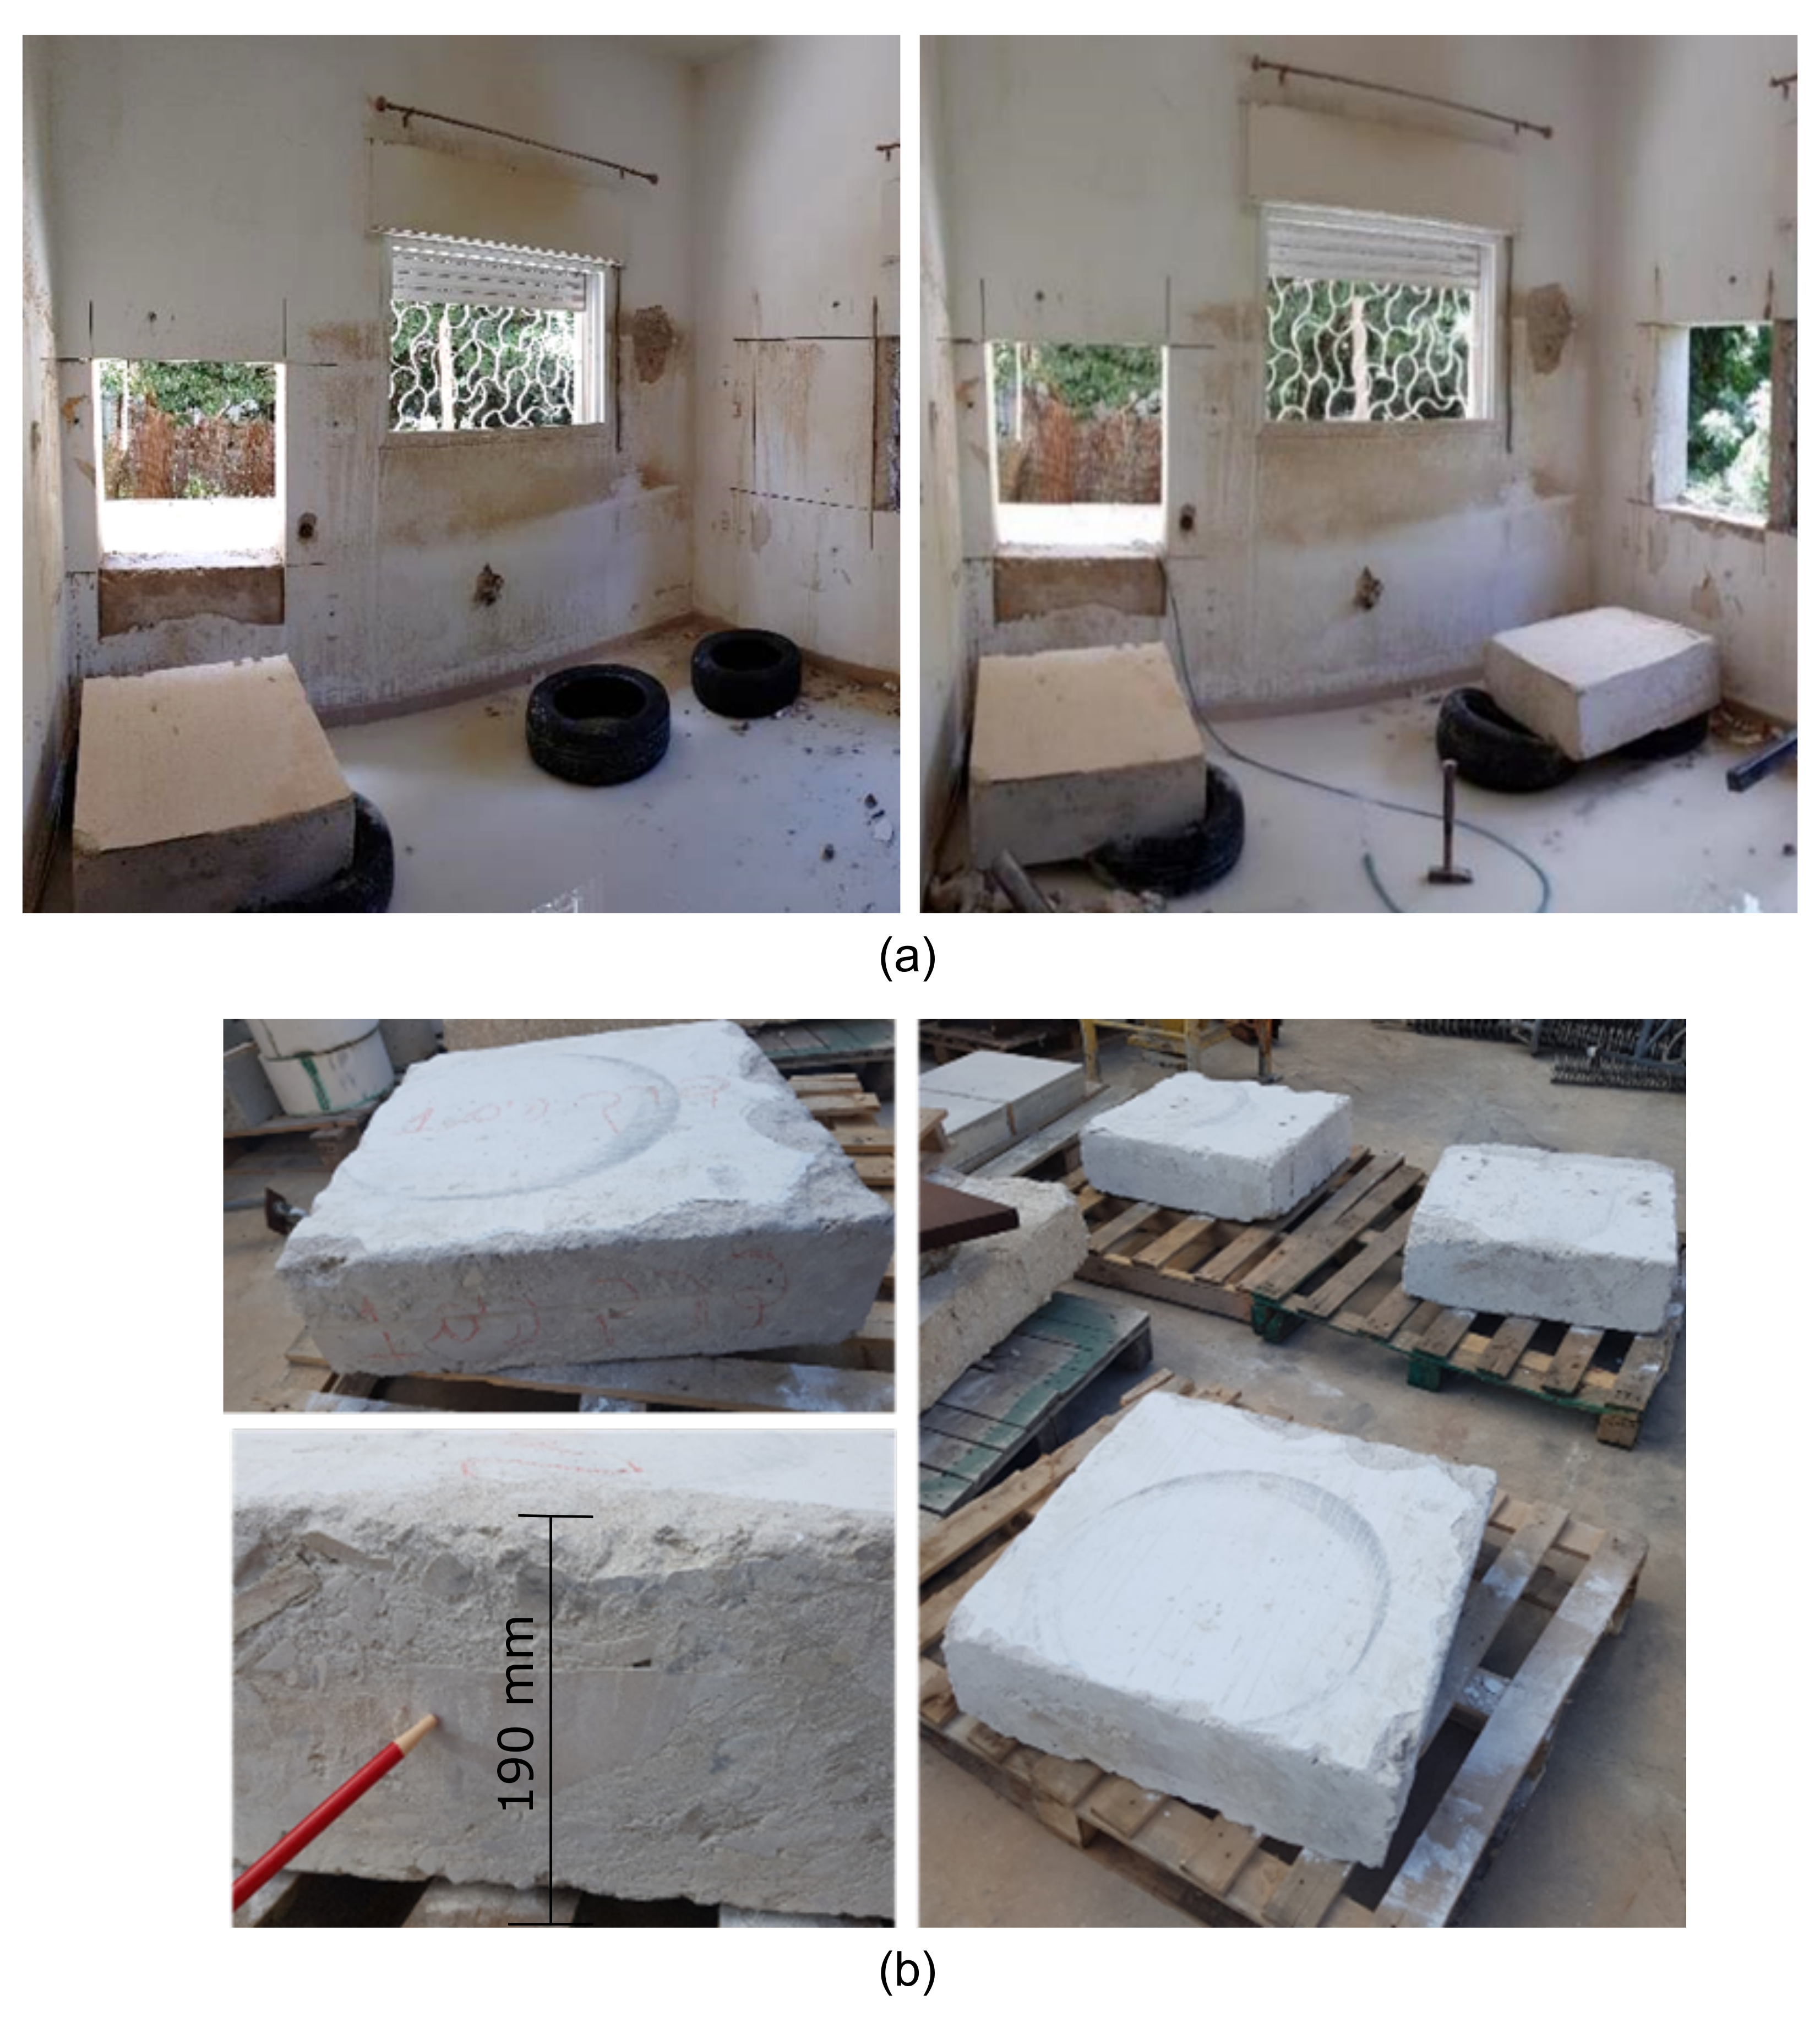
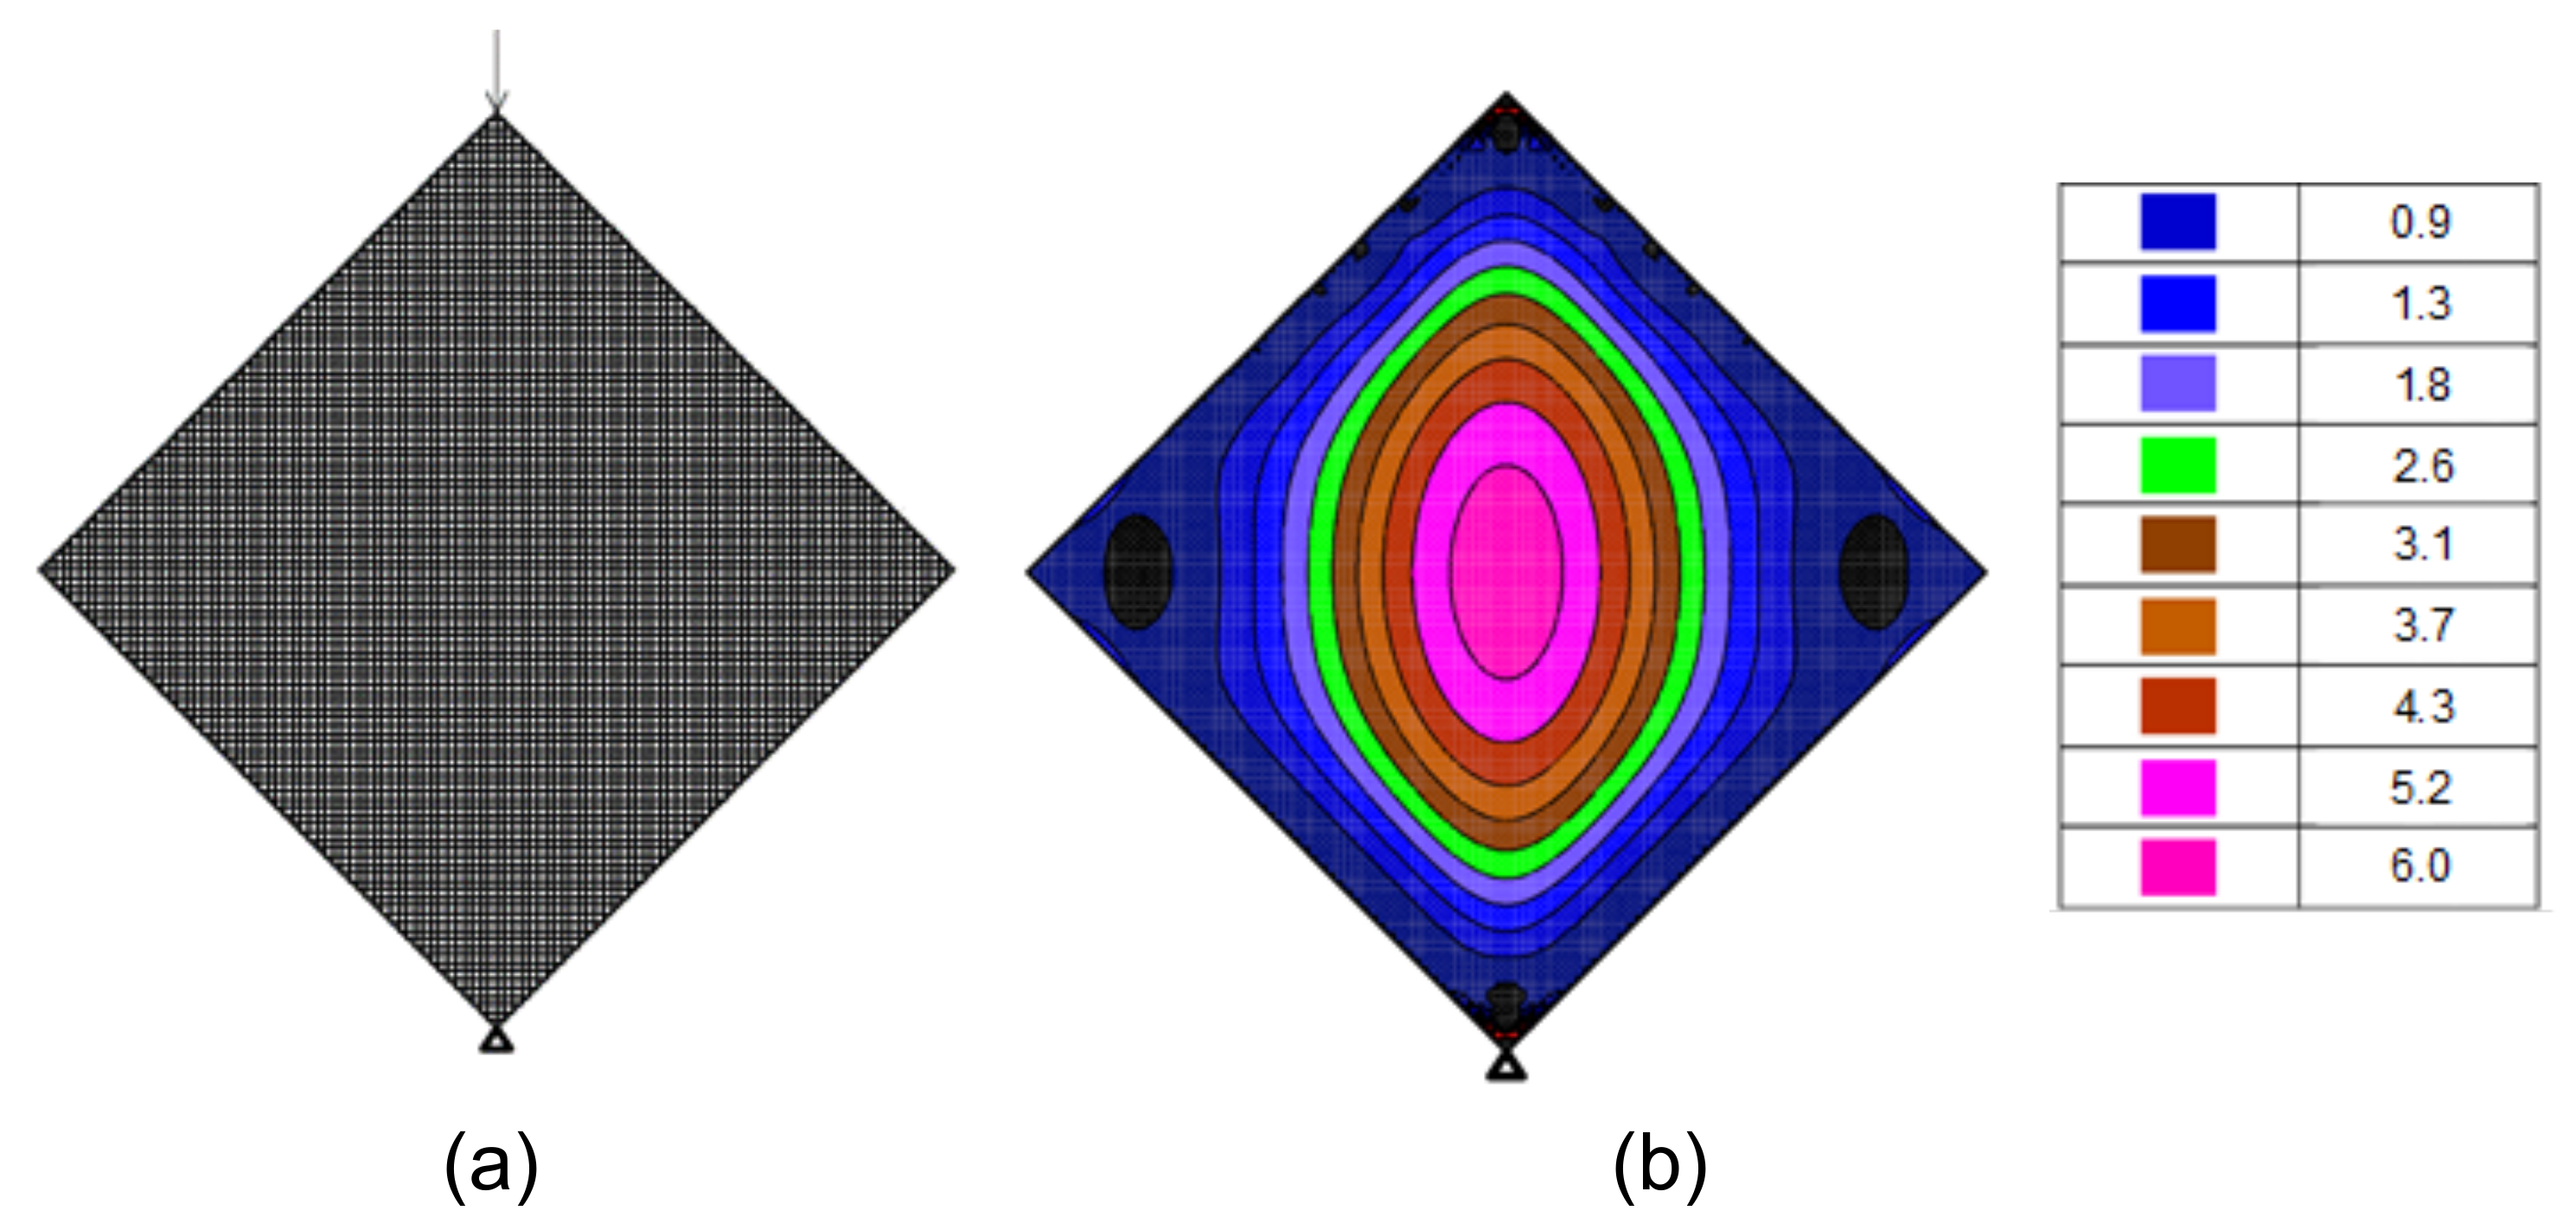
- Then, based on the use of relatively large stones in LPC walls, diagonal compression tests (DCT) were performed on authentic LPC specimens, as well as control specimens made of standard concrete. These tests are usually performed on masonry specimens and here they were adopted to study the shear capacity of LPC specimens.
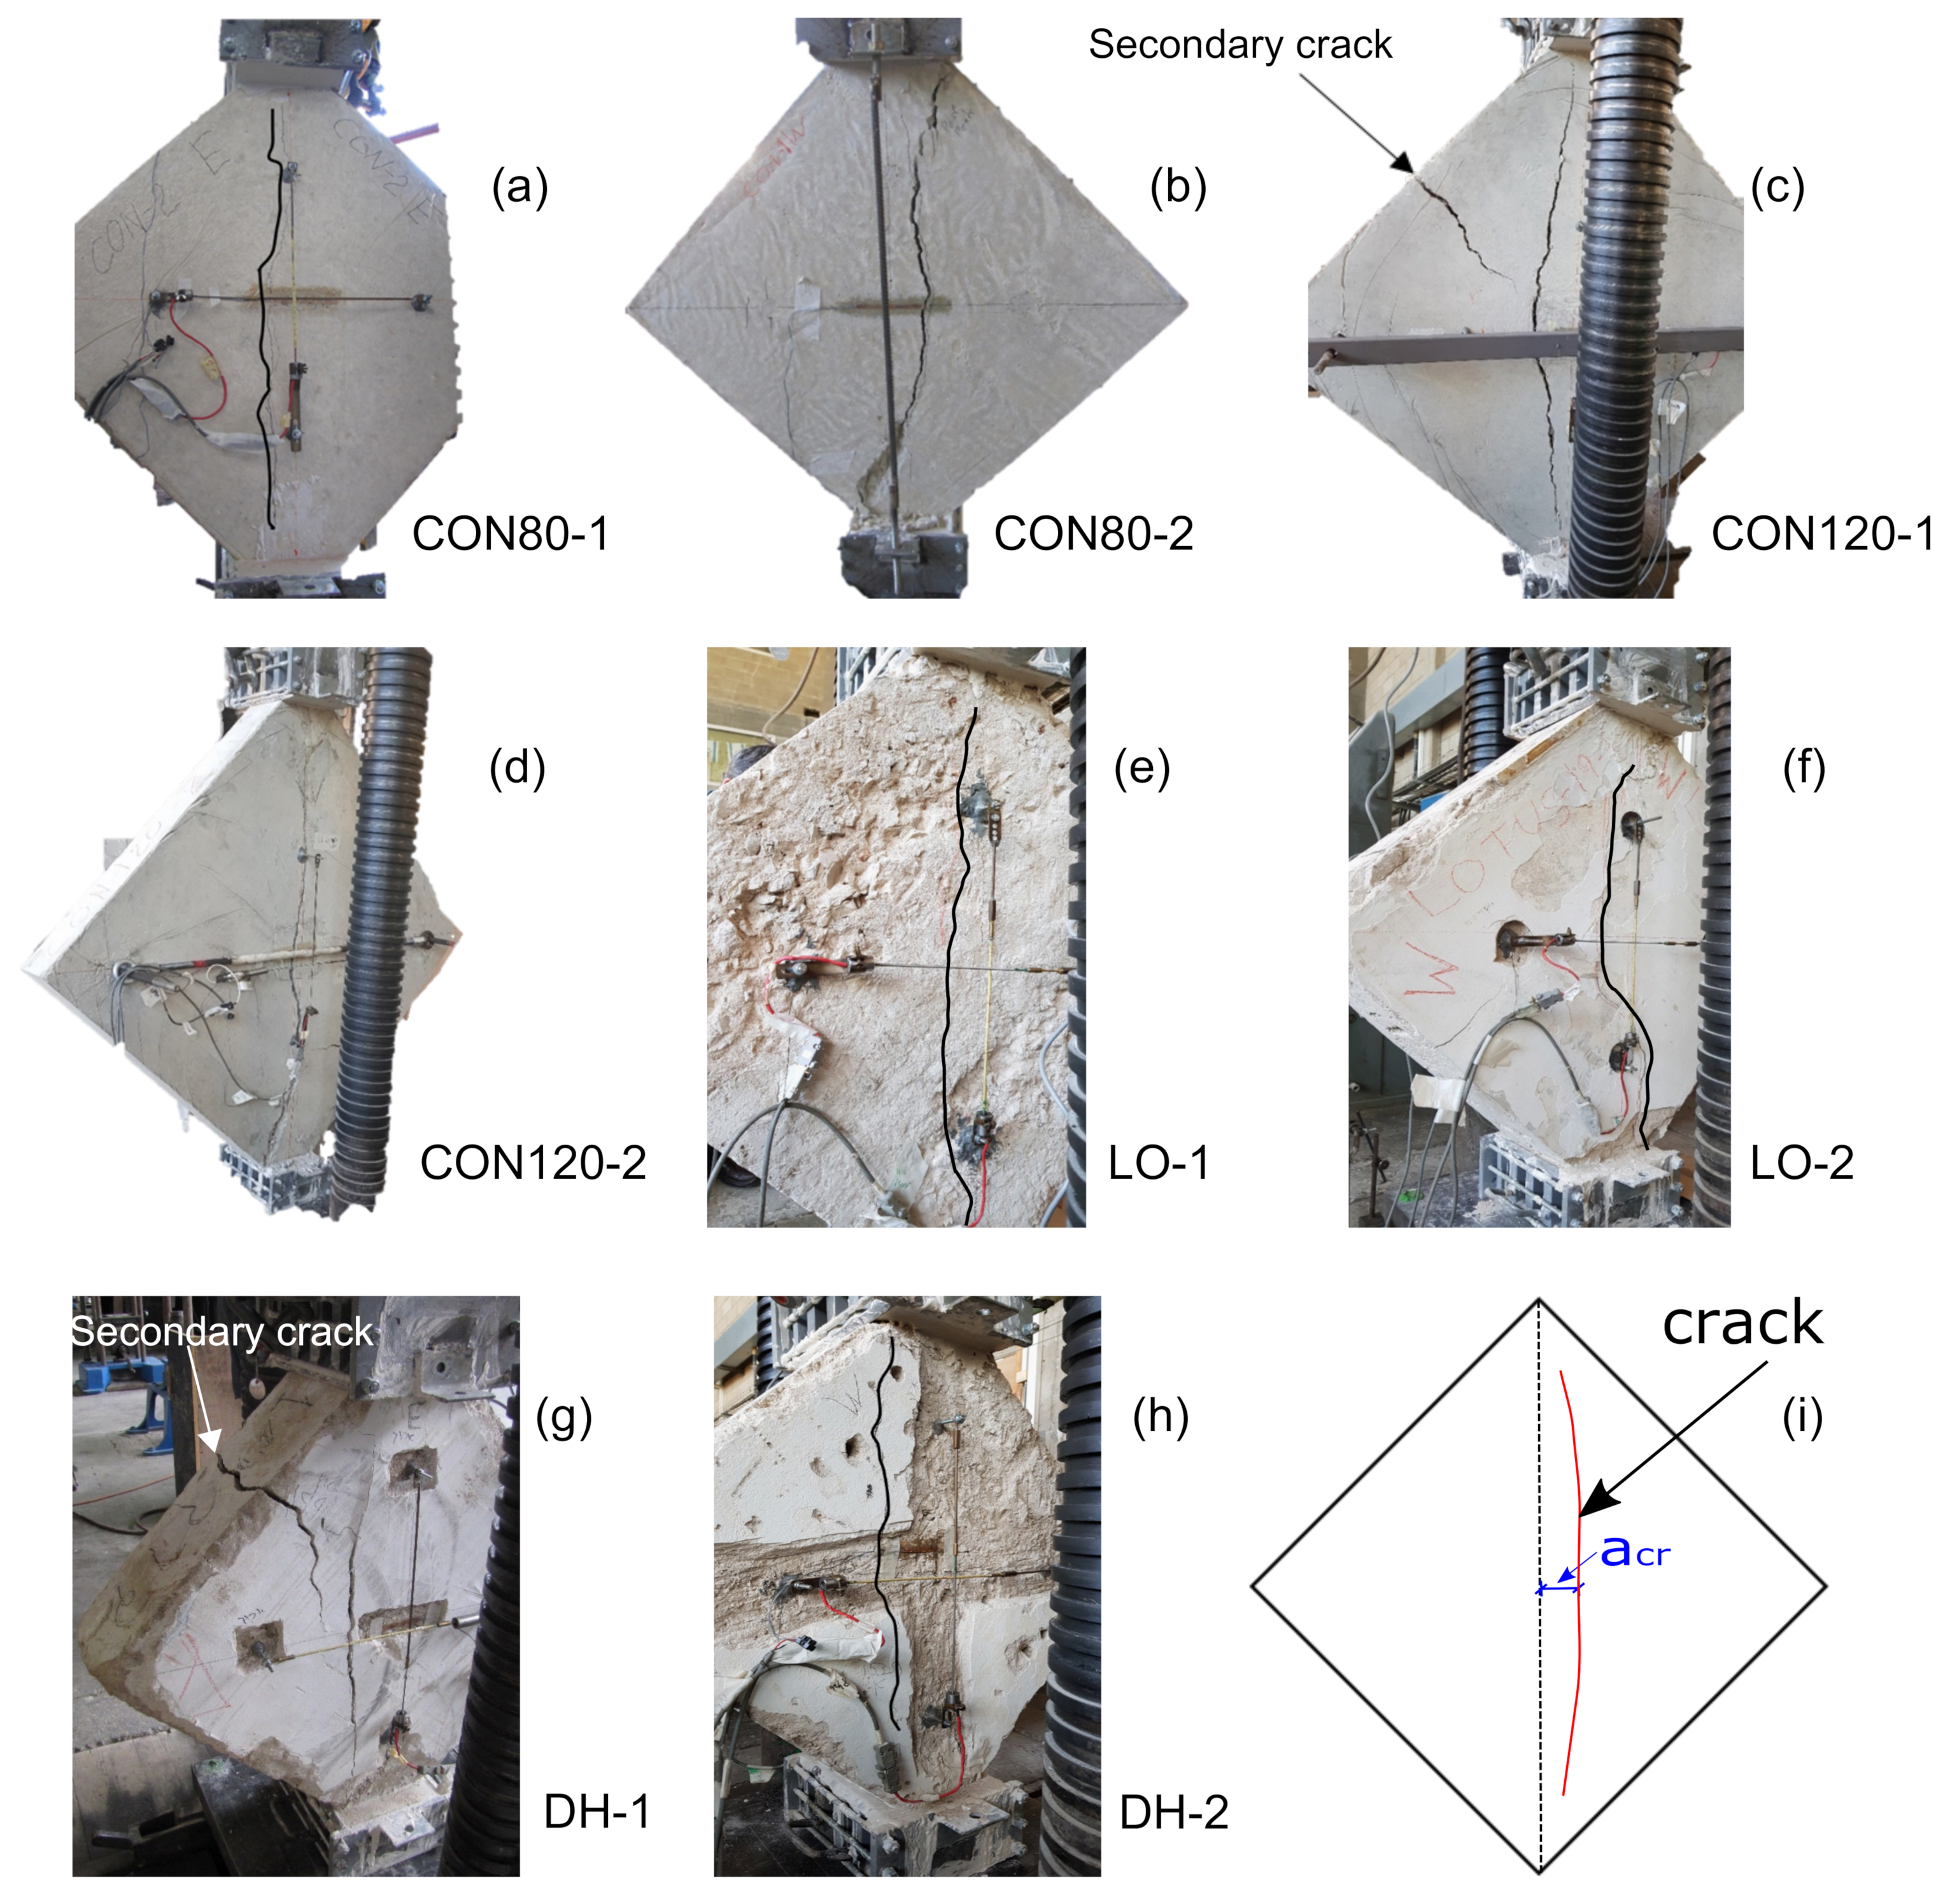
- These tests yielded the expected mode of failure of vertical cracking, caused by principal tension stresses, perpendicular to the external load line of action and corresponding to diagonal tension failure, when the DCT rhombus specimens are considered as cartesian rectangular ones acted by horizontal and normal forces.
- To the best of the authors knowledge, DCT was used in this research for the first time for LPC specimens. For this specimen type, it was found that major principal (tensile) stress is best evaluated by the RILEM approach or by FEM analysis.
- Analysis of the measured maximum load, as well as the specimen dimensions, corresponding to those of squat walls, show that their shear capacity needs to be evaluated based on their tensile strength (rather than the flexural shear capacity of unreinforced concrete beams).
- Thus, the load-bearing (both horizontal and gravitational) capacity to prevent diagonal tension failure of an unreinforced LPC wall can be evaluated by comparing the LPC tensile strength to the major principal stress caused by the load. Assessment of the tensile strength can be based on the proposed compressive–tensile strength relation.
Author Contributions
Funding
Institutional Review Board Statement
Informed Consent Statement
Data Availability Statement
Acknowledgments
Conflicts of Interest
References
- European Standard 1992-1-1. Eurocode 2: Design of concrete structures. In Part 1-1: General Rules and Rules for Buildings; European Committee for Standardization: Brussels, Belgium, 2004. [Google Scholar]
- ACI Committee 318. Building Code Requirements for Structural Concrete and Commentary (ACI 318-19); American Concrete Institute: Farmington Hills, MI, USA, 2019; p. 623. [Google Scholar]
- Viner, N.; Nsieri, E.; Shohat, A.; Offir, Y. Behavior of Typical Debesh Walls in Israel Subjected to Earthquake Loading and Their Possible Strengthening Techniques; Israel Ministry of National Infrastructures: Israel, 2013. (In Hebrew)
- Vardhan, P. Civil Engineering Solutions: An Innovative Guide to Advanced Civil Engineering Concepts; Notion Press: Tamil Nadu, India, 2016. [Google Scholar]
- Offir, Y.; Shohat, A.; Cohen, A. Seismic retrofit of Bnai Zion hospital using innovative damped rocking–mass system. In Proceedings of the 16th World Conference on Earthquake, 16WCEE, Santiago, Chile, 9–13 January 2017. [Google Scholar]
- Eid, R.; Jaber, G.; Dancygier, A.; Rutenberg, A. Assessment of existing unreinforced low performance concrete (LPC) walls towards their retrofit. In Proceedings of the Society for Earthquake and Civil Engineering Dynamics (SECED 2019), London, UK, 9–10 September 2019. [Google Scholar]
- Eid, R.; Jaber, G.; Dancygier, A.; Rutenberg, A. Shear capacity of flexurally strengthened old low–performance concrete elements. J. Build. Eng. 2021, 43, 102551. [Google Scholar] [CrossRef]
- RILEM TC. 76-LUM, Diagonal tensile strength tests of small wall specimens. In RILEM, Recommendations for the Testing and Use of Constructions Materials; E&FN SPON: London, UK, 1994; pp. 488–489. [Google Scholar]
- American Society for Testing and Materials, ASTM E 519-02:2002. Standard test method for diagonal tension (shear) in masonry assemblages. In Annual Book of ASTM Standards; ASTM International: West Conshohock, PA, USA, 2002. [Google Scholar]
- Paulay, T.; Priestley, M.J.N.; Synge, A.J. Ductility in Earthquake Resisting Squat Shear walls. ACI J. 1982, 79, 257–269. [Google Scholar]
- American Society for Testing and Materials, ASTM C39/C39M-20. Standard Test Method for Compressive Strength of Cylindrical Concrete Specimens; ASTM International: West Conshohock, PA, USA, 2020. [Google Scholar]
- Brignola, A.; Frumento, S.; Lagomarsino, S.; Podestà, S. Identification of shear parameters of masonry panels through the in-situ diagonal compression test. Int. J. Archit. Herit. 2009, 3, 52–73. [Google Scholar] [CrossRef]
- Muttoni, A.; Ruiz, M.F. Shear in slabs and beams: Should they be treated in the same way. Fédérat. Int. Béton (fib) Bull. 2010, 57, 105–128. [Google Scholar]
- Ghali, J.; Dancygier, A.N.; Eid, R.; Rutenberg, A. Quantification of the Structural Properties of Unreinforced Plum Concrete Walls; Israel Ministry of National Infrastructures: Israel, 2020. (In Hebrew)
- Atir Engineering Software Development Ltd. STRAP (STRuctural Analysis Program); Atir Engineering Software Development Ltd.: Tel Aviv, Israel, 2018. [Google Scholar]
- Paulay, T.; Priestley, M.J.N. Seismic Design of Reinforced Concrete and Masonry Buildings; John Wiley & Sons, Inc.: New York, NY, USA, 1992. [Google Scholar]

| Water | 196 |
| Cement (CEM I 52.5N) | 140 |
| Coarse Aggregate (max. size 25 mm) | 830 |
| Coarse aggregate (max. size 19 mm) | 220 |
| Natural sand | 817 |
| Water | 196 |
| Cement (CEM I 52.5N) | 206 |
| Coarse aggregate (max. size 19 mm) | 1050 |
| Natural sand | 760 |
| Building | Number of Specimens | H | D | Correction Factor | Corrected | ||
|---|---|---|---|---|---|---|---|
| mm | mm | MPa | MPa | ||||
| 73 | 74 | 3.8 | 0.99 | 0.87 | 3.3 | ||
| 73 | 74 | 3.2 | 0.99 | 0.87 | 2.8 | ||
| 74 | 74 | 3.5 | 1.00 | 0.87 | 3.1 | ||
| 99 | 94 | 3.5 | 1.05 | 0.88 | 3.1 | ||
| 99 | 94 | 2.4 | 1.05 | 0.88 | 2.1 | ||
| 99 | 94 | 3.9 | 1.05 | 0.88 | 3.5 | ||
| LO | 11 | 213 | 102 | 2.5 | 2.09 | 1.00 | 2.5 |
| 206 | 102 | 2.1 | 2.02 | 1.00 | 2.1 | ||
| 180 | 102 | 5.1 | 1.76 | 0.98 | 5.0 | ||
| 197 | 102 | 3.1 | 1.93 | 0.99 | 3.1 | ||
| 211 | 102 | 5.7 | 2.07 | 1.00 | 5.7 | ||
| Average corrected compressive strength, (MPa) | 3.3 | ||||||
| Standard deviation (MPa) (Coefficient of Variation) | 1.1 (34%) | ||||||
| 223 | 145 | 14.1 | 1.54 | 0.96 | 13.5 | ||
| 234 | 145 | 13.7 | 1.61 | 0.97 | 13.3 | ||
| 157 | 145 | 11.5 | 1.08 | 0.89 | 10.2 | ||
| BZ | 6 | 195 | 145 | 10.2 | 1.34 | 0.94 | 9.6 |
| 245 | 102 | 11.7 | 2.40 | 1.00 | 11.7 | ||
| 270 | 102 | 12.0 | 2.65 | 1.00 | 12.0 | ||
| Average corrected compressive strength, (MPa) | 11.7 | ||||||
| Standard deviation (MPa) (Coefficient of Variation) | 1.6 (14%) | ||||||
| 182 | 102 | 2.9 | 1.78 | 0.98 | 2.8 | ||
| 3 | 180 | 102 | 4.0 | 1.76 | 0.98 | 4.0 | |
| DH | 179 | 102 | 4.7 | 1.75 | 0.98 | 4.6 | |
| Average corrected compressive strength, (MPa) | 3.8 | ||||||
| Standard deviation (MPa) (Coefficient of Variation) | 0.9 (23%) | ||||||
| 155 | 102 | 10.3 | 1.52 | 0.96 | 9.9 | ||
| TA | 2 | 152 | 102 | 9.6 | 1.49 | 0.96 | 9.2 |
| Average corrected compressive strength, (MPa) | 9.5 | ||||||
| Standard deviation (MPa) (Coefficient of Variation) | 0.5 (5%) | ||||||
| 188 | 102 | 4.0 | 1.84 | 0.99 | 4.0 | ||
| 159 | 102 | 4.2 | 1.56 | 0.96 | 4.1 | ||
| SY | 4 | 164 | 102 | 3.9 | 1.61 | 0.97 | 3.7 |
| 167 | 102 | 3.9 | 1.64 | 0.97 | 3.8 | ||
| Average corrected compressive strength, (MPa) | 3.9 | ||||||
| Standard deviation (MPa) (Coefficient of Variation) | 0.2 (4%) | ||||||
| Specimen | Number of Specimens | H | D | Compressive Strength |
|---|---|---|---|---|
| mm | mm | MPa | ||
| 300 | 150 | 7.7 | ||
| 3 | 300 | 150 | 6.5 | |
| 300 | 150 | 8.2 | ||
| PCLAB | 300 | 150 | 8.1 | |
| 3 (with a large aggregate) | 300 | 150 | 7.0 | |
| 300 | 150 | 7.7 | ||
| Average compressive strength, (MPa) | 7.5 | |||
| Standard deviation (MPa) (Coefficient of Variation) | 0.7 (9%) | |||
| Specimen | Number of Specimens | Compressive Strength (MPa) | ||
|---|---|---|---|---|
| Cylinders | Cubes | Cubes | ||
| mm | mm | mm | ||
| 18.0 | 25.5 | 20.5 | ||
| CON80 | 9 | 16.9 | 23.4 | 20.3 |
| 15.5 | 22.3 | 18.5 | ||
| Average compressive strength, (MPa) | 16.8 | 23.7 | 19.8 | |
| Standard deviation (MPa) (Coefficient of Variation) | 1.25 (7%) | 1.6 (7%) | 1.1 (6%) | |
| – | 23.1 | 20.8 | ||
| CON120 | 6 | – | 19.3 | 20.6 |
| – | 21.4 | 21.9 | ||
| Average compressive strength, (MPa) | 17.3 | 21.3 | 21.1 | |
| Standard deviation (MPa) (Coefficient of Variation) | 1.9 (9%) | 0.7 (3%) | ||
| 16.4 | – | – | ||
| CLAB | 3 | 18.0 | – | – |
| 17.9 | – | – | ||
| Average compressive strength, (MPa) | 17.4 | |||
| Standard deviation (MPa) (Coefficient of Variation) | 0.92 (5%) | |||
| Building | No. of Specimens | Splitting Tensile | Axial Tensile | Proposed Relation | |||||
|---|---|---|---|---|---|---|---|---|---|
| Strength | Strength | Absolute | |||||||
| H | D | Error | |||||||
| mm | mm | MPa | MPa | MPa | MPa | ||||
| 235 | 102 | 0.38 | 0.34 | 0.77 | 0.23 | ||||
| 125 | 102 | 0.67 | 0.61 | 0.43 | 0.57 | ||||
| 220 | 102 | 0.53 | 0.48 | 0.55 | 0.45 | ||||
| LO | 7 | 214 | 102 | 3.3 | 0.54 | 0.49 | 0.26 | 0.54 | 0.46 |
| 215 | 102 | 0.46 | 0.41 | 0.64 | 0.36 | ||||
| 215 | 102 | 0.48 | 0.43 | 0.61 | 0.39 | ||||
| 205 | 102 | 0.91 | 0.82 | 0.32 | 0.68 | ||||
| Average splitting tensile strength, (MPa) | 0.57 | ||||||||
| Standard deviation (MPa) (Coefficient of variation) | 0.18 (32%) | ||||||||
| 260 | 102 | 1.81 | 1.63 | 0.57 | 0.43 | ||||
| 260 | 102 | 1.30 | 1.17 | 0.80 | 0.20 | ||||
| 246 | 102 | 1.35 | 1.21 | 0.77 | 0.23 | ||||
| BZ | 6 | 200 | 102 | 11.7 | 1.54 | 1.38 | 0.94 | 0.68 | 0.32 |
| 200 | 102 | 1.91 | 1.72 | 0.54 | 0.46 | ||||
| 200 | 102 | 1.66 | 1.49 | 0.63 | 0.37 | ||||
| Average splitting tensile strength, (MPa) | 1.59 | ||||||||
| Standard deviation (MPa) (Coefficient of variation) | 0.25 (16%) | ||||||||
| 189 | 102 | 0.38 | 0.34 | 0.89 | 0.11 | ||||
| 194 | 102 | 0.37 | 0.34 | 0.89 | 0.11 | ||||
| DH | 4 | 182 | 102 | 3.8 | 0.43 | 0.39 | 0.30 | 0.78 | 0.22 |
| 157 | 102 | 0.53 | 0.47 | 0.65 | 0.35 | ||||
| Average splitting tensile strength, (MPa) | 0.43 | ||||||||
| Standard deviation (MPa) (Coefficient of variation) | 0.07 (16%) | ||||||||
| 200 | 102 | 0.68 | 0.62 | 0.50 | 0.50 | ||||
| 156 | 102 | 0.51 | 0.46 | 0.68 | 0.32 | ||||
| 175 | 102 | 0.31 | 0.28 | 1.11 | 0.11 | ||||
| SY | 6 | 165 | 102 | 3.9 | 0.61 | 0.55 | 0.31 | 0.57 | 0.43 |
| 177 | 102 | 0.37 | 0.34 | 0.92 | 0.08 | ||||
| 162 | 102 | 0.48 | 0.43 | 0.73 | 0.27 | ||||
| Average splitting tensile strength, (MPa) | 0.49 | ||||||||
| Standard deviation (MPa) (Coefficient of variation) | 0.14 (29%) | ||||||||
| Mean (MPa) | 0.68 | 0.33 | |||||||
| Standard deviation (MPa) | 0.18 | 0.16 | |||||||
| Coefficient of variation | 0.26 | 0.47 | |||||||
| Specimen | No. of Specimens | Splitting Tensile | Axial Tensile | Proposed Relation | |||||
|---|---|---|---|---|---|---|---|---|---|
| Strength | Strength | Absolute | |||||||
| H | D | Error | |||||||
| mm | mm | MPa | MPa | MPa | MPa | ||||
| 300 | 150 | 0.82 | 0.74 | 0.73 | 0.27 | ||||
| PCLAB | 3 | 300 | 150 | 7.53 | 0.85 | 0.77 | 0.60 | 0.71 | 0.29 |
| 300 | 150 | 1.09 | 0.98 | 0.55 | 0.45 | ||||
| Average splitting tensile strength, (MPa) | 0.92 | ||||||||
| Standard deviation (MPa) (Coefficient of variation) | 0.15 (16%) | ||||||||
| Mean (MPa) | 0.67 | 0.33 | |||||||
| Standard deviation (MPa) | 0.10 | 0.10 | |||||||
| Coefficient of variation | 0.15 | 0.29 | |||||||
| Specimen | No. of Specimens | Splitting Tensile | Axial Tensile | |||
|---|---|---|---|---|---|---|
| Strength | Strength | |||||
| mm | mm | MPa | MPa | MPa | ||
| 2.60 | 2.34 | |||||
| CON80 | 3 | Cubes | 16.8 | 2.60 | 2.34 | |
| 2.50 | 2.25 | |||||
| Average splitting tensile strength, (MPa) | 2.57 | |||||
| Standard deviation (MPa) (Coefficient of variation) | 0.06 (2%) | |||||
| 200 | 100 | 2.10 | 1.89 | |||
| CON120 | 3 | 200 | 100 | 17.3 | 2.50 | 2.25 |
| 200 | 100 | 2.30 | 2.07 | |||
| Average splitting tensile strength, (MPa) | 2.30 | |||||
| Standard deviation (MPa) (Coefficient of variation) | 0.20 (9%) | |||||
| 300 | 150 | 1.72 | 1.55 | |||
| CLAB | 3 | 300 | 150 | 17.41 | 1.73 | 1.56 |
| 300 | 150 | 2.11 | 1.90 | |||
| Average splitting tensile strength, (MPa) | 1.85 | |||||
| Standard deviation (MPa) (Coefficient of variation) | 0.22 (12%) | |||||
| Details | Measured | Calculated | ||||||||||||
|---|---|---|---|---|---|---|---|---|---|---|---|---|---|---|
| Average | with | with | with | |||||||||||
| Specimen | w | h | D | |||||||||||
| mm | mm | mm | kN | MPa | MPa | MPa | MPa | mm | MPa | |||||
| CON80–1 | 800 | 800 | 150 | 548.4 | 2.29 | 0.99 | 3.23 | 1.40 | 60 | 0.462 | 2.11 | 0.91 | ||
| CON80–2 | 800 | 800 | 150 | 616.1 | 2.57 | 2.31 | 2.57 | 1.11 | 3.63 | 1.57 | 50 | 0.468 | 2.40 | 1.04 |
| CON120–1 | 1200 | 1200 | 150 | 751.3 | 2.09 | 1.01 | 2.95 | 1.43 | 60 | 0.462 | 1.93 | 0.93 | ||
| CON120–2 | 1200 | 1200 | 150 | 895.8 | 2.30 | 2.07 | 2.49 | 1.20 | 3.52 | 1.70 | 30 | 0.478 | 2.38 | 1.15 |
| Mean | 1.08 | 1.52 | 1.01 | |||||||||||
| Standard deviation | 0.10 | 0.14 | 0.11 | |||||||||||
| Coefficient of variation | 0.09 | 0.09 | 0.11 | |||||||||||
| LO–1 | 800 | 800 | 240 | 133.8 | 0.35 | 0.68 | 0.49 | 0.96 | 90 | 0.434 | 0.30 | 0.59 | ||
| LO–2 | 800 | 800 | 190 | 93.7 | 0.57 | 0.51 | 0.31 | 0.60 | 0.44 | 0.85 | 80 | 0.444 | 0.27 | 0.53 |
| DH–1 | 700 | 700 | 195 | 154.1 | 0.56 | 1.46 | 0.80 | 2.06 | 110 | 0.410 | 0.46 | 1.20 | ||
| DH–2 | 700 | 700 | 200 | 150.4 | 0.43 | 0.39 | 0.54 | 1.39 | 0.76 | 1.96 | 60 | 0.462 | 0.50 | 1.28 |
| Mean | 1.03 | 1.46 | 0.90 | |||||||||||
| Standard deviation | 0.45 | 0.64 | 0.39 | |||||||||||
| Coefficient of variation | 0.44 | 0.44 | 0.44 | |||||||||||
Publisher’s Note: MDPI stays neutral with regard to jurisdictional claims in published maps and institutional affiliations. |
© 2021 by the authors. Licensee MDPI, Basel, Switzerland. This article is an open access article distributed under the terms and conditions of the Creative Commons Attribution (CC BY) license (https://creativecommons.org/licenses/by/4.0/).
Share and Cite
Eid, R.; Dancygier, A.N.; Jaber, G. Mechanical Properties of Low-Performance Concrete (LPC) and Shear Capacity of Old Unreinforced LPC Squat Walls. Materials 2021, 14, 7310. https://doi.org/10.3390/ma14237310
Eid R, Dancygier AN, Jaber G. Mechanical Properties of Low-Performance Concrete (LPC) and Shear Capacity of Old Unreinforced LPC Squat Walls. Materials. 2021; 14(23):7310. https://doi.org/10.3390/ma14237310
Chicago/Turabian StyleEid, Rami, Avraham N. Dancygier, and Ghali Jaber. 2021. "Mechanical Properties of Low-Performance Concrete (LPC) and Shear Capacity of Old Unreinforced LPC Squat Walls" Materials 14, no. 23: 7310. https://doi.org/10.3390/ma14237310
APA StyleEid, R., Dancygier, A. N., & Jaber, G. (2021). Mechanical Properties of Low-Performance Concrete (LPC) and Shear Capacity of Old Unreinforced LPC Squat Walls. Materials, 14(23), 7310. https://doi.org/10.3390/ma14237310