Abstract
As a kind of potential biomedical material, Mg–Ca alloy has attracted much attention. However, the role of Ca-containing intermetallics in microgalvanic corrosion is still controversial. In 0.6 mol/L NaCl and Na2SO4 solutions, the microgalvanic corrosion behavior of the second phase and Mg matrix of Mg–Ca and Mg–Al–Ca alloys was examined. It was confirmed that the Mg2Ca phase acts as a microanode in microgalvanic corrosion in both NaCl and Na2SO4 solutions, with the Mg matrix acting as the cathode and the Al2Ca phase acting as the microcathode to accelerate corrosion of the adjacent Mg matrix. It was also found that Cl− and SO42− have different sensibilities to microgalvanic corrosion.
1. Introduction
Magnesium alloys have attracted special interest in many fields for their light weight, high specific strength, and great biodegradability [1,2]. They have considerable potential for application in transportation, aerospace, electronic technology, and especially biomedicine [3,4,5]. Magnesium alloys have a similar density to human bones and good biocompatibility to be used as human implant materials, which is why they are known as revolutionary metal materials [6,7,8,9,10]. However, the corrosion rate is so fast that many hydrogen bubbles are generated in the human tissue, and the Mg(OH)2 surface film formed is loose and porous, meaning it has no protective effect during the soaking process [11]. The poor corrosion resistance prevents wider commercial application of Mg alloys [12,13].
Many alloying elements have been added to Mg alloys to increase corrosion resistance and strength for biomedical applications. Recently, rare earth elements [14,15,16,17] have been used as additional elements. However, it is regrettable that rare earth elements are harmful to the human body and not suitable as human implant materials. A small amount of Al is not harmful to the human body, while Ca is essential for the human body [18,19] and is often used as an added element to reduce the grain size [20,21]. Zhu et al. reported a new Mg–Al–Ca alloy in which a majority of deformable Al2Ca precipitates were formed. This alloy demonstrated one of the highest combinations of tensile elongation and work hardening capacity among existing Mg alloys [22].
With the increase in Ca content in Mg–Al alloys, the precipitation phase changes from Mg17Al12 to the Al2Ca and Mg2Ca phases [23]. The electrochemical property of these intermetallics is worthy of attention. It is well known that the Mg17Al12 phase is nobler than the Mg matrix and acts as a cathode to accelerate dissolution of the Mg matrix [24]. Ca is a more active element than Mg, and the electrochemical effect of Ca-containing intermetallics differ from that of intermetallics containing Al. Esmaily [25] and Südholz [26] claimed the Mg2Ca phase is unique as it possesses a more active corrosion potential than the Mg matrix of all Mg-based intermetallics. Yang [20] added Ca to Mg–Al–Mn alloy and found that Ca-containing intermetallics were initially corroded instead of the Mg matrix. On the other hand, Wu [23] added Al to Mg–Ca alloy and found that Ca-containing intermetallics acted as cathodes and barriers to corrosion. The corrosion behavior of Ca-containing intermetallics in microgalvanic corrosion is still debatable.
Due to the potential application of magnesium–calcium alloys as biomaterials, their corrosion behavior is mostly studied in simulated body fluids [27,28]. However, the corrosion behavior of Mg–Al alloys reported thus far has mostly focused on NaCl solution [29]. In addition, there has been limited research on corrosion of Mg–Al–Ca alloys, and all the known studies were carried out in NaCl solution [30]. The human body fluid contains many ions, such as chloride, phosphate, carbonate, sulfate, etc. [10,11]. According to previous results, Cl− is much more aggressive than SO42− to Mg alloys [31]. The present authors recently found that WE43 (Mg–Y–Gd–Nd–Zr) alloy shows worse corrosion resistance in Na2SO4 than in NaCl solution [4]. Meanwhile, the microgalvanic corrosion behavior of WE43 alloy in Na2SO4 solution, where the second phase acts as anode and dissolves preferentially, is poles apart from that in NaCl solution, where the second phase acts as a cathode. It is worth investigating whether Ca-containing intermetallics have different microgalvanic behavior in NaCl and Na2SO4 solutions.
The present work aimed to study the role of Ca-containing intermetallics in microgalvanic corrosion in NaCl and Na2SO4 solutions and the corrosion resistance of Mg–Ca and Mg–Al–Ca alloys in the two solutions.
2. Experimental Procedure
2.1. Materials Preparation
Mg–Ca and Mg–Al–Ca alloys were supplied by YinGuang Magnesium Industry Co., Ltd., Wenxi, China. The nominal composition is listed in Table 1. The ingot casting was cut into 10 mm × 10 mm × 10 mm sample for the immersion test, followed by being ground, polished, degreased, and dried. The specimens connected to the copper wire and sealed with resin were used for electrochemical tests with an exposed area of 1 cm2. Subsequently, the working surface was mechanically ground with SiC paper to P2000 grit, cleaned with deionized water and alcohol, and finally dried by flowing cold air.

Table 1.
The nominal composition of Mg–Ca and Mg–Al–Ca alloys (wt %).
2.2. Microstructure Characterization
The microstructure of the Mg–Ca and Mg–Al–Ca alloys was observed by optical microscopy (OM) and scanning electron microscope (SEM; American FEI Quanta 250 FEG). The phase morphology of the alloys was detected by t backscattered electron (BSE).
2.3. Immersion Measurements
2.3.1. Immersion Observation Tests
At 25 ± 0.5 °C, the sample size of 10 × 10 × 10 mm was exposed to 0.6 mol/L NaCl solution and 0.6 mol/L Na2SO4 solution for 2 min, 5 min, 30 min, 2 h, 5 h, and 24 h for corrosion morphology observation. All specimens were washed with deionized water after immersion, degreased with ethanol, and dried in cold air flow. At room temperature, the specimens were soaked in a chromic acid solution containing 180 g/L CrO3 for 5 min to remove the corrosion products. SEM–BSE and EDS were used to examine the corrosion surface after removing corrosion products as well as the cross-sectional morphology of the corroded samples.
2.3.2. Hydrogen Evolution and Weight Loss Test
All the tests were performed in 0.6 mol/L NaCl and 0.6 mol/L Na2SO4 solutions at 25 ± 0.5 °C. The funnel collected all the hydrogen bubbles over a specimen with the dimension of 30 mm × 30 mm × 10 mm in a beaker containing 2 L of testing solution. The hydrogen evolution was recorded every five minutes for a total of three hours. The weight loss test was carried out using a digital balance (JA3003) before and after soaking with the corrosion products removed by chromic acid.
2.3.3. Electrochemical Measurements
All the experiments were carried out in 0.6 mol/L NaCl and 0.6 mol/L Na2SO4 solutions using a CHI660D electrochemical workstation. At 25 ± 0.5 °C, a typical three-electrode setup was used with a Pt mesh as the counter electrode, an R232 saturated calomel electrode (SCE) as the reference electrode, and the samples as the working electrode.
EIS tests were performed at open-circuit potential over a frequency range from 100 kHz to 10 mHz, and the sinusoid potential perturbation had an amplitude of 5 mV. The EIS spectra were fitted using the ZSimpWin 3.20 software.
After the EIS test, the cathodic polarization curves were carried out from 0 to −0.3 V vs. the OCP. All the electrochemical tests were replicated more than three times to ensure accuracy of the results. The anodic polarization curves were started at the OCP value and terminated at a final current density of 10 mA cm−2. The scan rate was 0.5 mV s−1.
3. Results and Discussion
3.1. Microstructural Analysis
The SEM micrographs are presented in Figure 1. As can be seen, with the addition of the Al element, the size of the grain became smaller. The number of second phases at the grain boundaries increased, and the second phase morphology changed from a semicontinuous network in Mg–Ca alloys to a continuous network in Mg–Al–Ca alloys. The second phase in the Mg–Ca alloy was the Mg2Ca phase, and the types of second phase in Mg–Al–Ca alloys were determined by the mass ratio of Ca/Al [32]. Ninomiya et al. [33] reported that there were two kinds of second phase particles (Mg2Ca and Al2Ca phase) in Mg–Al–Ca alloys when the mass ratio of Ca/Al was higher than 0.8, while there was only an Al2Ca phase particle when the mass ratio of Ca/Al was lower than 0.8. Jiang [34] and Luo [35] confirmed that the second phase containing Ca was (MgAl)2Ca with the Ca/Al ratio of 0.50–0.67. The Ca/Al ratio of the Mg–Al–Ca alloy in this work was 0.70. Taking the results of EDS (Figure 1c) and element mapping (Figure 2) into consideration, it was still unclear whether the network second phase in the Mg–Al–Ca alloy was (MgAl)2Ca or Al2Ca as the detecting area must contain the influence of the adjacent Mg matrix. Luckily, the influence of the Mg matrix could be eliminated after immersion in solution, and it was found that Al2Ca was the main component of the network’s second phase, as further discussed in Section 3.2.2. Meanwhile, the SEM–BSE morphology of the Mg–Al–Ca alloy showed bright block phases were distributed along with the network second phase; this was the AlMn phase.
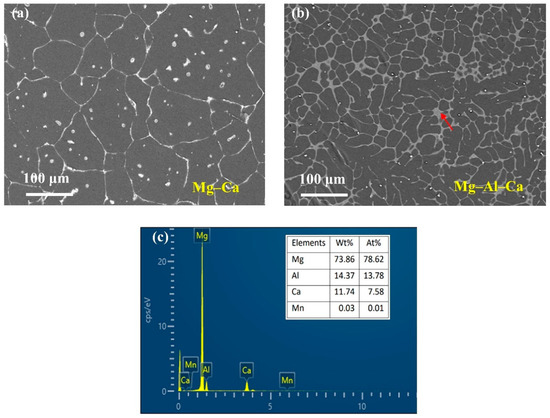
Figure 1.
SEM–BSE morphologies of Mg–Ca and Mg–Al–Ca alloys. (a) Mg–Ca alloy; (b) Mg–Al–Ca alloy; (c) EDS results of the second phase (pointed by the red arrow) in Mg–Al–Ca alloy.
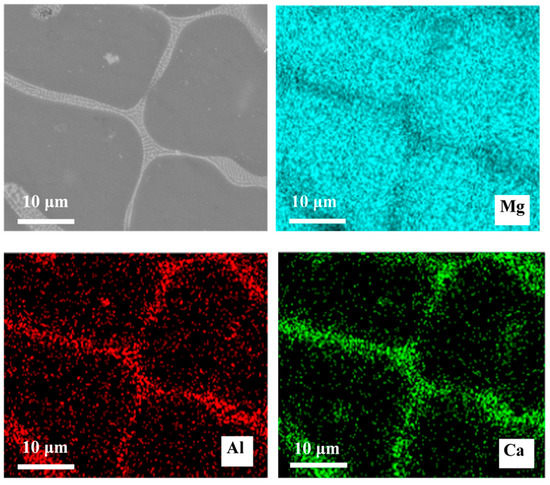
Figure 2.
SEM–BSE morphologies of Mg–Al–Ca alloy and EDS mapping of elements.
3.2. Corrosion Morphology Characterization
3.2.1. Mg–Ca Alloy
Figure 3 depicts the microgalvanic corrosion behavior of the Mg–Ca alloy’s second phase and Mg matrix in NaCl solution with the corrosion products removed. It was confirmed that the second phase of the Mg–Ca alloy was more active than the Mg matrix and dissolved preferentially in NaCl solution.
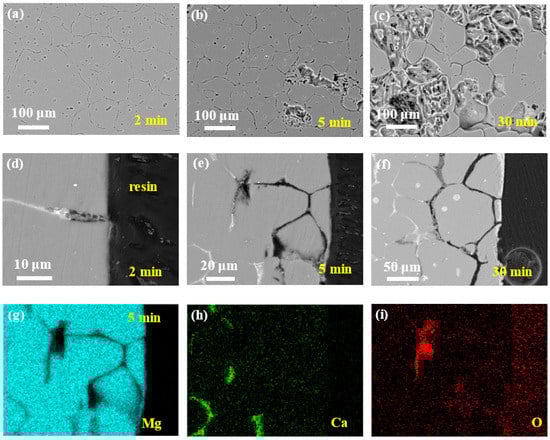
Figure 3.
Corrosion morphologies of Mg–Ca alloy after immersion in 0.6 mol/L NaCl solution for different times with corrosion products removed. Surface morphologies after (a) 2 min, (b) 5 min, and (c) 30 min. Cross-section morphologies after (d) 2 min, (e) 5 min, and (f) 30 min. (g–i) EDS mapping results of 5 min cross-sectional sample in (e).
After 2 min of immersion, no second phase could be detected on the surface of the Mg–Ca alloy (see Figure 3a), and the depth of dissolution of the second phase was about 10 m from the cross-sectional morphology (see Figure 3d), with the Mg matrix being unaffected. Then, with the increase in the immersion time, the dissolution of the second phase became more and more severe, about 60 and 100 μm of the dissolution depth after immersion for 5 and 30 min, respectively (see Figure 3b–f). Meanwhile, the intensity of the microgalvanic corrosion between the second phase and Mg matrix weakened with the depth of the second phase dissolution increasing, and corrosion of the Mg matrix was triggered. The corrosion of the Mg matrix could be seen on the surface after immersion for 5 min (see Figure 3b), which extended to most of the surface after 30 min (see Figure 3c).
The mapping results of elements Mg, Ca, and O of the sample after immersion for 5 min (Figure 3e) confirmed the dissolution of the second phase. The hole left by the dissolution of the second phase was filled with epoxy resin; thus, the missing Mg and Ca in this area was distinct (see Figure 3g,h). The bottom of the dissolution showed enrichment of O, which were oxides or hydroxides that were not removed by the chromic acid. However, Mg and Ca deficiency was observed in this area, which was unexpected. The oxides or hydroxides should be CaO/Ca(OH)2 or MgO/Mg(OH)2; thus, there should be the existence of Ca and Mg in this area in the mapping results. Perhaps the color in this area was weak but not void. This phenomenon requires further study.
Figure 4 shows the microgalvanic corrosion behavior of the Mg–Ca alloy in Na2SO4 solution. The second phase still served as the anode and dissolved preferentially. However, it was found that the severity of the Mg–Ca alloy corrosion in Na2SO4 solution was much weaker than that in NaCl solution, meaning the corrosion resistance of the Mg–Ca alloy in Na2SO4 solution was much better than that in the NaCl solution. After immersion for 30 min and 2 h, there was no existence of second phase on the surface of the Mg–Ca alloy (see Figure 4a,b). The depth of the dissolution of the second phase can be seen in Figure 4d,e, with the Mg matrix unattacked. After immersion for 5 h, the depth of the dissolution of the second phase increased, while small pitting corrosion of the Mg matrix emerged (see Figure 4c,f). This indicated corrosion of the Mg matrix due to dissolution of the second phase and weak microgalvanic corrosion, just like the corrosion phenomenon in NaCl solution. The mapping results of elements Mg, Ca, and O of the sample after immersion for 5 h (Figure 4f), as shown in Figure 4f,h,i, also confirmed the dissolution of the second phase.
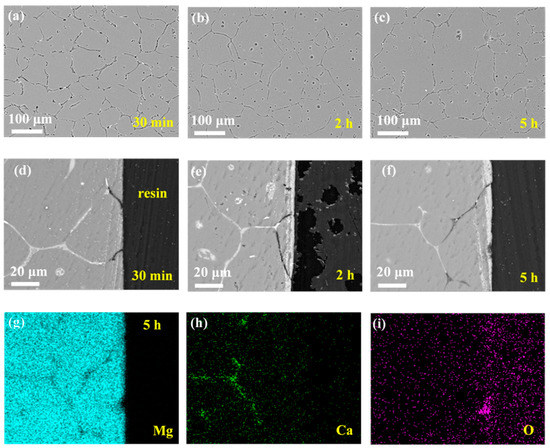
Figure 4.
Corrosion morphologies of Mg–Ca alloy after immersion in 0.6 mol/L Na2SO4 solutions for different times with corrosion products removed. Surface morphologies after (a) 30 min, (b) 2 h, and (c) 5 h. Cross-section morphologies after (d) 30 min, (e) 2 h, and (f) 5 h. (g–i) EDS mapping results of 5 h cross-sectional sample in (f).
The corrosion behavior of the Mg–Ca alloy in NaCl and Na2SO4 solutions was similar, and the corrosion process of the Mg–Ca alloy in both NaCl and Na2SO4 solutions could be divided into two stages. First, this step was dominated by microgalvanic corrosion between the second phase and the Mg matrix, with the second phase acting as anode and dissolving preferentially with the Mg matrix protected. Second, with the depth of the second phase dissolution increasing, the microgalvanic corrosion on the surface of the Mg–Ca alloy weakened, and corrosion of the Mg matrix occurred; thus, in this stage, microgalvanic corrosion and dissolution of the Mg matrix took place simultaneously.
3.2.2. Mg–Al–Ca Alloy
The corrosion morphologies of the Mg–Al–Ca alloy in NaCl solution with corrosion products removed are shown in Figure 5. Contrary to the microgalvanic corrosion behavior of the Mg–Ca alloy, the second phase in the Mg–Al–Ca alloy acted as the cathode and accelerated corrosion of the Mg matrix. In NaCl solution, firstly, the Mg matrix adjacent to the second phase corroded, as seen in Figure 5a. The origination of microgalvanic corrosion can be appreciably observed in the cross-sectional morphology in Figure 5d. After immersion for 5 h, microgalvanic corrosion proceeded, the extension of the corrosion area was no longer limited adjacent to the second phase anymore, and the island of the intact Mg matrix was distributed on the surface (see Figure 5b,e). Then, after immersion for 24 h, the whole surface suffered severe corrosion with the remnant of the network second phase (see Figure 5c). In the cross-sectional morphology in Figure 5f,g, dissolution of the Mg matrix and the residual network second phase can be appreciably observed.
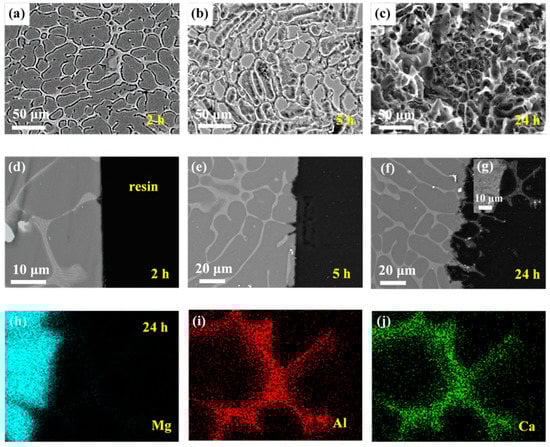
Figure 5.
Corrosion morphologies of Mg–Al–Ca alloy after immersion in 0.6 mol/L NaCl solution for different times with corrosion products removed. Surface morphologies after (a) 2 h, (b) 5 h, and (c) 24 h. Cross-section morphologies after (d) 2 h, (e) 5 h, and (f,g) 24 h. (h–j) EDS mapping results of 24 h cross-sectional sample in (g).
The mapping results of elements Mg, Al, and Ca of the sample after immersion for 24 h (Figure 5g), as shown in Figure 5h–j, confirmed the network second phase acting as the cathode during microgalvanic corrosion. Meanwhile, the results of mapping identified the component of the second phase of the Mg–Al–Ca alloy. The enrichment of Al and Ca in the second phase is shown in Figure 5i,j; however, few Mg element existed in this area. Thus, the second phase in the Mg–Al–Ca alloy was Al2Ca, not (MgAl)2Ca.
The corrosion morphologies of the Mg–Al–Ca alloy in Na2SO4 solution with corrosion products removed are shown in Figure 6. It was observed that the corrosion rate of the Mg–Al–Ca alloy in Na2SO4 solution was much slower than that in NaCl solution. The slight corrosion of the surface morphology after immersion for 5 h is shown in Figure 6a. Only some holes (indicated by the red arrows) could be seen on the surface resulting from the falling of the AlMn phase. Then, with the immersion time increasing, the morphology in Figure 6b dominated the surface after immersion for 24 h (the corresponding cross-section morphology is shown in Figure 6d). Apart from the falling of the AlMn phase, small pitting corrosion or uniform corrosion of Mg matrix occurred on the surface, not microgalvanic corrosion between the Al2Ca phase and Mg matrix like the corrosion behavior of the Mg–Al–Ca alloy in NaCl solution. Occasionally, there were one or two corrosion pits on the surface (see Figure 6c; corresponding cross-section morphology is shown in Figure 6e). In this area, obvious microgalvanic corrosion between the Al2Ca phase and Mg matrix was present, with the Al2Ca phase acting as the cathode. The mapping results of elements Mg, Al, Ca, and O are shown in Figure 6f–i, respectively. The corrosion pit could be attributed to the distribution of the AlMn phase and impurities.
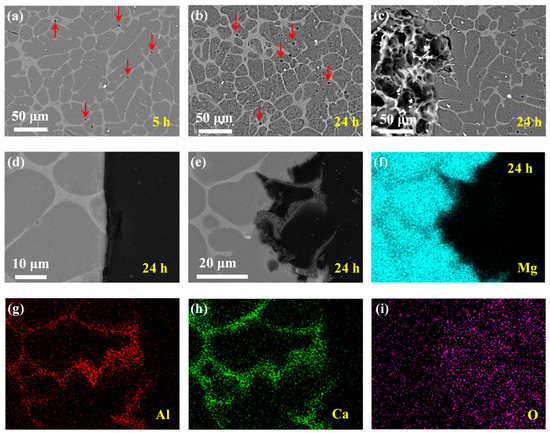
Figure 6.
Corrosion morphologies of Mg–Al–Ca alloy after immersion in 0.6 mol/L Na2SO4 solutions for different times with corrosion products removed. Surface morphologies after (a) 5 h and (b,c) 24 h. Cross-sectional morphologies (d) corresponding to (b,e) corresponding to (c). (f–i) EDS mapping results of 24 h cross-sectional sample in (e).
The corrosion behavior of the Mg–Al–Ca alloy in NaCl solution was significantly different from that in Na2SO4 solution. In NaCl solution, the microgalvanic corrosion between the Al2Ca phase and Mg matrix of the Mg–Al–Ca alloy dominated the whole immersion process, with the Al2Ca phase acting as cathode. However, in the Na2SO4 solution, uniform corrosion of the Mg matrix was the main phenomenon. In other words, NaCl solution was much more sensitive to the difference between phases in the Mg–Al–Ca alloy than Na2SO4 solution.
3.3. Hydrogen Evolution and Weight Loss Test
The weight loss rates of the Mg–Ca and Mg–Al–Ca alloys immersed in 0.6 mol/L NaCl solution and 0.6 mol/L Na2SO4 solution for two days are shown in Figure 7. The weight loss rate of the Mg–Ca alloy in NaCl solution (76.92 mm/y) was about 5 times faster than that in Na2SO4 solution (16.03 mm/y), and the weight loss rate of the Mg–Al–Ca alloy in NaCl solution (19.86 mm/y) was about 6 times as fast as that in Na2SO4 solution (3.33 mm/y). Both the Mg–Ca and Mg–Al–Ca alloys showed faster corrosion rates in NaCl solution than in Na2SO4 solution, which coincided with the corrosion morphologies. This phenomenon is attributed to Cl− being more corrosive than SO42− [31]. The WE43 alloy in these two solutions showed a different result, which is interesting [4].
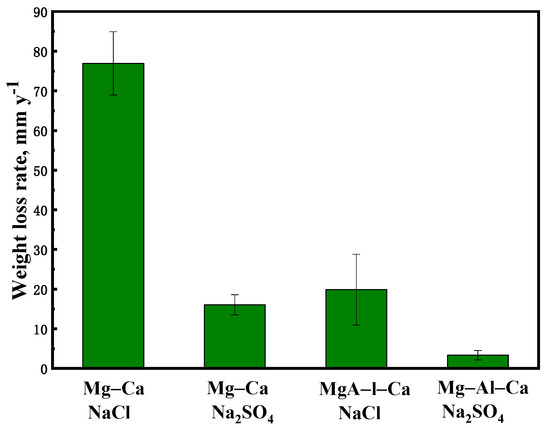
Figure 7.
The weight loss rate of Mg–Ca and Mg–Al–Ca alloys after soaking in 0.6 mol/L NaCl and Na2SO4 solutions for 2 d.
On the other hand, the corrosion resistance of the alloy became better with the addition of Al. In NaCl solution, the weight loss rate of the Mg–Ca alloy was about 4 times faster than that of the Mg–Al–Ca alloy. In Na2SO4 solution, the weight loss rate of the Mg–Ca alloy was about 5 times as fast as that of the Mg–Al–Ca alloy.
The hydrogen evolution of the two alloys immersed in 0.6 mol/L NaCl and Na2SO4 solutions for 3 h are shown in Figure 8. The hydrogen evolution of the Mg–Ca alloy was faster than that of the Mg–Al–Ca alloy, and it was faster in NaCl solution than in Na2SO4 solution. This result was consistent with the weight loss rate.
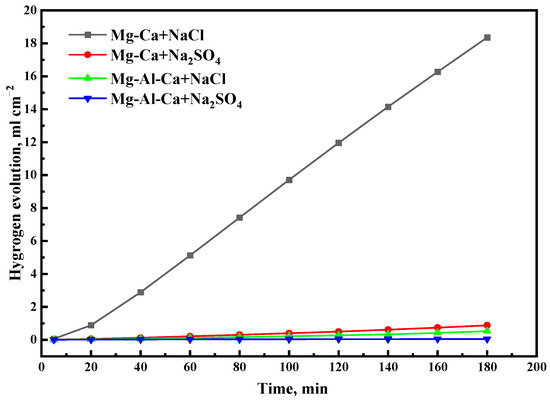
Figure 8.
Hydrogen evolution of Mg–Ca and Mg–Al–Ca alloys after immersion in 0.6 M NaCl and Na2SO4 solutions for 3 h.
3.4. Electrochemical Measurements
3.4.1. EIS Analysis
Figure 9 shows the EIS plots of the Mg–Ca and Mg–Al–Ca alloys soaked in 0.6 mol/L NaCl and Na2SO4 solutions. The plots of the alloys in Na2SO4 solution consisted of a high-frequency and a medium-frequency capacitance loop, while the plots of the alloys in NaCl solution had a low-frequency inductance loop. The high-frequency capacitance loop can be associated with the electric double layer at the interface of the Mg substrate and electrolyte. The medium-frequency capacitance loop should be related to the surface film. The low-frequency loop can be attributed to the initiation of localized corrosion.
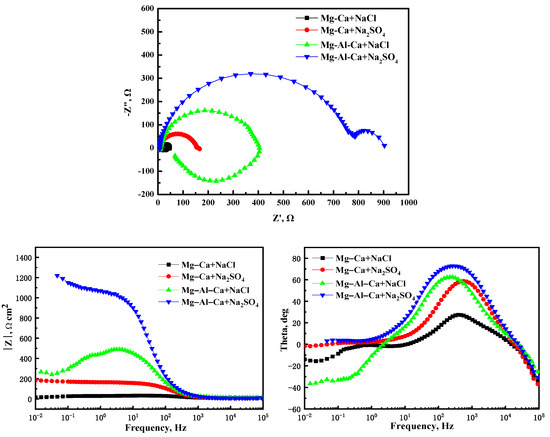
Figure 9.
The EIS plots of Mg–Ca alloy and Mg–Al–Ca alloys in 0.6 mol/L NaCl and Na2SO4 solutions.
The equivalent circuit diagram is shown in Figure 10, and the fitting results are given in Table 2. In Figure 10, Rs is the solution resistance, Rt is the charge transfer resistance, Qdl is the capacitance of the electric double layer, Rt and Qdl together indicate the first capacitance loop in high-frequency, and Rf and Qf are the surface film resistance and capacitance, respectively. In addition, L is the inductance of the electrochemical reactions at the film–substrate interface, and the RL is the resistance of the inductance [31].
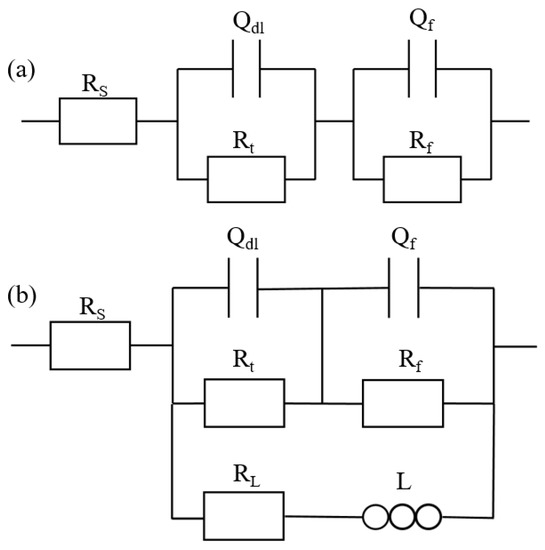
Figure 10.
Equivalent circuit diagram of Mg–Ca and Mg–Al–Ca alloys in (a) Na2SO4 solution and (b) NaCl solution.
Table 2.
EIS fitting results.
The capacitive diameter of the Mg–Ca and Mg–Al–Ca alloys in Na2SO4 solution was much larger than that in NaCl solution. Meanwhile, the Nyquist plots of the two alloys in NaCl solution showed a distinctive low-frequency inductance loop. These results indicate that the corrosion resistance of two alloys in Na2SO4 solution is better than in NaCl solution, which coincides with the results of corrosion morphologies, weight loss, and hydrogen evolution.
3.4.2. Potential Dynamic Polarization Curves
The cathodic and anodic polarization curves of the Mg–Ca and Mg–Al–Ca alloys immersed in 0.6 mol/L NaCl and Na2SO4 solutions are shown in Figure 11. Before the polarization test, the open-circuit potential was obtained, and the open-circuit potentials of Mg–Ca alloys immersed in NaCl solution, Mg–Ca alloys immersed in Na2SO4 solution, Mg–Al–Ca alloys immersed in NaCl solution, and Mg–Al–Ca alloys immersed in Na2SO4 solutions were −1.6422, −1.5424, −1.5776, and −1.584, respectively.
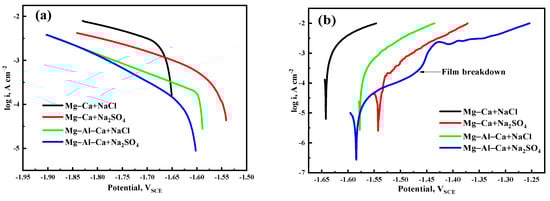
Figure 11.
Polarization curves of Mg–Ca and Mg–Al–Ca alloys in 0.6 mol/L NaCl and Na2SO4 solutions: (a) cathodic curves and (b) anodic curves. The polarization test of Mg–Ca alloy immersed in NaCl solution, Mg–Ca alloy immersed in Na2SO4 solution, Mg–Al–Ca alloy immersed in NaCl solution, and Mg–Al–Ca alloy immersed in Na2SO4 solution started from −1.6512, −1.5424, −1.5836, and −1.6014 VSCE, respectively.
It is generally believed that the cathode of the polarization curve represents a hydrogen evolution reaction, and the anode is related to the anodic dissolution of the magnesium alloy. The fitting results of the cathodic polarization curves in Figure 11 are listed in Table 3. The Icorr values of the two alloys in Na2SO4 solution were much smaller than those in NaCl solution. Meanwhile, the anodic polarization curve of the Mg–Al–Ca alloy in Na2SO4 solution showed passivation of the surface film, which terminated at the turning point of film breakdown. However, the other three curves were always active dissolution. This indicates that the surface film of Mg–Al–Ca alloy is more protective than that of the Mg–Ca alloy, and Cl− is more corrosive than SO42− to the surface film.
Table 3.
Fitting results of the cathodic polarization curves.
4. Conclusions
1. The second phase (Mg2Ca) of the Mg–Ca alloy serves as the microanode in microgalvanic corrosion with the Mg matrix in NaCl and Na2SO4 solutions. However, the second phase (Al2Ca) of the Mg–Al–Ca alloy serves as the microcathode in microgalvanic corrosion in NaCl and Na2SO4 solutions.
2. The addition of Al can significantly improve the corrosion resistance of the Mg–Ca alloy in both NaCl and Na2SO4 solutions.
3. Cl− ion is more sensitive to microgalvanic corrosion between different phases and more corrosive to the surface film than SO42− ion.
Author Contributions
Conceptualization, J.L. and S.H.; methodology, validation, and investigation, P.Y. and S.Y.; writing—original draft preparation, P.Y.; writing—review and editing, B.F. and G.L.; supervision, W.Z. and S.Z. (Shijie Zhu); project administration, J.L. and S.H.; funding acquisition, J.L., S.Z. (Shaojun Zhang) and W.T. All authors have read and agreed to the published version of the manuscript.
Funding
This work was funded by the China Postdoctoral Science Foundation (Grant No. 2020M682337), Certificate of Postdoctoral Research Grant in Henan Province (Grant No. 201903011), and the National Key Research and Development Program of China (Grant No. 2016YFB0301001 and 2016YFB0301101).
Institutional Review Board Statement
Not applicable.
Informed Consent Statement
Not applicable.
Data Availability Statement
All data used to support the findings of this study are included in the article.
Conflicts of Interest
The authors declare that they have no known competing financial interests or personal relationships that could have appeared to influence the work reported in this paper.
References
- You, S.; Huang, Y.; Kainer, K.U.; Hort, N. Recent research and developments on wrought magnesium alloys. J. Magnes. Alloys 2017, 5, 239–253. [Google Scholar] [CrossRef]
- Yu, S.; Liu, C.; Gao, Y.; Jiang, S.; Yao, Y. Microstructure, texture and mechanical properties of Mg-Gd-Y-Zr alloy annular forging processed by hot ring rolling. Mater. Sci. Eng. A 2017, 689, 40–47. [Google Scholar] [CrossRef]
- Chen, X.; Wang, H.; Zou, Q.; Le, Q.; Wen, C.; Atrens, A. The influence of heat treatment on discharge and electrochemical properties of Mg-Gd-Zn magnesium anode with long-period stacking ordered structure for Mg-air battery. Electrochim. Acta 2020, 367, 137518. [Google Scholar] [CrossRef]
- Feng, B.; Liu, G.; Yang, P.; Huang, S.; Qi, D.; Chen, P.; Wang, C.; Du, J.; Zhang, S.; Liu, J. Different role of the second phase in the micro-galvanic corrosion of WE43 Mg alloy in NaCl and Na2SO4 solution. J. Magnes. Alloys 2021. [Google Scholar] [CrossRef]
- Wu, S.X.; Wang, S.R.; Wang, G.Q.; Yu, X.C.; Liu, W.T.; Chang, Z.Q.; Wen, D.S. Microstructure, mechanical and corrosion properties of magnesium alloy bone plate treated by high-energy shot peening. Trans. Nonferrous Met. Soc. China Engl. Ed. 2019, 29, 1641–1652. [Google Scholar] [CrossRef]
- Staiger, M.P.; Pietak, A.M.; Huadmai, J.; Dias, G. Magnesium and its alloys as orthopedic biomaterials: A review. Biomaterials 2006, 27, 1728–1734. [Google Scholar] [CrossRef]
- Zeng, R.; Dietzel, W.; Witte, F.; Hort, N.; Blawert, C. Progress and challenge for magnesium alloys as biomaterials. Adv. Eng. Mater. 2008, 10, 3–14. [Google Scholar] [CrossRef]
- Etim, I.P.; Zhang, W.; Tan, L.; Yang, K. Influence of stamping on the biodegradation behavior of Mg–2Zn-0.5Nd (ZN20) sheet. Bioact. Mater. 2020, 5, 133–141. [Google Scholar] [CrossRef] [PubMed]
- Witte, F.; Kaese, V.; Haferkamp, H.; Switzer, E.; Meyer-Lindenberg, A.; Wirth, C.J.; Windhagen, H. In vivo corrosion of four magnesium alloys and the associated bone response. Biomaterials 2005, 26, 3557–3563. [Google Scholar] [CrossRef]
- Pokharel, D.B.; Liping, W.; Dong, J.; Wei, X.; Etim, I.I.N.; Subedi, D.B.; Umoh, A.J.; Ke, W. Effect of D-fructose on the in-vitro corrosion behavior of AZ31 magnesium alloy in simulated body fluid. J. Mater. Sci. Technol. 2021, 66, 202–212. [Google Scholar] [CrossRef]
- Xin, Y.; Huo, K.; Tao, H.; Tang, G.; Chu, P.K. Influence of aggressive ions on the degradation behavior of biomedical magnesium alloy in physiological environment. Acta Biomater. 2008, 4, 2008–2015. [Google Scholar] [CrossRef]
- Kang, Y.; Du, B.; Li, Y.; Wang, B.; Sheng, L.; Shao, L.; Zheng, Y.; Xi, T. Optimizing mechanical property and cytocompatibility of the biodegradable Mg-Zn-Y-Nd alloy by hot extrusion and heat treatment. J. Mater. Sci. Technol. 2019, 35, 6–18. [Google Scholar] [CrossRef]
- Song, M.S.; Zeng, R.C.; Ding, Y.F.; Li, R.W.; Easton, M.; Cole, I.; Birbilis, N.; Chen, X.B. Recent advances in biodegradation controls over Mg alloys for bone fracture management: A review. J. Mater. Sci. Technol. 2019, 35, 535–544. [Google Scholar] [CrossRef]
- Wang, L.; Jiang, J.; Yuan, T.; Xie, Q.; Liu, H.; Ma, A. Recent Progress on Corrosion Behavior and Mechanism of Mg–RE Based Alloys with Long Period Stacking Ordered Structure. Met. Mater. Int. 2020, 26, 551–563. [Google Scholar] [CrossRef]
- Srinivasan, A.; Blawert, C.; Huang, Y.; Mendis, C.L.; Kainer, K.U.; Hort, N. Corrosion behavior of Mg-Gd-Zn based alloys in aqueous NaCl solution. J. Magnes. Alloys 2014, 2, 245–256. [Google Scholar] [CrossRef] [Green Version]
- Willbold, E.; Gu, X.; Albert, D.; Kalla, K.; Bobe, K.; Brauneis, M.; Janning, C.; Nellesen, J.; Czayka, W.; Tillmann, W.; et al. Effect of the addition of low rare earth elements (lanthanum, neodymium, cerium) on the biodegradation and biocompatibility of magnesium. Acta Biomater. 2015, 11, 554–562. [Google Scholar] [CrossRef] [PubMed]
- Jin, S.; Zhang, D.; Lu, X.; Zhang, Y.; Tan, L.; Liu, Y.; Wang, Q. Mechanical properties, biodegradability and cytocompatibility of biodegradable Mg-Zn-Zr-Nd/Y alloys. J. Mater. Sci. Technol. 2020, 47, 190–201. [Google Scholar] [CrossRef]
- Zeng, R.C.; Qi, W.C.; Cui, H.Z.; Zhang, F.; Li, S.Q.; Han, E.H. In vitro corrosion of as-extruded Mg-Ca alloys-The influence of Ca concentration. Corros. Sci. 2015, 96, 23–31. [Google Scholar] [CrossRef]
- Zeng, R.C.; Sun, L.; Zheng, Y.F.; Cui, H.Z.; Han, E.H. Corrosion and characterisation of dual-phase Mg-Li-Ca alloy in Hank’s solution: The influence of microstructural features. Corros. Sci. 2014, 79, 69–82. [Google Scholar] [CrossRef]
- Yang, J.; Peng, J.; Nyberg, E.A.; Pan, F.S. Effect of Ca addition on the corrosion behavior of Mg-Al-Mn alloy. Appl. Surf. Sci. 2016, 369, 92–100. [Google Scholar] [CrossRef]
- Yin, P.; Li, N.F.; Lei, T.; Liu, L.; Ouyang, C. Effects of Ca on microstructure, mechanical and corrosion properties and biocompatibility of Mg-Zn-Ca alloys. J. Mater. Sci. Mater. Med. 2013, 24, 1365–1373. [Google Scholar] [CrossRef]
- Zhu, G.; Wang, L.; Wang, J.; Wang, J.; Park, J.S.; Zeng, X. Highly deformable Mg-Al–Ca alloy with Al2Ca precipitates. Acta Mater. 2020, 200, 236–245. [Google Scholar] [CrossRef]
- Wu, P.; Xu, F.; Deng, K.; Han, F.; Zhang, Z.; Gao, R. Effect of extrusion on corrosion properties of Mg-2Ca-ΧAl (Χ = 0, 2, 3, 5) alloys. Corros. Sci. 2017, 127, 280–290. [Google Scholar] [CrossRef]
- Dabah, E.; Ben-Hamu, G.; Lisitsyn, V.; Eliezer, D.; Shin, K.S. The influence of Ca on the corrosion behavior of new die-cast Mg-Al-based alloys for elevated temperature applications. J. Mater. Sci. 2010, 45, 3007–3015. [Google Scholar] [CrossRef]
- Esmaily, M.; Svensson, J.E.; Fajardo, S.; Birbilis, N.; Frankel, G.S.; Virtanen, S.; Arrabal, R.; Thomas, S.; Johansson, L.G. Fundamentals and advances in magnesium alloy corrosion. Prog. Mater. Sci. 2017, 89, 92–193. [Google Scholar] [CrossRef]
- Südholz, A.D.; Kirkland, N.T.; Buchheit, R.G.; Birbilis, N. Electrochemical properties of intermetallic phases and common impurity elements in magnesium alloys. Electrochem. Solid-State Lett. 2011, 14, 5–8. [Google Scholar] [CrossRef]
- Gao, J.C.; Wu, S.; Wang, Y.; Qiao, L.Y. Study on corrosion and degradation behavior of Mg-Ca alloy in simulated body fluid. Mater. Sci. Forum 2009, 610–613, 942–945. [Google Scholar] [CrossRef]
- Seong, J.W.; Kim, W.J. Mg-Ca binary alloy sheets with Ca contents of ≤1 wt.% with high corrosion resistance and high toughness. Corros. Sci. 2015, 98, 372–381. [Google Scholar] [CrossRef]
- Yin, Z.Z.; Zhang, Z.Q.; Tian, X.J.; Wang, Z.L.; Zeng, R.C. Corrosion Resistance, and Durability of Superhydrophobic Coating on AZ31 Mg Alloy via One-Step Electrodeposition. Acta Metall. Sin. Engl. Lett. 2021, 34, 25–38. [Google Scholar] [CrossRef]
- Wang, W.; Chen, S.Y.; Qiao, K.; Peng, P.; Han, P.; Wu, B.; Wang, C.X.; Wang, J.; Wang, Y.H.; Wang, K.S. Microstructure, Mechanical Properties, and Corrosion Behavior of Mg-Al–Ca Alloy Prepared by Friction Stir Processing. Acta Metall. Sin. Engl. Lett. 2021. [Google Scholar] [CrossRef]
- Song, G.; Atrens, A.; St. John, D.; Wu, X.; Nairn, J. The anodic dissolution of magnesium in chloride and sulfate solutions. Corros. Sci. 1997, 39, 1981–2004. [Google Scholar] [CrossRef]
- Liang, S.M.; Chen, R.S.; Blandin, J.J.; Suery, M.; Han, E.H. Thermal analysis and solidification pathways of Mg-Al-Ca system alloys. Mater. Sci. Eng. A 2008, 480, 365–372. [Google Scholar] [CrossRef]
- Ninomiya, R.; Ojiro, T.; Kubota, K. Improved heat resistance of Mg-Al alloys by the Ca addition. Acta Metall. Mater. 1995, 43, 669–674. [Google Scholar] [CrossRef]
- Jiang, Z.; Jiang, B.; Yang, H.; Yang, Q.; Dai, J.; Pan, F. Influence of the Al2Ca phase on microstructure and mechanical properties of Mg-Al-Ca alloys. J. Alloys Compd. 2015, 647, 357–363. [Google Scholar] [CrossRef]
- Luo, A.A.; Powell, B.R.; Balogh, M.P. Creep and microstructure of magnesium-aluminum-calcium based alloys. Metall. Mater. Trans. A 2002, 33, 567–574. [Google Scholar] [CrossRef]
Publisher’s Note: MDPI stays neutral with regard to jurisdictional claims in published maps and institutional affiliations. |
© 2021 by the authors. Licensee MDPI, Basel, Switzerland. This article is an open access article distributed under the terms and conditions of the Creative Commons Attribution (CC BY) license (https://creativecommons.org/licenses/by/4.0/).