
Carbonized Solid Fuel Production from Polylactic Acid and Paper Waste Due to Torrefaction


Abstract
:1. Introduction
1.1. Background of Current Situation
1.2. The Problem of Bioplastic Solution
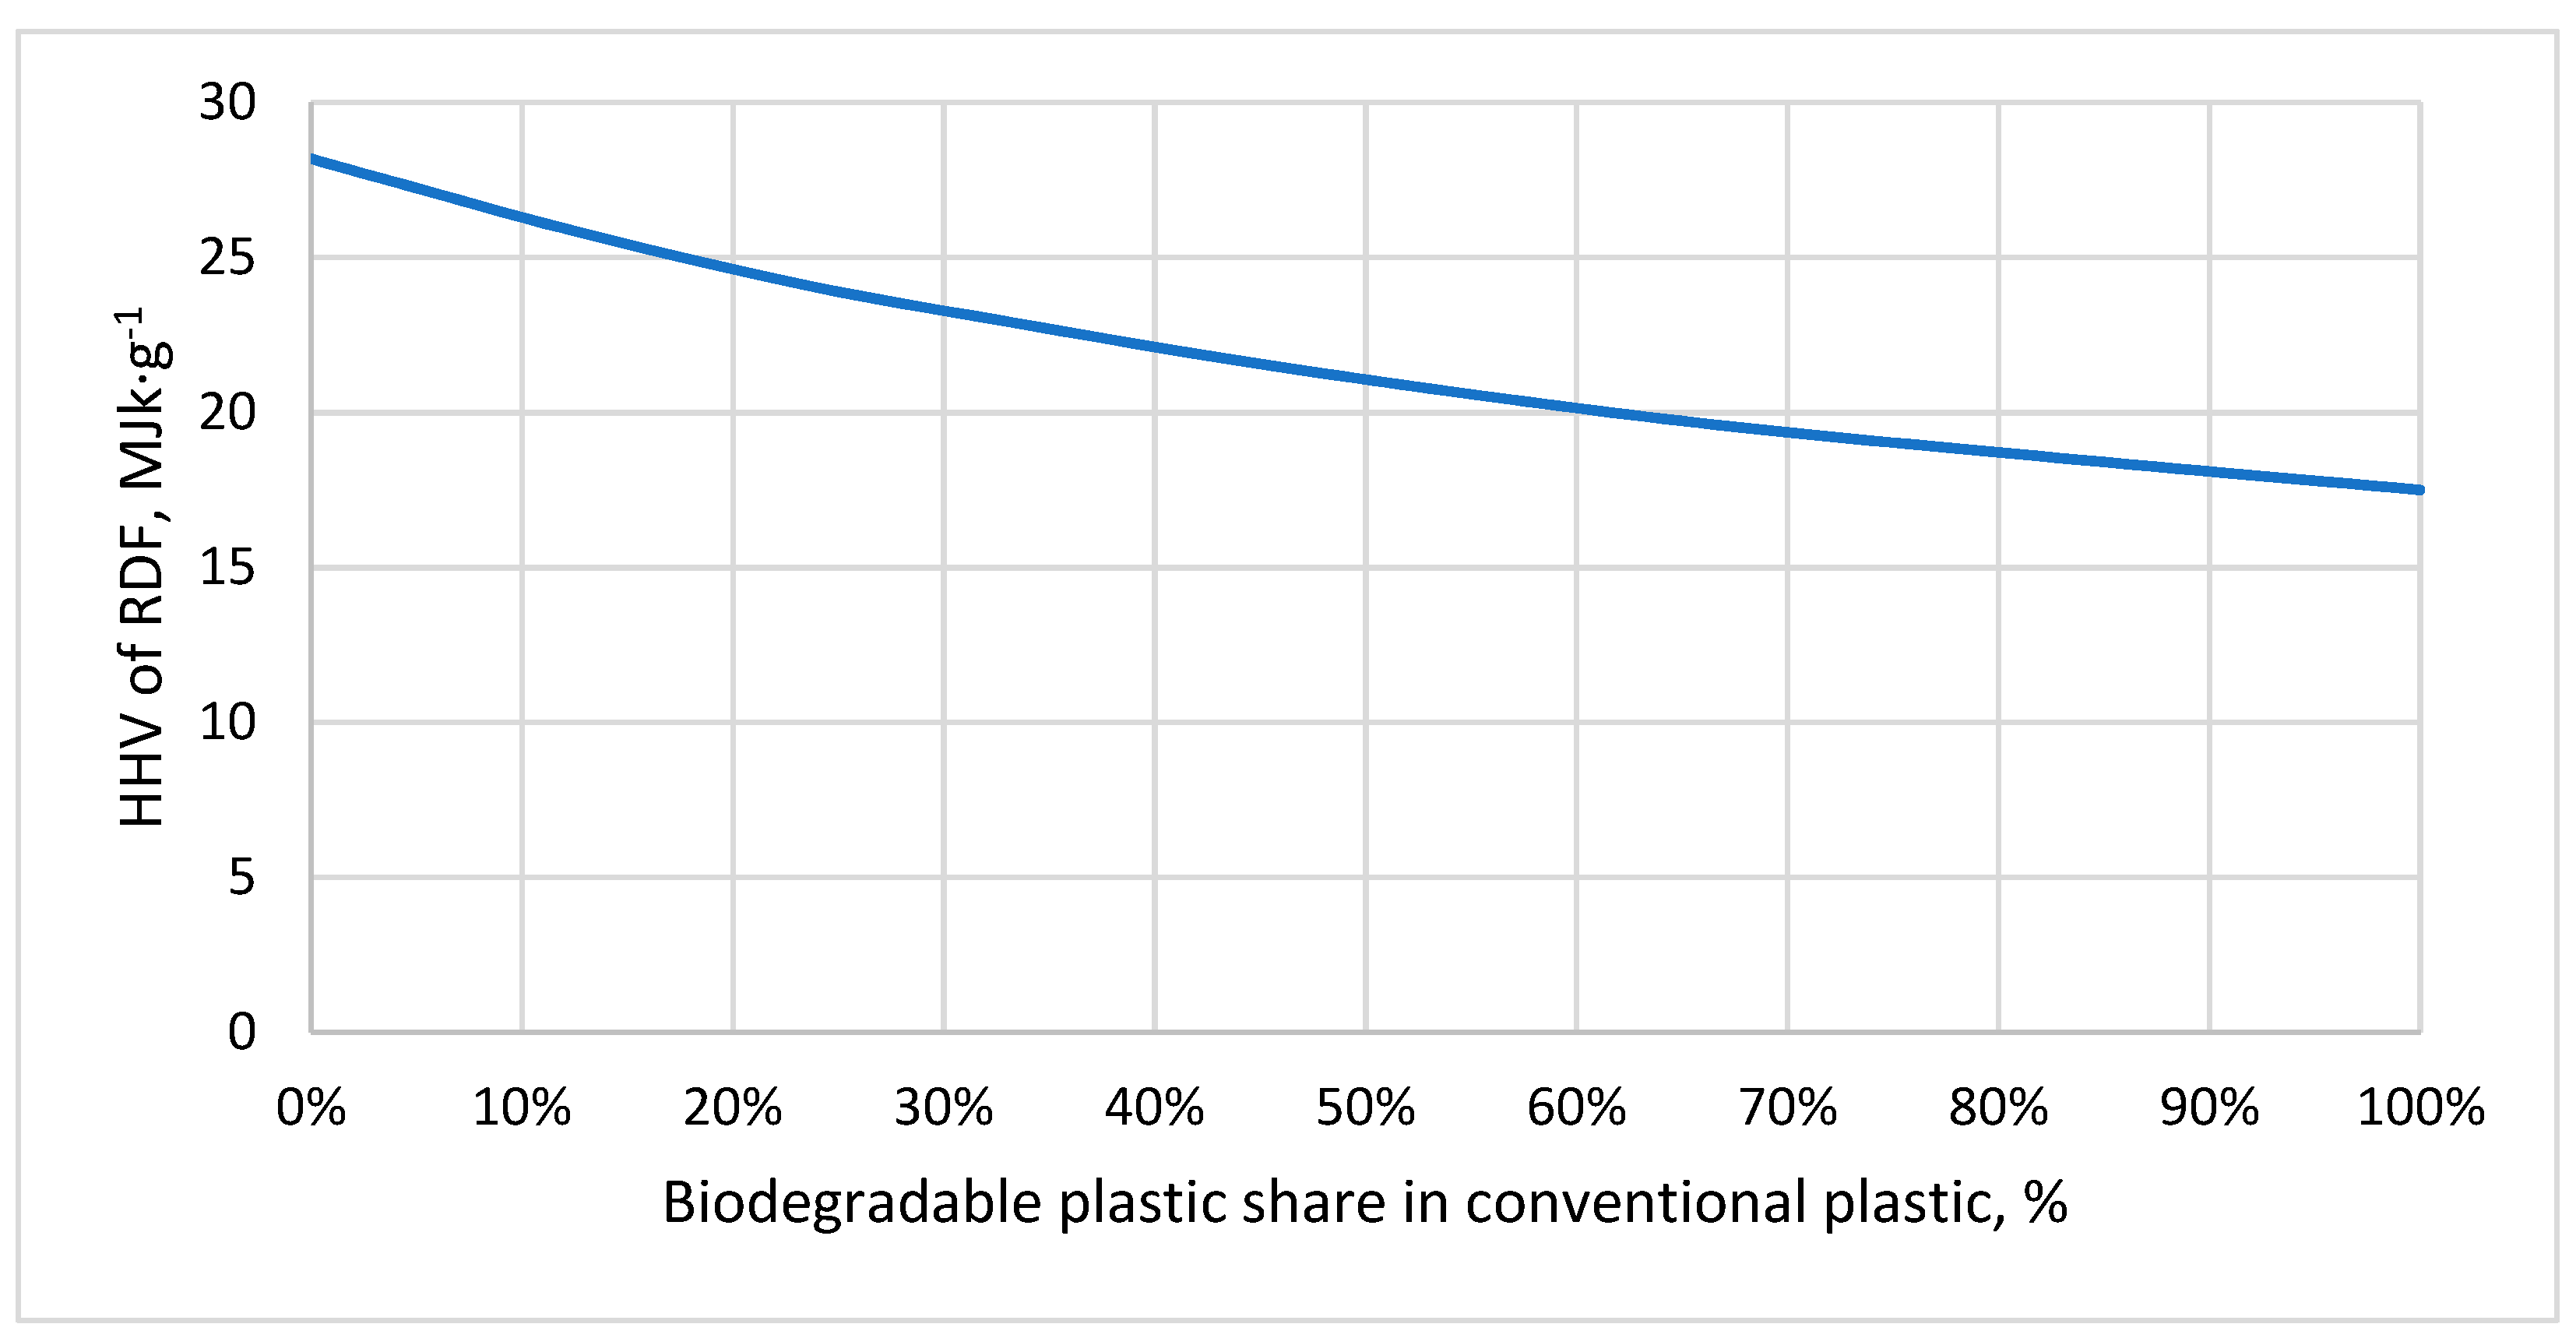
1.3. The RDF Quality Importance
1.4. Study Aim
1.5. Methods of Thermal Processes Analysis
2. Materials and Methods
2.1. Materials
2.2. Methods
2.2.1. Torrefaction Process—CSF Production
2.2.2. Proximate Analysis and HHV Determination
2.2.3. Statistical Analyses
2.2.4. Thermal Analysis
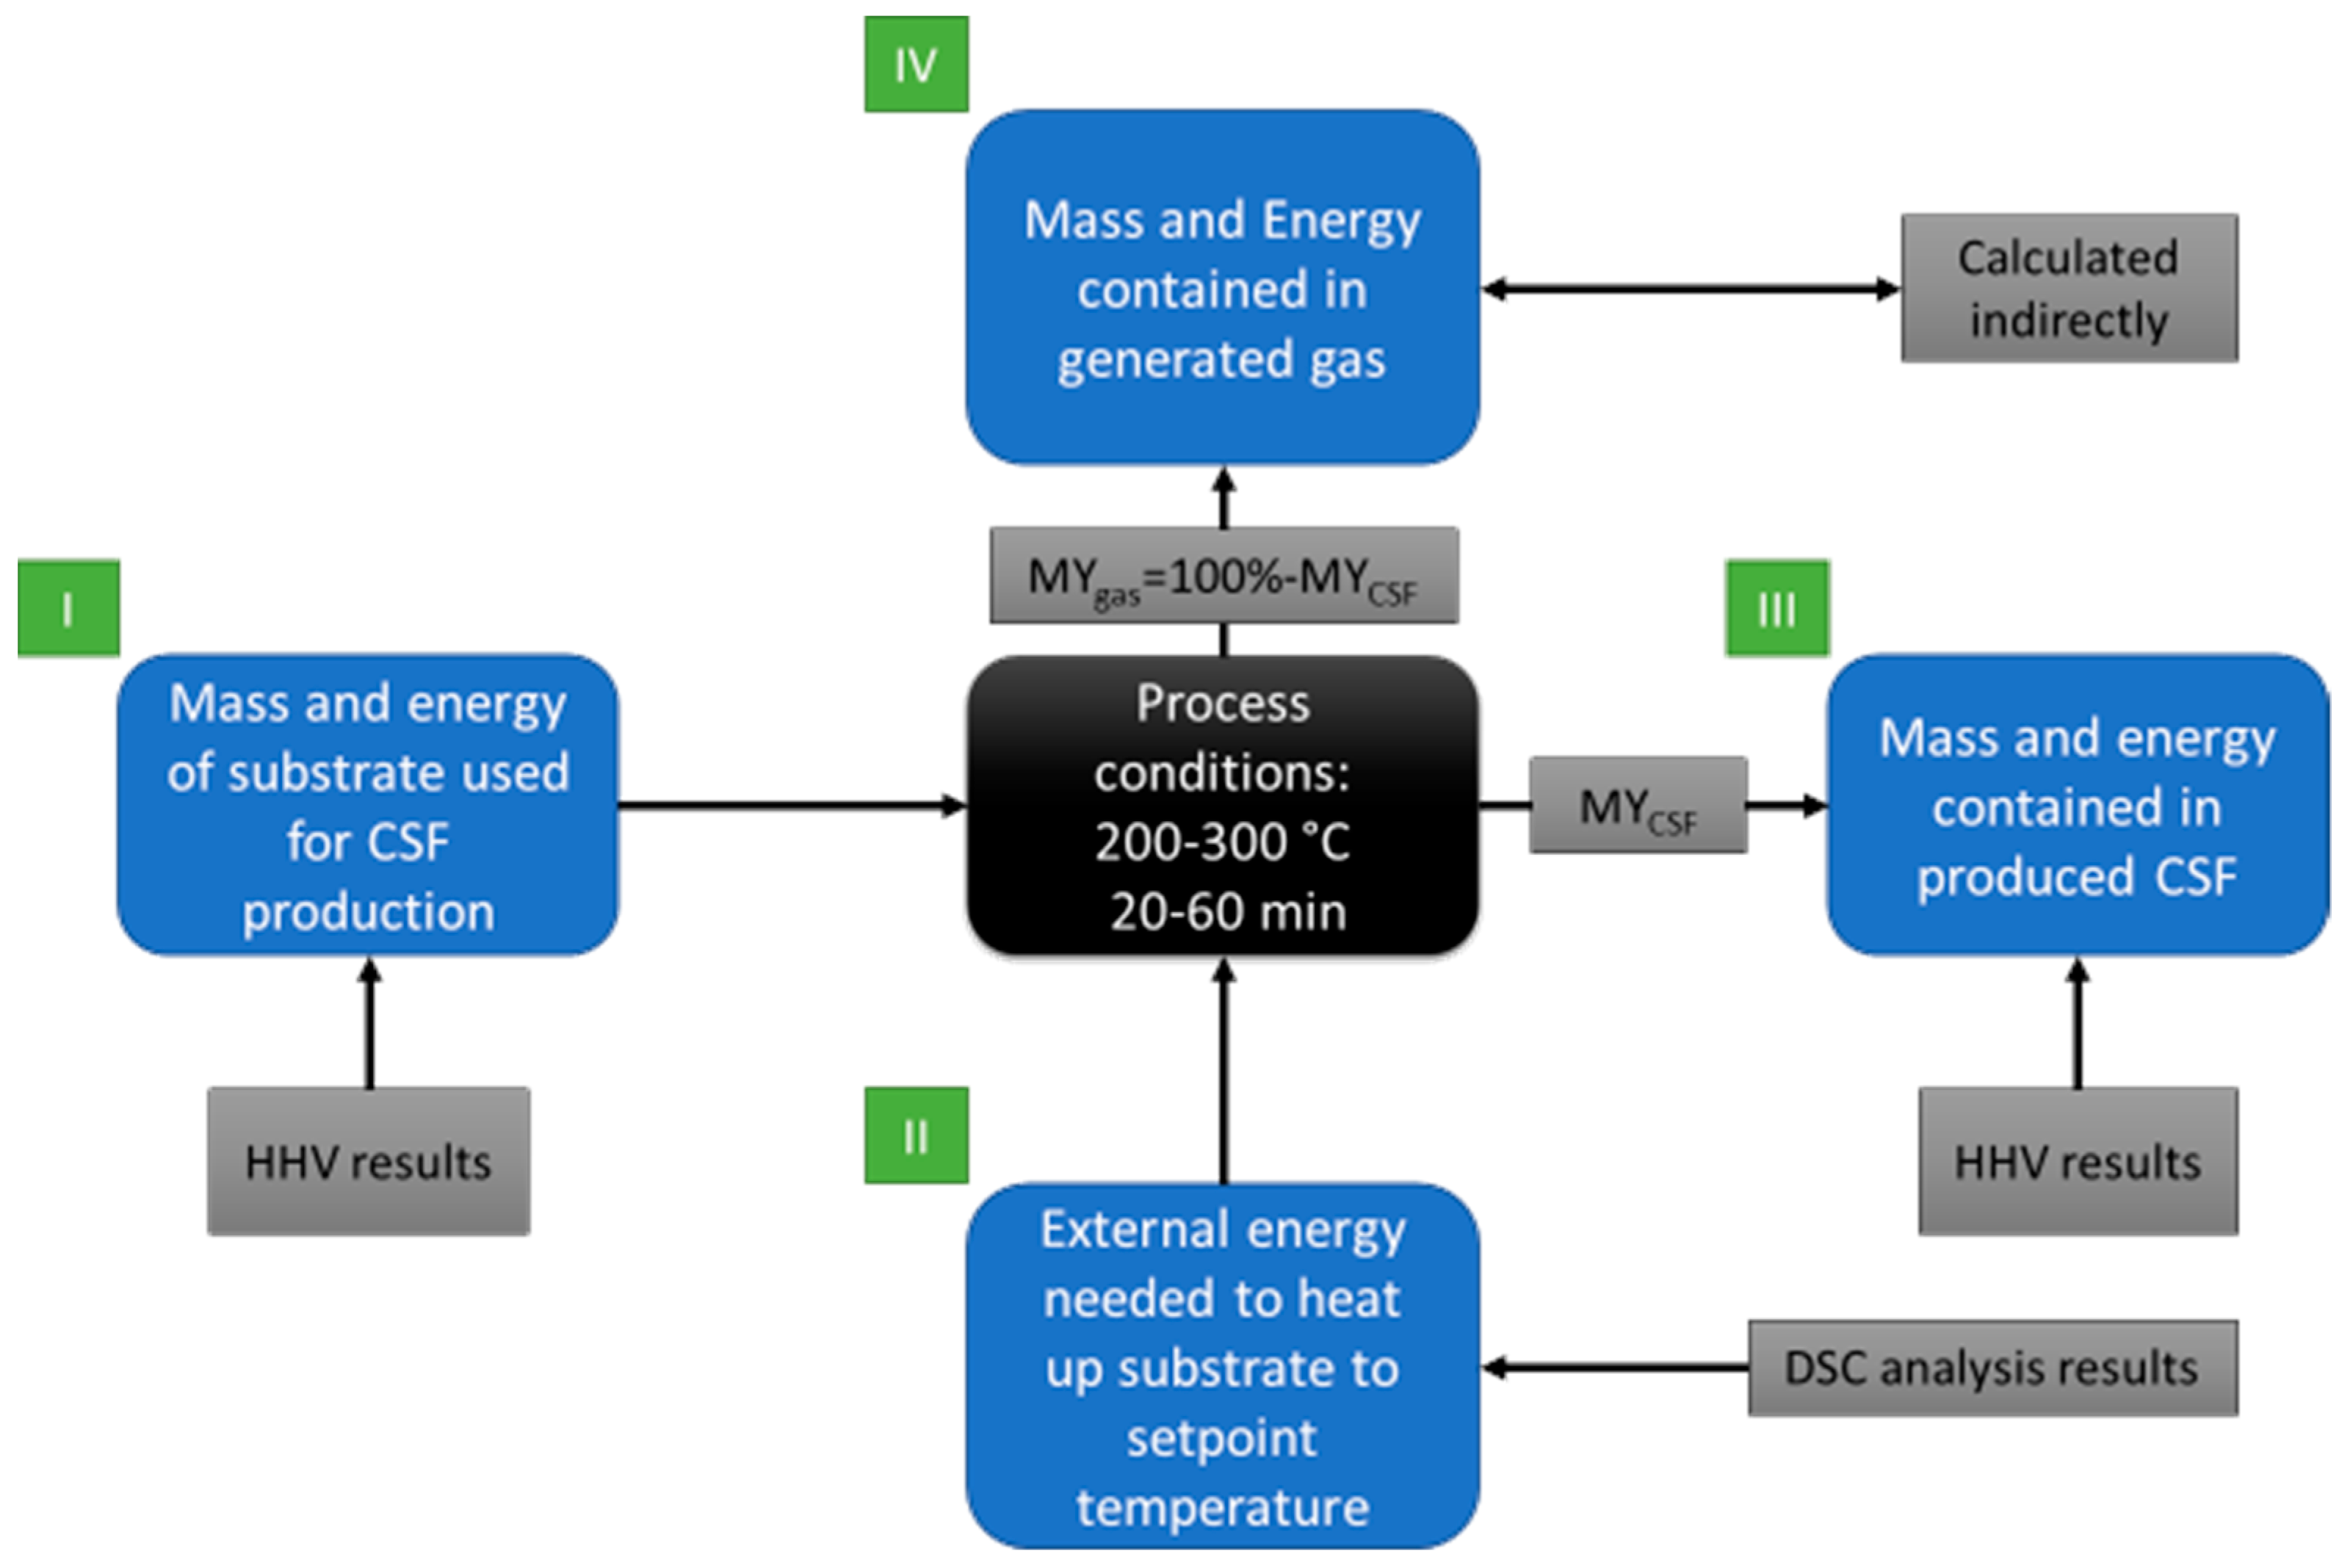
2.2.5. Theoretical Mass and Energy Balance of the Torrefaction Process
- Mass of substrate used to produce 1 g of CSF;
- Energy contained in the raw material used to produce 1 g of CSF;
- External energy provided to the reactor to heat the proper amount of substrate to setup temperature, to produce 1 g of CSF;
- Energy contained in 1 g of CSF;
- Mass of gas generated during the production of 1 g of CSF;
- Energy contained in gas after production of 1 g of CSF.
- Moisture content in substrate = 0%;
- External energy is used to provide heat for the process;
- No heat losses of the reactor;
- The energy contained in the gas is a sum of chemical energy related to the chemical composition of gas and heat; here it was assumed that CSF is cooled down after the process, and all heat goes to gas.
3. Results and Discussion
3.1. Torrefaction Process—CSF Production
3.2. Proximate Analysis and HHV Results
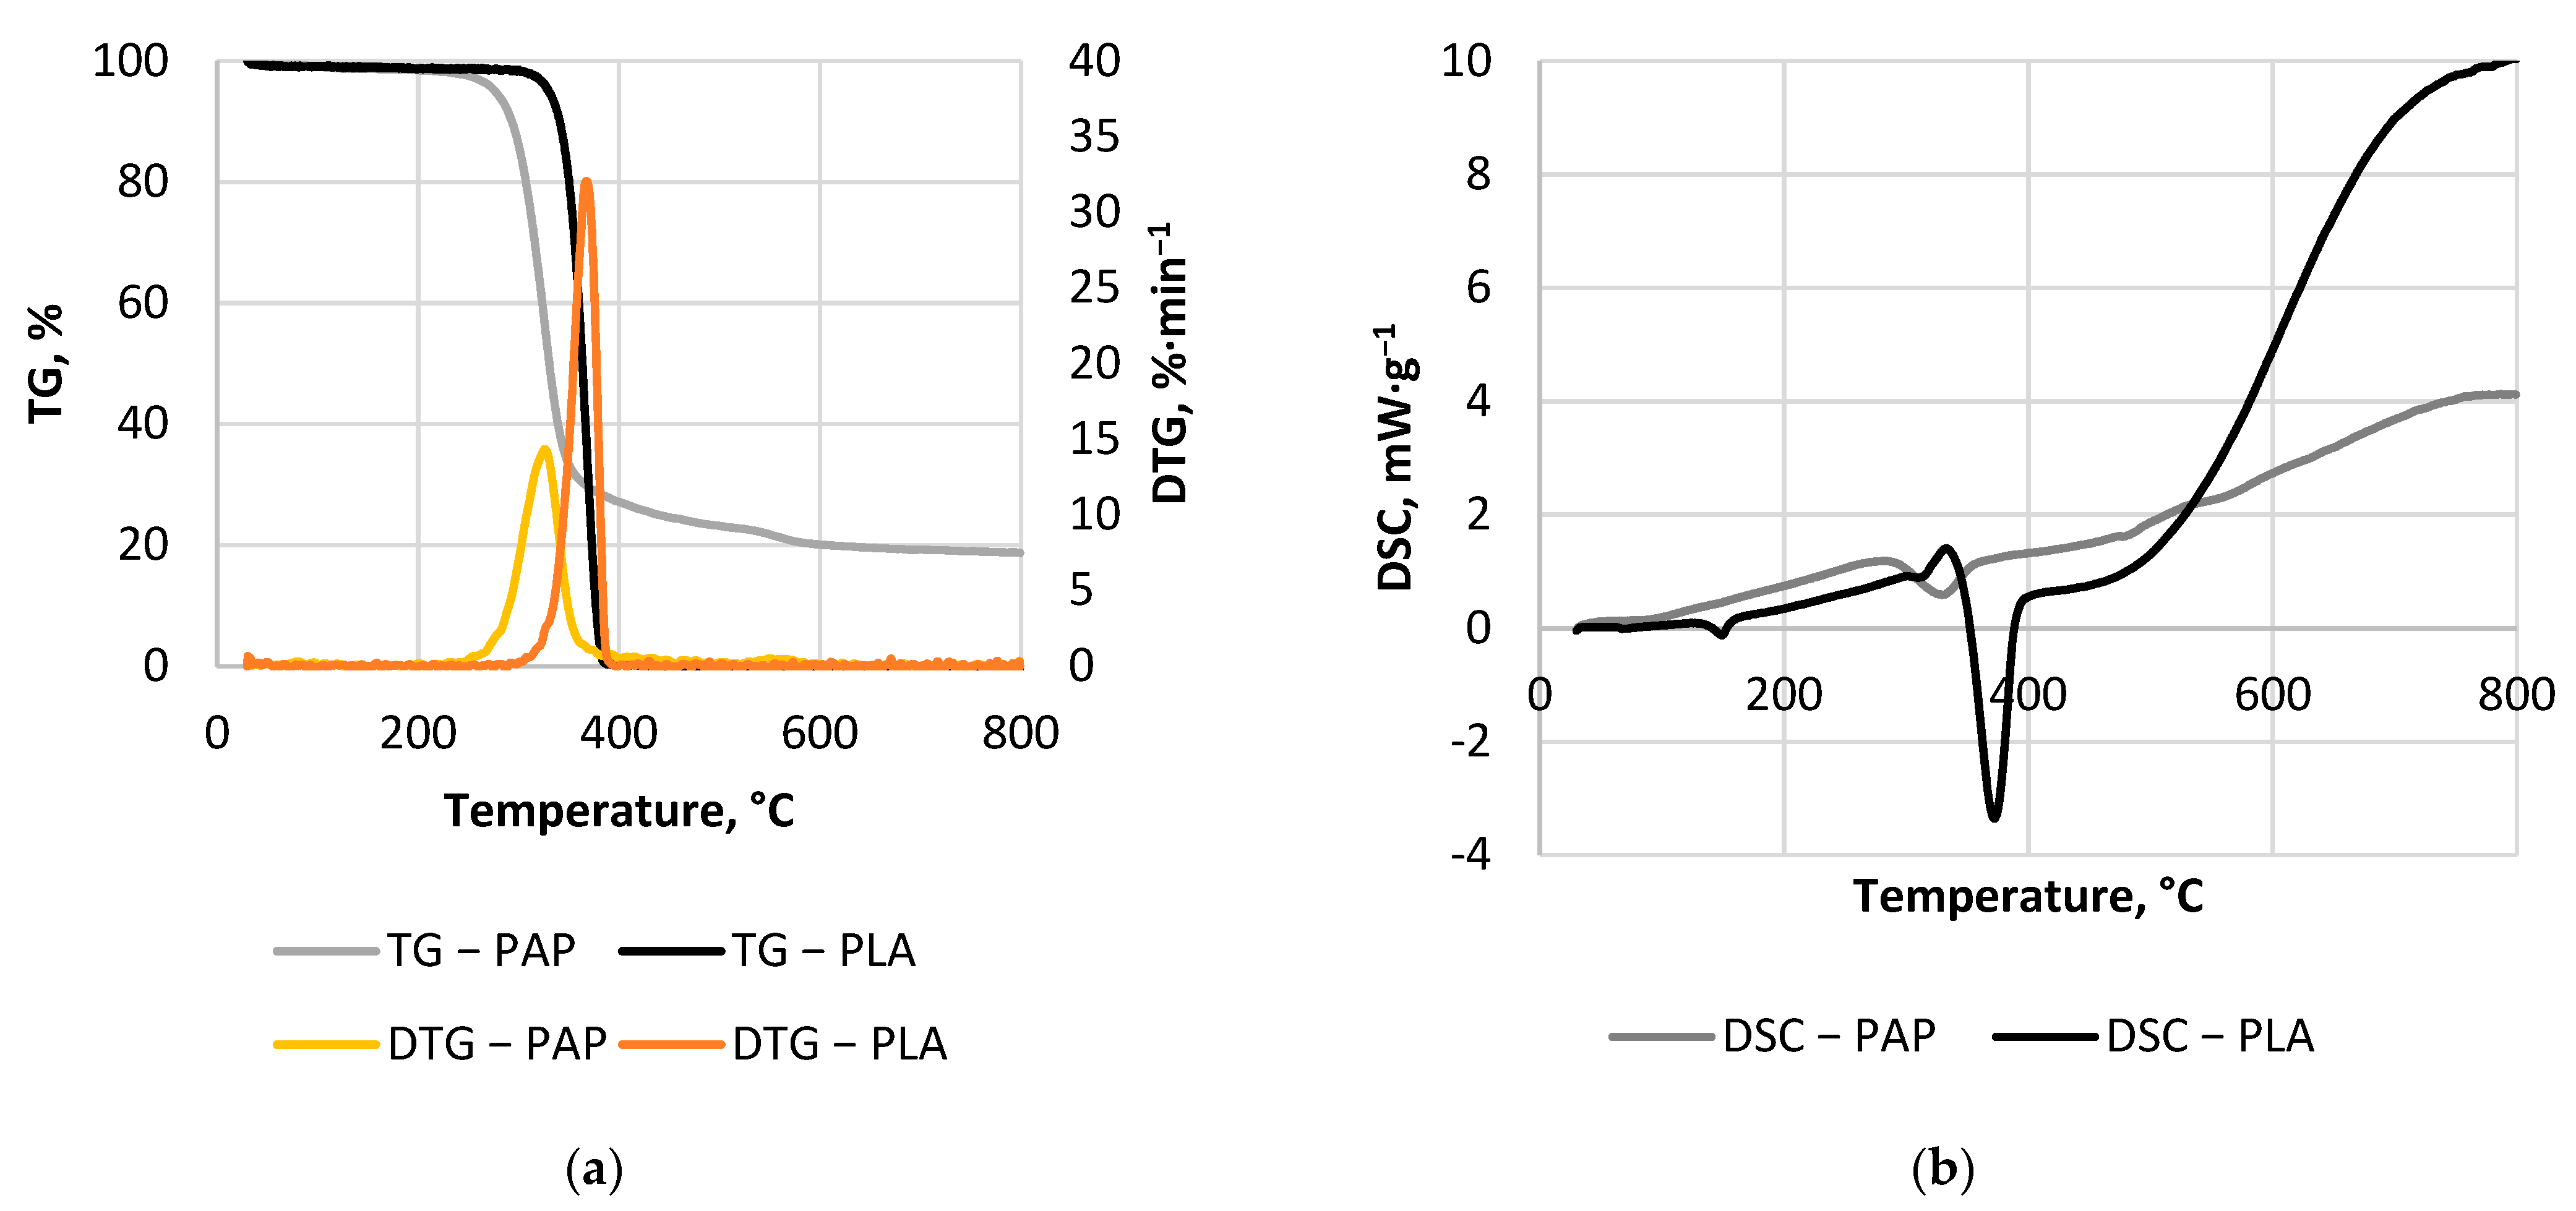
3.3. Thermal Analysis Results
3.4. Theoretical Mass and Energy Balance of the Torrefaction Process
4. Summary
Supplementary Materials
Author Contributions
Funding
Institutional Review Board Statement
Informed Consent Statement
Data Availability Statement
Acknowledgments
Conflicts of Interest
Glossary
| PLA | polylactic acid |
| PAP | paper |
| CSF | carbonized solid fuel |
| EU | European Union |
| HD-PE | high-density polyethylene |
| PET | polyethylene terephthalate |
| LD-PE | low-density polyethylene |
| RDF | refuse-derived fuel |
| MSW | municipal solid waste |
| SRF | solid recovered fuel |
| MBT | mechanical-biological treatment plant for waste |
| PP | Polypropylene |
| PE | Polyethylene |
| PS | Polystyrene |
| HHV | higher heating value |
| TGA | thermogravimetric analysis |
| DSC | differential scanning calorimetry analysis |
| MY | mass yield |
| EDr | energy densification ratio |
| EY | energy yield |
| MC | moisture content |
| VM | volatile matter |
| AC | ash content |
| VS | volatile solids content |
| CP | combustible part content |
| R2 | determination coefficient |
| AIC | Akaike value |
| an | regression coefficients, |
| DTG | differential thermogravimetry |
| CR | Coats–Redfern method |
| Ea | activation energy |
| A | pre-exponential factor |
| n | order of reaction |
| Sp | specific heat value |
Appendix A


| Material | Equation | R2 |
|---|---|---|
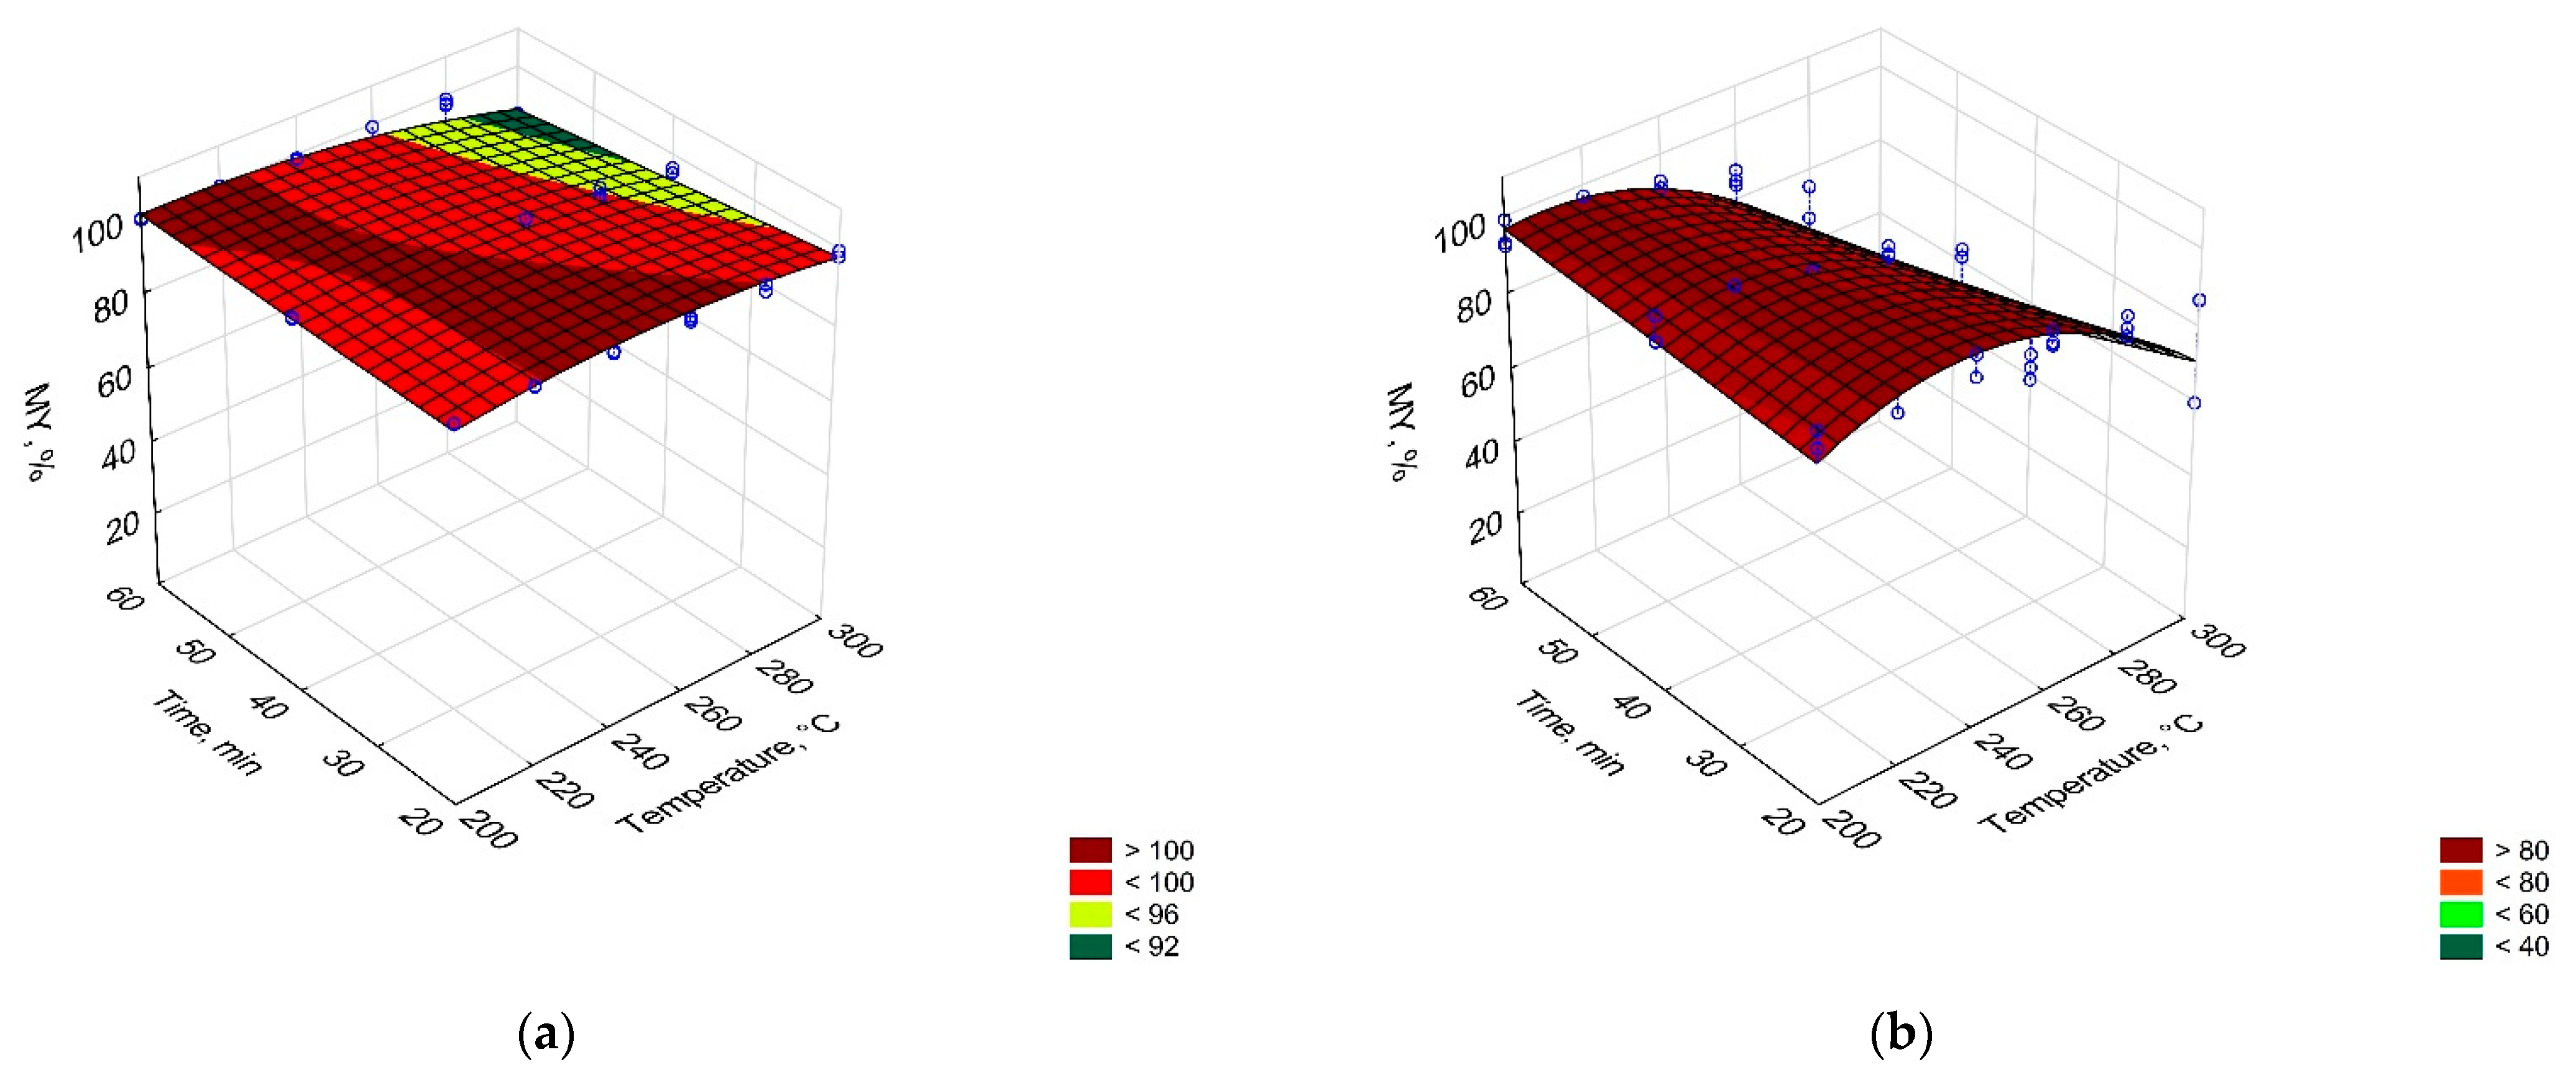
| PLA | MY(T,t), % = 0.759 × T − 0.00139 × T2 + 0.678 × t − 0.00303 × T × t | 0.55 |
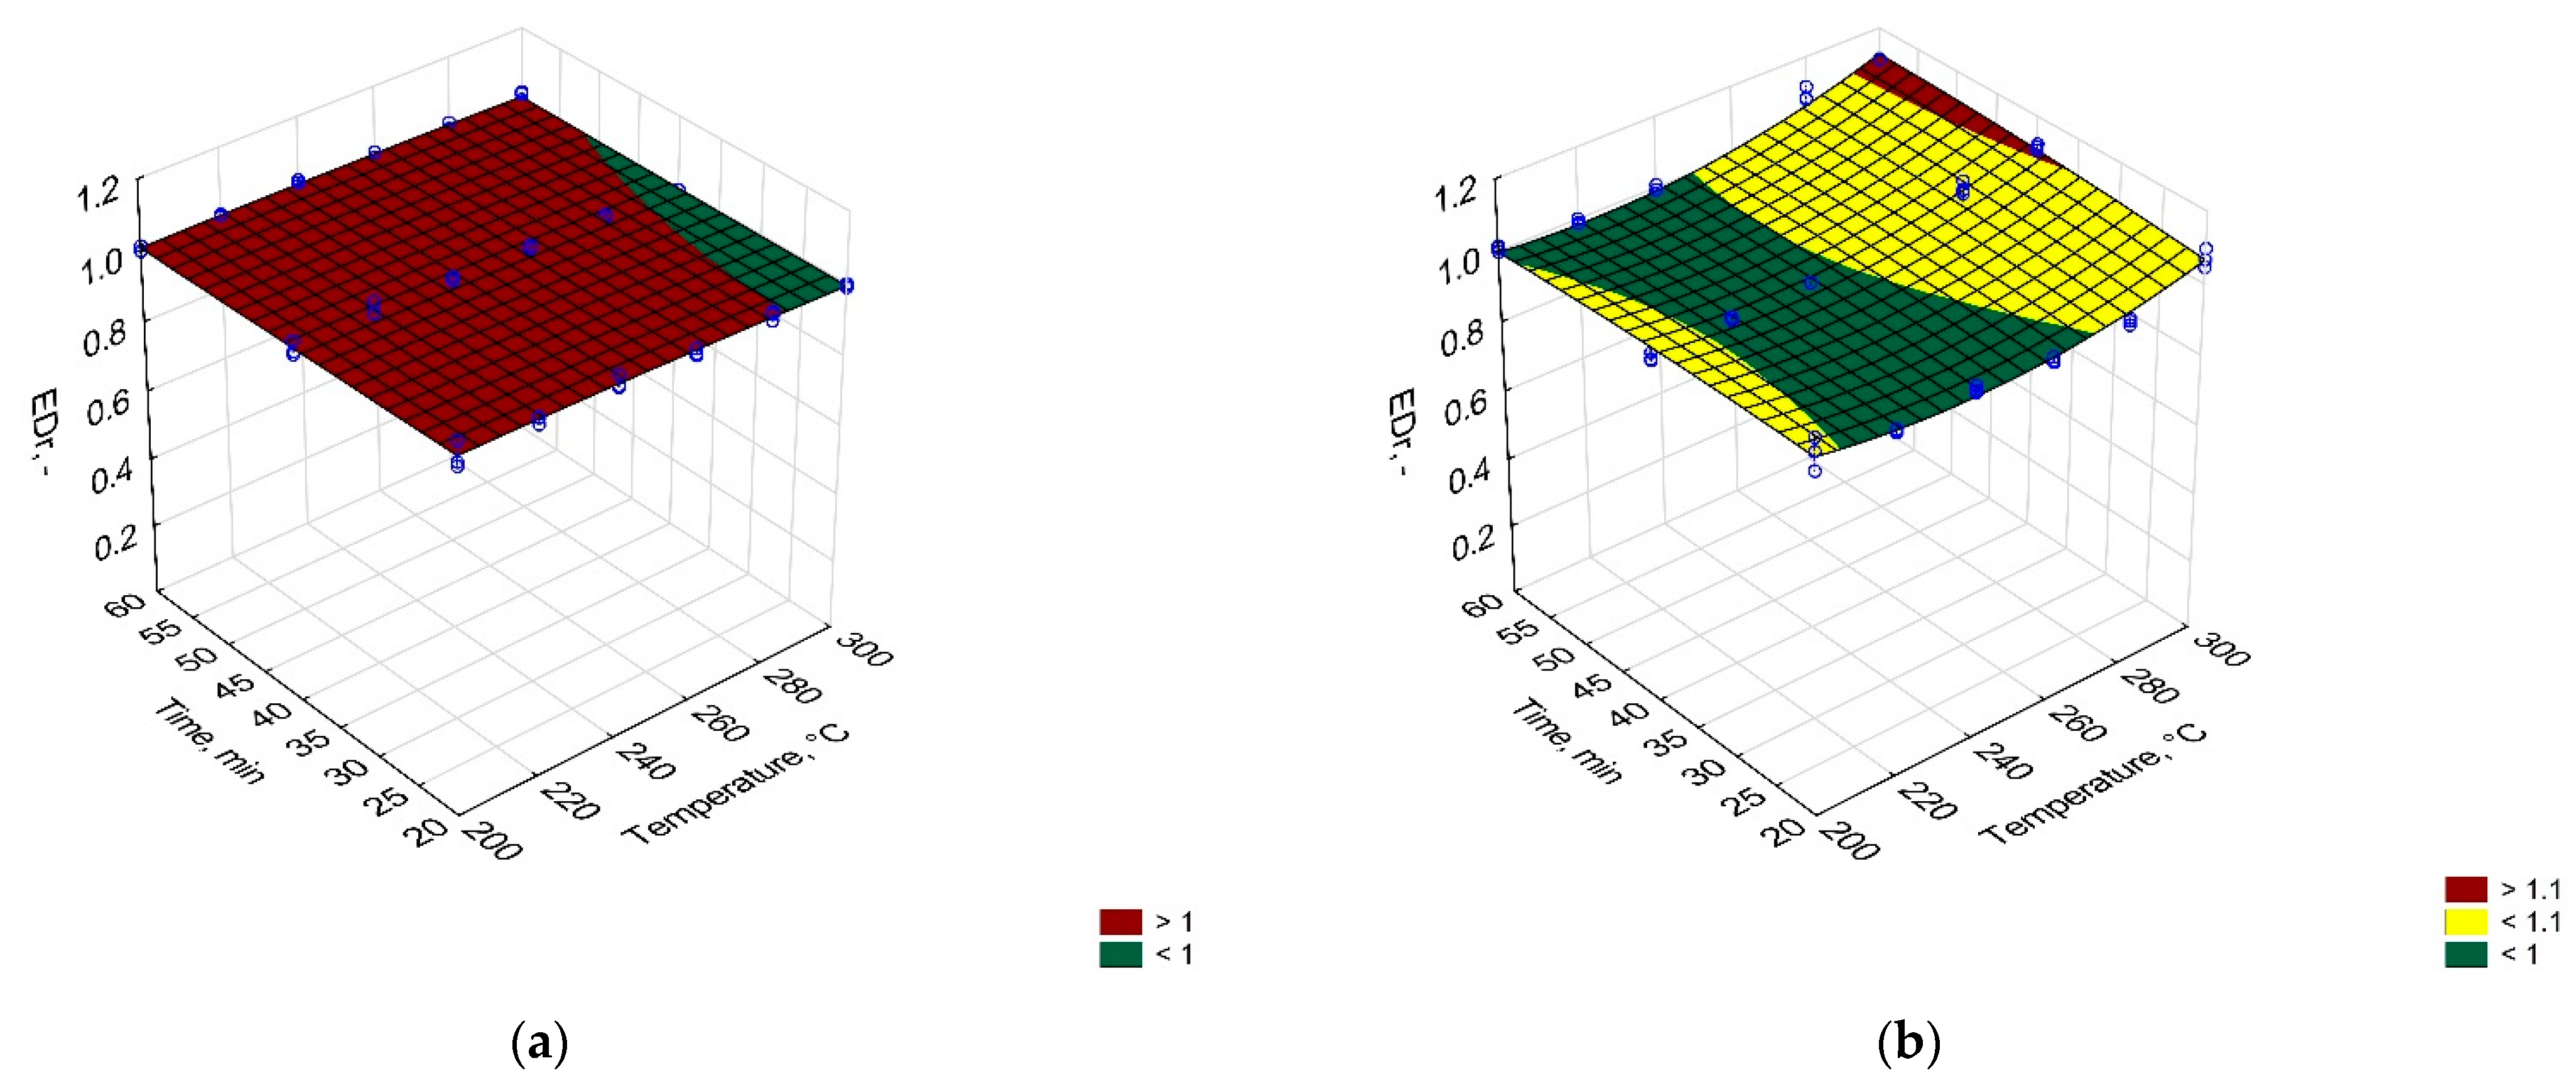
| EDr(T,t), % = 0.975 + 0.000545 × T − 0.00000160 × T2 − 0.00101 × t + 0.00000220 × t2 + 0.00000340 × T × t | 0.13 | |
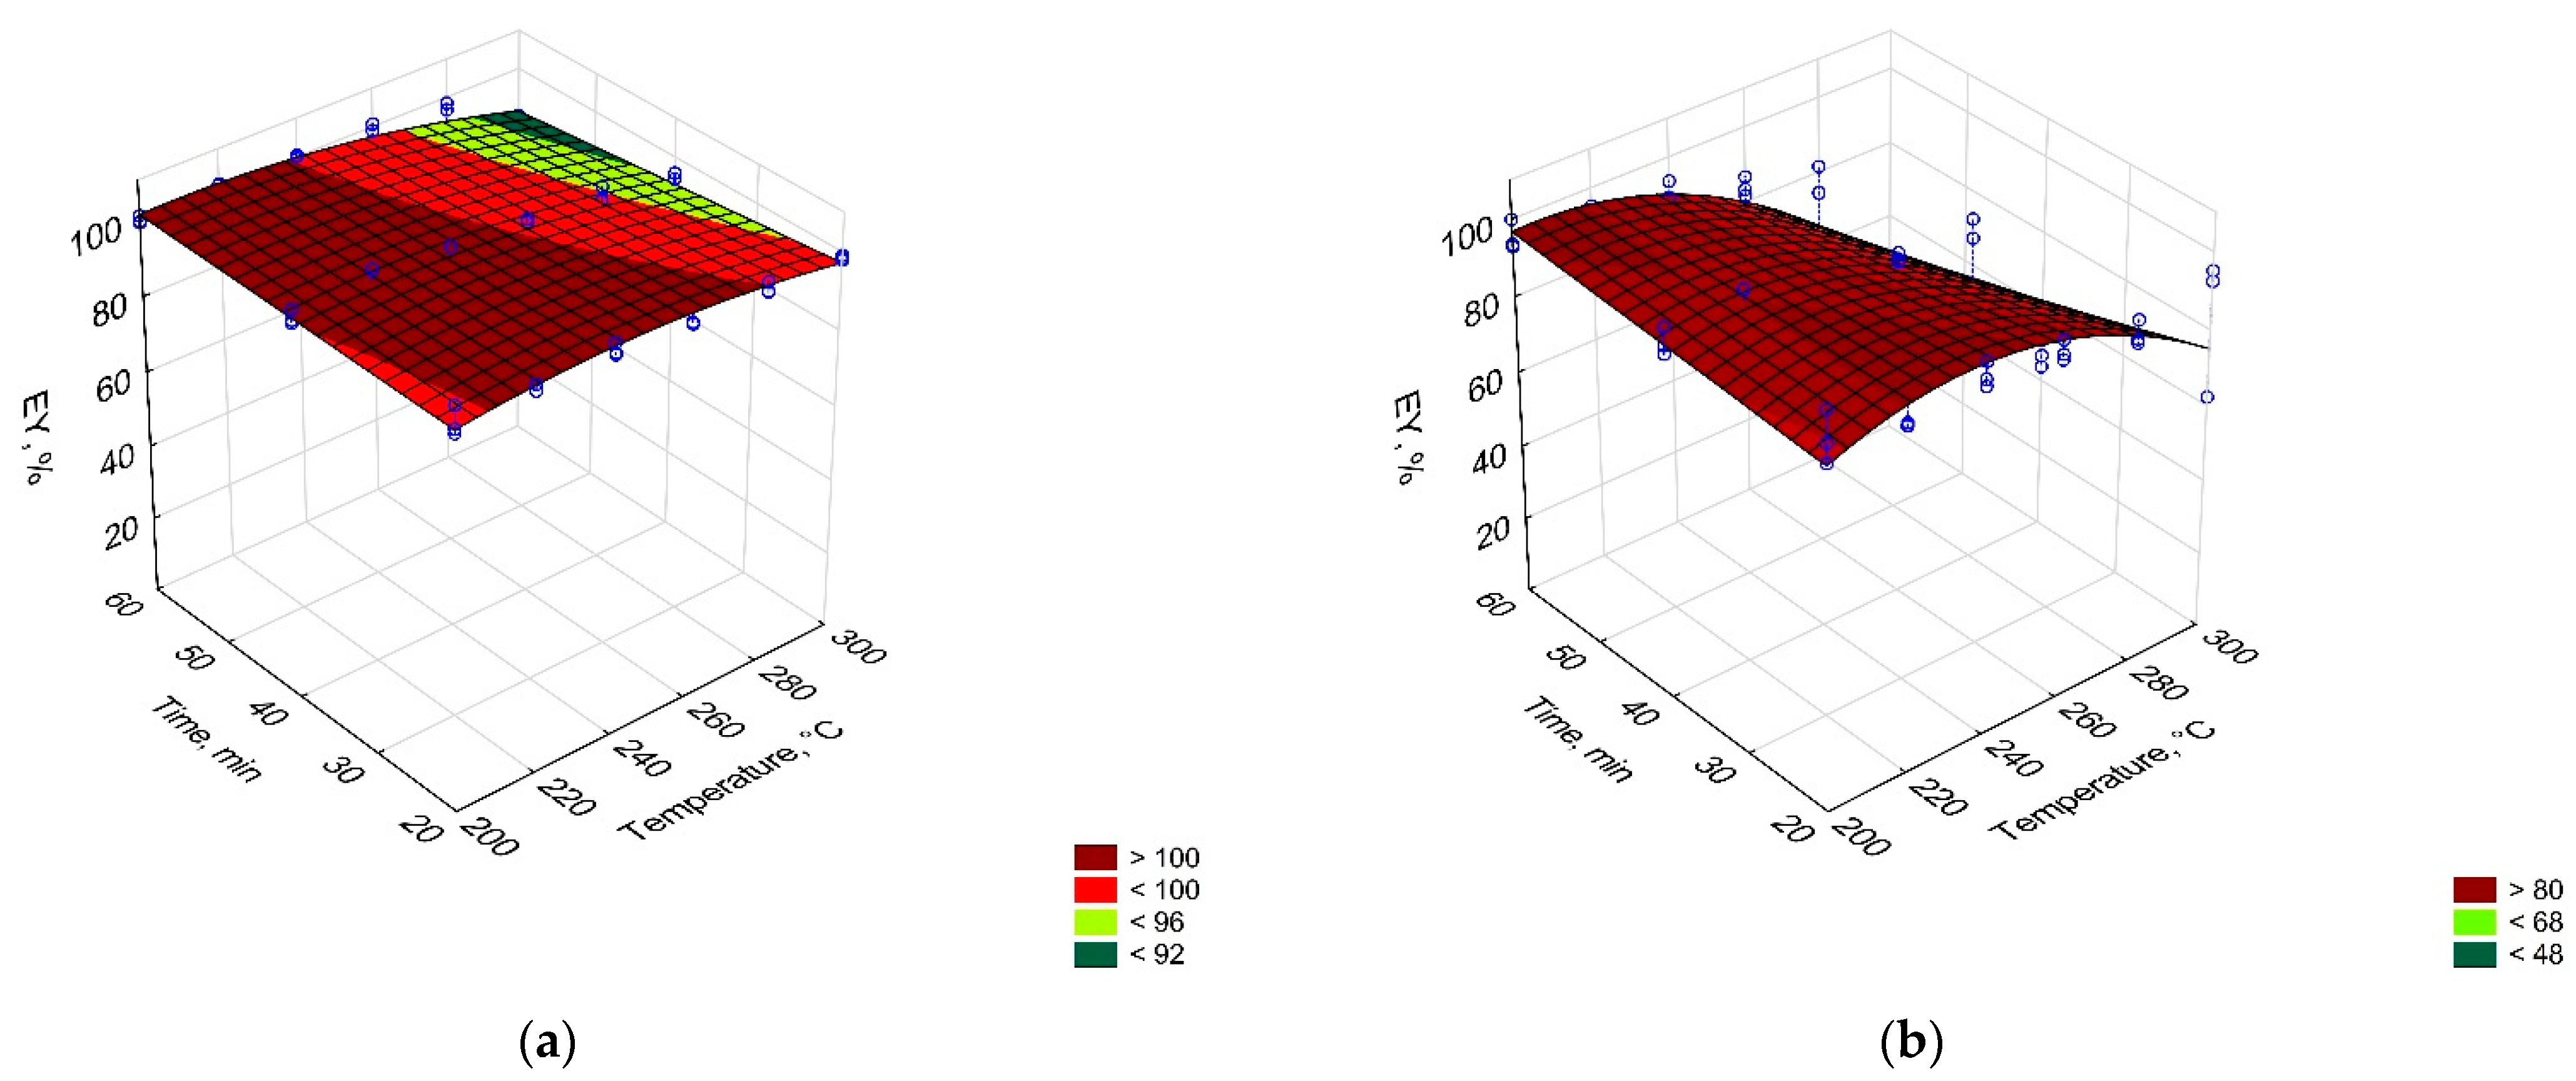
| EY(T,t), % = 0.792 × T − 0.00151 × T2 + 0.596 × t − 0.00270 × T × t | 0.58 | |
| VM, % = 100 | 1.00 | |
| FC, % = 0 | 1.00 | |
| AC, % = 0 | 1.00 | |
| VS, % = 100 | 1.00 | |
| CP, % = 100 | 1.00 | |
| HHV, J·g−1 = 19549 ± 140 | 1.00 | |
| PAP | MY(T,t), % = − 340.901 + 3.558 × T − 0.00712 × T2 + 2.079 × t − 0.00952 × T × t | 0.86 |
| EDr(T,t), % = 2.404 − 0.0119 × T + 0.0000243 × T2 − 0.00189 × t − 0.0000268 × t2 + 0.0000184 × T x t | 0.77 | |
| EY(T,t), % = − 260.469 + 2.876 × T − 0.00570 × T2 + 1.946 × t − 0.00889 × T × t | 0.78 | |
| VM(T,t), % = -153.308 + 2.021 × T − 0.00418 × T2 +0.899 × t − 0.00421 × T × t | 0.92 | |
| FC(T,t), % = 184.153 − 1.583 × T + 0.00336 × T2 − 0.00609 × t2 + 0.00245 × T × t | 0.90 | |
| AC(T,t), % = 53.879 − 0.409 × T + 0.000815 × T2 − 0.232 × t + 0.00105 × T × t | 0.94 | |
| VS, % = 47.732 + 0.396 × T − 0.000790 × T2 + 0.239 × t − 0.00109 × T × t | 0.94 | |
| CP(T,t), % = 46.120 + 0.409 × T − 0.000815 × T2 + 0.232 × t − 0.00105 × T × t | 0.94 | |
| HHV(T,t), J·g−1 = 39,926.103 − 198.210 × T + 0.425 × T2 + 0.0447 × T × t | 0.77 |
References
- Narancic, T.; O’Connor, K.E. Plastic waste as a global challenge: Are biodegradable plastics the answer to the plastic waste problem? Microbiology 2019, 165, 129–137. [Google Scholar] [CrossRef] [PubMed]
- North, E.J.; Halden, R.U. Plastics and environmental health: The road ahead. Rev. Environ. Health 2013, 28, 1–8. [Google Scholar] [CrossRef]
- Jambeck, J.R.; Geyer, R.; Wilcox, C.; Siegler, T.R.; Perryman, M.; Andrady, A.; Narayan, R.; Lavender Law, K. Plastic waste inputs from land into the ocean. Science 2015, 347, 768–771. [Google Scholar] [CrossRef]
- Katyal, D.; Kong, E.; Villanueva, J. Microplastics in the environment: Impact on human health and future mitigation strategies. Environ. Health Rev. 2020, 63, 27–31. [Google Scholar] [CrossRef] [Green Version]
- Geyer, R.; Jambeck, J.R.; Law, K.L. Production, use, and fate of all plastics ever made. Sci. Adv. 2017, 3, e1700782. [Google Scholar] [CrossRef] [Green Version]
- PlascticsEurope. Plastics—The Facts 2020 An analysis of European Plastics Production, Demand and Waste Data. 2020. Available online: https://plasticseurope.org/knowledge-hub/plastics-the-facts-2020/ (accessed on 15 November 2021).
- Qureshi, M.S.; Oasmaa, A.; Pihkola, H.; Deviatkin, I.; Tenhunen, A.; Mannila, J.; Minkkinena, H.; Pohjakallioc, M.; Laine-Ylijokid, J. Pyrolysis of plastic waste: Opportunities and challenges. J. Anal. Appl. Pyrolysis 2020, 152, 104804. [Google Scholar] [CrossRef]
- Rujnić-Sokele, M.; Pilipović, A. Challenges and opportunities of biodegradable plastics: A mini review. Waste Manag. Res. 2017, 35, 132–140. [Google Scholar] [CrossRef] [PubMed]
- Conversio Market & Strategy. Global Plastic Flow 2018. 2020. Available online: https://www.carboliq.com/pdf/19_conversio_global_plastics_flow_2018_summary.pdf (accessed on 15 November 2021).
- Ellen Macarthur Foundation. The New Plastics Economy: Rethinking the Future of Plastics & Catalysing Action. 2017. Available online: https://ellenmacarthurfoundation.org/the-new-plastics-economy-rethinking-the-future-of-plastics-and-catalysing (accessed on 15 November 2021).
- Dilkes-Hoffman, L.S.; Pratt, S.; Lant, P.A.; Laycock, B. The role of biodegradable plastic in solving plastic solid waste accumulation. In Plastics to Energy: Fuel, Chemicals, and Sustainability Implications; Elsevier: Amsterdam, The Netherlands, 2018; pp. 469–505. [Google Scholar] [CrossRef]
- European Bioplastic Conference. Bioplastics Market Development 2020. 2020. Available online: https://docs.european-bioplastics.org/conference/Report_Bioplastics_Market_Data_2020_short_version.pdf (accessed on 15 November 2021).
- European Environment Agency. Bio-Waste in Europe-Turning Challenges into Opportunities; Van der Linden, A., Almut, R., Eds.; European Environment Agency: Copenhagen, Denmark, 2020. [CrossRef]
- Singh, N.; Hui, D.; Singh, R.; Ahuja, I.P.S.; Feo, L.; Fraternali, F. Recycling of plastic solid waste: A state of art review and future applications. Compos. Part B Eng. 2017, 115, 409–422. [Google Scholar] [CrossRef]
- Eriksson, O.; Finnveden, G. Plastic waste as a fuel—CO2-neutral or not? Energy Environ. Sci. 2009, 2, 907–914. [Google Scholar] [CrossRef]
- Boumanchar, I.; Chhiti, Y.; M’hamdi Alaoui, F.E.; Sahibed-dine, A.; Bentiss, F.; Jama, C.; Bensitel, M. Municipal solid waste higher heating value prediction from ultimate analysis using multiple regression and genetic programming techniques. Waste Manag. Res. 2019, 37, 578–589. [Google Scholar] [CrossRef] [Green Version]
- Dianda, P.; Mahidin, M.; Munawar, E. Production and characterization refuse derived fuel (RDF) from high organic and moisture contents of municipal solid waste (MSW). In IOP Conference Series: Materials Science and Engineering; Institute of Physics Publishing: Banda Aceh, Indonesia, 2018; Volume 334. [Google Scholar] [CrossRef]
- Gug, J.I.; Cacciola, D.; Sobkowicz, M.J. Processing and properties of a solid energy fuel from municipal solid waste (MSW) and recycled plastics. Waste Manag. 2015, 35, 283–292. [Google Scholar] [CrossRef] [PubMed]
- Świechowski, K.; Stępień, P.; Syguła, E.; Koziel, J.; Białowiec, A. Lab-Scale Study of Temperature and Duration Effects on Carbonized Solid Fuels Properties Produced from Municipal Solid Waste Components. Materials 2021, 14, 1191. [Google Scholar] [CrossRef] [PubMed]
- Wielgosiński, G. Thermal Waste Conversion. Racibórz: Nowa Energia. 2020. Available online: https://nowa-energia.com.pl/wydawnictwa-ksiazkowe/ (accessed on 15 November 2021).
- Caputo, A.C.; Pelagagge, P.M. RDF production plants: I Design and costs. Appl. Therm. Eng. 2002, 22, 423–437. [Google Scholar] [CrossRef]
- Nobre, C.; Vilarinho, C.; Alves, O.; Mendes, B.; Gonçalves, M. Upgrading of refuse derived fuel through torrefaction and carbonization: Evaluation of RDF char fuel properties. Energy 2019, 181, 66–76. [Google Scholar] [CrossRef]
- Syguła, E.; Świechowski, K.; Stępień, P.; Koziel, J.A.; Białowiec, A. The Prediction of Calorific Value of Carbonized Solid Fuel Produced from Refuse-Derived Fuel in the Low-Temperature Pyrolysis in CO2. Materials 2020, 14, 49. [Google Scholar] [CrossRef]
- Syguła, E.; Świechowski, K.; Hejna, M.; Kunaszyk, I.; Białowiec, A. Municipal Solid Waste Thermal Analysis—Pyrolysis Kinetics and Decomposition Reactions. Energies 2021, 14, 4510. [Google Scholar] [CrossRef]
- Miranda, T.; Nogales, S.; Román, S.; Montero, I.; Arranz, J.I.; Sepúlveda, F.J. Control of several emissions during olive pomace thermal degradation. Int. J. Mol. Sci. 2014, 15, 18349–18361. [Google Scholar] [CrossRef] [Green Version]
- Abd-Elghany, M.; Klapötke, T.M. A review on differential scanning calorimetry technique and its importance in the field of energetic materials. Phys. Sci. Rev. 2018, 3, 103. [Google Scholar] [CrossRef]
- Mansa, R.; Zou, S. Thermogravimetric analysis of microplastics: A mini review. Environ. Adv. 2021, 5, 100117. [Google Scholar] [CrossRef]
- PN-EN 14346:2011 Standard. Waste Characteristics. Calculation of Dry Mass on the Basis of Dry Residue or Water Content. Available online: https://sklep.pkn.pl/pn-en-14346-2011p.html (accessed on 15 November 2021).
- Torquato, L.D.M.; Crnkovic, P.M.; Ribeiro, C.A.; Crespi, M.S. New approach for proximate analysis by thermogravimetry using CO2 atmosphere: Validation and application to different biomasses. J. Therm. Anal. Calorim. 2017, 128, 1–14. [Google Scholar] [CrossRef] [Green Version]
- PN-Z-15008-04:1993 Standard. Municipal Solid Waste. Analysis of Combustible and Non-Combustible Content. Available online: https://sklep.pkn.pl/pn-z-15008-04-1993p.html (accessed on 15 November 2021).
- PN-EN 15169:2011 Standard. Waste Characteristics. Determination of Organic Matter Content for Waste, Slurry and Sludge. Available online: https://sklep.pkn.pl/pn-en-15169-2011p.html (accessed on 15 November 2021).
- PN EN ISO 18125:2017-07 Solid Biofuels—Determination of Calorific Value. Available online: https://sklep.pkn.pl/pn-en-iso-18125-2017-07p.html (accessed on 15 November 2021).
- Poudel, J.; Karki, S.; Oh, S.C. Valorization of waste wood as a solid fuel by torrefaction. Energies 2018, 11, 1641. [Google Scholar] [CrossRef] [Green Version]
- Dyjakon, A.; Noszczyk, T. Alternative fuels from forestry biomass residue: Torrefaction process of horse chestnuts, oak acorns, and spruce cones. Energies 2020, 13, 2468. [Google Scholar] [CrossRef]
- Chen, D.; Gao, A.; Cen, K.; Zhang, J.; Cao, X.; Ma, Z. Investigation of biomass torrefaction based on three major components: Hemicellulose, cellulose, and lignin. Energy Convers. Manag. 2018, 169, 228–237. [Google Scholar] [CrossRef]
- Tumuluru, J.S.; Sokhansanj, S.; Hess, J.R.; Wright, T.C.; Boardman, R.D. A review on biomass torrefaction process and product properties for energy applications. Ind. Biotechnol. 2011, 7, 384–401. [Google Scholar] [CrossRef] [Green Version]
- Camacho-Muñoz, R.; Villada-Castillo, H.S.; Solanilla-Duque, J.F. Anaerobic biodegradation under slurry thermophilic conditions of poly(lactic acid)/starch blend compatibilized by maleic anhydride. Int. J. Biol. Macromol. 2020, 163, 1859–1865. [Google Scholar] [CrossRef]
- Jing, J.; Zhang, Y.; Tang, X.; Fang, Z. Synthesis of a highly efficient phosphorus-containing flame retardant utilizing plant-derived diphenolic acids and its application in polylactic acid. RSC Adv. 2016, 6, 49019–49027. [Google Scholar] [CrossRef]
- Caillat, S.; Vakkilainen, E. Large-scale biomass combustion plants: An overview. In Biomass Combustion Science, Technology and Engineering; Woodhead Publishing Limited: Sawston, UK, 2013; pp. 189–224. [Google Scholar] [CrossRef]
- Elyounssi, K.; Blin, J.; Halim, M. High-yield charcoal production by two-step pyrolysis. J. Anal. Appl. Pyrolysis 2010, 87, 138–143. [Google Scholar] [CrossRef]
- Narzari, R.; Borkotoki, B. Chapter 2-Biochar: An Overview on its Production, Properties and Potential Benefits. In Biology, Biotechnology and Sustainable Development; Research India Publications: Delhi, India, 2015. [Google Scholar]
- Tong, S.; Xiao, L.; Li, X.; Zhu, X.; Liu, H.; Luo, G.; Worasuwannarak, N.; Kerdsuwan, S.; Fungtammasan, B.; Yao, H. A gas-pressurized torrefaction method for biomass wastes. Energy Convers. Manag. 2018, 173, 29–36. [Google Scholar] [CrossRef]
- Ramos-Carmona, S.; Pérez, J.F.; Pelaez-Samaniego, M.R.; Barrera, R.; Garcia-Perez, M. Effect of torrefaction temperature on properties of patula pine. Maderas: Cienc. Y Tecnol. 2017, 19, 39–50. [Google Scholar] [CrossRef] [Green Version]
- Yi, L.; Feng, J.; Qin, Y.H.; Li, W.Y. Prediction of elemental composition of coal using proximate analysis. Fuel 2017, 193, 315–321. [Google Scholar] [CrossRef]
- Zhou, H.; Meng, A.; Long, Y.; Li, Q.; Zhang, Y. An overview of characteristics of municipal solid waste fuel in China: Physical, chemical composition and heating value. Renew. Sustain. Energy Rev. 2014, 36, 107–122. [Google Scholar] [CrossRef]
- Słupska, M.; Dyjakon, A.; Stopa, R. Determination of strength properties of energy plants on the example of miscanthus-giganteus, rosa multiflora and salix viminalis. Energies 2019, 12, 3660. [Google Scholar] [CrossRef] [Green Version]
- Parikh, J.; Channiwala, S.A.; Ghosal, G.K. A correlation for calculating HHV from proximate analysis of solid fuels. Fuel 2005, 84, 487–494. [Google Scholar] [CrossRef]
- Backes, E.H.; Pires, L.d.N.; Costa, L.C.; Passador, F.R.; Pessan, L.A. Analysis of the degradation during melt processing of pla/biosilicate® Composites. J. Compos. Sci. 2019, 3, 52. [Google Scholar] [CrossRef] [Green Version]
- Sousa, S.; Costa, A.; Silva, A.; Simões, R. Poly(lactic acid)/Cellulose films produced from composite spheres prepared by emulsion-solvent evaporation method. Polymers 2019, 11, 66. [Google Scholar] [CrossRef] [PubMed] [Green Version]
- Byadgi, S.A.; Kalburgi, P.B. Production of Bioethanol from Waste Newspaper. Procedia Environ. Sci. 2016, 35, 555–562. [Google Scholar] [CrossRef]
- Van der Stelt, M.J.C. Chemistry and Reaction Kinetics of Biowaste Torrefaction; Technische Universiteit Eindhoven: Eindhoven, The Netherlands, 2011. [Google Scholar]
- Porshnov, D.; Ozols, V.; Ansone-Bertina, L.; Burlakovs, J.; Klavins, M. Thermal decomposition study of major refuse derived fuel components. Energy Procedia 2018, 147, 48–53. [Google Scholar] [CrossRef]
- Yang, H.; Yan, R.; Chen, H.; Lee, D.H.; Zheng, C. Characteristics of hemicellulose, cellulose and lignin pyrolysis. Fuel 2007, 86, 1781–1788. [Google Scholar] [CrossRef]
- Noszczyk, T.; Dyjakon, A.; Koziel, J.A. Kinetic parameters of nut shells pyrolysis. Energies 2021, 14, 682. [Google Scholar] [CrossRef]
- Lavrykov, S.A.; Ramarao, B.V. Thermal Properties of Copy Paper Sheets. Dry. Technol. 2012, 30, 297–311. [Google Scholar] [CrossRef]
- Zmeskal, O.; Marackova, L.; Lapcikova, T.; Mencik, P.; Prikryl, R. Thermal properties of samples prepared from polylactic acid by 3D printing. AIP Conf. Proc. 2020, 2305, 020022. [Google Scholar] [CrossRef]
- Water-Heat of Vaporization Online Water Heat of Vaporization Calculator. Available online: https://www.engineeringtoolbox.com/water-properties-d_1573.html (accessed on 15 November 2021).
- Świechowski, K.; Syguła, E.; Koziel, J.A.; Stępień, P.; Kugler, S.; Manczarski, P.; Białowiec, A. Low-Temperature Pyrolysis of Municipal Solid Waste Components and Refuse-Derived Fuel—Process Efficiency and Fuel Properties of Carbonized Solid Fuel. Data 2020, 5, 48. [Google Scholar] [CrossRef]


| Material | Temp., °C | Time, min | VM, % | FC, % | AC, % | VS, % | CP, % | HHV, J·g−1 |
|---|---|---|---|---|---|---|---|---|
| PLA | - | - | 100.0 | 0.0 | 0.0 | 100.0 | 100.0 | 19,420 |
| 200 | 20 | 100.0 | 0.0 | 0.0 | 100.0 | 100.0 | 19,675 | |
| 40 | 100.0 | 0.0 | 0.0 | 100.0 | 100.0 | 19,598 | ||
| 60 | 100.0 | 0.0 | 0.0 | 100.0 | 100.0 | 19,512 | ||
| 220 | 20 | 100.0 | 0.0 | 0.0 | 100.0 | 100.0 | 19,631 | |
| 40 | 100.0 | 0.0 | 0.0 | 100.0 | 100.0 | 19,799 | ||
| 60 | 100.0 | 0.0 | 0.0 | 100.0 | 100.0 | 19,613 | ||
| 240 | 20 | 100.0 | 0.0 | 0.0 | 100.0 | 100.0 | 19,703 | |
| 40 | 100.0 | 0.0 | 0.0 | 100.0 | 100.0 | 19,654 | ||
| 60 | 100.0 | 0.0 | 0.0 | 100.0 | 100.0 | 19,682 | ||
| 260 | 20 | 100.0 | 0.0 | 0.0 | 100.0 | 100.0 | 19,399 | |
| 40 | 100.0 | 0.0 | 0.0 | 100.0 | 100.0 | 19,372 | ||
| 60 | 100.0 | 0.0 | 0.0 | 100.0 | 100.0 | 19,592 | ||
| 280 | 20 | 100.0 | 0.0 | 0.0 | 100.0 | 100.0 | 19,529 | |
| 40 | 100.0 | 0.0 | 0.0 | 100.0 | 100.0 | 19,510 | ||
| 60 | 100.0 | 0.0 | 0.0 | 100.0 | 100.0 | 19,410 | ||
| 300 | 20 | 100.0 | 0.0 | 0.0 | 100.0 | 100.0 | 19,346 | |
| 40 | 100.0 | 0.0 | 0.0 | 100.0 | 100.0 | 19,294 | ||
| 60 | 100.0 | 0.0 | 0.0 | 100.0 | 100.0 | 19,571 | ||
| PAP | - | - | 88.2 | 8.2 | 3.6 | 96.3 | 96.4 | 17,525 |
| 200 | 20 | 86.6 | 9.9 | 3.4 | 96.6 | 96.6 | 17,889 | |
| 40 | 86.2 | 10.1 | 3.6 | 96.3 | 96.4 | 17,283 | ||
| 60 | 86.7 | 9.8 | 3.5 | 96.5 | 96.5 | 17,653 | ||
| 220 | 20 | 88.0 | 8.6 | 3.4 | 96.5 | 96.6 | 17,185 | |
| 40 | 86.7 | 10.0 | 3.3 | 96.4 | 96.7 | 17,504 | ||
| 60 | 86.4 | 10.1 | 3.5 | 96.4 | 96.5 | 17,368 | ||
| 240 | 20 | 85.5 | 10.9 | 3.5 | 96.3 | 96.5 | 17,446 | |
| 40 | 84.7 | 11.8 | 3.6 | 96.2 | 96.4 | 17,366 | ||
| 60 | 84.8 | 11.7 | 3.5 | 96.2 | 96.5 | 17,434 | ||
| 260 | 20 | 86.2 | 10.2 | 3.6 | 96.1 | 96.4 | 17,163 | |
| 40 | 84.0 | 12.4 | 3.6 | 96.0 | 96.4 | 17,389 | ||
| 60 | 81.9 | 14.1 | 4.0 | 95.7 | 96.0 | 17,220 | ||
| 280 | 20 | 83.6 | 12.7 | 3.7 | 96.3 | 96.3 | 17,352 | |
| 40 | 67.9 | 26.0 | 6.1 | 93.7 | 93.9 | 19,048 | ||
| 60 | 66.9 | 26.2 | 7.0 | 92.8 | 93.0 | 19,146 | ||
| 300 | 20 | 69.3 | 24.8 | 5.9 | 93.9 | 94.1 | 18,758 | |
| 40 | 60.8 | 31.5 | 7.7 | 91.8 | 92.3 | 19,520 | ||
| 60 | 55.7 | 34.6 | 9.7 | 89.9 | 90.3 | 19,346 |
| Material | Note | Temperature, °C | n | Ea, kJ·(mol·K)−1 | A, s−1 | R2 |
|---|---|---|---|---|---|---|
| PLA | Whole process | 30–800 | 2.02 | 46.24 | 2.91 × 10 | 0.66 |
| Main decomposition peak | 290–400 | 0.42 | 160.05 | 2.37 × 10¹⁰ | 0.96 | |
| PAP | Whole process | 30–800 | 1.56 | 33.11 | 5.88 × 10⁻¹ | 0.89 |
| Main decomposition peak | 240–400 | 2.12 | 122.55 | 1.74 × 10⁸ | 0.96 | |
| Third decomposition peak | 668–760 | 3.00 | 173.05 | 4.90 × 10¹⁰ | 0.91 |
| Temp., °C | Time, min | Mass of Substrate Used to Produce 1 g of CSF, g | Energy Contained in the Raw Material Used to Produce 1 g of CSF, J | External Energy Needed to Produce 1 g of CSF, J * | Energy Contained in 1 g of CSF, J ** | Mass of Gas Generated during the Production of 1 g of CSF, g | Energy Contained in Gas after Production of 1 g of CSF, J *** | ||||||
|---|---|---|---|---|---|---|---|---|---|---|---|---|---|
| PLA | PAP | PLA | PAP | PLA | PAP | PLA | PAP | PLA | PAP | PLA | PAP | ||
| 200 | 20 | 1.004 | 1.054 | 19,500 | 18,475 | 86 | 328 | 19,675 | 17,889 | 0.004 | 0.054 | −89 | 914 |
| 40 | 1.006 | 1.048 | 19,540 | 18,367 | 86 | 328 | 19,598 | 17,283 | 0.006 | 0.048 | 27 | 1412 | |
| 60 | 1.006 | 1.055 | 19,538 | 18,482 | 86 | 328 | 19,512 | 17,653 | 0.006 | 0.055 | 112 | 1157 | |
| 220 | 20 | 1.003 | 1.074 | 19,483 | 18,817 | 133 | 425 | 19,631 | 17,185 | 0.003 | 0.074 | −15 | 2056 |
| 40 | 1.004 | 1.053 | 19,505 | 18,459 | 133 | 425 | 19,799 | 17,504 | 0.004 | 0.053 | −161 | 1380 | |
| 60 | 1.007 | 1.060 | 19,552 | 18,582 | 133 | 425 | 19,613 | 17,368 | 0.007 | 0.060 | 72 | 1639 | |
| 240 | 20 | 1.005 | 1.053 | 19,512 | 18,454 | 194 | 536 | 19,703 | 17,446 | 0.005 | 0.053 | 3 | 1543 |
| 40 | 1.007 | 1.078 | 19,562 | 18,886 | 194 | 536 | 19,654 | 17,366 | 0.007 | 0.078 | 101 | 2056 | |
| 60 | 1.013 | 1.096 | 19,676 | 19,207 | 194 | 536 | 19,682 | 17,434 | 0.013 | 0.096 | 188 | 2309 | |
| 260 | 20 | 1.010 | 1.066 | 19,608 | 18,683 | 267 | 663 | 19,399 | 17,163 | 0.010 | 0.066 | 477 | 2184 |
| 40 | 1.011 | 1.102 | 19,642 | 19,308 | 267 | 663 | 19,372 | 17,389 | 0.011 | 0.102 | 537 | 2583 | |
| 60 | 1.007 | 1.170 | 19,562 | 20,499 | 267 | 663 | 19,592 | 17,220 | 0.007 | 0.170 | 237 | 3942 | |
| 280 | 20 | 1.014 | 1.131 | 19,685 | 19,822 | 355 | 803 | 19,529 | 17,352 | 0.014 | 0.131 | 510 | 3273 |
| 40 | 1.025 | 1.357 | 19,909 | 23,778 | 355 | 803 | 19,510 | 19,048 | 0.025 | 0.357 | 754 | 5534 | |
| 60 | 1.022 | 1.550 | 19,839 | 27,163 | 355 | 803 | 19,410 | 19,146 | 0.022 | 0.550 | 784 | 8820 | |
| 300 | 20 | 1.012 | 1.288 | 19,646 | 22,571 | 458 | 940 | 19,346 | 18,758 | 0.012 | 0.288 | 758 | 4753 |
| 40 | 1.043 | 2.357 | 20,247 | 41,303 | 458 | 940 | 19,294 | 19,520 | 0.043 | 1.357 | 1,410 | 22,722 | |
| 60 | 1.227 | 2.485 | 23,833 | 43,551 | 458 | 940 | 19,571 | 19,346 | 0.227 | 1.485 | 4,719 | 25,144 | |
Publisher’s Note: MDPI stays neutral with regard to jurisdictional claims in published maps and institutional affiliations. |
© 2021 by the authors. Licensee MDPI, Basel, Switzerland. This article is an open access article distributed under the terms and conditions of the Creative Commons Attribution (CC BY) license (https://creativecommons.org/licenses/by/4.0/).
Share and Cite
Świechowski, K.; Zafiu, C.; Białowiec, A. Carbonized Solid Fuel Production from Polylactic Acid and Paper Waste Due to Torrefaction. Materials 2021, 14, 7051. https://doi.org/10.3390/ma14227051
Świechowski K, Zafiu C, Białowiec A. Carbonized Solid Fuel Production from Polylactic Acid and Paper Waste Due to Torrefaction. Materials. 2021; 14(22):7051. https://doi.org/10.3390/ma14227051
Chicago/Turabian StyleŚwiechowski, Kacper, Christian Zafiu, and Andrzej Białowiec. 2021. "Carbonized Solid Fuel Production from Polylactic Acid and Paper Waste Due to Torrefaction" Materials 14, no. 22: 7051. https://doi.org/10.3390/ma14227051
APA StyleŚwiechowski, K., Zafiu, C., & Białowiec, A. (2021). Carbonized Solid Fuel Production from Polylactic Acid and Paper Waste Due to Torrefaction. Materials, 14(22), 7051. https://doi.org/10.3390/ma14227051