Article

Three-Dimensional Finite Element Investigation into Effects of Implant Thread Design and Loading Rate on Stress Distribution in Dental Implants and Anisotropic Bone

by
Dawit-Bogale Alemayehu
1 and
Yeau-Ren Jeng
1,2,3,*
1
Department of Biomedical Engineering, National Cheng Kung University (NCKU), Tainan 70101, Taiwan
2
School of Smart Semiconductor and Sustainable Manufacturing, National Cheng Kung University (NCKU), Tainan 70101, Taiwan
3
Medical Device Innovation Center (MDIC), National Cheng Kung University (NCKU), Tainan 70101, Taiwan
*
Author to whom correspondence should be addressed.
Materials 2021, 14(22), 6974; https://doi.org/10.3390/ma14226974
Submission received: 10 September 2021 / Revised: 6 November 2021 / Accepted: 16 November 2021 / Published: 18 November 2021

Abstract

:
Variations in the implant thread shape and occlusal load behavior may result in significant changes in the biological and mechanical properties of dental implants and surrounding bone tissue. Most previous studies consider a single implant thread design, an isotropic bone structure, and a static occlusal load. However, the effects of different thread designs, bone material properties, and loading conditions are important concerns in clinical practice. Accordingly, the present study performs Finite Element Analysis (FEA) simulations to investigate the static, quasi-static and dynamic response of the implant and implanted bone material under various thread designs and occlusal loading directions (buccal-lingual, mesiodistal and apical). The simulations focus specifically on the von Mises stress, displacement, shear stress, compressive stress, and tensile stress within the implant and the surrounding bone. The results show that the thread design and occlusal loading rate have a significant effect on the stress distribution and deformation of the implant and bone structure during clinical applications. Overall, the results provide a useful insight into the design of enhanced dental implants for an improved load transfer efficiency and success rate.

Graphical Abstract

1. Introduction

Dental implants have become increasingly common as a method for replacing missing teeth in recent decades [1,2,3,4]. However, while some studies have reported an implant success rate as high as 78–100% [5], other studies have indicated that single tooth replacement failures may occur for a variety of reasons [6], including implant surface, implant design, and bone quality factors [7] and early bone loss in the dental implant region [8]. In practice, the bio-structure of dental implants is of critical importance in determining the success rate of the implant procedure since it affects the bone directly and causes the stress distribution to change from constant to a variable, thereby putting both the implant and the bone at risk of biomechanical overload failure [9]. The success rate of dental implants is also crucially dependent on the efficiency of the stress transfer from the implant to the supporting bone [10,11,12], which depends in turn on many factors, including the loading condition [9], the implant thread design [2,13,14], and the bone material properties [15].
The Finite Element Method (FEM) provides an extremely efficient approach for analyzing biomechanical problems [16,17,18,19,20,21,22]. FEM is particularly attractive for the analysis of biomechanical processes, which are difficult (if not impossible) to examine in vivo or in vitro. As a result, it has been used extensively in the literature to evaluate the stress and deformation behavior of dental implants to improve their success rate [3,12,23,24,25,26,27,28,29,30,31,32,33,34]. Tribst et al. examined the mechanical performance of an alternate design for producing an implant-supported full-arch dental prosthesis (IFDP) with limited occlusal height using a finite element method (FEM) [35]. Additionally, a linear static structural finite element method (FEM) simulation was used to evaluate entire tooth models (enamel, dentin, and pulp) which is constructed with an efficient and new method using micro-computed tomography (CT) data [36]. The study by Mosavar et al. was inspired by a paucity of numerical models of bone-implant interactions for diverse osseointegration and the simplification of bone as an isotropic material in prior investigations. Further, four different thread form implants were modeled and subjected to static occlusal load and varied osseointegration conditions of the bone-implant interface using finite element analysis. It is found that the cervical cortical bone region received the most stress, as did the first thread [37].
During their service lives, dental implants are subjected to both static and dynamic loads [38]. Static loads are exerted on the rigid maxilla from the unmoving mandible, and the intensity is not varied over time [39]. One of the many shortcomings in Finite Element analysis is the assumption of unrealistic (static) loads in dental implants [40]. Most previous studies only consider the effects of static loads applied to a single point on the implant surface [24,41,42,43]. As a result, the induced stress does not usually exceed the yield strength of the dental implant material (e.g., 550 MPa for titanium, [44]) or bone (190 MPa for cortical bone, and 10 MPa for cancellous bone [44]). Therefore, in comparison to more realistic cyclic loading, static loads are associated with a less critical effect, creating less stress in the dental implant system [45]. Similarly, quasi-static loading has no significant influence on both implant and surrounding bone. Gehrke et al. [46] investigated one-piece and two-piece sintered dental implants subjected to quasi-static loading at a 30 degrees angle to the implant axis. The results showed that both implants could resist the loads produced during mastication.
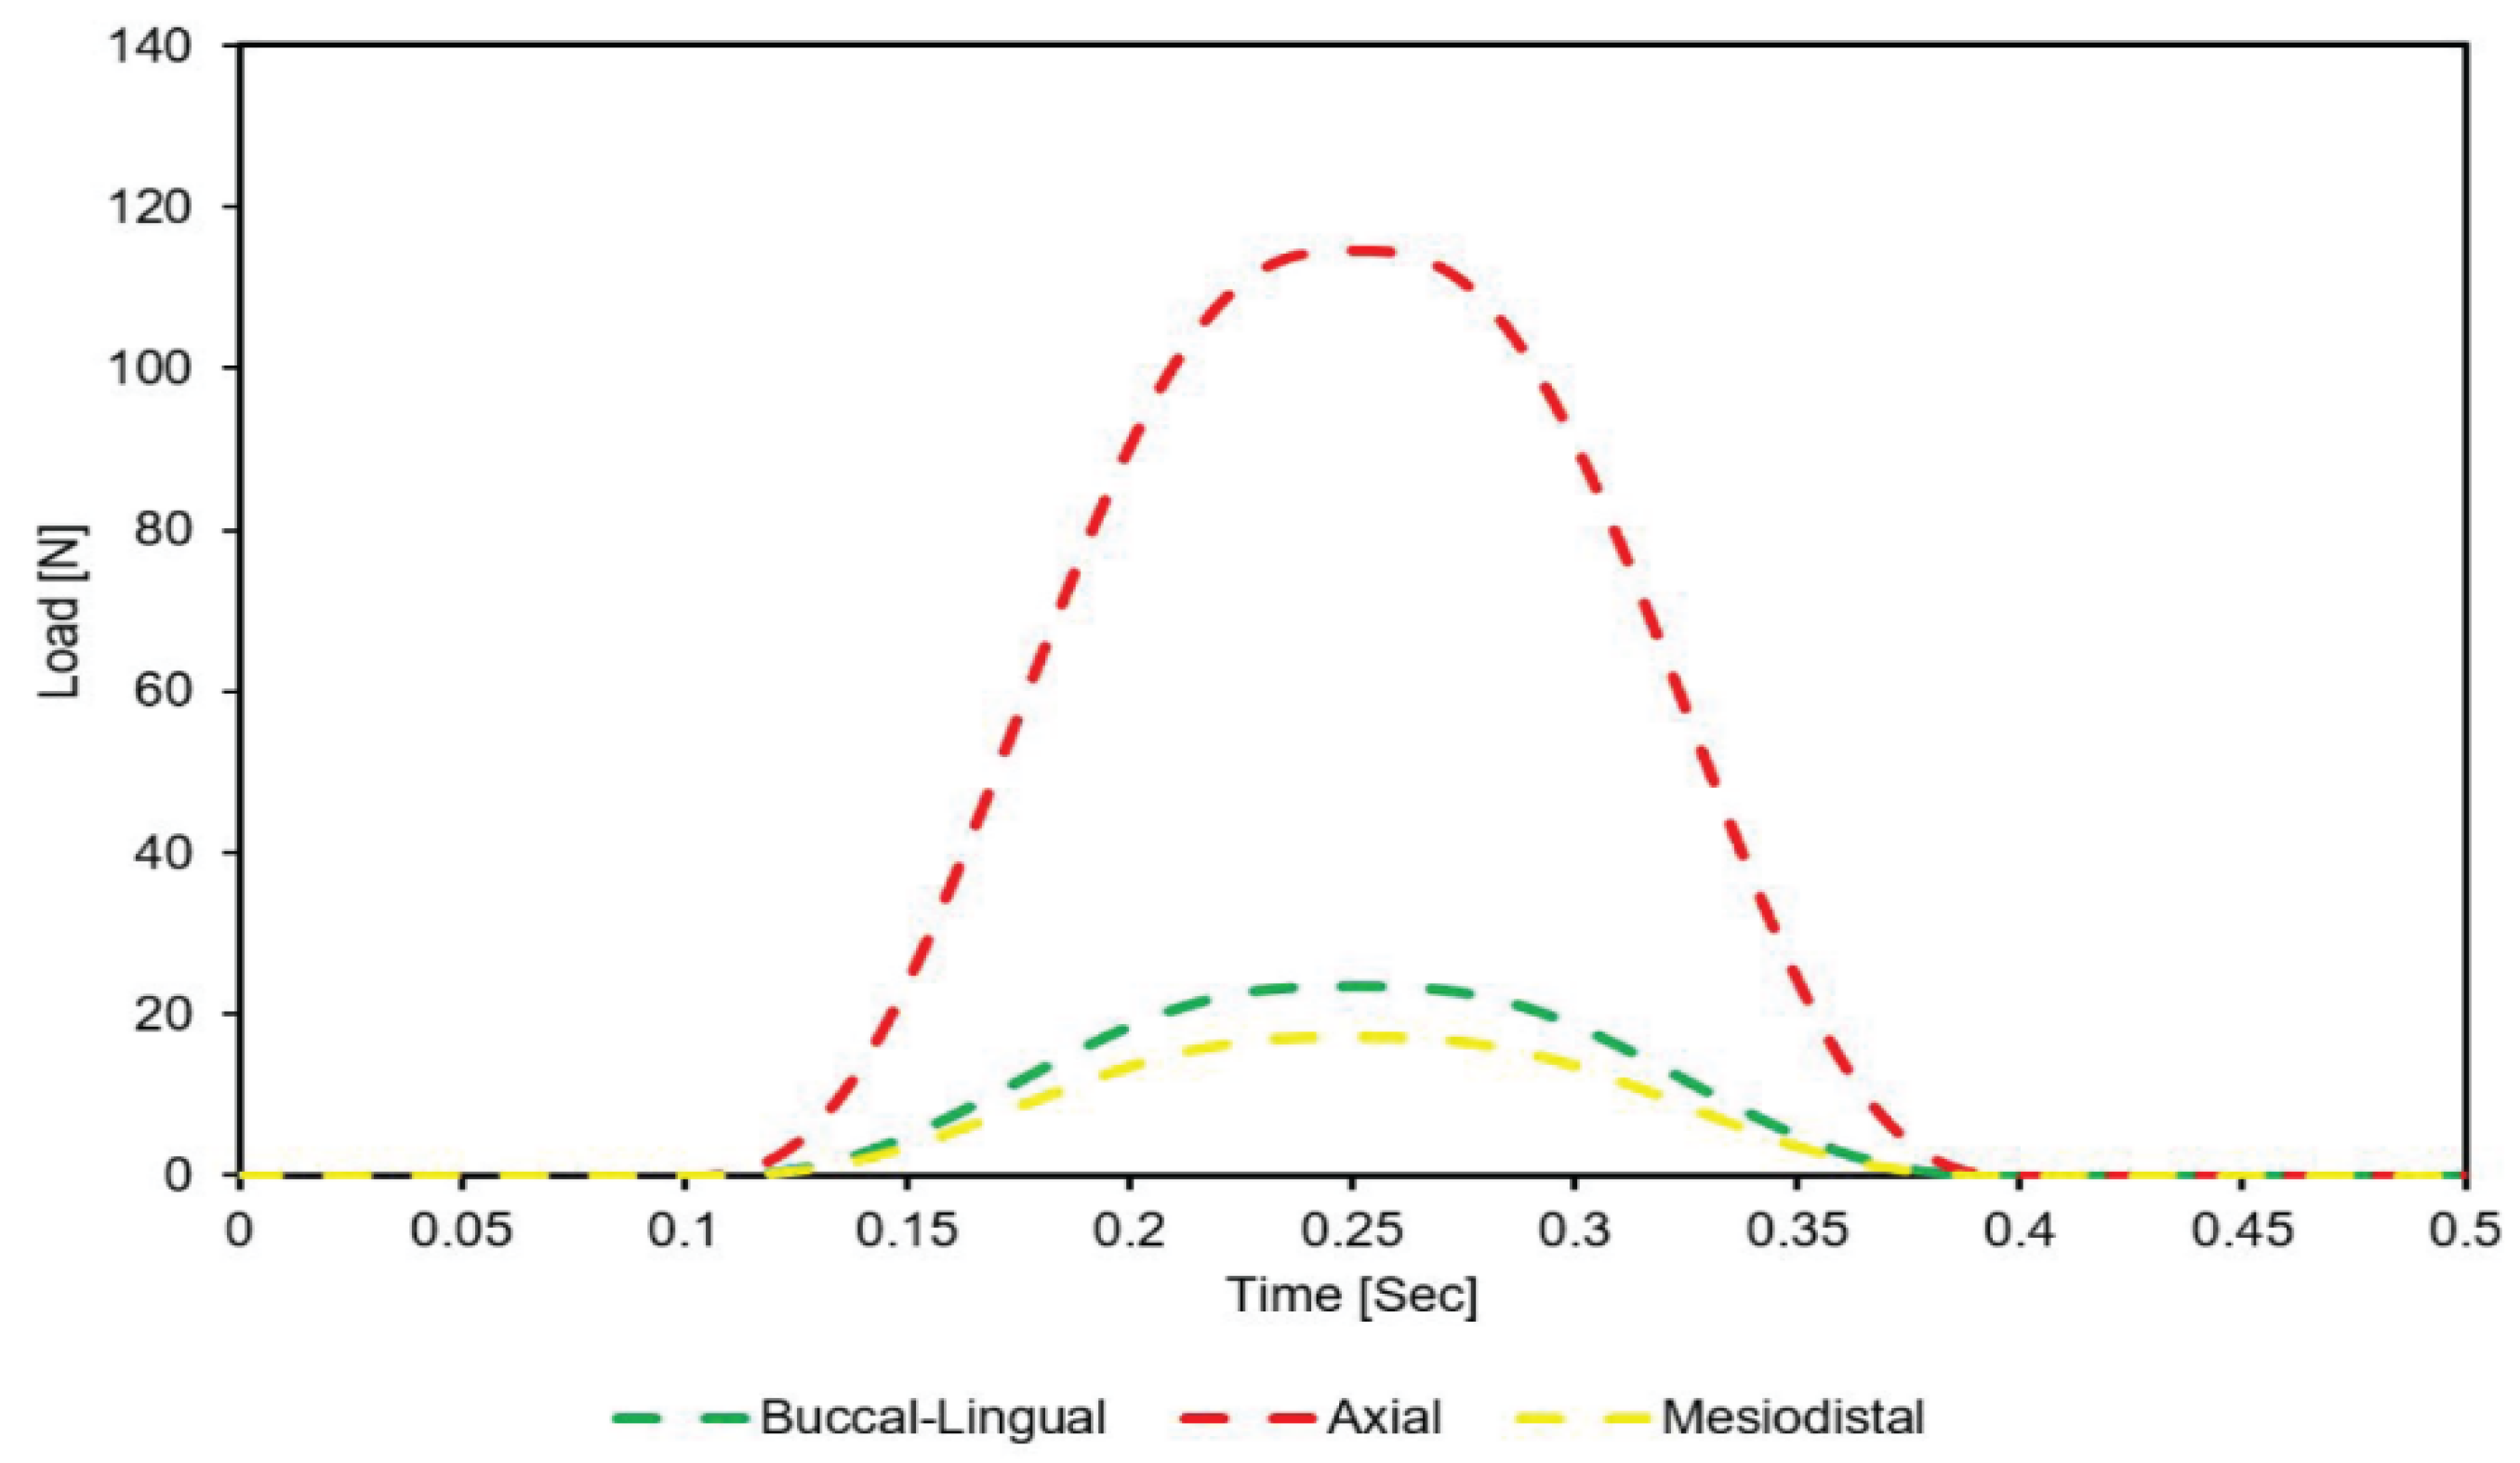
However, to mimic the actual mandible movement for FEM simulation, the masticatory occlusal load applied to the crown surface must be cyclic, repeatable, and dynamic with time [47]. Furthermore, cyclic loading increases stress, which was already at a peak in static loading conditions. Hence, increasing the possibility of implant fatigue and fracture during clinical service. Regardless of those consequences, not many studies about the effect of dynamic loading on the performance of dental implants and bone. Gotfredsen et al. [48,49,50] showed that in practical implant situations, high dynamic loads are much more destructive than static loads, and therefore have a critical effect on the implant success rate. The results showed that dynamic loading produced higher maximum stress than static loading and had a greater effect on the stress range as the elastic modulus varied. Bulaqi et al. [44] showed that for short dental implants subject to dynamic loads, a greater crown height space (CHS) contributed to screw loosening and fatigue fracture. Kayabaşi et al. [51] showed that for dental implants with a buttress thread shape, dynamic loading increased the stress within the implant by as much as 10–20%.
The shape of the implant thread has a significant effect on both the stress distribution within the implant and the marginal bone rehabilitation [10]. Accordingly, an appropriate design of the thread pattern is essential to improve the uniformity of the stress distribution and reduce the stress intensity at the bone-implant interface (BII) [13,52]. Mosovar et al. [
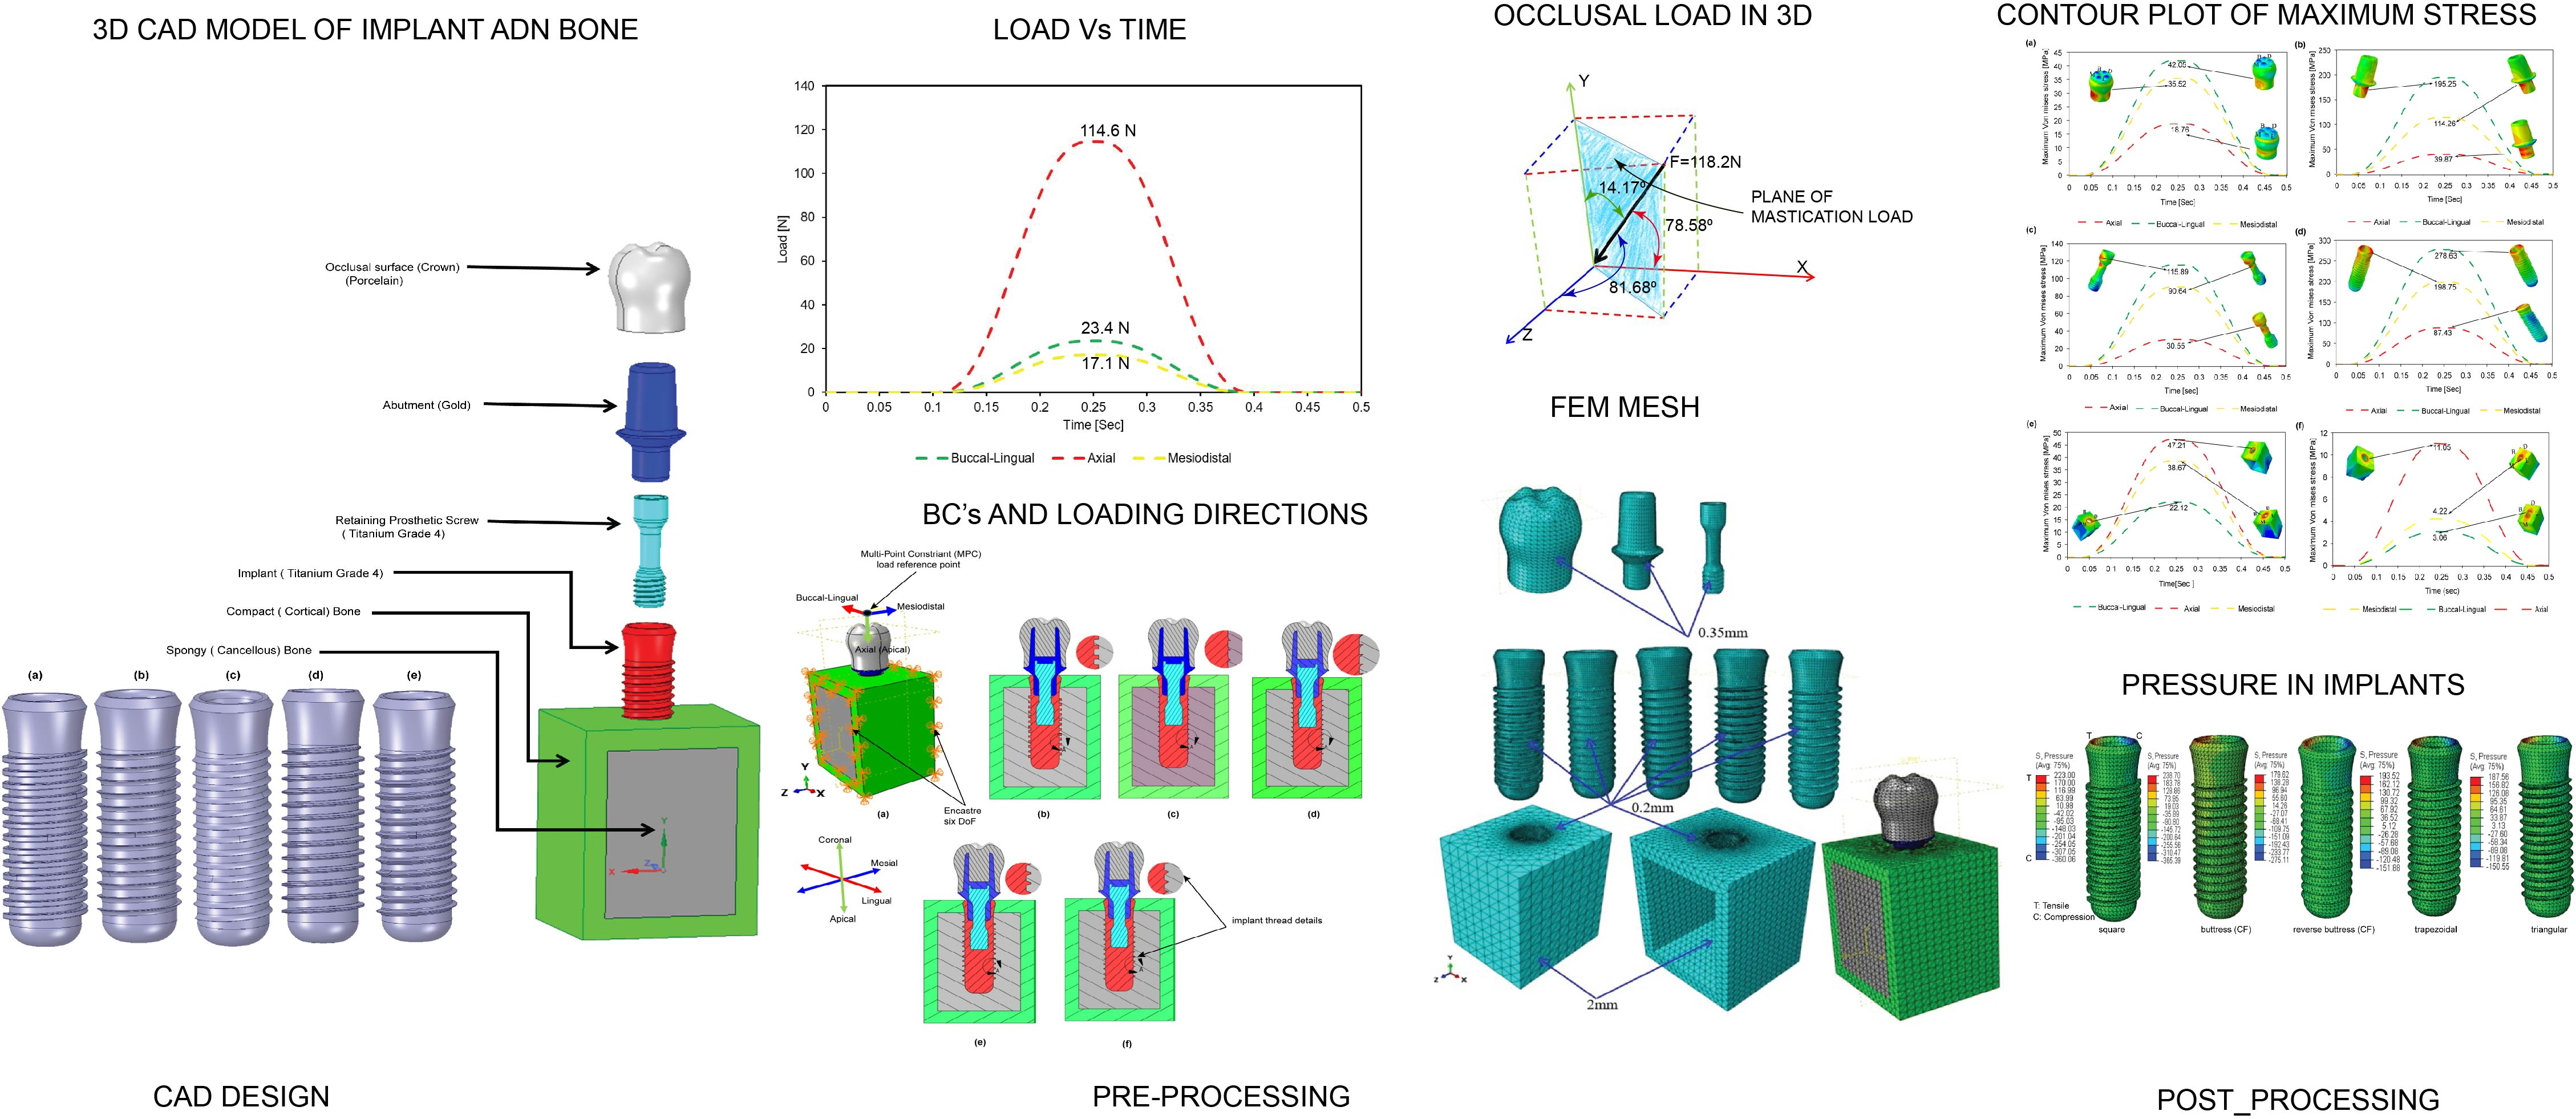
37] examined the effects of four different thread shapes on the stress distribution in the anisotropic bone under static loading conditions and found that a square thread resulted in improved performance. Many thread designs are available for dental implants, including square, triangular, buttress, reverse buttress, and trapezoidal. The thread design and associated parameters (e.g., face angle, thread width, thread pitch, and so on) have a critical effect on both the type of force produced at the BII (i.e., tensile, compressive, or shear) and the efficiency with which the load is transferred to the bone [37,53]. For example, triangular threads generate a higher shear force, while square-shaped threads produce a lower shear force and higher compressive force [52]. For square and buttress threads, the axial load is dissipated mainly through compressive forces [37,54,55]. However, for triangular and reverse buttress threads, the load is transferred through a combination of shear forces, compressive forces, and tensile forces [53]. Among the various thread designs, the square design reduces the maximum von Mises stress [56]. Albrektsson et al. [57] showed that the stress concentration of dental implants can be further reduced by curving the tops of the threads. Hansson and Werke [52] similarly showed that the maximum stress induced in the bone, and the ability of the implant to bear the load depends not only on the thread design (e.g., triangular, square, buttress, and so on) but also on the detailed parameters of the thread design, including the pitch, thread width, and face angle.
The bone material property also has an important effect on the stress distribution in dental implant systems. However, the accurate modeling of bone-related organs using finite element modeling (FEM) methods is challenging due to their inherent inhomogeneous and anisotropic characteristics [1,4,37,58]. As a result, almost all previous studies consider the implanted bone to be isotropic, homogeneous, and linearly elastic [3,4,25,41,59,60,61,62,63]. However, such a simplification results in significantly lower stress predictions for the peri-implant bone than those observed in practice [8]. Consequently, the usefulness of the simulation results for practical clinical purposes is greatly impaired.
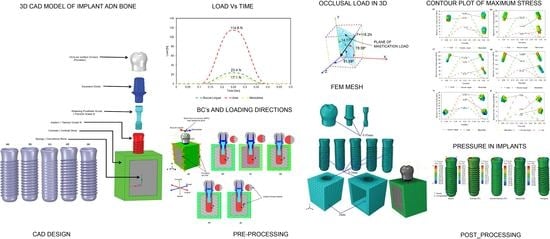
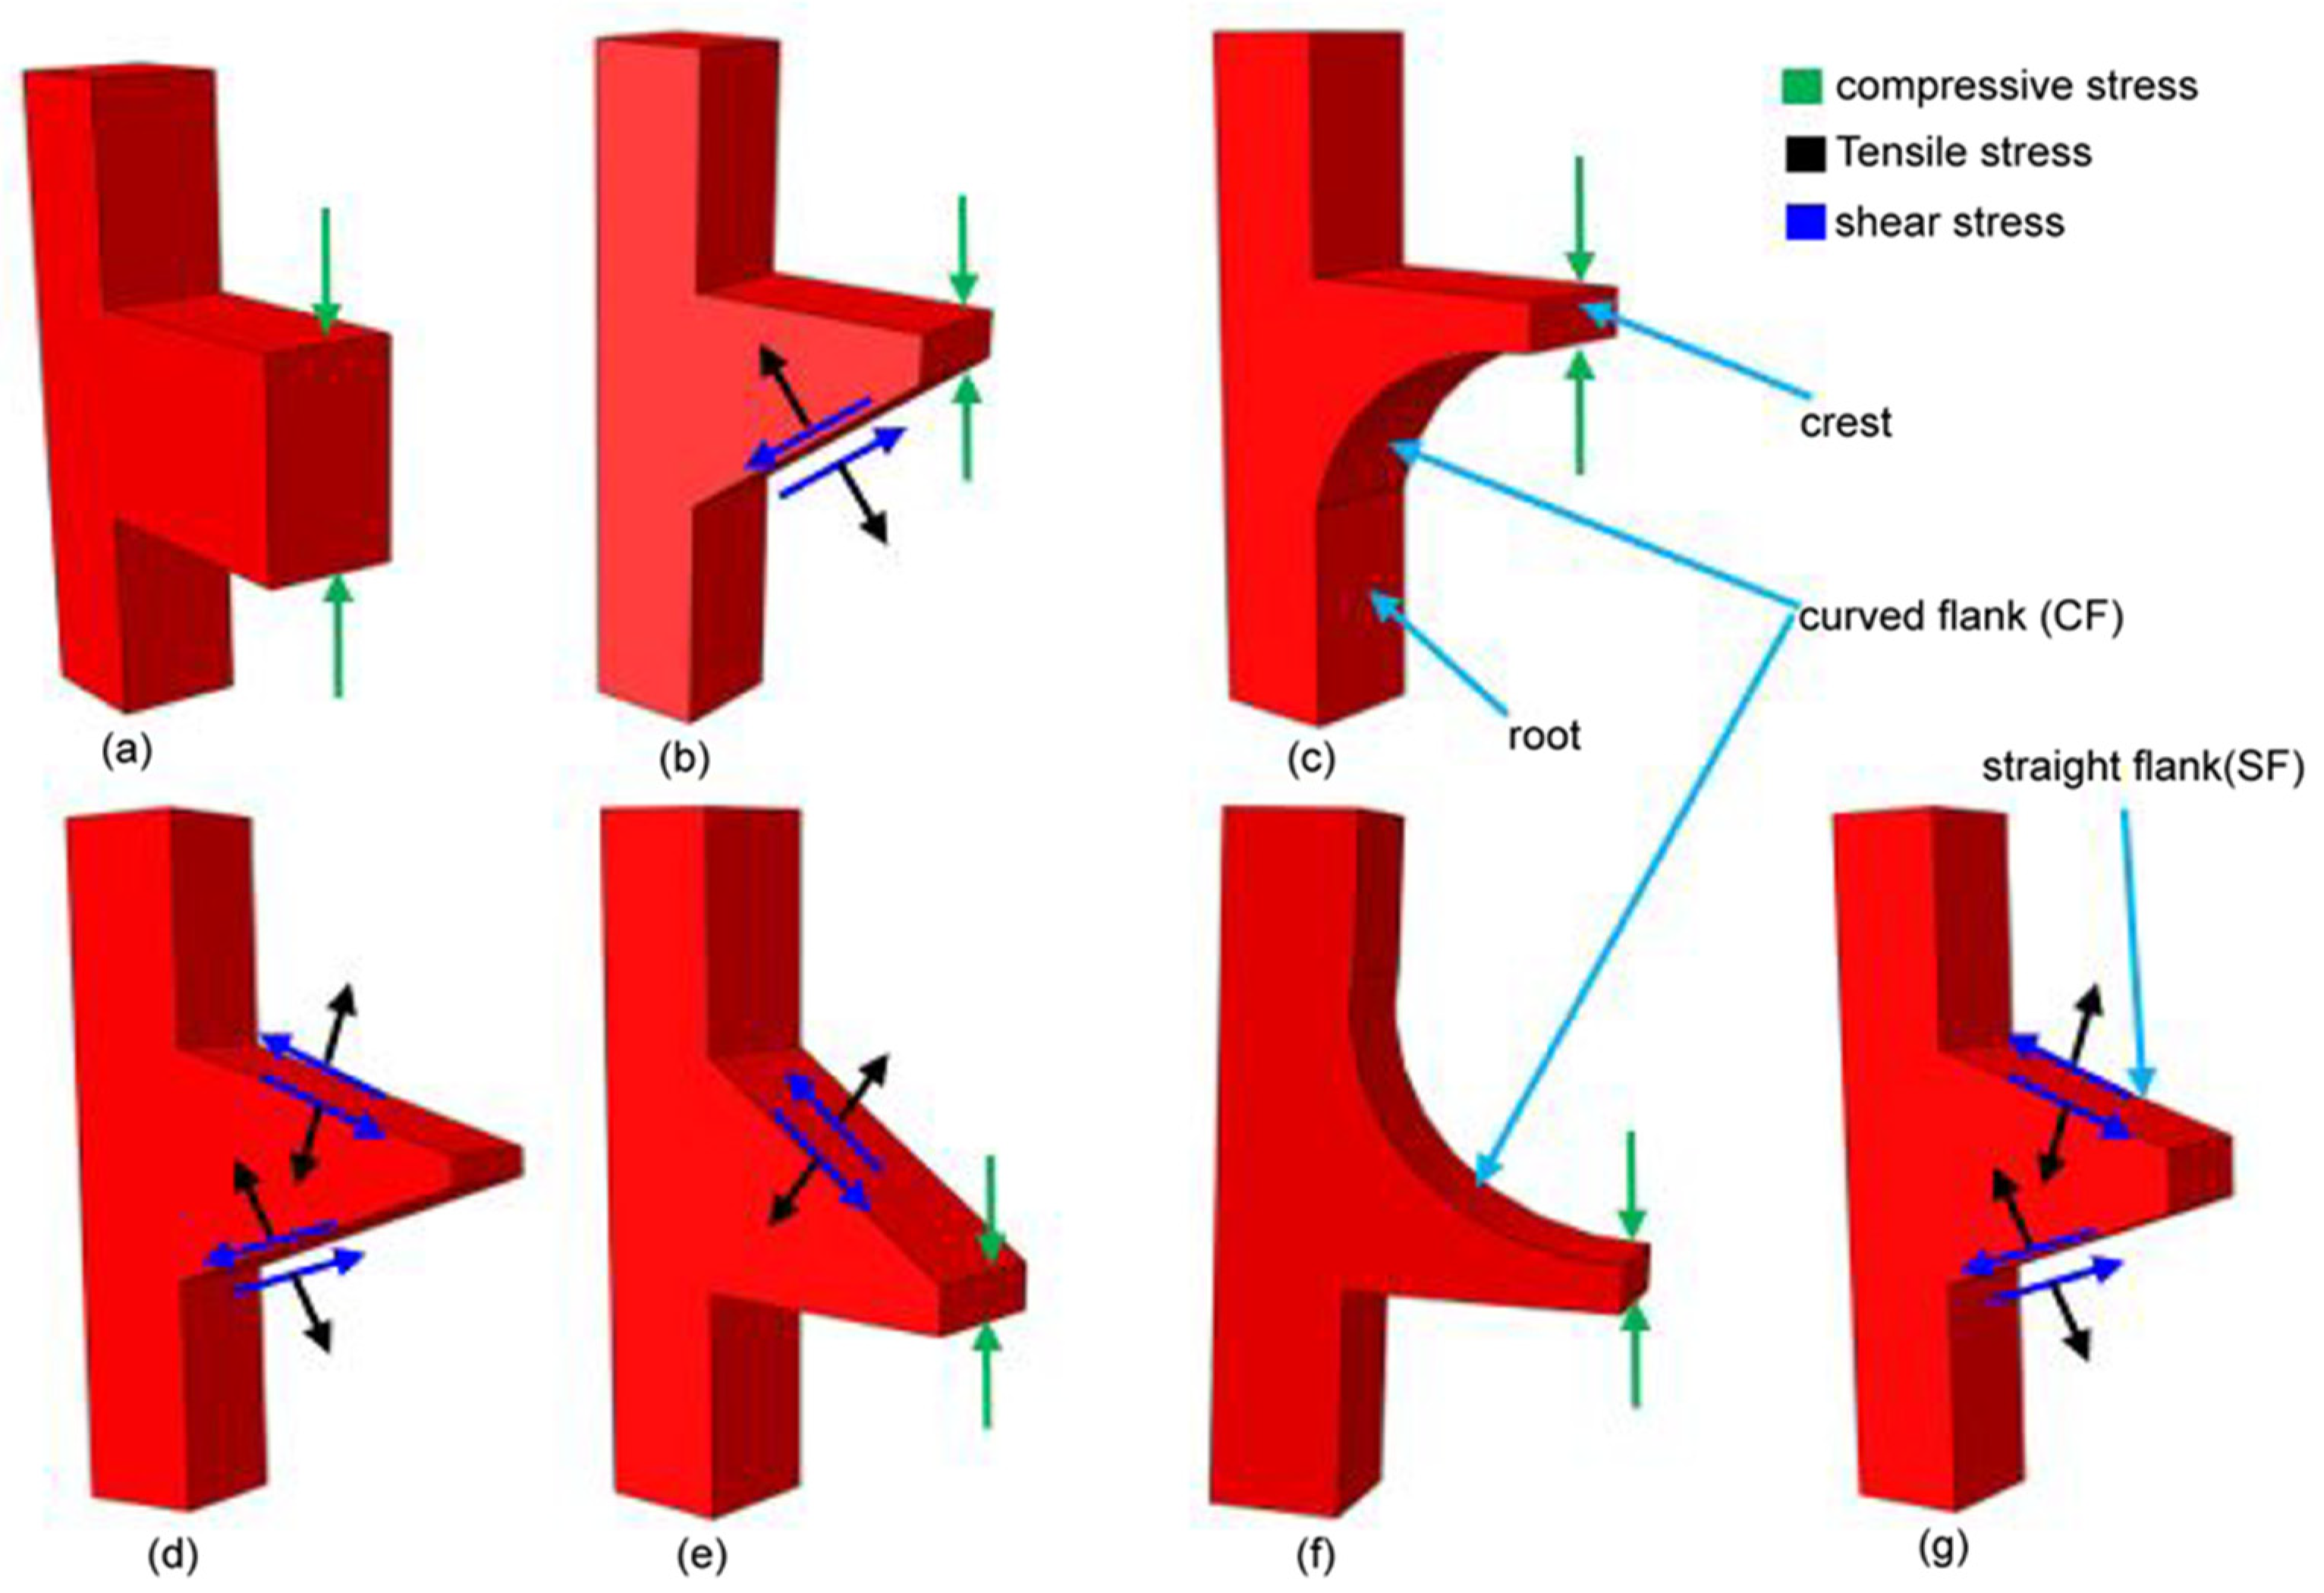
This study aims to investigate the biomechanical behavior of five dental implants with varied thread designs when loaded under three different loading rates, as well as the impact on implant stress distribution and surrounding anisotropic bone. Additionally, we will investigate whether dynamic load will noticeably increase stresses and deformation in all five implant models and bone compared to static and quasi-static loading conditions.

2. Materials and Methods

2.1. Implant and Bone Models

The present study performs a comprehensive FEM investigation into the effects of five different dental implant thread designs (square, buttress, reverse buttress, trapezoidal, and triangular) on the stress distribution induced within the implant and surrounding bone under three different loading rates, namely static, quasi-static and dynamic. The simulations consider the implant to consist of four components, i.e., the crown, abutment, screw, and implant. For both buttress designs, two different flank profiles were implemented, namely straight flank (SF) and curved flank (CF). Thus, as shown in Figure 1, a total of seven three-dimensional (3D) implant models were constructed, (note that for clarity of presentation, only the first thread in each model is shown). Moreover, the implanted bone is modeled as an anisotropic structure consisting of a spongy bone interior (cancellous bone) and a compact bone exterior (cortical bone). The 3D model for this investigation was made from a rectangular slice of compact and spongy bone obtained from a human jawbone (Mandible). For each model, the implant length, diameter, and pitch were specified as 14 mm, 4.1 mm and 0.8 mm, respectively, following the design specification of the commercial Straumann® Standard Plus (SP) dental implant (Straumann, Basel, Switzerland). As shown in Figure 2, the prosthetic was assumed to consist of four components, namely the crown, abutment, screw, and implant. Finally, the simulations consider the implant to be jointly loaded by three external forces acting in the mesiodistal, buccal-lingual, and apical directions, respectively. The simulations focus specifically on the von Mises stress, displacement magnitude, shear stress, compressive stress, and tensile stress under each of the considered thread designs and loading conditions. The results are expected to be of significant benefit in the design of dental implants with an improved success rate under realistic clinical conditions.

2.2. Material Properties and Mesh

The static and quasi-static responses of the dental implants were investigated using ABAQUS Standard simulations, while the dynamic response was investigated using ABAQUS Explicit. The implants and bone models were discretized using a free meshing technique with C3D10M 10-node modified quadratic tetrahedron elements. As shown in Figure 3 the models were meshed using a 0.2-mm element size in regions of the computational domain with a high-stress concentration, and 0.35-mm or 2-mm size elements elsewhere. Table 1 presents the mesh statistics of the five basic implant models. The mechanical properties of the implant and bone materials are shown in Table 2. It is noted that the mechanical properties of the crown, abutment, screw, and implant component are all assumed to be elastic, isotropic, and homogenous.

2.3. Load and Boundary Conditions

As shown in Figure 4a, the occlusal surface of the dental implant was subjected to a combined loading condition in the mesiodistal, buccal-lingual and apical directions. In performing the simulations, the magnitudes of the loads in the three directions were set as 23.4 N, 17.1 N, and 114.6 N, respectively, and were applied to a dummy reference point located at a distance of 3 mm from the occlusal surface using a multi-point constraint (MPC) technique. The resulting equivalent load was equal to 118.2 N at an angle of 75.8 degrees to the occlusal plane [44,51,64,65]. As described in the previous section, the simulations considered three different loading rates, namely static, quasi-static and dynamic. In the latter case, the external load was applied for 0.5 seconds to replicate the natural mastication cycle, which typically has a frequency of 2 Hz [44,66]. Figure 4b–f present cross-sectional views of the five basic thread designs considered in the present study. In performing the simulations, a zero-displacement boundary condition was initially applied at the interface between the implant and mandible bone in the X-, Y, and Z-directions. Moreover, to mimic the actual clinical situation at the interface between the implant and bone, frictional contact interfaces were implemented with values of 0.65 between the implant and cortical bone, and 0.77 between the implant and cancellous bone [67]. And the implants were assumed to be subjected to a combined load acting jointly in the mesiodistal, buccal-lingual, and apical directions, respectively. Moreover, the load was applied under three different rates, namely static, quasi-static and dynamic. The resulting shear stress, tensile stress, and compressive within the implant were analyzed employing finite element simulations performed in ABAQUS software (Dassault Systèmes Simulia Corporation, Providence, RI).

3. Results

3.1. Mesh Sensitivity Analysis

In performing FEA simulations, convergence tests are required to achieve an adequate tradeoff between the computational cost of the simulation process and the accuracy of the numerical solutions. Accordingly, the five implant models were implemented with eight different element sizes in the range of 0.05~0.4 mm. For each mesh size, the maximum von Mises stress was computed in the compact bone region. The simulation results were then inspected to determine the mesh size at which the change in the maximum von Mises stress was limited to less than 5%. And the convergence test was performed under a dynamic loading rate. The corresponding results are presented in Figure 5. A detailed inspection shows that the maximum von Mises stress increases by just 3.96%, 4.44%, 3.10%, 4.00%, and 1.26% as the element size increases from 0.2 to 0.25 mm in the square, buttress, reverse buttress, trapezoidal, and triangular models, respectively. Accordingly, an element size of 0.2 mm was adopted as the optimal seed size for the meshing process (see Figure 3).

3.2. Cyclic Load vs. Time

Figure 6 shows the variation of the load applied to the occlusal surface of the crown in the mesiodistal, buccal-lingual, and apical directions throughout the mastication cycle (0.5 s).

3.3. Maximum Von Mises Stress

Figure 7 shows the corresponding variation in the maximum von Mises stress in the crown, abutment, abutment screw, Buttress thread implant, cortical bone, and spongy bone regions of the model, respectively. It is seen that for all of the implant components, the maximum von Mises stress is produced under buccal-lingual loading, followed by mesiodistal and axial loading, respectively. Moreover, the maximum von Mises stress is induced in the implant component of the prosthetic (Figure 7d). The maximum stress has a value of 278.63 MPa and is thus around 50.66% of the implant material (titanium) yield strength (see Table 1). By contrast, the minimum von Mises stress is produced in the crown region of the implant (Figure 7a). Observing the results presented in Figure 7e for the cortical bone region of the model, it is seen that the maximum von Mises stress is produced under axial loading, followed by mesiodistal and buccal-lingual loading, respectively. By contrast, for the spongy bone region of the model, the maximum stress is produced under axial loading, followed by buccal-lingual and mesiodistal loading (Figure 7f). Comparing the two figures, the maximum von Mises stress in the cortical bone region (47.21 MPa, 22.31% of the yield strength, see Table 1) is higher than that in the spongy bone region (11.05 MPa, 110% of the yield strength). Moreover, the maximum von Mises stress is distributed relatively uniformly between the three loading conditions. However, the magnitude of the maximum von Mises stress is significantly reduced and less evenly distributed in the spongy bone region (11.05 MPa under axial loading and 3.06 MPa under mesiodistal loading).
Table 3 contains results from ONE WAY ANOVA statistical analysis comparing the effect of the three loading rates on stress in all implant models. The result showed, the p-value is greater than 5% and way far below the F critical value. Also, Table 4 shows the maximum von Mises stress in the crown, abutment, screw, implant, cortical bone, and spongy bone regions of the five models under the static, quasi-static and dynamic loading conditions. It is evident that for each region of the model, the maximum von Mises stress increases significantly under the application of a dynamic load. The increases are 32%, 38.19%, 45.10%, 51.20%, and 58.21% for square, buttress, reverse buttress, trapezoidal, and triangular thread implant, respectively. And Square, buttress, reverse buttress, trapezoidal, and triangular thread implants have a 32%, 38.17%, 45.08%, 51.19%, and 58.19% stress increase in cortical bone, respectively. Moreover, for each model, the maximum von Mises stress occurs in the implant region of the prosthetic.
Figure 8 shows the von Mises stress distributions in the crown, abutment, retaining screw, implant, and supporting bone regions of the five models under dynamic loading conditions. As shown in Figure 9c, under dynamic loading conditions, the maximum von Mises stress occurs in the implant component of the prosthetic, while the lowest von Mises’s stress occurs in the spongy bone. The maximum von Mises stress has a value of 496.48 MPa and occurs in the triangular thread model, while the lowest von Mises stress has a value of 159.77 MPa and occurs in the square thread model. Regarding the bone regions of the model, the von Mises stress has maximum values of 81.96 MPa and 24.75 MPa in the cortical bone regions of the triangular and square thread models, respectively, and minimum values of 8.25 MPa and 5.31 MPa.
Table 5 compares the maximum von Mises stresses induced in the buttress and reverse buttress models for two different flank designs (curved and straight) under each of the three loading conditions. It is seen that for each model, the application of a curved flank design lowers the maximum von Mises stress in all the prosthetic and bone regions of the model.
The reduction in the maximum von Mises stress is particularly apparent under the dynamic loading condition and in the crown region of the prosthetic, for which the reduction is equal to almost 50%. The addition of curved flank (CF) to the buttress and reverse buttress thread profiles will greatly increase compressive stress while significantly lowering tensile stress. After this result is established, only buttress and reverse buttress with CF profile are examined in this study.

3.4. Maximum Pressure

Figure 9 shows the maximum pressure (tensile stress and compressive stress) in the square, buttress, reverse buttress, trapezoidal, and triangular thread implant models under dynamic loading conditions. For each of the models, the maximum pressure occurs in the implant neck region, where the implant and cortical bone make contact. The maximum compressive stress is produced in the square and buttress (CF) thread implants, with magnitudes of 360.06 MPa and 365.39 MPa respectively. The addition of a curved flank to a buttress implant increased compressive stress when compared to a square implant. By contrast, the trapezoidal and Triangular thread designs result in relatively lower maximum compressive stresses of 151.88 MPa and 150.55 MPa, respectively.

3.5. Maximum and Minimum Principal Stress

The results confirm that the dynamic loading condition yields a significant increase in the magnitude of the principal stress in all five implant models (Figure 10). The percentage change in minimum and maximum compressive principal stresses due to dynamic loading for buttress thread implant is 51.17% and 65.26% and for reverse buttress implant is 39.26% and 59.33%, respectively. However, the static and quasi-static loading conditions show no significant difference in effect on the stress response of the implants. The highest maximum principal (tensile) stress occurs in the reverse buttress (CF) model and has a value of 458.35 MPa. By contrast, the highest minimum principal (compressive) stress occurs in the buttress thread (CF) model and has a value of 517 MPa. For both stresses (tensile and compressive), the maximum stress occurs in the tip bevel region of the implant where it contacts the crestal part of the cortical bone.
Figure 9. Shows the maximum pressure in (a) Square, (b) Buttress, (c) reverse buttress, (d) trapezoidal, and (e) triangular thread shape under cyclic loading.
Materials 14 06974 g009

3.6. Maximum Displacements

Figure 11a–c show the maximum displacements of the crown, abutment, screw, implant, cortical bone, and spongy bone regions of the five models under static, quasi-static, and dynamic loading conditions, respectively. For all the thread models, and each of the three loading conditions, the maximum displacement occurs in the crown region of the prosthetic, while the minimum displacement occurs in the spongy bone. Furthermore, for each loading condition, the square thread design results in the lowest displacement, while the trapezoidal and triangular designs yield the highest displacement. Comparing the three figures, it is seen that the quasi-static and static loading conditions yield a similar maximum displacement of the prosthetic and bone regions of the model. However, the dynamic loading condition yields a significant increase in the maximum displacement of all regions of the model for all five thread designs. In square thread implants, the percentage change in maximum displacement because of applying dynamic load is 54%, and 65% for the rest of the dental implant thread type. Maximum displacement changes attributed to dynamic load in cortical bone were 52.03% in square thread implants, 41.76% in triangular thread implants, and 55% in the other three implants.

3.7. Maximum Shear Stress

Table 6 shows the maximum shear stress in the crown, abutment, screw, implant, cortical bone, and spongy bone regions of the five basic thread models for each of the three planes (XY, XZ, and YZ) and loading rate conditions (static, quasi-static, and dynamic). For each model, the maximum shear stress increases significantly on all planes under the application of a dynamic load (40–99%). The maximum shear stresses in the three planes (XY, XZ, and YZ) for the square thread implant in static and dynamic loading were (27.75 MPa, 19.69 MPa, and 17.13 MPa) and (41.66 MPa, 29.30 MPa, and 25.51 MPa), respectively. The percentage change in maximum shear stress in three planes (XY, XZ, and YZ) of the dynamic loading rate is shown here (50.13%, 48.81%, and 48.92%). Similarly, in triangular thread implant, the percentage change in the maximum shear stress in the three planes (XY, XZ, and YZ) of the static and dynamic loading rate is (95.56%, 85.67%, and 99.14%). The p-value for the one-way ANOVA statistical analysis in Table 7 is greater than 5%. As a result, there is no discernible difference in the stress responses of the various components within each model under static and quasi-static loads. Furthermore, based on the results of the ANOVA analysis (Table 8), the square thread and buttress thread models produce lower shear stress values than the reverse buttress, trapezoidal, and triangular models. Moreover, for all thread models and loading directions, the shear stress in the cortical bone is greater than that in the spongy bone. And the effect of dynamic load on shear stress was significant but varied in every three planes (XY, XZ, and YZ planes).

4. Discussion

Based on the ONE WAY ANOVA statistical analysis result p-value was greater than 5%, indicating that the result is statistically non-significant (Table 3). In other words, there is a remarkable increase in stress magnitude in the case of dynamic loading compared to that of quasi-static and static loading conditions in all five implant models. Also from the FEA result and based on the approach used in this study, the dynamic load applied to the crown surface increased the stresses by 30–60% compared to unrealistic (static) loading (Table 4, Table 5 and Table 6) which is highly significant. Dynamic mechanical loading can damage the surface morphology and chemistry of dental implants [68] and can result in the penetration of micro-organisms down to the threaded region of the fixture-abutment interface [69]. Furthermore, cyclic loading can increase the stress induced in the implant by around 10–20% compared to that observed under static loading [51]. Previous studies have shown that the stress induced in the implant and surrounding bone region depends not only on the nature of the applied load (i.e., static or dynamic) but also on the design of the implant thread [70,71].
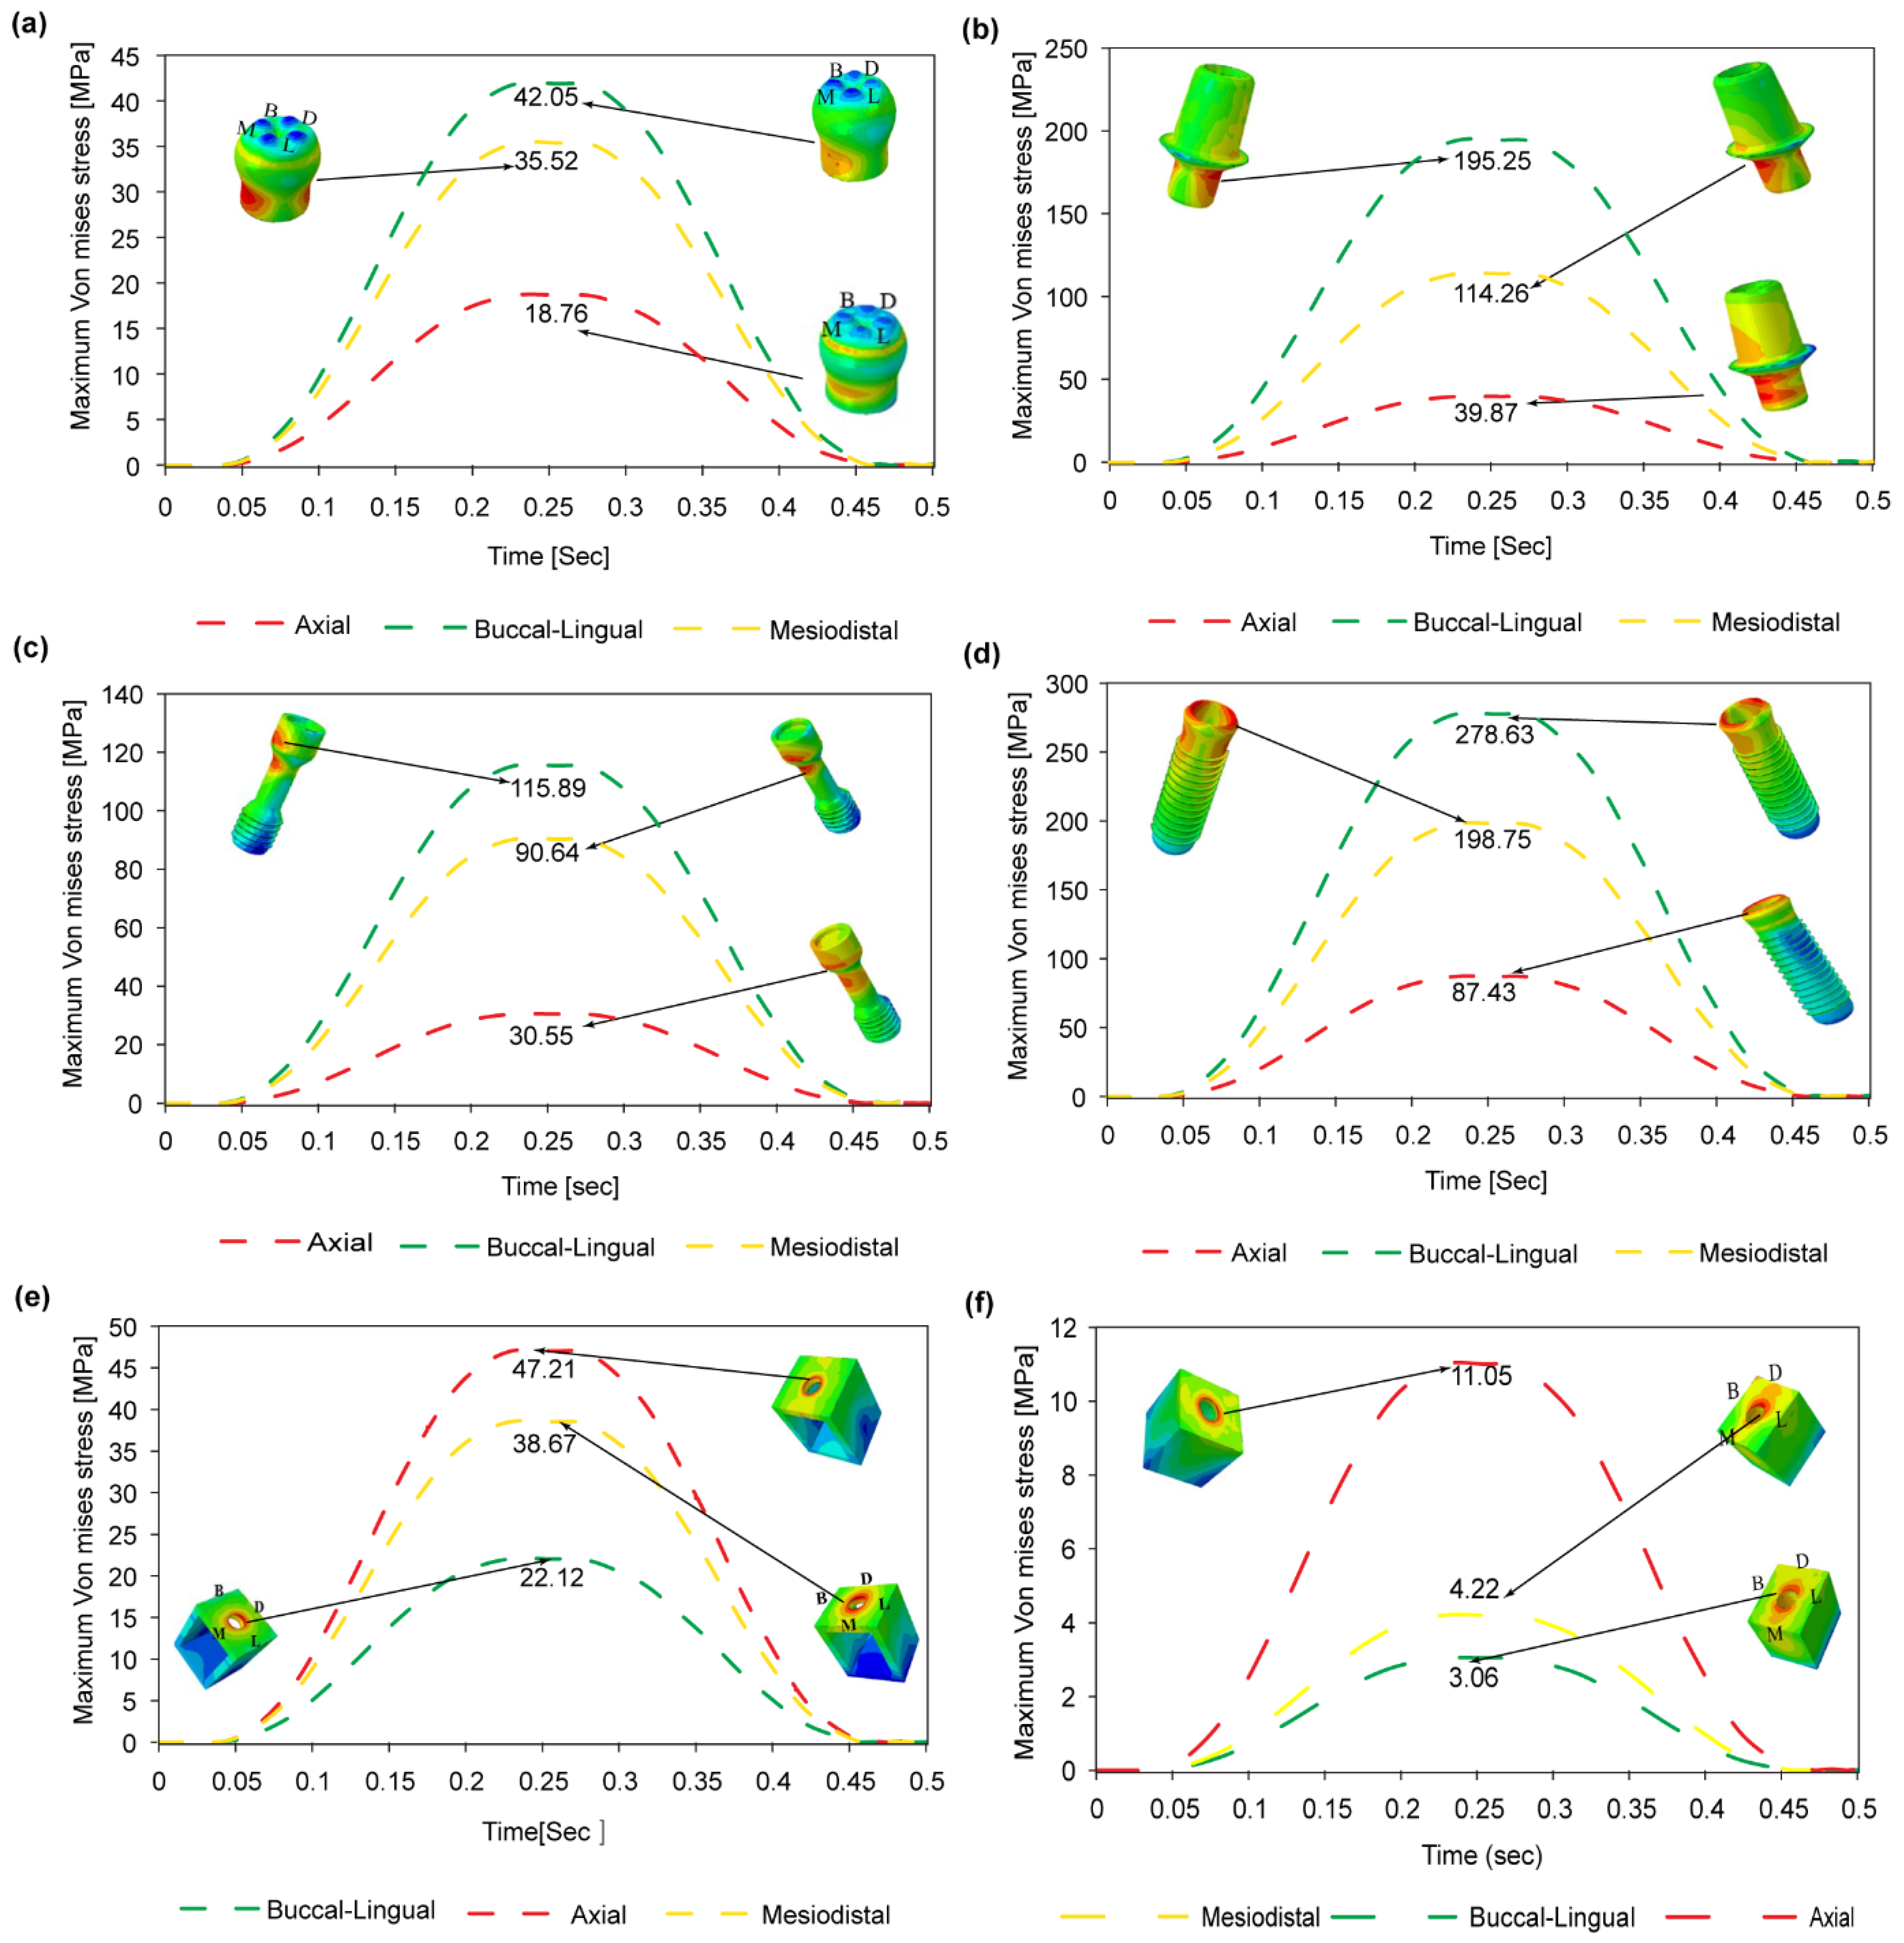
It has been shown that for all five thread design models, the von Mises stress, shear stress, compressive stress, and displacement all increase significantly under a dynamic load compared to a static or quasi-static load. However, little difference has been observed in the stress response of the implant under static and quasi-static loads, respectively. In general, the results have shown that the maximum stress is concentrated in the contact areas of the implant-bone models, e.g., at the abutment-screw, abutment-implant, and bone-implant interfaces (see Figure 7 and 
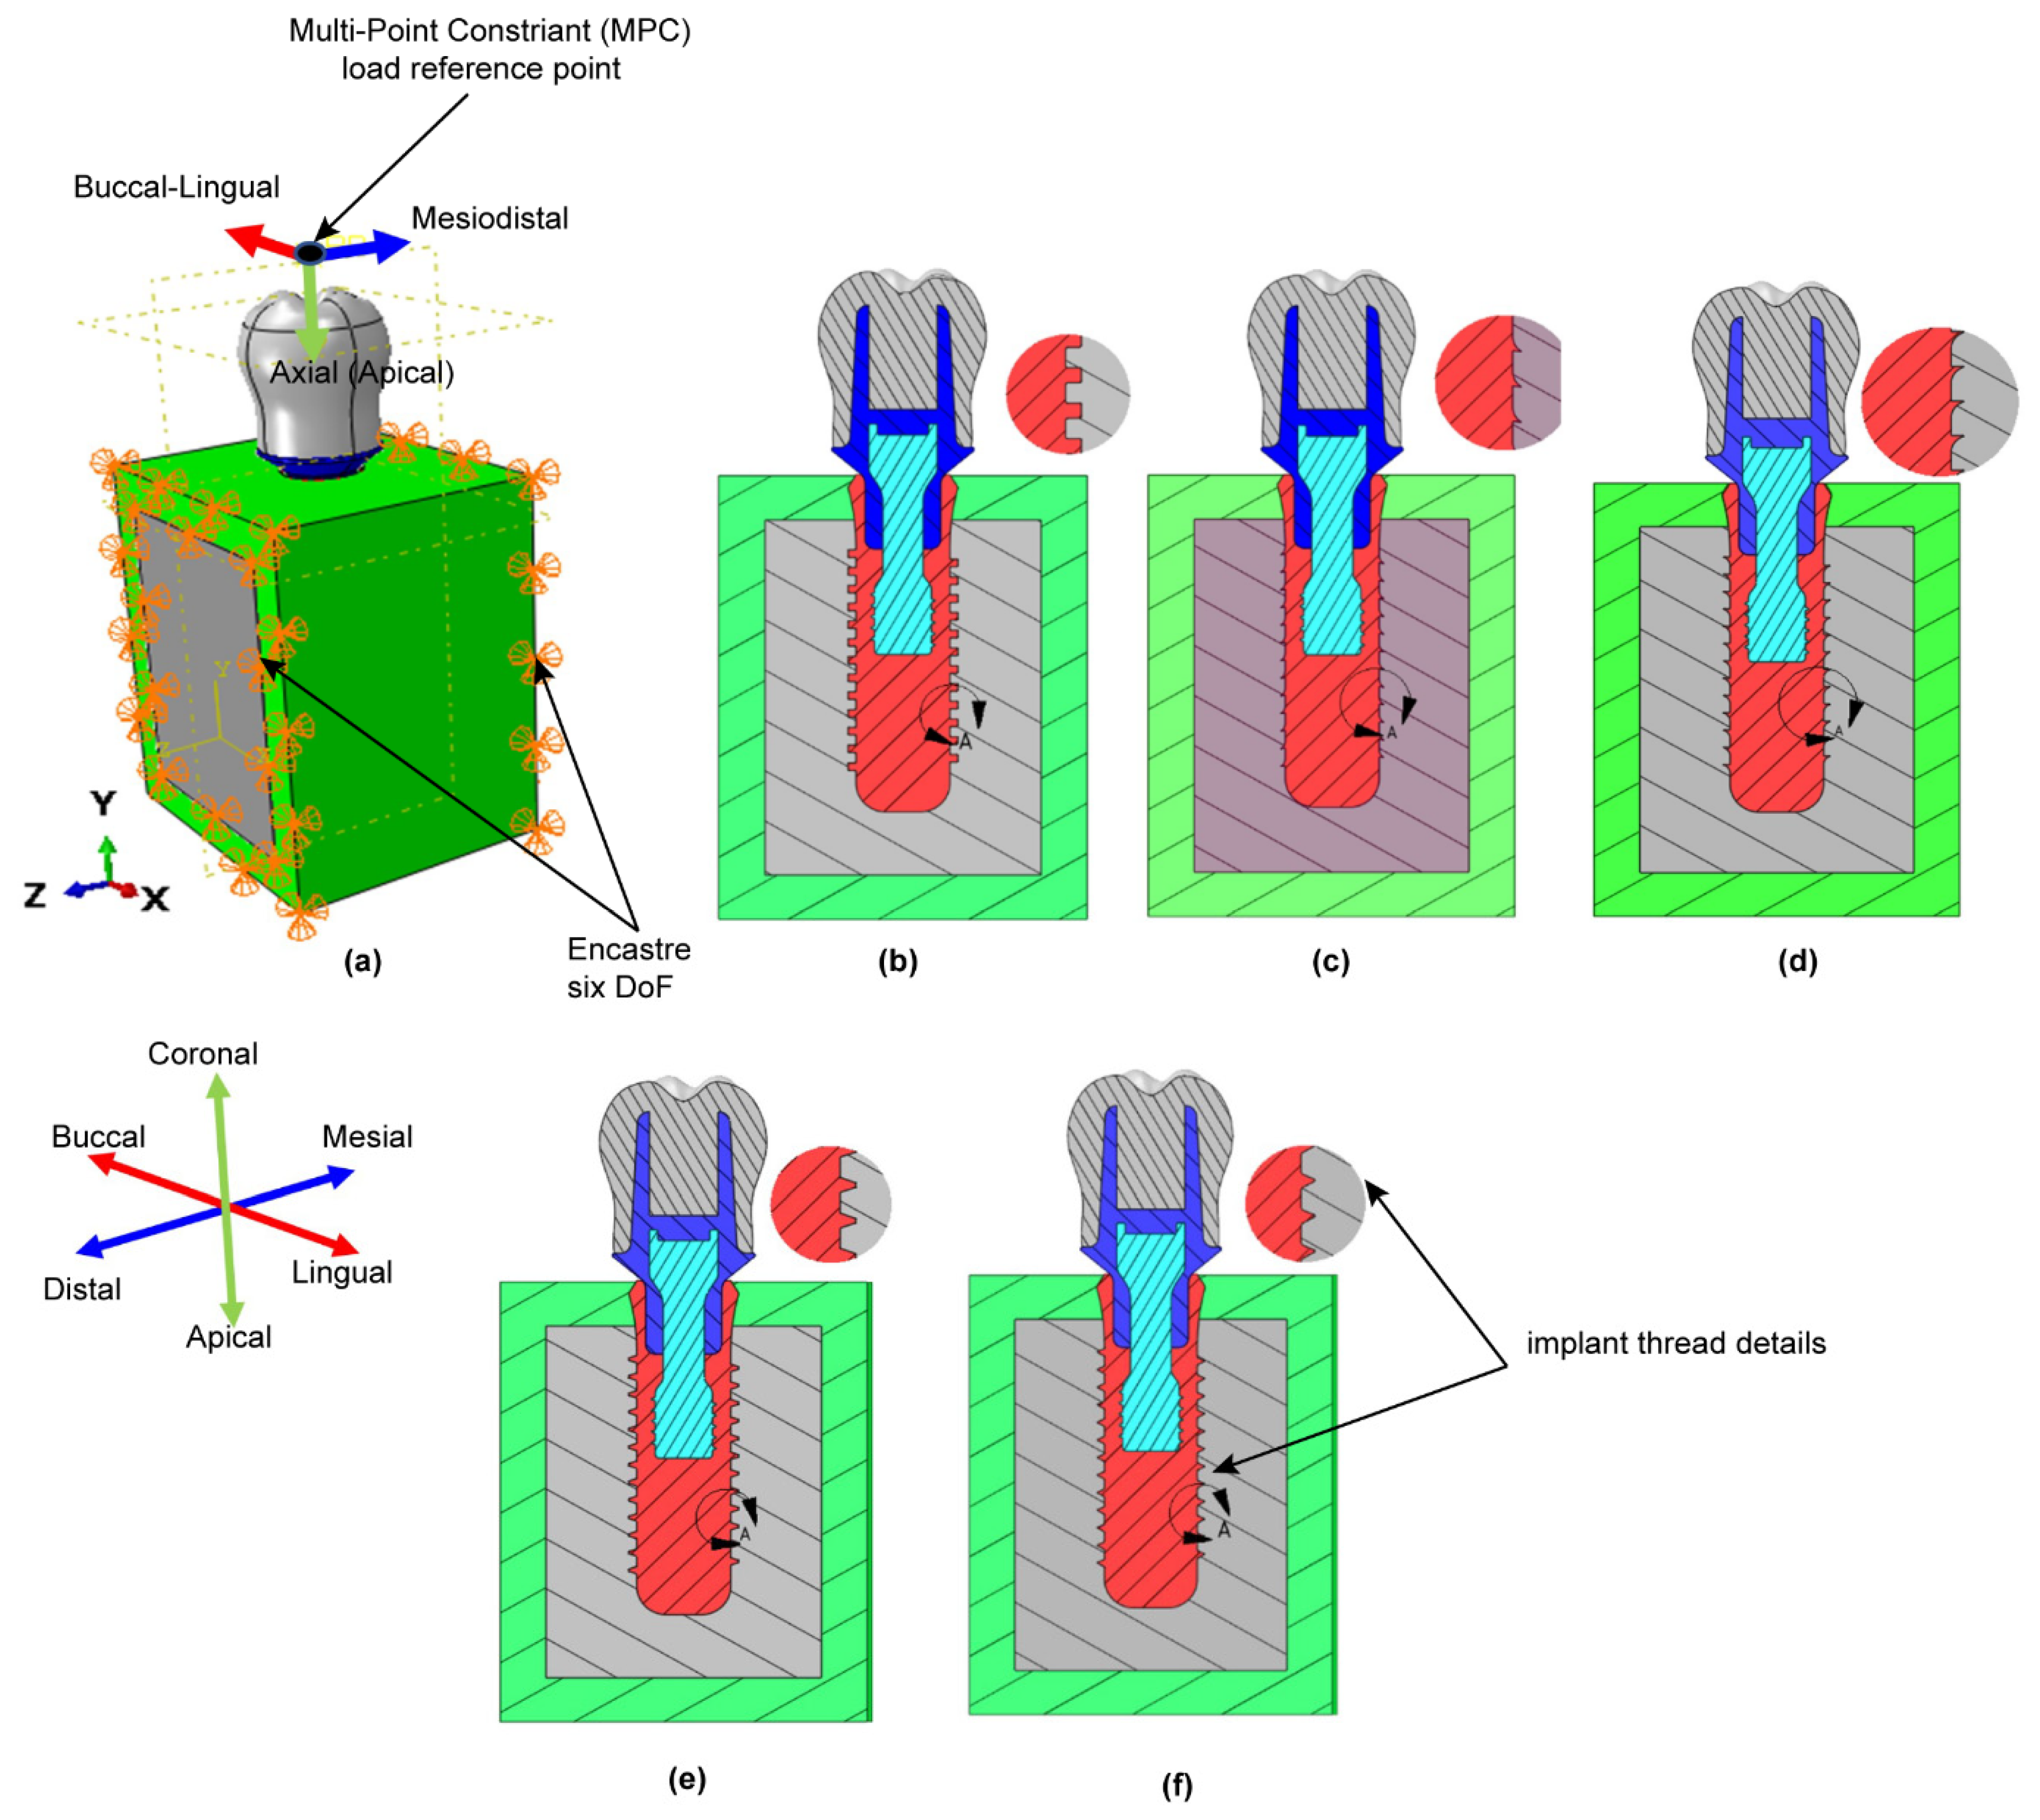
Figure 9). Accordingly, for all thread designs, there is a risk of micromotion, which may cause screw loosening, crestal bone loss, and implant fracture. The present results have shown that, under dynamic loading, the maximum von Mises stress in the prosthetic components is higher under buccal-lingual loading than under axial or mesiodistal loading (see Figure 7a–d). By contrast, in the cortical and spongy bone regions, the maximum von Mises stress is produced under axial compressive loading (see Figure 7e,f). In the case of trabecular bone, its yield strength threshold is exceeded under dynamic stress in the axial direction. This increase indicates that trabecular tissue yield strength is higher in compression than in tension. This could result in bone resorption and mineral redistribution to help with bone remodeling. Due to higher stress carrying in the implant, followed by cortical bone, the Von Mises stress is lower in spongy bone for all loading rates.
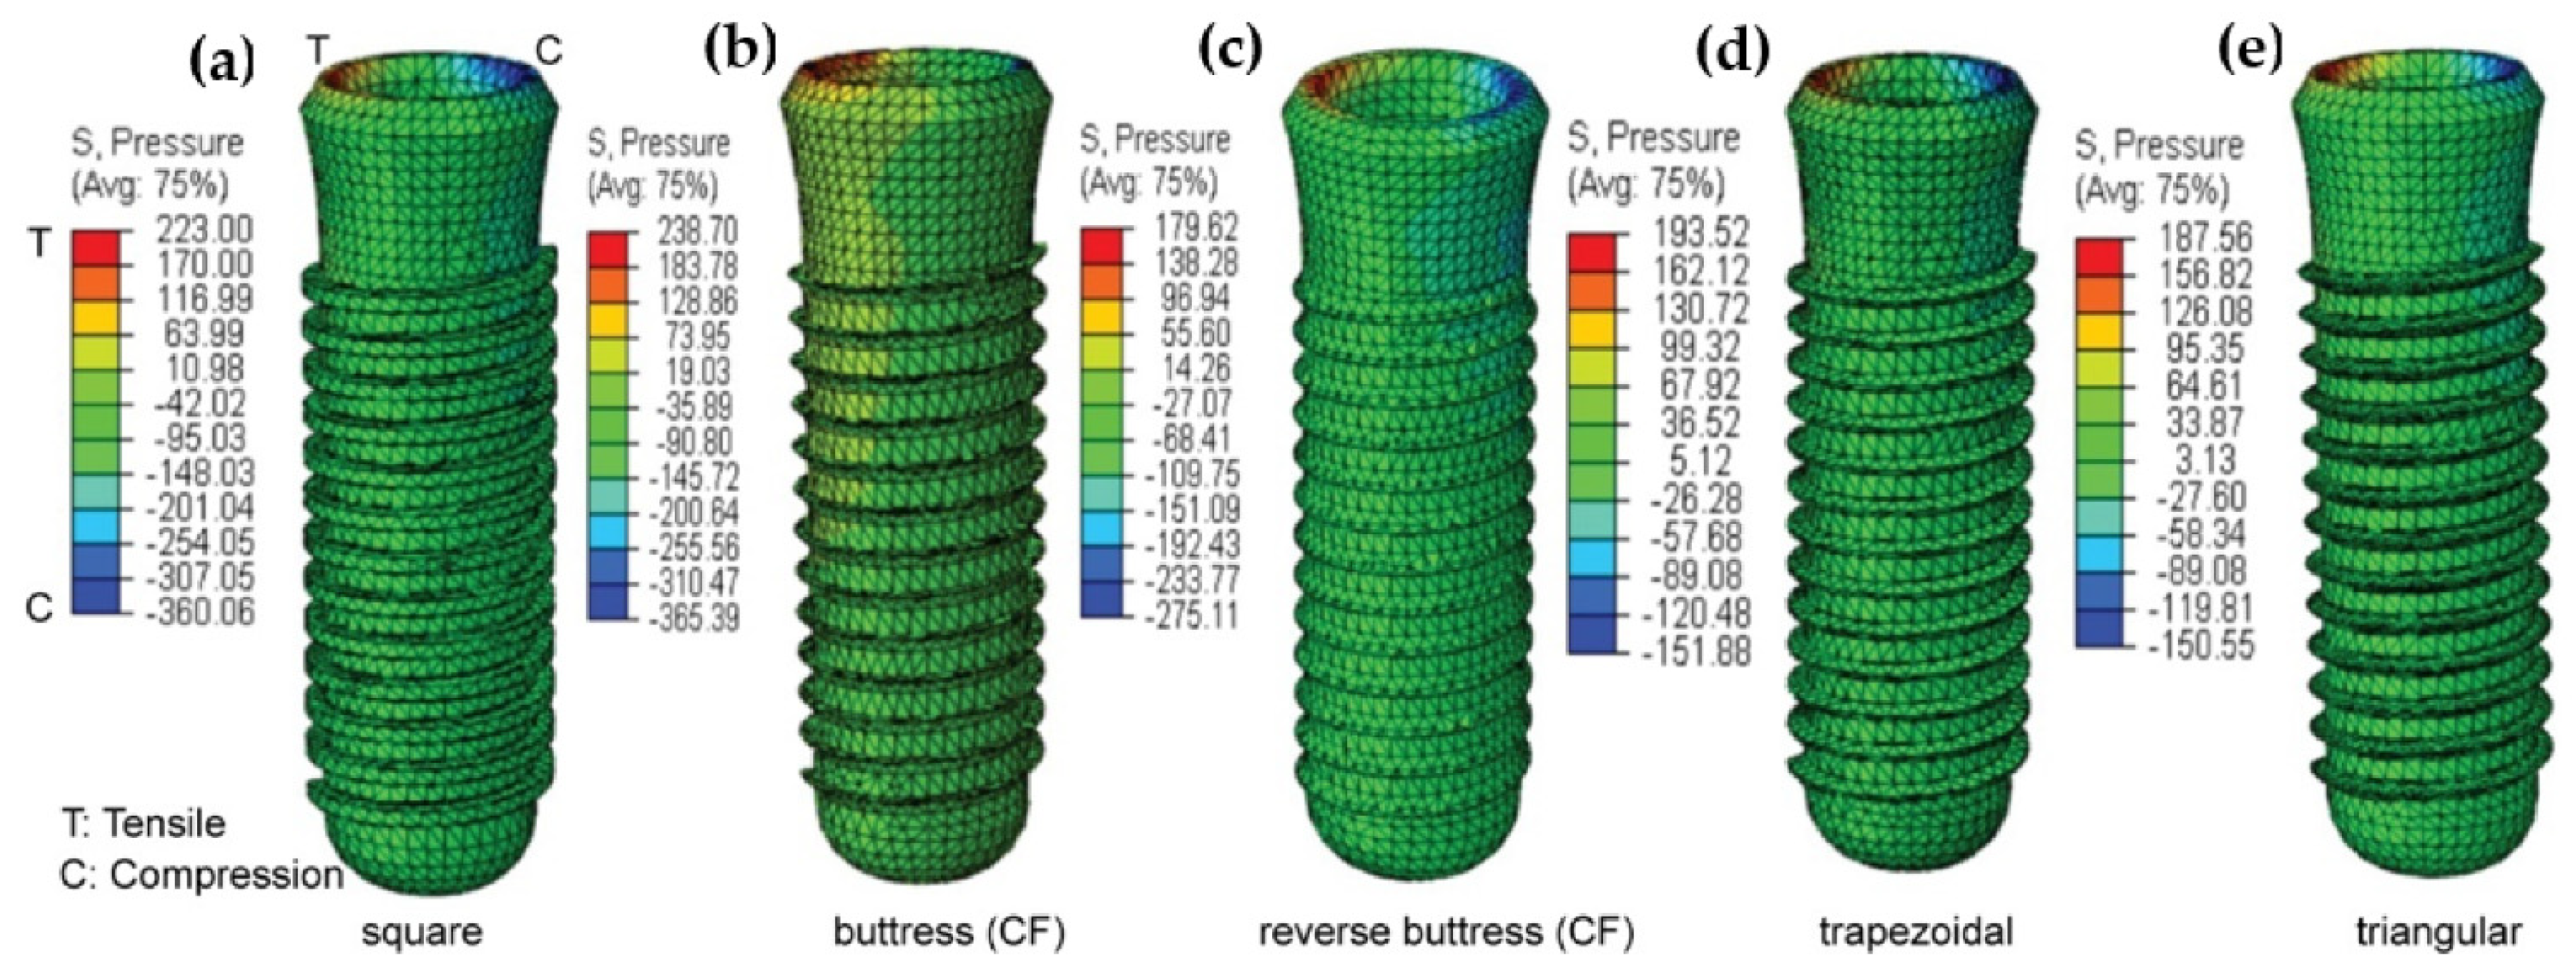
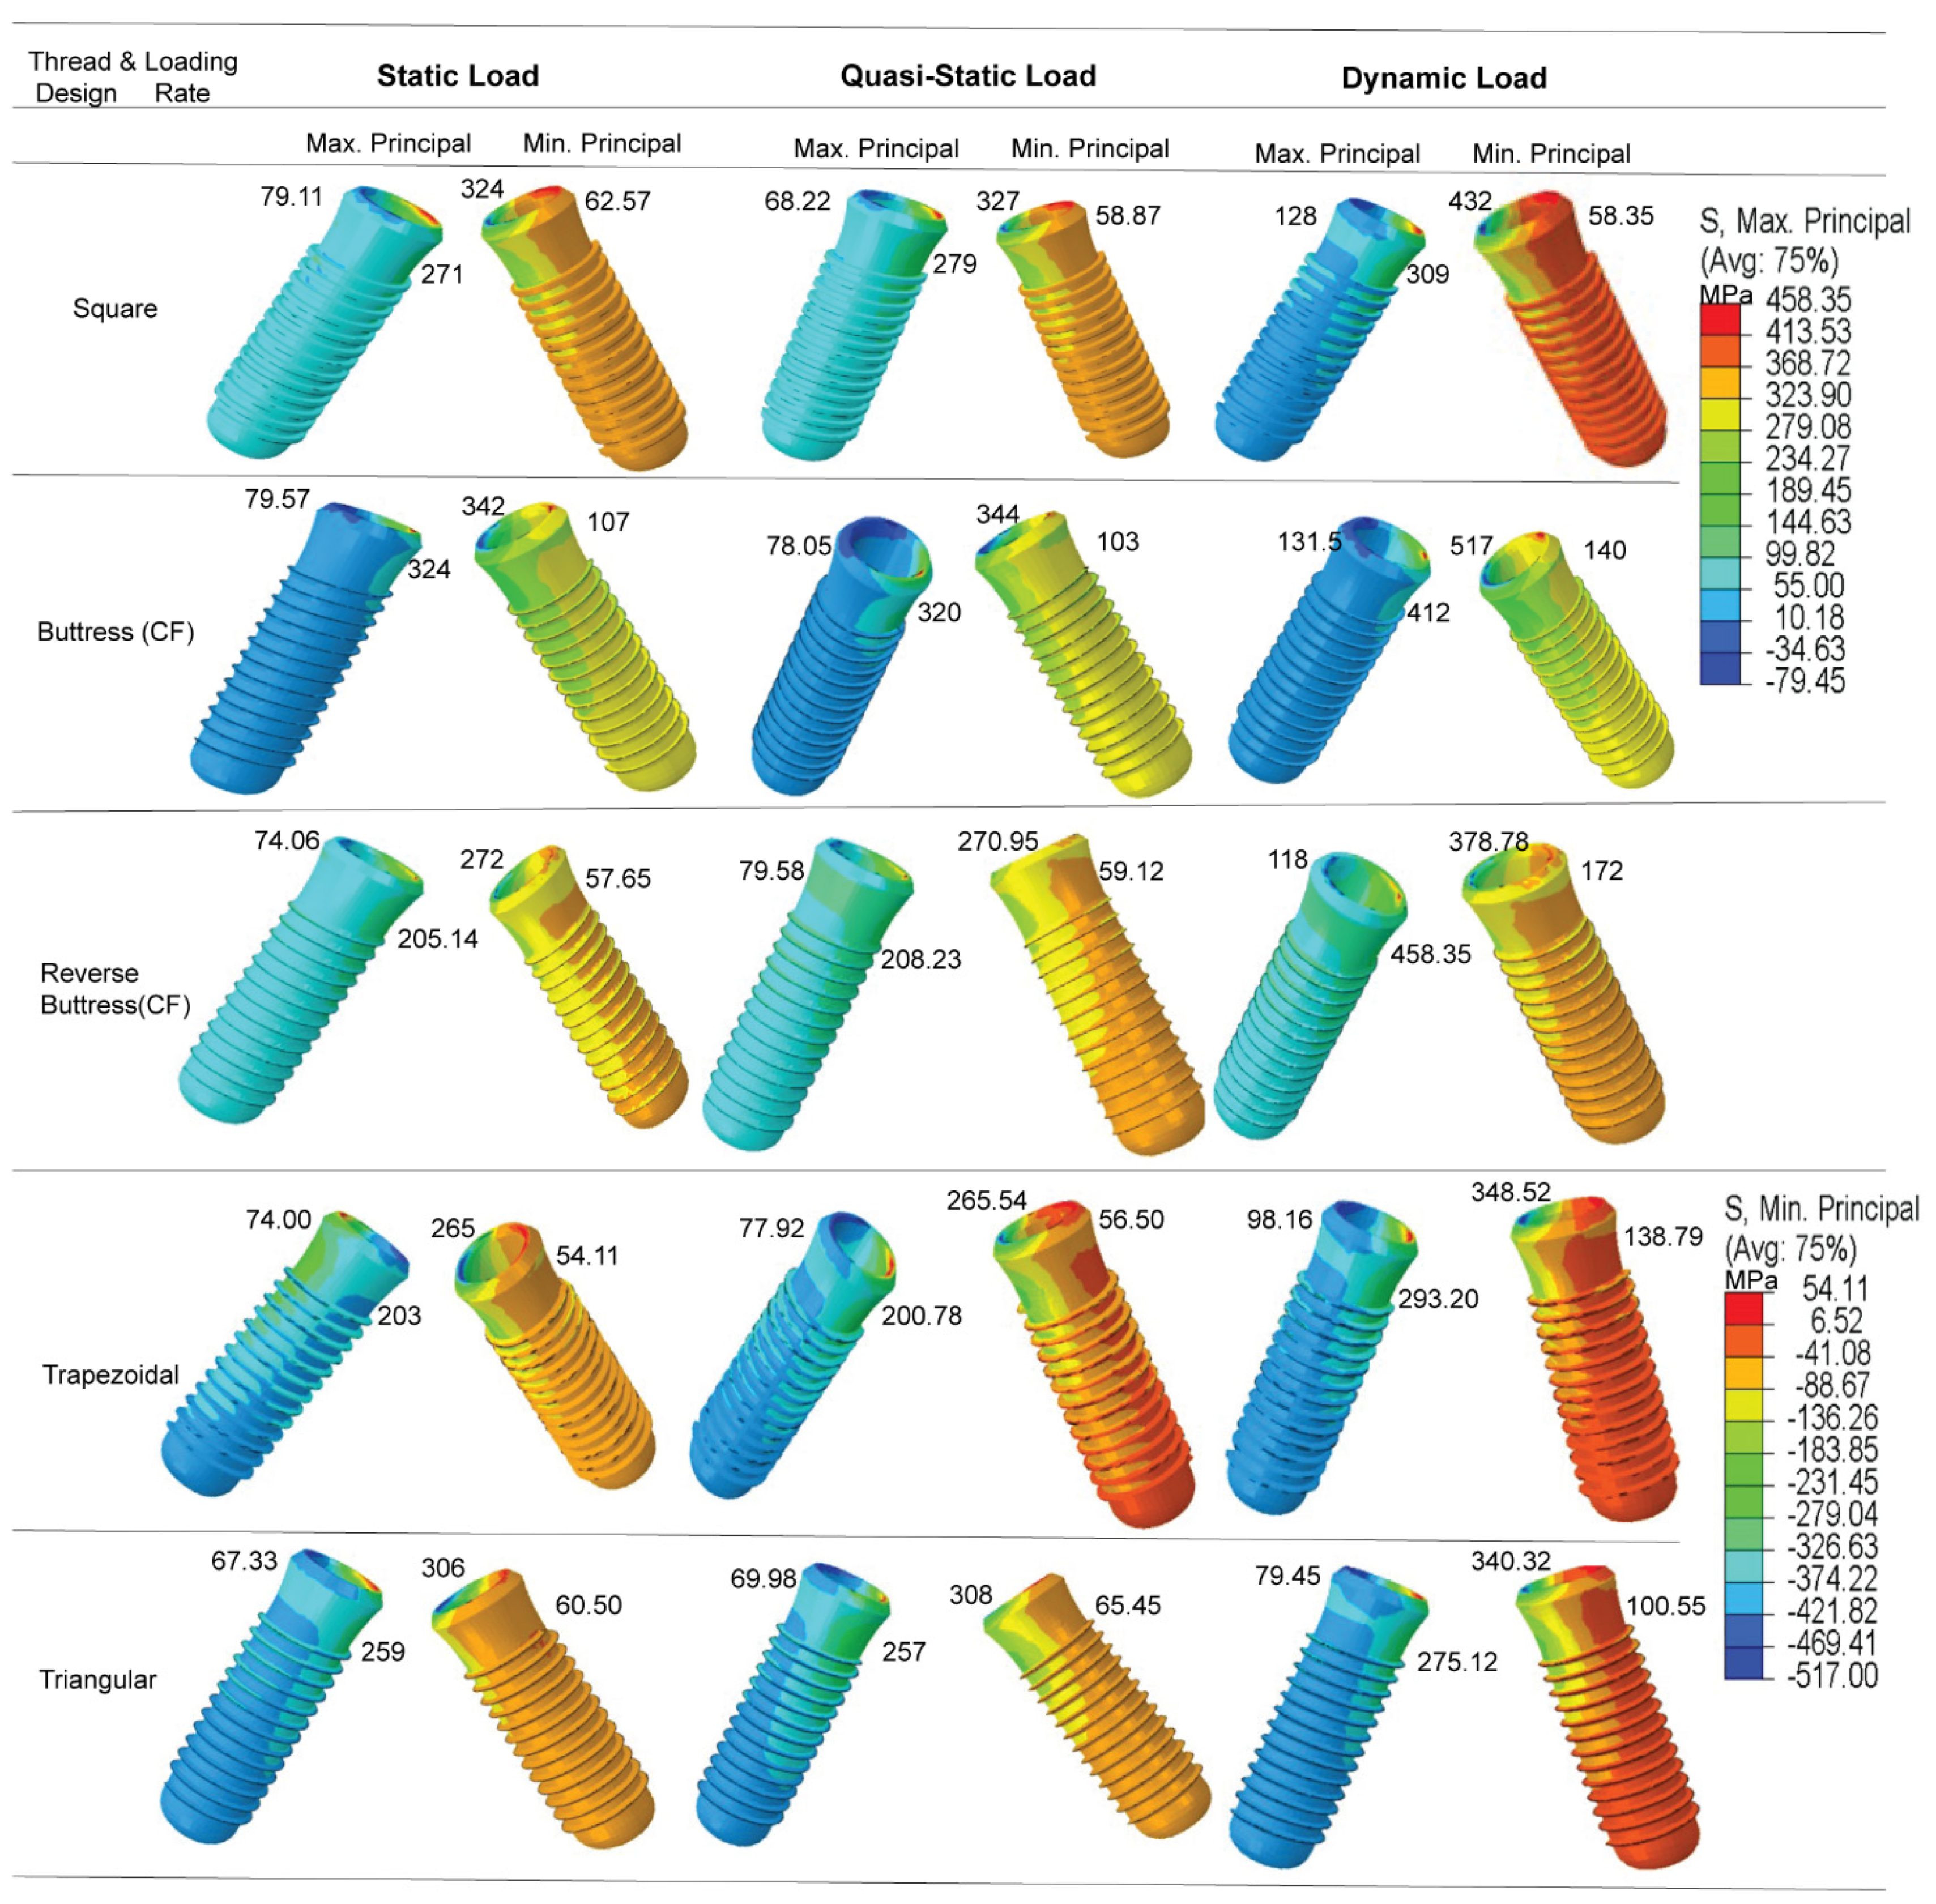
The results presented in Figure 9b have shown that the maximum principal stress is concentrated in the first thread of the implant in the tip bevel region where it contacts the crestal part of the cortical bone. This prediction is consistent with the findings of Sun et al. [72] that the abutment screw commonly breaks at the first thread and the implant breaks in the neck region. The simulation results obtained for the maximum shear stress (Table 6) have shown no significant differences in the stress response behaviors of the five thread models under static loads and quasi-static loads, respectively. However, for each model, the stress increases significantly under dynamic loading. When all implant models were considered, it increased by 30–60% (see Table 4 and Figure 9c). This is extremely important because it implies that such cyclic loading rates must be closely monitored, since they may cause implant and bone fatigue and fracture. Many previous studies have reported that dynamic loading can have a greater effect on the implant success rate than static loading. For example, Yagihara et al. [65] found that the attachment strength was significantly improved following the application of a dynamic load for four weeks compared to that obtained under a static load after four or eight weeks. Likewise, Duyck et al. [73] reported that under dynamic stress situations, peri-implant bone resorption performance in rabbit tibias was significantly better than it was under static load scenarios.
Furthermore, previous studies have generally considered only a static masticatory load, [37,74,75,76,77,78,79,80,81,82]. However, in addition to static load, the current study considered quasi-static and dynamic loading rates. As a result, this research yields better results and a more reliable conclusion. This also reveals that dynamic loading considerably increases stress in all five models and cortical bone, potentially leading to bone fatigue and fracture. The results obtained in the present study have shown that the application of dynamic loading can increase the stress of dental implants and cortical bone by as much as 30–60% compared to static loading (see Table 4 and Figure 9c). This percentage increment is obtained when considering all the five implant models. And most importantly, including buttress and reverse buttress implants with CF thread profiles. Kayabaşi et al. [51] considered only a single dental thread design (reverse buttress), whereas the present study has considered five different models. The present results have shown that while dynamic loading yields an effective increase in the compressive stress in the implant and bone region and is therefore beneficial in improving the implant success rate, the thread design should be carefully chosen to avoid failure in the first thread region of the implant.
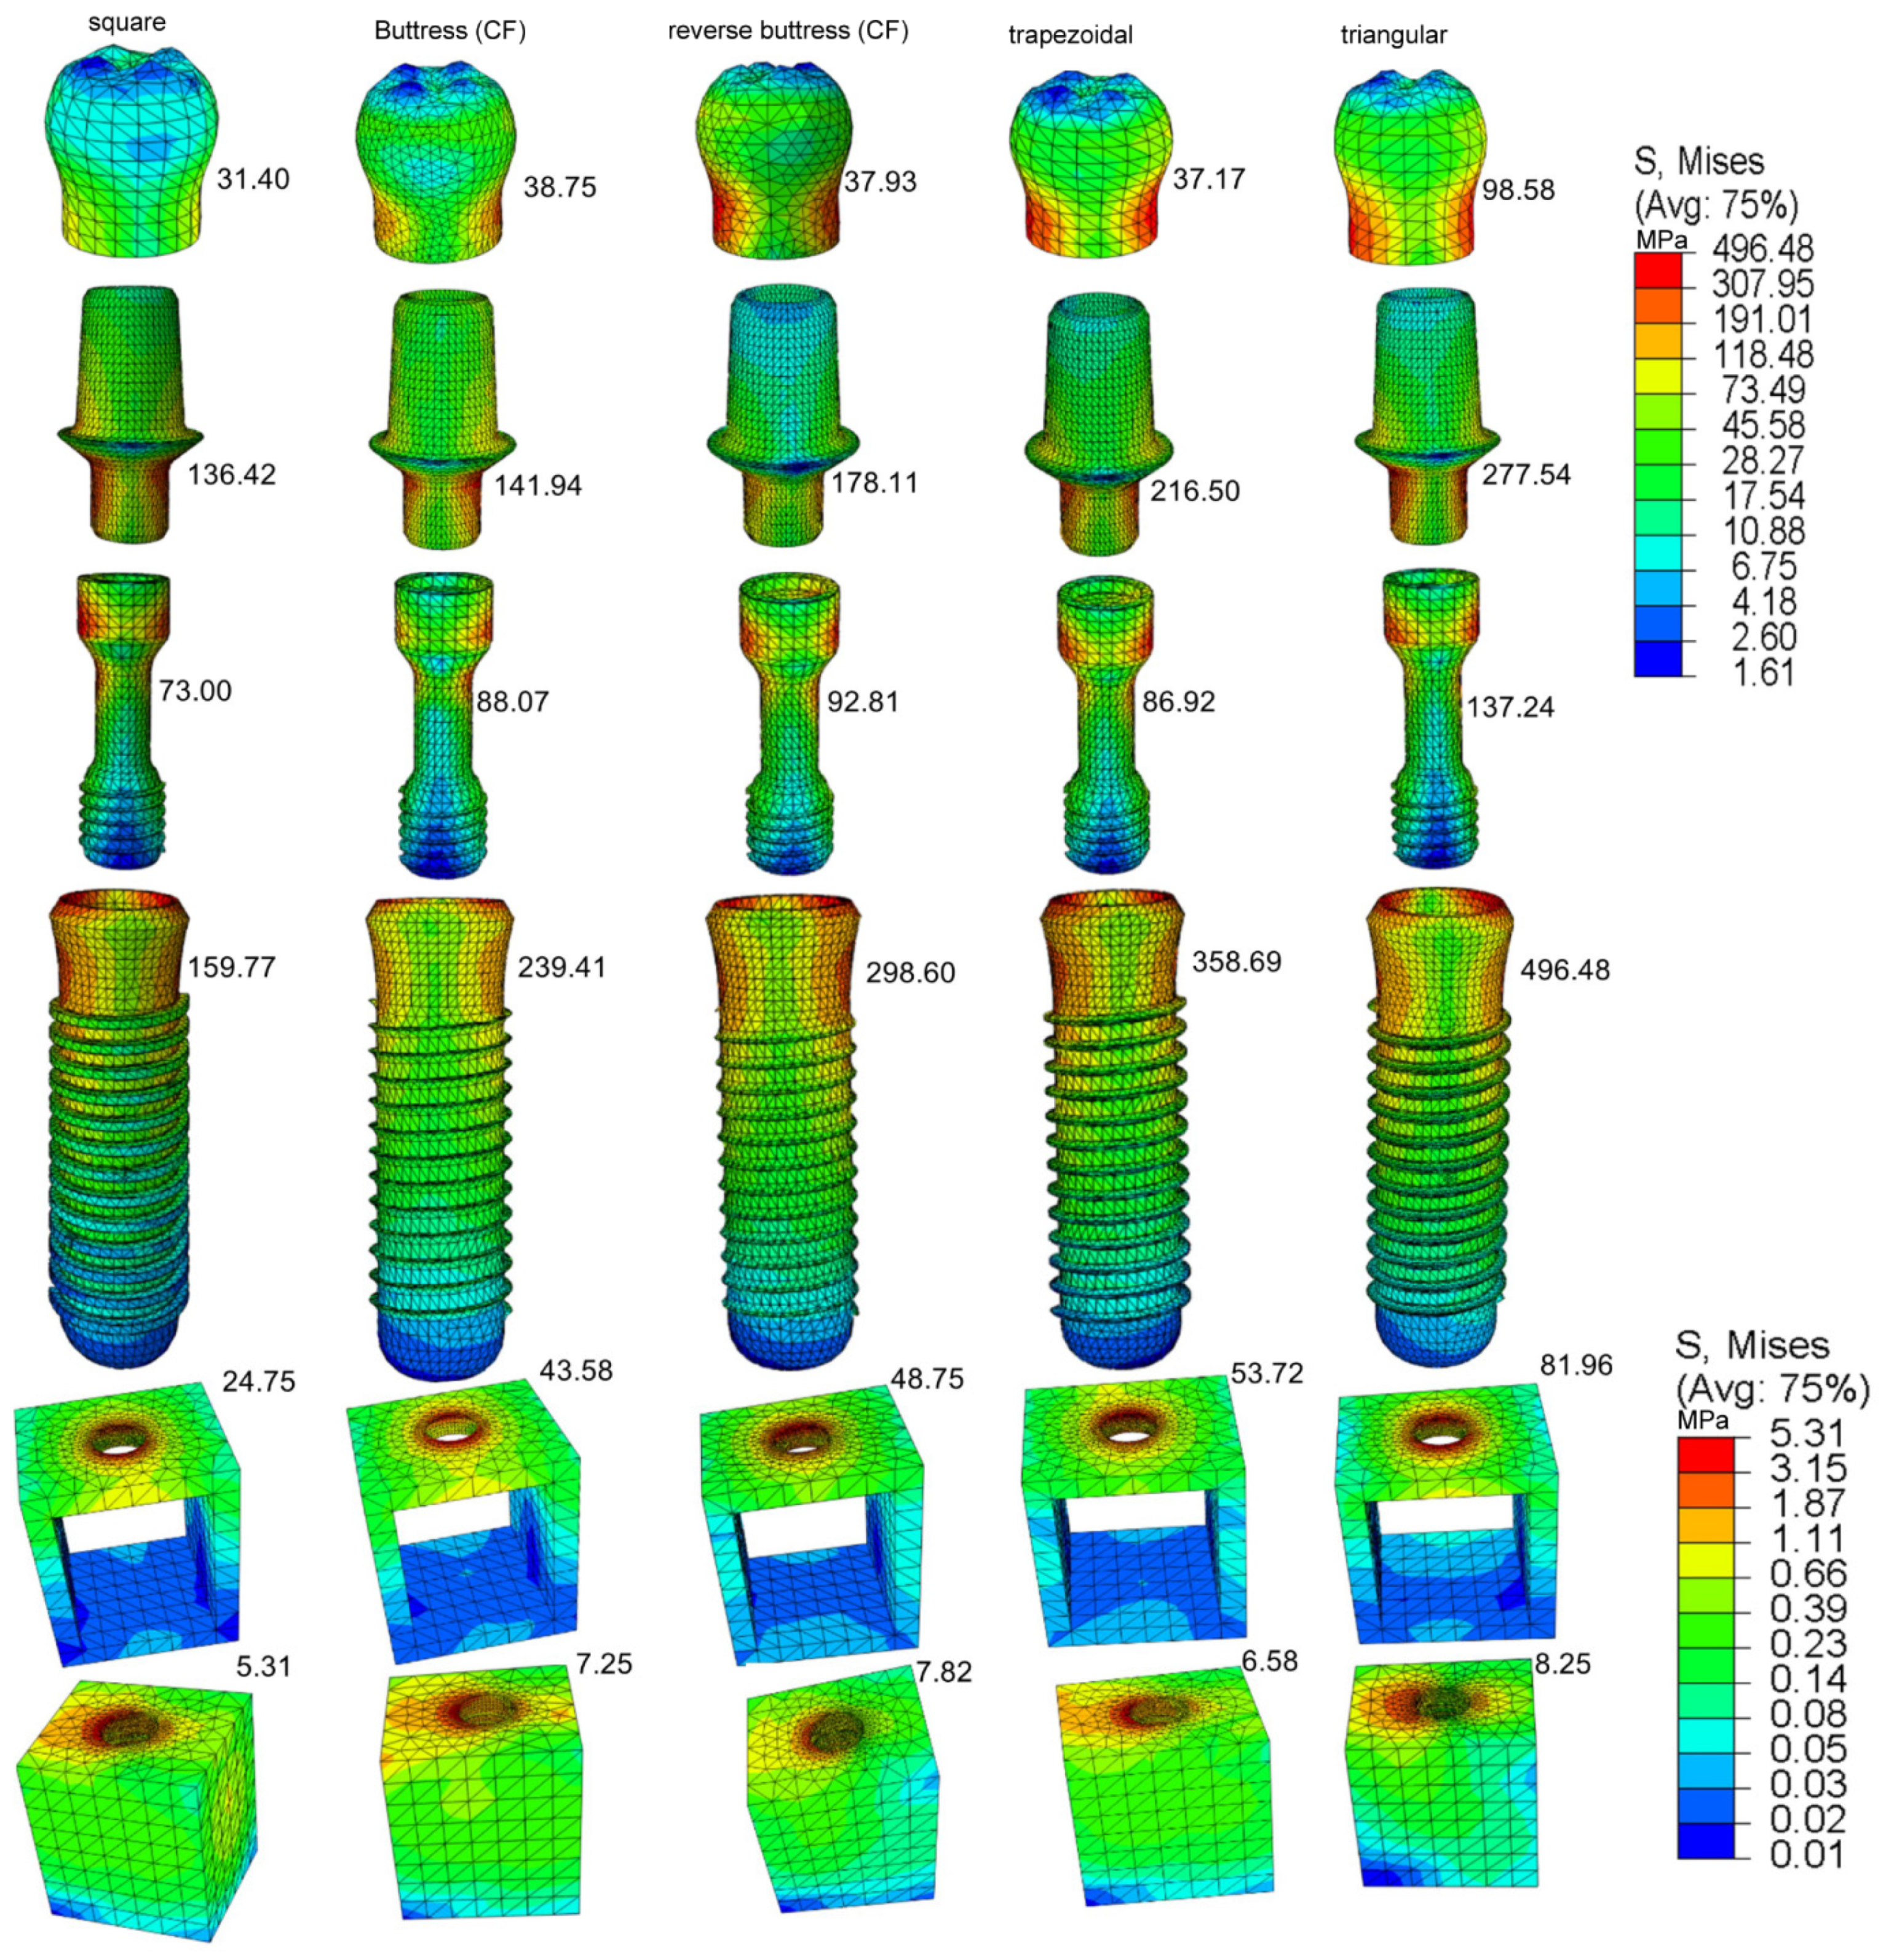
The FEA results obtained in the present study have shown that, for all the loading rates and thread designs, the maximum von Mises stress is concentrated in the implant region of the prosthetic (see Table 4 and Figure 9c). As a result, the minimum stress is transferred to the bone, and the uniformity of the stress distribution within the bone is improved. The present results are thus in good general agreement with those of previous studies [37,51,83,84,85,86]. However, most previous studies did not consider the crown and abutment screw components of the prosthetic [37,83,85,86], and hence, the clinical application of the FEA findings is somewhat limited. Adding the mechanical retaining screw and occlusal surface enhanced the reliability of the result from FEM and mimicking the clinical situation during mastication load is applied by the patient.
The present results have shown that the implant thread design affects both the magnitude and the distribution of the stress induced in the cortical bone under all three loading rates (see Table 4 and Figure 9c). They are thus in good agreement with the findings of Hansson and Werke [52]. In particular, the results have shown that for the buttress and reverse buttress thread models, the application of curved flanks reduces the maximum von Mises stress by up to 50% compared to straight flanks (Table 5), curved flank provides more bone contact area by decreasing the shear stress and tensile stress. Hence, more bone contact area has been proven to offer increased initial stability and stress resistance [
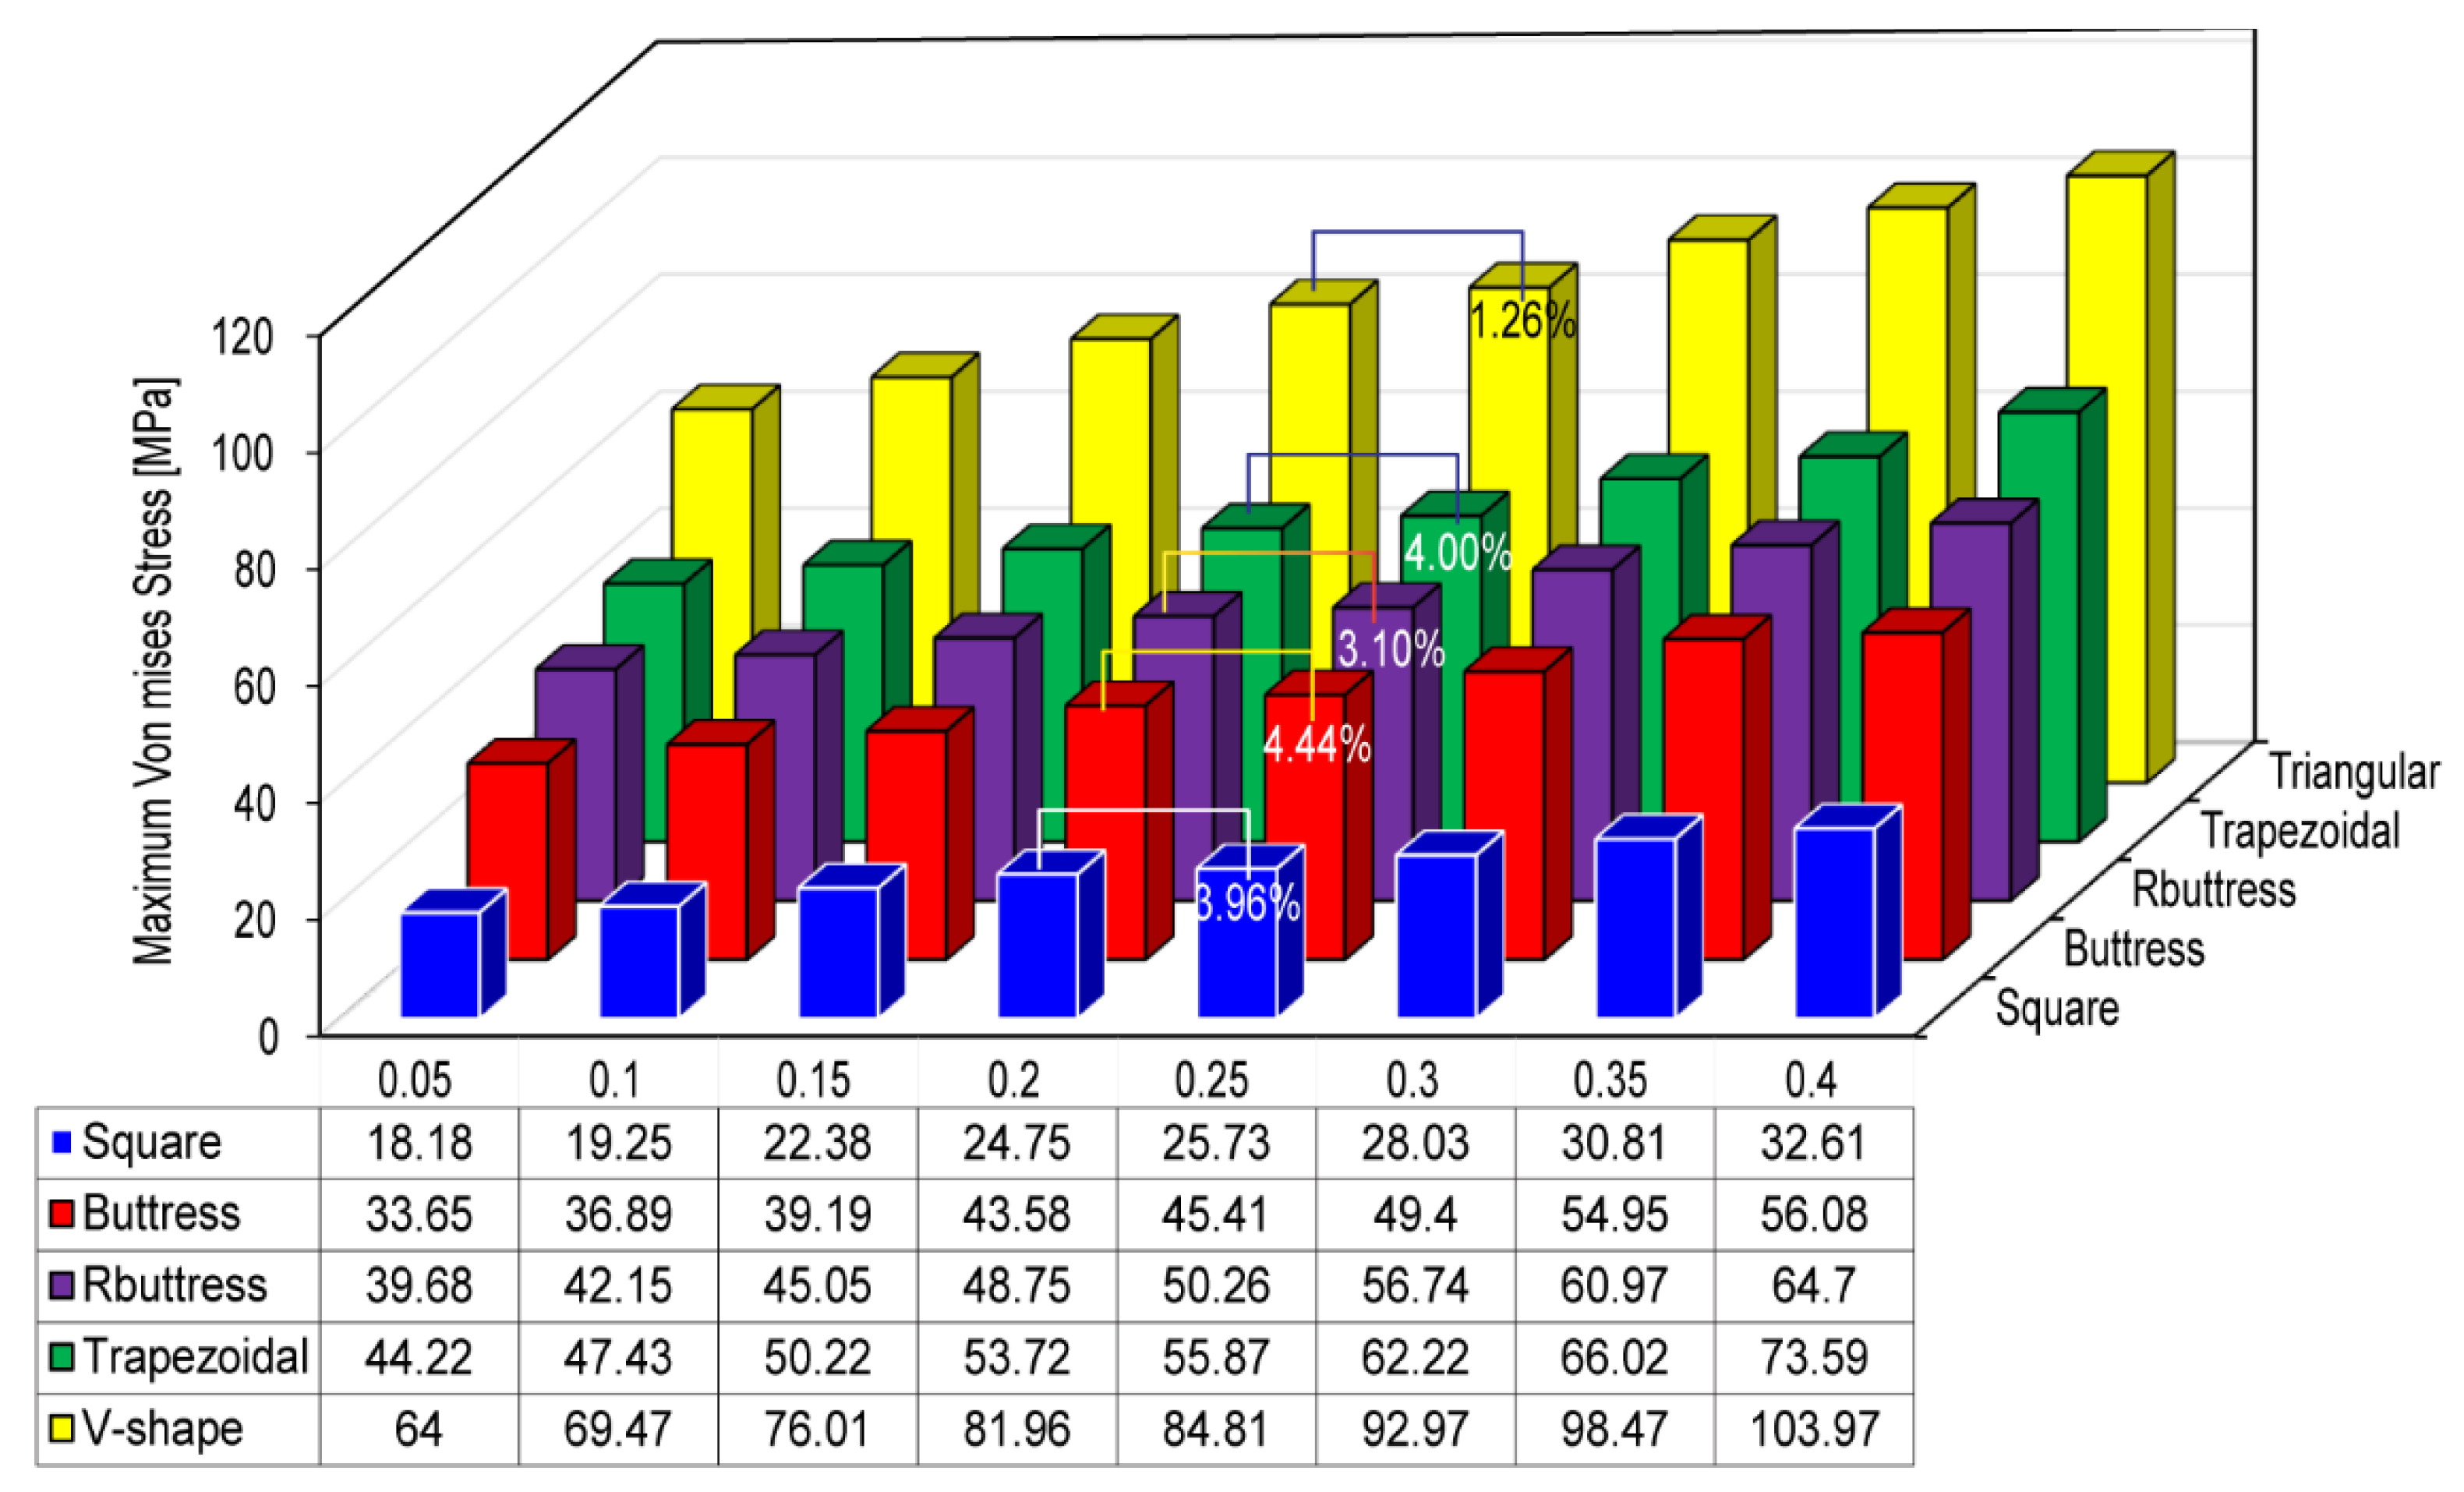
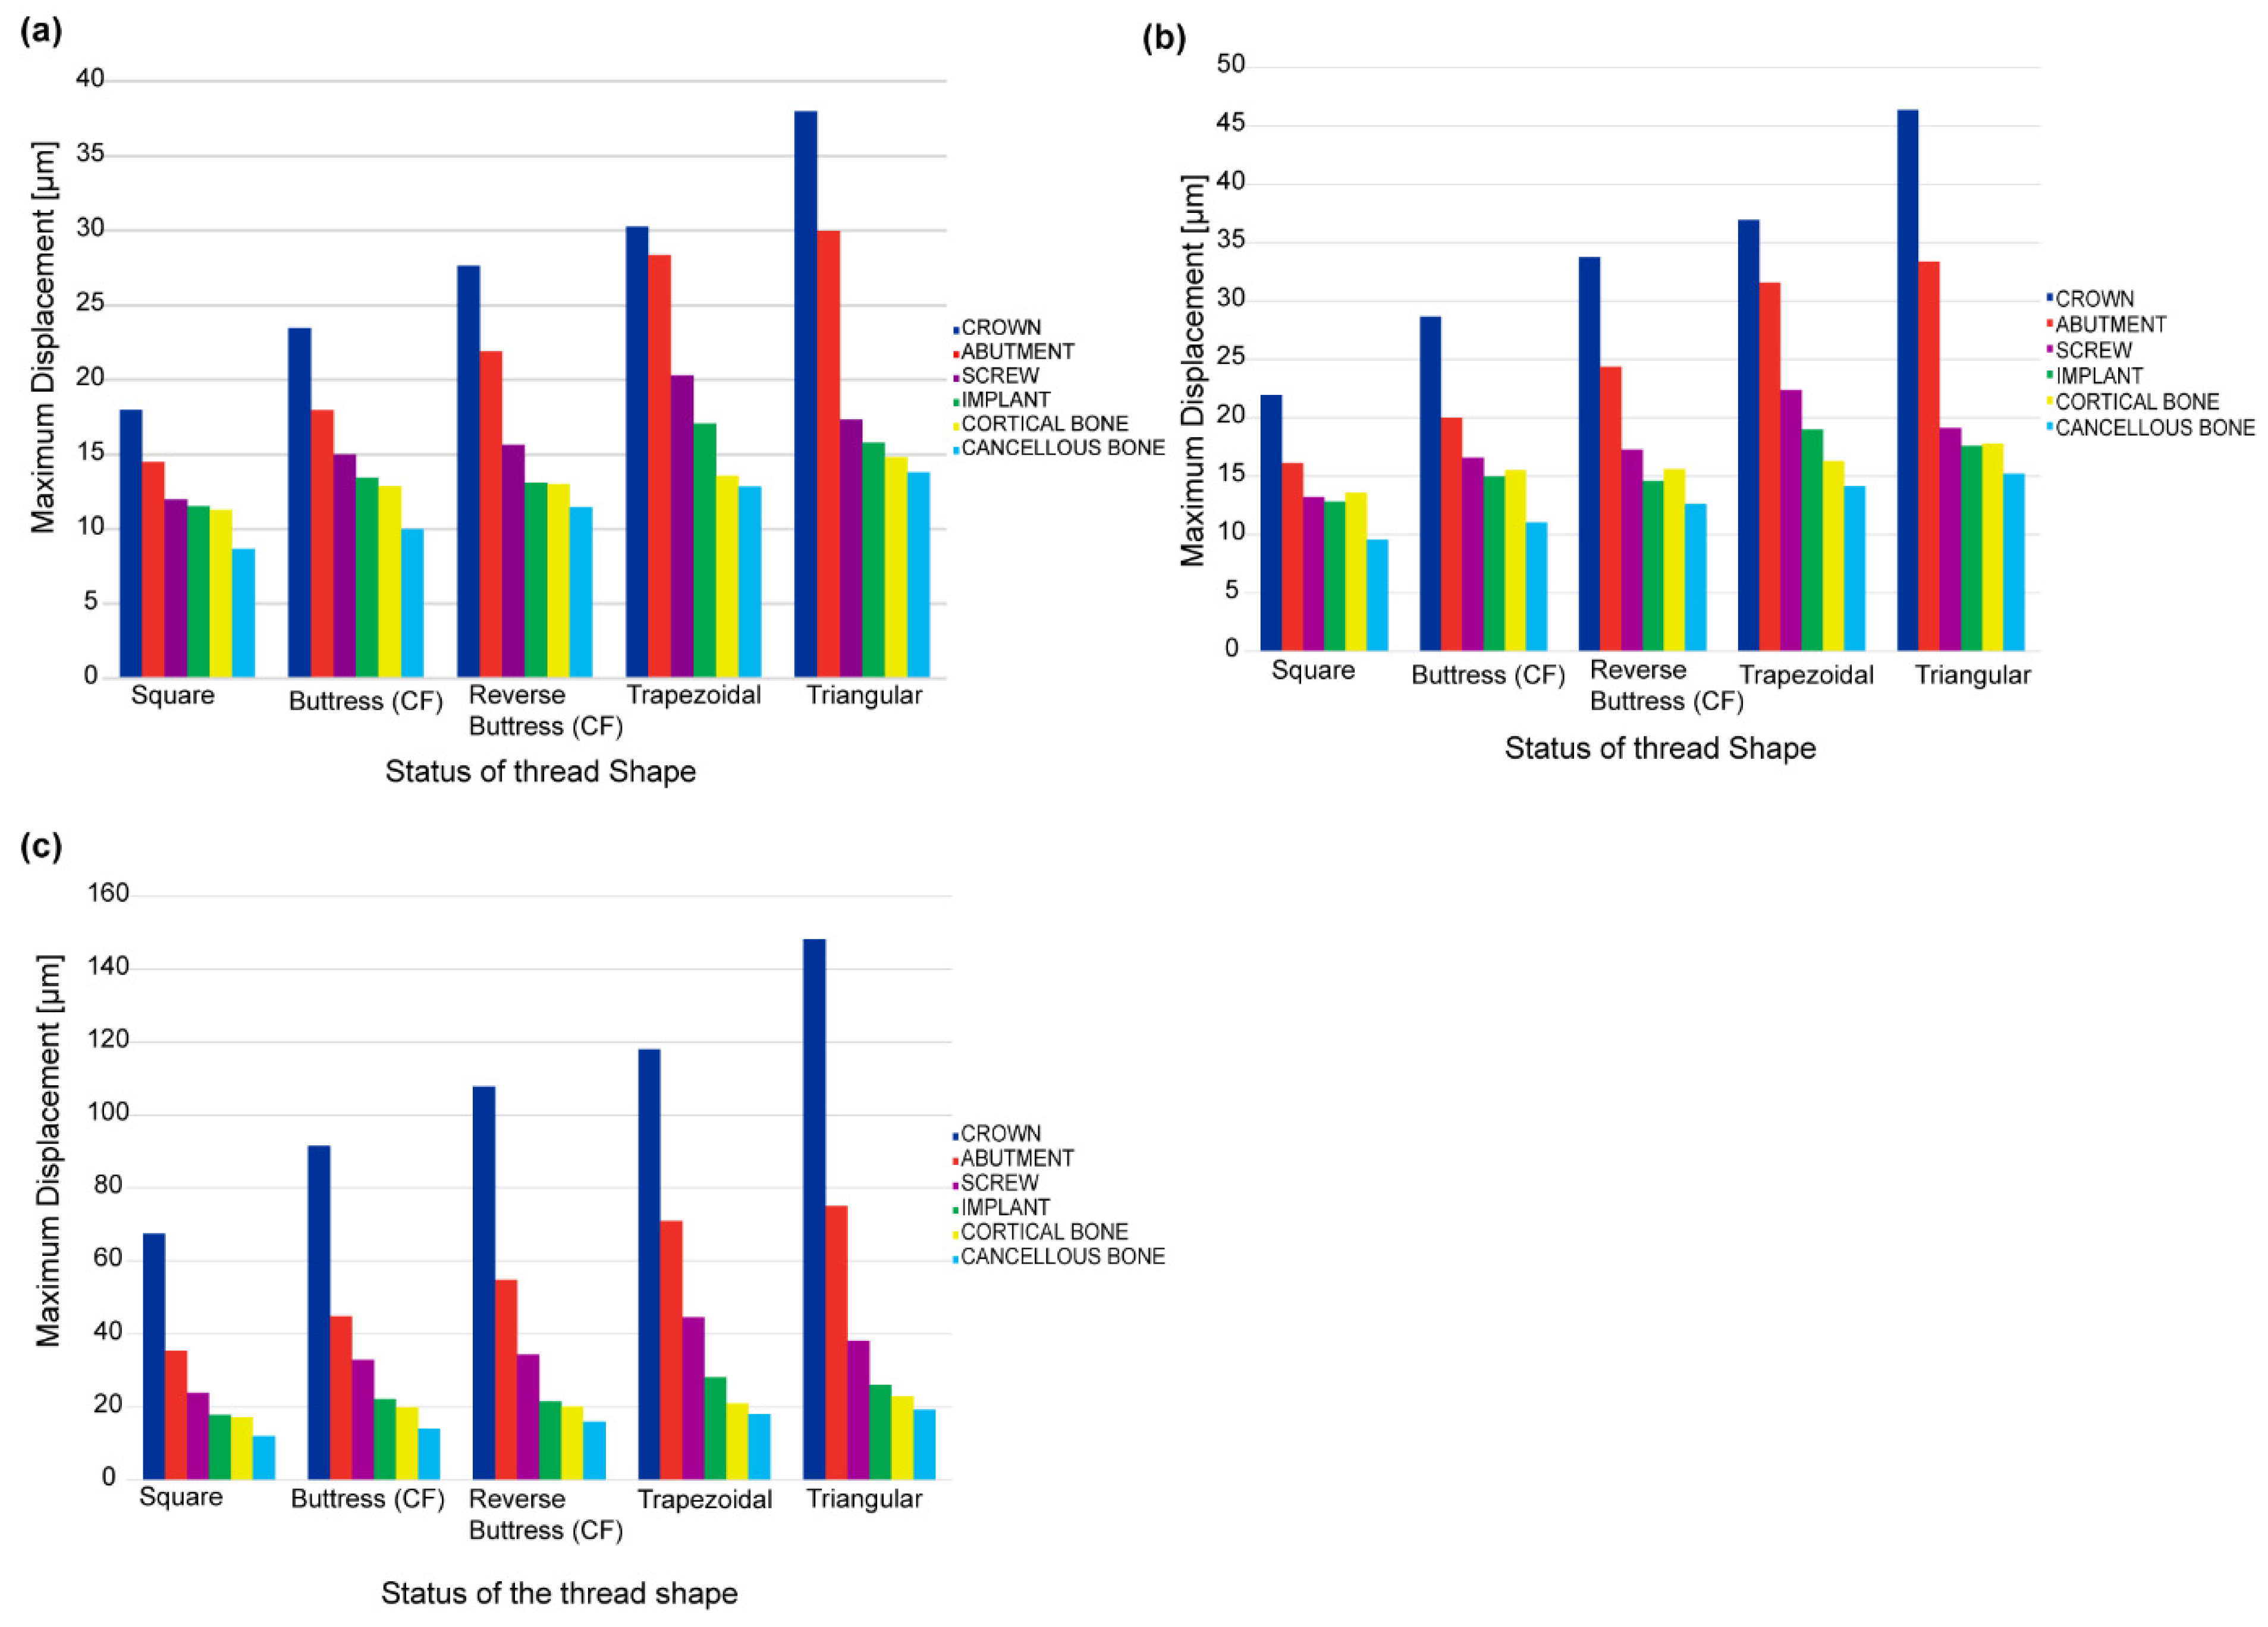
87]. Among the various thread designs considered in the present study, the square thread design results in the lowest von Mises stress, shear stress, and displacement, and the highest compressive stress (see Figure 8 and Figure 9b, Table 4 and Table 6). In general, the masticatory load acting on the crown occlusal surface results in three different stresses, namely tensile, compressive, and shear. Tensile stresses tend to pull objects apart, and if it becomes more than the yield strength, it may cause failure in implant and bone loss, while shear forces promote sliding. By contrast, compressive stresses maintain the integrity of the bone-implant interface. Furthermore, cortical bone is the strongest in compression and the weakest in shear [88]. Thus, the present results suggest that the square thread design, which enhances the compressive stress, is the most suitable for dental implant applications. However, the buttress and reverse buttress designs with curved flanks also reduce the tensile and shear stress, while also promoting compressive stress (see Figure 9 and Table 5). Consequently, the buttress thread designs with curved flanks also represent a favorable design for dental implants. Furthermore, for each design, the maximum displacement, von Mises stress, and shear stress are significantly lower in the spongy bone region than in the cortical bone region (see Figure 8 and Figure 9, and Table 6).
The other factor that directly affects the biomechanical behavior of dental implants is a bone material property. Unlike this study, most previous studies considered bone as an isotropic model. Martins et al. designed 2D computational axisymmetric models of isotropic bone implants and used varied thread profile shapes to anticipate the effect of material stiffness in dental implants [16]. However, human bone is appearing to be highly anisotropic and is directional dependent. Consequently, for the case of isotropic bone, the resulting stress and strain from the FEM might not represent the actual stress during clinical service. Anisotropy, according to O’Mahony et al. [89], would increase the already high levels of stress and strain in the cortical crest by 20 to 30% in the isotropic scenario. And further reported, anisotropy increased what were previously minimal levels of interface tensile and radial-hoop shear stresses in cancellous bone by three to four times along the lingual side, exceeding bond strength [89]. And As per Xi et al., percentage increases in maximum stresses of cortical bone surrounding implant in the orthotropic model were up to 13.2 percent higher than those in the functionally isotropic model, but those on the cancellous bone surrounding implant were up to 226.7 percent higher [90]. The findings of this study are consistent with previous research results.
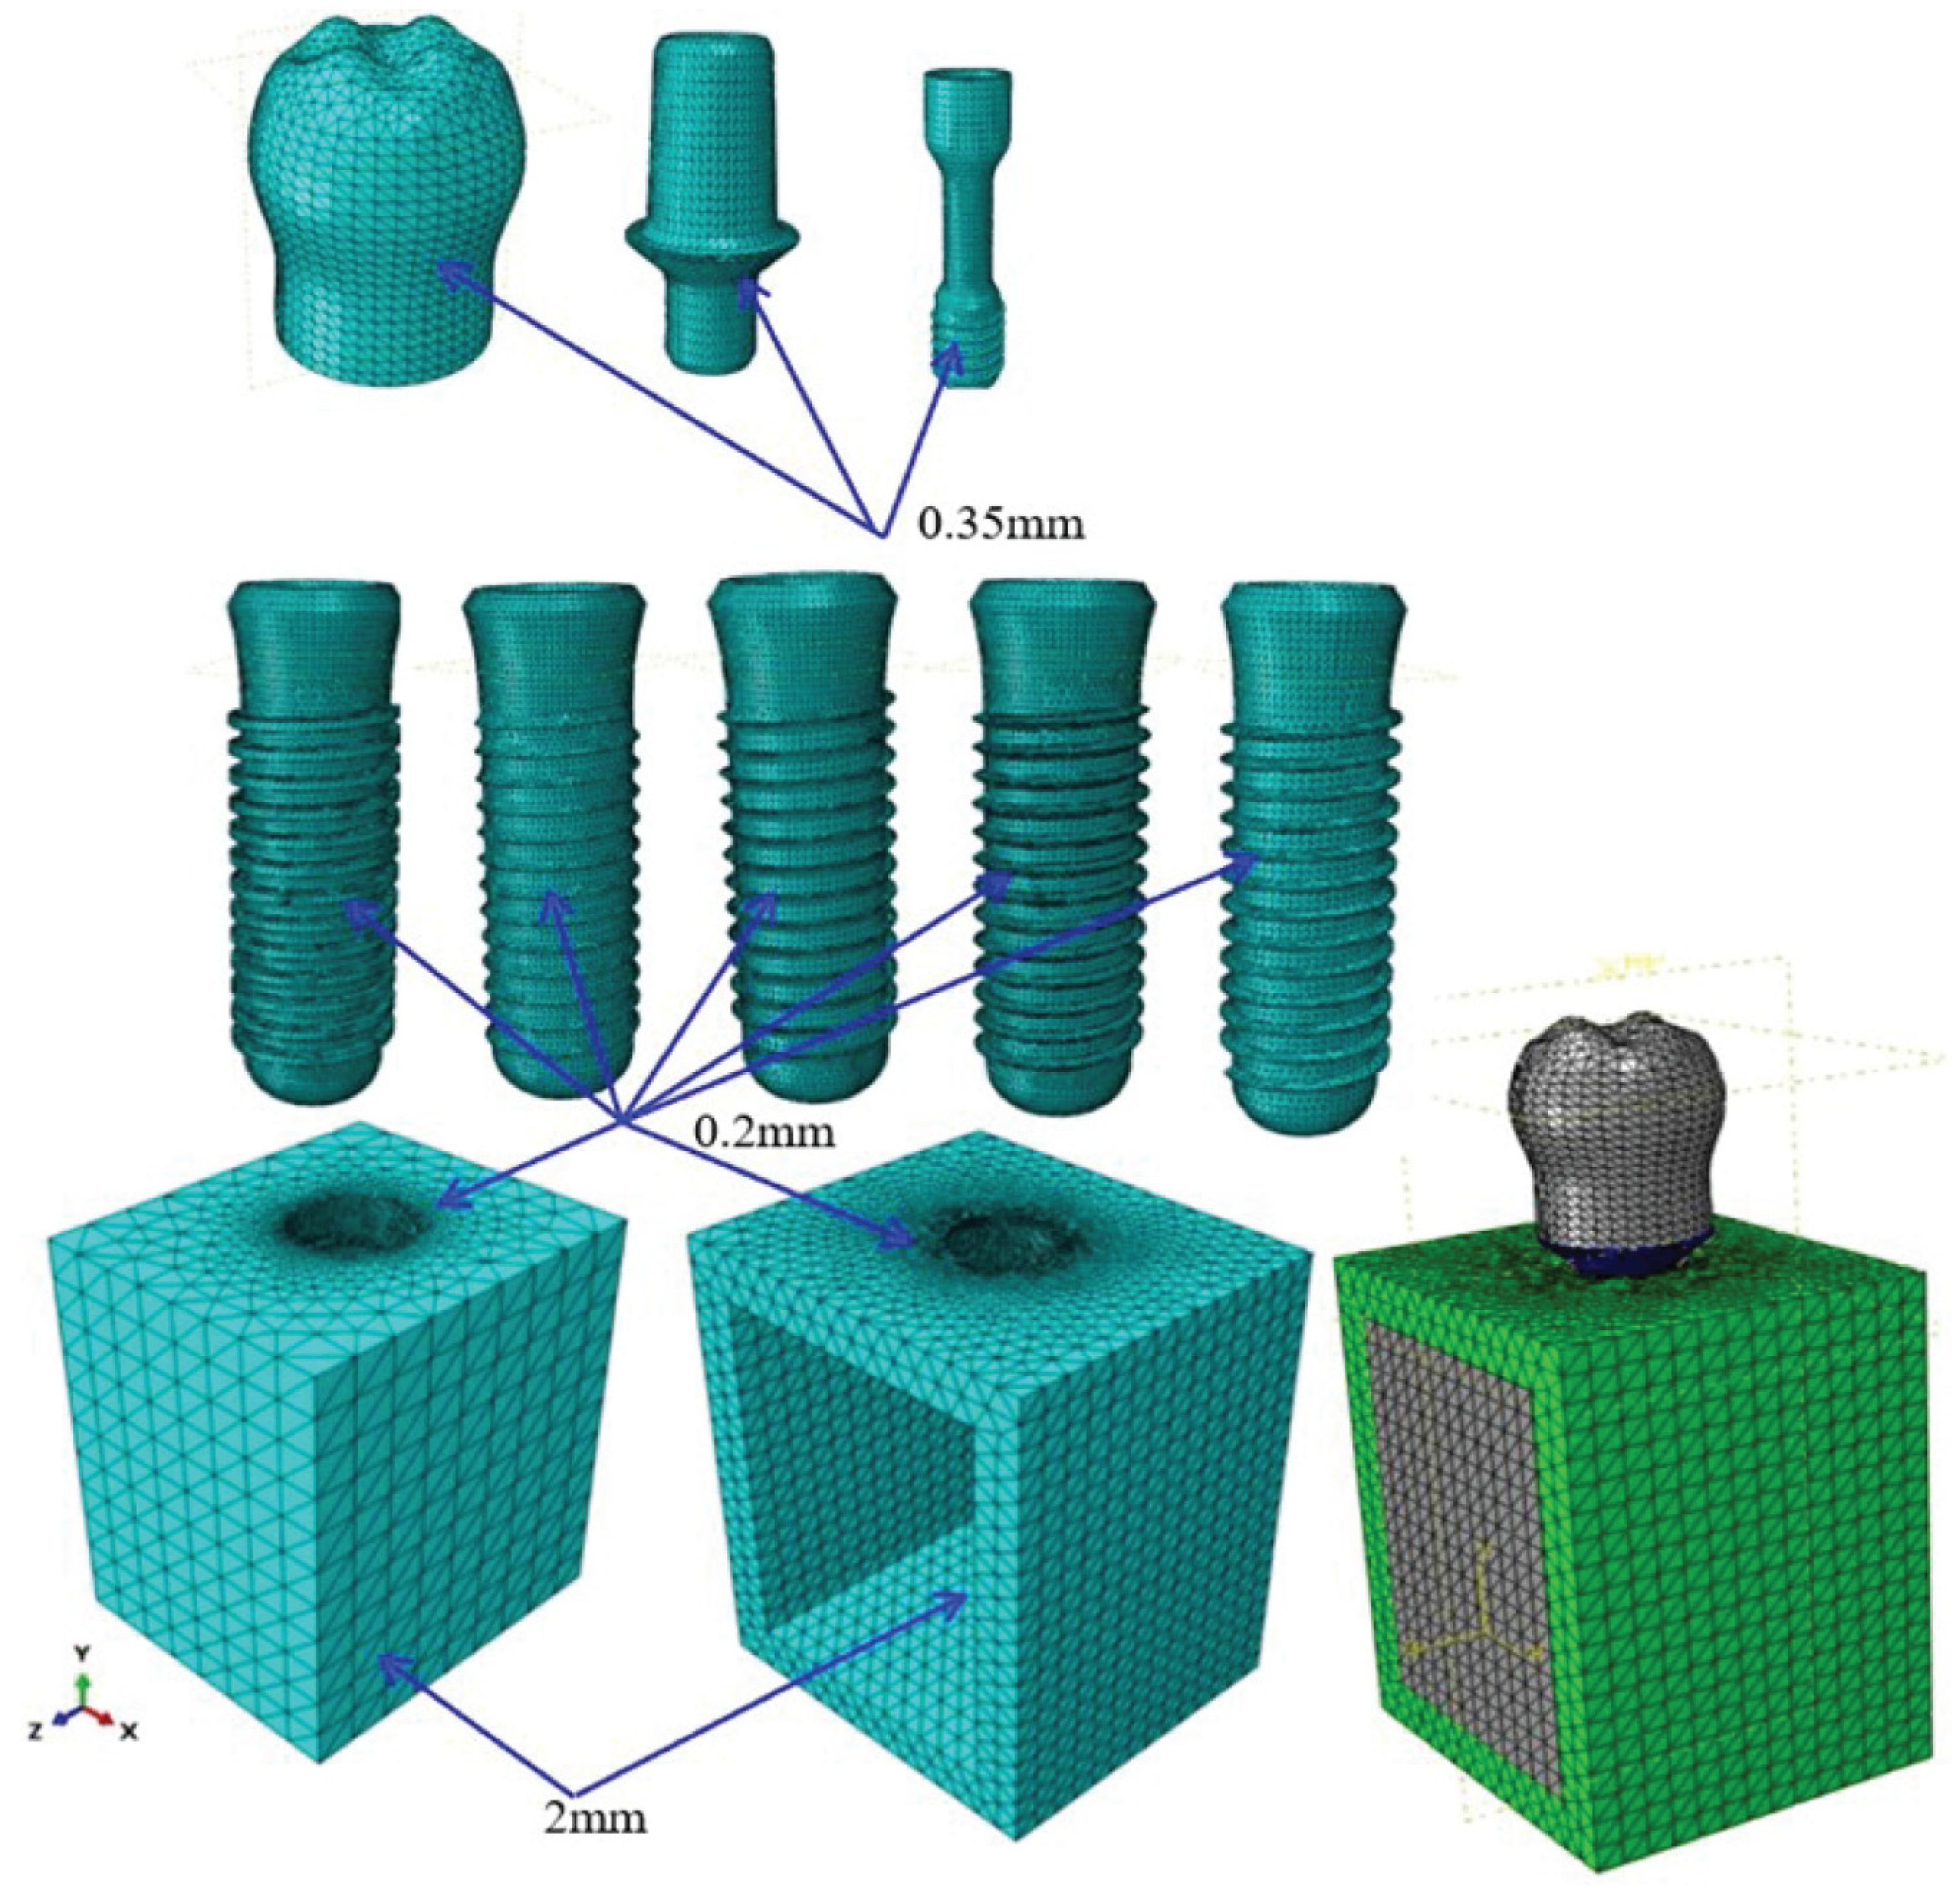
Although FEM is a powerful and efficient way to solve biomechanical problems, there are limitations during the analysis of this study. Dynamic analysis in this study is computationally intensive both in terms of calculation time and computer memory usage. It is a heavy task for the testing of the convergence for different element sizes against maximum stress. Quad finite element type yields excellent FEM outcome with less numerical error. But our study has employed modified quadratic tetrahedral finite element type with 10-nodes (C3D10M) due to the complexity of the implant geometry and 3D model, limited computer RAM, and convergence time.

5. Conclusions

In this study, the influence of different loading rates and thread design on stress distribution of dental implants inserted in anisotropic bone was studied using the FEM technique. Overall, the simulation results support the following main conclusions:
The application of dynamic masticatory loading to the occlusal surface of the prosthetic increases the stress within the implant and surrounding bone significantly.
The outcomes of the simulation revealed that while static loading analyses provide a convenient and low-complexity approach for performing the preliminary design of dental implants, dynamic loading analyses are required to properly understand the performance implications of the proposed design in clinical situations.
No significant difference exists between the stress response behavior of the different thread design models under static loading and quasi-static loading conditions, respectively.
The adoption of curved flanks for buttress and reverse buttress threaded implants resulted in a large improvement in compressive stress and a considerable reduction in maximum stress.
Square thread implants had more favorable stress and strain distribution, which may improve the process of bone remodeling.
We also infer that the anisotropic bone behavior has an unavoidable consequence on the stresses and strain distribution, which could improve the FEM result’s robustness. And it can be used to replace complex bone models, which are often computationally expensive.

Author Contributions

Conceptualization, Y.-R.J.; methodology, D.-B.A.; software, D.-B.A.; validation, D.-B.A.; formal analysis, D.-B.A.; investigation, D.-B.A.; resources, D.-B.A. & Y.-R.J.; data curation, D.-B.A.; writing—original draft preparation, D.-B.A.; writing—review and editing, D.-B.A. & Y.-R.J.; visualization, D.-B.A.; supervision, Y.-R.J.; project administration, Y.-R.J.; funding acquisition, Y.-R.J. All authors have read and agreed to the published version of the manuscript.

Funding

This work was financially supported by the Ministry of Science and Technology of Taiwan (MOST 108-2221-E-006-228-MY3, 109-2923-E-006-005-MY3, and 110-2124-M-006-005).

Institutional Review Board Statement

Not applicable.

Informed Consent Statement

Not applicable.

Acknowledgments

Y.-R.J. would like to acknowledge the Medical Device Innovation Center (MDIC) and Intelligent Manufacturing Research Center (iMRC) from The Featured Areas Research Center Program within the framework of the Higher Education Sprout Project by the Ministry of Education (MOE) in Taiwan and AC2T research GmbH (AC2T) in Austria (COMET InTribology, FFG-No.872176).

Conflicts of Interest

The authors declare no conflict of interest.

References

  1. Yang, B.; Irastorza-Landa, A.; Heuberger, P.; Ploeg, H.L. Effect of insertion factors on dental implant insertion torque/energy-experimental results. J. Mech. Behav. Biomed. Mater. 2020, 112, 103995. [Google Scholar] [CrossRef]
  2. Li, J.; Jansen, J.A.; Walboomers, X.F.; van den Beucken, J.J. Mechanical aspects of dental implants and osseointegration: A narrative review. J. Mech. Behav. Biomed. Mater. 2020, 103, 103574. [Google Scholar] [CrossRef]
  3. Brune, A.; Stiesch, M.; Eisenburger, M.; Greuling, A. The effect of different occlusal contact situations on peri-implant bone stress—A contact finite element analysis of indirect axial loading. Mater. Sci. Eng. C 2019, 99, 367–373. [Google Scholar] [CrossRef]
  4. Cantó-Navés, O.; Marimon, X.; Ferrer, M.; Cabratosa-Termes, J. Comparison between experimental digital image processing and numerical methods for stress analysis in dental implants with different restorative materials. J. Mech. Behav. Biomed. Mater. 2021, 113, 104092. [Google Scholar] [CrossRef]
  5. Shamami, D.Z.; Karimi, A.; Beigzadeh, B.; Derakhshan, S.; Navidbakhsh, M.A. Three-Dimensional Finite Element Study to Characterize the Influence of Load Direction on Stress Distribution in Bone Around Dental Implant. J. Biomater. Tissue Eng. 2014, 4, 693–699. [Google Scholar] [CrossRef]
  6. Wu, T.; Fan, H.; Ma, R.; Chen, H.; Li, Z.; Yu, H. Effect of lubricant on the reliability of dental implant abutment screw joint: An in vitro laboratory and three-dimension finite element analysis. Mater. Sci. Eng. C 2017, 75, 297–304. [Google Scholar] [CrossRef]
  7. Silva, G.A.F.; Faot, F.; da Rosa Possebon, A.P.; da Silva, W.J.; Del Bel Cury, A.A. Effect of macrogeometry and bone type on insertion torque, primary stability, surface topography damage and titanium release of dental implants during surgical insertion into artificial bone. J. Mech. Behav. Biomed. Mater. 2021, 119, 104515. [Google Scholar] [CrossRef]
  8. Macedo, J.P.; Pereira, J.; Faria, J.; Pereira, C.A.; Alves, J.L.; Henriques, B.; Souza, J.C.M.; López-López, J. Finite element analysis of stress extent at peri-implant bone surrounding external hexagon or Morse taper implants. J. Mech. Behav. Biomed. Mater. 2017, 71, 441–447. [Google Scholar] [CrossRef] [Green Version]
  9. Merdji, A.; Bachir Bouiadjra, B.; Ould Chikh, B.; Mootanah, R.; Aminallah, L.; Serier, B.; Muslih, I.M. Stress distribution in dental prosthesis under an occlusal combined dynamic loading. Mater. Des. 2012, 36, 705–713. [Google Scholar] [CrossRef]
  10. Ausiello, P.; Franciosa, P.; Martorelli, M.; Watts, D.C. Effects of thread features in osseo-integrated titanium implants using a statistics-based finite element method. Dent. Mater. 2012, 28, 919–927. [Google Scholar] [CrossRef]
  11. Reddy, P.M.; Thumati, P. A 3-D fi nite element analysis of strain around end osseous threaded and non-threaded implant-opposing natural teeth with regular occlusion and altered occlusion: An in-vitro study. J. Dent. Implant. 2014, 4, 53. [Google Scholar] [CrossRef]
  12. Pirmoradian, M.; Naeeni, H.A.; Firouzbakht, M.; Toghraie, D.; Khabaz, M.K.; Darabi, R. Finite element analysis and experimental evaluation on stress distribution and sensitivity of dental implants to assess optimum length and thread pitch. Comput. Methods Programs Biomed. 2020, 187, 105258. [Google Scholar] [CrossRef]
  13. Abuhussein, H.; Pagni, G.; Rebaudi, A.; Wang, H.L. The effect of thread pattern upon implant osseointegration: Review. Clin. Oral Implants Res. 2010, 21, 129–136. [Google Scholar] [CrossRef] [Green Version]
  14. Niroomand, M.R.; Arabbeiki, M. Implant stability in different implantation stages: Analysis of various interface conditions. Inform. Med. Unlocked 2020, 19, 100317. [Google Scholar] [CrossRef]
  15. Gasik, M.; Lambert, F.; Bacevic, M. Biomechanical properties of bone and mucosa for design and application of dental implants. Materials 2021, 14, 2845. [Google Scholar] [CrossRef]
  16. Martins, D.; Couto, R.; Fonseca, E.M.M.; Rita, A. Numerical analysis of the mechanical stimuli transferred from a dental implant to the bone. J. Comput. Appl. Res. Mech. Eng. 2021, 11, 1–11. [Google Scholar] [CrossRef]
  17. Gibreel, M.; Sameh, A.; Hegazy, S.; Närhi, T.O.; Vallittu, P.K.; Perea-Lowery, L. Effect of specific retention biomaterials for ball attachment on the biomechanical response of single implant-supported overdenture: A finite element analysis. J. Mech. Behav. Biomed. Mater. 2021, 122, 104653. [Google Scholar] [CrossRef]
  18. Mao, Q.; Su, K.; Zhou, Y.; Hossaini-Zadeh, M.; Lewis, G.S.; Du, J. Voxel-based micro-finite element analysis of dental implants in a human cadaveric mandible: Tissue modulus assignment and sensitivity analyses. J. Mech. Behav. Biomed. Mater. 2019, 94, 229–237. [Google Scholar] [CrossRef]
  19. Marcián, P.; Borák, L.; Zikmund, T.; Horáčková, L.; Kaiser, J.; Joukal, M.; Wolff, J. On the limits of finite element models created from (micro)CT datasets and used in studies of bone-implant-related biomechanical problems. J. Mech. Behav. Biomed. Mater. 2021, 117, 104393. [Google Scholar] [CrossRef]
  20. Fabris, D.; Fredel, M.C.; Souza, J.C.M.; Silva, F.S.; Henriques, B. Biomechanical behavior of functionally graded S53P4 bioglass-zirconia dental implants: Experimental and finite element analyses. J. Mech. Behav. Biomed. Mater. 2021, 120, 104565. [Google Scholar] [CrossRef]
  21. Achour, T.; Merdji, A.; Bachir Bouiadjra, B.; Serier, B.; Djebbar, N. Stress distribution in dental implant with elastomeric stress barrier. Mater. Des. 2011, 32, 282–290. [Google Scholar] [CrossRef]
  22. Wirth, A.J.; Müller, R.; Harry van Lenthe, G. The discrete nature of trabecular bone microarchitecture affects implant stability. J. Biomech. 2012, 45, 1060–1067. [Google Scholar] [CrossRef] [PubMed]
  23. Rendohl, E.D.S.; Brandt, W.C. Stress distribution with extra-short implants in an angled frictional system: A fi nite element analysis study. J. Prosthet. Dent. 2020, 124, 728.e1–728.e9. [Google Scholar] [CrossRef]
  24. Aslam, A.; Hassan, S.H.; Aslam, H.M.; Khan, D.A. Effect of platform switching on peri-implant bone: A 3D finite element analysis. J. Prosthet. Dent. 2019, 121, 935–940. [Google Scholar] [CrossRef] [PubMed]
  25. Borges Radaelli, M.T.; Idogava, H.T.; Spazzin, A.O.; Noritomi, P.Y.; Boscato, N. Parafunctional loading and occlusal device on stress distribution around implants: A 3D finite element analysis. J. Prosthet. Dent. 2018, 120, 565–572. [Google Scholar] [CrossRef]
  26. Cinel, S.; Celik, E.; Sagirkaya, E.; Sahin, O. Experimental evaluation of stress distribution with narrow diameter implants: A finite element analysis. J. Prosthet. Dent. 2018, 119, 417–425. [Google Scholar] [CrossRef]
  27. Dimililer, G.; Kücükkurt, S.; Cetiner, S. Biomechanical effects of implant number and diameter on stress distributions in maxillary implant-supported overdentures. J. Prosthet. Dent. 2018, 119, 244–249.e6. [Google Scholar] [CrossRef]
  28. Moraes, S.L.D.; Pellizzer, E.P.; Verri, F.R.; Santiago, J.F.; Silva, J.V.L. Three-dimensional finite element analysis of stress distribution in retention screws of different crown–implant ratios. Comput. Methods Biomech. Biomed. Eng. 2015, 18, 689–696. [Google Scholar] [CrossRef]
  29. Pisani, M.X.; Presotto, A.G.C.; Mesquita, M.F.; Barão, V.A.R.; Kemmoku, D.T.; Del Bel Cury, A.A. Biomechanical behavior of 2-implant– and single-implant–retained mandibular overdentures with conventional or mini implants. J. Prosthet. Dent. 2018, 120, 421–430. [Google Scholar] [CrossRef]
  30. Ramos Verri, F.; Santiago Junior, J.F.; de Faria Almeida, D.A.; de Oliveira, G.B.B.; de Souza Batista, V.E.; Marques Honório, H.; Yoshito Noritomi, P.; Piza Pellizzer, E. Biomechanical influence of crown-to-implant ratio on stress distribution over internal hexagon short implant: 3-D finite element analysis with statistical test. J. Biomech. 2015, 48, 138–145. [Google Scholar] [CrossRef]
  31. Maria, E.; Ciaramella, S.; Calì, M.; Pascoletti, G.; Martorelli, M.; Asero, R.; Watts, D.C. Modal analysis for implant stability assessment: Sensitivity of this methodology for different implant designs. Dent. Mater. 2018, 34, 1235–1245. [Google Scholar] [CrossRef] [Green Version]
  32. Narendrakumar, U.; Mathew, A.T.; Iyer, N.; Rahman, F.; Manjubala, I. A 3D Finite Element Analysis of Dental Implants with Varying Thread Angles. Mater. Today Proc. 2018, 5, 11900–11905. [Google Scholar] [CrossRef]
  33. Kaleli, N.; Sarac, D.; Külünk, S.; Öztürk, Ö. Effect of different restorative crown and customized abutment materials on stress distribution in single implants and peripheral bone: A three-dimensional fi nite element analysis study. J. Prosthet. Dent. 2018, 119, 437–445. [Google Scholar] [CrossRef]
  34. Zhang, G.; Yuan, H.; Chen, X.; Wang, W.; Chen, J.; Liang, J.; Zhang, P. A three-dimensional finite element study on the biomechanical simulation of various structured dental implants and their surrounding bone tissues. Int. J. Dent. 2016, 2016, 4867402. [Google Scholar] [CrossRef] [Green Version]
  35. Tribst, J.P.M.; dal Piva, A.M.D.O.; Lo Giudice, R.; Borges, A.L.S.; Bottino, M.A.; Epifania, E.; Ausiello, P. The influence of custom-milled framework design for an implant-supported full-arch fixed dental prosthesis: 3D-FEA sudy. Int. J. Environ. Res. Public Health 2020, 17, 4040. [Google Scholar] [CrossRef]
  36. Martorelli, M.; Ausiello, P. A novel approach for a complete 3D tooth reconstruction using only 3D crown data. Int. J. Interact. Des. Manuf. 2013, 7, 125–133. [Google Scholar] [CrossRef]
  37. Mosavar, A.; Ziaei, A.; Kadkhodaei, M. The Effect of Implant Thread Design on Stress Distribution in Anisotropic Bone with Different Osseointegration Conditions: A Finite Element Analysis. Int. J. Oral Maxillofac. Implants 2015, 30, 1317–1326. [Google Scholar] [CrossRef] [PubMed] [Green Version]
  38. Khosravani, M.R. Mechanical behavior of restorative dental composites under various loading conditions. J. Mech. Behav. Biomed. Mater. 2019, 93, 151–157. [Google Scholar] [CrossRef]
  39. Cantó-navés, O.; Medina-galvez, R.; Marimon, X.; Ferrer, M.; Figueras-Álvarez, Ó.; Cabratosa-Termes, J. A 3D finite element analysis model of single implant-supported prosthesis under dynamic impact loading for evaluation of stress in the crown, abutment and cortical bone using different rehabilitation materials. Materials 2021, 14, 3519. [Google Scholar] [CrossRef]
  40. Benazzi, S.; Nguyen, H.N.; Kullmer, O.; Kupczik, K. Dynamic modelling of tooth deformation using occlusal kinematics and finite element analysis. PLoS ONE 2016, 11, e0152663. [Google Scholar] [CrossRef]
  41. Marci, P.; Kaiser, J. Micro fi nite element analysis of dental implants under different loading conditions. Comput. Biol. Med. 2018, 96, 157–165. [Google Scholar] [CrossRef]
  42. Huang, M.; Juan, P.; Chen, S.; Wu, C.; Wen, S. Materials Science & Engineering C The potential of the three-dimensional printed titanium mesh implant for cranioplasty surgery applications: Biomechanical behaviors and surface properties. Mater. Sci. Eng. C 2019, 97, 412–419. [Google Scholar] [CrossRef]
  43. Amaral, C.F.; Gomes, R.S.; Rodrigues Garcia, R.C.M.; Del Bel Cury, A.A. Stress distribution of single-implant–retained overdenture reinforced with a framework: A finite element analysis study. J. Prosthet. Dent. 2018, 119, 791–796. [Google Scholar] [CrossRef]
  44. Bulaqi, H.A.; Mousavi Mashhadi, M.; Safari, H.; Samandari, M.M.; Geramipanah, F. Effect of increased crown height on stress distribution in short dental implant components and their surrounding bone: A finite element analysis. J. Prosthet. Dent. 2015, 113, 548–557. [Google Scholar] [CrossRef]
  45. Ziaie, B.; Khalili, S.M.R. Evaluation of Fatigue Life for Dental Implants Using FEM Analysis. Prosthesis 2021, 3, 300–313. [Google Scholar] [CrossRef]
  46. Gehrke, S.A.; Pérez-Díaz, L.; Dedavid, B.A. Quasi-static strength and fractography analysis of two dental implants manufactured by direct metal laser sintering. Clin. Implant Dent. Relat. Res. 2018, 20, 368–374. [Google Scholar] [CrossRef] [PubMed]
  47. Liu, X.; Pang, F.; Li, Y.; Jia, H.; Cui, X.; Yue, Y.; Yang, X.; Yang, Q. Effects of Different Positions and Angles of Implants in Maxillary Edentulous Jaw on Surrounding Bone Stress under Dynamic Loading: A Three-Dimensional Finite Element Analysis. Comput. Math. Methods Med. 2019, 2019, 8074096. [Google Scholar] [CrossRef] [PubMed]
  48. Gotfredsen, K.; Berglundh, T.; Lindhe, J. Bone reactions adjacent to titanium implants subjected to static load. A study in the dog (I). Clin. Oral Implants Res. 2001, 12, 1–8. [Google Scholar] [CrossRef]
  49. Gotfredsen, K.; Berglundh, T.; Lindhe, J. Bone reactions adjacent to titanium implants subjected to static load of different duration. A study in the dog (III). Clin. Oral Implants Res. 2001, 12, 552–558. [Google Scholar] [CrossRef]
  50. Gotfredsen, K.; Berglundh, T.; Lindhe, J. Bone reactions adjacent to titanium implants with different surface characteristics subjected to static load. A study in the dog (II). Clin. Oral Implants Res. 2001, 12, 196–201. [Google Scholar] [CrossRef]
  51. Kayabaşi, O.; Yüzbasioǧlu, E.; Erzincanli, F. Static, dynamic and fatigue behaviors of dental implant using finite element method. Adv. Eng. Softw. 2006, 37, 649–658. [Google Scholar] [CrossRef]
  52. Hansson, S.; Werke, M. The implant thread as a retention element in cortical bone: The effect of thread size and thread profile: A finite element study. J. Biomech. 2003, 36, 1247–1258. [Google Scholar] [CrossRef]
  53. Misch, C.; Strong, J.; Bidez, M.W. Scientific Rationale for Dental Implant Design. In Contemporary Implant Dentistry; Mosby: St. Louis, MO, USA, 2015; pp. 200–229. [Google Scholar]
  54. Bumgardner, J.D.; Boring, J.G.; Cooper, R.C.J.; Gao, C.; Givaruangsawat, S.; Gilbert, J.A.; Misch, C.M.; Steflik, D.E. Preliminary evaluation of a new dental implant design in canine models. Implant Dent. 2000, 9, 252–260. [Google Scholar] [CrossRef] [PubMed]
  55. Barbier, L.; Schepers, E. Adaptive bone remodeling around oral implants under axial and nonaxial loading conditions in the dog mandible. Int. J. Oral Maxillofac. Implants 1997, 12, 215–223. [Google Scholar] [PubMed]
  56. Lee, C.C.; Lin, S.C.; Kang, M.J.; Wu, S.W.; Fu, P.Y. Effects of implant threads on the contact area and stress distribution of marginal bone. J. Dent. Sci. 2010, 5, 156–165. [Google Scholar] [CrossRef] [Green Version]
  57. Albrektsson, T.; Brånemark, P.I.; Hansson, H.A.; Kasemo, B.; Larsson, K.; Lundström, I.; McQueen, D.H.; Skalak, R. The interface zone of inorganic implants In vivo: Titanium implants in bone. Ann. Biomed. Eng. 1983, 11, 1–27. [Google Scholar] [CrossRef]
  58. Jeng, Y.R.; Lin, T.T.; Hsu, H.M.; Chang, H.J.; Shieh, D. Bin Human enamel rod presents anisotropic nanotribological properties. J. Mech. Behav. Biomed. Mater. 2011, 4, 515–522. [Google Scholar] [CrossRef]
  59. Chen, L.J.; He, H.; Li, Y.M.; Li, T.; Guo, X.P.; Wang, R.F. Finite element analysis of stress at implant-bone interface of dental implants with different structures. Trans. Nonferrous Met. Soc. China 2011, 21, 1602–1610. [Google Scholar] [CrossRef] [Green Version]
  60. Linetskiy, I.; Demenko, V.; Linetska, L.; Yefremov, O. Impact of annual bone loss and different bone quality on dental implant success—A finite element study. Comput. Biol. Med. 2017, 91, 318–325. [Google Scholar] [CrossRef]
  61. de la Rosa Castolo, G.; Guevara Perez, S.V.; Arnoux, P.J.; Badih, L.; Bonnet, F.; Behr, M. Implant-supported overdentures with different clinical configurations: Mechanical resistance using a numerical approach. J. Prosthet. Dent. 2019, 121, 546.e1–546.e10. [Google Scholar] [CrossRef] [PubMed]
  62. Hussein, F.A.; Salloomi, K.N.; Abdulrahman, B.Y.; Al-Zahawi, A.R.; Sabri, L.A. Effect of thread depth and implant shape on stress distribution in anterior and posterior regions of mandible bone: A finite element analysis. Dent. Res. J. 2019, 16, 200–207. [Google Scholar] [CrossRef]
  63. Dastenaei, F.M.; Hajarian, A.; Zargar, O.; Zand, M.M.; Noorollahian, S. Effects of thread shape on strength and stability of dental miniscrews against orthodontic forces. Procedia Manuf. 2019, 35, 1032–1038. [Google Scholar] [CrossRef]
  64. Geramizadeh, M.; Katoozian, H.; Amid, R.; Kadkhodazadeh, M. Finite element analysis of dental implants with and without microthreads under static and dynamic loading. J. Long. Term. Eff. Med. Implants 2017, 27, 25–35. [Google Scholar] [CrossRef]
  65. Yagihara, A.; Kawasaki, R.; Mita, A.; Takakuda, K. Impact of Dynamic and Static Load on Bone Around Implants: An Experimental Study in a Rat Model. Int. J. Oral Maxillofac. Implant. 2016, 31, e49–e56. [Google Scholar] [CrossRef] [PubMed] [Green Version]
  66. Po, J.M.C.; Kieser, J.A.; Gallo, L.M.; Tésenyi, A.J.; Herbison, P.; Farella, M. Time-frequency analysis of chewing activity in the natural environment. J. Dent. Res. 2011, 90, 1206–1210. [Google Scholar] [CrossRef]
  67. Tang, C.B.; Liu, S.Y.; Zhou, G.X.; Yu, J.H.; Zhang, G.D.; Bao, Y.D.; Wang, Q.J. Nonlinear finite element analysis of three implant-abutment interface designs. Int. J. Oral Sci. 2012, 4, 101–108. [Google Scholar] [CrossRef] [PubMed] [Green Version]
  68. Sridhar, S.; Wang, F.; Wilson, T.G.; Palmer, K.; Valderrama, P.; Rodrigues, D.C. The role of bacterial biofilm and mechanical forces in modulating dental implant failures. J. Mech. Behav. Biomed. Mater. 2019, 92, 118–127. [Google Scholar] [CrossRef]
  69. Koutouzis, T.; Mesia, R.; Calderon, N.; Wong, F.; Wallet, S. The effect of dynamic loading on bacterial colonization of the dental implant fixture-abutment interface: An in vitro study. J. Oral Implantol. 2014, 40, 432–437. [Google Scholar] [CrossRef]
  70. Walid, M.A.; Almutairi, A.S.; Alkhodary, M.A. The effect of osseodensification and different thread designs on the dental implant primary stability [Version 1; peer review: 2 approved, 1 approved with reservations] Abdullah Saleh Almutairi Referee Status. F1000Research 2018, 7, 1898. [Google Scholar]
  71. Calì, M.; Zanetti, E.M.; Oliveri, S.M.; Asero, R.; Ciaramella, S.; Martorelli, M.; Bignardi, C. Influence of thread shape and inclination on the biomechanical behaviour of plateau implant systems. Dent. Mater. 2018, 34, 460–469. [Google Scholar] [CrossRef]
  72. Sun, F.; Wang, L.; Li, X.C.; Cheng, W.; Lin, Z.; Ba, D.C.; Song, G.Q.; Sun, C.S. Effect of surface modification on the long-term stability of dental implant abutment screws by plasma nitriding treatment. Surf. Coat. Technol. 2020, 399, 126089. [Google Scholar] [CrossRef]
  73. Duyck, J.; Rønold, H.J.; Van Oosterwyck, H.; Naert, I.; Vander Sloten, J.; Ellingsen, J.E. The influence of static and dynamic loading on marginal bone reactions around osseointegrated implants: An animal experimental study. Clin. Oral Implants Res. 2001, 12, 207–218. [Google Scholar] [CrossRef] [PubMed]
  74. Gupta, S.; Goyal, P.; Jain, A.; Chopra, P. Effect of peri-implantitis associated horizontal bone loss on stress distribution around dental implants-A 3D finite element analysis. Mater. Today Proc. 2020, 28, 1503–1509. [Google Scholar] [CrossRef]
  75. Kittur, N.; Oak, R.; Dekate, D.; Jadhav, S.; Dhatrak, P. Dental implant stability and its measurements to improve osseointegration at the bone-implant interface: A review. Mater. Today Proc. 2021, 43, 1064–1070. [Google Scholar] [CrossRef]
  76. Rahmanivahid, P.; Heidari, M. Effect of design parameters of dental implant on stress distribution: A finite element analysis. Int. J. Eng. Technol. 2020, 9, 621–629. [Google Scholar] [CrossRef]
  77. Chakraborty, A.; Datta, P.; Majumder, S.; Mondal, S.C.; Roychowdhury, A. Finite element and experimental analysis to select patient’s bone condition specific porous dental implant, fabricated using additive manufacturing. Comput. Biol. Med. 2020, 124, 103839. [Google Scholar] [CrossRef]
  78. Alaqeely, R.; Babay, N.; AlQutub, M. Dental implant primary stability in different regions of the Jawbone: CBCT-based 3D finite element analysis. Saudi Dent. J. 2020, 32, 101–107. [Google Scholar] [CrossRef]
  79. Valera-Jiménez, J.F.; Burgueño-Barris, G.; Gómez-González, S.; López-López, J.; Valmaseda-Castellón, E.; Fernández-Aguado, E. Finite element analysis of narrow dental implants. Dent. Mater. 2020, 36, 927–935. [Google Scholar] [CrossRef] [PubMed]
  80. Nimbalkar, S.; Dhatrak, P.; Gherde, C.; Joshi, S. A review article on factors affecting bone loss in dental implants. Mater. Today Proc. 2020, 43, 970–976. [Google Scholar] [CrossRef]
  81. Joshi, J.; Gariya, N.; Manral, A.R.; Kumar, P. Comparative analysis of a human tooth using different materials based on the finite element method. Mater. Today Proc. 2020, 38, 2–6. [Google Scholar] [CrossRef]
  82. Jeng, M.D.; Lin, Y.S.; Lin, C.L. Biomechanical evaluation of the effects of implant neckwall thickness and abutment screw size: A 3D nonlinear finite element analysis. Appl. Sci. 2020, 10, 3471. [Google Scholar] [CrossRef]
  83. Cruz, M.; Wassall, T.; Toledo, E.M.; da Silva Barra, L.P.; de Castro Lemonge, A.C. Three-dimensional finite element stress analysis of a cuneiform-geometry implant. Int. J. Oral Maxillofac. Implants 2003, 18, 675–684. [Google Scholar]
  84. Eraslan, O.; Inan, Ö. The effect of thread design on stress distribution in a solid screw implant: A 3D finite element analysis. Clin. Oral Investig. 2010, 14, 411–416. [Google Scholar] [CrossRef]
  85. Kong, L.; Liu, B.; Li, D.; Song, Y.; Zhang, A.; Dang, F.; Qin, X.; Yang, J. Comparative study of 12 thread shapes of dental implant designs: A three-dimensional finite element analysis. ISSN UK World J. Model. Simul. 2006, 1, 746–7233. [Google Scholar]
  86. Chun, H.J.; Cheong, S.Y.; Han, J.H.; Heo, S.J.; Chung, J.P.; Rhyu, I.C.; Choi, Y.C.; Baik, H.K.; Ku, Y.; Kim, M.H. Evaluation of design parameters of osseointegrated dental implants using finite element analysis. J. Oral Rehabil. 2002, 29, 565–574. [Google Scholar] [CrossRef]
  87. Shetty, P.; Yadav, P.; Tahir, M.; Saini, V. Implant Design and Stress Distribution. Int. J. Oral Implantol. Clin. Res. 2016, 7, 34–39. [Google Scholar] [CrossRef]
  88. Reilly, D.T.; Burstein, A.H. The elastic and ultimate properties of compact bone tissue. J. Biomech. 1975, 8, 393. [Google Scholar] [CrossRef]
  89. O’Mahony, A.M.; Williams, J.L.; Spencer, P. Anisotropic elasticity of cortical and cancellous bone in the posterior. Oral Implant. Res. 2001, 12, 648–657. [Google Scholar]
  90. Ding, X.; Liao, S.H.; Zhu, X.H.; Wang, H.M. Influence of orthotropy on biomechanics of peri-implant bone in complete mandible model with full dentition. Biomed Res. Int. 2014, 2014, 709398. [Google Scholar] [CrossRef] [Green Version]
Figure 1. Thread design models and directions of transferred loads, (a) Square, (b) buttress (SF), (c) buttress (CF), (d) trapezoidal, (e) reverse buttress (SF), (f) reverse buttress (CF), and (g) triangular.
Materials 14 06974 g001
Figure 2. Shows the 3D models of implants and bone: (a) square, (b) buttress (CF), (c) reverse buttress(CF), (d) trapezoidal, and (e) triangular.
Materials 14 06974 g002
Figure 3. Computational meshes for implant and bone models.
Materials 14 06974 g003
Figure 4. (a) Loading and boundary conditions. Sectional views of: (b) square thread, (c) buttress (CF) thread, (d) reverse (CF) buttress thread, (e) trapezoidal thread, and (f) triangular thread.
Materials 14 06974 g004
Figure 5. Maximum von Mises stress for different implant models and element sizes.
Materials 14 06974 g005
Figure 6. Dynamic loading of crown occlusal surface in buccal-lingual, axial, and mesiodistal directions during mastication cycle (2 Hz).
Materials 14 06974 g006
Figure 7. Shows the maximum von mises stress due to dynamic loading in Buttress (CF) implant in case of (a) Crown, (b) abutment, (c) Screw, (d) implant, (e) Compact bone, and (f) Spongy bone.
Materials 14 06974 g007
Figure 8. The maximum von Mises stress in the prosthetic components, all implant design, and anisotropic bone under dynamic load.
Materials 14 06974 g008
Figure 10. Maximum and minimum principal stresses in implant under dynamic load.
Materials 14 06974 g010
Figure 11. Maximum displacements of prosthetic and bone regions of different thread models under (a) static loading, (b) quasi-static loading, and (c) dynamic loading.
Materials 14 06974 g011
Table 1. Mesh statistics of different implant and bone models.
CrownAbutmentScrewImplantCortical BoneTrabecular BoneTotal
Thread ShapeNo.ElementNo.NodeNo.ElementNo.NodeNo.ElementNo.NodeNo.ElementNo.NodeNo.ElementNo.NodeNo.ElementNo.NodeNo.ElementNo.Node
Reverse Buttress (CF)28,366608721,417508116,9013724168,76038,51240,7438972306,17357,166582,360119,542
Buttress (CF)36,970780920,725496917,0223748161,16437,26641,0459020334,73164,236611,657127,048
Square26,370569821,115503316,8943729235,37447,45149,74110,912343,84668,114693,340140,937
Triangular28,060602321,455509716,8763729235,86050,59440,2178873373,04670,342715,514144,658
Trapezoidal27,979599020,991501416,9373736168,39935,00649,97410,946380,45172,147664,731132,839
Table 2. Physical properties of materials for the FEA [39,59].
MaterialsYoung’s Modulus E (MPa)Poisson’s Ratio νDensity (g/cm3)Strength (MPa)
Cortical boneEx12,600νxy0.33190
Ey12,600νyz0.253
Ez19,400νxz0.253
νyx0.3
νzy0.39
νzx0.39
Cancellous boneEx1148νxy0.055310
Ey210νyz0.01
Ez1148νxz0.322
νyx0.01
νzy0.055
νzx0.322
Gold abutment *136,0000.3717.5765
Porcelain68,9000.282.44145
Titanium grade 4 *110,0000.344.5550
* The vectors of x, y and z are mean the buccolingual, infero-superior, and mesiodistal direction, respectively. And Implant & screw = Titanium grade 4, Abutment = Gold, Crown = Porcelain.
Table 3. Show the result of testing the null hypothesis using ONE WAY ANOVA statistical analysis.
Anova: Single Factor
Summary
GroupsCountSumAverageVariance
Static302467.6682.255333336338.674991
Quasi-Static302593.4286.447333336867.053779
Dynamic303513.29117.109666714,067.48338
ANOVA
Source of VariationSSdfMSFp-valueFcrit
Between Groups21,725.76102210,862.880511.1948956120.3076543.101296
Within Groups790,923.1522879091.070715
Total812,648.913289
Table 4. Maximum von Mises stress in a different region of each model under static, quasi-static, and dynamic loads.
Maximum Von Mises Stress (MPa)
Thread TypeComponentsStaticQuasi-StaticDynamic
SquareCROWN23.7924.8631.40
ABUTMENT103.35108.00136.42
SCREW55.3057.7973.00
IMPLANT121.04126.49159.77
CORTICAL BONE18.7519.6024.75
SPONGY BONE4.024.215.31
Buttress (CF)CROWN24.2925.5638.75
ABUTMENT110.03115.81141.94
SCREW68.2771.8588.07
IMPLANT173.24182.33239.41
CORTICAL BONE31.5433.1943.58
SPONGY BONE2.256.237.25
Reverse buttress (CF)CROWN27.4528.8037.93
ABUTMENT128.88135.22178.11
SCREW67.1670.4692.81
IMPLANT205.79214.42298.60
CORTICAL BONE33.6035.0148.75
SPONGY BONE2.805.657.82
TrapezoidalCROWN27.5028.9937.17
ABUTMENT160.13168.86216.50
SCREW64.2967.7986.92
IMPLANT237.23247.06358.69
CORTICAL BONE35.5337.0053.72
SPONGY BONE4.354.536.57
TriangularCROWN70.8274.0098.58
ABUTMENT199.38208.36277.54
SCREW98.59103.03137.24
IMPLANT313.81327.93496.48
CORTICAL BONE51.8154.1481.96
SPONGY BONE2.676.258.25
Table 5. Maximum von Mises stress in buttress and reverse buttress models with curved flank (CF) and straight flank (SF) design.
Maximum Von Mises Stress (MPa)
SFCFDecrease (%)
Thread DesignComponentsStaticQuasi-StaticDynamicStaticQuasi-StaticDynamicStaticQuasi-StaticDynamic
Buttresscrown37.4844.4574.8124.2925.5638.7535.242.548.2
abutment147.49168.33246.03110.03115.81141.9425.431.242.31
screw97.6896.95142.7868.2771.8588.0730.1125.8938.32
implant245.07234.42402.91173.24182.33239.4129.3128.5740.58
Cortical bone41.8842.268.3631.5433.1943.5824.6921.3636.25
Cancellous bone2.727.619.162.256.237.2517.2518.1920.85
Reverse buttresscrown37.2643.0823.8127.4528.837.9326.3233.1449.78
abutment159.39157.43217.21128.88135.22178.1117.5914.1118
screw95.5290.47136.8767.1670.4692.8129.6922.1232.19
implant254.72271.35449.83205.79214.42298.619.2120.9833.62
Cortical bone44.0843.8664.8233.635.0148.7523.7820.1824.79
Cancellous bone3.57.210.432.85.657.8219.8921.525
SF = straight flank, CF = curved flan.
Table 6. Maximum shear stress in three different planes of basic thread models under static, quasi-static, and dynamic loading conditions.
Shear Stress [MPa] for Oblique Load-118.2N
Static LoadQuasi-Static LoadDynamic Load
Thread TypeComponentsXYXZYZXYXZYZXYXZYZ
SquareCROWN7.1513.155.917.5113.616.0410.6919.328.67
ABUTMENT29.0710.0933.8831.8310.6634.3140.6713.9147.88
SCREW7.445.1813.248.005.4113.9310.067.6218.38
IMPLANT27.7519.6917.1329.3220.9918.5941.6629.3025.51
CORTICAL BONE4.948.973.365.279.183.537.2413.365.28
SPONGY BONE1.011.081.061.011.141.101.612.161.99
Buttress (CF)CROWN4.553.787.524.924.037.626.515.6811.45
ABUTMENT25.009.6354.5326.6610.1757.3835.1014.4679.61
SCREW9.3510.1815.959.9410.7417.3114.1314.7123.66
IMPLANT35.9022.5514.9838.4523.2815.7253.3833.9226.80
CORTICAL BONE5.7110.732.405.7311.222.499.6916.327.21
SPONGY BONE0.530.660.640.560.690.650.991.262.46
Reverse Buttress (CF)CROWN14.266.7236.6915.317.2139.4520.689.9453.29
ABUTMENT46.2946.2053.1049.6249.4656.9572.0173.9482.65
SCREW14.8110.3719.1916.0411.3220.8422.1215.8028.72
IMPLANT43.2732.0819.2443.5732.3419.3977.4158.4834.45
CORTICAL BONE6.7212.192.767.1513.082.9312.7324.288.26
SPONGY BONE0.630.900.580.690.990.632.263.392.12
TrapezoidalCROWN5.173.8511.405.584.1112.117.766.2218.81
ABUTMENT26.7715.7255.3628.9317.0559.3641.0224.3784.76
SCREW9.835.2617.119.895.3617.2517.669.4732.56
IMPLANT51.5926.7120.6153.8928.0722.0380.5546.2334.09
CORTICAL BONE6.9411.812.987.5612.933.2513.1823.025.65
SPONGY BONE0.610.680.680.650.730.742.522.812.89
TriangularCROWN4.983.306.845.413.607.398.125.7812.02
ABUTMENT27.798.5560.1228.048.6360.6453.4215.90119.62
SCREW10.1716.8316.7210.7317.8717.9716.7329.0830.50
IMPLANT36.6933.0717.4739.8235.8019.0471.7561.4034.79
CORTICAL BONE8.2312.233.268.7713.093.5727.3246.4314.44
SPONGY BONE0.790.920.550.861.000.612.813.582.75
Table 7. Shows an ANOVA single factor statistical analysis for testing static and quasi-static loading difference on maximum stress in all implant thread shape.
ANOVA: Single Factor
Summary
GroupsCountSumAverageVariance
Static303114.384103.81289282.257
Quasi-Static303176.172105.87249530.255
ANOVA
Source of VariationSSdfMSFp-valueFcrit
Between Groups63.62828163.628280.0067640.9347344.006873
Within Groups545,562.8589406.256
Total545,626.559
Table 8. ANOVA single factor statistical analysis for the effect of thread shape on maximum shear stress for the cyclic applied load.
Summary of One Way ANOVA
GroupsCountSumAverageVariance
Square6111.9318.655314.408
685.6714.2783388.64706
6107.7117.95167290.9025
Buttress (CF)6119.819.96667405.2682
686.3514.39167126.7028
6151.1925.19833799.038
Reverse Buttress (CF)6207.2134.5351021.174
6185.8330.97167816.2047
6209.4934.915888.1732
Trapezoidal6162.6927.115862.3519
6112.1218.68667260.4293
6178.7629.79333894.9547
Triangular6180.1530.025738.5722
6162.1727.02833537.4403
6214.1235.686671833.773
ANOVA
Source of VariationSSdfMSFp-valueFcrit
Between Groups4664.33414333.16670.505920.9226741.825908
Within Groups49,390.275658.536
Total54,054.5389
Publisher’s Note: MDPI stays neutral with regard to jurisdictional claims in published maps and institutional affiliations.

