Article

Study of Grain Growth in a Ni-Based Superalloy by Experiments and Cellular Automaton Model

1
Neutron Scattering Technical Engineering Research Center, School of Mechanical Engineering, Dongguan University of Technology, Dongguan 523808, China
2
Guangdong-Hong Kong-Macao Joint Laboratory for Neutron Scattering Science and Technology, Dongguan University of Technology, Dongguan 523808, China
3
Institute for Advanced Studies in Precision Materials, Yantai University, Yantai 264005, China
*
Authors to whom correspondence should be addressed.
Materials 2021, 14(22), 6922; https://doi.org/10.3390/ma14226922
Submission received: 28 October 2021 / Revised: 9 November 2021 / Accepted: 14 November 2021 / Published: 16 November 2021

Abstract

:
The grain growth behavior in a typical Ni-based superalloy was investigated using isothermal heat treatment experiments over a holding temperature range of 1353–1473 K. The experimental results showed that the grain structure continuously coarsened as the holding time and holding temperature increased during heat treatment. A classical parabolic grain growth model was used to explore the mechanism of grain growth under experimental conditions. The grain growth exponent was found to be slightly above 2. This indicates that the current grain growth in the studied superalloy is mainly governed by grain boundary migration with a minor pinning effect from the precipitates. Then, the grain growth in the studied superalloy during isothermal heat treatment was modelled by a cellular automaton (CA) with deterministic state switch rules. The microscale kinetics of grain growth is described by the correlation between the moving velocity and curvature of the grain boundary. The local grain boundary curvature is well evaluated by a template disk method. The grain boundary mobility was found to increase with increasing temperature. The relationship between the grain boundary mobility and temperature has been established. The developed CA model is capable of capturing the dependence of the grain size on the holding time under different holding temperatures.

1. Introduction

The mechanical performances of components are sensitive to their microstructures, especially the grain size [1,2,3,4,5]. For instance, grain refinement can improve the strength and ductility of components at the same time by activating more slip systems [6,7]. This renders the control of grain size an important task. Ni-based superalloys have wide applications in high-temperature components, such as aircraft engines and gas turbines [8,9,10,11,12]. Thus, the study of grain growth behavior in Ni-based superalloys is of interest to many researchers [13,14,15,16,17,18]. Ruan et al. [13] found that grain growth in IN718 can be retarded by NbC and TiN phases due to Ostwald ripening. Lee et al. [14] found that the grain boundary structure can become rough at high temperatures, and it has a significant influence on the grain growth in a model Ni-based superalloy. Song and Aindow [15] conducted annealing experiments to study the grain growth in a model Ni-based superalloy and found that the pinning effect of the second-phase particles can lead to grain growth stagnation. Aoki et al. [16] analyzed the effects of strain on the grain size evolution in IN718 during post heat treatment. Tian et al. [17] simulated the grain size evolution in a Ni-based superalloy and found that a dual microstructure can be obtained by controlling the treating temperatures. Collins et al. [18] studied the grain growth behavior of RR1000 and found that there is a grain size limit for grain growth.
Most of the grain size models within the above research are of a classical parabolic type. These models may lack the ability to describe the characteristics of the grain structure, such as its morphology and grain distribution. Cellular automaton (CA) has an intrinsic advantage over the description and visualization of microstructural evolution in metals and alloys [19,20]. It has been successfully applied to describe the evolution of the grain structure in alloy steels [21,22], titanium alloys [23,24,25], and Ni-based superalloys [26,27,28].
In this study, isothermal heat treatment experiments were conducted to investigate the grain growth behavior in a typical Ni-based superalloy. The grain structure of the studied superalloy was characterized by the electron backscatter diffraction (EBSD) technique. Compared with other characterization techniques, such as optical microscopy and scanning electron microscopy, the average grain size and grain size distribution can be readily and reliably measured by the EBSD technique. A cellular automaton model is developed to describe the evolution of grain structure in the studied Ni-based superalloy during isothermal heat treatment.

2. Materials and Experiments

A commercial Ni-based superalloy was used in this investigation. Table 1 shows its chemical composition.
Specimens with 5 mm × 5 mm × 2 mm dimensions were machined from the wrought billet. During the grain growth tests, specimens were heated in sealed quartz capsules together with high-purity argon gas. Ice water quench cooling was used to keep the microstructure of the specimen intact at the end of each heat treatment. Table 2 shows the detailed experimental procedure of grain growth tests. First, solution heat treatment was conducted for all specimens under a holding temperature of 1338 K for 1200 s. The solution heat treatment routine was carefully chosen to fully resolve all precipitates in the gamma matrix. Then, specimens were subjected to isothermal heating under a holding temperature of 1353–1473 K and holding time of 180–2400 s.
The microstructures of specimens after heat treatment were studied by electron backscatter diffraction (EBSD). Specimens were ground by sandpaper down to 1200 grit and final polished with a vibratory polisher with a colloidal silica suspension. The grain size and pH of the colloidal silica suspension were 0.04 μm and 9.8, respectively. EBSD detections were conducted on a Philips XL30FEG scanning electron microscope (SEM, FEI Co., Hillsboro, OR, USA), equipped with a charge-coupled device (CCD) camera. The detected EBSD data were processed with the texture analysis software MTEX version 5.7.0, Freiberg, Germany [29]. Figure 1 shows the grain structure after solution heat treatment. The grains are colored by inverse pole figure color keys [30]. The grain boundaries are represented by black lines. Twin grains sharing a common twin boundary were merged together for evaluation of the average grain size. Then, the average grain size was calculated by the area fraction weighted method [31]. The average grain size of the grain structure shown in Figure 1 is around 70 μm.

3. Experimental Results and Discussions

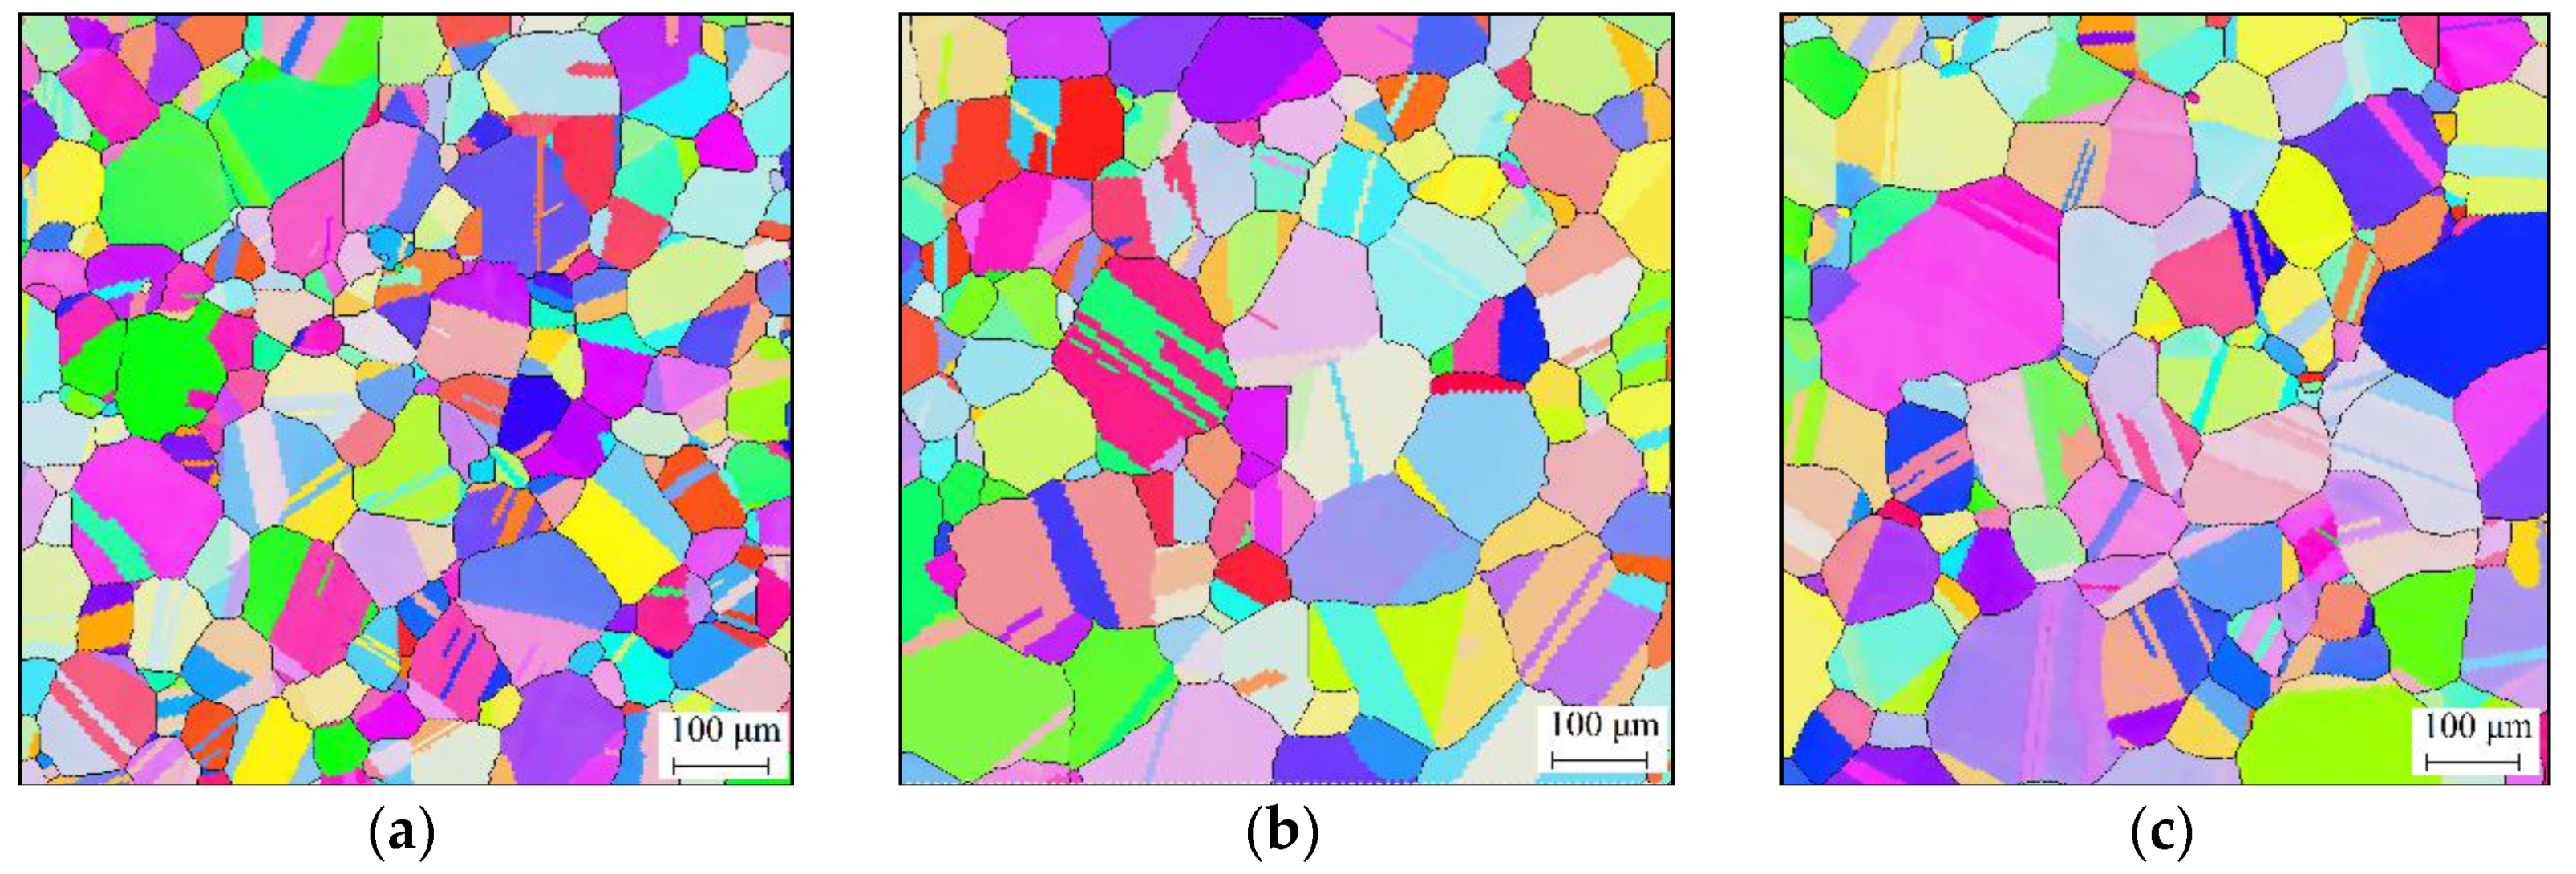
Figure 2 illustrates the effects of the holding time on the grain structure under a holding temperature of 1353 K. It is shown that the grain structure gradually coarsens as the holding time increases. The grain sizes under holding times of 600 s, 1500 s, and 2400 s were 106 μm, 154 μm, and 192 μm, respectively. During the isothermal holding period, the total grain boundary energy tends to reduce with increasing holding time [32,33]. Then, the reduction tendency of the grain boundary energy drives the grain boundaries to move and diminish, during which the average grain size grows with an increase in holding time.
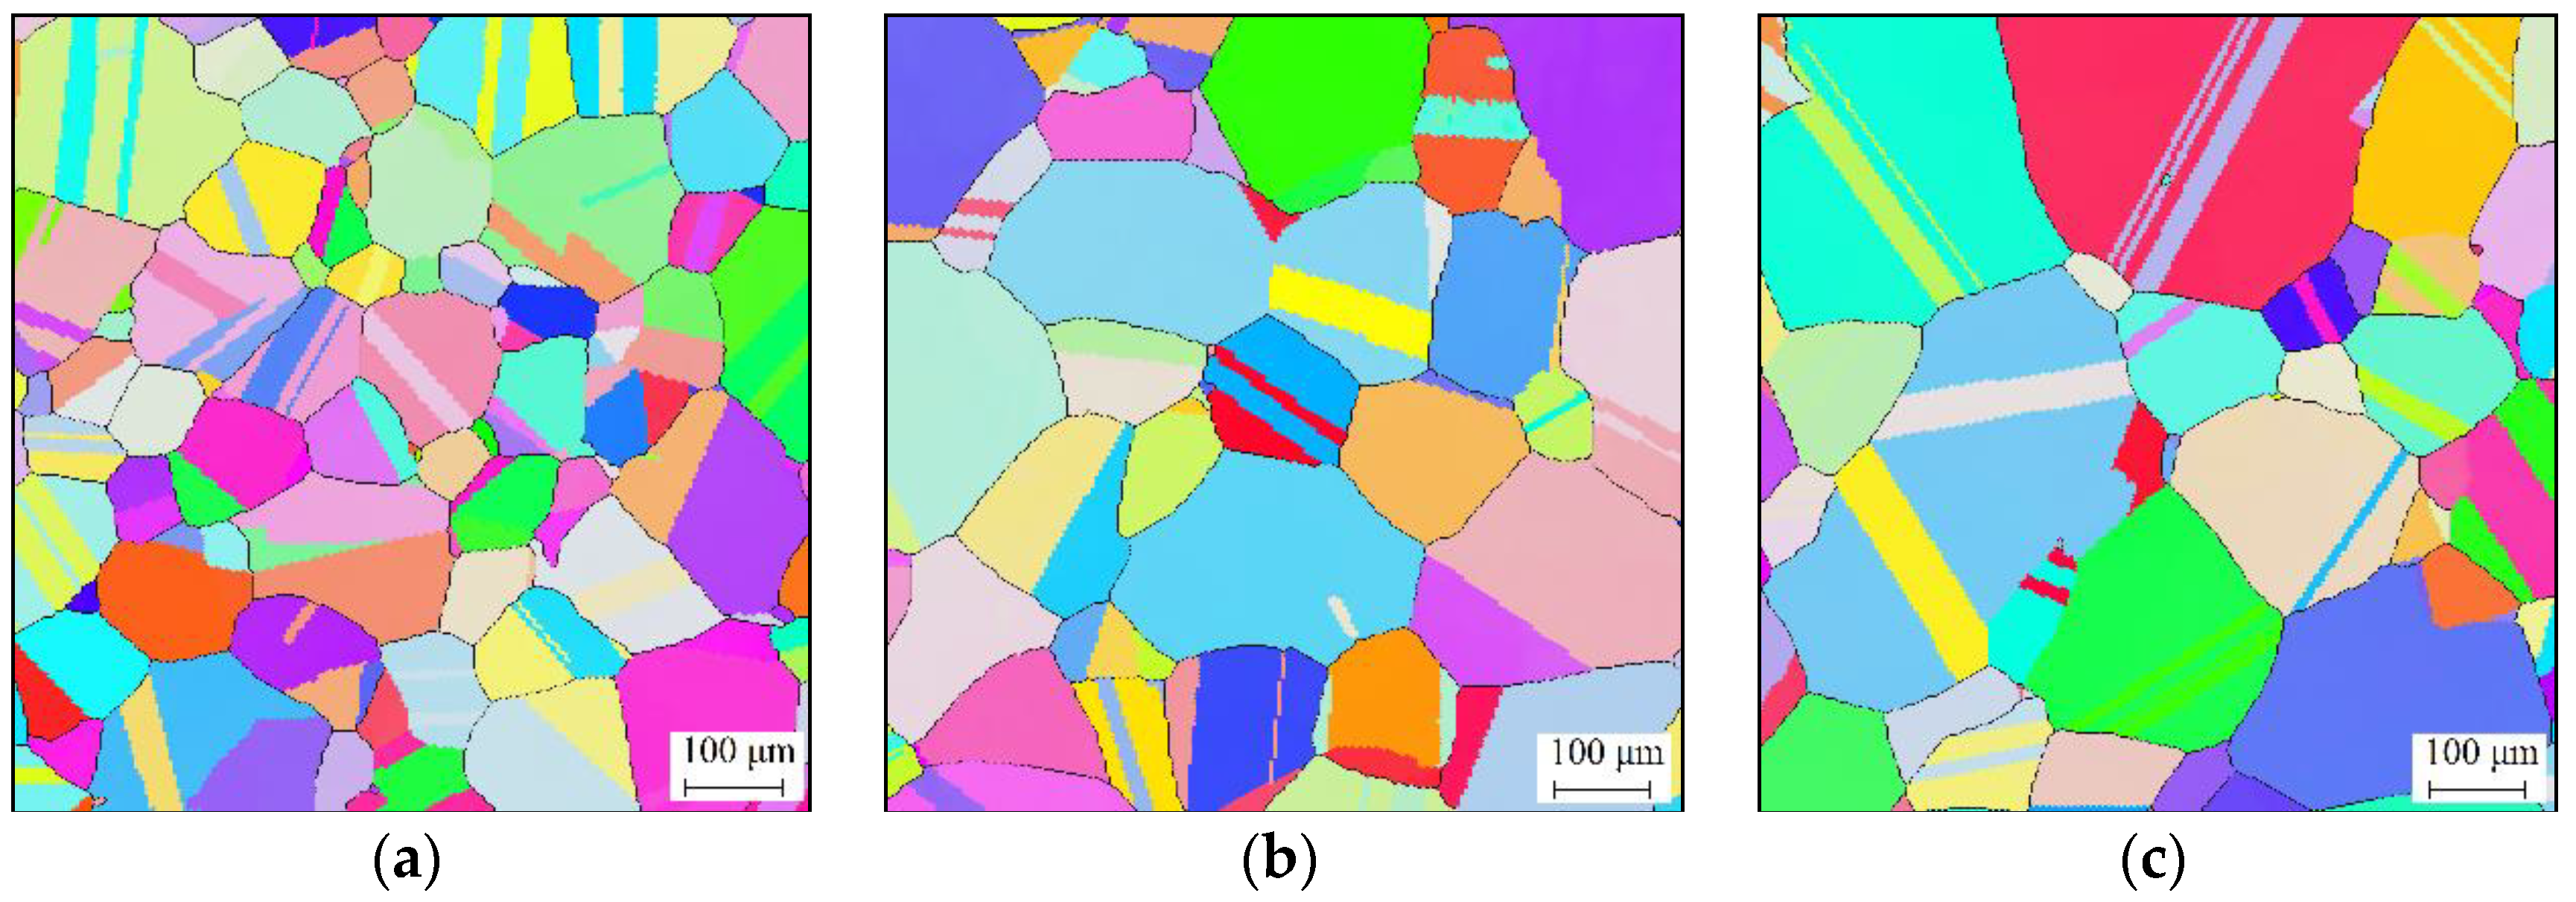
Figure 3 shows the effects of the holding temperature on the grain structure under a holding time of 540 s. It was found that the grains grew significantly under higher holding temperatures. The grain sizes under the holding temperatures of 1413 K, 1443 K, and 1473 K were 160 μm, 238 μm, and 299 μm, respectively. The movement of grain boundaries is a thermally activated process [34,35]. This makes the grain structure coarsen faster at higher holding temperatures.
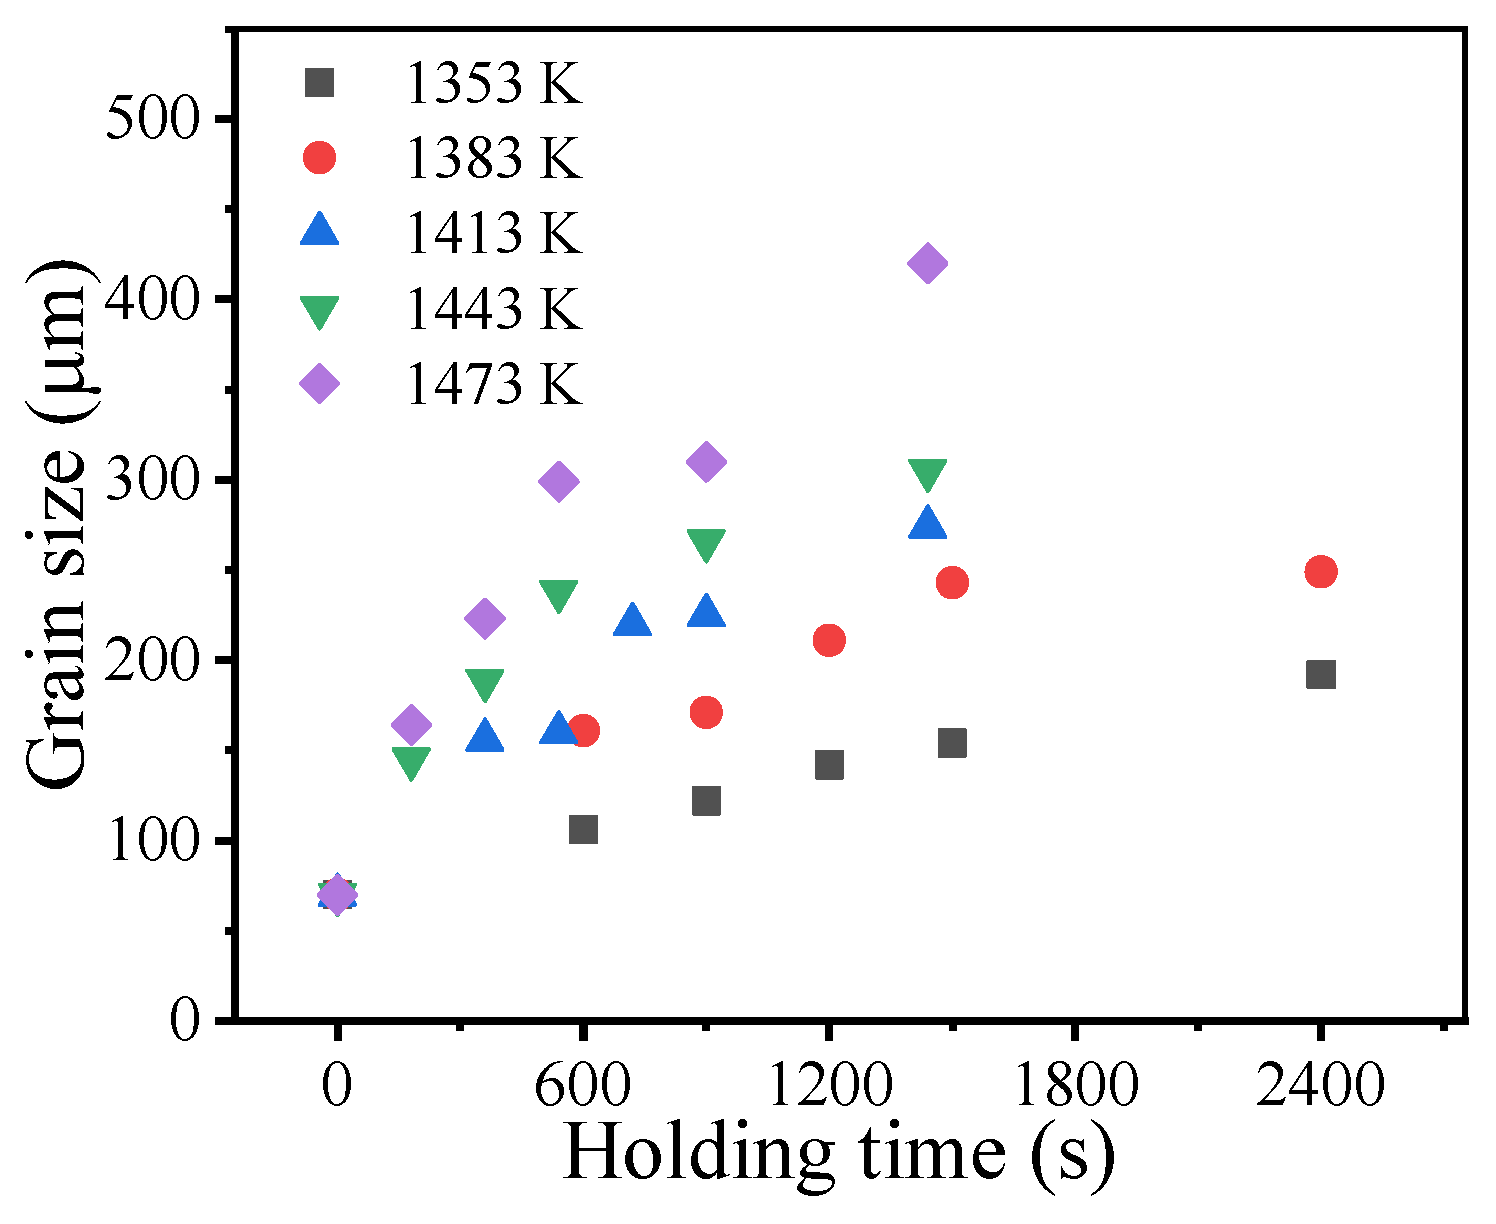
Figure 4 illustrates the measured grain sizes at different holding times and holding temperatures. The measured grain size continuously increases as the holding time and holding temperature increase. Generally, the relationship between the grain size and holding time during isothermal heat treatment can be described by the parabolic law [36]:
G t n G 0 n = k G t
where n is the grain growth exponent, G t n is the average grain size at time t, G 0 n is the initial grain size, and k G is the material parameter and can be written in the Arrhenius form:
k G = k 0 exp [ Q / ( R T ) ]
where k 0 is the material constant, Q is the activation energy, R is the gas constant, and T is the holding temperature.
Material parameters n, k 0 , and Q can be identified by minimizing the value of the objective function (OF):
O F = j = 1 nmd ( G m j G p j ) 2
where nmd is the number of measured data, and G m j and G p j are the jth values of measured and predicted grain size, respectively.
Based on the MATLAB fminsearch function, n, k 0 , and Q were identified by minimizing OF. Table 3 shows the identified material parameters. Thus, the relationship between the grain size and holding time during isothermal heat treatment for the studied superalloy can be described as:
G t 2.43 G 0 2.43 = 3.63 × 10 14 exp [ 3.2 × 10 5 / ( R T ) ] t
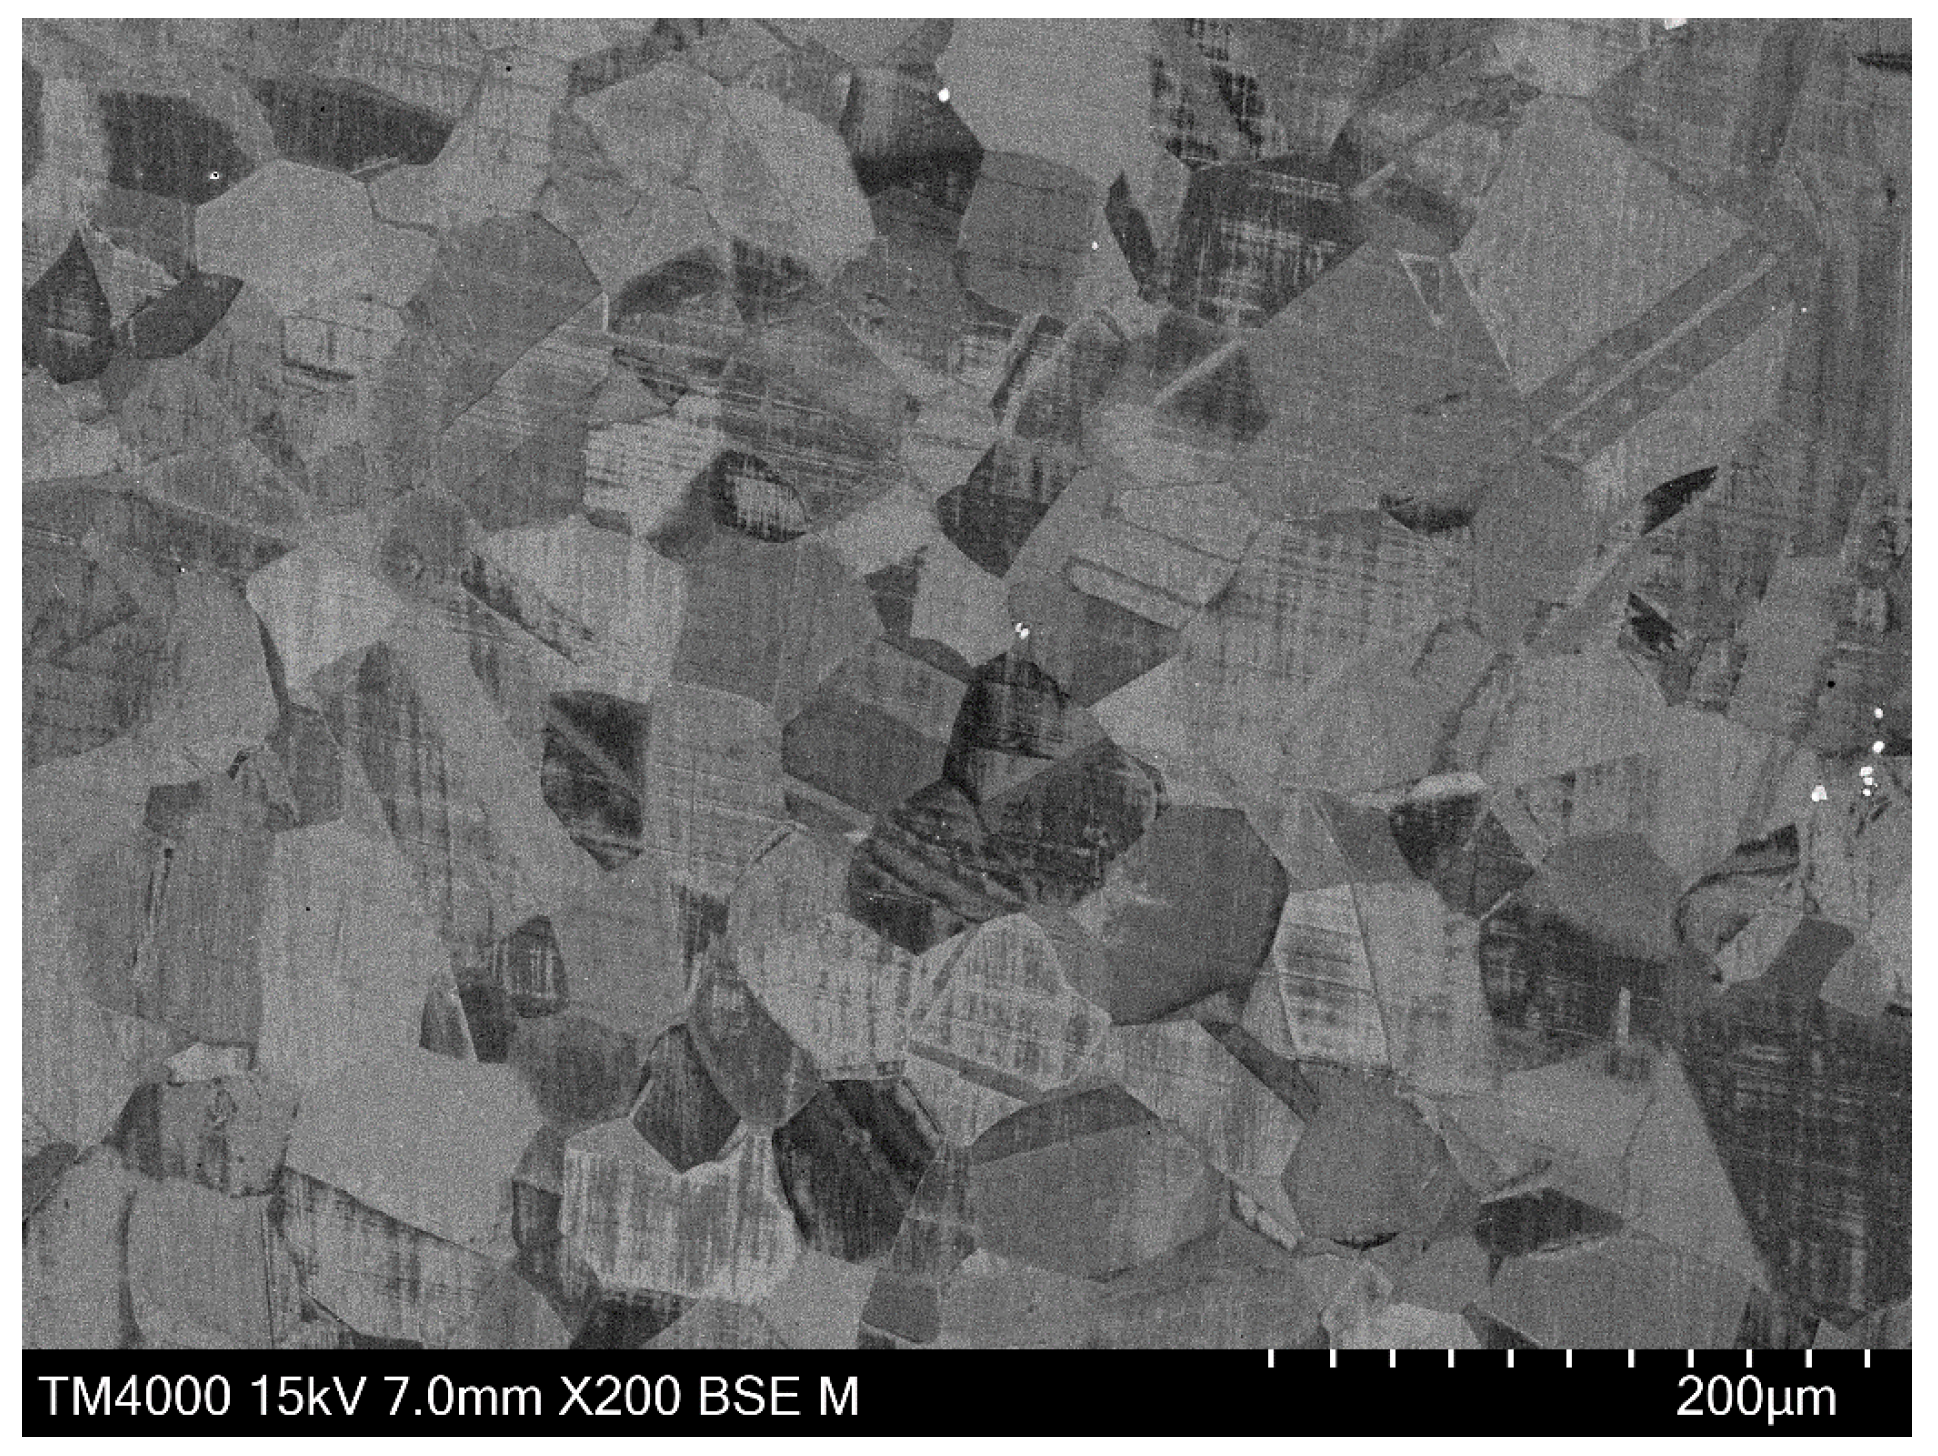
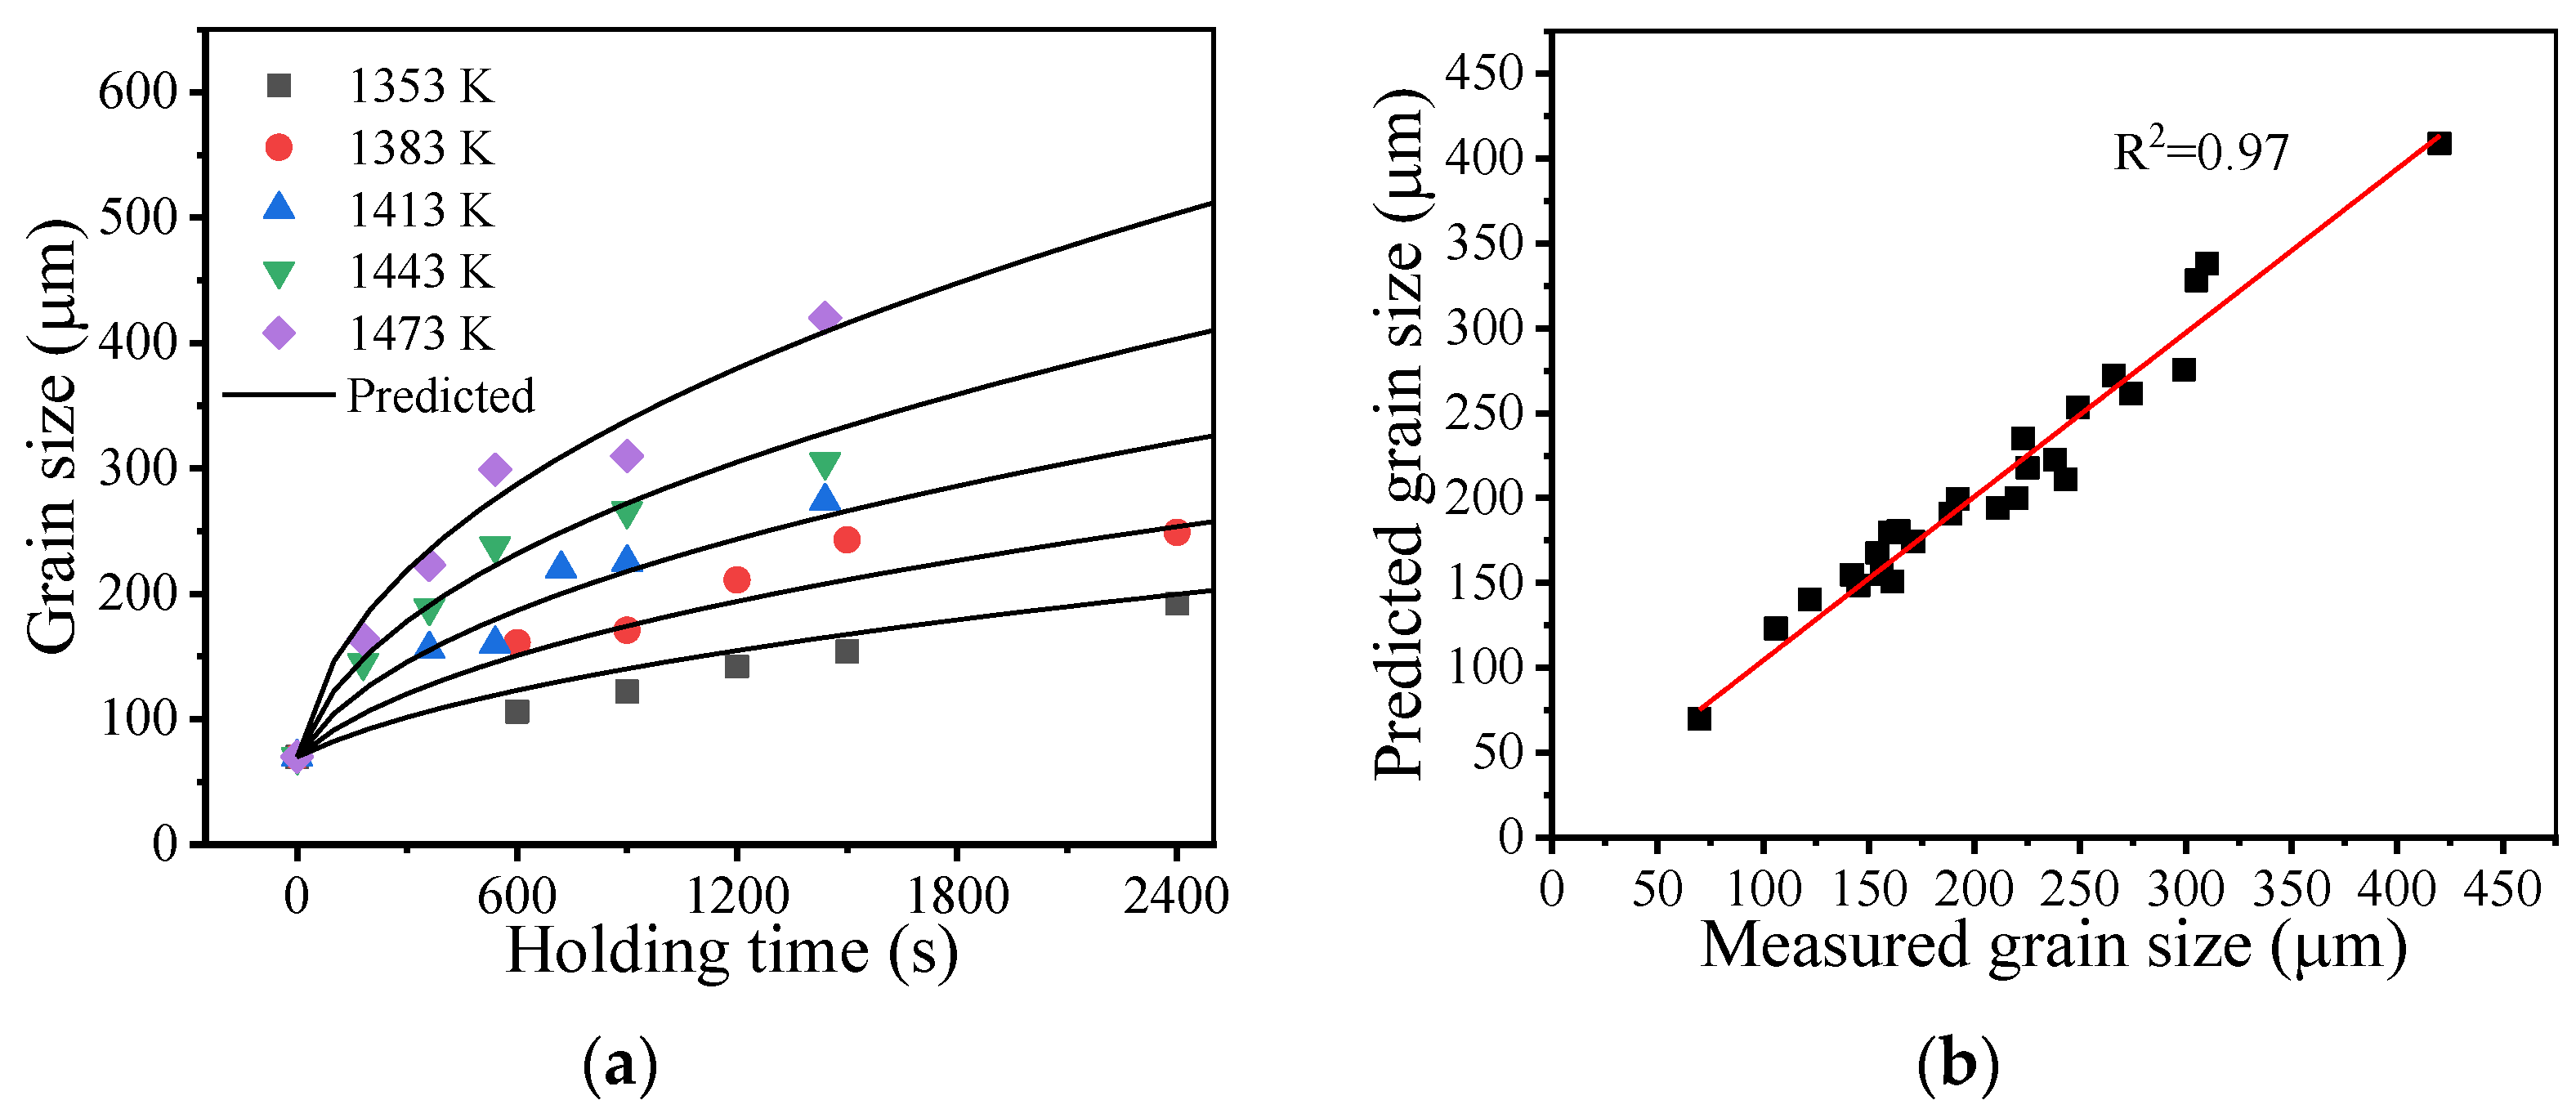
It was shown that the identified value of the grain growth exponent n was slightly above 2. The value of the grain growth exponent can be related with the grain growth mechanism and generally lies between 2 and 4 [36]. For a pure single-phase system, the grain growth exponent is theoretically equal to 2. The grain growth slows down in the presence of precipitates due to their suppressing effects [37,38]. Under these circumstances, the grain growth exponent increases. Thus, the identified grain growth exponent indicates that the current grain growth in the studied superalloy is mainly governed by grain boundary migration with a minor pinning effect from precipitates [39]. This is because most of the precipitates in the studied superalloy were dissolved during the solution heat treatment. Figure 5 shows the backscattered electron image of the microstructure after solution heat treatment. Except for some carbides, precipitates cannot be clearly seen.
Figure 6 illustrates the comparison between the measured and predicted grain sizes. It was found that the predicted grain growth curves were in good agreement with the measured results. The coefficient of determination (R2) is 0.97. This suggests that Equation (4) can reliably capture the grain growth behavior of the studied superalloy.

4. Simulating Grain Growth Behavior Using a CA Model

A CA model is used to discretize the grain structure into a grid of cells and simulate the evolution of the grain structure by the transformation of cell states. The state of a cell is related with its neighboring cells according to the transformation rules. Thus, the grain growth can be described from a mesoscale view.
In this section, a CA model for describing the grain growth behavior of the studied superalloy will be established.

4.1. Models for Grain Growth

Grain boundary migration is mainly driven by the reduction of grain boundary energy. The moving velocity (V) of grain boundaries can be described by [40]:
V = M γ κ
where M is grain boundary mobility, γ is grain boundary energy per unit area, and κ is grain boundary curvature.
Γ can be described by [41]:
γ = μ b θ 0 / [ 4 π ( 1 ν ) ]
where μ is the shear modulus for the studied superalloy, μ = μ0[1 − 0.64(T − 300)/1726], μ0 is the shear modulus at room temperature and is taken as 7.89 × 10⁴ Mpa, b is the magnitude of the Burgers vector, ν is the Poisson ratio, and θ0 is the lower misorientation limit for high angle grain boundary and is normally taken as 15°.
In reality, grain shape is never an ideal circle. Therefore, the grain boundary curvature cannot be explicitly evaluated by the circle area formula. After the grain structure is discretized into a grid of cells, the local grain boundary curvature at cell i can be evaluated by a template disk method [42,43]:
κ C κ ( N i κ Kink ) / ( D κ N κ )
where Dκ is the diameter of the template disk, Nκ is the total number of cells in the template disk, N i κ is the number of cells with different states from the evaluated cell i, and Kink is the number of cells with different states from the evaluated cell i when the evaluated boundary is straight. In this way, N i κ will be equal to Kink when cell i is located on a straight boundary. This makes Equation (7) equal to zero, which is consistent with the fact that the curvature of a straight boundary is zero. Cκ is a parameter.
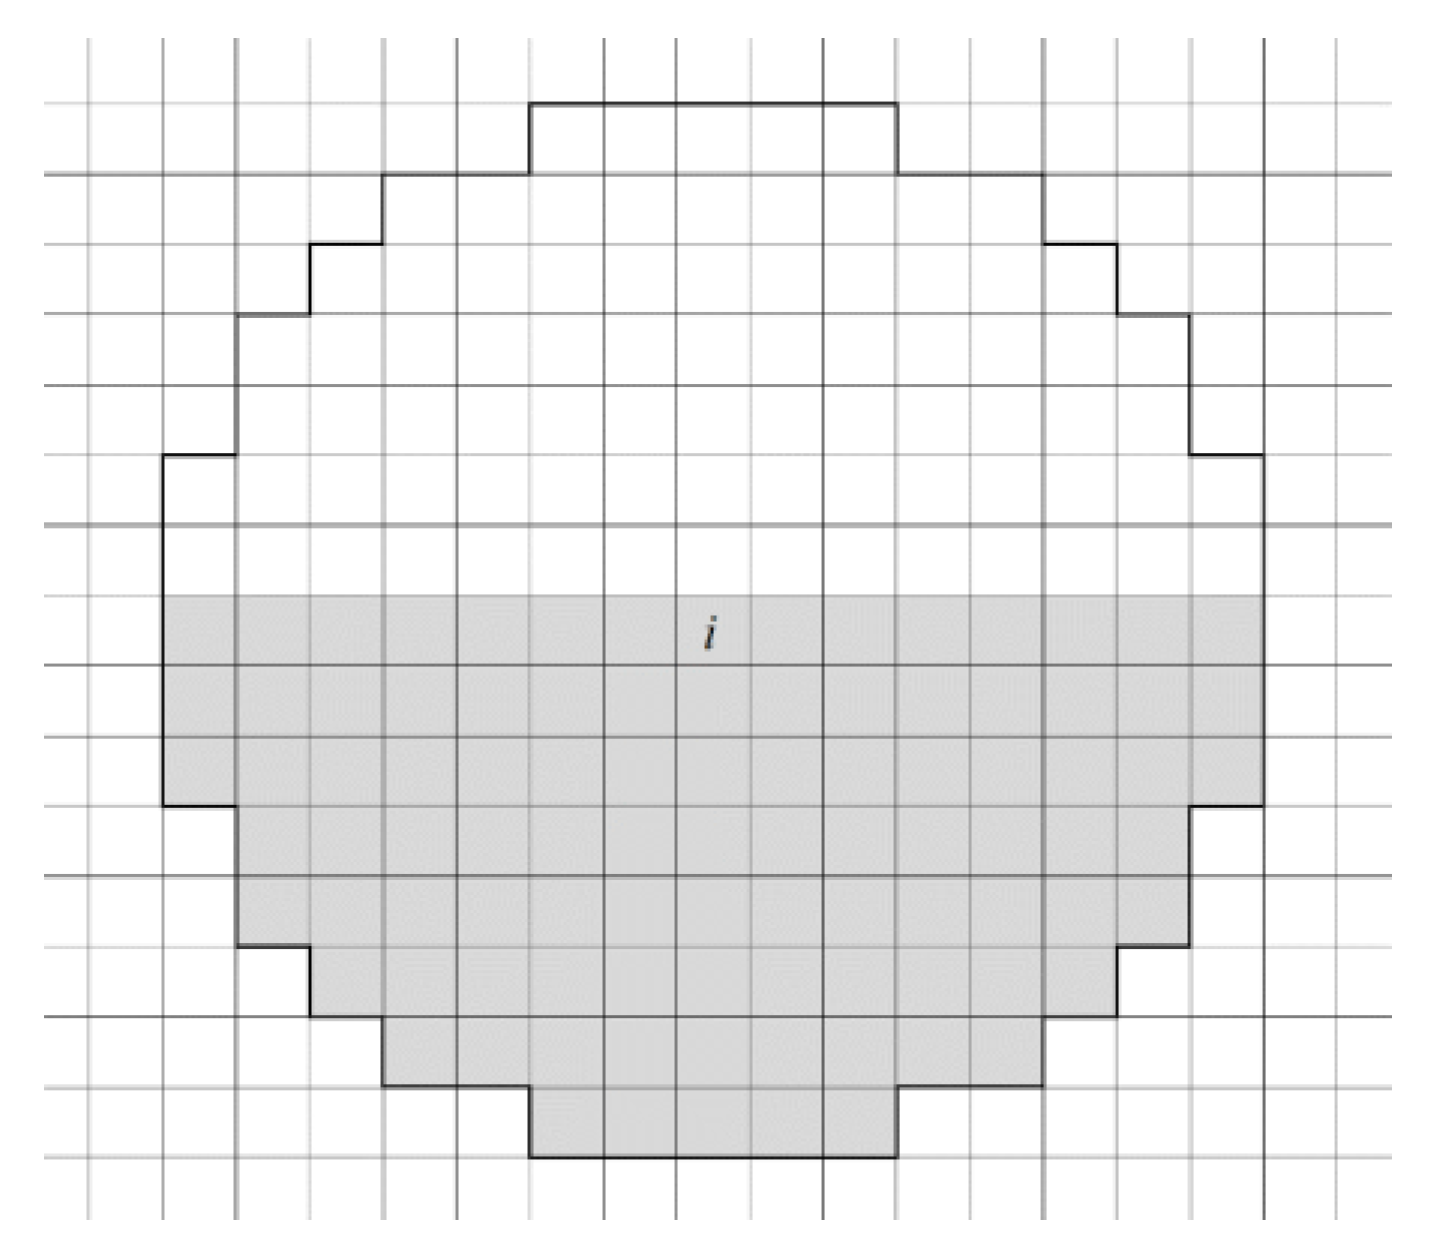
In the present study, a template disk with a diameter of 15 cells was employed to evaluate the boundary curvature at local cells [44]. By choosing an odd cell diameter, the local cell to be evaluated can be located right in the middle of the template disk. Figure 7 shows the detailed structure of the employed template disk. The template disk is surrounded by black lines. Within the template disk, there are 15 cells along the diameter and there are 177 cells in total. Thus, Dκ = 15Lc, Nκ = 177, where Lc is cell size. To specify the value of Kink, Figure 7 also shows the details for straight boundary conditions. The colors white and gray represent different grains. Cell i is the cell where the boundary curvature will be evaluated and is located in the middle of the template disk. As shown in Figure 7, the local boundary at cell i is straight. Cell i belongs to the gray grain. There are 81 cells with a different state from the gray cells within the template disk. Thus, Kink = 81. From here, the curvature for the local boundary can be evaluated by moving the template disk along grain boundary cells, once Cκ is determined.
Cκ can be calibrated by comparing analytical and simulated shrinkage results of one circular grain in terms of relationship between grain radius and time. The analytical equation describing the relationship between grain radius and time during the shrinkage of one circular grain can be written as:
R t 2 = R 0 2 2 M γ t
where Rt and R0 are the grain radius at time t and the initial grain radius, respectively. For the calibration of Cκ, one circular grain with an initial radius of 100 μm was chosen. M and γ are taken as the values of the studied superalloy at 1323 K [45]. The circular grain shrinkage simulation was conducted over a 200 × 200 square grid with a cell size of 2 μm. Cell neighbors were chosen according to Von Neumann’s neighboring rule and cell grid borders were treated by periodic boundary conditions [46]. The state transformation of a boundary cell is governed by a deterministic rule [47]. The moving distance of a boundary cell increases by:
D t = D t Δ t + V Δ t
where ∆t is the change in time. When Dt becomes greater than the cell size, the state of the boundary cell transforms to the state of whichever neighboring cell has the largest curvature.
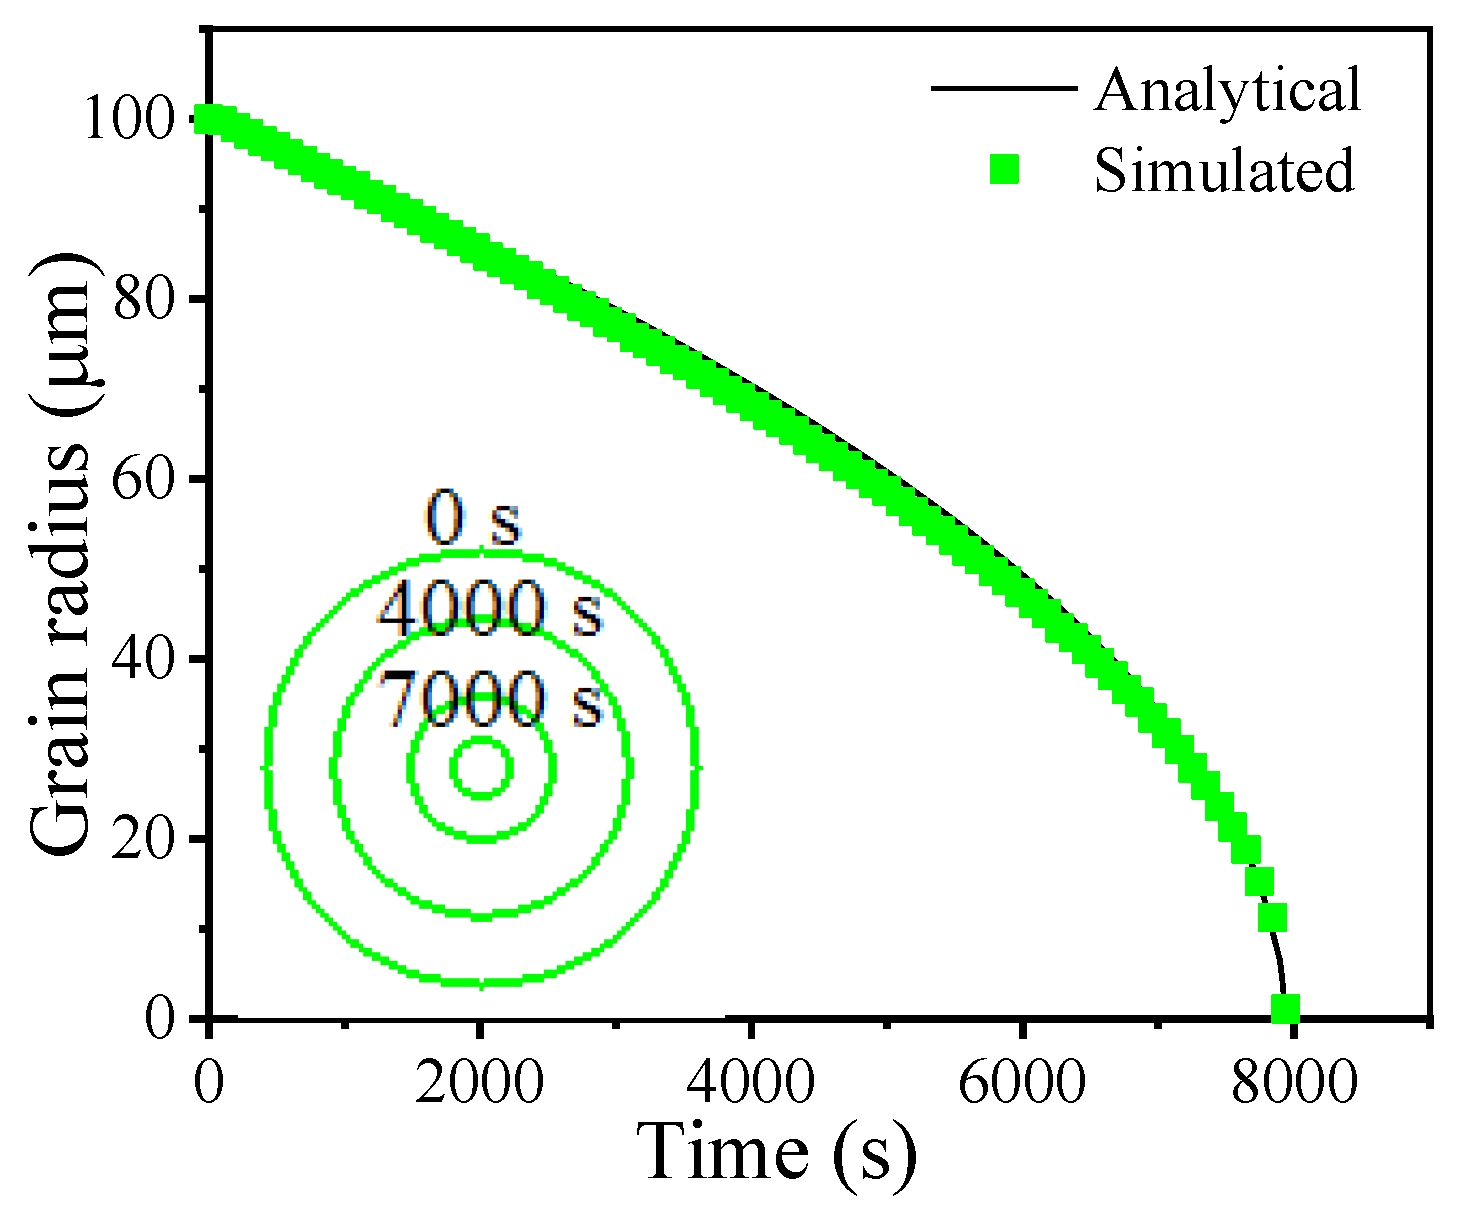
Based on the analytical relationship between the grain radius and time, Cκ is calibrated as 17.6. Figure 8 shows the simulated relationship between grain radius and time after calibration. It was found that the simulated grain radius curve nearly coincided with the analytical one. The evolution of the grain shape with time during the shrinkage simulation is also shown in Figure 8. The grain shapes at 0 s, 4000 s, 7000 s, and 7800 s during simulation are indicated by green lines. The shrinking grain keeps a nearly circular shape even at the end of the simulation. This indicates that the current evaluation method for local boundary curvature is effective.

4.2. Grain Growth Simulation

A 500 × 500 square grid was used for the grain growth simulation. The grid was of the same cell size as the circular grain shrinkage simulation, and the transformation and neighboring rules and boundary conditions were also the same as in the circular grain shrinkage simulation. The initial microstructure for the simulation was created by having nuclei randomly seed in the 500 × 500 square grid and letting them grow until they impinged on each other. The initial grain size was controlled at 70 μm, which is the same as the measured value after solution heat treatment. Based on the measured grain sizes, the values of M under different holding temperatures were identified and listed in Table 4. It was found that M increases with increasing temperatures. This is because the movement of grain boundaries is a thermally activated process.
The relationship between M and holding temperature can be described by [48]:
M = δ D ob b exp [ Q b / ( R T ) ] / ( k T )
where δDob and Qb are material parameters, and R, b, and k are the universal gas constant, magnitude of Burgers vector, and Boltzmann’s constant, respectively. Based on the identified values of M, δDob and Qb were fitted and are listed in Table 5.
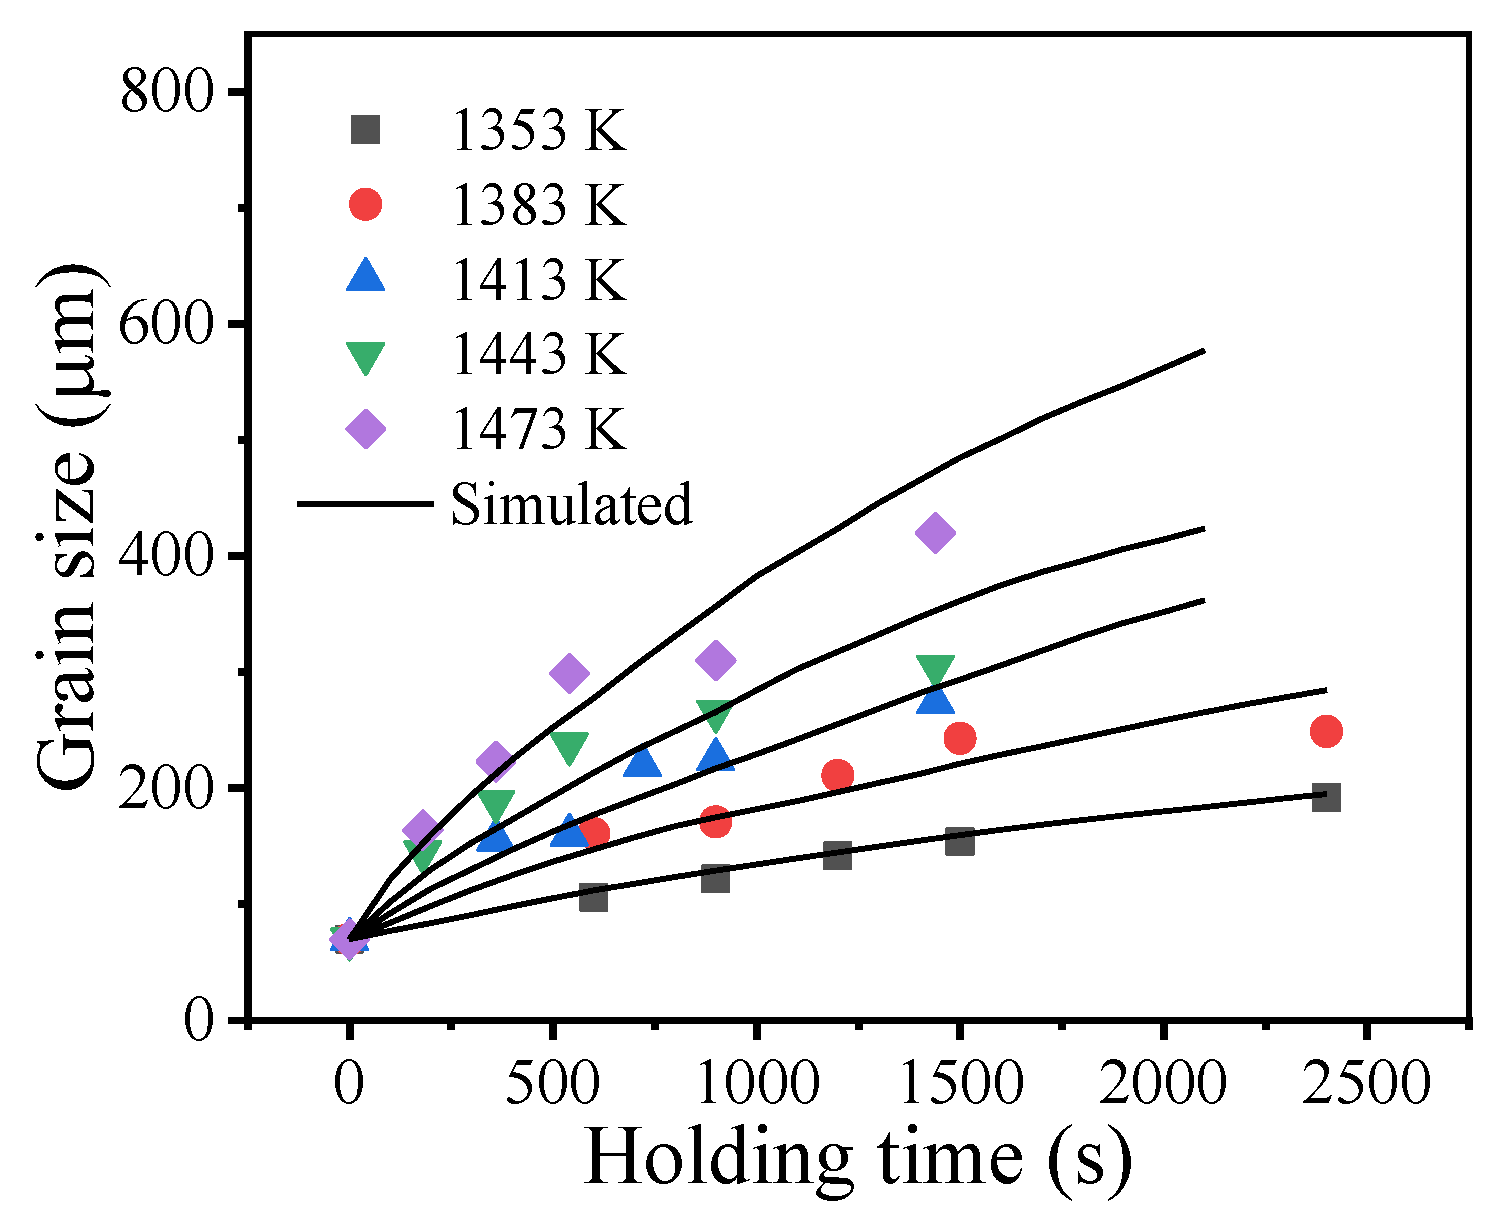
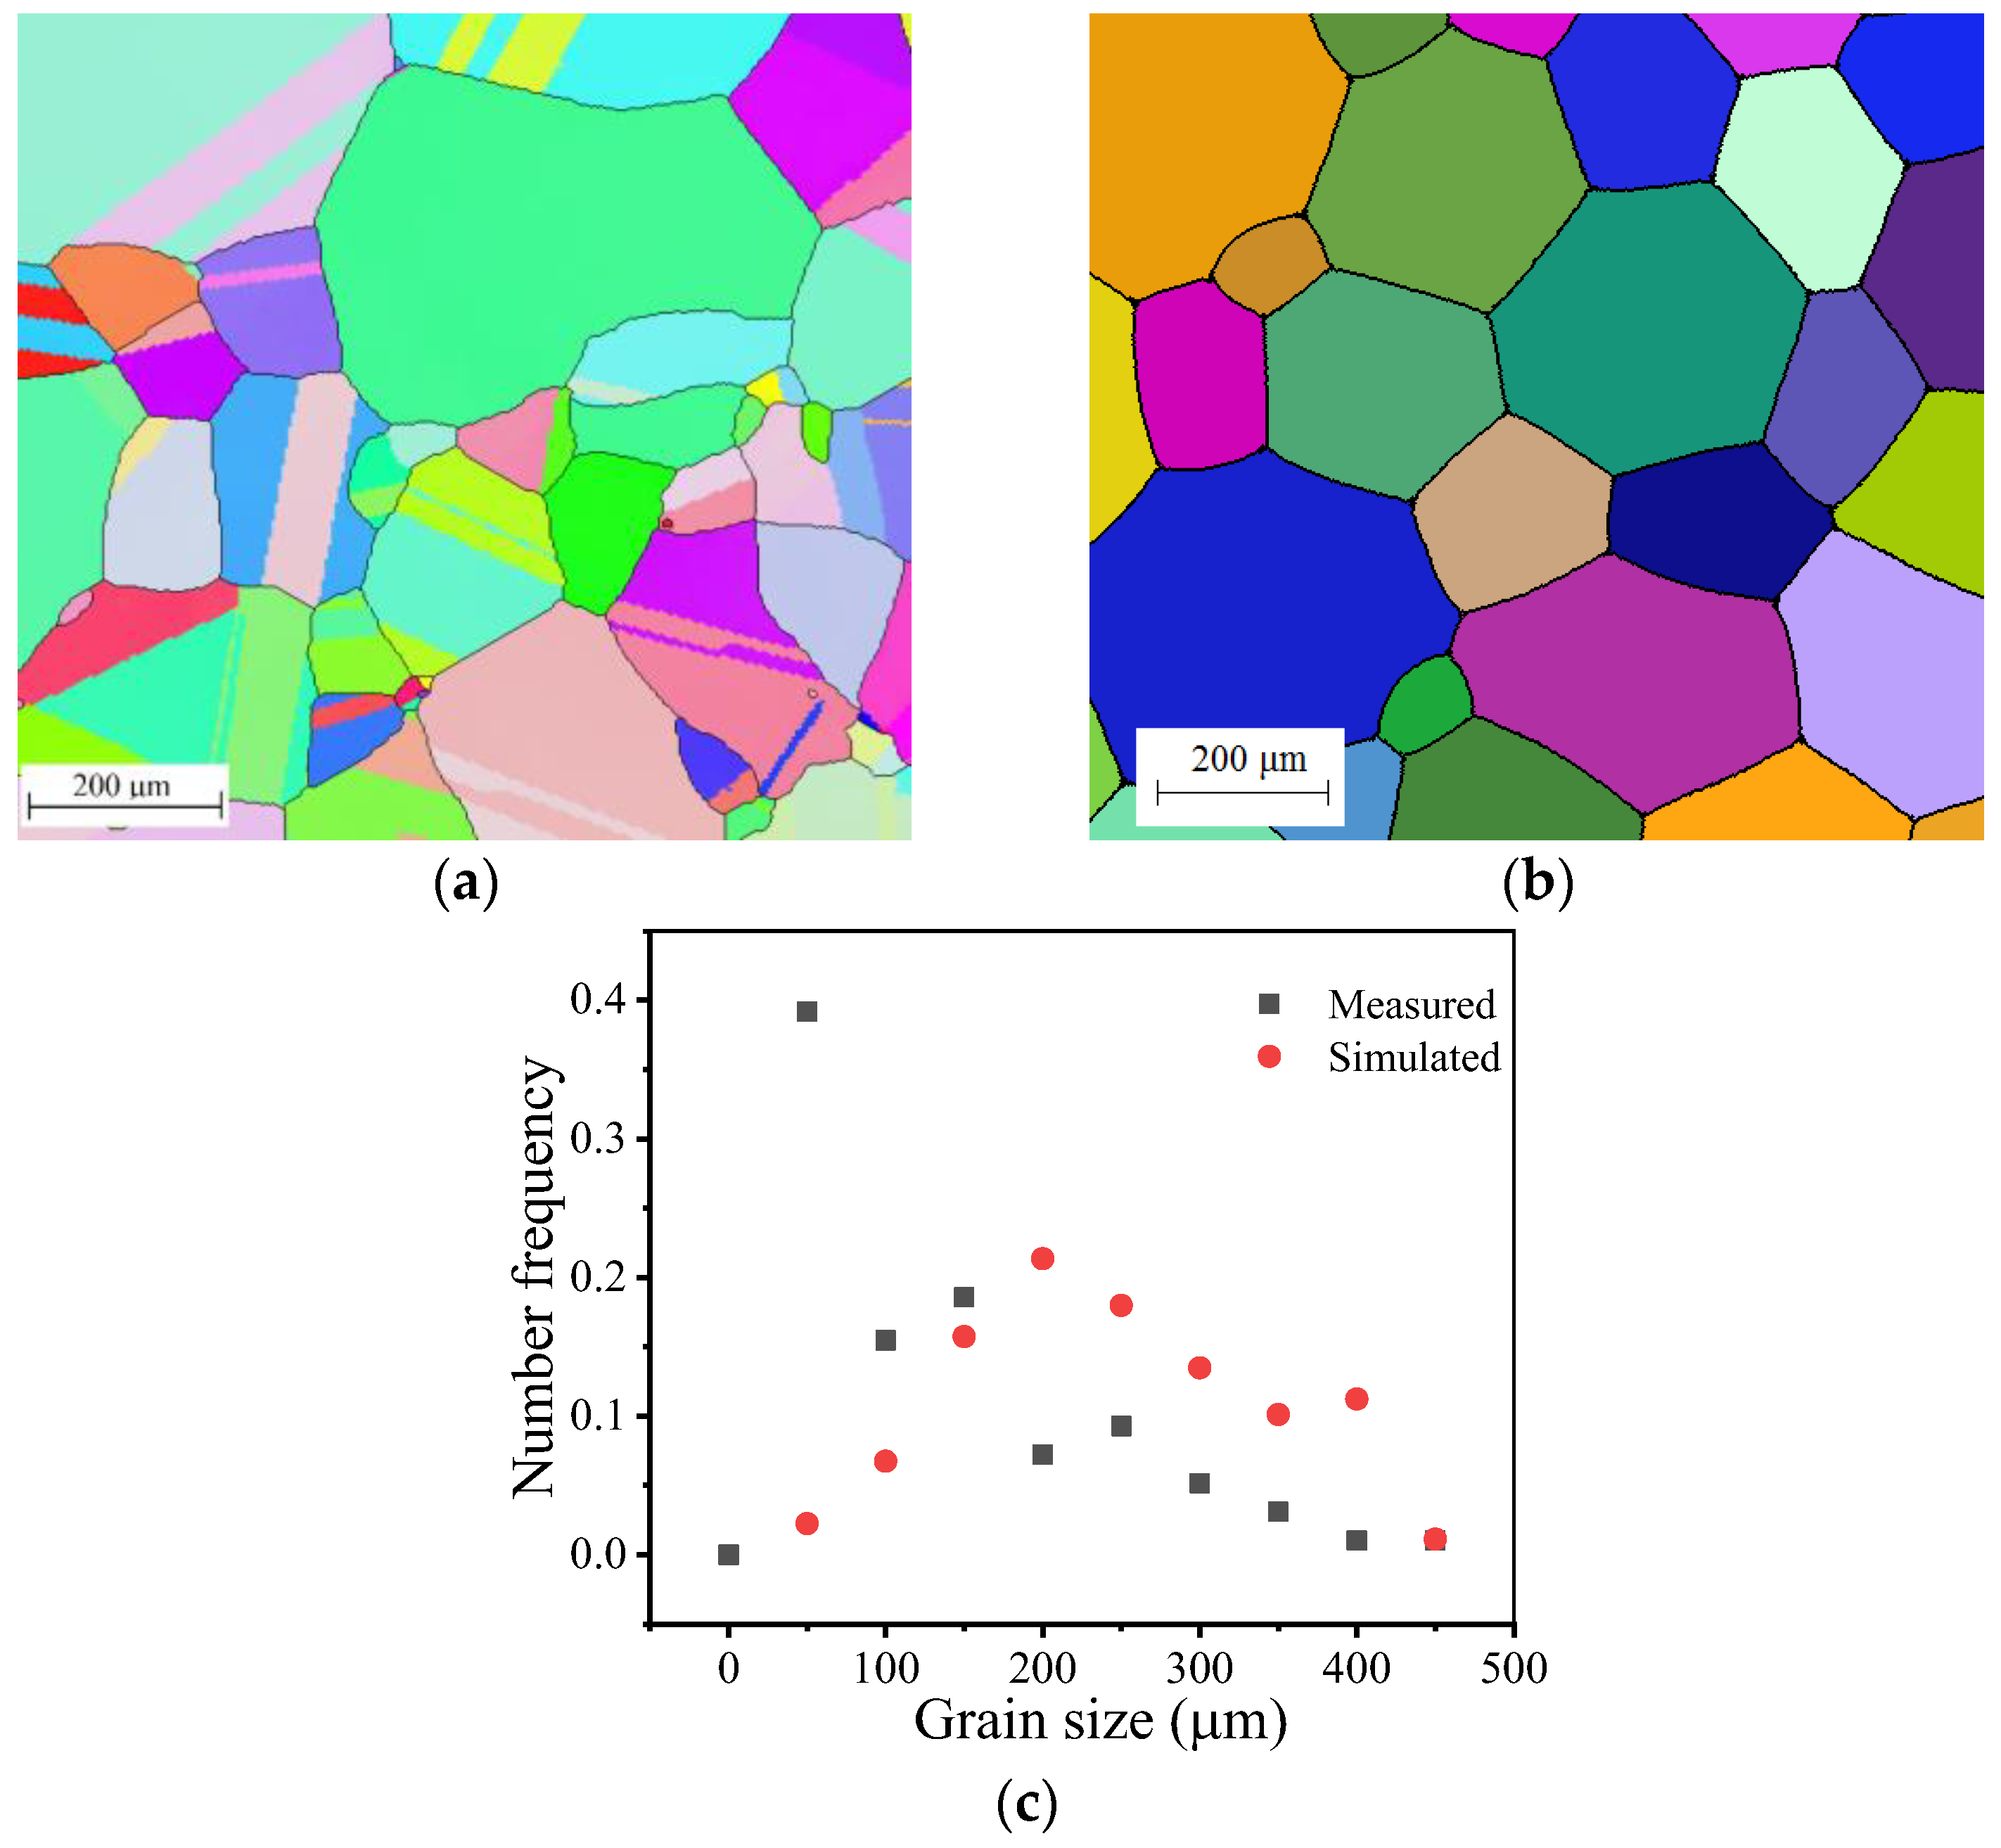
Figure 9 shows the measured and simulated grain sizes under different holding temperatures. The simulated grain growth curves are capable of capturing the dependence of grain size on holding time under different holding temperatures. Figure 10 shows the comparisons between measured and simulated grain structure under the holding temperature of 1383 K and a holding time of 2400 s. The measured and simulated frequency patterns of grain size are similar. However, the measured frequency is much higher than the simulated value at a grain size of 50 μm and nearly all the simulated frequencies are higher than the measured values when the grain size is larger than 200 μm. These large differences in frequency pattern stem from a flaw in the initial microstructure creation method for CA simulation: during the creation of the initial microstructure for CA simulation, only the average grain size is controllable. The grain nuclei are randomly seeded, making the grain distribution uncontrollable.

5. Conclusions

The grain growth in the studied superalloy was investigated by isothermal heat treatments and a cellular automaton (CA) model. The following conclusions can be drawn:
(1)
The holding temperature and holding time have large effects on the grain growth behavior of the studied superalloy. The grain structure gradually coarsens as the holding temperature and holding time increase.
(2)
The grain growth behavior of the studied superalloy can be described by the parabolic equation G t 2.43 G 0 2.43 = 3.63 × 10 14 exp [ 3.2 × 10 5 / ( R T ) ] t .
(3)
A CA model was developed to simulate the evolution of the grain structure in the studied superalloy. The local grain boundary curvature was effectively evaluated and the relationship between the grain boundary mobility and holding temperature was established. The simulated grain growth curves show that the developed CA model can capture the dependence of the grain size on the holding time under different holding temperatures.

Author Contributions

Conceptualization, Y.-X.L.; data curation, Y.-X.L. and R.-H.L.; formal analysis, Y.-X.L.; funding acquisition, Y.-X.L.; investigation, Y.-X.L. and Z.-J.K.; methodology, Y.-X.L.; project administration, Y.-X.L. and J.-J.R.; resources, Y.-X.L.; software, Y.-X.L. and Z.-J.K.; supervision, Y.-X.L. and J.-J.R.; validation, Y.-X.L.; visualization, Y.-X.L.; writing—original draft, Y.-X.L.; writing—review and editing, Y.-X.L. and J.-Q.S. All authors have read and agreed to the published version of the manuscript.

Funding

This research was funded by National Natural Science Foundation of China (Grant No. 51905098, 51905048), KEY Laboratory of Robotics and Intelligent Equipment of Guangdong Regular Institutions of Higher Education (Grant No. 2017KSYS009), Innovation Center of Robotics And Intelligent Equipment (Grant No. KCYCXPT2017006), Research and Development Program in Key Fields of Guangdong Province (Grant No. 2020B090926002), Young Creative Talents of Guangdong Regular Institutions of Higher Education (Grant No. 2018KQNCX254),The Joint Funds of Guangdong Basic and Applied Basic Research Foundation (Grant No. 2019A1515110261).

Institutional Review Board Statement

Not applicable.

Informed Consent Statement

Not applicable.

Data Availability Statement

The data presented in this study are available in this article.

Acknowledgments

Thanks to Yue-Hong Cai for her support.

Conflicts of Interest

The authors declare no conflict of interest.

References

  1. Yan, F.; Xiong, W.; Faierson, E.J. Grain structure control of additively manufactured metallic materials. Materials 2017, 10, 1260. [Google Scholar] [CrossRef] [Green Version]
  2. Naghizadeh, M.; Mirzadeh, H. Effects of grain size on mechanical properties and work-hardening behavior of AISI 304 austenitic stainless steel. Steel Res. Int. 2019, 90, 1900153. [Google Scholar] [CrossRef]
  3. Lawrence, S.K.; Yagodzinskyy, Y.; Hänninen, H.; Korhonen, E.; Tuomisto, F.; Harris, Z.D.; Somerday, B.P. Effects of grain size and deformation temperature on hydrogen-enhanced vacancy formation in Ni alloys. Acta Mater. 2017, 128, 218–226. [Google Scholar] [CrossRef] [Green Version]
  4. Wang, K.; Wen, D.X.; Li, J.J.; Zheng, Z.Z.; Xiong, Y.B. Hot deformation behaviors of low-alloyed ultrahigh strength steel 30CrMnSiNi2A: Microstructure evolution and constitutive modeling. Mater. Today Commun. 2021, 26, 102009. [Google Scholar] [CrossRef]
  5. Lin, Y.C.; Wu, Q.; Pang, G.D.; Jiang, X.Y.; He, D.G. Hot tensile deformation mechanism and dynamic softening behavior of Ti–6Al–4V alloy with thick lamellar microstructures. Adv. Eng. Mater. 2020, 22, 1901193. [Google Scholar] [CrossRef]
  6. Wei, K.; Hu, R.; Yin, D.; Xiao, L.; Pang, S.; Cao, Y.; Zhou, H.; Zhao, Y.; Zhu, Y. Grain size effect on tensile properties and slip systems of pure magnesium. Acta Mater. 2021, 206, 116604. [Google Scholar] [CrossRef]
  7. Guo, J.; Zhong, M.; Zhou, W.; Zhang, Y.; Wu, Z.; Li, Y.; Zhang, J.; Liu, Y.; Yang, H. Grain size effect of the γ phase precipitation on martensitic transformation and mechanical properties of Ni–Mn–Sn–Fe Heusler alloys. Materials 2021, 14, 2339. [Google Scholar] [CrossRef]
  8. Chen, Z.J.; Lin, Y.C.; He, D.G.; Lou, Y.M.; Chen, M.S. A unified dislocation density-based model for an aged polycrystalline Ni-based superalloy considering the coupled effects of complicate deformation mechanisms and initial δ phase. Mater. Sci. Eng. A 2021, 827, 142062. [Google Scholar] [CrossRef]
  9. Petrů, J.; Pagáč, M.; Grepl, M. Laser beam drilling of Inconel 718 and its effect on mechanical properties determined by static uniaxial tensile testing at room and elevated temperatures. Materials 2021, 14, 3052. [Google Scholar] [CrossRef] [PubMed]
  10. Lin, Y.C.; Yang, H.; Chen, D.D.; He, D.G. Stacked auto-encoder network to predict tensile deformation behavior of a typical nickel-based superalloy considering Portevin–Le Chatelier effects. Met. Mater. Int. 2021, 27, 254–261. [Google Scholar] [CrossRef]
  11. Gupta, M.K.; Pruncu, C.I.; Mia, M.; Singh, G.; Singh, S.; Prakash, C.; Sood, P.K.; Gill, H.S. Machinability investigations of Inconel-800 super alloy under sustainable cooling conditions. Materials 2018, 11, 2088. [Google Scholar] [CrossRef] [Green Version]
  12. Li, F.; Bai, Y.; Meng, L.; Fu, R.; Zhong, Y.; Du, J.; Yin, F.; Feng, D. Impact of aging heat treatment on microstructure and mechanical properties of a newly developed GH4096 disk superalloy. Mater. Charact. 2020, 161, 110175. [Google Scholar] [CrossRef]
  13. Ruan, J.J.; Ueshima, N.; Oikawa, K. Phase transformations and grain growth behaviors in superalloy 718. J. Alloy. Compd. 2018, 737, 83–91. [Google Scholar] [CrossRef]
  14. Lee, S.B.; Yoon, D.Y.; Henry, M.F. Abnormal grain growth and grain boundary faceting in a model Ni-base superalloy. Acta Mater. 2000, 48, 3071–3080. [Google Scholar] [CrossRef]
  15. Song, K.; Aindow, M. Grain growth and particle pinning in a model Ni-based superalloy. Mater. Sci. Eng. A 2008, 479, 365–372. [Google Scholar] [CrossRef]
  16. Aoki, C.; Ueno, T.; Ohno, T.; Oikawa, K. Influence of hot-working conditions on grain growth of superalloy 718. J. Mater. Process. Technol. 2019, 267, 26–33. [Google Scholar] [CrossRef]
  17. Tian, G.; Jia, C.; Liu, J.; Hu, B. Experimental and simulation on the grain growth of P/M nickel-base superalloy during the heat treatment process. Mater. Des. 2009, 30, 433–439. [Google Scholar] [CrossRef]
  18. Collins, D.M.; Conduit, B.D.; Stone, H.J.; Hardy, M.C.; Conduit, G.J.; Mitchell, R.J. Grain growth behaviour during near-γ′ solvus thermal exposures in a polycrystalline nickel-base superalloy. Acta Mater. 2013, 61, 3378–3391. [Google Scholar] [CrossRef]
  19. Chen, F.; Zhu, H.; Chen, W.; Ou, H.; Cui, Z. Multiscale modeling of discontinuous dynamic recrystallization during hot working by coupling multilevel cellular automaton and finite element method. Int. J. Plast. 2021, 145, 103064. [Google Scholar] [CrossRef]
  20. Chen, D.D.; Lin, Y.C.; Wu, F. A design framework for optimizing forming processing parameters based on matrix cellular automaton and neural network-based model predictive control methods. Appl. Math. Model. 2019, 76, 918–937. [Google Scholar] [CrossRef]
  21. Ogawa, J.; Natsume, Y. Three-dimensional large-scale grain growth simulation using a cellular automaton model. Comp. Mater. Sci. 2021, 199, 110729. [Google Scholar] [CrossRef]
  22. Babu, K.A.; Prithiv, T.; Gupta, A.; Mandal, S. Modeling and simulation of dynamic recrystallization in super austenitic stainless steel employing combined cellular automaton, artificial neural network and finite element method. Comp. Mater. Sci. 2021, 195, 110482. [Google Scholar] [CrossRef]
  23. Zhang, S.; Hou, C.; Ma, Z. Grain growth of Ti–6Al–4V alloy predicted with cellular automaton-finite difference (CAFD) model. Int. J. Met. 2021, 1–8. [Google Scholar] [CrossRef]
  24. Xiong, F.; Huang, C.; Kafka, O.L.; Lian, Y.; Yan, W.; Chen, M.; Fang, D. Grain growth prediction in selective electron beam melting of Ti-6Al-4V with a cellular automaton method. Mater. Des. 2021, 199, 109410. [Google Scholar] [CrossRef]
  25. Zhang, J.; Liou, F.; Seufzer, W.; Taminger, K. A coupled finite element cellular automaton model to predict thermal history and grain morphology of Ti-6Al-4V during direct metal deposition (DMD). Addit. Manuf. 2016, 11, 32–39. [Google Scholar] [CrossRef]
  26. Ansari Dezfoli, A.R.; Lo, Y.L.; Raza, M.M. Prediction of epitaxial grain growth in single-track laser melting of IN718 using integrated finite element and cellular automaton approach. Materials 2021, 14, 5202. [Google Scholar] [CrossRef]
  27. Zhang, Y.; Zhou, J.; Yin, Y.; Shen, X.; Shehabeldeen, T.A.; Ji, X. GPU-Accelerated cellular automaton model for grain growth during directional solidification of nickel-based superalloy. Metals 2021, 11, 298. [Google Scholar] [CrossRef]
  28. Liu, Y.X.; Lin, Y.C.; Zhou, Y. 2D cellular automaton simulation of hot deformation behavior in a Ni-based superalloy under varying thermal-mechanical conditions. Mater. Sci. Eng. A 2017, 691, 88–99. [Google Scholar] [CrossRef]
  29. Bachmann, F.; Hielscher, R.; Schaeben, H. In Texture analysis with MTEX–free and open source software toolbox. Solid State Phenom. 2010, 160, 63–68. [Google Scholar] [CrossRef] [Green Version]
  30. Nolze, G.; Hielscher, R. Orientations-perfectly colored. J. Appl. Crystallogr. 2016, 49, 1786–1802. [Google Scholar] [CrossRef]
  31. Zhang, Y.; Wang, L.; Findley, K.O.; Speer, J.G. Influence of temperature and grain size on austenite stability in medium manganese steels. Metall. Mater. Trans. A 2017, 48, 2140. [Google Scholar] [CrossRef]
  32. Omori, T.; Kusama, T.; Kawata, S.; Ohnuma, I.; Sutou, Y.; Araki, Y.; Ishida, K.; Kainuma, R. Abnormal grain growth induced by cyclic heat treatment. Science 2013, 341, 1500–1502. [Google Scholar] [CrossRef] [PubMed]
  33. Chen, M.S.; Zou, Z.H.; Lin, Y.C.; Li, H.B.; Wang, G.Q. Formation mechanism of large grains inside annealed microstructure of GH4169 superalloy by cellular automation method. J. Mater. Sci. Technol. 2019, 35, 1403–1411. [Google Scholar] [CrossRef]
  34. Wen, D.; Long, P.; Li, J.; Huang, L.; Zheng, Z. Effects of linear heat input on microstructure and corrosion behavior of an austenitic stainless steel processed by wire arc additive manufacturing. Vacuum 2020, 173, 109131. [Google Scholar] [CrossRef]
  35. Wang, M.J.; Sun, C.Y.; Fu, M.W.; Liu, Z.L.; Qian, L.Y. Study on the dynamic recrystallization mechanisms of Inconel 740 superalloy during hot deformation. J. Alloy. Compd. 2020, 820, 153325. [Google Scholar] [CrossRef]
  36. Atkinson, H.V. Overview no. 65. Theories of normal grain growth in pure single phase systems. Acta Metall. 1988, 36, 469–491. [Google Scholar] [CrossRef]
  37. Moshtaghi, M.; Safyari, M. Effect of dwelling time in VIM furnace on chemical composition and mechanical properties of a Ni–Fe–Cr alloy. Vacuum 2019, 169, 108890. [Google Scholar] [CrossRef]
  38. Moshtaghi, M.; Abbasi, S.M. Effect of vacuum degree in VIM furnace on mechanical properties of Ni–Fe–Cr based alloy. Trans. Nonferrous Met. Soc. China 2012, 22, 2124–2130. [Google Scholar] [CrossRef]
  39. Illescas, S.; Fernández, J.; Guilemany, J.M. Kinetic analysis of the austenitic grain growth in HSLA steel with a low carbon content. Mater. Lett. 2008, 62, 3478–3480. [Google Scholar] [CrossRef]
  40. Thomas, S.L.; Chen, K.; Han, J.; Purohit, P.K.; Srolovitz, D.J. Reconciling grain growth and shear-coupled grain boundary migration. Nat. Commun. 2017, 8, 1764. [Google Scholar] [CrossRef] [Green Version]
  41. Liu, Y.X.; Lin, Y.C.; Li, H.B.; Wen, D.X.; Chen, X.M.; Chen, M.S. Study of dynamic recrystallization in a Ni-based superalloy by experiments and cellular automaton model. Mater. Sci. Eng. A 2015, 626, 432–440. [Google Scholar] [CrossRef]
  42. Bullard, J.W.; Garboczi, E.J.; Carter, W.C.; Fuller, E.R. Numerical methods for computing interfacial mean curvature. Comp. Mater. Sci. 1995, 4, 103–119. [Google Scholar] [CrossRef]
  43. Frette, O.I.; Virnovsky, G.; Silin, D. Estimation of the curvature of an interface from a digital 2D image. Comp. Mater. Sci. 2009, 44, 867–875. [Google Scholar] [CrossRef] [Green Version]
  44. Han, F.; Tang, B.; Kou, H.; Li, J.; Feng, Y. Cellular automata simulations of grain growth in the presence of second-phase particles. Model. Simul. Mater. Sci. 2015, 23, 065010. [Google Scholar] [CrossRef]
  45. Lin, Y.C.; Liu, Y.X.; Chen, M.S.; Huang, M.H.; Ma, X.; Long, Z.L. Study of static recrystallization behavior in hot deformed Ni-based superalloy using cellular automaton model. Mater. Des. 2016, 99, 107–114. [Google Scholar] [CrossRef]
  46. Su, F.; Liu, W.; Wen, Z. Three-dimensional cellular automata simulation of the austenitizing process in GCr15 bearing steel. Materials 2019, 12, 3022. [Google Scholar] [CrossRef] [PubMed] [Green Version]
  47. Zheng, C.; Raabe, D.; Li, D. Prediction of post-dynamic austenite-to-ferrite transformation and reverse transformation in a low-carbon steel by cellular automaton modeling. Acta Mater. 2012, 60, 4768–4779. [Google Scholar] [CrossRef]
  48. Han, F.B.; Tang, B.; Kou, H.; Li, J.; Feng, Y. Effects of subgrain size and static recrystallization on the mechanical performance of polycrystalline material: A microstructure-based crystal plasticity finite element analysis. Prog. Nat. Sci. Mater. Int. 2015, 25, 58–65. [Google Scholar] [CrossRef] [Green Version]
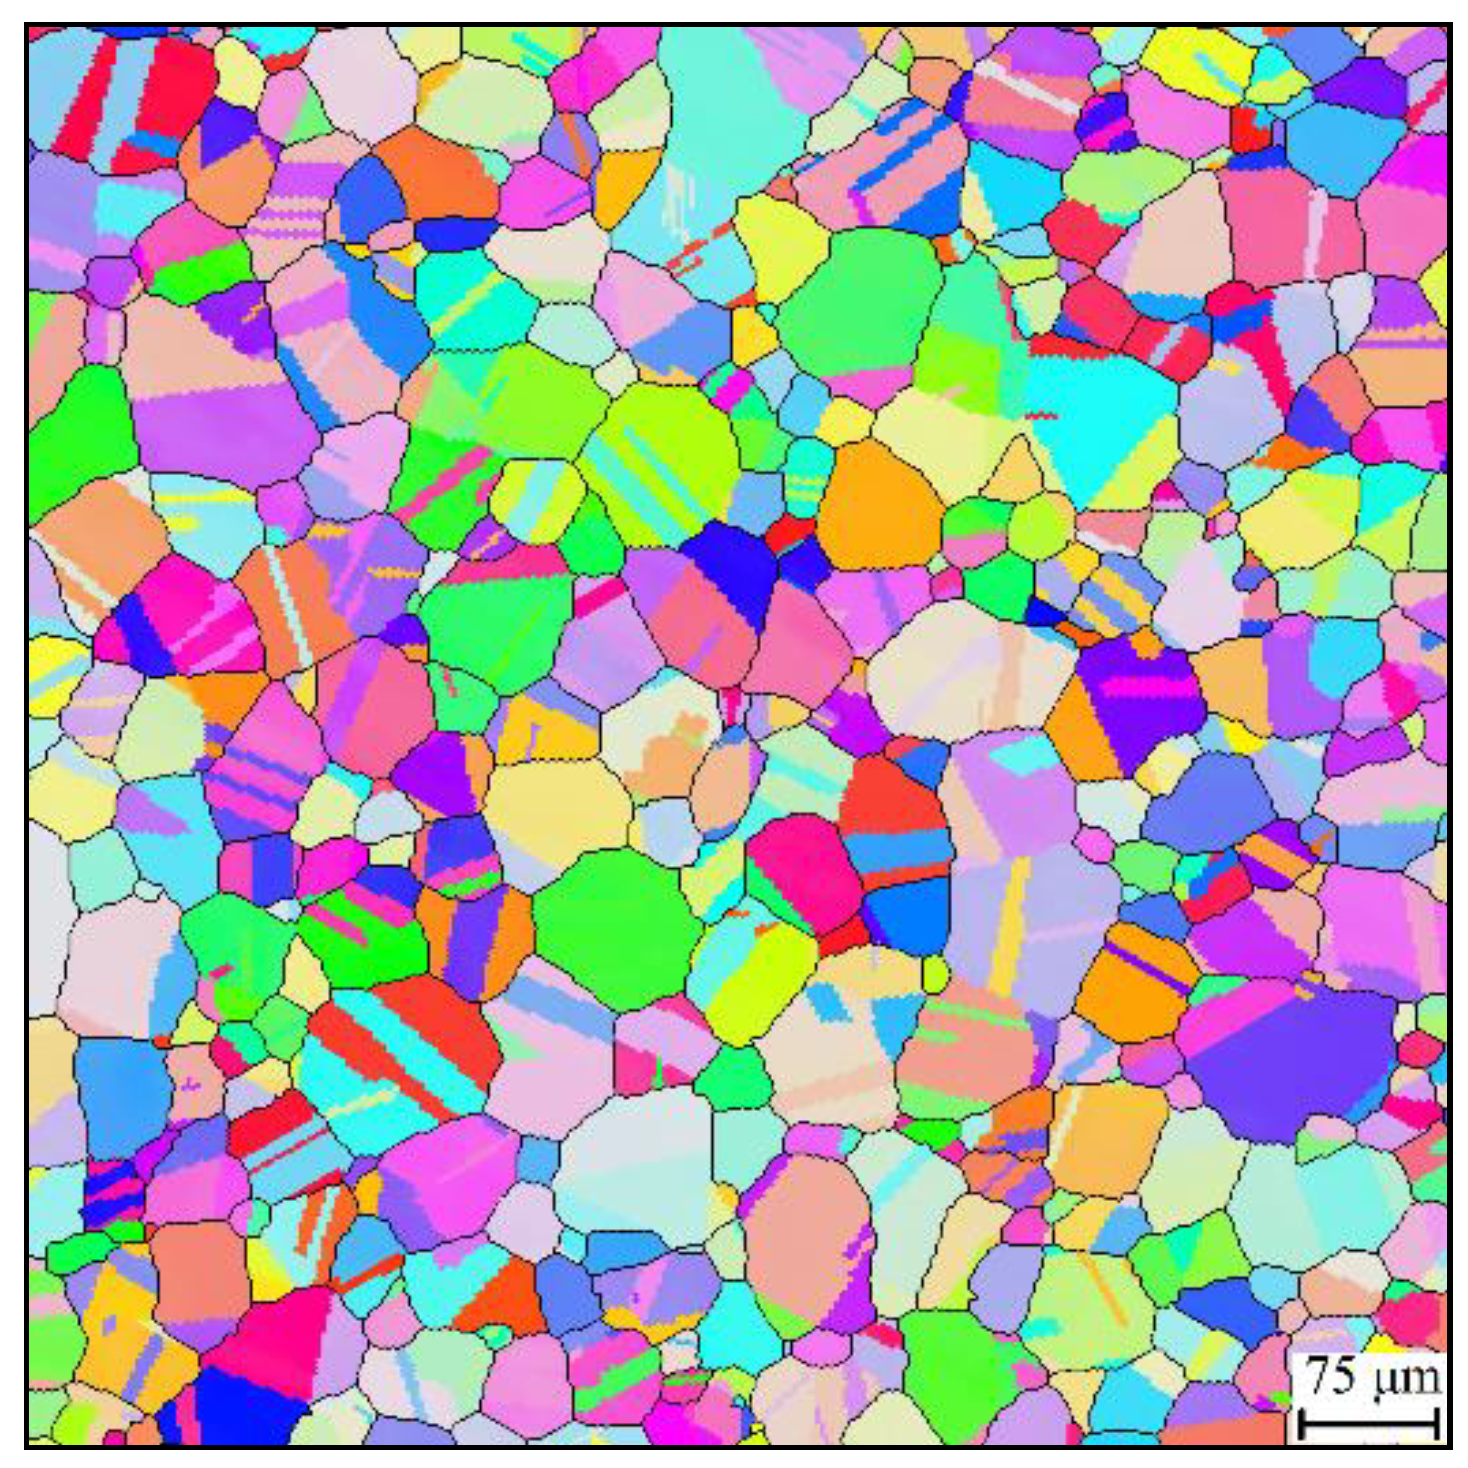
Figure 1. Initial grain structure for grain growth tests.
Materials 14 06922 g001
Figure 2. Grain structures under holding temperature of 1353 K and holding time of (a) 600 s, (b) 1500 s, and (c) 2400 s.
Materials 14 06922 g002
Figure 3. Grain structure under holding time of 540 s and holding temperature of (a) 1413 K, (b) 1443 K, and (c) 1473 K.
Materials 14 06922 g003
Figure 4. Grain sizes at different holding times and holding temperatures.
Materials 14 06922 g004
Figure 5. BSE image of the microstructure after solution heat treatment.
Materials 14 06922 g005
Figure 6. Comparisons between measured and predicted grain sizes: (a) fitting lines; (b) the coefficient of determination.
Materials 14 06922 g006
Figure 7. Template disk for evaluation of boundary curvature.
Materials 14 06922 g007
Figure 8. Comparison between analytical and simulated results for circular grain shrinkage.
Materials 14 06922 g008
Figure 9. Comparisons between measured and simulated grain sizes.
Materials 14 06922 g009
Figure 10. Comparisons between measured and simulated grain structure: (a) measured; (b) simulated; (c) grain number frequency.
Materials 14 06922 g010
Table 1. Chemical composition (wt.%) of the studied superalloy.
NiCrNbMoTiAlCoCFe
53.8218.385.423.030.950.410.20.027Bal.
Table 2. Experimental procedure of grain growth tests.
Routine for Solution Heat TreatmentHolding Temperature for Grain Growth
Experiments (K)
Holding Time for Grain Growth
Experiments (s)
1338 K/1200 s + ice water quench1353600, 900, 1200, 1500, 2400
1383600, 900, 1200, 1500, 2400
1413360, 540, 720, 900, 1440
1443180, 360, 540, 900, 1440
1473180, 360, 540, 900, 1440
Table 3. Material parameters related with the prediction of grain size.
Parametersn k 0 ( μ m n · s 1 ) Q (kJ·mol−1)
values2.433.63 × 1014320
Table 4. Values of M for the studied superalloy.
Temperature (K)13531383141314431473
M (m4 J−1 s−1)8.5 × 10−121.75 × 10−112.7 × 10−114 × 10−116.5 × 10⁻¹¹
Table 5. Material parameters related with the calculation of grain boundary mobility.
ParameterδDob (m3·s−1)Qb (J·mol−1)R (J·mol−1·K−1)b (m)k (J·K−1)
Value5.76 × 10−122.55 × 1058.3142.49 × 10−101.38 × 10⁻²³
Publisher’s Note: MDPI stays neutral with regard to jurisdictional claims in published maps and institutional affiliations.