1. Introduction
In recent decades, a number of studies devoted to identification of material properties such as Young’s modulus, yield stress, and work hardening modulus by using experimental indentation data, finite element (FE) simulations, and optimisation procedures for solving inverse problems have occurred in the literature. Various optimisation techniques have been used by researchers, see, e.g., [
1,
2,
3,
4] to determine material properties from indentation load–displacement curves tests. Identification of elastic and/or elasto-visco-plastic constitutive laws from indentation tests in terms of general theoretical framework of inverse problems solution has been described in [
5,
6]. With respect to brittle materials, cohesive zone FE simulations of indentation cracking have been performed e.g., in [
7,
8,
9,
10] to investigate the crack morphology, the change of crack length with indenter shape, a quantitative evaluation of the threshold load for indentation fracture, and to explore a limitation of analytical models such as Lawn-Evans-Marshall model [
11]. For indentation crack initiation and propagation modelling a cohesive interface consisting of cohesive elements is placed in the plane of potential cracking and only mode I type crack is considered. The behaviour of the cohesive elements in this interface is governed by a traction-separation law which mostly has the bilinear form characterised by three parameters- peak cohesive traction
σmax, corresponding damage-initiating displacement ∆
c and failure displacement ∆
sep. It was shown in [
12] that the cohesive energy density and the peak cohesive traction play a far more important role than the shape of the cohesive traction—separation curve in predicting the final fracture behaviour. In case of the bilinear form of the cohesive traction—separation law the cohesive energy density (critical fracture energy) 2
Γ can be calculated by 2
Critical review of various cohesive zone models is given in [
13]. Contrary to analytical approaches, cohesive interface FE simulations exhibit a natural advantage consisting in no need to specify the crack front a priori. Namely, the crack front is found as a result of the solution of the boundary value problem. Moreover, the influence of residual stresses developing under the indent due to inelastic compressive behaviour of brittle materials [
10,
14,
15,
16,
17] is more reliably captured. Some care is needed with respect to the elasticity of the cohesive interface, specifically one should avoid double-counting the elasticity—once in the cohesive law and a second time as part of the bulk behaviour. Nevertheless, the effect of this issue is negligible when cohesive surfaces are only specified along a potential single crack path such as in the case of indentation cracking, or if the stiffness of cohesive surfaces is infinite [
18]. Currently, there is an increasing effort to combine cohesive zone models with extended finite element method (XFEM) to model crack growth [
19,
20,
21]. XFEM can avoid remeshing near the crack tip as the crack grows and all other difficulties connected with it. With respect to indentation crack modelling, remeshing is not needed as the indentation cracks extend only over short distances without kinking and a zone of the potential crack formation is covered with cohesive elements. Thus, the application of XFEM does not seem to bring any other benefits in this context. To interpret the results of simulation of the growth of indentation cracks in terms of the linear fracture mechanics, the cohesive (bridging) zone must be significantly smaller than the crack. Hence, great care is needed in applying the simulation results to short crack problems under indentation tests [
22,
23].
A direct application of the former macroscopic cohesive laws to cleavage fracture, which entails a simple separation of the atomic planes, is not easily workable. Consider (110) cleavage planes in Si crystal. Their interplanar spacing
d is 1.92 Å. The (110) cracks with [
] crack front in Si crystal were analysed using ab initio and gradient elasticity theory in our study [
24]. It was shown that the critical crack opening
δc (interplanar separation) leading to the loss of the crystal bearing capacity is 0.2 nm, the corresponding peak stress is of the order of theoretical strength, and the cohesive energy density 2
. Moreover, the length of the cohesive zone is very small, approximately 0.6 nm. It means that macroscopic FE simulation would require extremely fine mesh, which is often unfeasible. Nguyen and Ortiz [
25] suggested a way to the macroscopic form of the cohesive law by considering the cooperative behaviour of a large number
N of interatomic planes forming a cohesive layer. The thickness of the cohesive layer in FE simulations is given by the local element size
D. Thus, the number of atomic planes in the cohesive layer is
, where the factor 2 was added due to symmetry. Nguyen and Ortiz showed that for sufficiently large
N the macroscopic critical opening displacement ∆
c and the corresponding macroscopic cohesive stress
for the separation of a single atomic plane asymptotically scale as
where the interplanar modulus
C depends on a specific material. For the interplanar cohesive potential suggested in [
26]
the interplanar modulus
C for (110) planes in Si crystal is
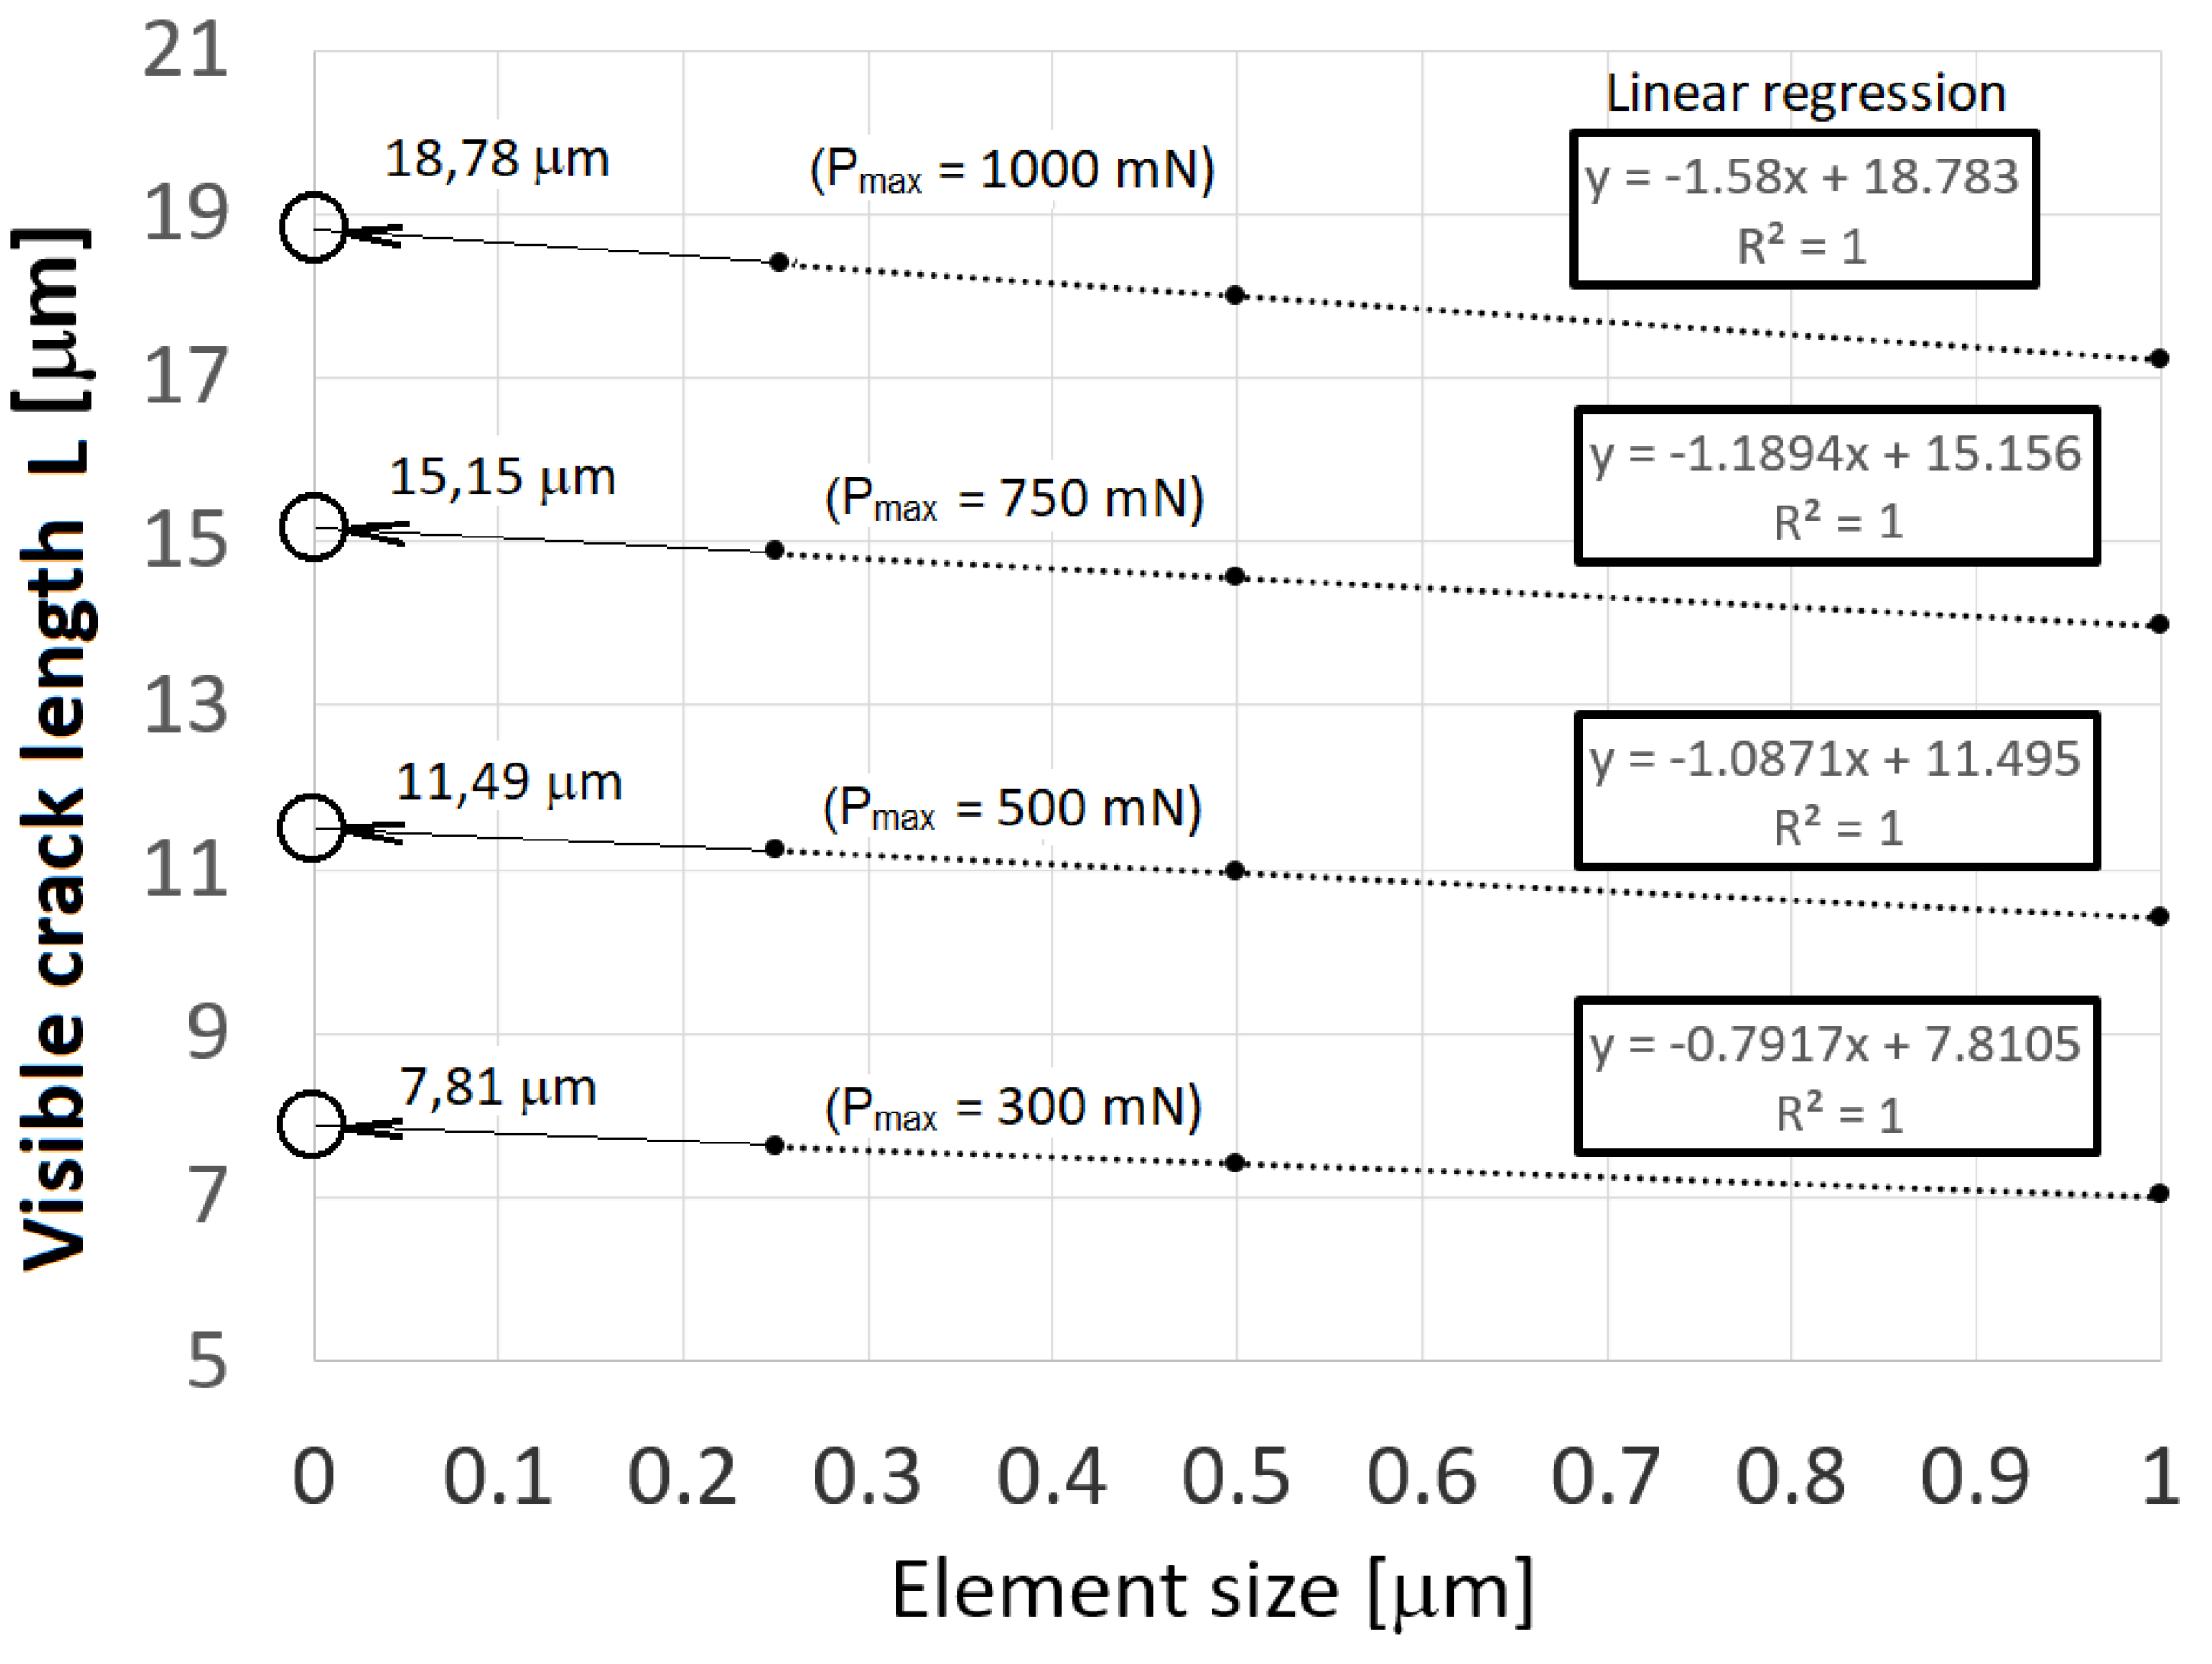
For the element size D = 0.25 μm, Equation (1) provides . While the critical opening displacement ∆c and the corresponding macroscopic cohesive stress do depend on the element size, the cohesive energy density 2Γ is independent of the size element. The aim of this study is to use experimental microindentation data, FE simulations with cohesive zone modelling, and an optimisation procedure to determine the cohesive energy density of single crystals without having to check whether the size of the cohesion zone is considerably less than the crack size and thus to analyse the problems of short cracks. Obviously, such a procedure is particularly suitable for determining fracture properties of MEMS/NEMS parts or thin films using micro/nano indentation tests.
2. Materials and Methods
As-received Si crystals (100) with dimensions 50 mm × 50 mm × 3 mm were covered by poly(methyl methacrylate) PMMA before cutting and were precut to 1 cm × 1 cm samples by laser dicer. The cover layer PMMA was removed by acetone, isopropanol and deionised water in an ultrasound cleaner. The final cleaning step was etching of organic residues by oxygen plasma in Diener Plasma cleaner (Diener electronic GmbH, Ebhausen, Germany). Substrates were covered by a double layer of optics resists by spin-coating process. This double layer of resists is important for the lift-off process. The bottom resist was AR-BR 5460 (Allresist GmbH, Strausberg, Germany) and the top resist was AR-P 3540 (Allresist GmbH, Strausberg, Germany). The bottom resist is more sensitive than top resist and this combination of resists creates an undercut in resist layer. The exposure of the resist was done by UV Direct Write Laser system 66+ from Heidelberg Instruments (Heidelberg, Germany). After exposure, samples were developed by AR 300-47 (mixed with deionised water in the ratio 1:1, Allresist GmbH, Strausberg) for 60 s. The residues after developing were removed by oxygen plasma by reactive ion etching in Oxford Instruments Plasma Technology PlasmaPro NGP 80 (Oxford, UK). Optionally, the native oxide layer could be removed by buffered hydrofluoric acid (BOE 7:1 − HF:NH4F = 12.5:87.5%).
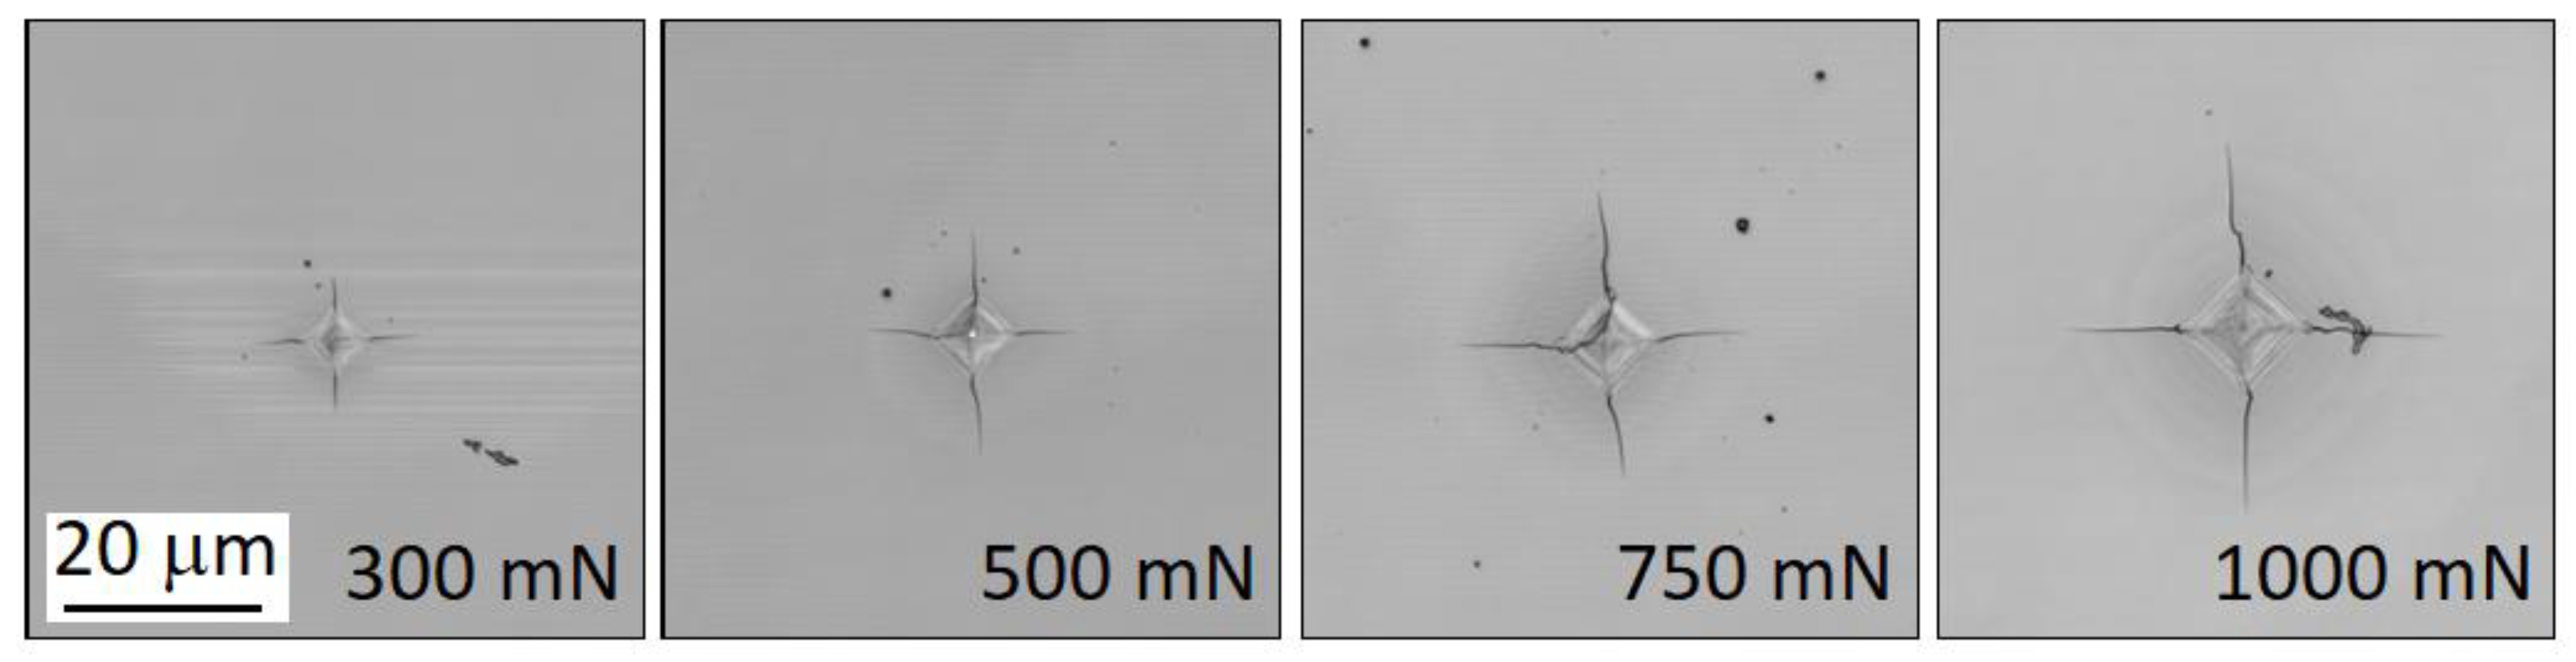
The indentation tests were load-controlled and performed using Fischerscope H100 XYp equipment (Riley Industries Ltd., Aldridge, UK) with maximal applied force to load cell of 1000 mN acting on standard Vickers diamond indenter with the centreline-to-face angle
ψ = 68° which was aligned along the cleavage plane {101} in the direction <100> of Si crystal. The minimal applied force, which the equipment can detect, is 0.4 mN with the force resolution 20 μN and depth resolution ±2nm. In this study, the test forces of 300 mN, 500 mN, 750 mN, and 1000 mN, respectively, were applied. Loading stage lasted 20 s followed by 5 s creep and with 20 s long unloading stage. The unloading stage was followed by 5-s long period of constant loading of 0.4 mN. For each of applied forces 25 indentation tests were performed to minimise the experimental error. The crack length was measured by confocal laser microscope Olympus LEXT4000 (Olympus Corporation) from the centre of indentation.
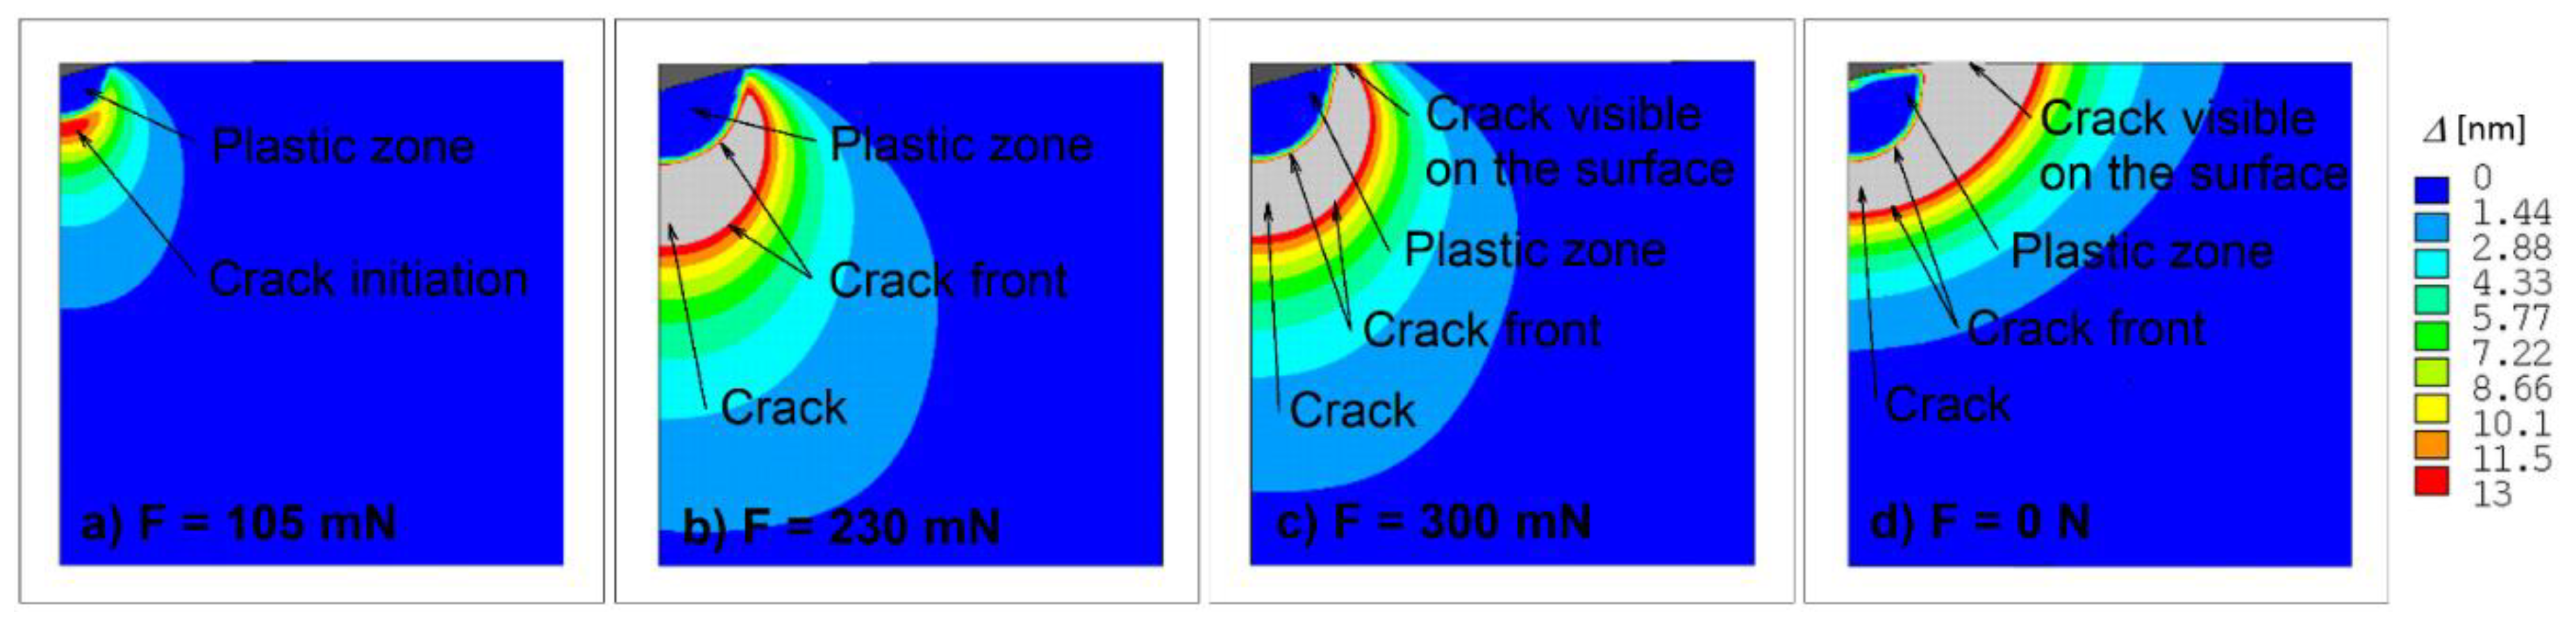
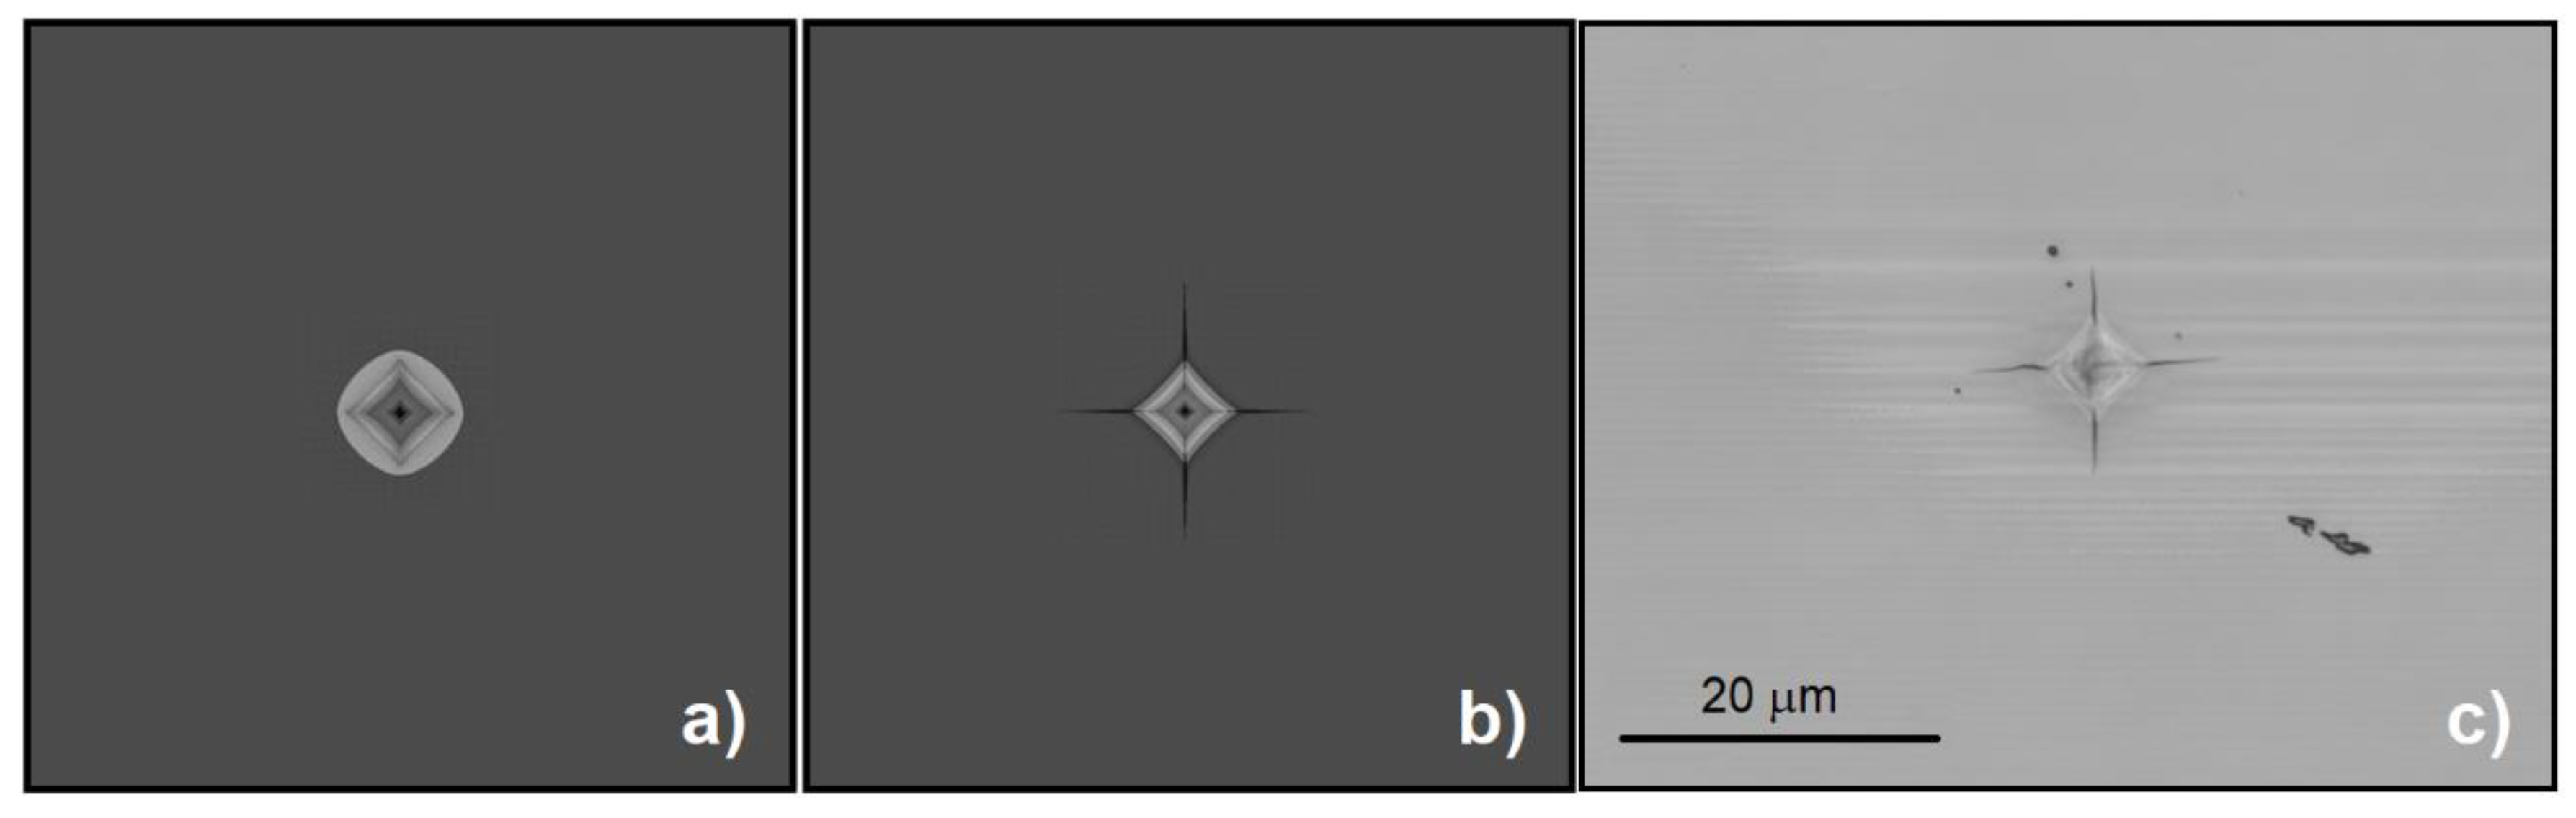
Figure 1 shows details of indentation with radial cracks after indentation tests. During indentation the crack behaviour is impossible to optically track because cracks spread under the surface, and they are thus invisible. The first visible radial cracks on the crystal top surface occur during the unloading stage of indentation tests.
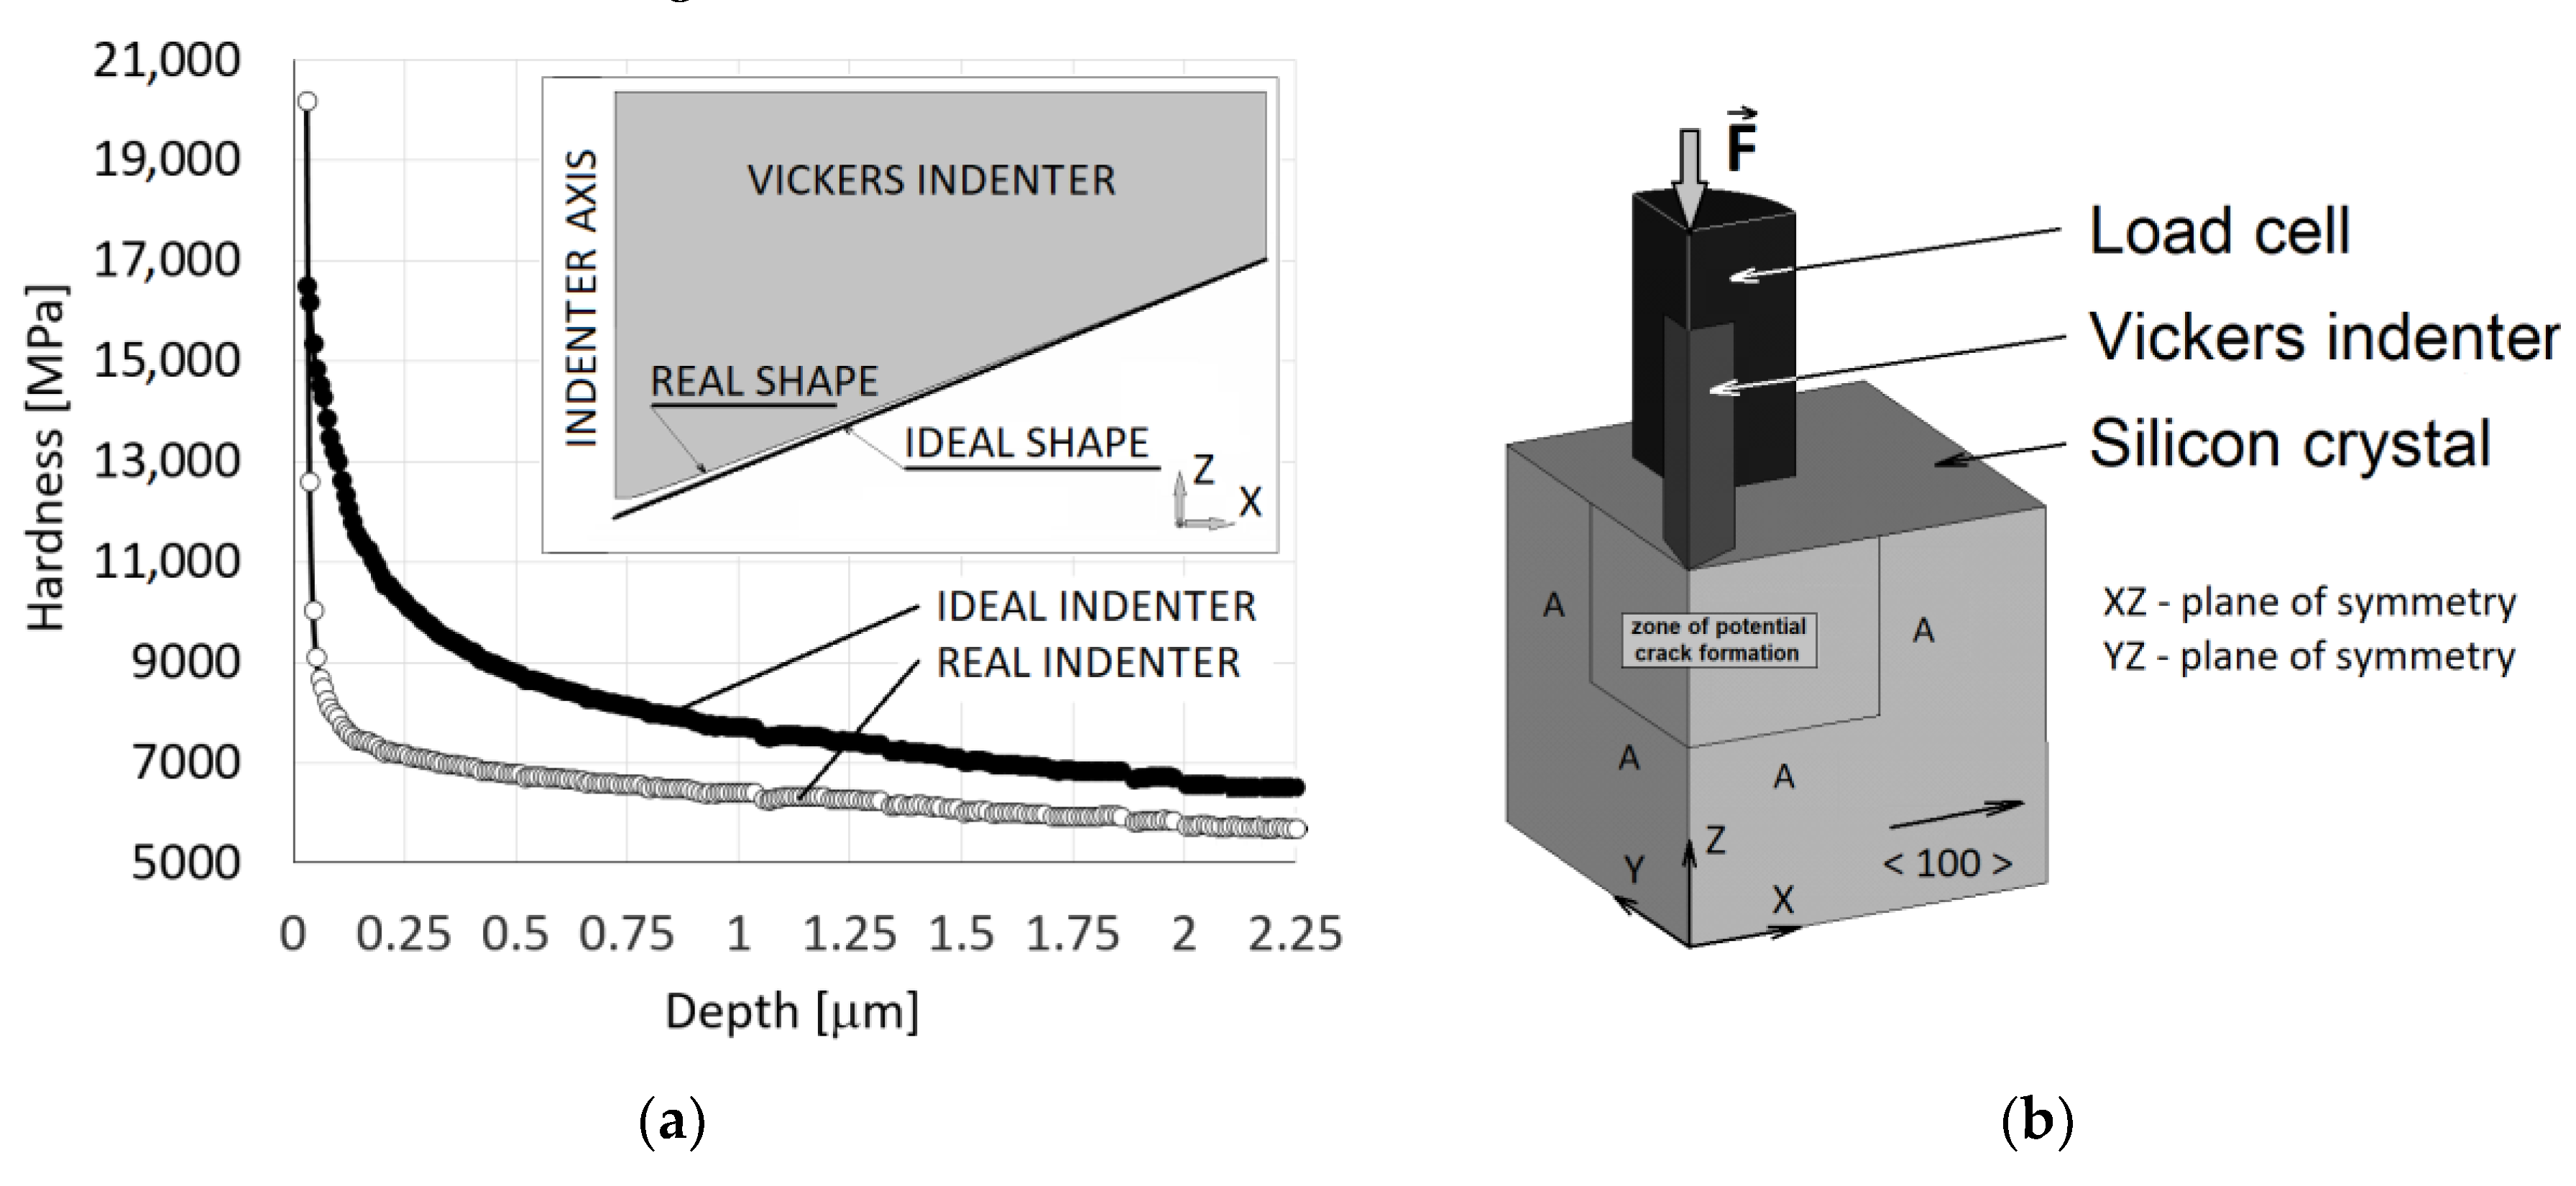
FE model for numerical simulation of the indentation test of Si crystal consisted of a cube with edge length of 200 μm (Si crystal), Vickers diamond indenter and the load cell, see
Figure 2a.
The discretisation of the FE model was performed by linear solid elements (SOLID185 in ANSYS software (Release 19.2)) and the contact with friction coefficient
f = 0.05 between the Si crystal sample and Vickers indenter was defined. The sample was loaded through pushing the indenter into the sample and the indentation depth was gradually increased. As a result, the indenter was deformed, and the loading force was subsequently obtained as a reaction. Two planes of symmetry (XZ, YZ) and the plane XY with prescribed boundary condition (
UZ = 0) representing the crystal storage were used in numerical simulations. Non-elastic response of the Si crystal (denoted as SC), that tends to accommodate the contact stresses under the indenter, was modelled in terms of ideally elastoplastic material defined by Young’s modulus
ESC =129.5 GPa, Poisson’s ratio
νSC = 0.278, the shear modulus
GSC =79.6 GPa and the yield stress
σy, SC which is initially unknown. In this context it should be noted that the elastic-perfectly plastic material behaviour according to the von Mises yield condition accurately describes the compressive behaviour of many brittle materials [
27,
28]. Vickers diamond indenter (VDI) was considered as a linear isotropic body defined by Young´s modulus
EVDI = 1220 GPa and Poisson´s ratio
νVDI = 0.20. Elastic properties of individual components (crystal, indenter) were chosen on the basis of available literature data. Linear isotropic behaviour was also assumed for the load cell (LC) defined by Poisson´s ratio
νLC = 0.3 and Young´s modulus
ELC which takes the stiffness of the test equipment into account and is also initially unknown. Reduced Young´s modulus
Er is then given by
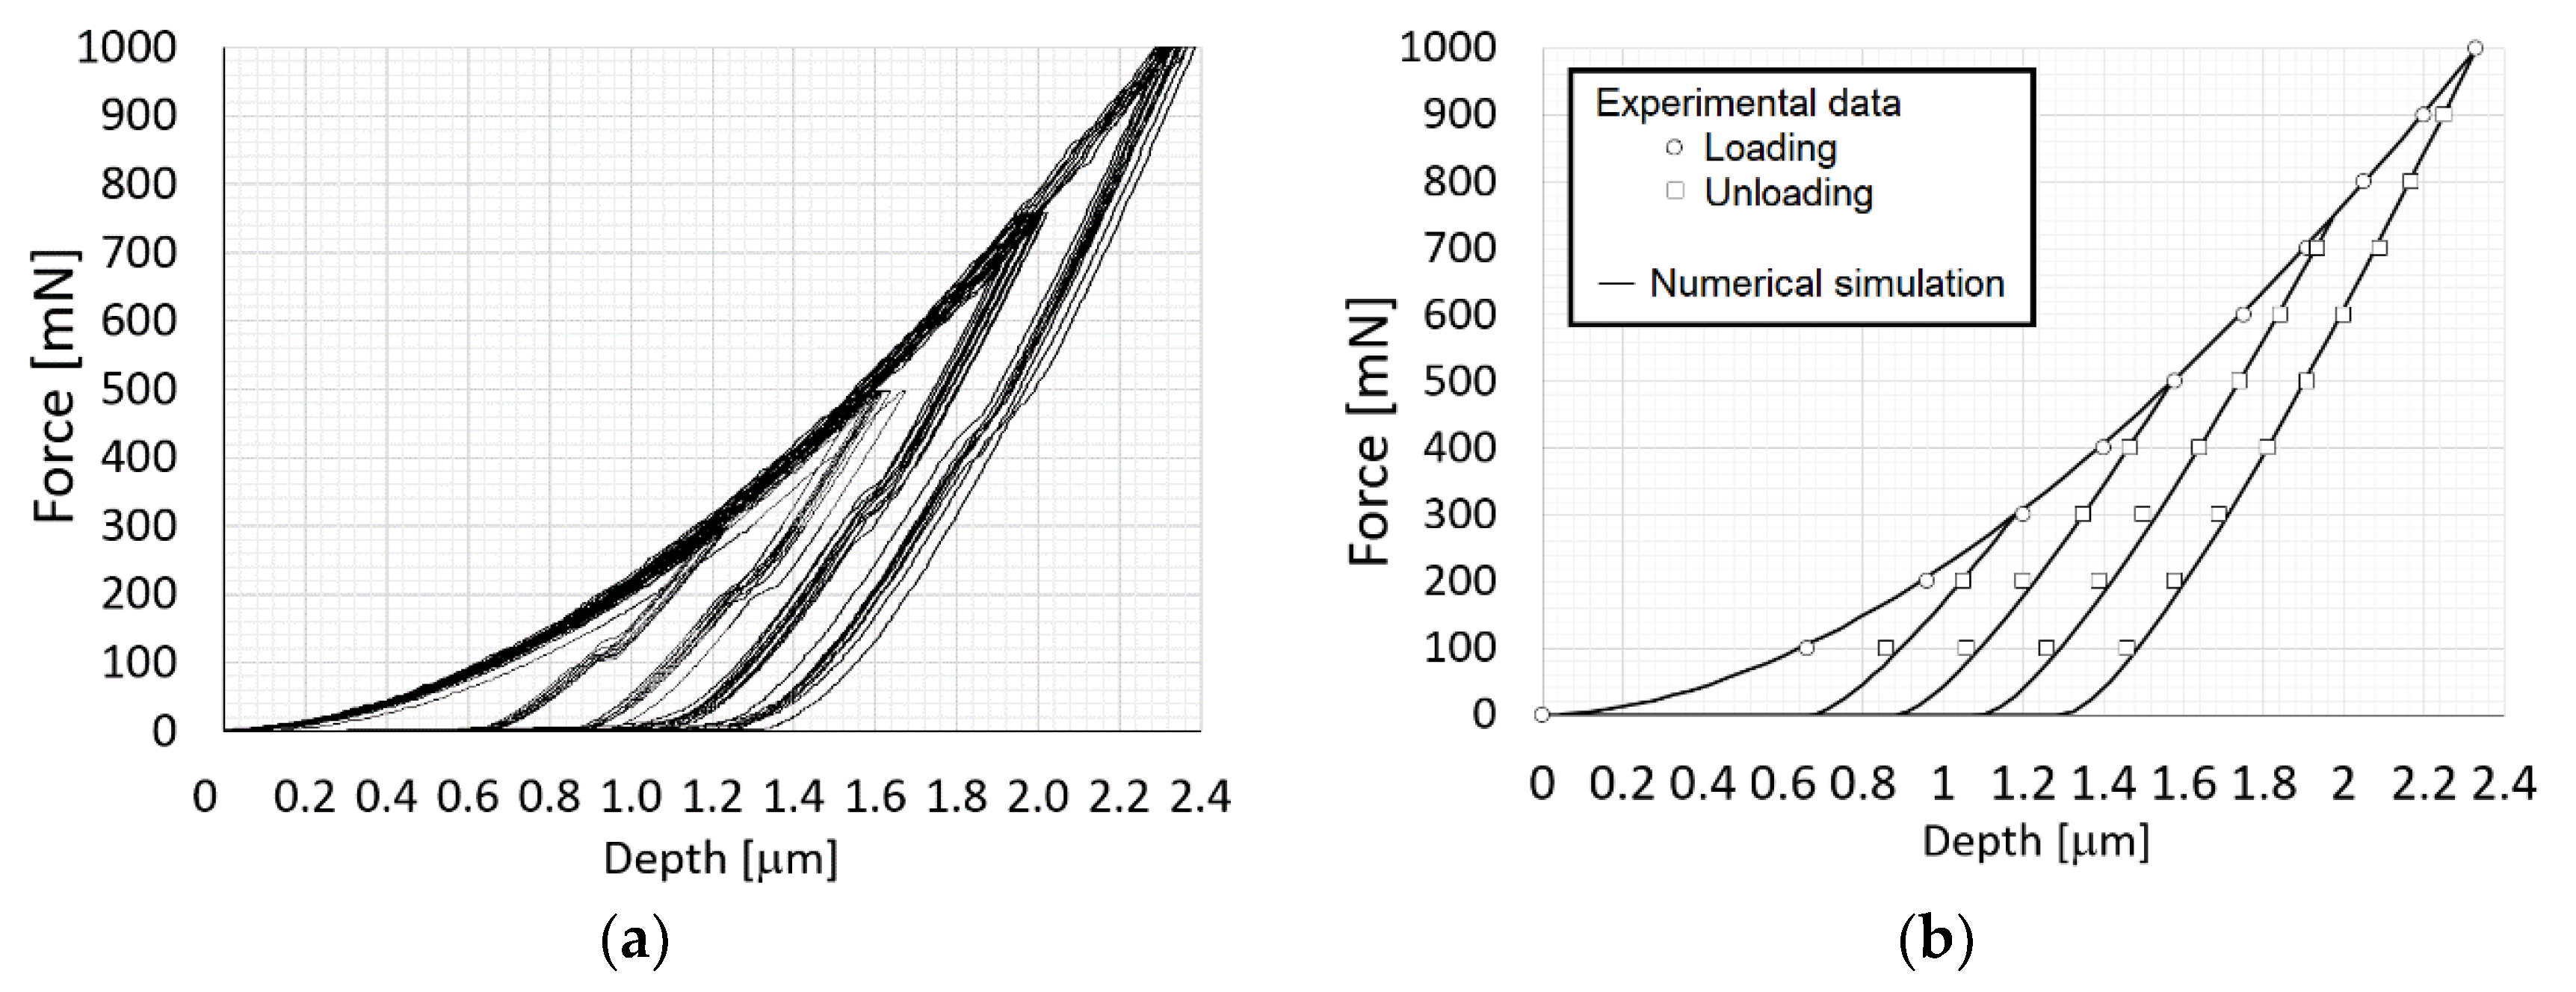
In the first step, the reduced Young´s modulus
Er was searched together with the yield stress
σk, SC based on load-depth curves from indentation tests, see
Figure 3a. The indenter tip shape deviation from the ideal shape, see
Figure 2a, was also taken into account when searching for the yield strength. Crack initiation and growth was not considered in this stage. It should be pointed out that the effect of cracks on the force-depth curve is negligible for lower loading force values. The nonlinear least-squares routine to get the best fit between the given indentation data and the optimised indentation data, produced by FE analysis, was applied to determine the aforementioned parameters. The corresponding objective functional
is given by, see [
29,
30,
31,
32,
33]
where
c is the optimisation variable set given above,
and
are the predicted and experimental loading force, respectively and
i denotes a position along the force-depth curve. The yield stress
σy, SC was determined from unloading stage of each of the force-depth curves, where linear behaviour exists (approx. to 10% decrease from maximal value of the applied force) in accordance with Oliver and Pharr method [
34]. The best fit was obtained with the yield stress
σy, SC = 6.4 GPa, the value which is close to the values applied for silicon in studies [
7,
8,
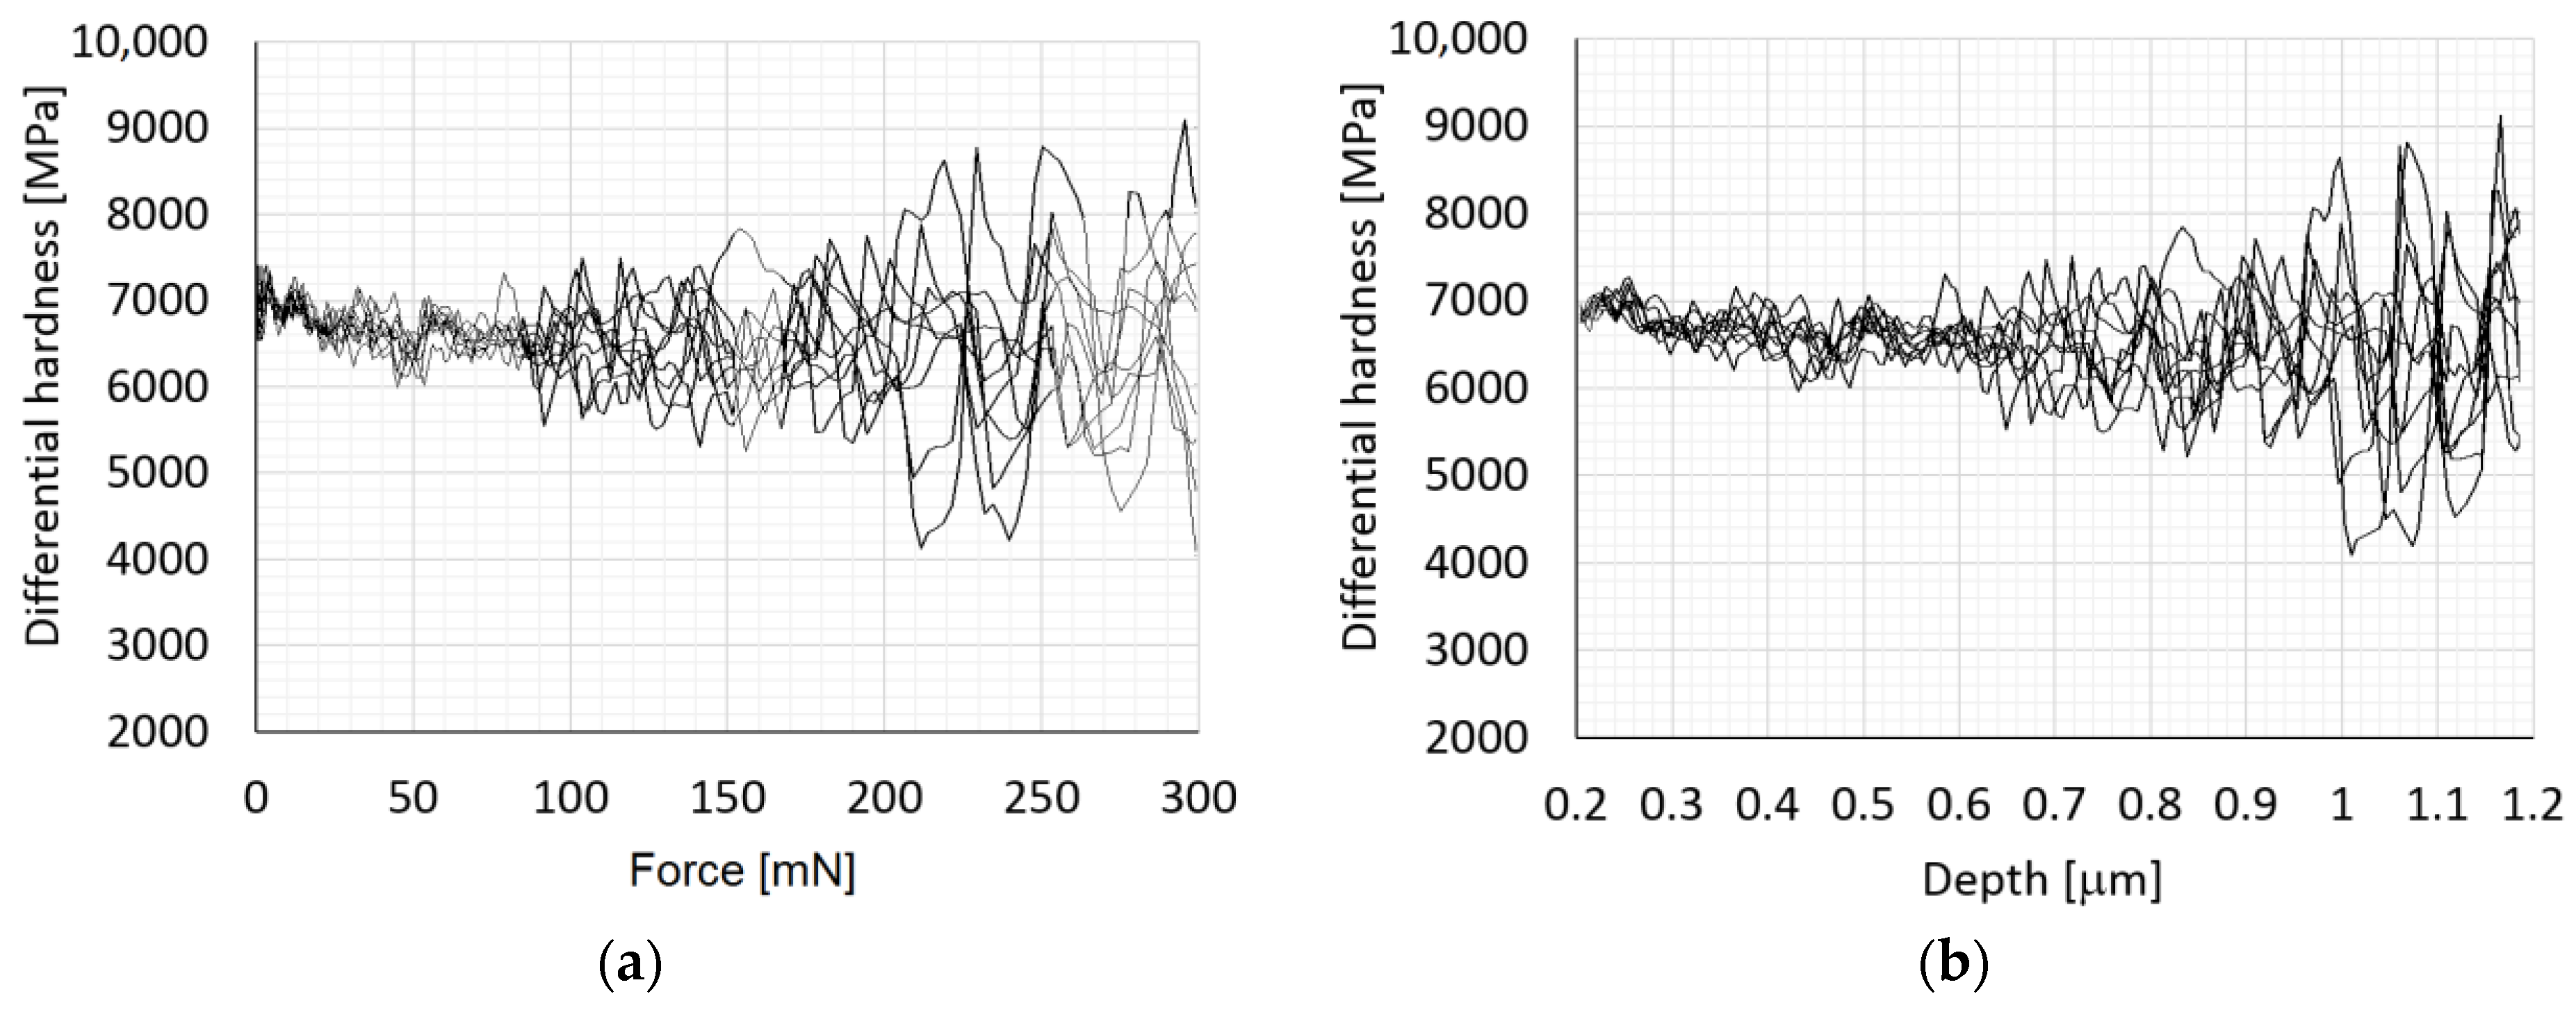
10]. Further decrease in the applied force cannot be employed for a correct fitting because the FE model does not include pop-out effect which occurs approximately at 50% decrease of the applied force. The real shape of the indenter tip, which is used in numerical simulations, was found on the basis of a calibration curve of differential hardness, which is performed before the measurement itself. It is therefore a matter of finding a match between the calculated and measured dependence of load vs indentation depth. The shape of the indenter tip and at the same time the required yield strength are calibrated here. The calibration was performed using the universal hardness HU which takes elastic and plastic deformations into account and is defined by the following relation
where
Pmax denotes the maximal force acting on the ideal Vickers indenter during a particular indentation test,
hmax denotes the corresponding maximal depth of indentation into the Si crystal, and
Sc is the contact area between the indenter tip and the Si crystal. The calibration was solved as an inverse problem by using incremental iteration procedure where the universal hardness and the loading force are known, and the contact area is searched. When the contact area is found the shape of indenter tip is modified and the force is incrementally increased. This procedure runs until the maximal loading (here 1000 mN) is reached. Then the calibration procedure is finished. The ideal and real indenter tip shape of Vickers indenter are shown in
Figure 2b. The difference between the ideal and the real shape of indenter tip is irrelevant in terms of the force-depth dependence but essential for the development of cracks in the near vicinity of the indenter tip.
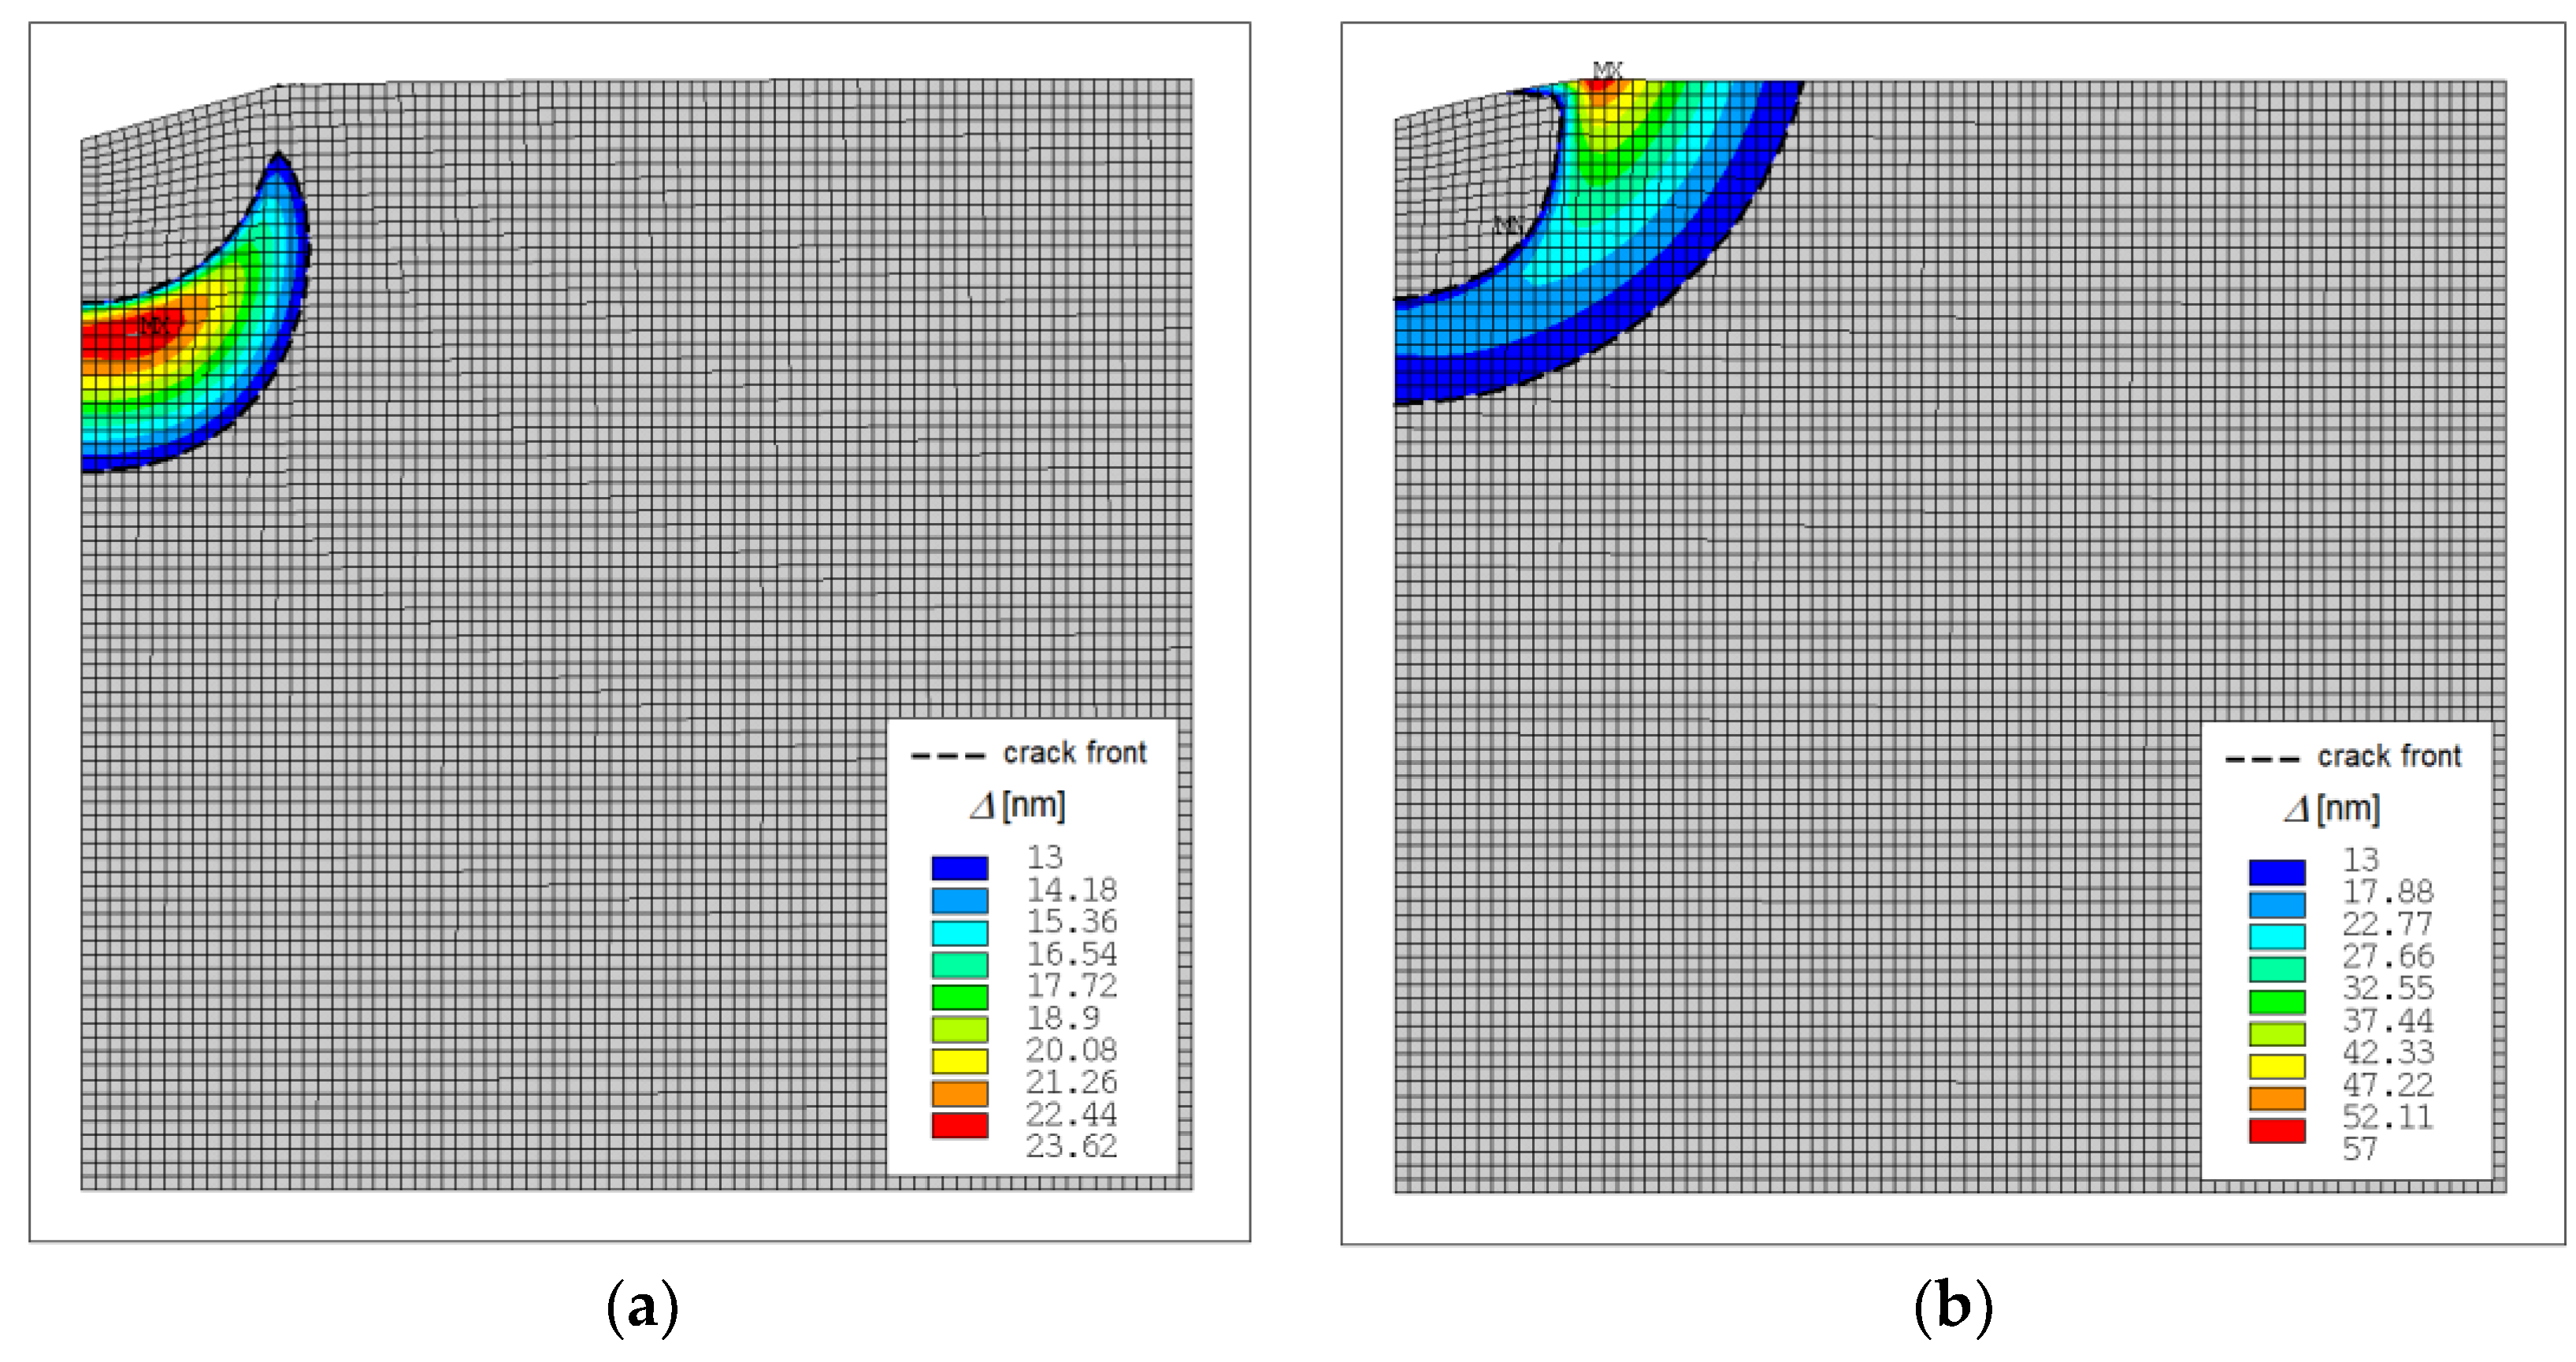
For the crack development modelling, a zone of the potential crack formation of the size
A ×
A with
A = 50 μm was defined in both symmetry planes, see
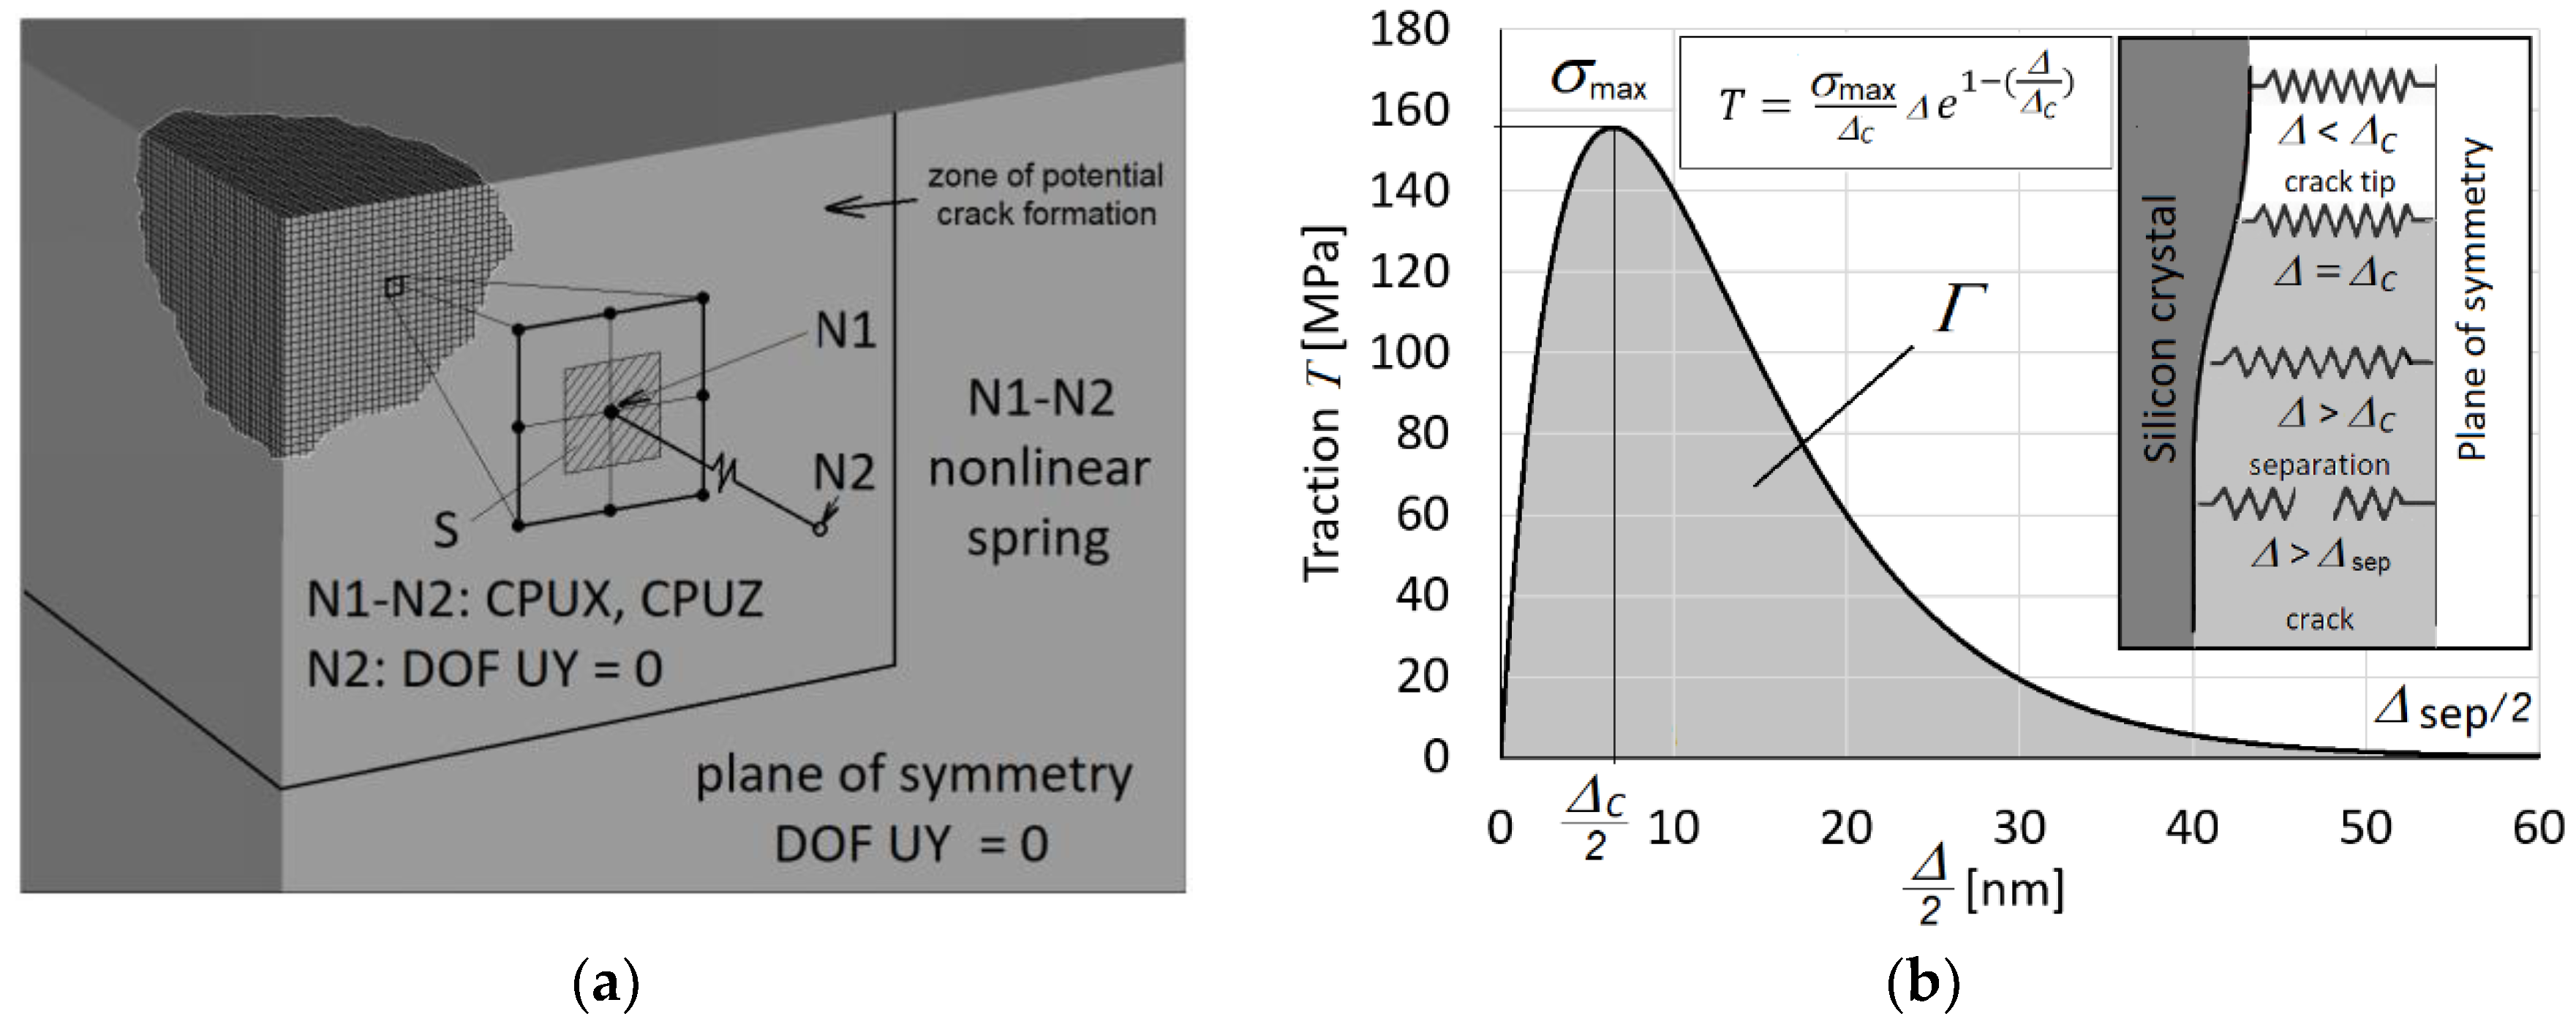
Figure 2a. The macroscopic cohesive potential can be obtained from Equations (2) and (3) in terms of the macroscopic opening displacement ∆ as
or
The cohesive traction
T(Δ) then follows from the derivative of the potential as
Note that the tangential component was neglected due to the character of loading of potential cracks in Mode I and due to the mechanism of crack formation. It would be possible to extend the model with this feature, however, in our opinion it would not bring a desired benefit. The relationship between the normal traction
T and crack opening displacement is illustrated in
Figure 4b. However, in
Figure 4b due to symmetry, only half of the crack opening displacement is displayed. Hence, the area under the traction-half displacement curve is equal to the half of the cohesive energy density 2
Γ, that is to
Γ. The cohesive crack zone is realised by means of nonlinear springs in tension. The nonlinear spring response in compression is considered as rigid and the tangential traction is ignored. The crack tip is defined as the point where the crack opening displacement is equal to ∆
c which corresponds to the maximal normal traction
σmax. Numerical simulations were performed for radial cracks propagating along the (101) cleavage plane in the direction [100] and along the (011) cleavage plane in the direction [
10], see
Figure 2a. The complete elastic–plastic stress field during the unloading stage of the indentation is given by a superposition of the elastic contact stress field
and a residual stress field
generated due to the permanent deformation
under the contact. While with decreasing contact force
P(
t) the elastic contact stress field decreases, the residual stress field remains largely unchanged and promotes cracks extension. The boundary value problem to be solved during the unloading stage is to find the complete stress-strain field
,
:
where
satisfies compatibility,
denotes the actual contact surface with actual tractions
,
is the actual crack surface,
is the part of the boundary where displacements are prescribed,
and
are the stiffness and compliance tensors respectively,
is a unit normal to the surface. The actual tractions
are related to the actual resultant contact force
P(
t) by
The total energy
Є can be expressed in terms of mechanical and residual fields and the cohesive potential
as
Necessary first-order stationarity condition for the minimisation of the total energy reads
In case of full unloading
Equation (15) reduces to:
where
. Here, it should be emphasised again that the crack tip is defined as the point where the crack opening
is equal to
which corresponds to the maximal normal traction
σmax. The virtual crack area increment
is given by
where
is the crack front,
is the local unit normal vector to the crack front and
denotes the local virtual crack extension. Observe that
and consequently also the residual strain field
depend on the maximal loading force
Pmax.The identification of the material parameters
Γ and ∆
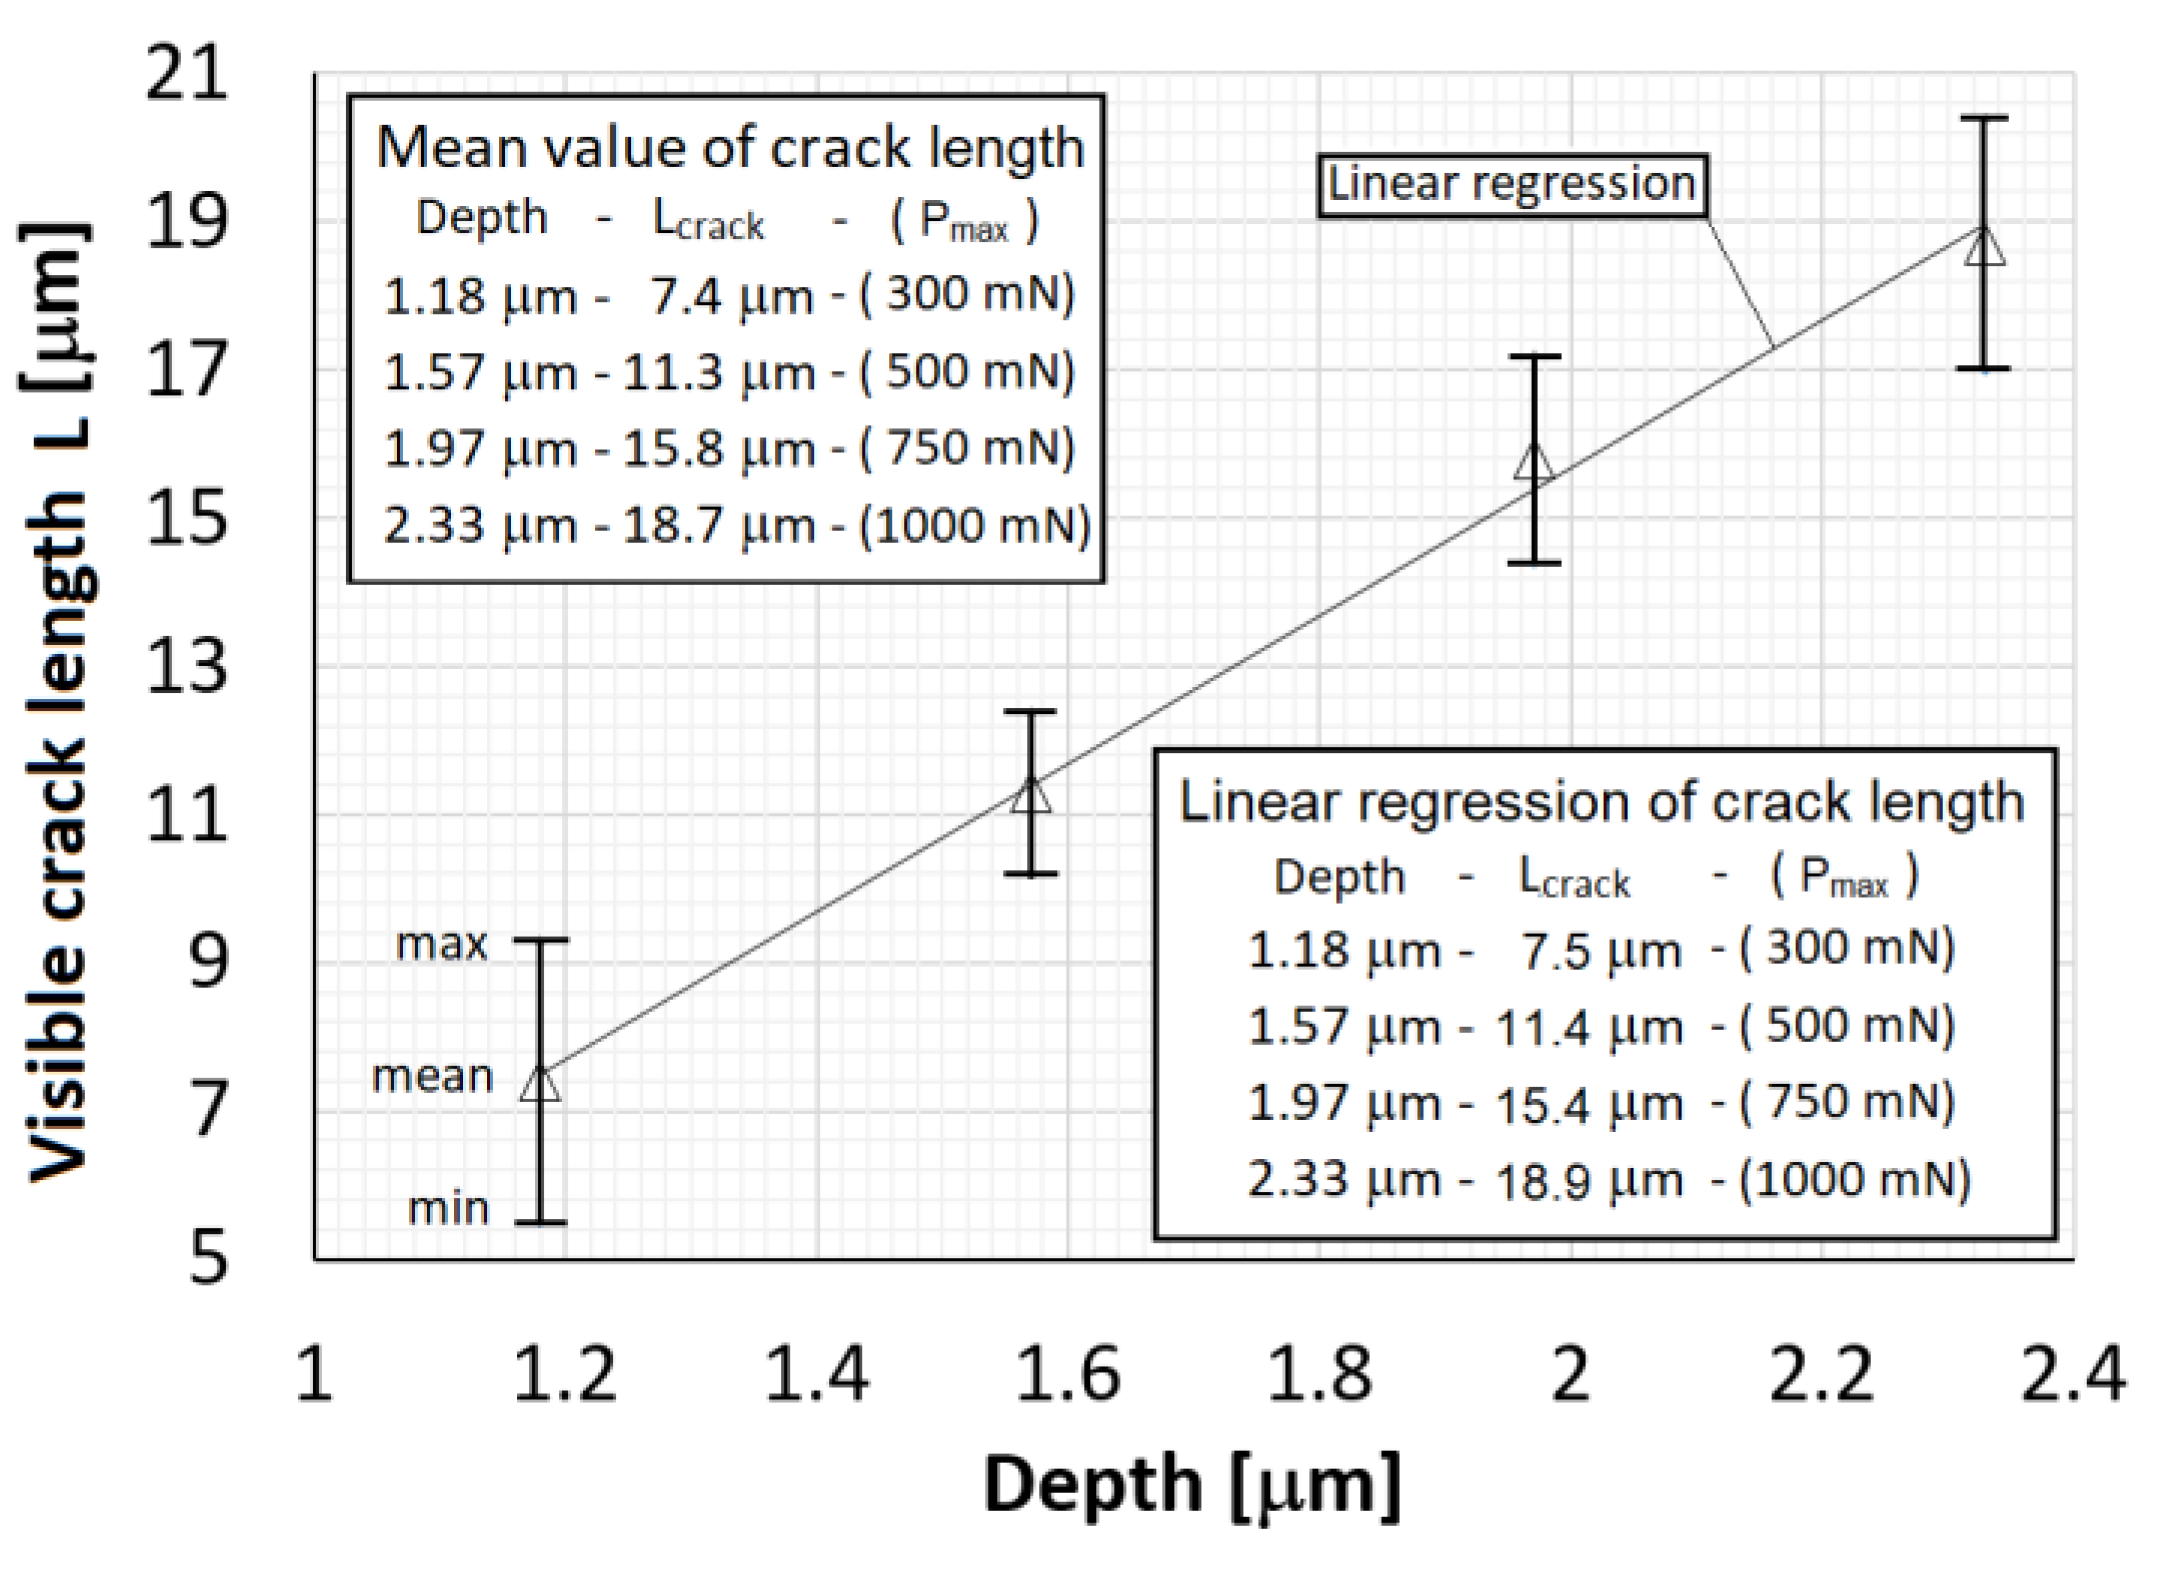
c is based upon the best fit between the visible crack length on the top surface and its numerical prediction obtained by FE analysis under full unloading. The optimisation model is
where
is a measured crack length on the top surface at i-th test,
is its theoretical counterpart, the subscript
j denotes j-th value of the maximal loading force
Pmax,j and
M = 25 is the number of performed indentation tests for each loading force. Simultaneously, the minimisation of the total energy is controlled. Observe, that as the independent cohesive material parameters also
σmax and ∆
c can be chosen, see Equation (9).
4. Discussion and Conclusions
While previous studies available in the literature, e.g., [
7,
8,
9,
10], which use cohesive zone finite element techniques for simulation of indentation cracks in brittle solids, tried to improve methods for the evaluation of material toughness from the indentation load, crack size, hardness, elastic constants, and indenter geometry, this study focuses on the evaluation of the cohesive energy density 2
Γ from which the material toughness can be easily determined using the well-known Griffith-Irwin formula
With the cohesive energy density determined as 2Γ = 5.30 J/m2 the Formula (19) gives KIC = 0.86 MPa·m1/2. In contrast to the previous studies, there is no need to control the premise of the linear fracture mechanics that the cohesive zone is much shorter than the crack length. Hence, the developed approach is suitable also for short cracks for which the linear fracture mechanics premise is violated. Besides, in spite of the previous improvements of the indentation cracking formulas, they are still relatively inaccurate to predict the fracture toughness in comparison to the proposed approach based on evaluation of the cohesive energy density.
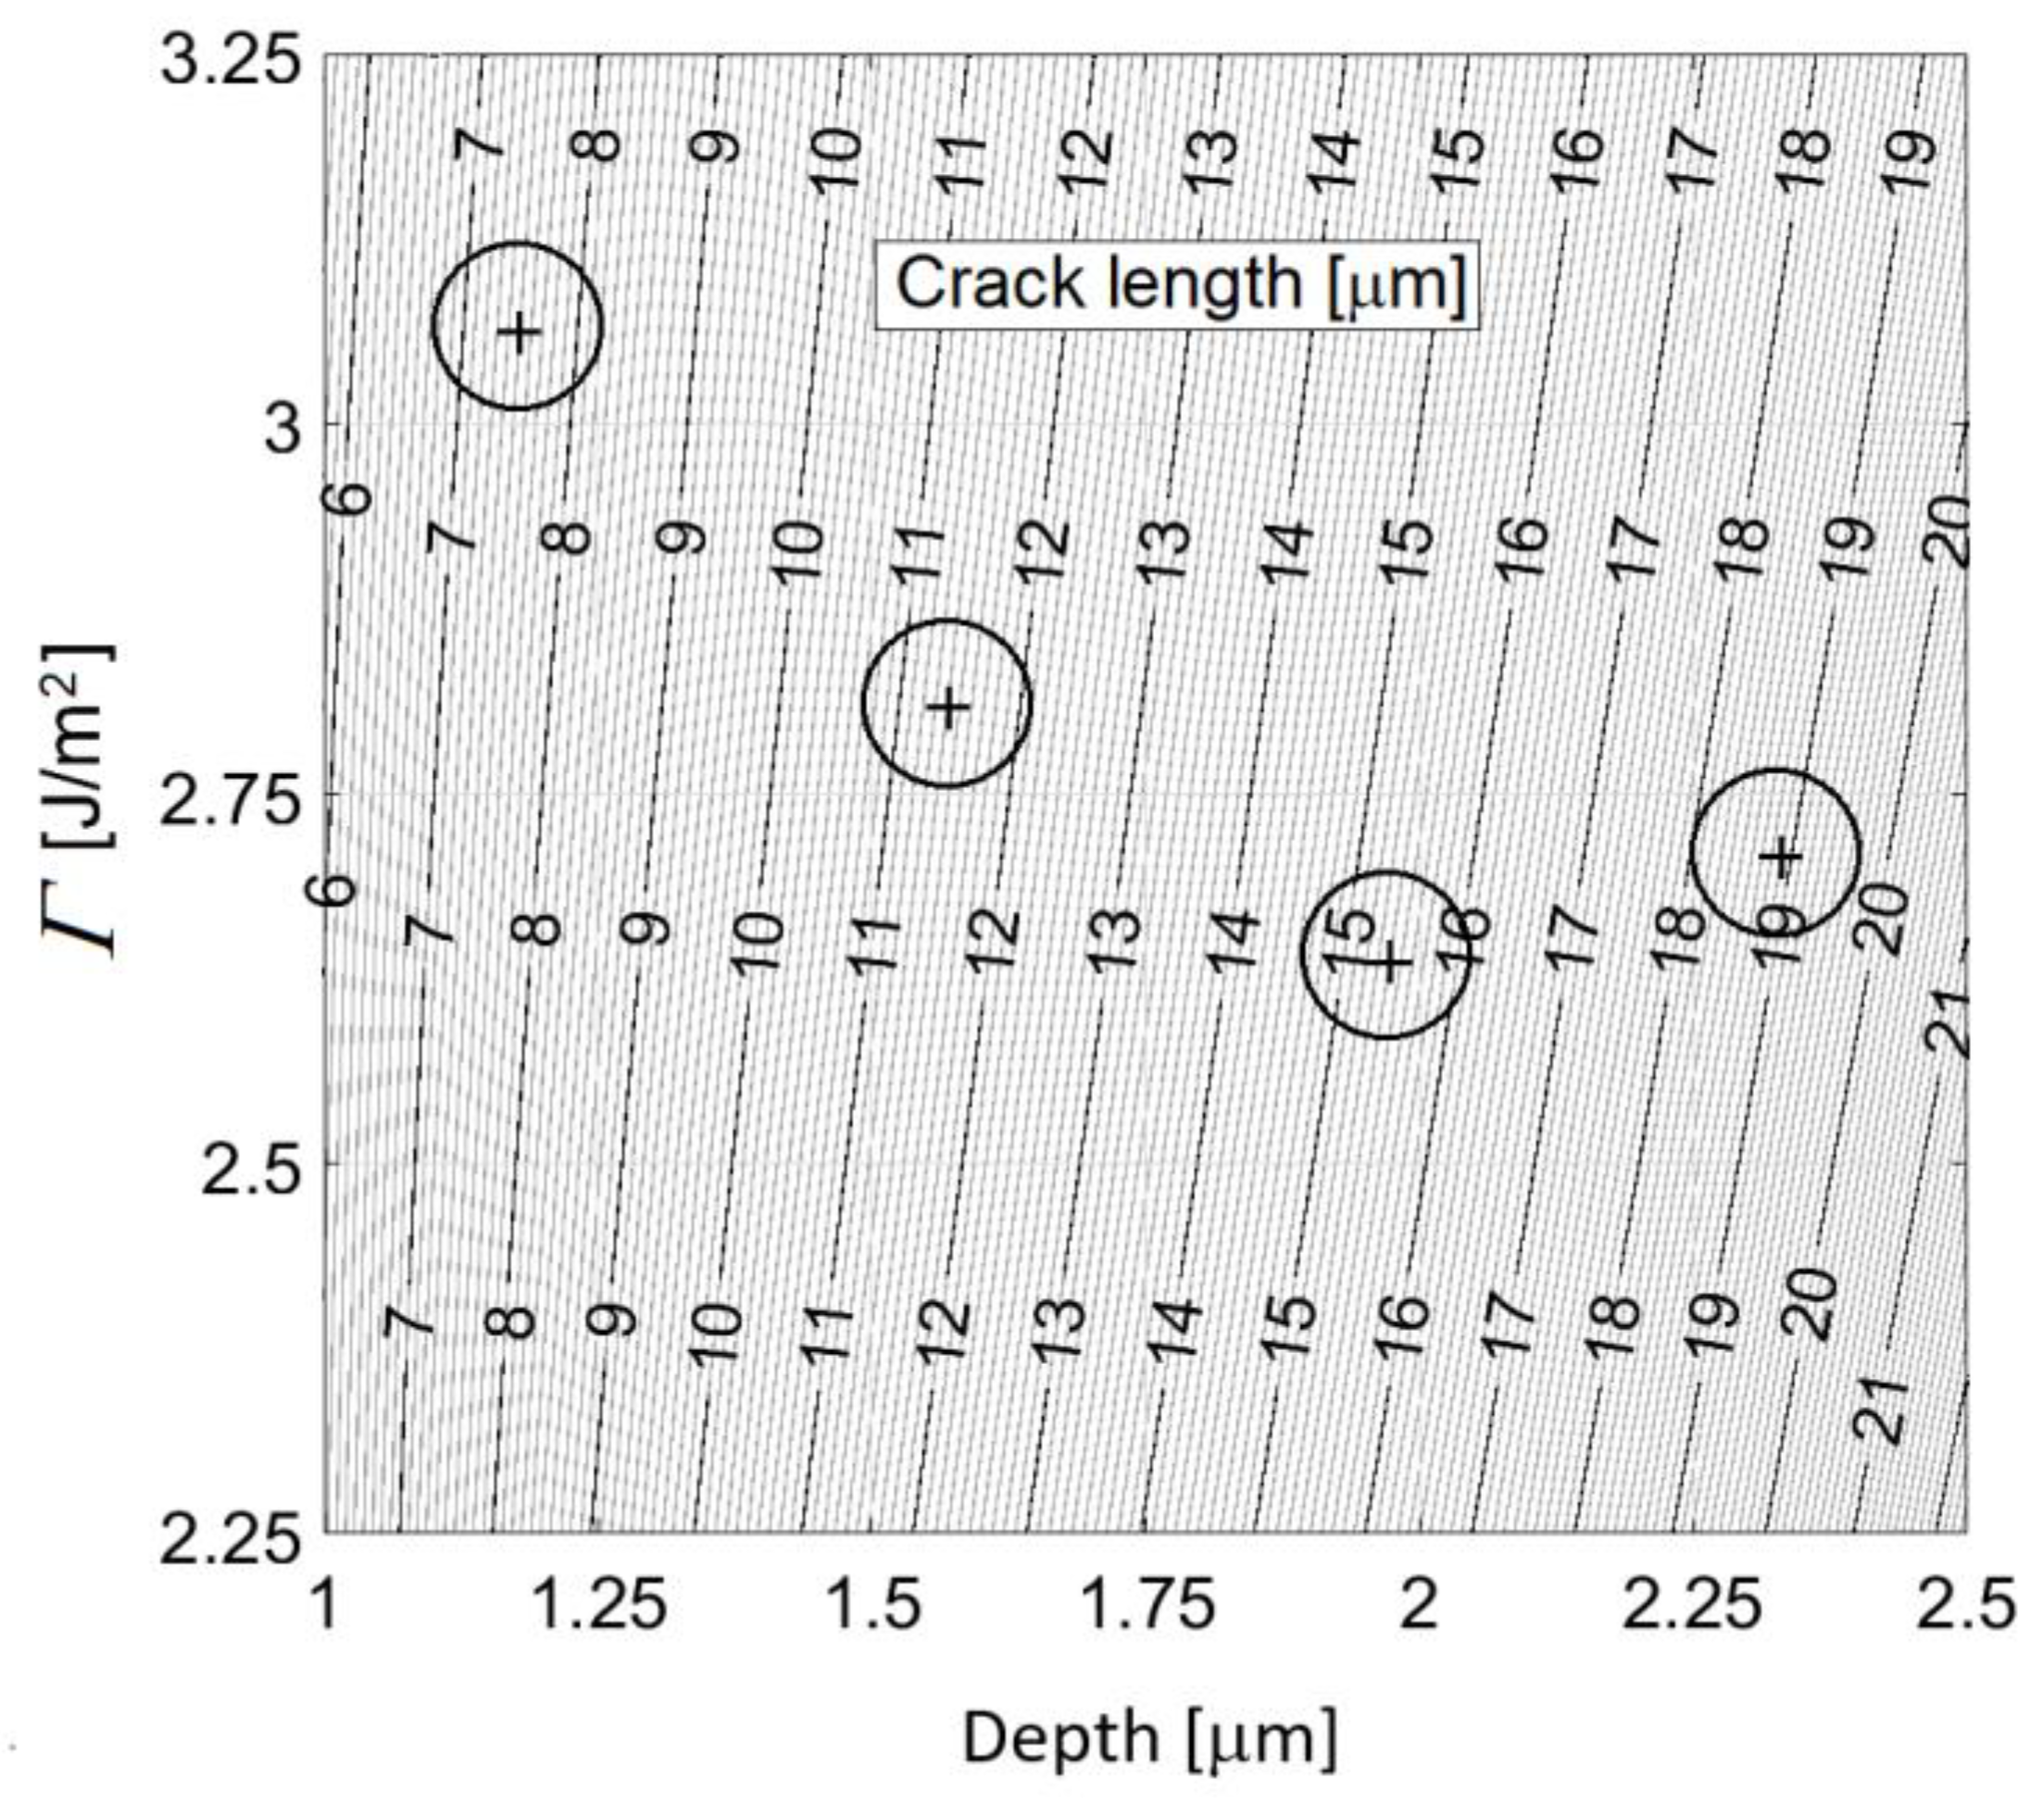
An integral part of the analysis is modelling of the permanent deformation under the contact since it gives rise to a residual stress field which is the primary driving force for cracks during the unloading process. A reliable model of the permanent deformation and the related residual stress/strain field requires knowledge of the yield stress, the reduced Young´s modulus of the whole system consisting of the load cell, Vickers indenter and the silicon crystal, and also the real shape of the indenter. All these parameters were found using an optimisation procedure which provides the best fit between the experimental indentation data and the optimised indentation data, produced by FE analysis. Specifically, optimal value of the yield strength σy, SC was 6.4 GPa. The computed residual stress/strain field enters the analysis of the inverse problem for identification of the cohesive energy density 2Γ and the critical crack opening displacement ∆c. The inverse problem solution requires to find the best fit between the visible crack length on the top surface of the silicon crystal and its numerical prediction obtained by FE analysis under full unloading and simultaneously to ensure minimisation of the total energy. The solution results are presented in the form of a diagram which links together the cohesive energy density, the crack length, and the indentation depth, from which the cohesive energy density 2Γ can be easily read off for particular crack length and indentation depth. Nevertheless, in case of a lower indentation depth the measurements are subject to a larger error which is reflected in the estimation error of the cohesive energy density. As the indentation depth increases, the error decreases and the estimate of the cohesive energy density converges to the value 2Γ = 5.30 J/m2.
There are several conflicts concerning the selection of the cohesive interface parameters
in FE modelling of cleavage fracture including the indentation cracks in brittle materials using the cohesive interface model. As already mentioned in Introduction, the ab initio calculations show that the crystal loses its bearing capacity after an interplanar separation of only a few Angstroms. Simultaneously, the peak stresses within the interplanar separation zone are of the order of theoretical strength of crystal. To reach such values in macroscopic FE simulation, extremely fine mesh would be required and full atomistic resolution in the vicinity of the crack would be necessitated, which is however unfeasible and impractical. Therefore, a suitable transformation of atomistic binding relation leading to macroscopic cohesive law is needed. A way to the macroscopic form of the cohesive law was suggested by Nguyen and Ortiz [
25] as mentioned in Introduction. As a result, the cohesive interface parameters
in any macroscopic cohesive law for the cleavage fracture differ by orders from their physical atomistic counterparts, however with the cohesive energy density (critical fracture energy) 2
Γ remaining unchanged. There are other limitations for the choice of the parameter
which were thoroughly investigated and discussed in [
7]. It was shown that the parameter
should be chosen to be lower than ≈ 0.2
σy to ensure initiation of crack in a linear fracture mechanics context. Moreover, care is needed when changing
because then the crack bridging zone also changes which affects the choice of cohesive element size
D. In the papers [
7,
10]
was chosen from the range <
> GPa, the typical value of the yield strength was
, and the typical value of the Young modulus was
E = 200 GPa. The fracture toughness
KIC ranged from 0.7 to 1 MPa.m
1/2. All these papers used the bilinear form of the cohesive traction—separation law. In this paper, the parameter
, and/or the critical opening displacement ∆
c together with the cohesive energy density 2
Γ were selected to provide best fit between the visible crack length on the top surface and its numerical prediction according to Equation (18). The optimal values were found as
, ∆
c = 13 nm, and 2
Γ = 5.30 J/m
2. It is interesting to notice that the asymptotic scaling rule in Equation (1)
1 predicts the macroscopic critical opening displacement as ∆
c 14.4 nm, see the text below Equation (3).
The reliability of the developed model is evidenced by the determined value of the cohesive energy density, which is in a good accordance with the values reported in the literature. Furthermore, the reliability of the model follows from the comparison of numerical simulation results with the measured differential hardness data which provide an estimate of the loading force for the indentation induced cracks inception during the loading stage. The proposed approach also seems appropriate for toughness evaluation of hard coatings bonded to a brittle substrate. Studies along this line will be left for a future work.

