
Environmental Effects on Piezoelectric Sensors Array Signals and a Compensated Damage Imaging Method


Abstract
:1. Introduction
2. Sensors Array Based Damage Imaging Method
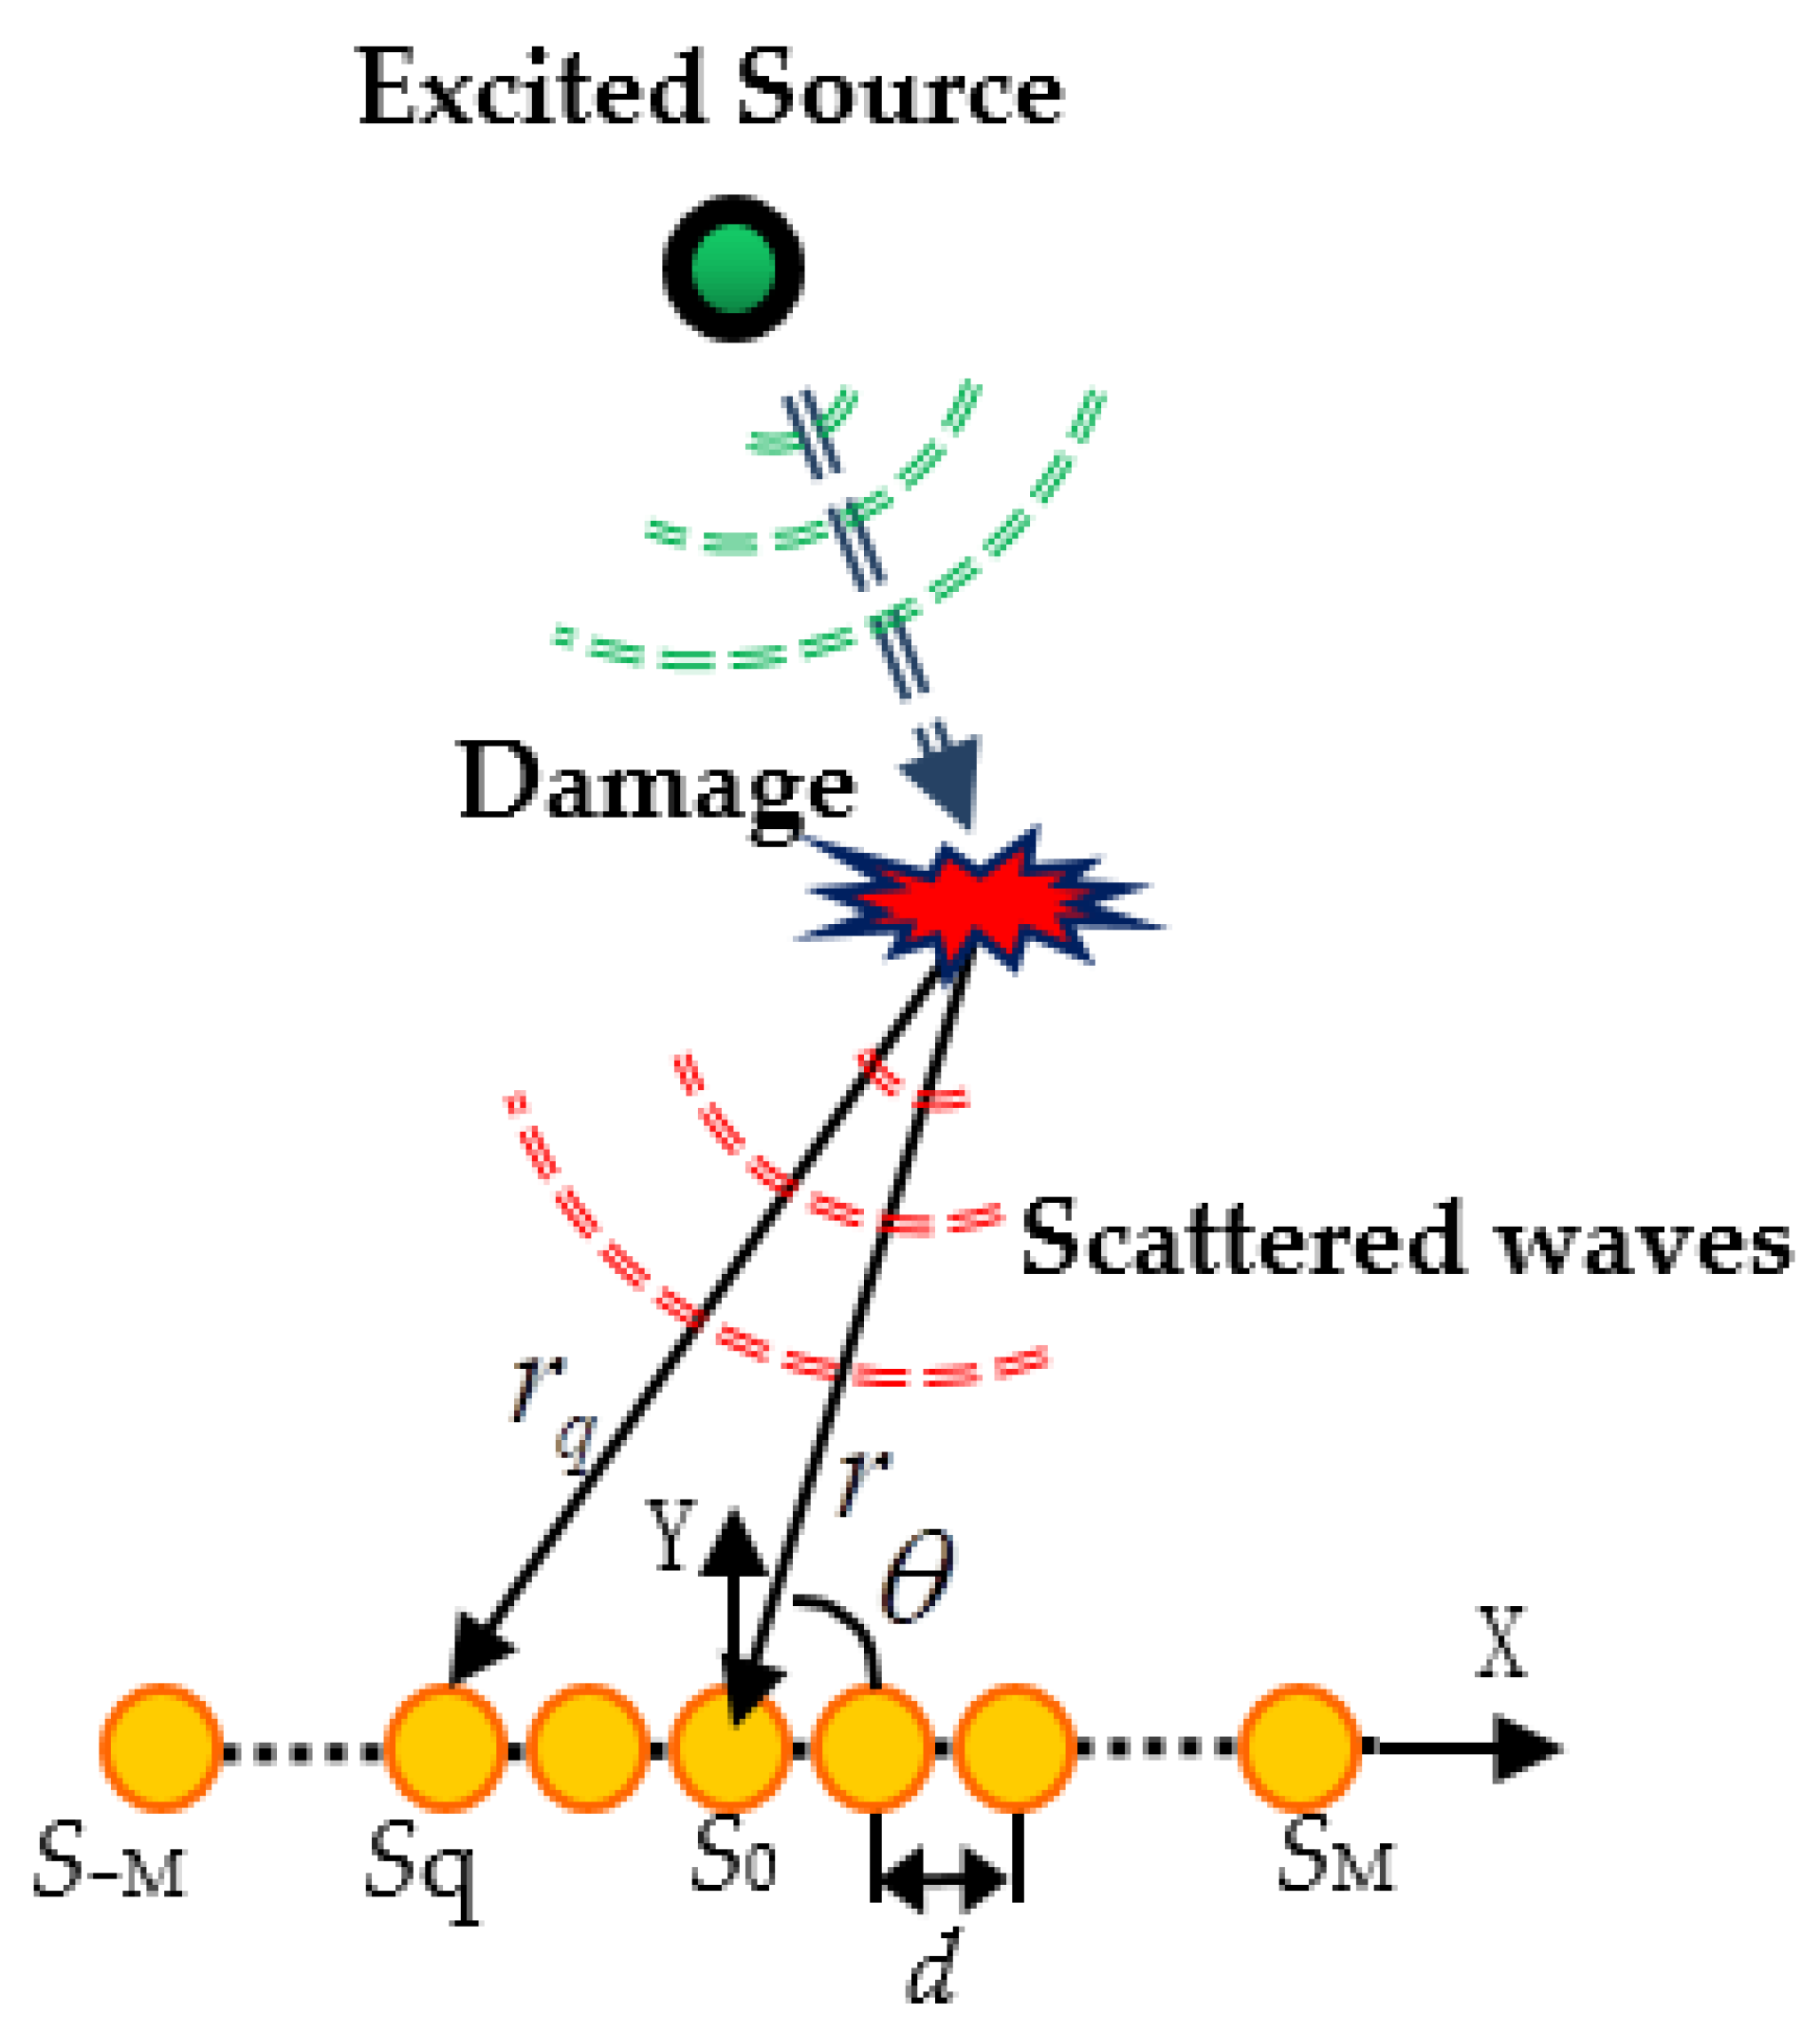
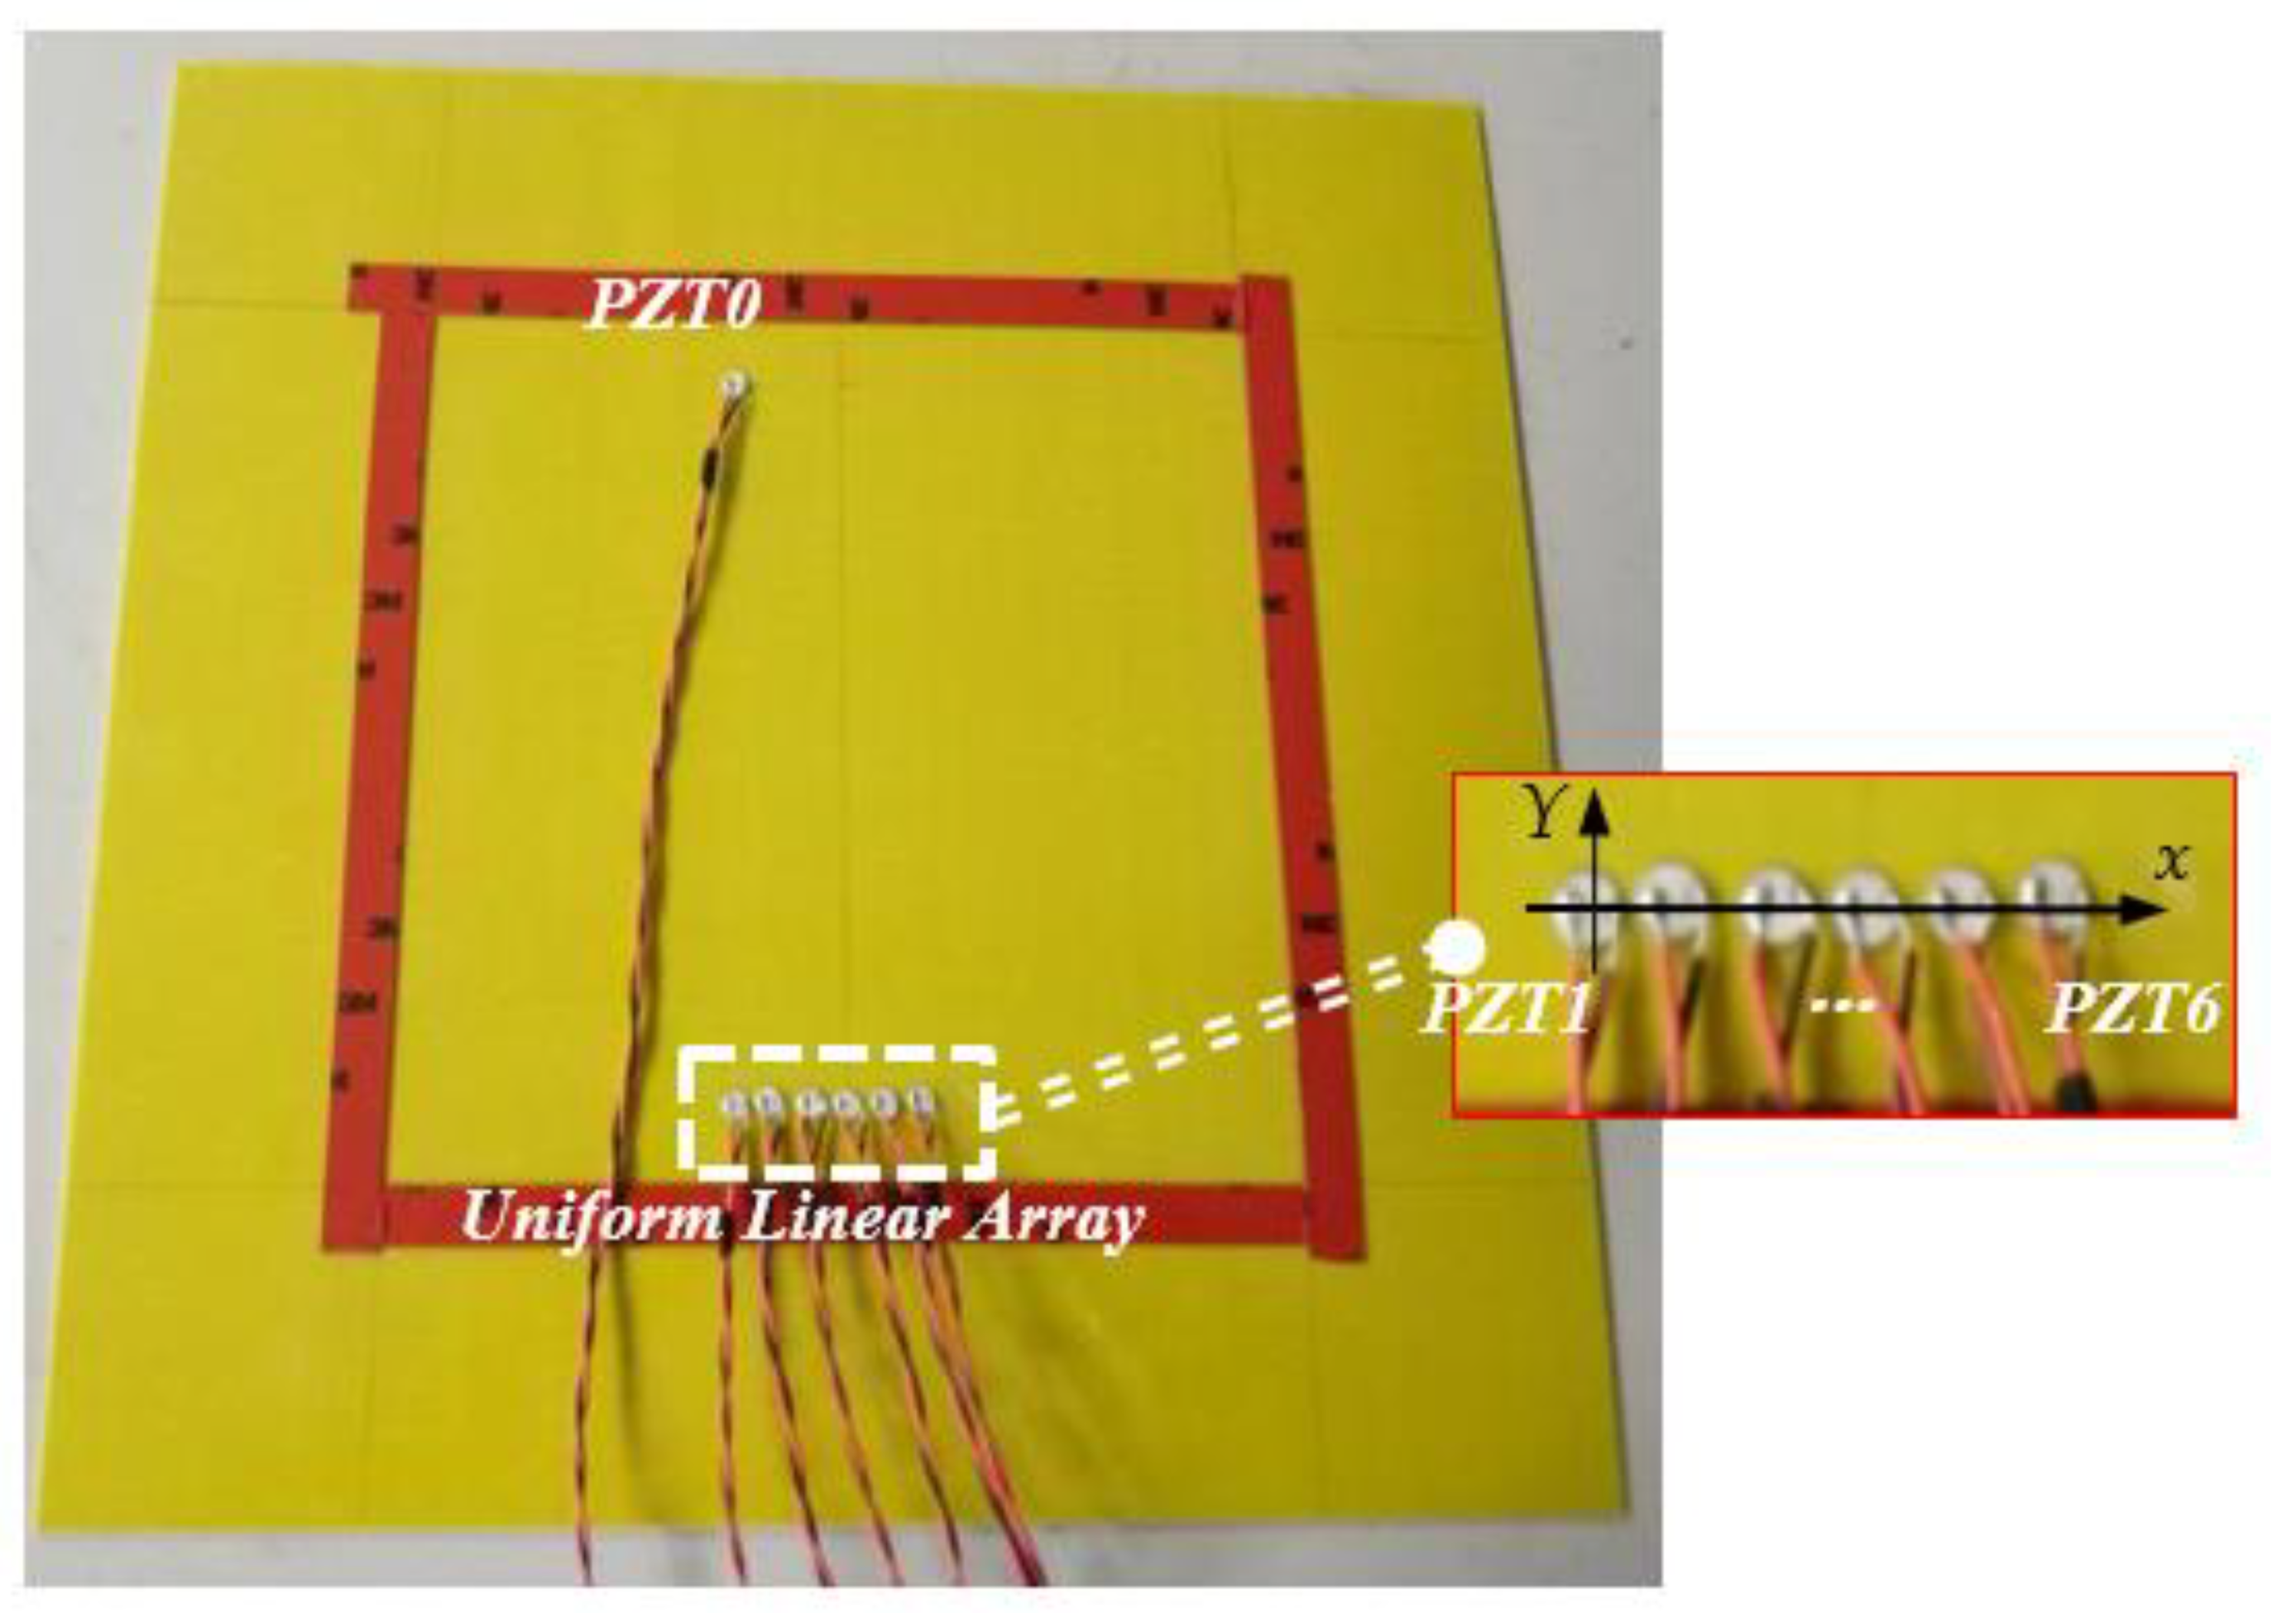
2.1. Piezoelectric Sensors Array Based Damage Imaging Method
2.2. Environmental Conditions Effects Compensation Method
3. Environmental Effects Experiments on Composite Structures
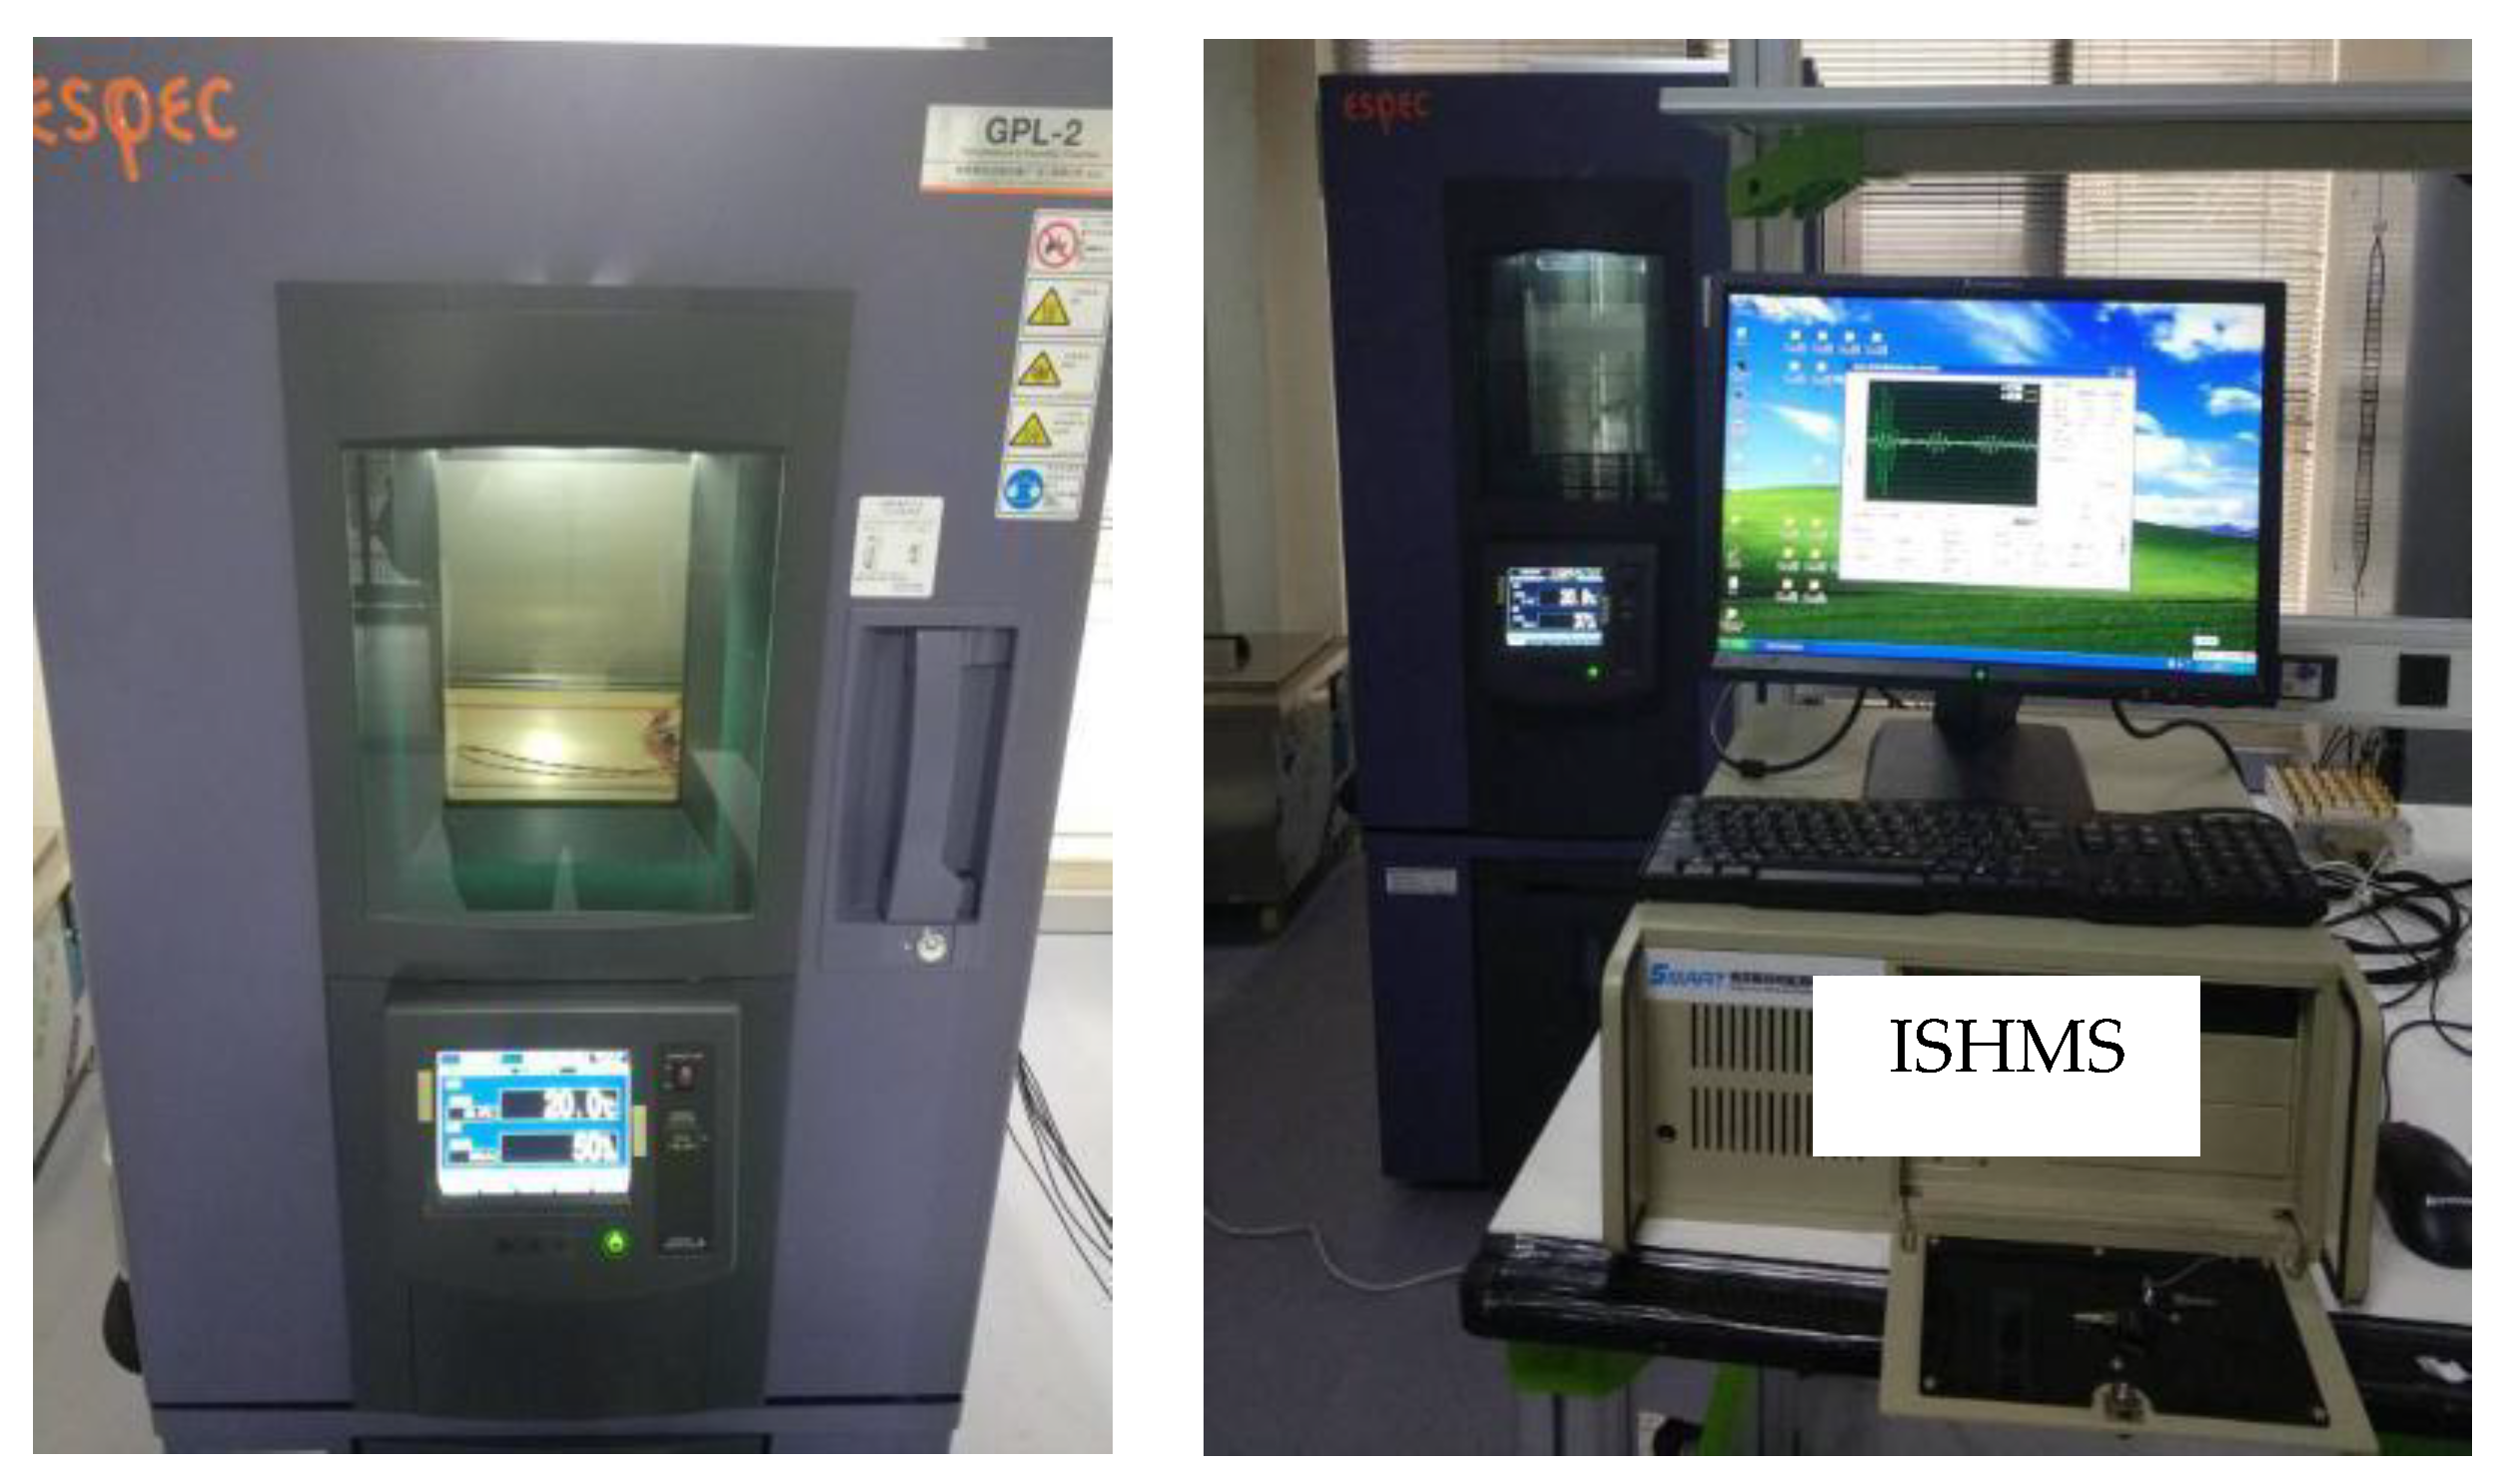
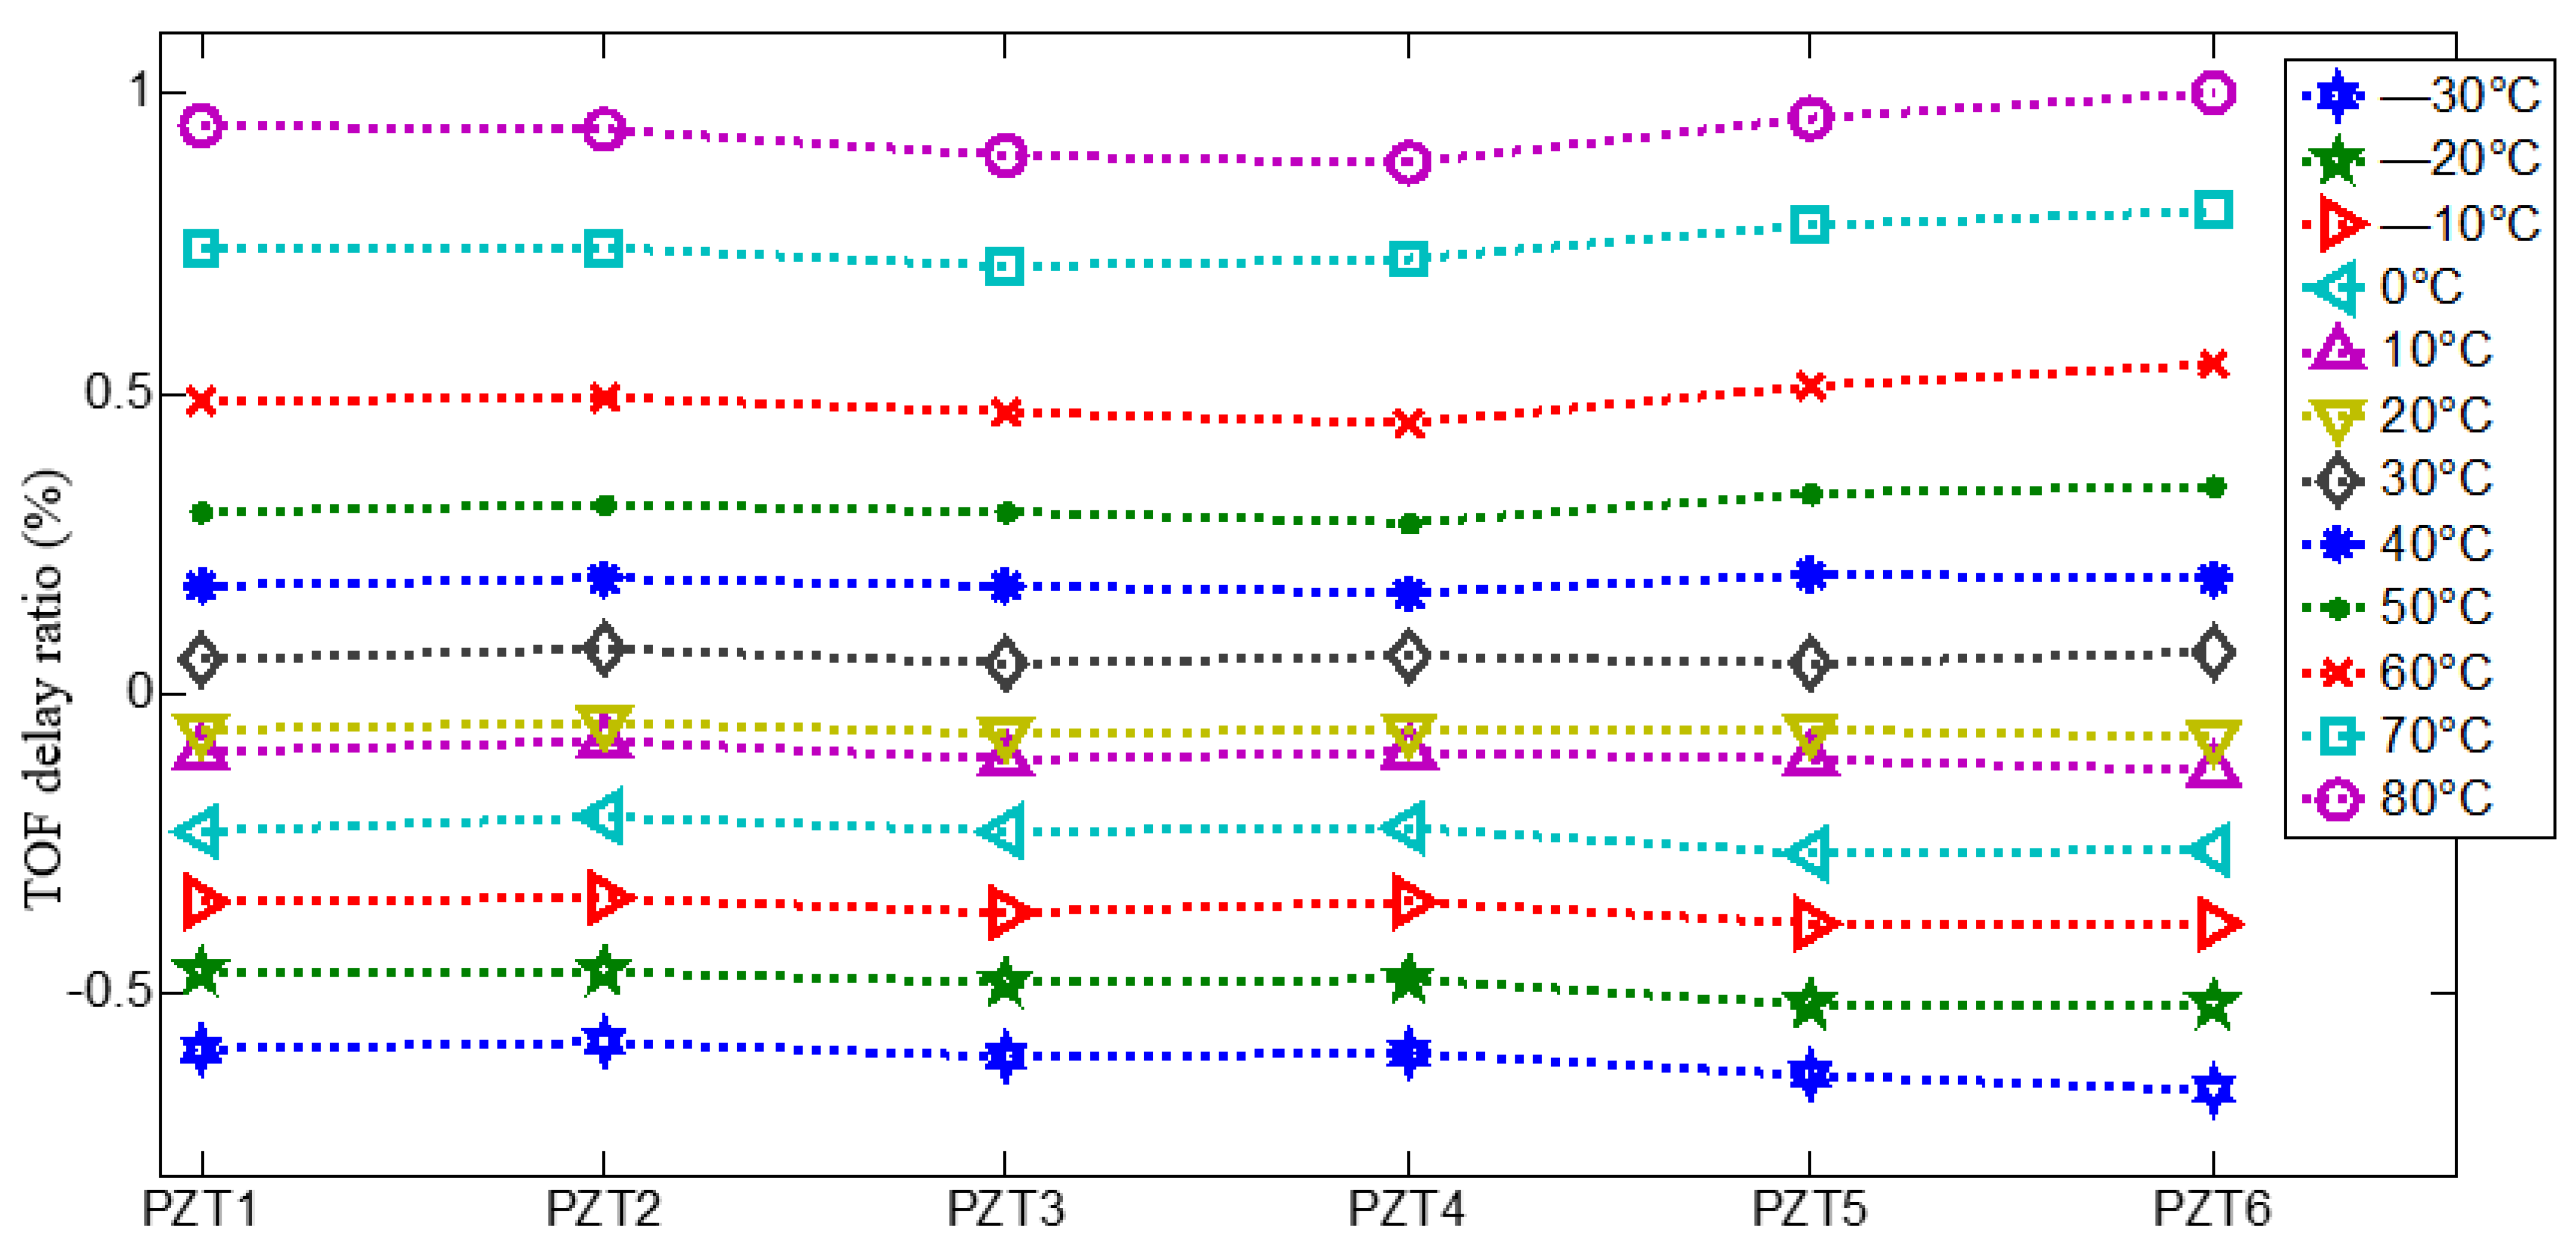
3.1. Temperature
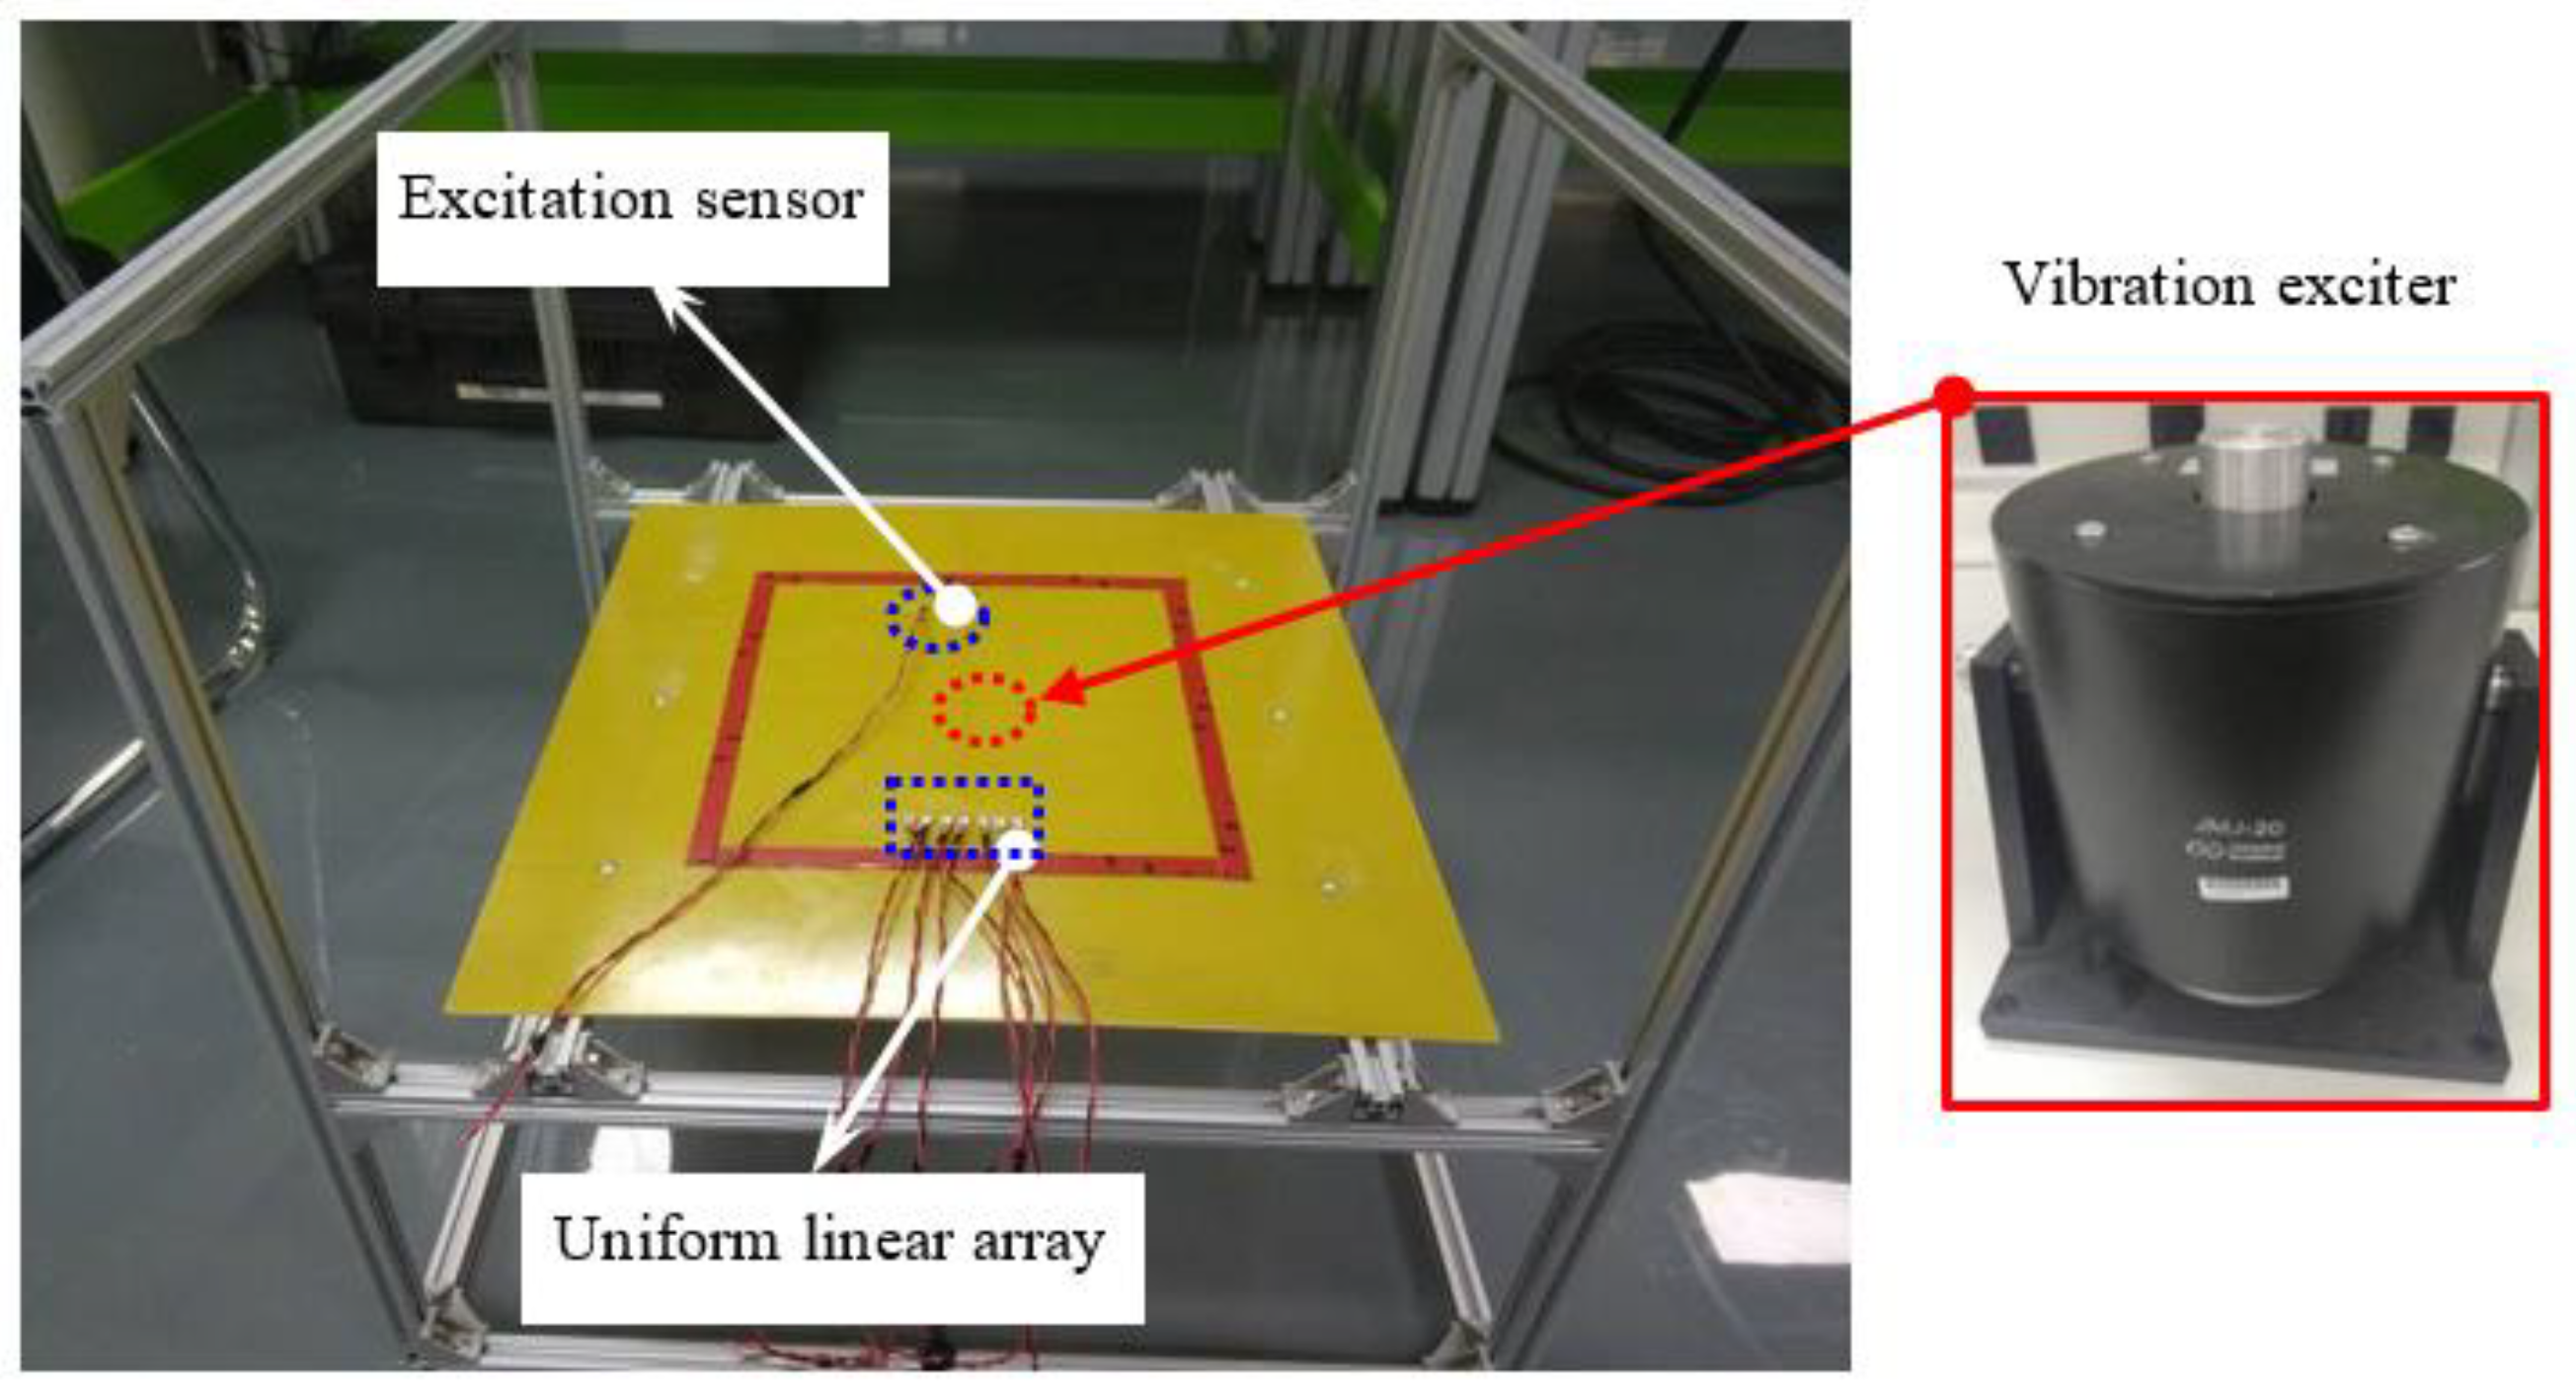
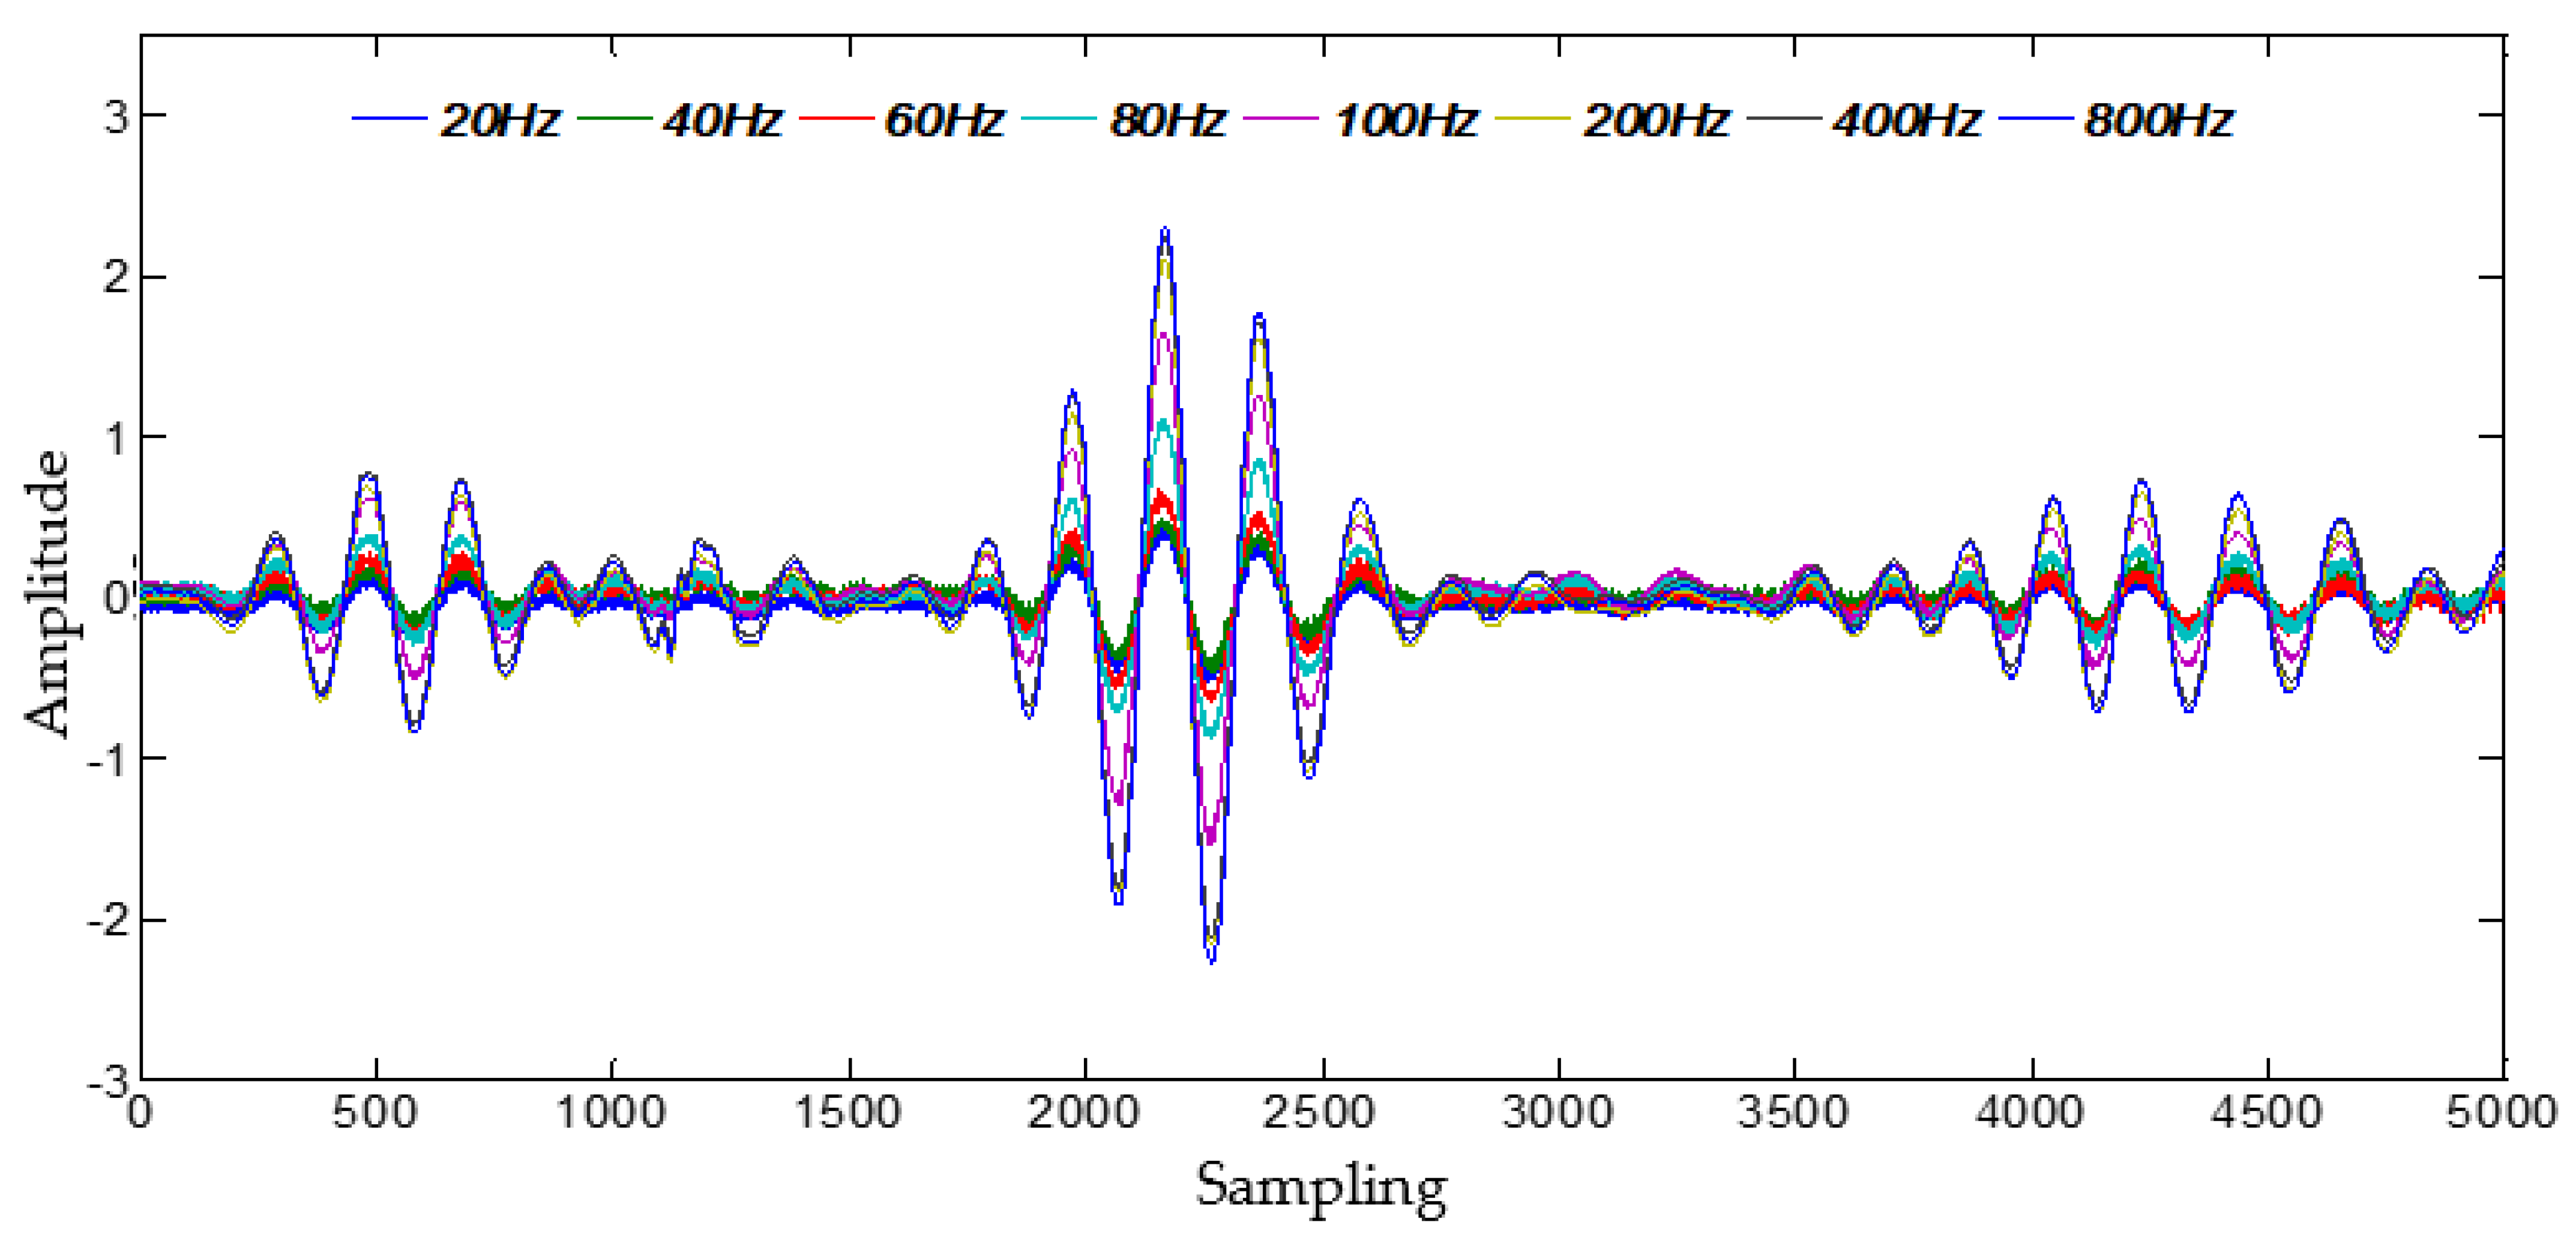
3.2. Vibration
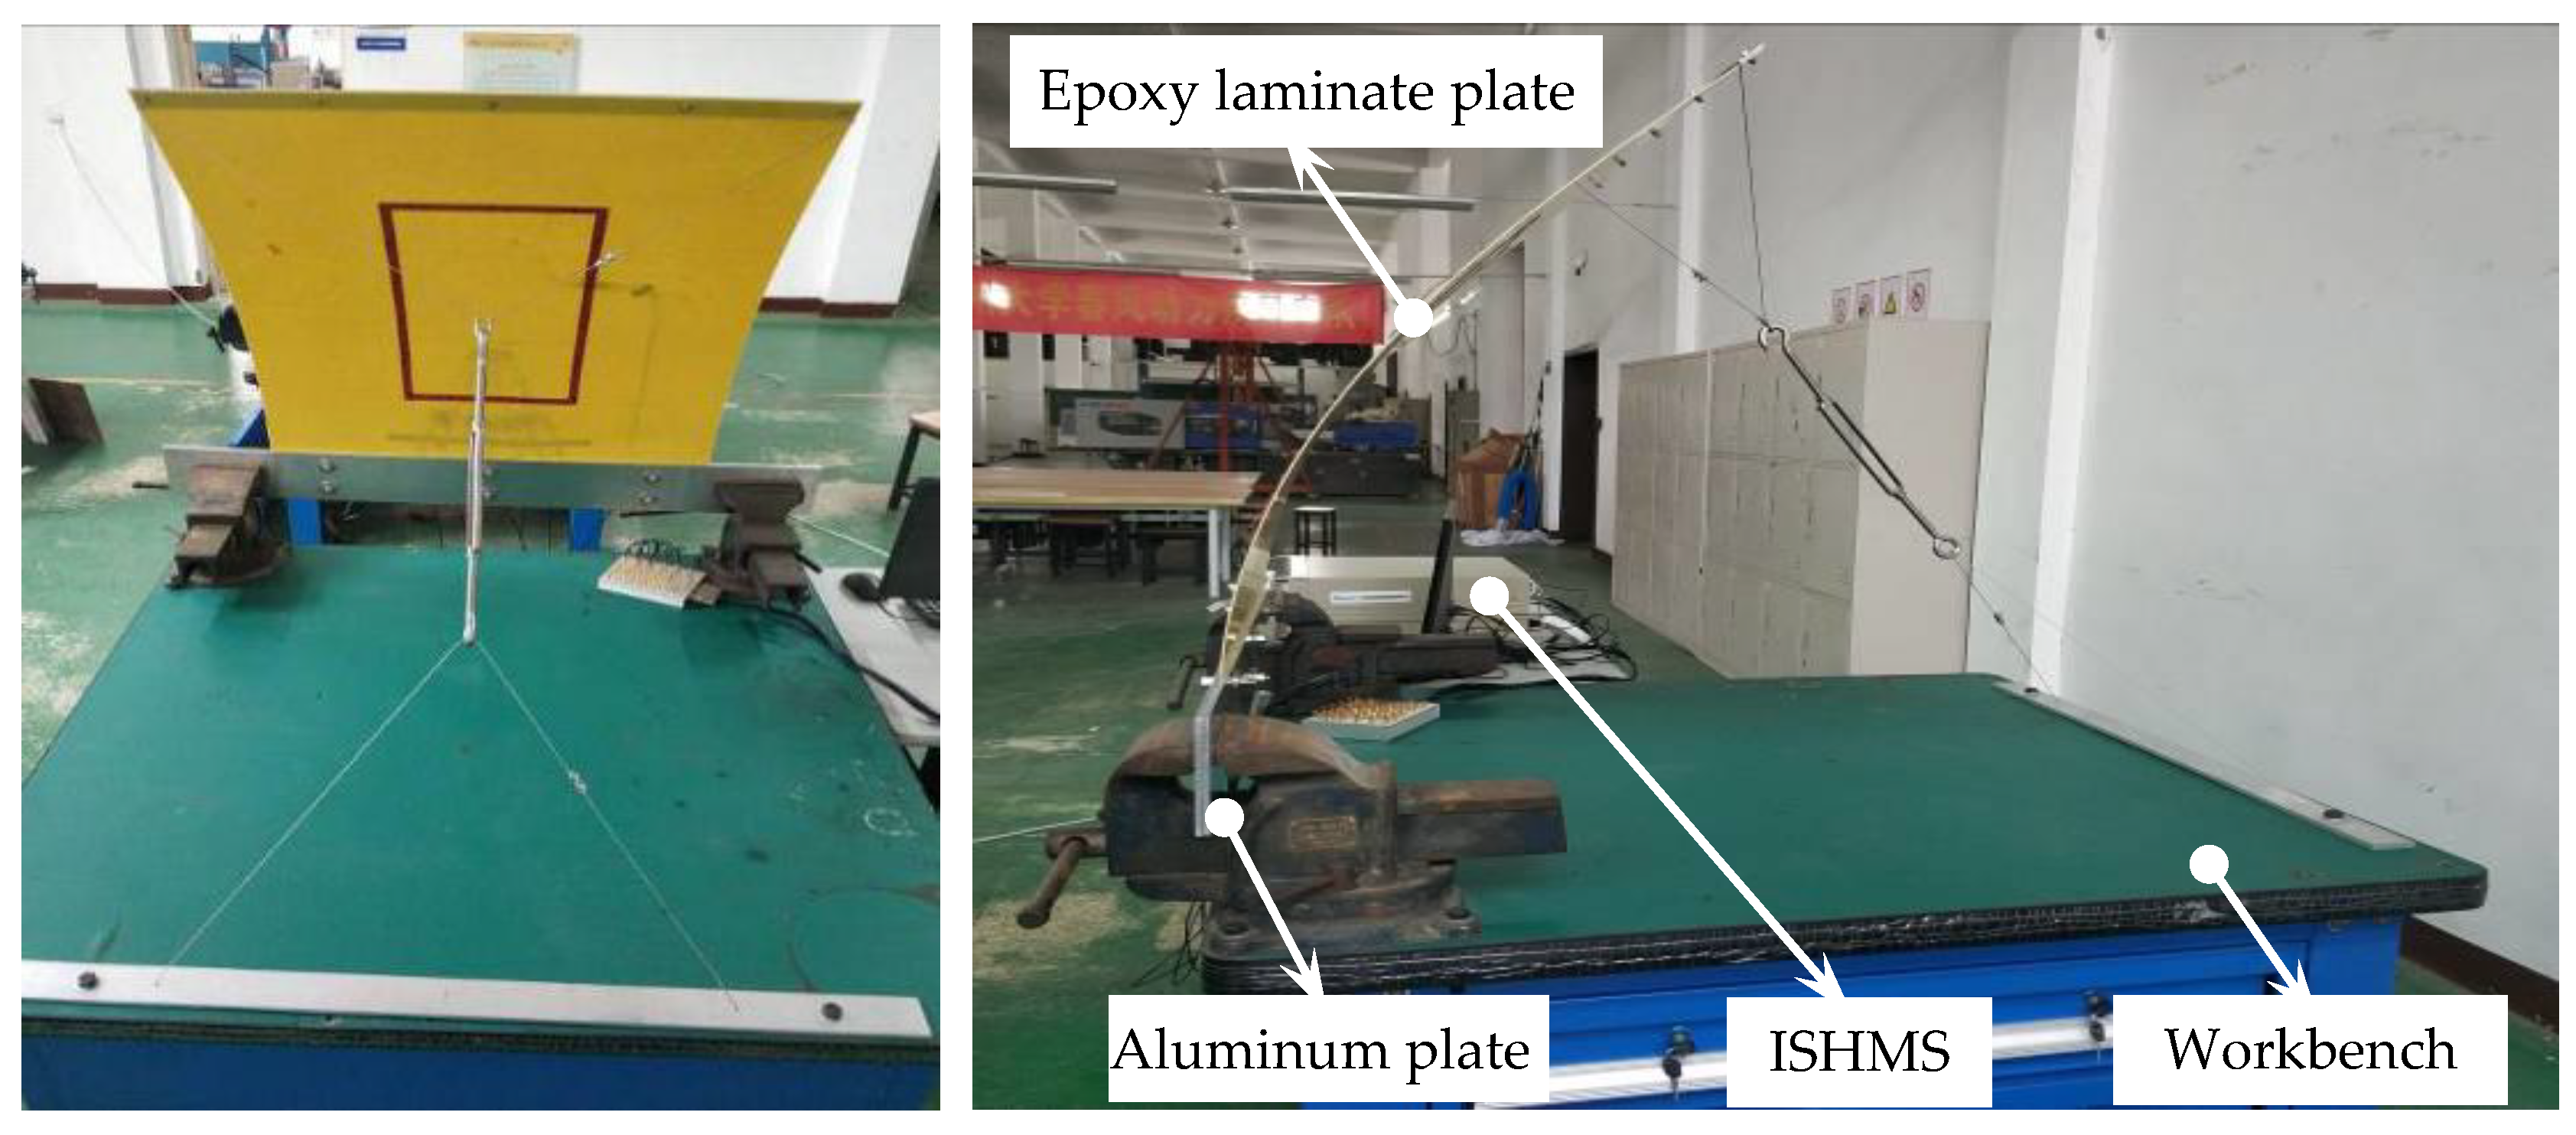
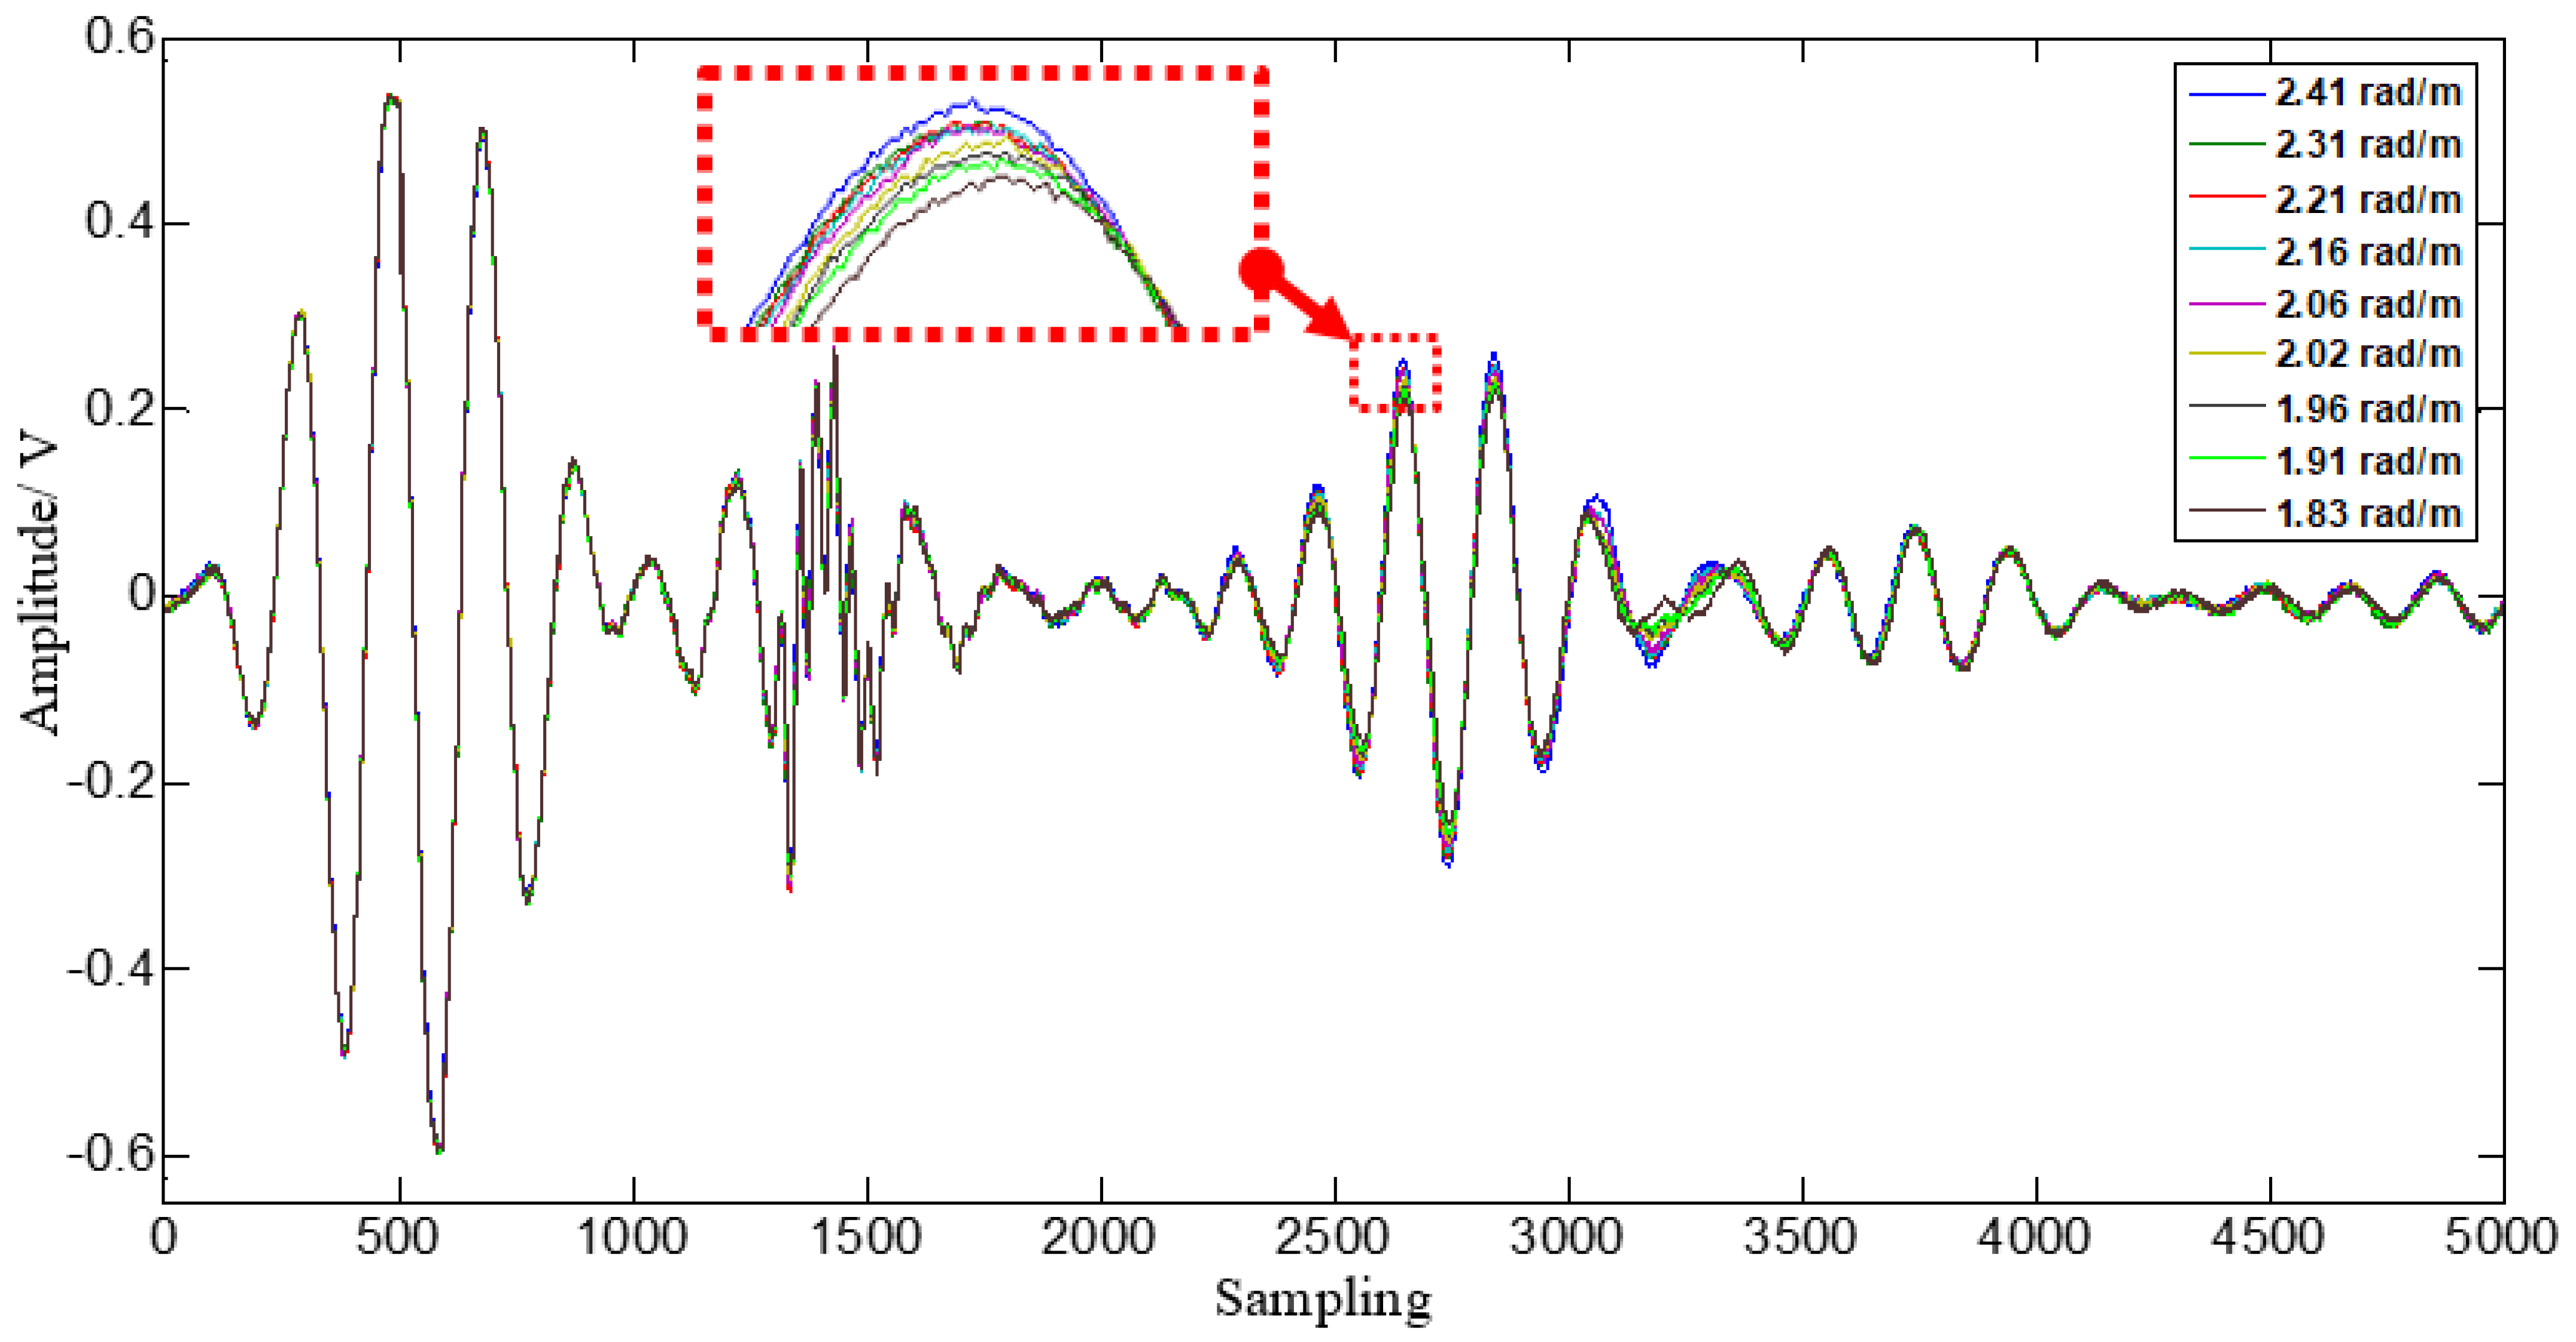
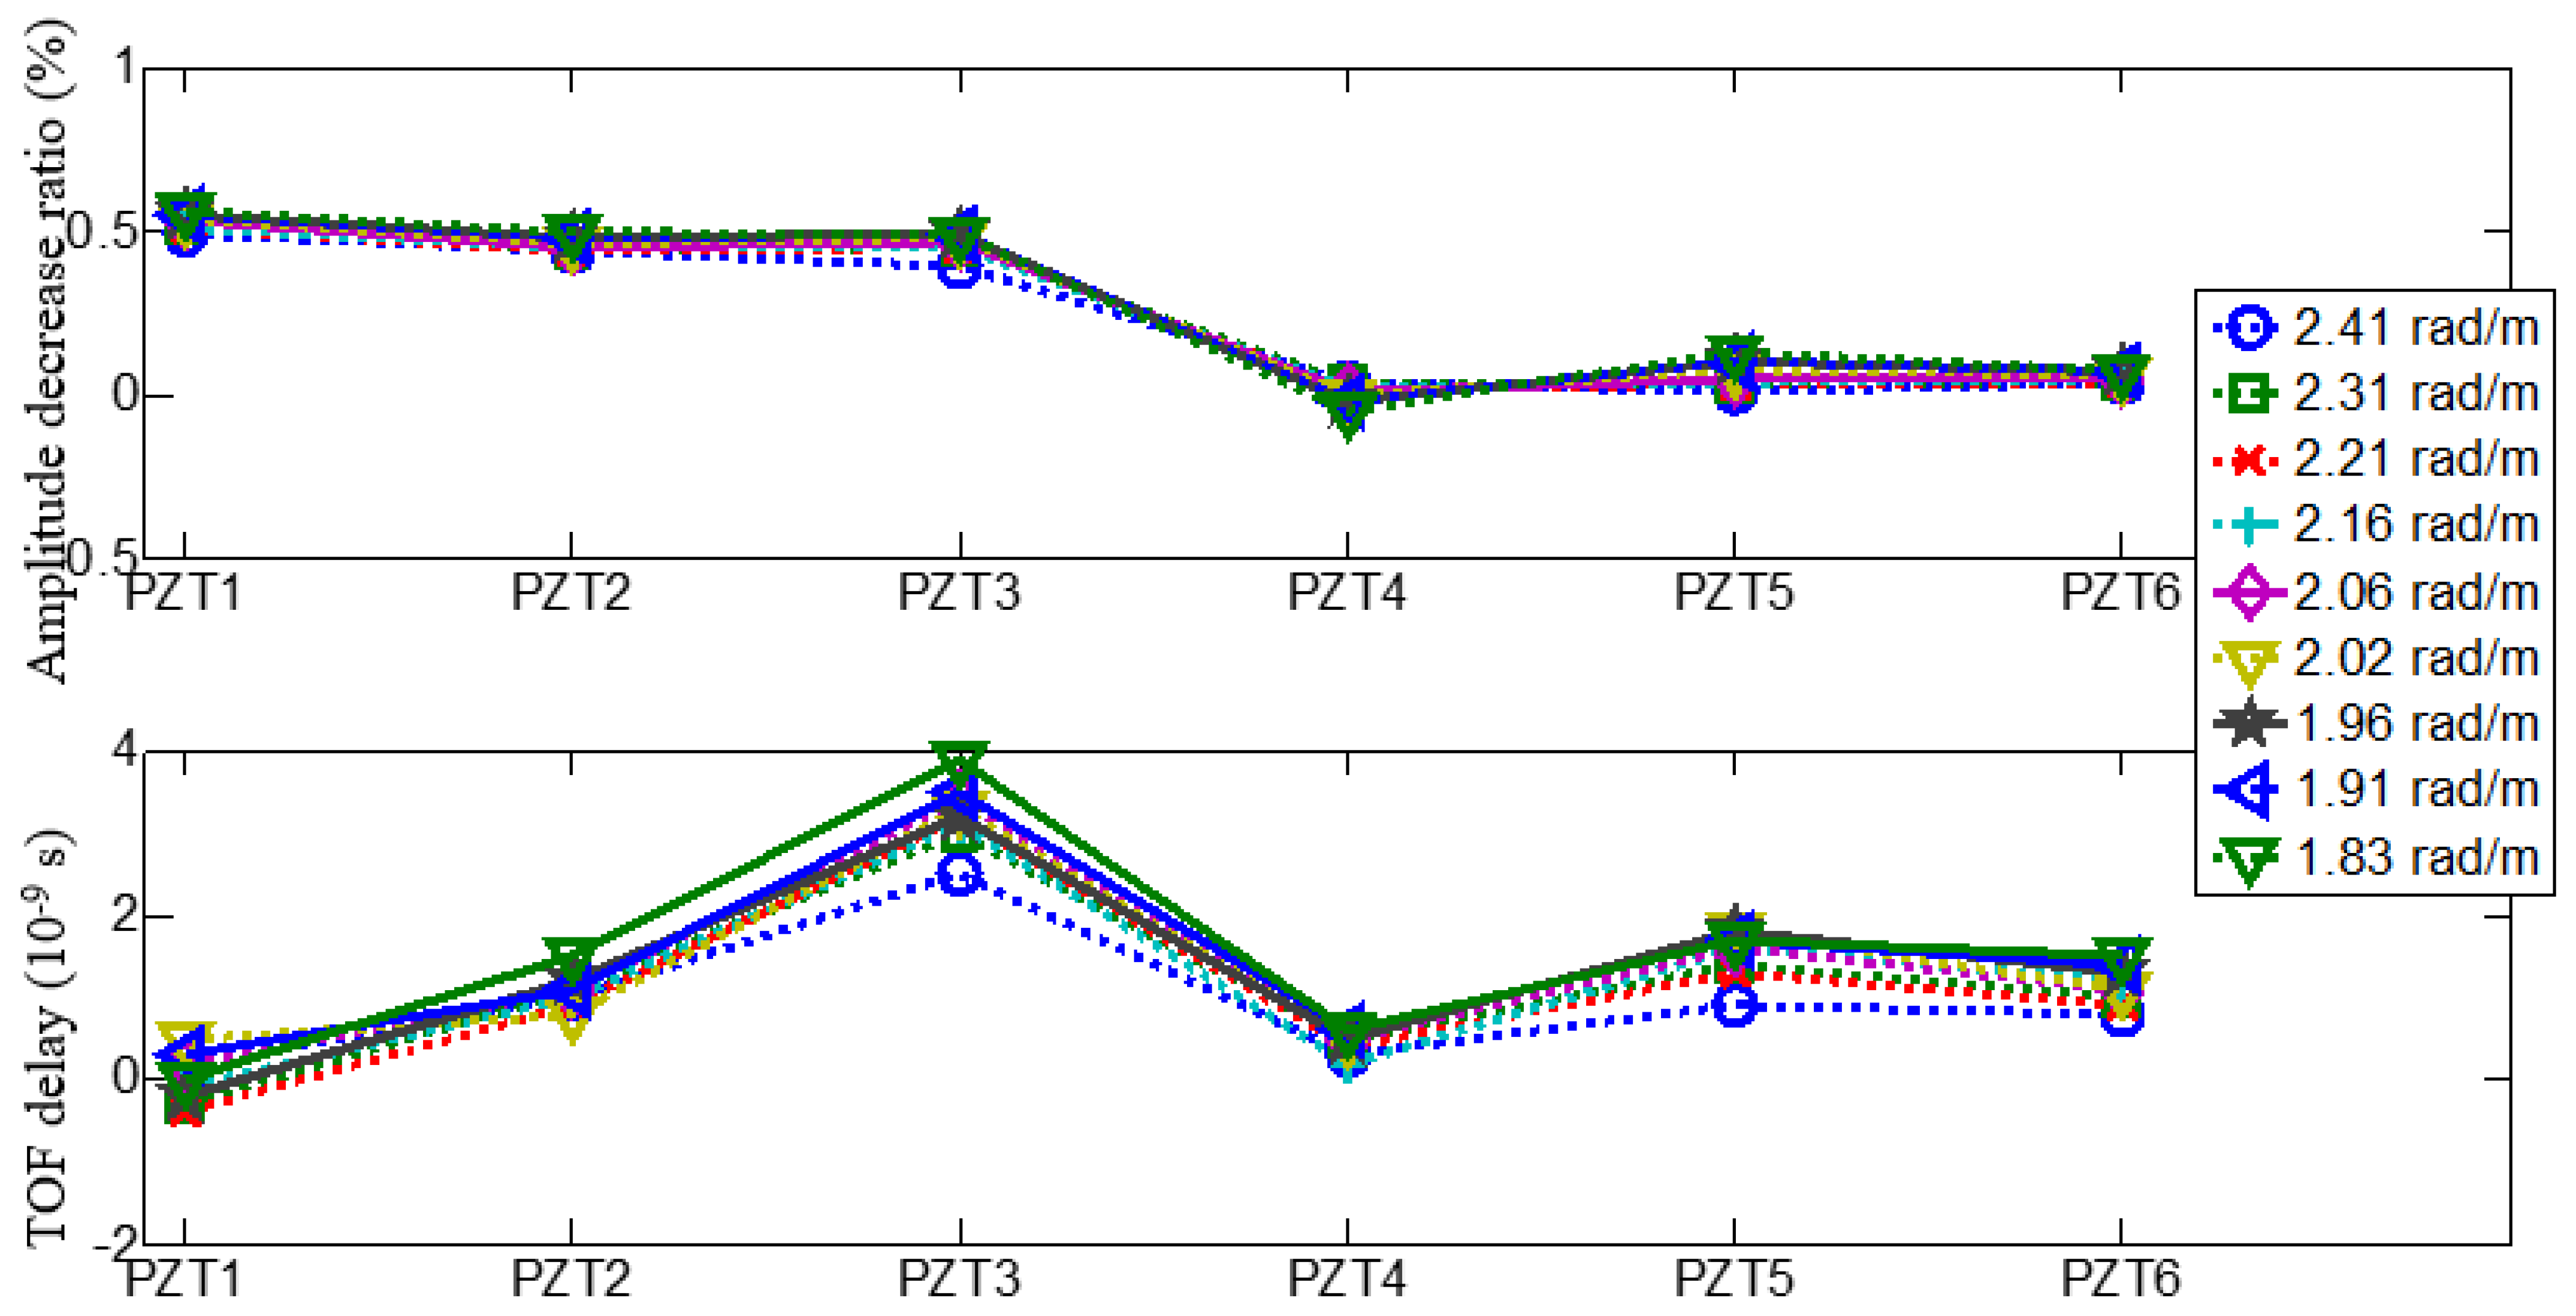
3.3. Load
4. Damage Imaging Compensation Results and Discussion
5. Conclusions and Future Works
Author Contributions
Funding
Institutional Review Board Statement
Informed Consent Statement
Data Availability Statement
Conflicts of Interest
References
- Qing, X.; Li, W.; Wang, Y.; Sun, H. Piezoelectric transducer-based structural health monitoring for aircraft applications. Sensors 2019, 19, 545. [Google Scholar] [CrossRef] [PubMed]
- Smithard, J.; Rajic, N.; Van der Velden, S.; Norman, P.; Rosalie, C.; Galea, S.; Mei, H.; Lin, B.; Giurgiutiu, V. An advanced multi-sensor acousto-ultrasonic structural health monitoring system: Development and aerospace demonstration. Materials 2017, 10, 832. [Google Scholar] [CrossRef] [PubMed] [Green Version]
- Su, Z.; Ye, L.; Lu, Y. Guided Lamb waves for identification of damage in composite structures: A review. J. Sound Vib. 2006, 295, 753–780. [Google Scholar] [CrossRef]
- Willberg, C.; Duczek, S.; Vivar-Perez, J.M.; Ahmad, Z.A. Simulation methods for guided wave-based structural health monitoring: A review. Appl. Mech. Rev. 2015, 67, 010803. [Google Scholar] [CrossRef] [Green Version]
- Wang, Q.; Xu, Y.; Su, Z.; Cao, M.; Yue, D. An enhanced time-reversal imaging algorithm-driven sparse linear array for progressive and quantitative monitoring of cracks. IEEE Trans. Instrum. Meas. 2018, 68, 3433–3445. [Google Scholar] [CrossRef]
- Huan, Q.; Chen, M.T.; Su, Z.Q.; Li, F.X. A high-resolution structural health monitoring system based on SH wave piezoelectric transducers phased array. Ultrasonics 2019, 97, 29–37. [Google Scholar] [CrossRef] [PubMed]
- Tian, Z.; Yu, L.; Sun, X.; Lin, B. Damage localization with fiber Bragg grating Lamb wave sensing through adaptive phased array imaging. Struct. Health Monit. 2019, 18, 334–344. [Google Scholar] [CrossRef]
- Ren, Y.; Qiu, L.; Yuan, S.; Bao, Q. On-line multi-damage scanning spatial-wavenumber filter based imaging method for aircraft composite structure. Materials 2017, 10, 519. [Google Scholar] [CrossRef] [PubMed] [Green Version]
- Ren, Y.; Qiu, L.; Yuan, S.; Su, Z. A diagnostic imaging approach for online characterization of multi-impact in aircraft composite structures based on a scanning spatial-wavenumber filter of guided wave. Mech. Syst. Signal Process. 2017, 90, 44–63. [Google Scholar] [CrossRef]
- Wang, Z.; Xiao, Z.; Li, Y.; Jiang, Y. An omnidirectional near-field comprehensive damage detection method for composite structures. Appl. Sci. 2019, 9, 567. [Google Scholar] [CrossRef] [Green Version]
- Schmidt, R.O. Multiple emitter location and signal parameter estimation. IEEE Trans. Antennas Propag. 1986, 34, 276–280. [Google Scholar] [CrossRef] [Green Version]
- Zhong, Y.; Xiang, J. Impact location on a stiffened composite panel using improved linear array. Smart Struct. Syst. 2019, 24, 173–182. [Google Scholar]
- Gorgin, R.; Luo, Y.; Wu, Z. Environmental and operational conditions effects on Lamb wave based structural heath monitoring systems: A review. Ultrasonics 2020, 105, 106114. [Google Scholar] [CrossRef] [PubMed]
- Ren, Y.; Qiu, L.; Yuan, S.; Fang, F. Multi-damage imaging of composite structures under environmental and operational conditions using guided wave and Gaussian mixture model. Smart Mater. Struct. 2019, 28, 115017. [Google Scholar] [CrossRef]
- Ren, Y.; Qiu, L.; Yuan, S.; Fang, F. Gaussian mixture model and delay-and-sum based 4D imaging of damage in aircraft composite structures under time-varying conditions. Mech. Syst. Signal Process. 2020, 135, 106390. [Google Scholar] [CrossRef]
- Sun, H.; Yi, J.; Xu, Y.; Wang, Y.; Qing, X. Identification and compensation technique of non-uniform temperature field for lamb wave-and multiple sensors-based damage detection. Sensors 2019, 19, 2930. [Google Scholar] [CrossRef] [PubMed] [Green Version]
- Mohabuth, M.; Kotousov, A.; Ng, C.T.; Rose, L.F. Implication of changing loading conditions on structural health monitoring utilising guided waves. Smart Mater. Struct. 2018, 27, 025003. [Google Scholar] [CrossRef] [Green Version]
- Yang, B.; Xuan, F.Z.; Xiang, Y.; Li, D.; Zhu, W.; Tang, X.; Xu, J.; Yang, K.; Luo, C. Lamb wave-based structural health monitoring on composite bolted joints under tensile load. Materials 2017, 10, 652. [Google Scholar] [CrossRef] [PubMed] [Green Version]
- Yuan, S.; Zhong, Y.; Qiu, L.; Wang, Z. Two-dimensional near-field multiple signal classification algorithm–based impact localization. J. Intell. Mater. Syst. Struct. 2015, 26, 400–413. [Google Scholar] [CrossRef]
- Ren, L.; Zhong, Y.; Xiang, J. Adaptive sensor array error calibration based impact localization on composite structure. Appl. Sci. 2020, 10, 4042. [Google Scholar] [CrossRef]


| Environmental Factors | Standard 2D-MUSIC | Compensated 2D-MUSIC | |||
|---|---|---|---|---|---|
| (mm) | (°) | (mm) | (°) | ||
| Temperature/°C | −20 | 242/8 | 95/5 | 242/8 | 93/3 |
| 0 | 233/17 | 96/6 | 233/17 | 94/4 | |
| 10 | 289/39 | 96/6 | 289/19 | 94/4 | |
| 20 | 231/19 | 96/6 | 240/10 | 94/4 | |
| 50 | 248/2 | 95/5 | 248/2 | 93/3 | |
| 70 | 246/4 | 95/5 | 249/1 | 93/3 | |
| Vibration/Hz | 30 | 242/8 | 94/4 | 244/6 | 94/4 |
| 60 | 257/7 | 94/4 | 257/7 | 93/3 | |
| 90 | 278/28 | 94/4 | 274/24 | 93/3 | |
| 300 | 238/12 | 92/2 | 241/9 | 92/2 | |
| 600 | 234/16 | 91/2 | 238/12 | 90/0 | |
| 900 | 208/42 | 91/3 | 246/4 | 90/0 | |
| Curvature induced by Load/rad/m | 2.31 | 258/8 | 93/3 | 255/5 | 93/3 |
| 2.21 | 244/6 | 94/4 | 245/5 | 94/4 | |
| 2.16 | 242/8 | 94/4 | 244/6 | 93/3 | |
| 2.06 | 266/14 | 93/3 | 248/2 | 92/2 | |
| 1.91 | 240/10 | 94/4 | 242/8 | 94/4 | |
| 1.83 | 260/10 | 93/3 | 260/10 | 93/3 | |
Publisher’s Note: MDPI stays neutral with regard to jurisdictional claims in published maps and institutional affiliations. |
© 2021 by the authors. Licensee MDPI, Basel, Switzerland. This article is an open access article distributed under the terms and conditions of the Creative Commons Attribution (CC BY) license (https://creativecommons.org/licenses/by/4.0/).
Share and Cite
Wang, Z.; Zhong, Y.; Zhou, J.; Li, C.; Zhong, L. Environmental Effects on Piezoelectric Sensors Array Signals and a Compensated Damage Imaging Method. Materials 2021, 14, 6742. https://doi.org/10.3390/ma14226742
Wang Z, Zhong Y, Zhou J, Li C, Zhong L. Environmental Effects on Piezoelectric Sensors Array Signals and a Compensated Damage Imaging Method. Materials. 2021; 14(22):6742. https://doi.org/10.3390/ma14226742
Chicago/Turabian StyleWang, Zhiling, Yongteng Zhong, Jinyu Zhou, Chaoyue Li, and Lina Zhong. 2021. "Environmental Effects on Piezoelectric Sensors Array Signals and a Compensated Damage Imaging Method" Materials 14, no. 22: 6742. https://doi.org/10.3390/ma14226742
APA StyleWang, Z., Zhong, Y., Zhou, J., Li, C., & Zhong, L. (2021). Environmental Effects on Piezoelectric Sensors Array Signals and a Compensated Damage Imaging Method. Materials, 14(22), 6742. https://doi.org/10.3390/ma14226742