
Alumina and Zirconia-Reinforced Polyamide PA-12 Composites for Biomedical Additive Manufacturing

 ,
,  ,
,  ,
,  and
and
Abstract
:1. Introduction
2. Materials and Methods
2.1. Sample Preparation
2.2. Filament Preparation
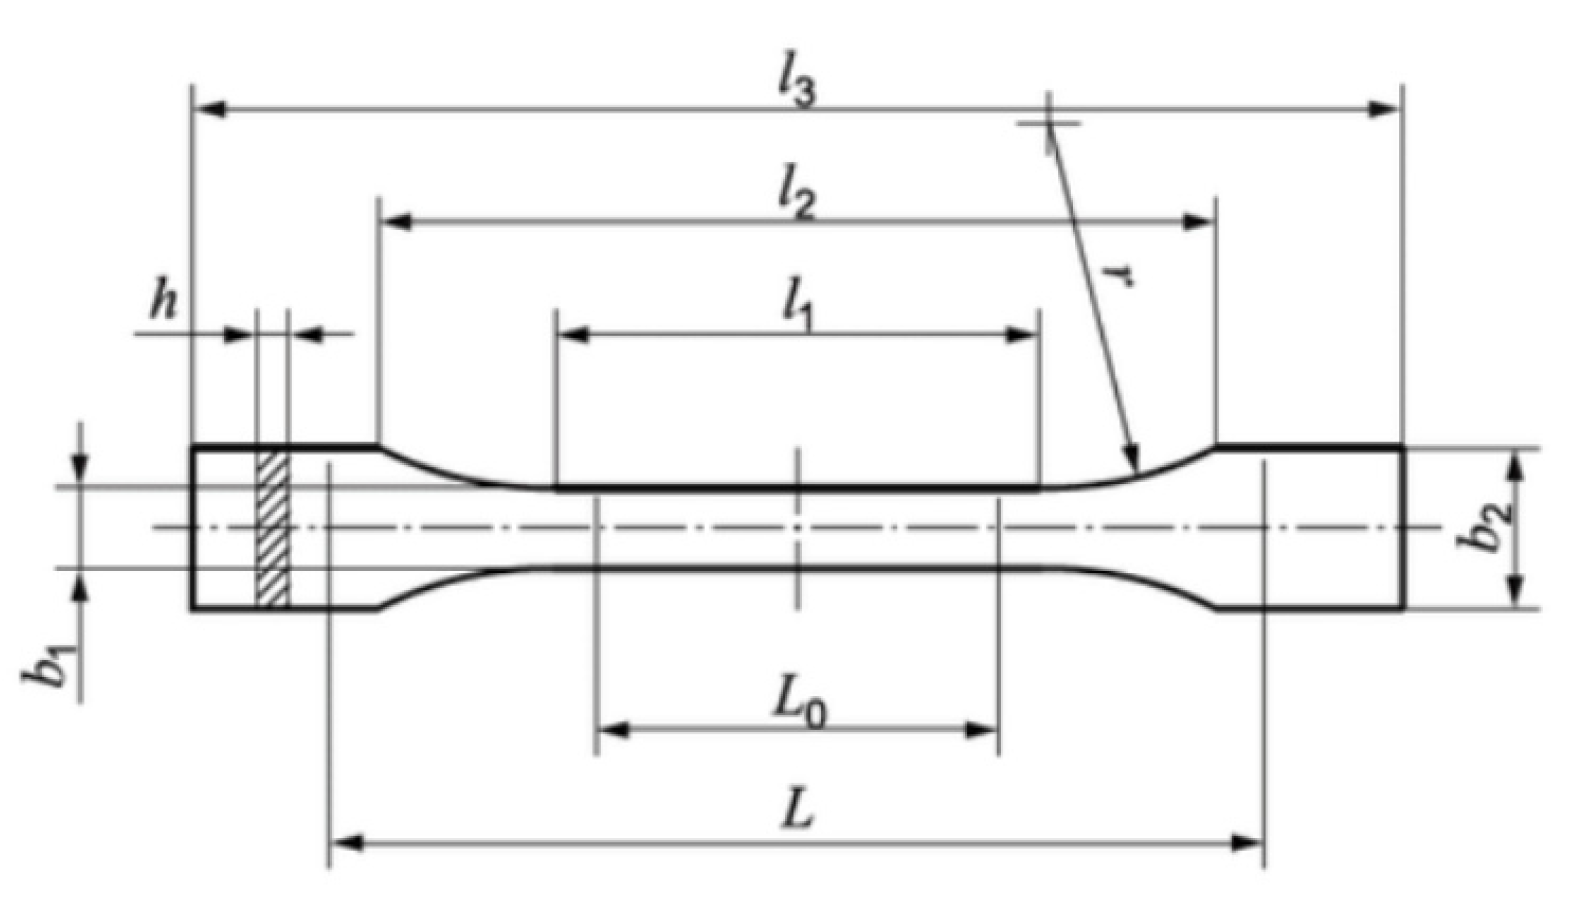
2.3. Filament Mechanical Testing Sample Preparation
2.4. Soaking Test Samples Preparation
Soaking Test
2.5. Methods
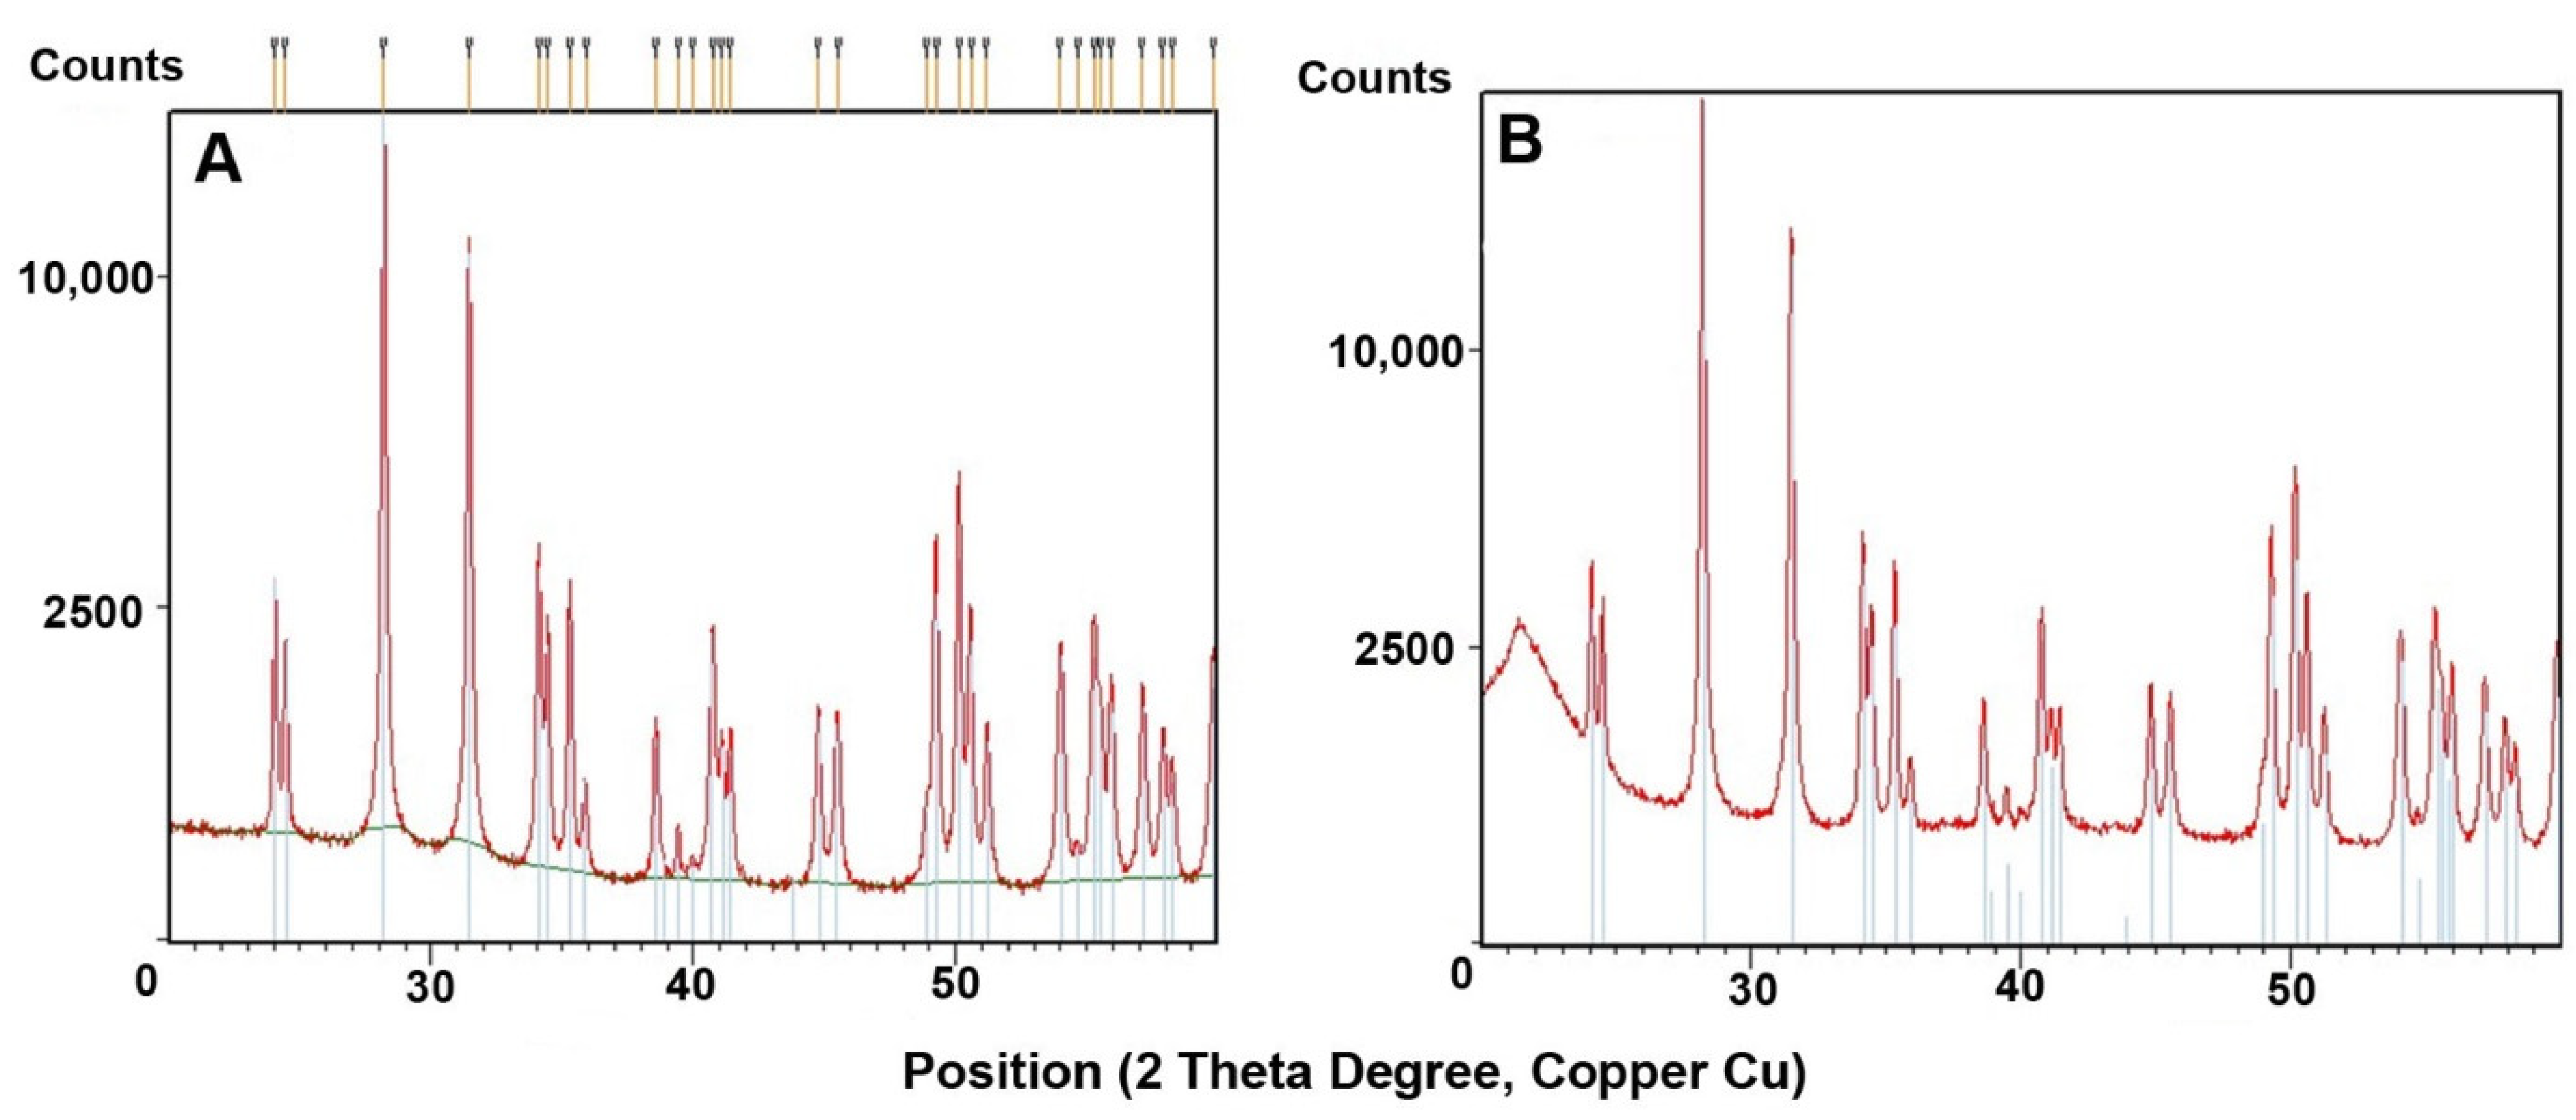
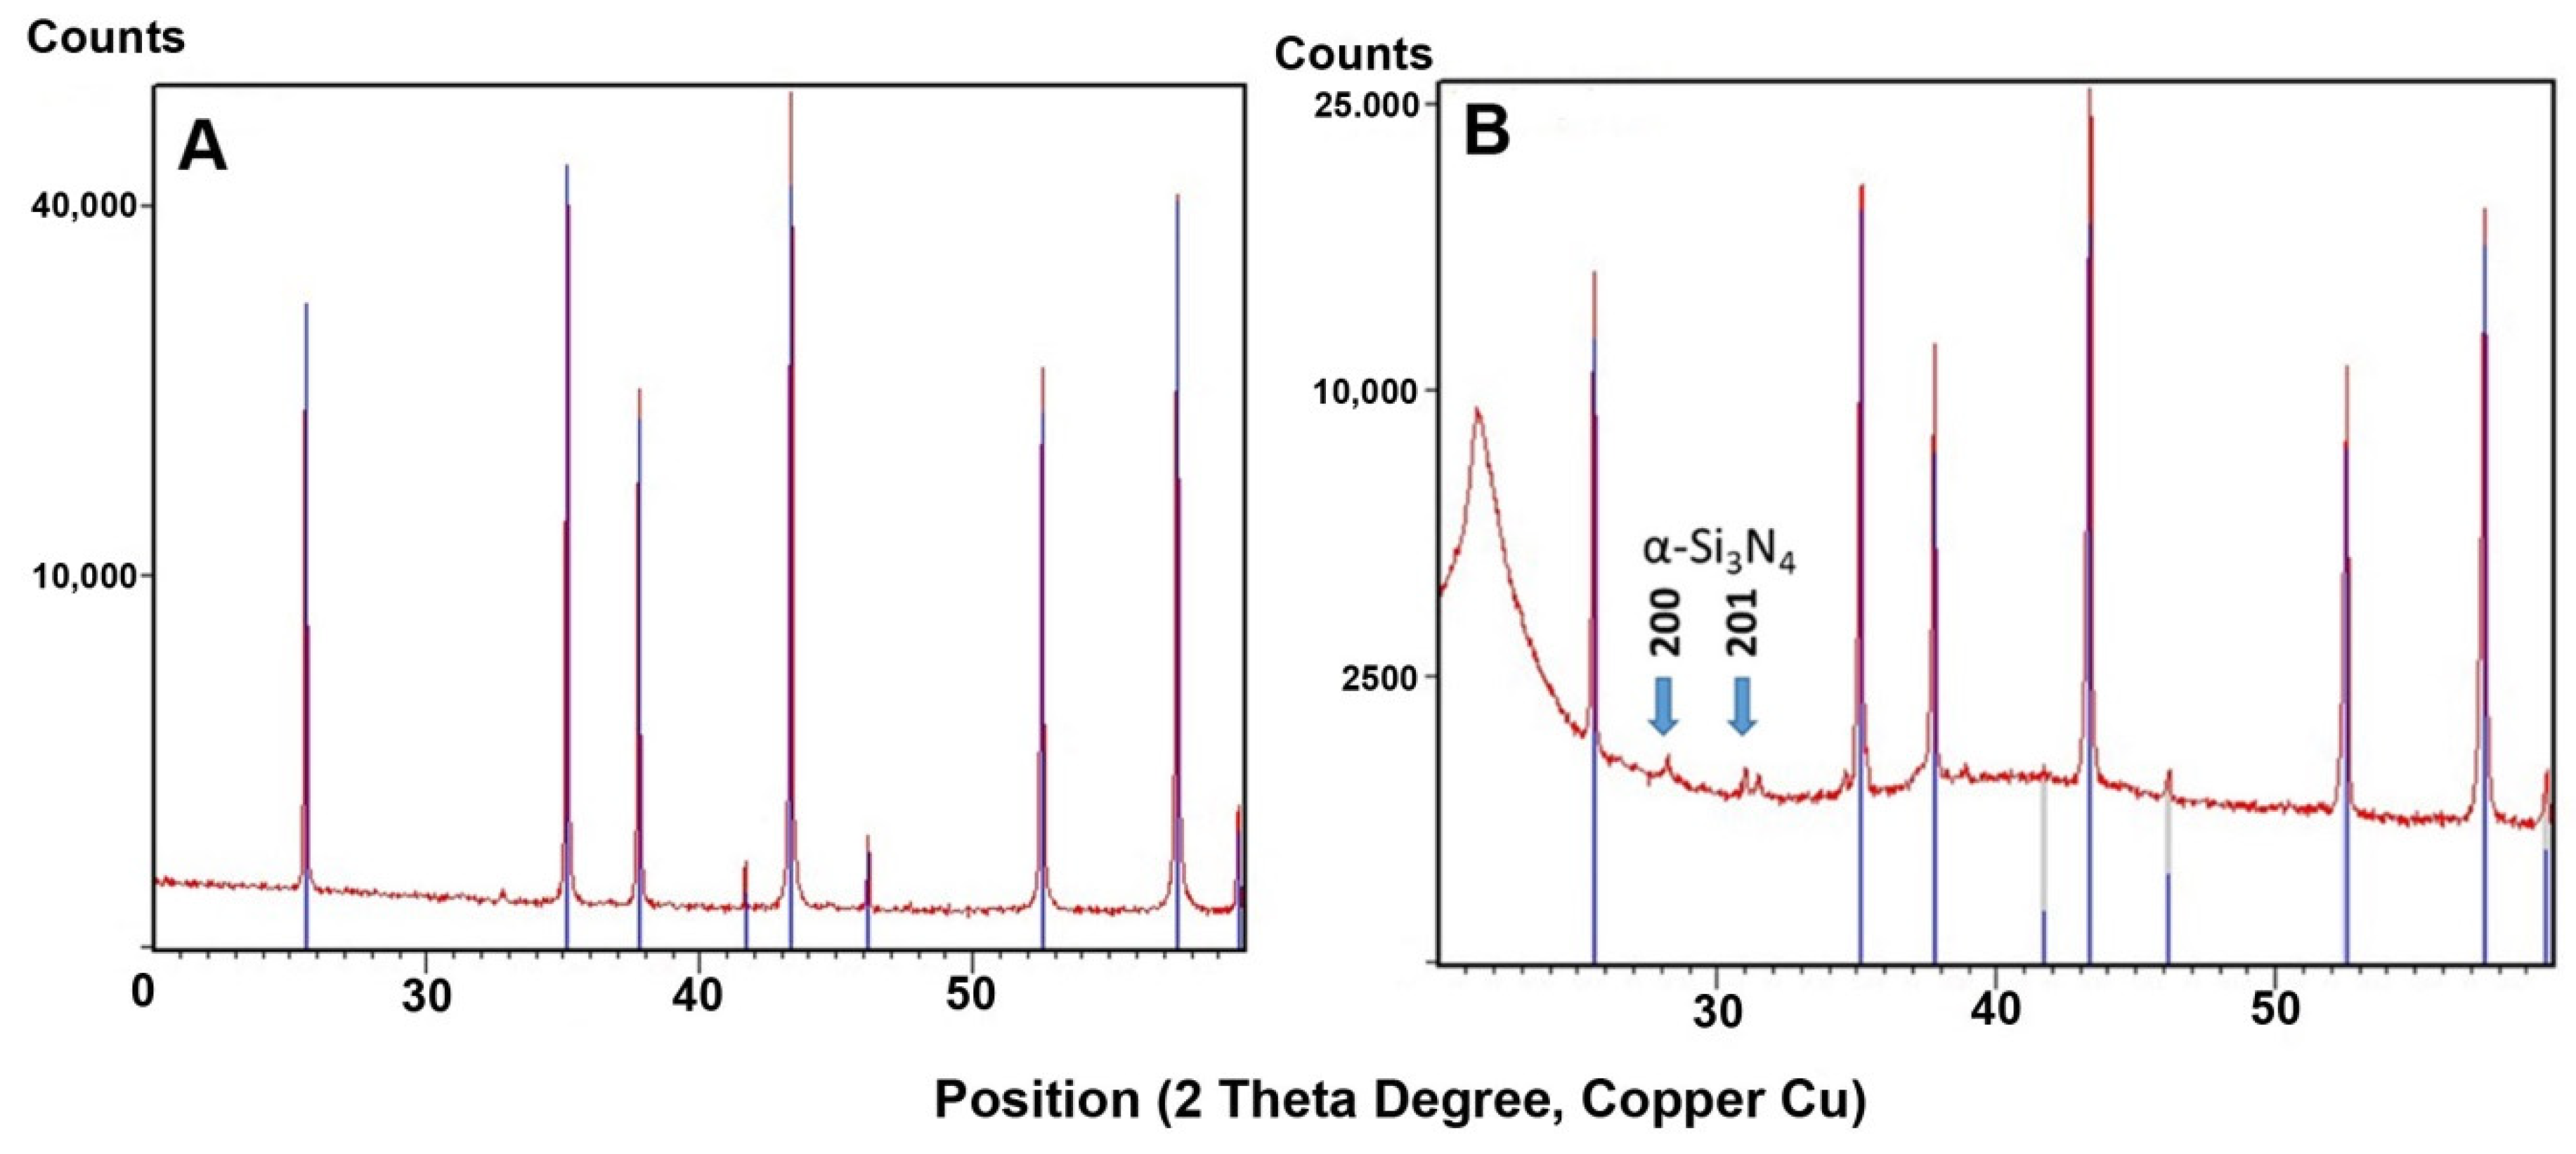
2.5.1. X-ray Diffraction (XRD)
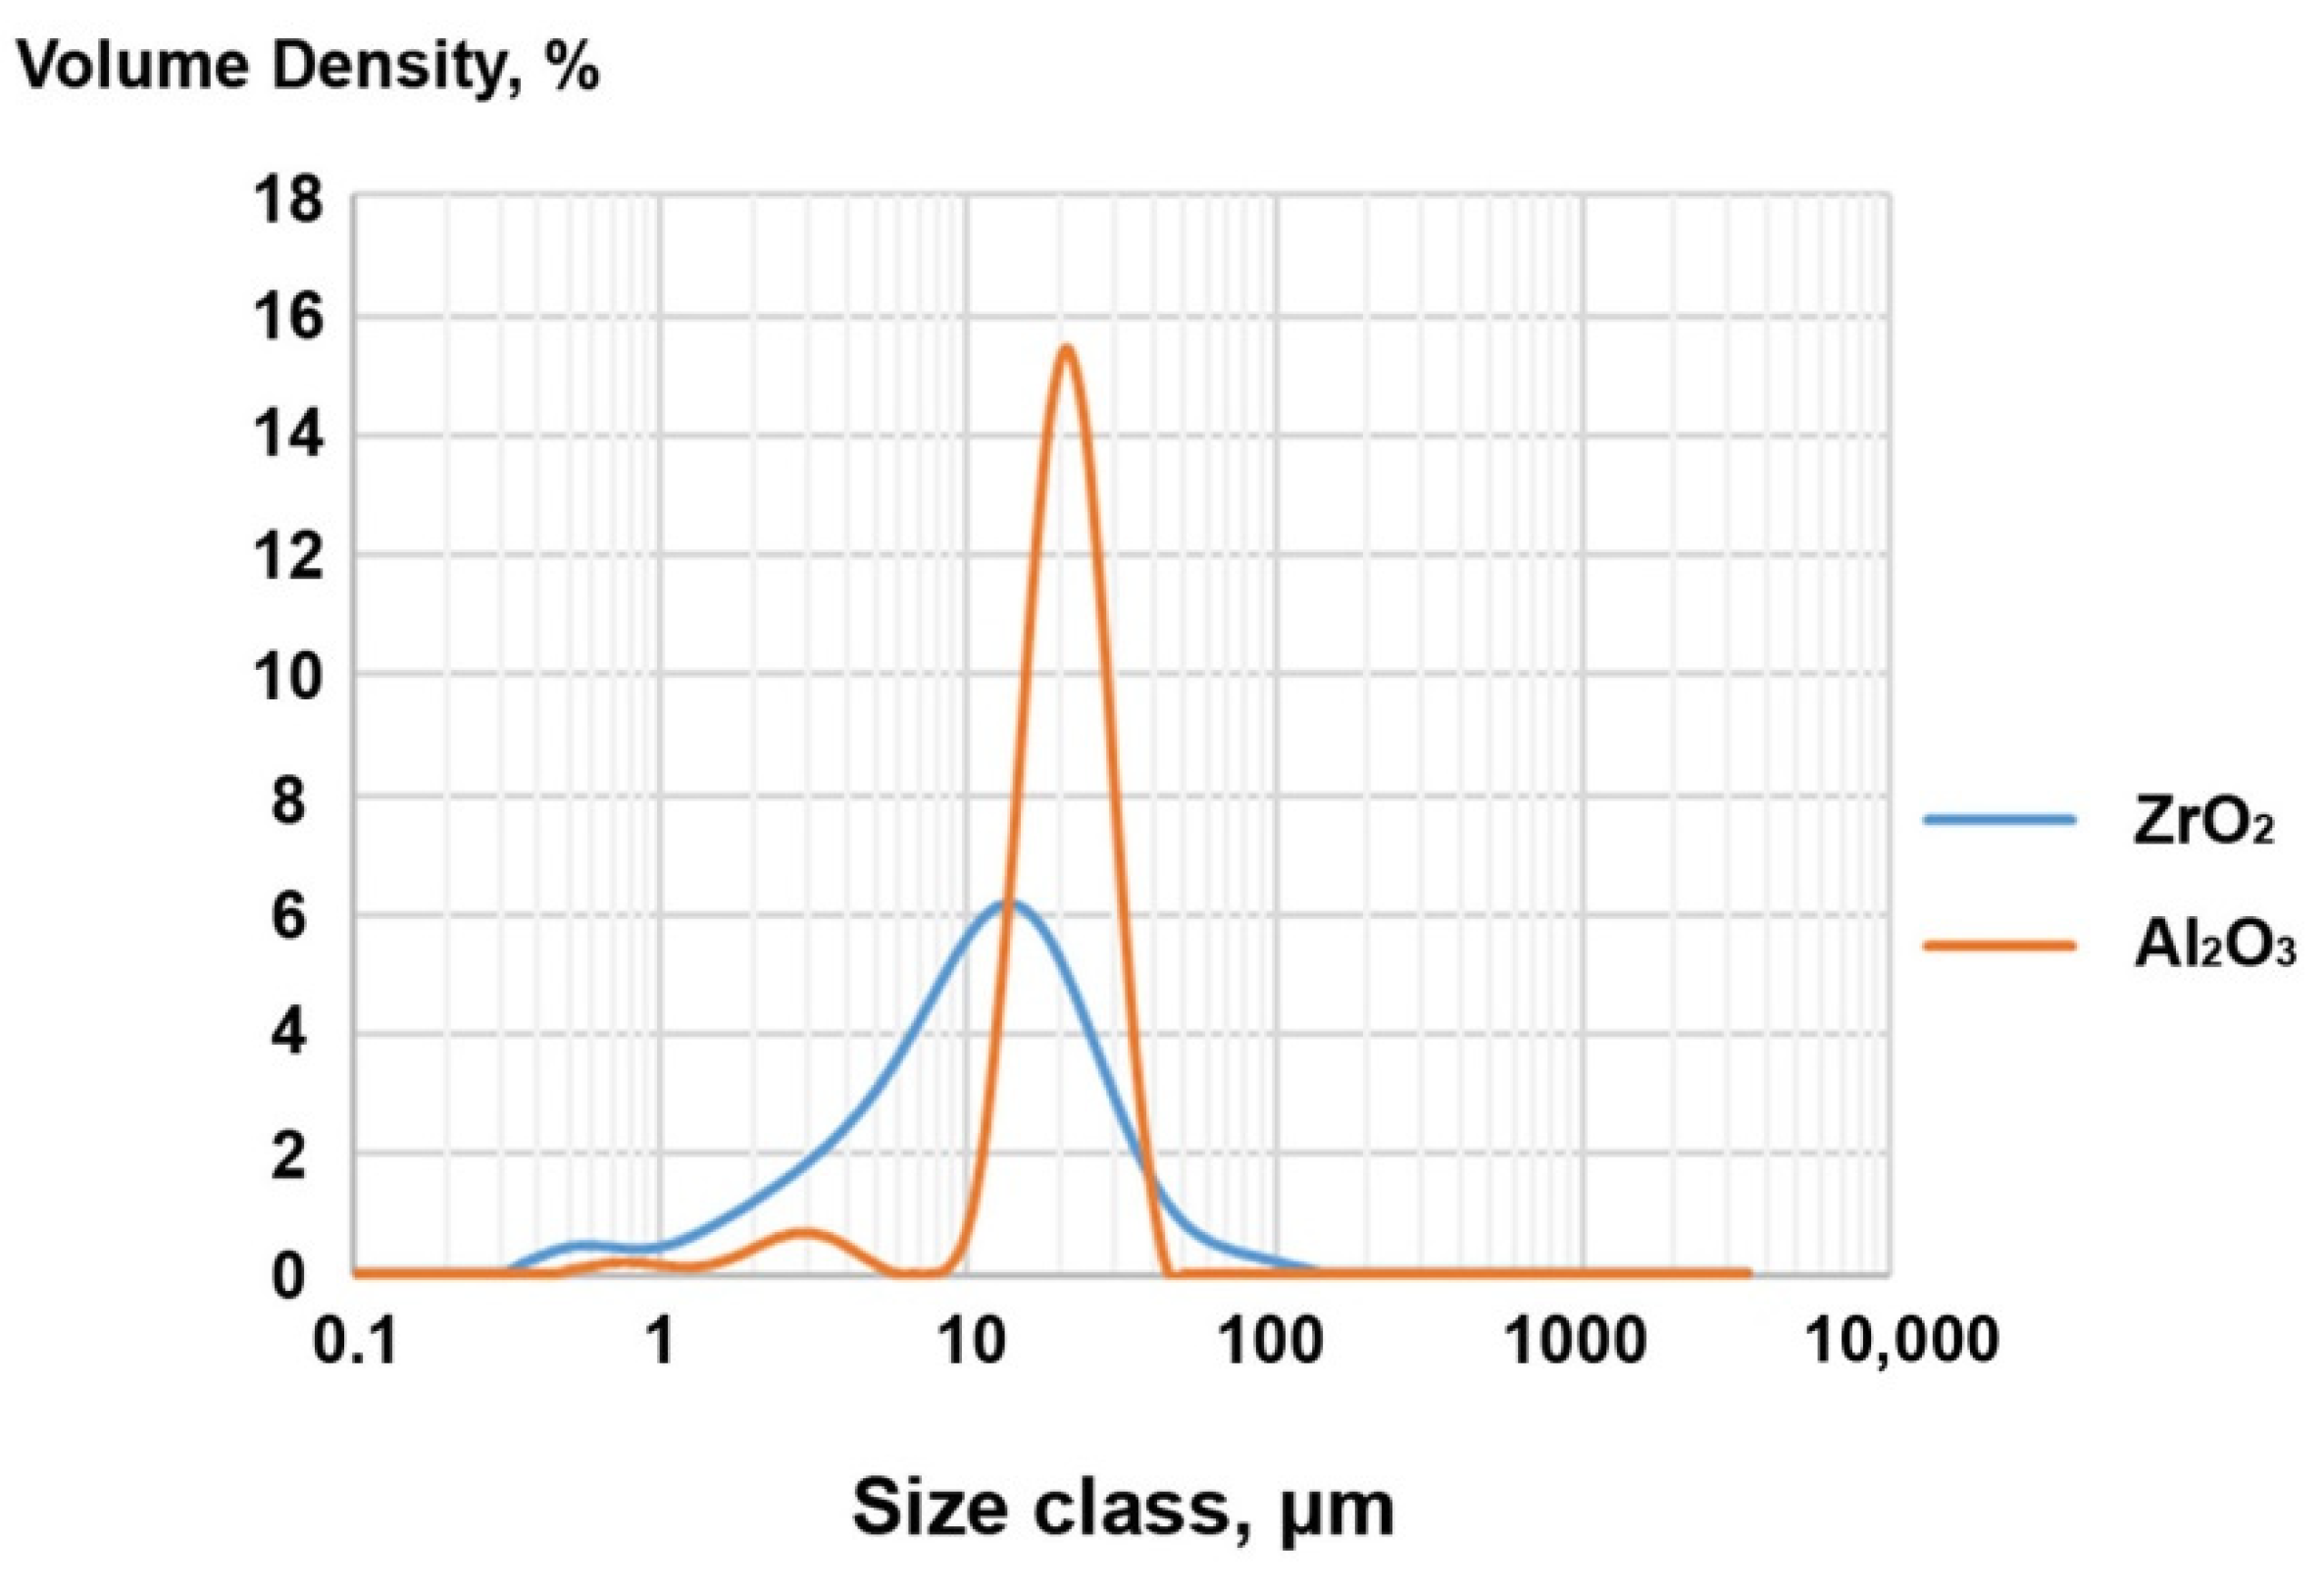
2.5.2. Particle Size Distribution (PSD)
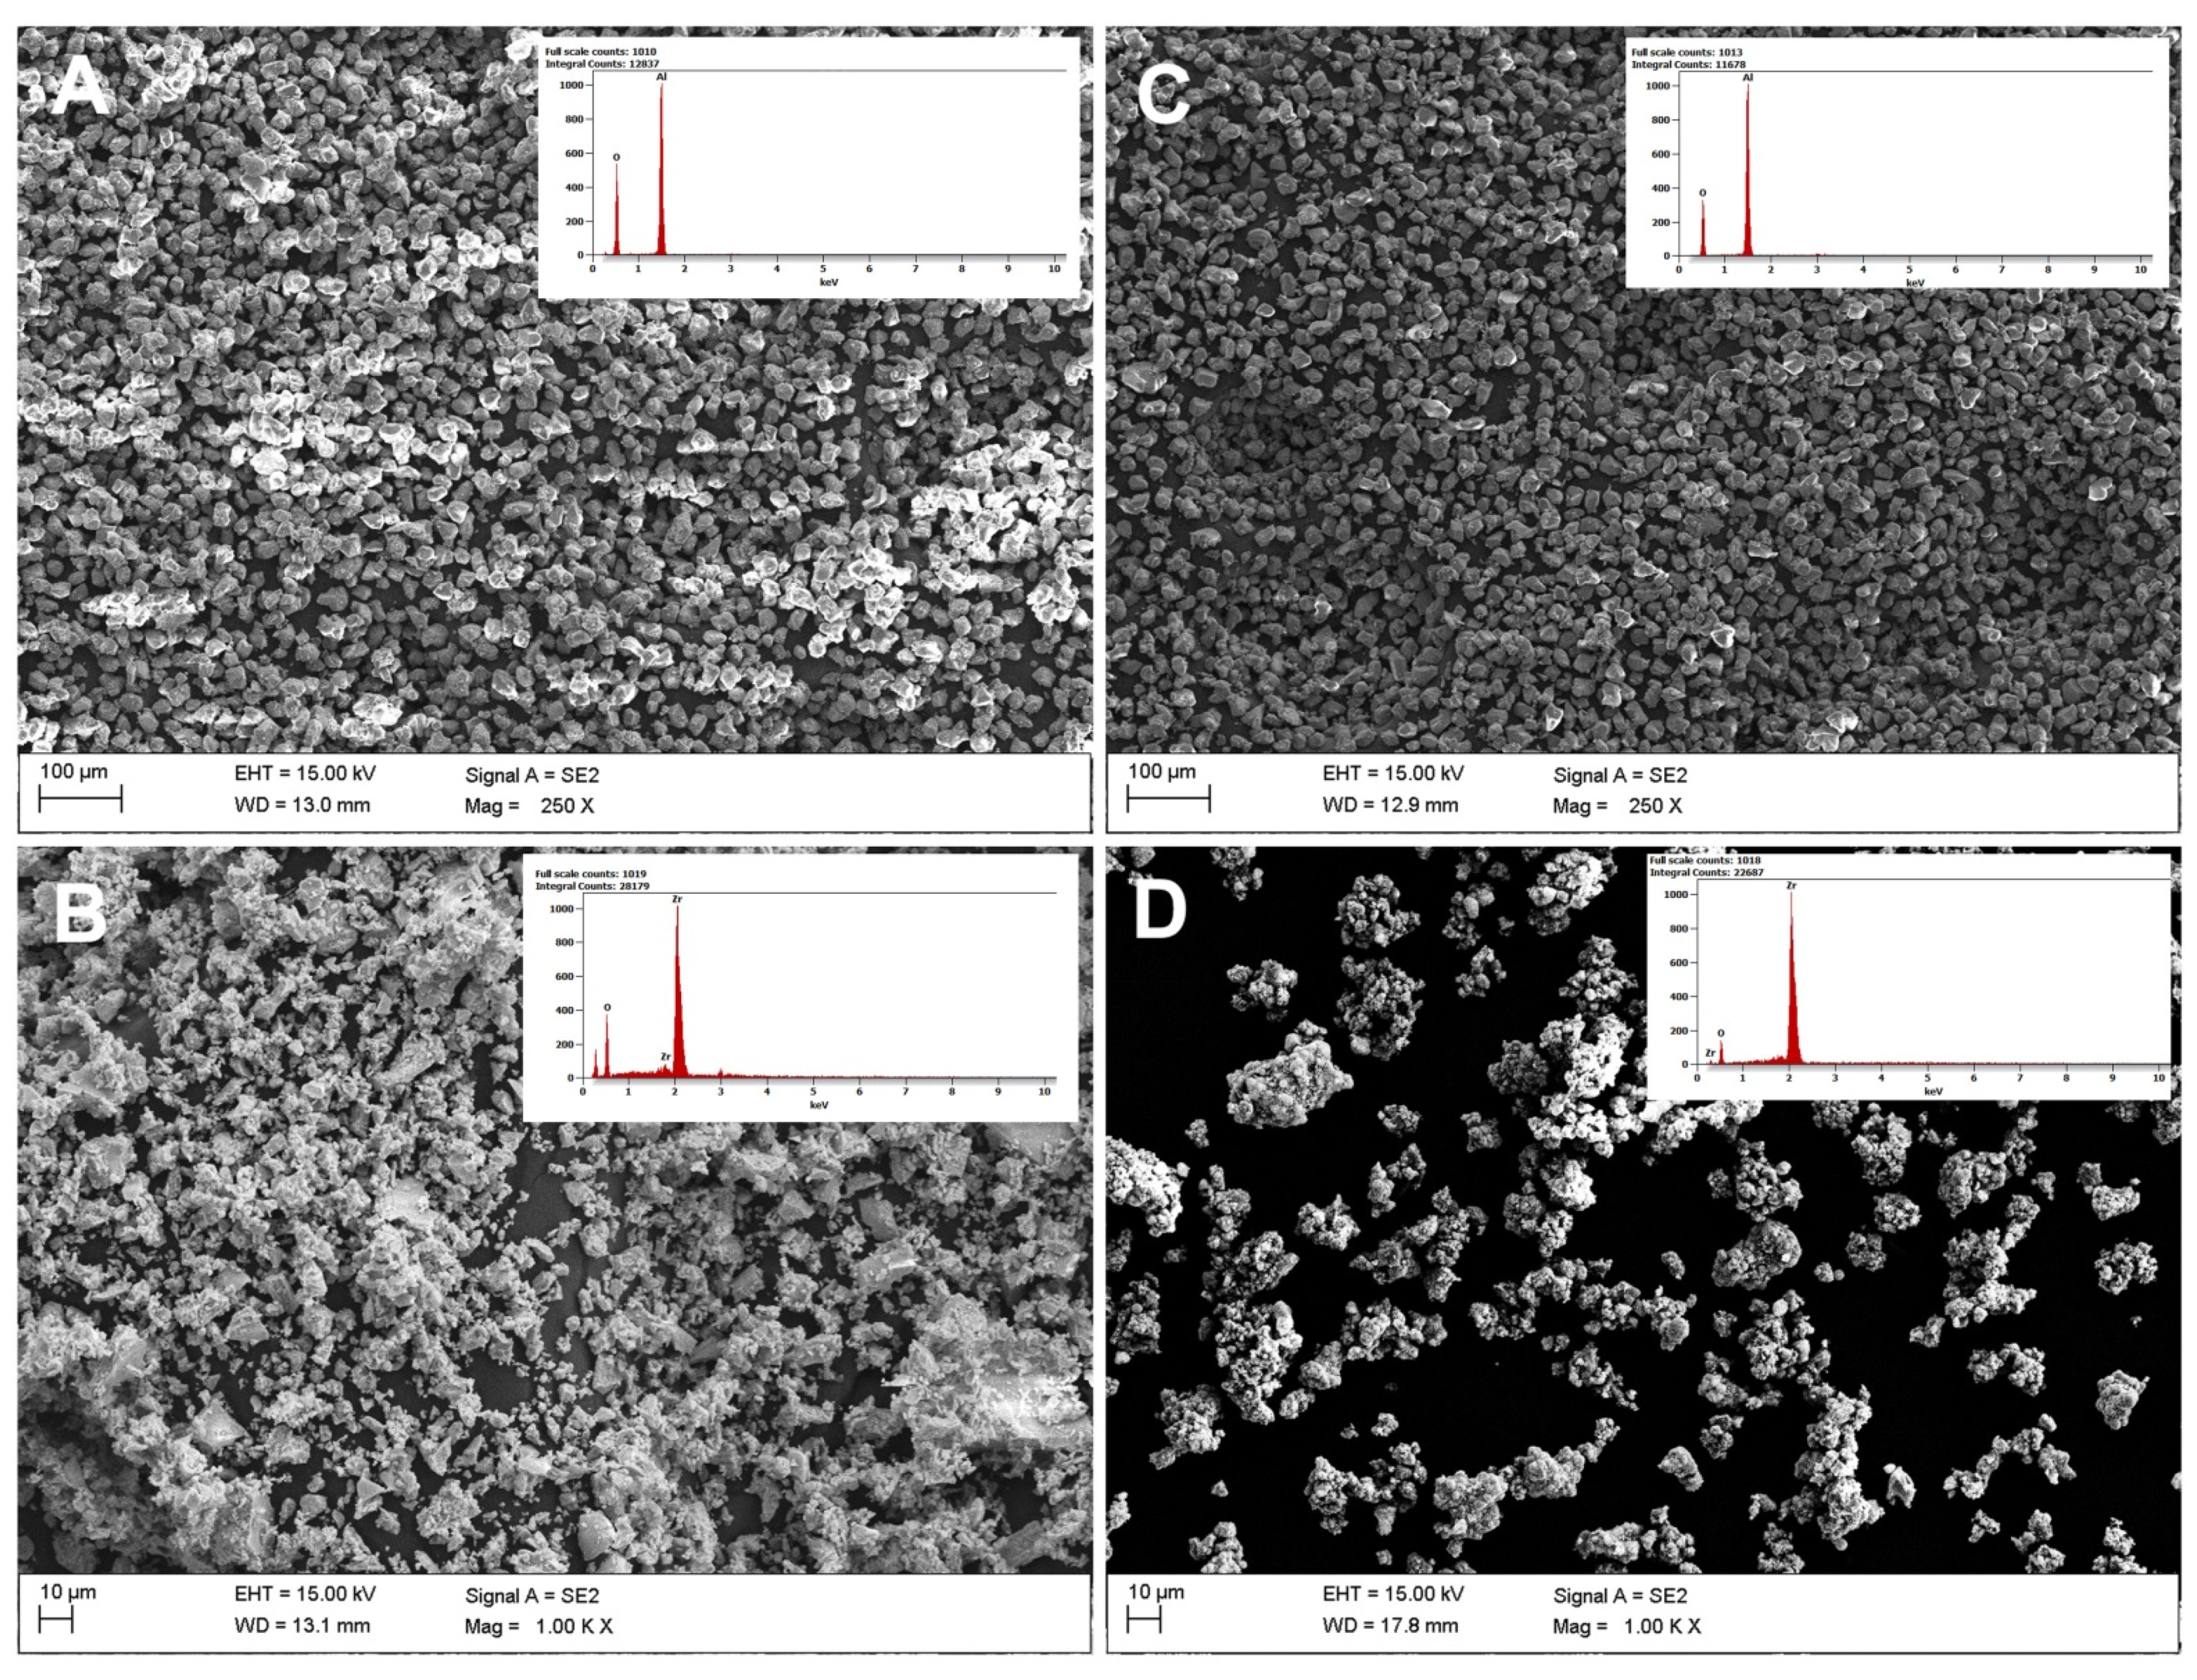
2.5.3. Scanning Electron Microscopy with Energy-Dispersive X-ray Spectroscopy (SEM/EDS)
Powders
Filaments
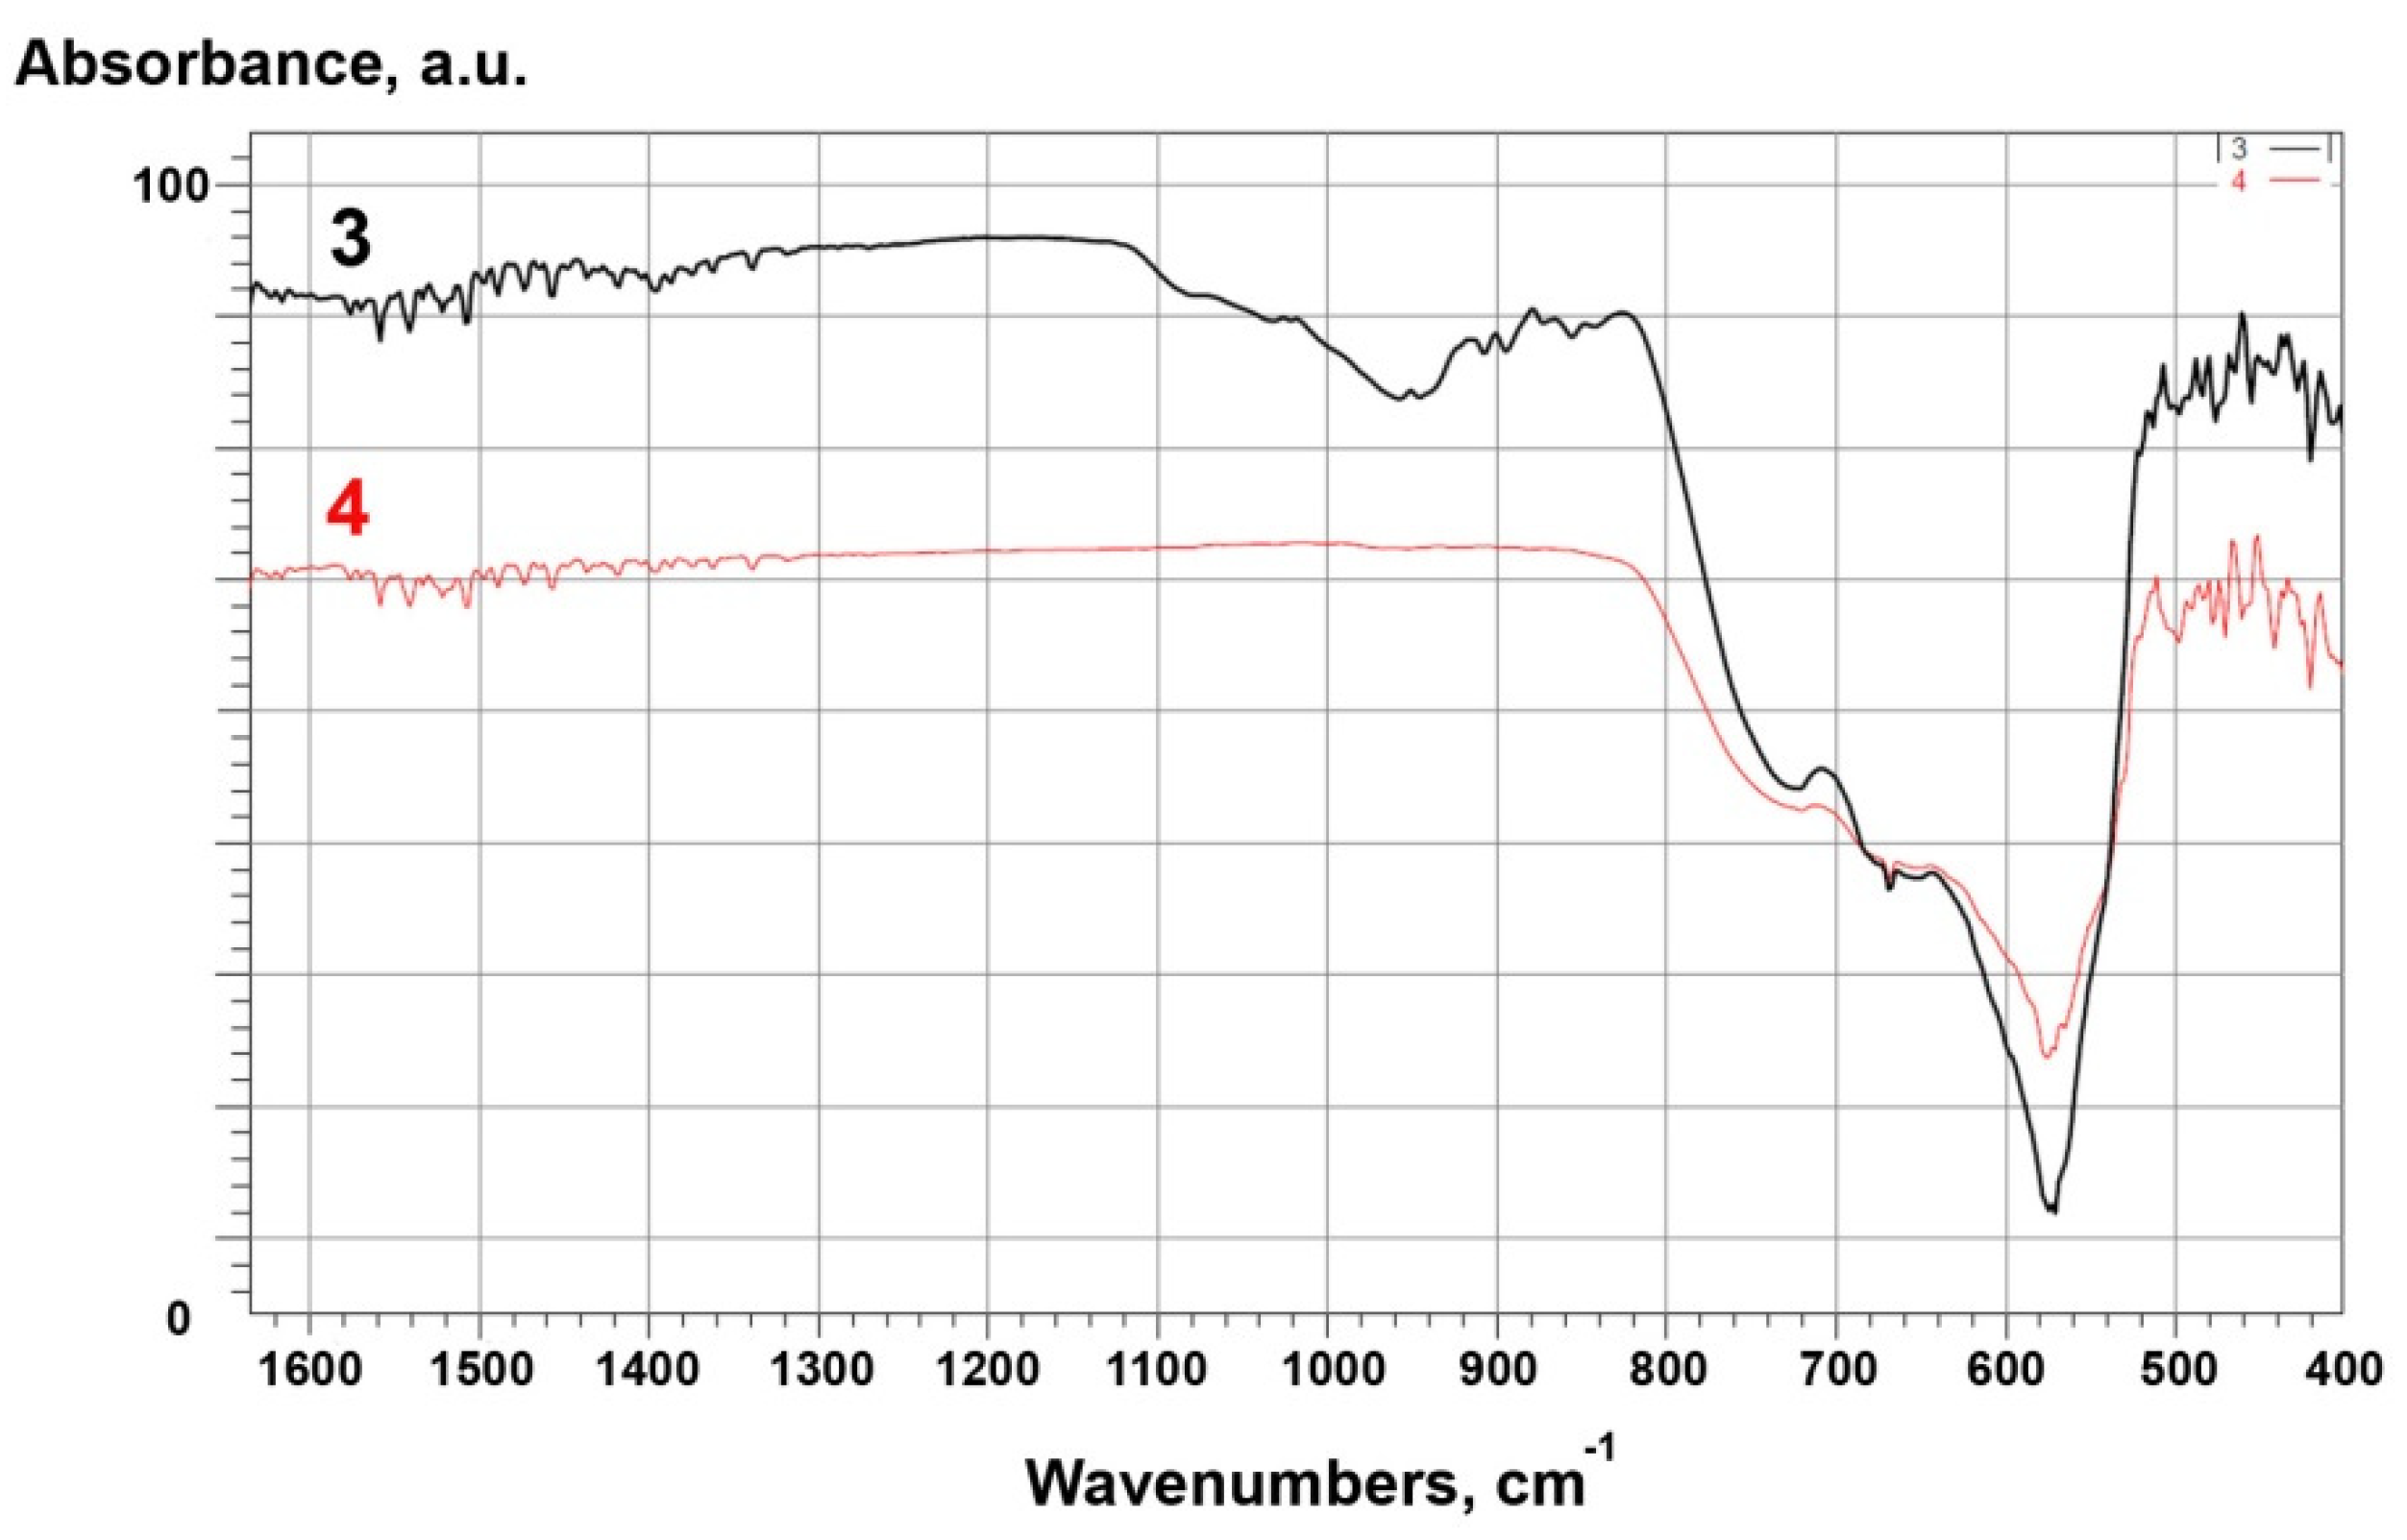
2.5.4. Fourier Transform Infrared Spectroscopy (FTIR)
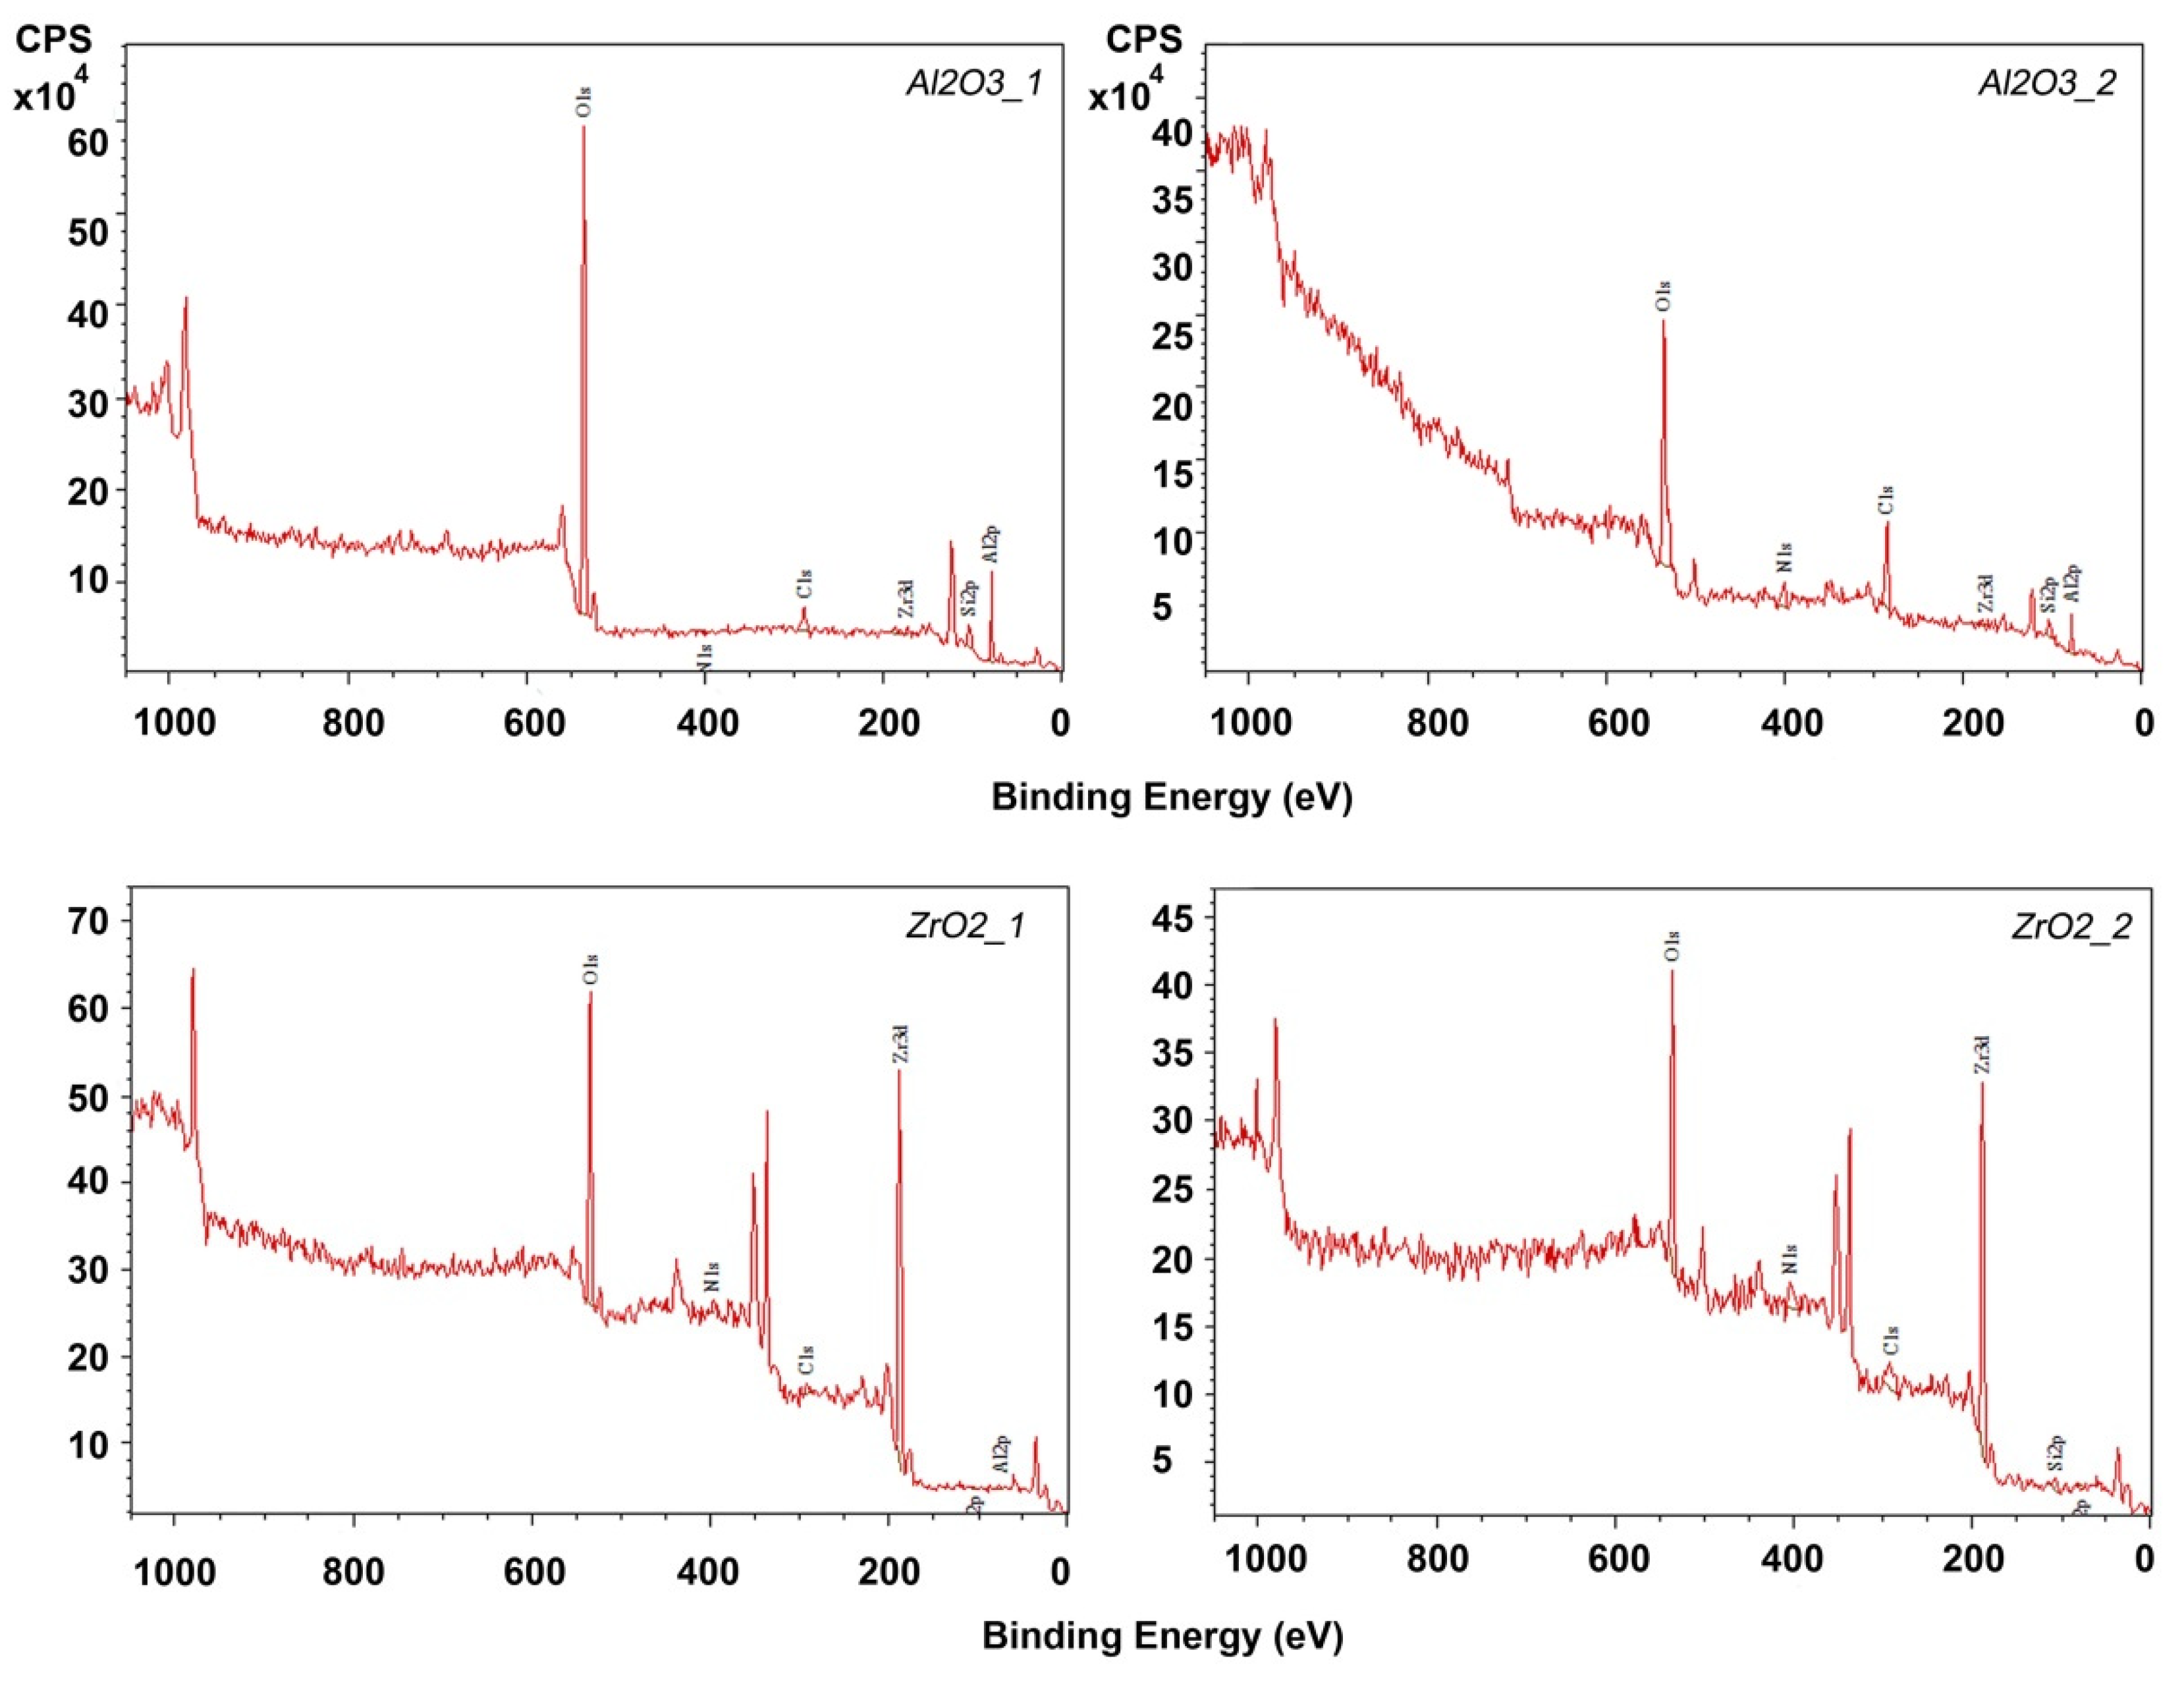
2.5.5. X-ray Photoelectron Spectroscopy (XPS)
2.5.6. Filament Mechanical Testing
2.5.7. Soaking Samples Mechanical Testing
3. Results and Discussion
3.1. Powder Analyses
3.2. Filament Testing
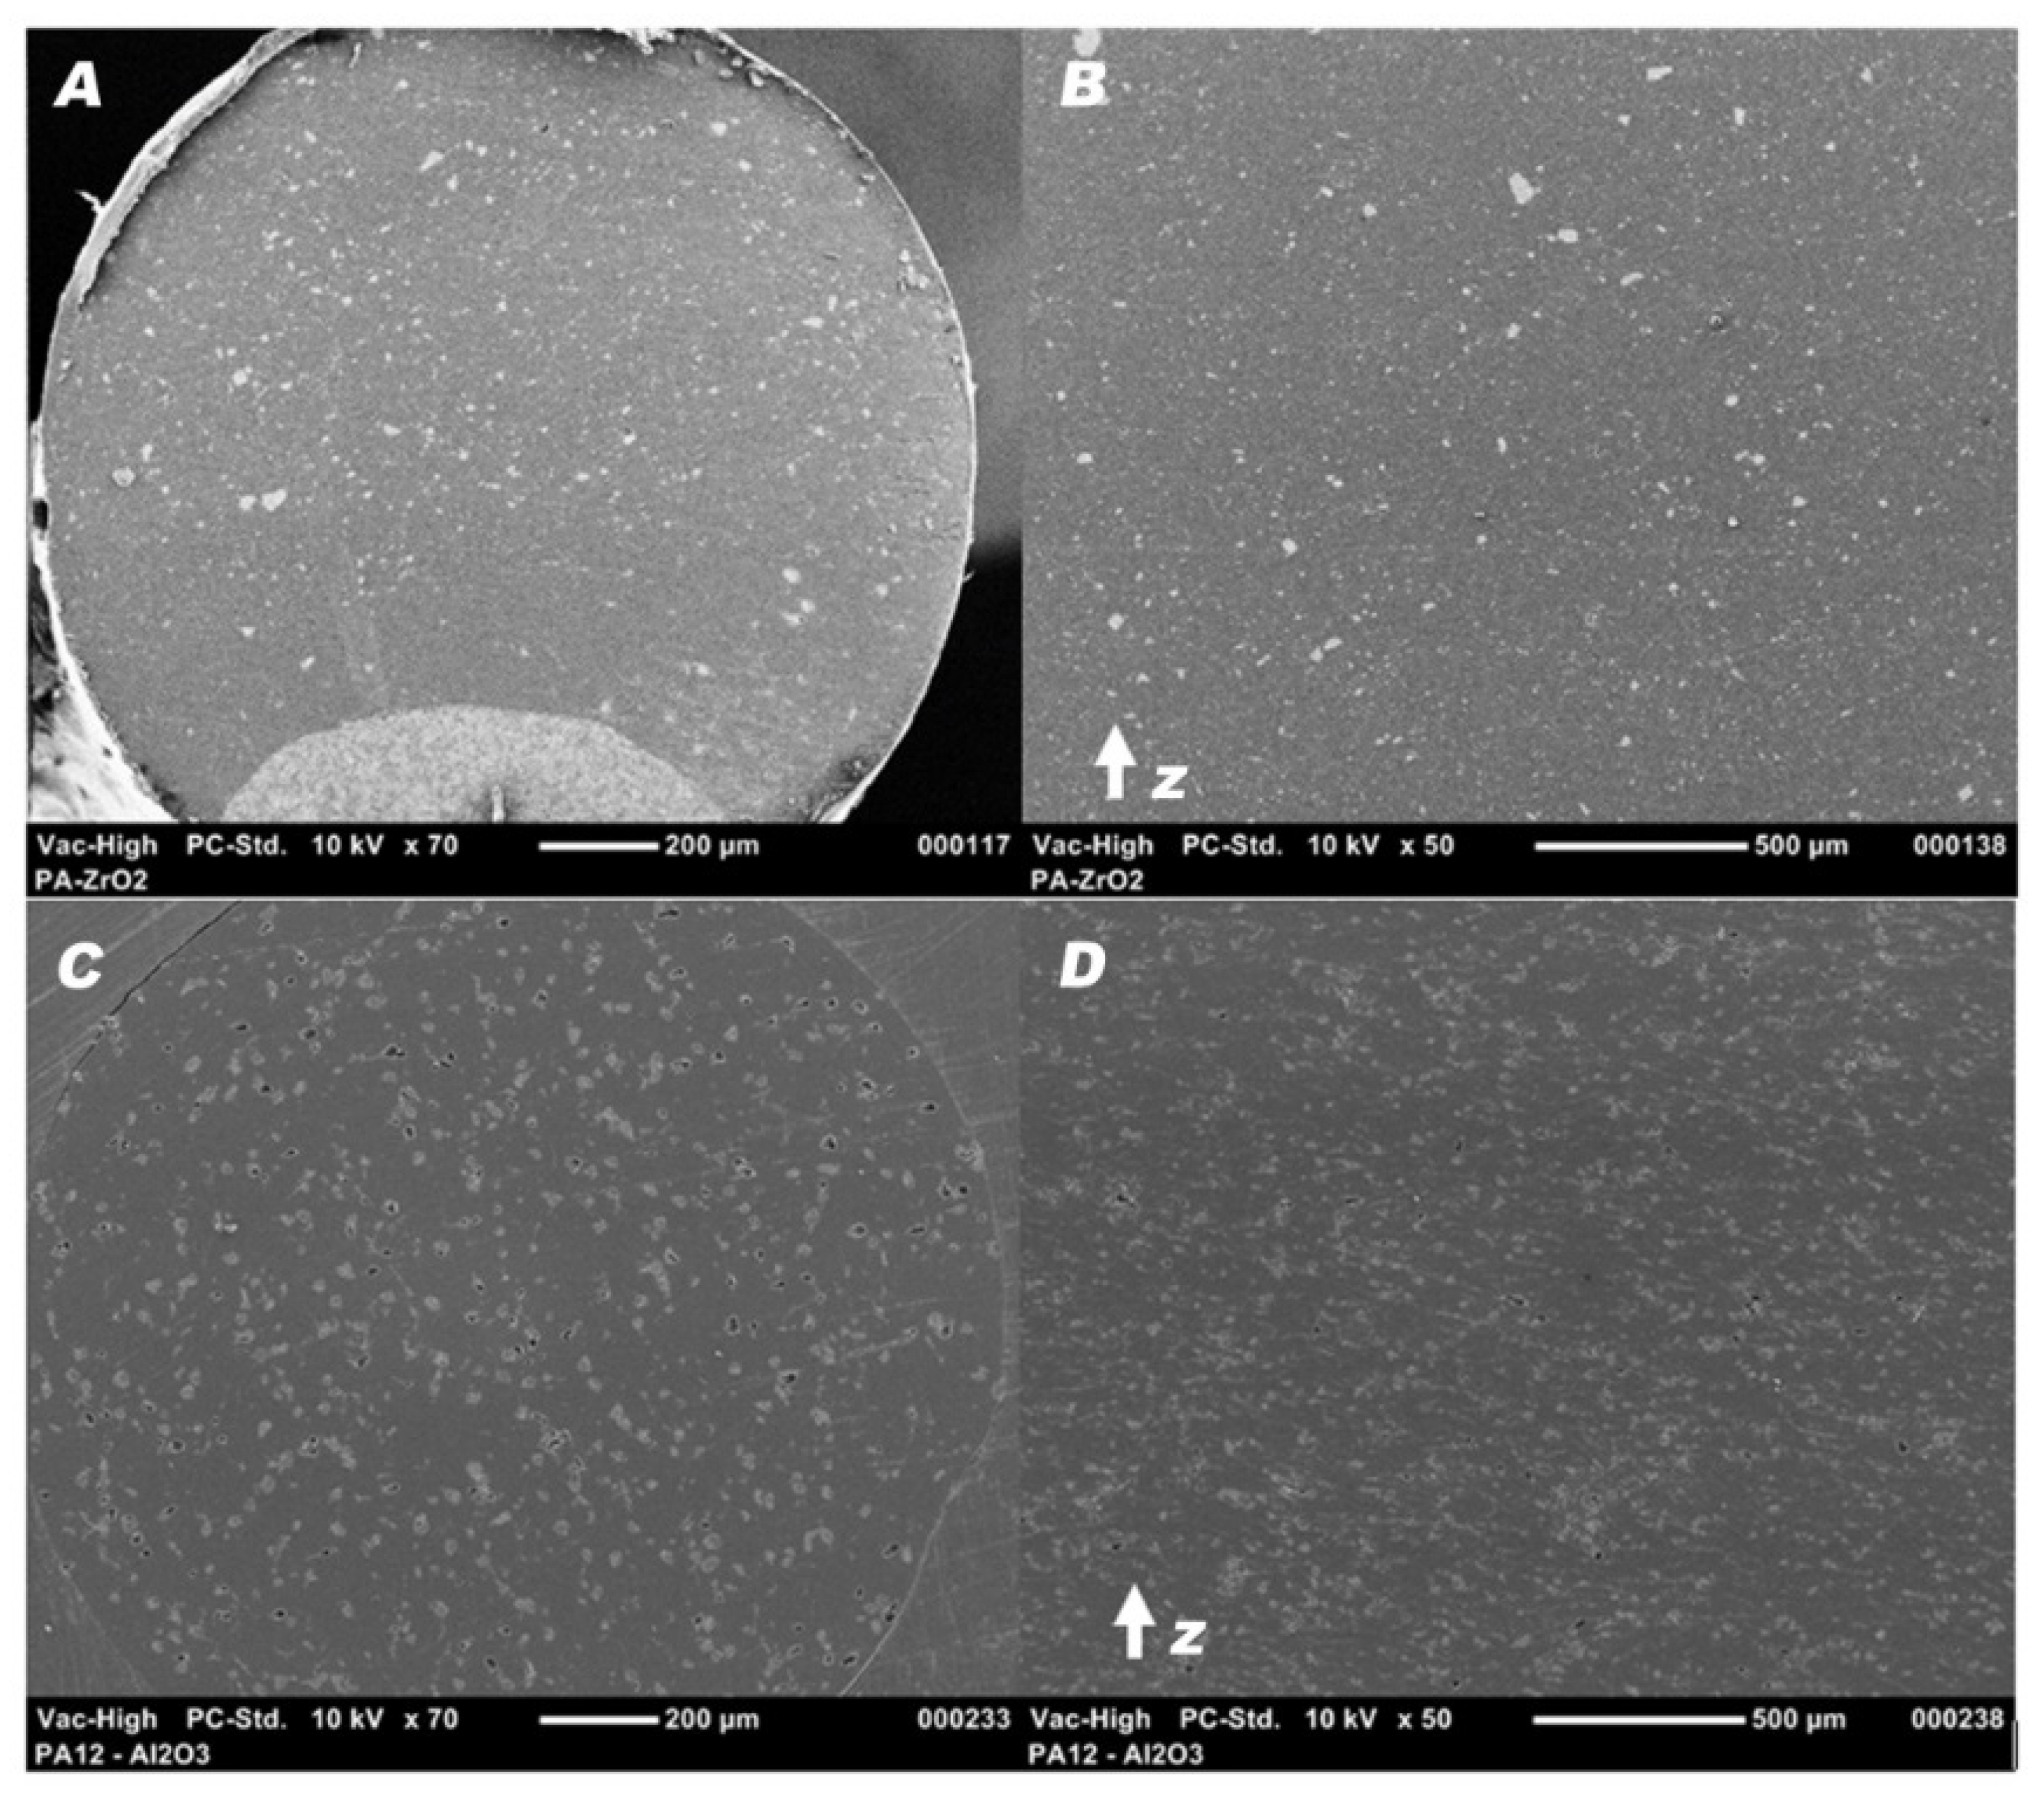
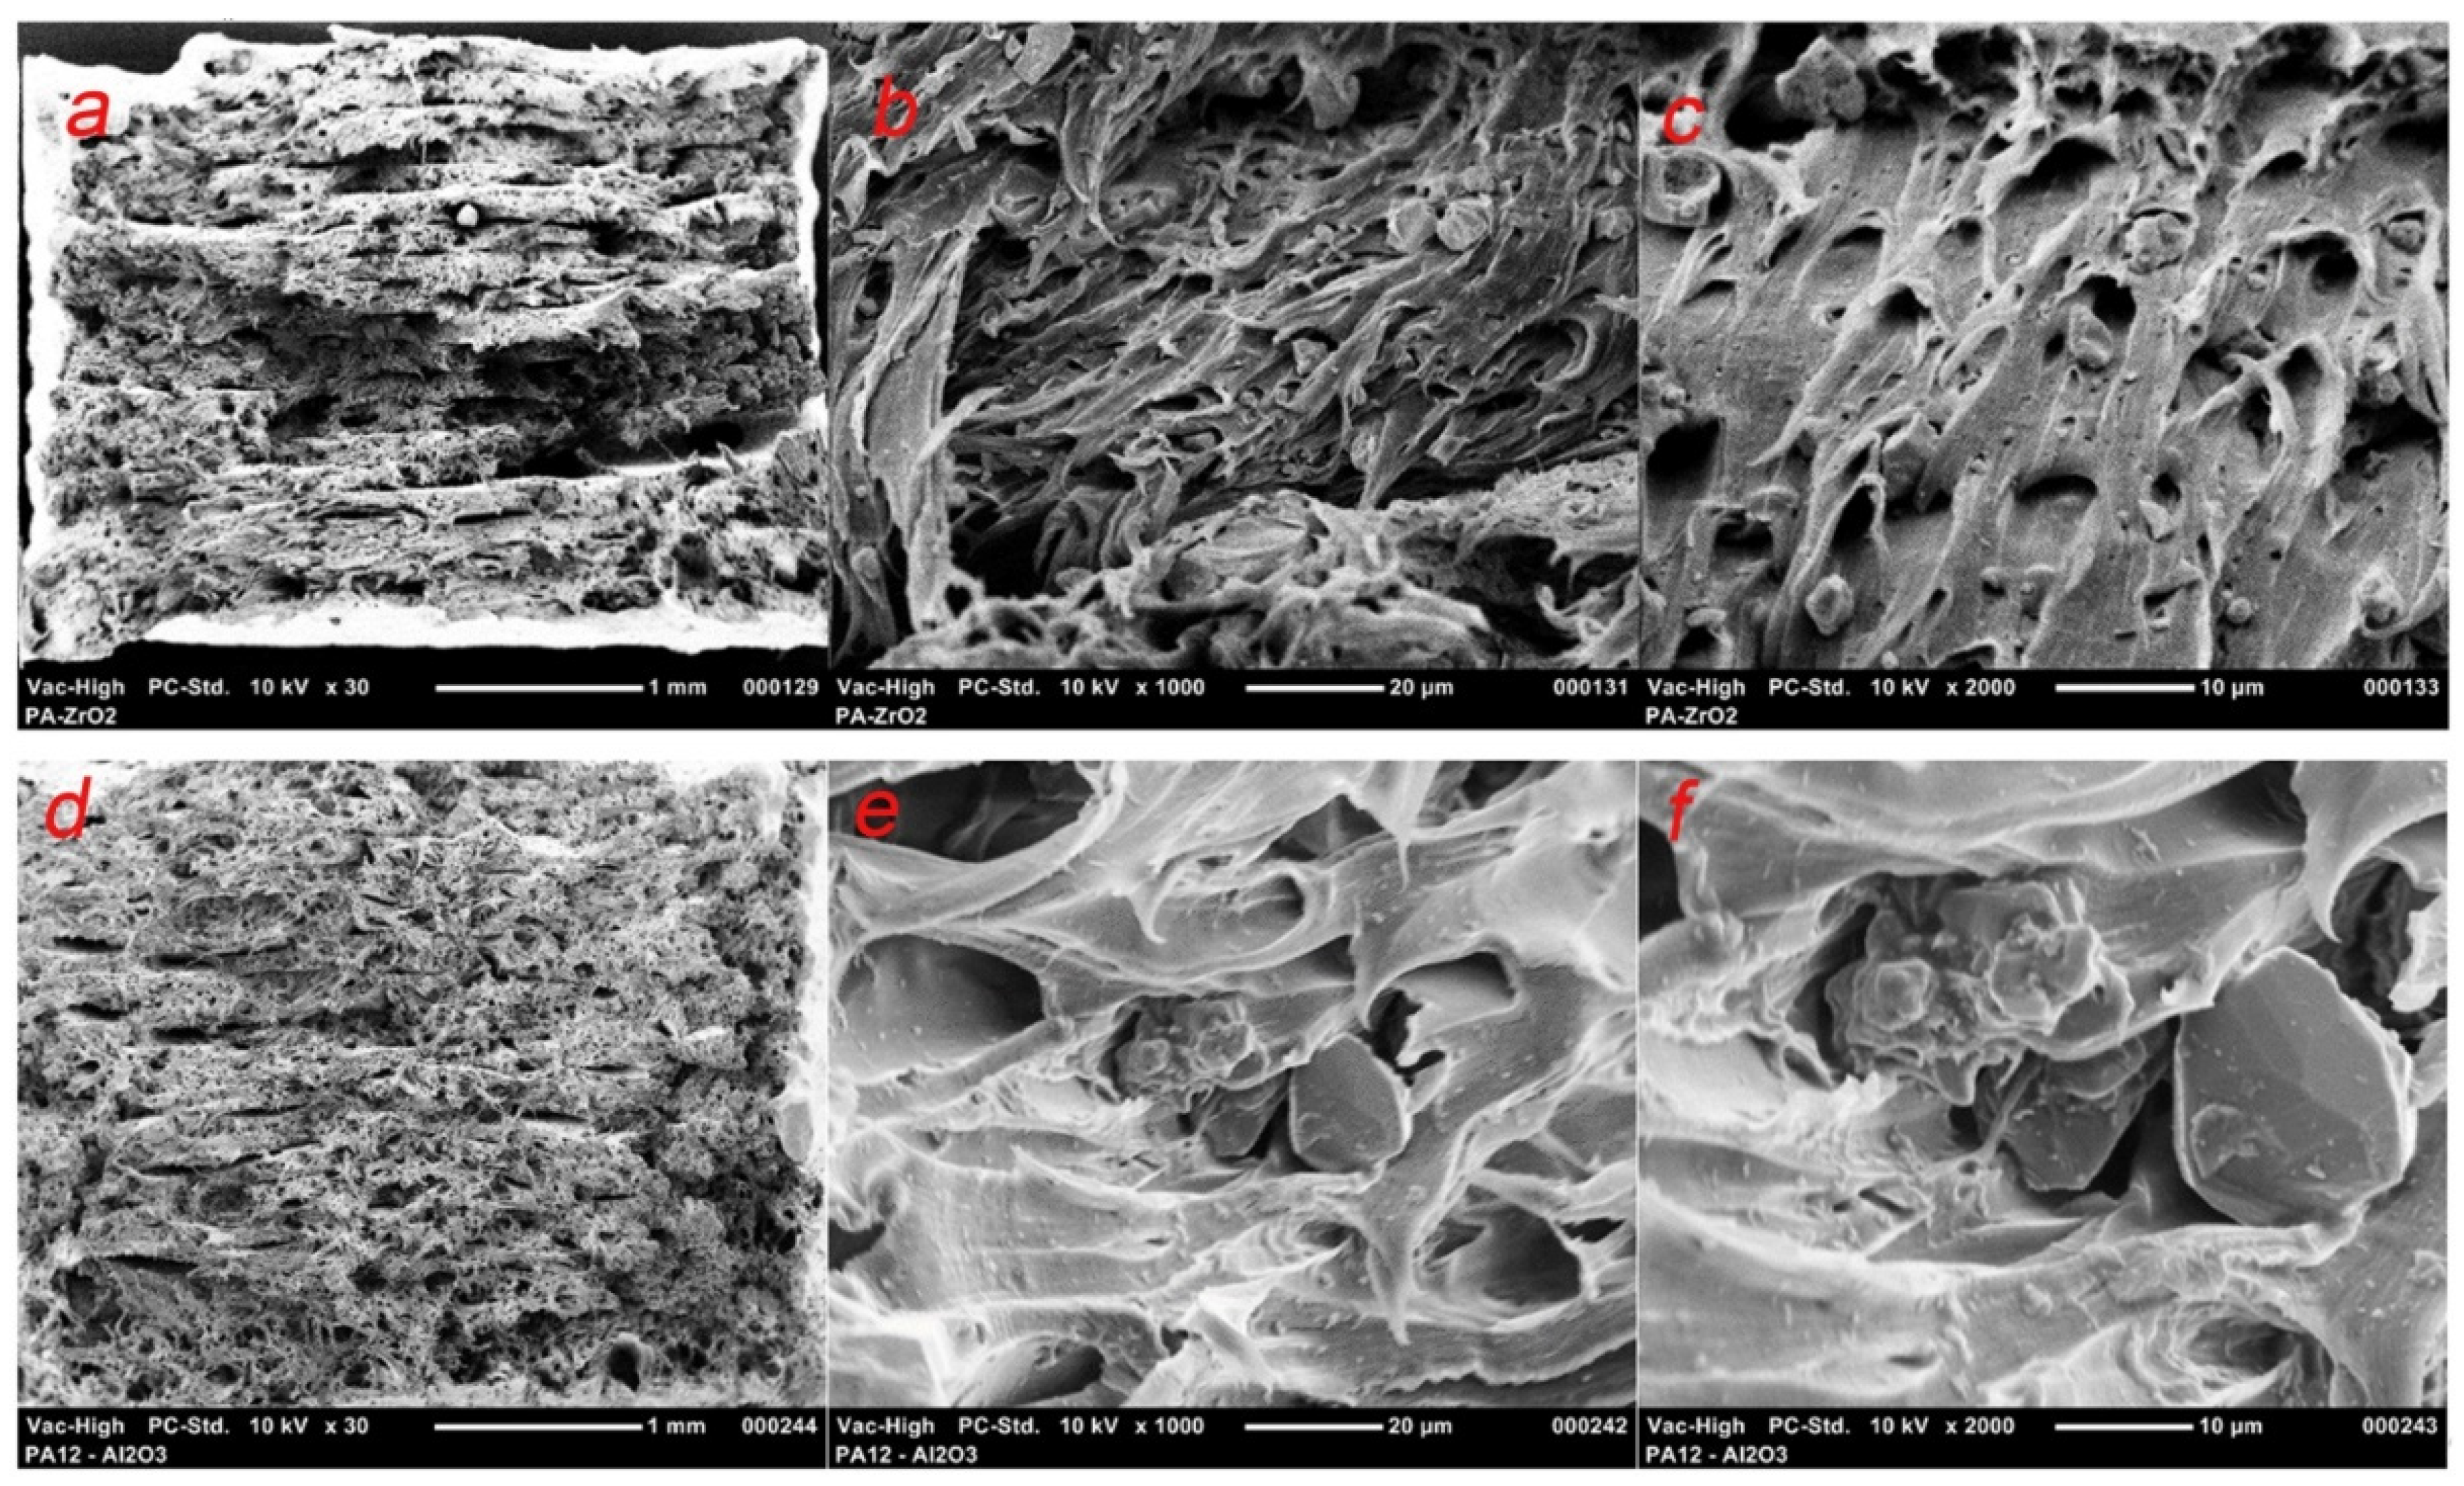
3.2.1. Filament and Sample Cross-Sections
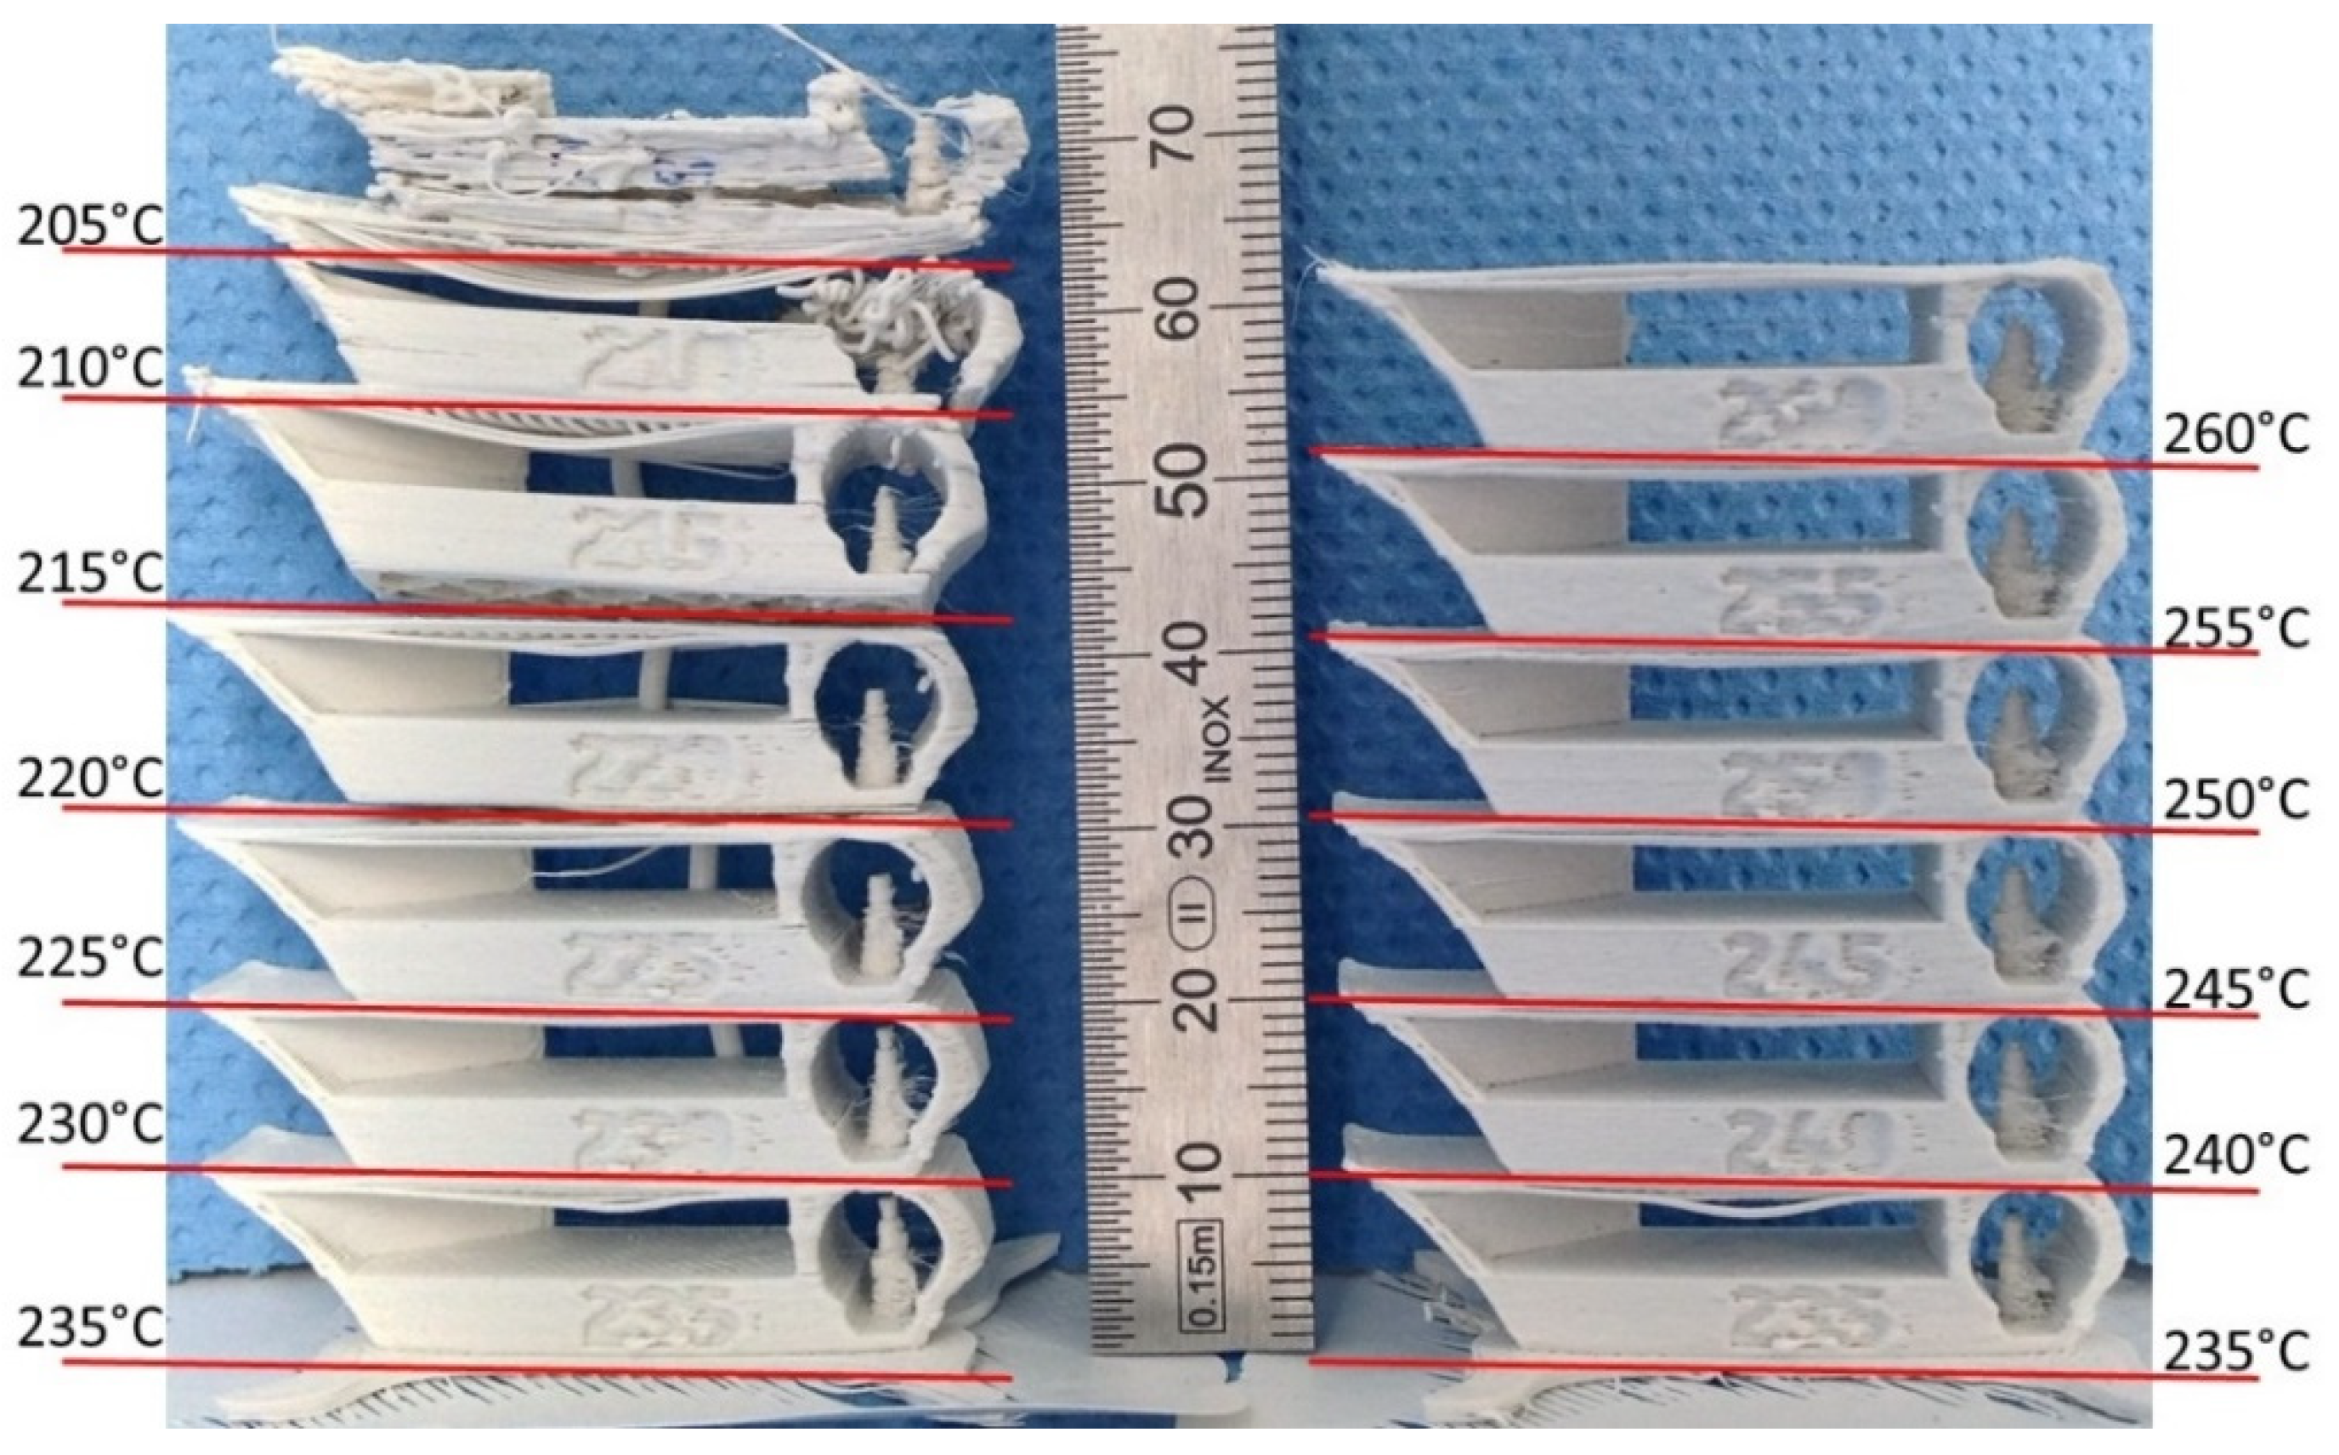
3.2.2. D Printing
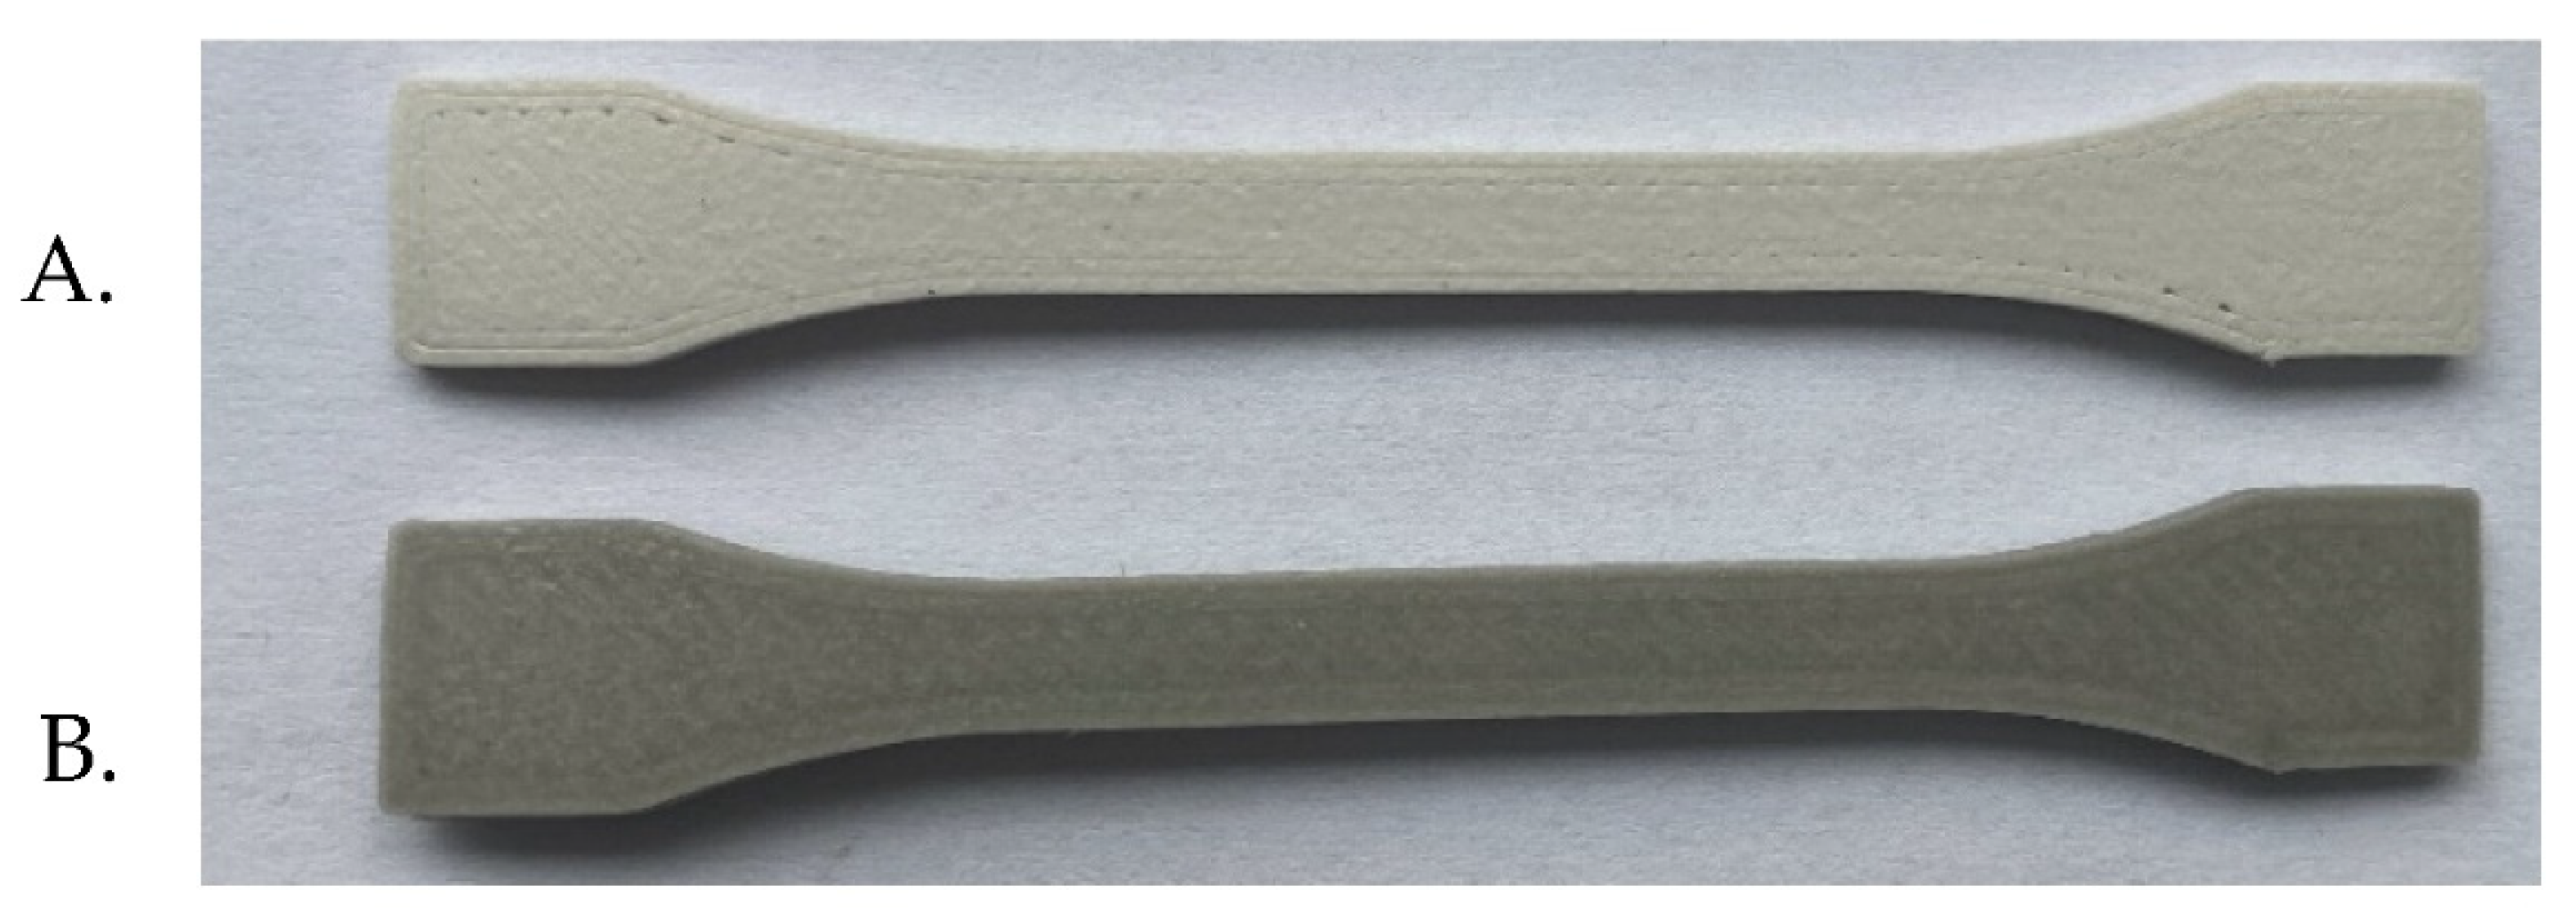
Geometric Samples
3.2.3. Filament Mechanical Testing
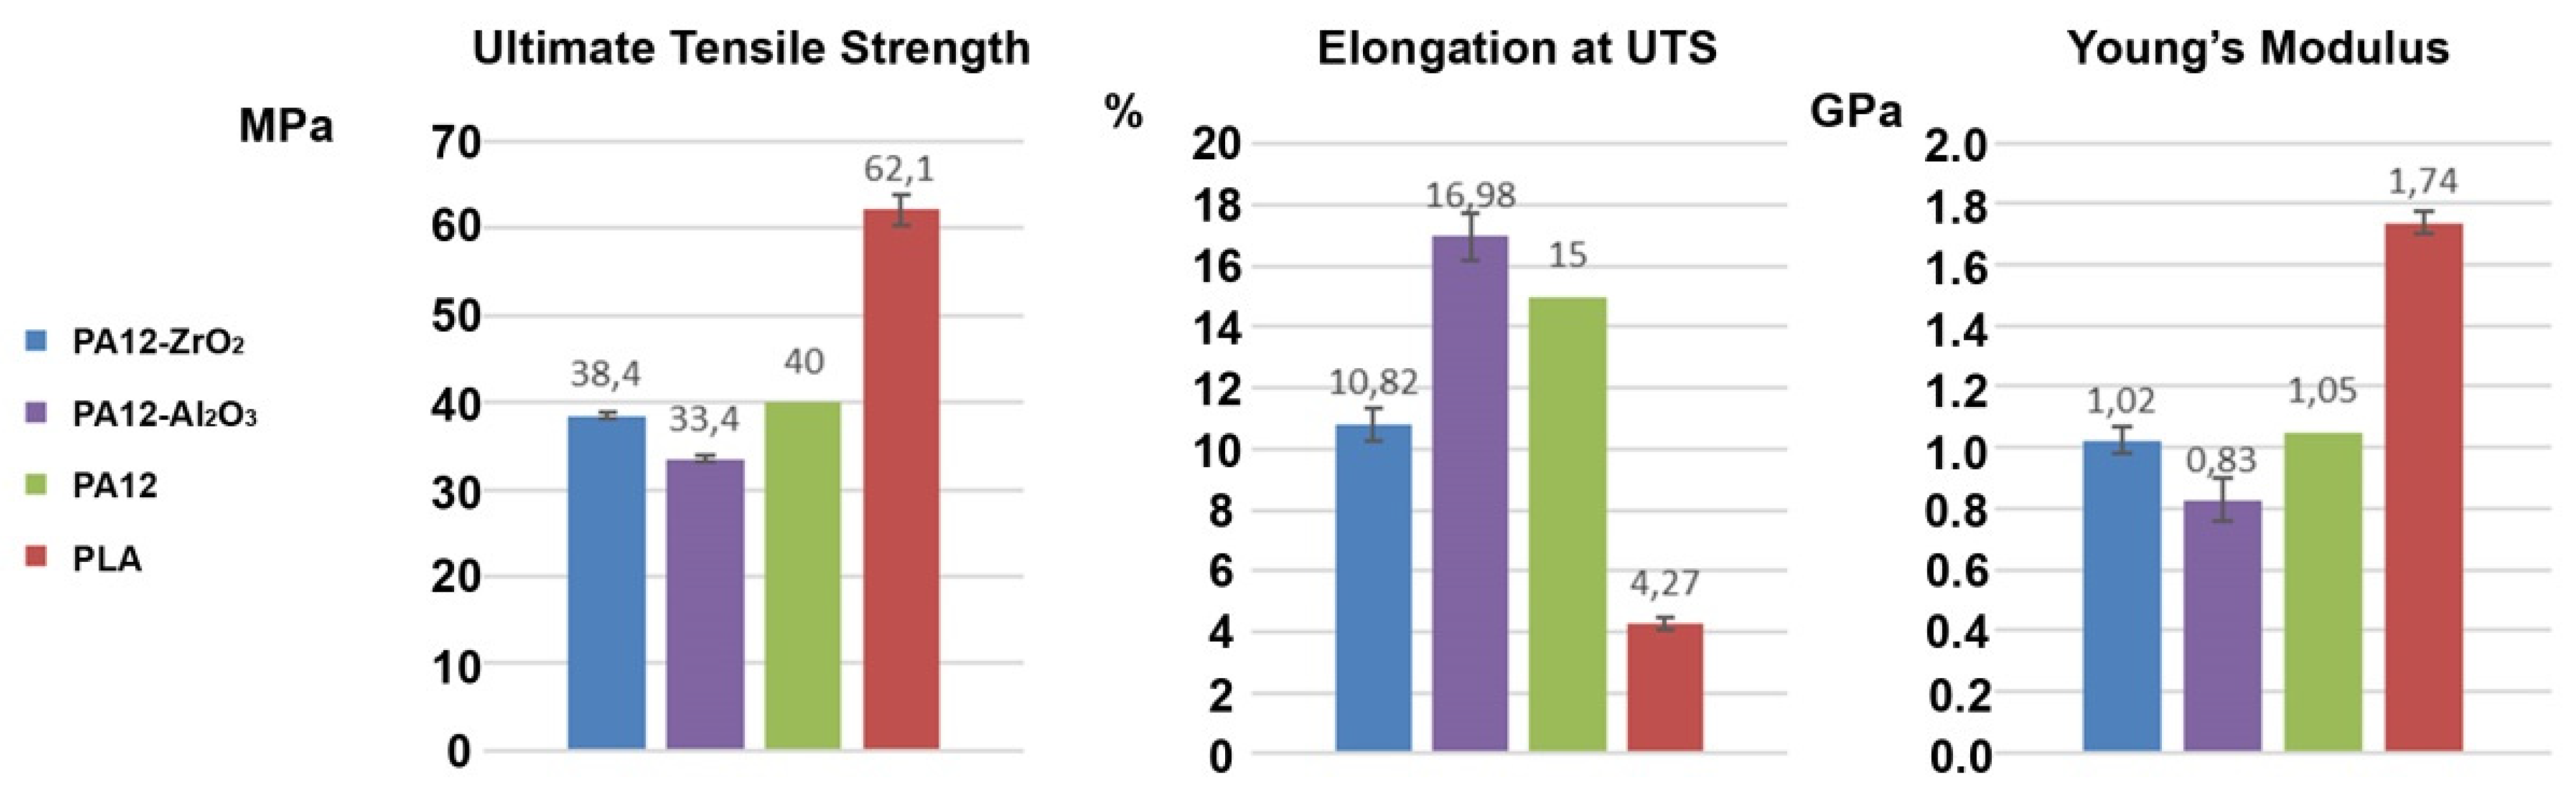
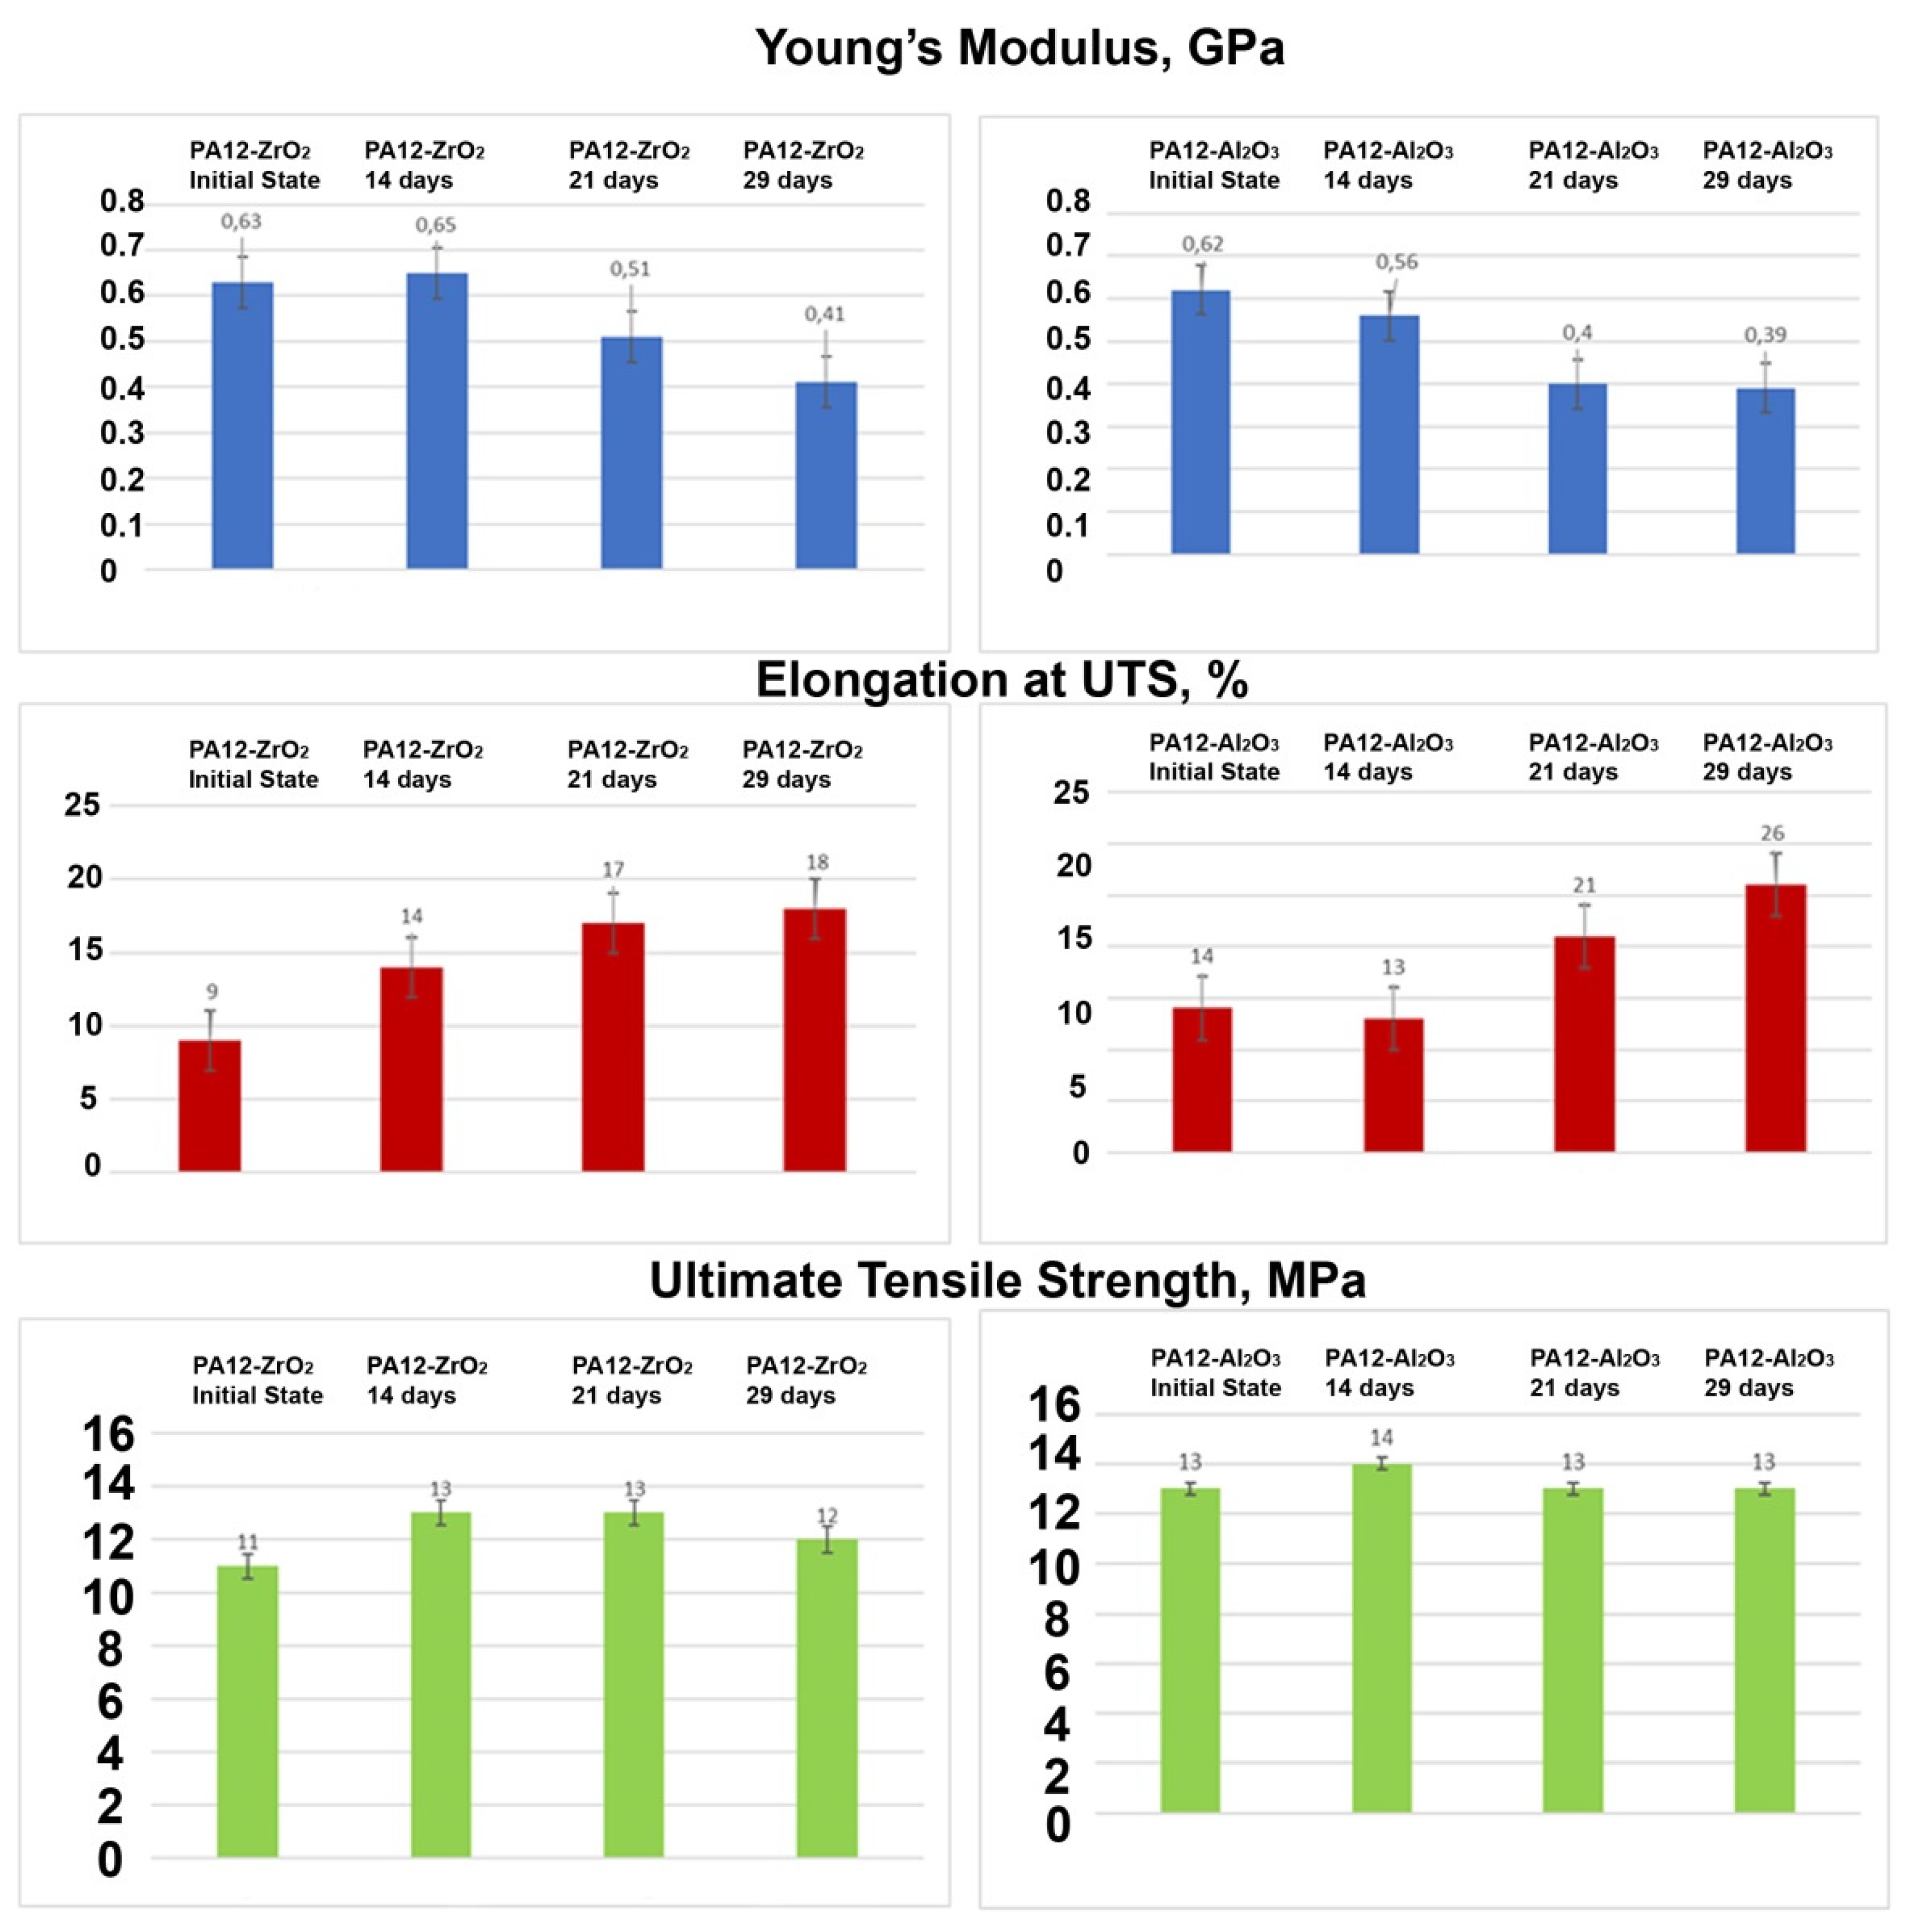
Ultimate Tensile Strength, Elongation, and Young’s Modulus
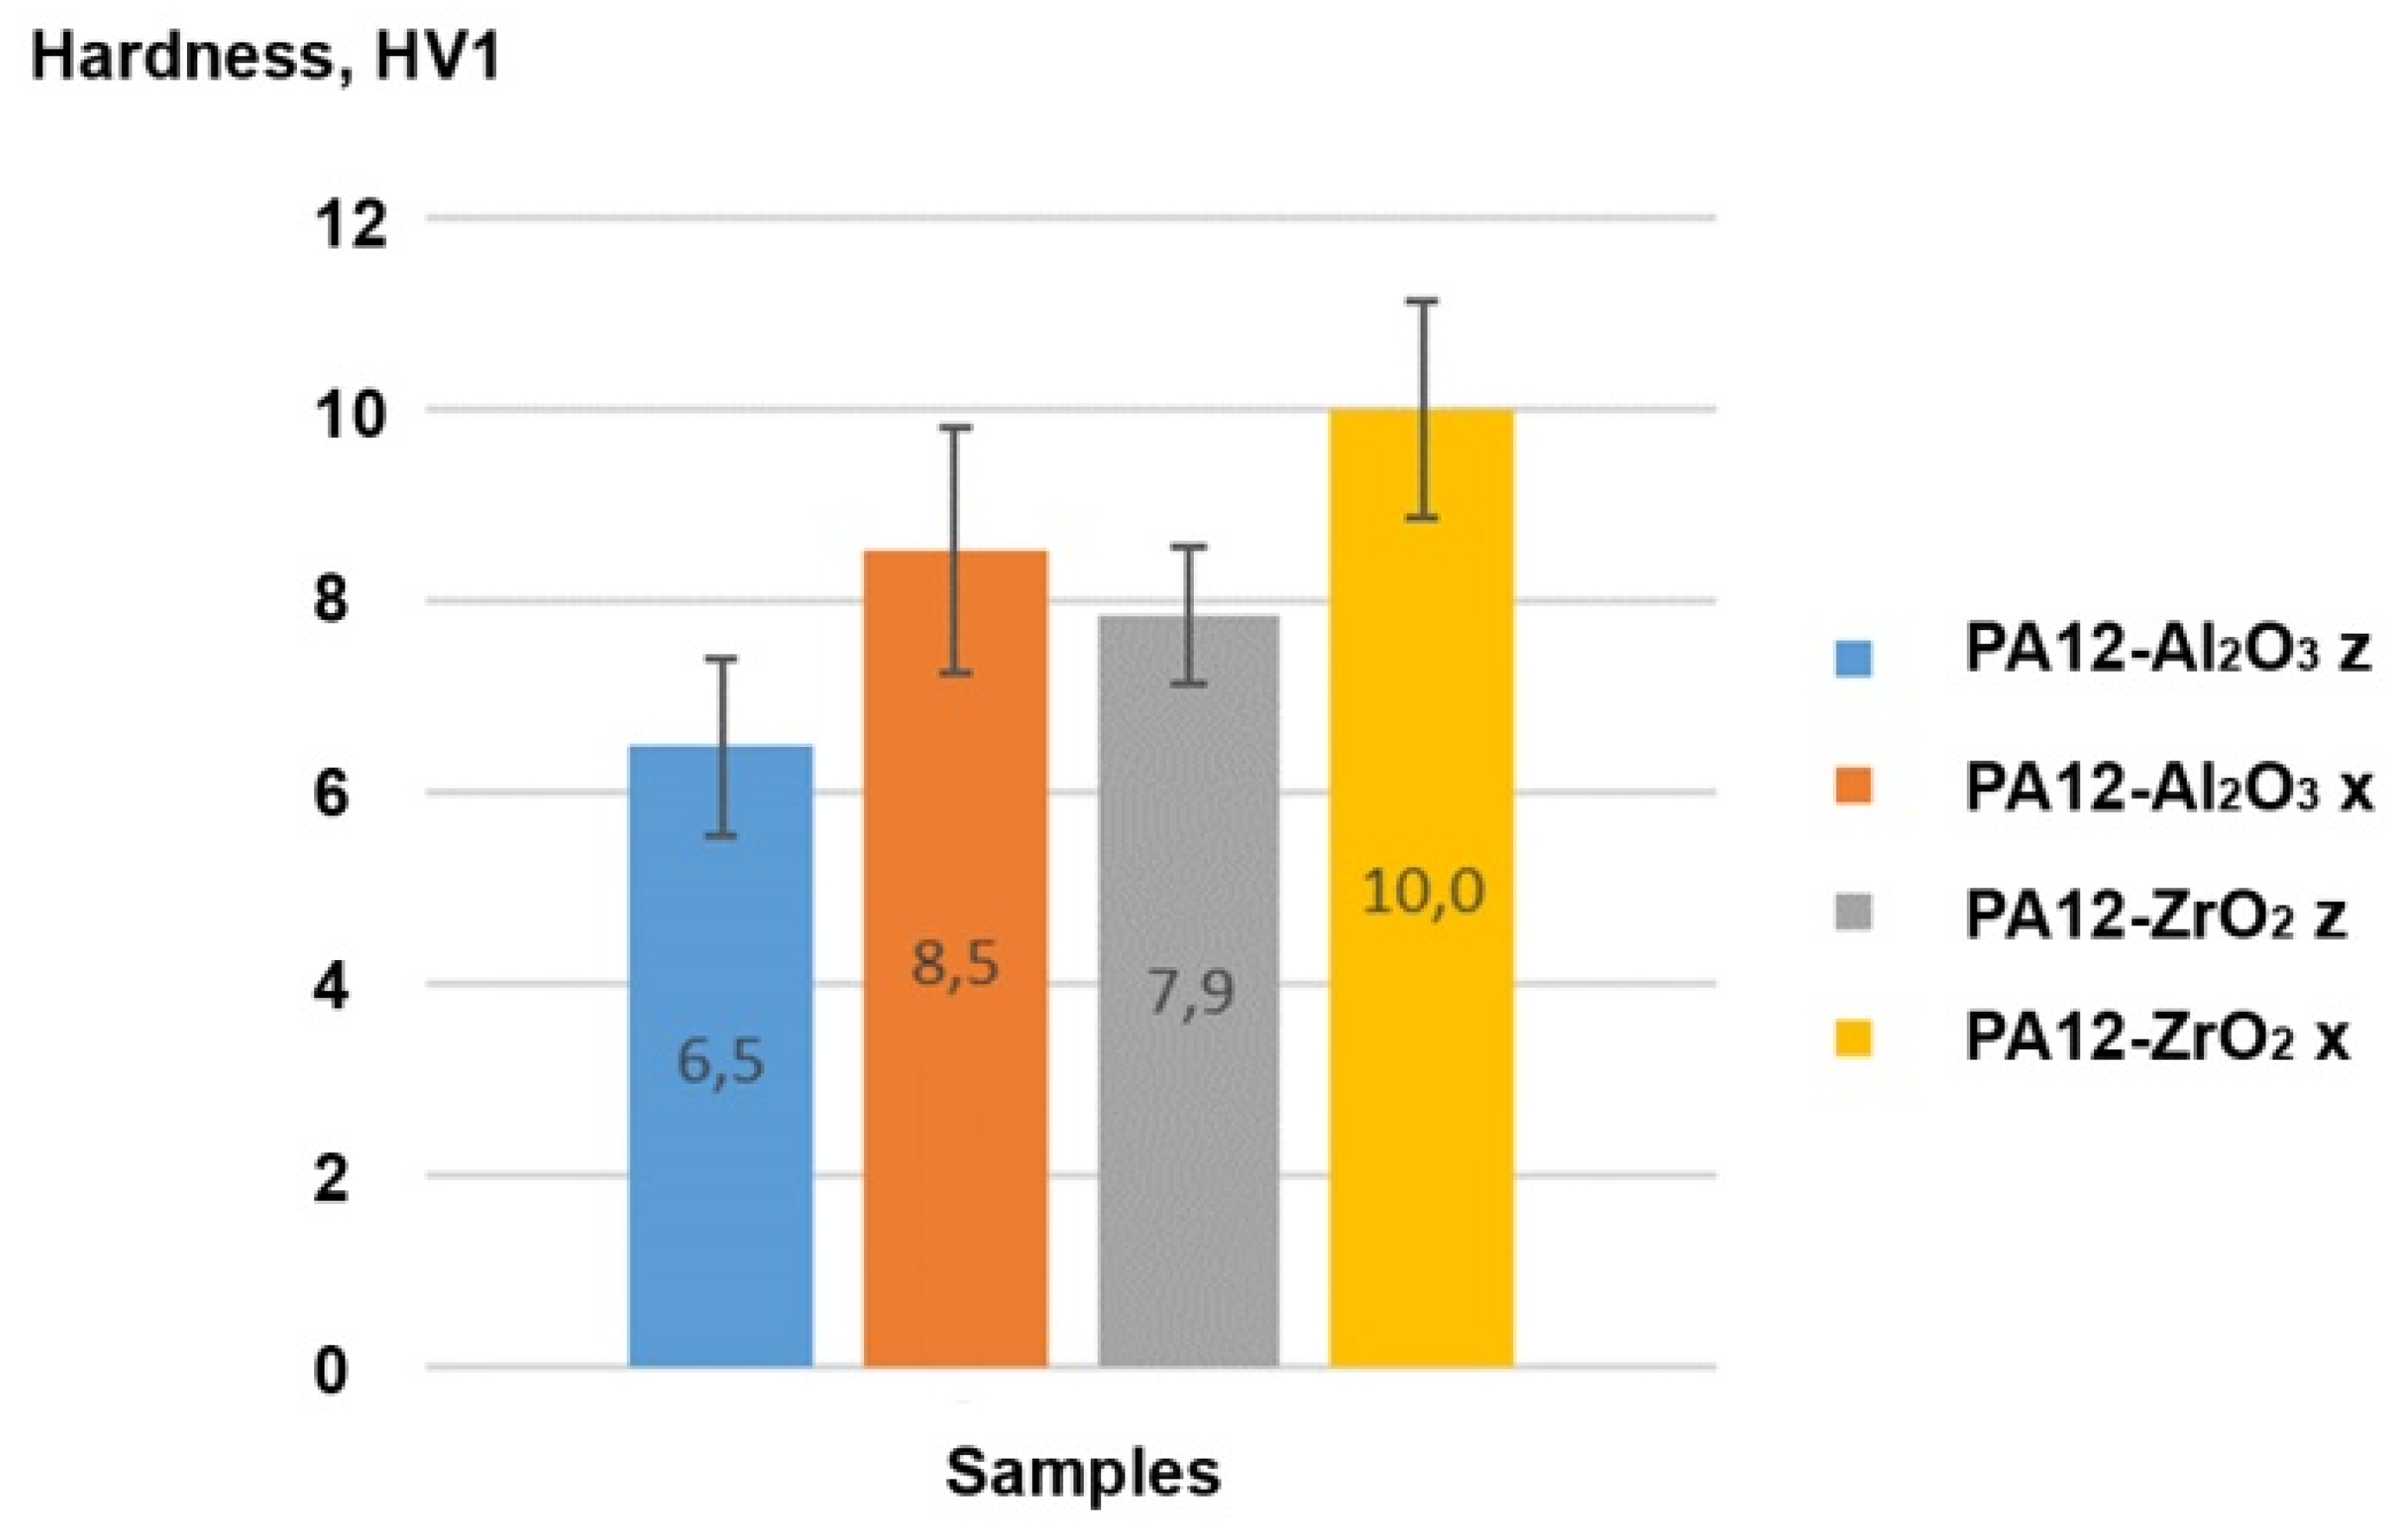
Vickers Hardness
Soaking Test
4. Conclusions
- (1)
- chemical surface modification with Piranha Solution was a simple and effective method of ceramic surface modification and safer than using HF, though still time-consuming and requiring filtration and neutralization to achieve good results, leaving no impurities on the modified powders;
- (2)
- the method of compacting and preparing the filament using a twin-screw extruder for the compounding and a single-screw extruder for the filament preparation produced composites with homogeneous filler dispersion in the polymer;
- (3)
- after chemical modification, no negative changes in the phase composition of the ceramics were found; at the same time, –OH groups and uniformly-incorporated Si3N4 were observed;
- (4)
- composite properties depended on the FDM printing temperature; filler use slightly reduced the tensile strength of bare PA-12 and larger reductions were observed for alumina. The key issue for mechanical properties was the shape and density of the CFs;
- (5)
- along with the time of soaking in artificial saliva for both material samples: PA12-ZrO2 and PA12-Al2O3 decreased the Young’s modulus value, increased Elongation at UTS, while ultimate tensile strength remained at the same value. The microhardness of the samples in the initial state of PA12-ZrO2 was lower than that of PA12-Al2O3, while with the soaking time the hardness for PA12-Al2O3 decreased and for PA12-ZrO2 it increased;
- (6)
- this study demonstrated that PA-12 can be used with CFs such as zirconia and alumina to prepare composites for biomedical applications; however, in the future, it is necessary to focus on optimizing mechanical properties via variations of filler mass proportions and 3D printing parameters. Another important issue that requires attention is an optimized 3D printing method and preparation of the base material because preparation of the FDM filament consumes large amounts of material (multi-kilogram scales), which is highly problematic for research trials.
Author Contributions
Funding
Institutional Review Board Statement
Informed Consent Statement
Data Availability Statement
Acknowledgments
Conflicts of Interest
References
- Wang, S.; Yang, Y.; Mu, Y.; Shi, J.; Cong, X.; Luan, J.; Wang, G. Synergy of electrochemical grafting and cross-linkable crystalline sizing agent to enhance the interfacial strength of carbon fibre/PEEK composites. Compos. Sci. Technol. 2021, 203, 108562. [Google Scholar] [CrossRef]
- Zhang, C.; Wang, F.; Jiang, Z.; Lan, J.; Zhao, L.; Si, P. Effect of graphene oxide on the thermal. Tribological, and biological properties of sitered 3Y-ZrO2/GO composite ceramics for dental implants. Ceram. Int. 2021, 47, 6940–6946. [Google Scholar] [CrossRef]
- Hu, X.; Mei, S.; Wang, F.; Qian, J.; Xie, D.; Zhao, J.; Yang, L.; Wu, Z.; Wei, J. Implantable PEEK/tantalum microparticles composite with improved surface performance for regulating cel behaviors, promoting bone formation and osseointegration. Bioact. Mater. 2021, 6, 928–940. [Google Scholar] [CrossRef]
- Ma, H.; Suonan, A.; Zhou, J.; Yuan, Q.; Liu, L.; Zhao, X.; Lou, X.; Yang, C.; Li, D.; Zhang, Y. PEEK (Polyether-ether-ketone) and its composite materials in orthopedic implantation. Arab. J. Chem. 2021, 14, 102977. [Google Scholar] [CrossRef]
- Chang, H.-H.; Yeh, C.-L.; Wang, Y.-L.; Huang, Y.-C.; Tsai, S.-J.; Li, Y.-T.; Yang, J.-H.; Lin, C.-P. Differences in the biomechanical bahaviors of natural teeth and dental implants. Dent. Mater. 2021, 37, 682–689. [Google Scholar] [CrossRef] [PubMed]
- Zeng, W.; Liu, Y.; Hou, X. Biomechanical evaluation of internal fixation implants for femoral neck fractures: A comparative finite element analysis. Comput. Methods Programs Biomed. 2020, 196, 105714. [Google Scholar] [CrossRef]
- Morgan, E.F.; Unnikrisnan, G.U.; Husserin, A.L. Bone Mechanical Properties in Healthy and Diseased States. Annu. Rev. Biomed. Eng. 2018, 20, 119–143. [Google Scholar] [CrossRef]
- Trofimov, E.A.; Lutfullin, R.Y.; Kashaev, R.M. Elastic properties of the titanium alloy Ti-6Al-4V. Lett. Mater. 2015, 5, 67–69. [Google Scholar] [CrossRef] [Green Version]
- Balijepalli, S.K.; Donnini, R.; Kaciulis, S.; Montanari, R.; Varone, A. Young’s Modulus Profile in Kolsterized AISI 316 L Steel. Mater. Sci. Forum 2013, 762, 183–188. [Google Scholar] [CrossRef]
- Khurshid, Z.; Hafeji, S.; Tekin, S.; Rashid Habib, S.; Ullah, R.; Sefat, F.; Zafar, M.S. Titanium, zirconia, polyetheretherketone (PEEK) as a dental implant material. In Dental Implants; Woodhead Publishing: Cambridge, UK, 2020; pp. 5–35. [Google Scholar]
- Schwitalla, A.D.; Zimmermann, T.; Spinting, T.; Kallage, I.; Muller, W.-D. Fatigue limits of different PEEK materials for dental implants. J. Mech. Behav. Biomed. Mater. 2017, 69, 163–168. [Google Scholar] [CrossRef]
- Dias Corpa Tardelli, J.; Bolfaini, C.; Candido dos Reis, A. Comparative analysis of corrosion resistance between beta titanium and Ti-6Al-4V alloys: A systematic review. J. Trace Elem. Med. Biol. 2020, 62, 126618. [Google Scholar] [CrossRef] [PubMed]
- Talha, M.; Ma, Y.; Kumar, P.; Lin, Y.; Singh, A. Role of protein adsorption in the bio corrosion of metallic implants—A review. Colloids Surf. B 2019, 176, 494–506. [Google Scholar] [CrossRef]
- Wang, Y.; Yan, Y.; Su, Y.; Qiao, L. Release of metal ions from nano CoCrMo wear debris generated from tribo-corrosion processes in artificial hip implants. J. Mech. Behav. Biomed. Mater. 2017, 68, 124–133. [Google Scholar] [CrossRef] [PubMed]
- Pivec, R.; Meneghini, M.; Hozack, W.J.; Westrich, G.H.; Mont, M.A. Modular taper junction corrosion and failure: How to approach a recalled total hip arthroplasty implant. J. Arthroplast. 2014, 29, 1–6. [Google Scholar] [CrossRef]
- Nie, Y.; Ma, S.; Tian, M.; Zhang, Q.; Huang, J.; Cao, M.; Li, Y.; Sun, L.; Pan, J.; Wang, Y.; et al. Superhydrophobic silane-based surface coatings on metal surface with nanoparticles hybridization to enhance anticorrosion efficiency, wearing resistance and antimicrobial ability. Surf. Coat. Technol. 2021, 410, 126966. [Google Scholar] [CrossRef]
- Wang, C.; Li, Z.; Zhao, H.; Zhang, G.; Ren, T.; Zhang, Y. Enhanced anticorrosion and antiwear properties of Ti-6Al-4V alloys with laser texture and graphene oxide coatings. Tribol. Int. 2020, 152, 106475. [Google Scholar] [CrossRef]
- Krishnakumar, S.; Senthilvelan, T. Polymer composites in dentistry and orthopedic applications—A review. Mater. Today Proc. 2021, 46, 9707–9713. [Google Scholar] [CrossRef]
- Li, K.; Kou, H.; Rao, J.; Liu, C.; Ning, C. Fabrication of enamel-like structure on polymer-infiltrated zirconia ceramics. Dent. Mater. 2021, 37, e245–e255. [Google Scholar] [CrossRef]
- Vaz-Machry, R.; Souto Borges, A.L.; Rocha Pereira, G.K.; Kleverlaan, C.J.; Vanturini, A.B.; Valandro, L.F. Influence of the foundation substrate on the fatigue behavior of bonded glass, zirconia polycrystals, and polymer infiltrated ceramic simplified CAD-CAM restorations. J. Mech. Behav. Biomed. Mater. 2021, 117, 104391. [Google Scholar] [CrossRef]
- Arnesano, A.; Padmanbhan Sanosh, K.; Notarangelo, A.; Montagna, F.; Licciulli, A. Fused desposition modeling shaping of glass infiltrated alumina for dental restoration. Ceram. Int. 2020, 46, 2206–2212. [Google Scholar] [CrossRef]
- Nakonieczny, D.S.; Ziębowicz, A.; Paszenda, Z.K.; Krawczyk, C. Trends and perspectives in modification of zirconium oxide for a dental prosthetic applications—A Review. Biocybern. Biomed. Eng. 2017, 37, 229–245. [Google Scholar] [CrossRef]
- Nakonieczny, D.S.; Basiaga, M.; Sambok, A.; Antonowicz, M.; Paszenda, Z.K.; Ziębowicz, A.; Krawczyk, C.; Ziębowicz, B.; Lemcke, H.; Kałużyński, P. Ageing of zirconia dedicated to dental prostheses for bruxers part 1: Influence of accelerating egeing for surface topography and mechanical properties. Rev. Adv. Mater. Sci. 2019, 58, 189–194. [Google Scholar] [CrossRef]
- Nakonieczny, D.S.; Sambok, A.; Antonowicz, M.; Basiaga, M.; Paszenda, Z.K.; Krawczyk, C.; Ziębowicz, B.; Lemcke, H.; Kałużyński, P. Ageing of zirconia dedicated to dental prostheses for bruxers part 2: Influence of Heat Treatment for Surface Morphology, Phase Composition and Mechanical Properties. Rev. Adv. Mater. Sci. 2019, 58, 218–225. [Google Scholar] [CrossRef]
- Kim, K.; Jung, Y.C.; Kim, S.Y.; Yang, B.; Kim, J. Adhesion enhancement and damage protection for carbon fiber-reinforced polymer (CFRP) composites via silica particle coating. Compos. Part A Appl. Sci. Manuf. 2018, 109, 105–114. [Google Scholar] [CrossRef]
- Nakonieczny, D.S.; Antonowicz, M.; Paszenda, Z.K. Surface modification methods of ceramic filler in ceramic-carbo fibre composites for bioengineering applications—A systematic review. Rev. Adv. Mater. Sci. 2020, 59, 586–609. [Google Scholar] [CrossRef]
- Vardhan, D.H.; Ramesh, A.; Chandra Mohana Reddy, B. Effect of ceramic fillers on flexural strength of the GFRP composite material. Mater. Today Proc. 2020, 37, 1739–1742. [Google Scholar] [CrossRef]
- Samal, S. Effect of shape and size of filler particle on the aggregation and sedimentation behaviour of the polymer composite. Powder Technol. 2020, 366, 43–51. [Google Scholar] [CrossRef]
- Angelopoulos, P.M.; Samouhos, M.; Taxiarchou, M. Functional fillers in composite filamants for fused filament fabrication—A review. Mater. Today Proc. 2020, 37, 4031–4043. [Google Scholar] [CrossRef]
- Wang, Y.; Zhu, M.; Zhu, X.X. Functional Fillers for Dental Resin Composites. Acta Biomater. 2020, 122, 50–65. [Google Scholar] [CrossRef]
- Bai, L.; Li, Z.; Zhao, S.; Zheng, J. Covalent functionalization of carbon nanotubes with hydroxyl-terminated polydimethylsiloxane to enhance filler dispersion, interfacial adhesion and performance of poly(methylphenylsiloxane) composites. Compos. Sci. Technol. 2018, 165, 274–281. [Google Scholar] [CrossRef]
- Liu, F.; Yi, M.; Ran, L.; Ge, Y.; Peng, K. Effects of silanization of C/C composites and grafting of h-BN fillers on the microstructure and interfacial properties of CVI-based C/C-BN composites. Ceram. Int. 2021, 47, 3484–3497. [Google Scholar] [CrossRef]
- Sandomierski, M.; Buchwald, Z.; Voekel, A. Calcium montmorillonite and montmorillonite with hydroxyapatite layer as fillers in dental composites with remineralizing potential. Appl. Clay Sci. 2020, 198, 105822. [Google Scholar] [CrossRef]
- Liao, W.; Zheng, S.; Chen, S.; Zhao, L.; Huang, X.; Huang, L.; Kang, S. Surface silanization and grafting reaction of nano-silver loaded zirconium phosphate and properties strengthen in 3D-printable dental base composites. J. Mech. Behav. Biomed. Mater. 2020, 110, 103864. [Google Scholar] [CrossRef]
- Lunelli, L.; Caradonna, F.; Potrich, C.; Piotto, C.; Bettotti, P.; Vanzetti, L.; Pederzolli, C.; Guella, G. A new silanizing agent tailored to surface bio-functionalization. Colloids Surf. B 2019, 181, 166–173. [Google Scholar] [CrossRef]
- Prazeres, E.; dos Santos, M.G.; Barreto, A.d.A.; Coutinho, J.P.; da Silva, E.G.P.; Melo, S.C.O.; de Jesus, R.M.; Lobo, I.P. Use of hexamethyldisilazane as a silanizing agent in microwave-assisted derivatization for determining phenolic compounds in wine by gas chromatography. Microchem. J. 2021, 161, 105785. [Google Scholar] [CrossRef]
- Bauer, F.; Meyer, R.; Bertmer, M.; Naumov, S.; Al-Naji, M.; Wissel, J.; Steinhart, M.; Enke, D. Silanization of siliceous materials, Part 3: Modification of surface energy and acid-base properties of silica nanoparticles determined by inverse gas chromatography (IGC). Colloids Surf. A Physicochem. Eng. Asp. 2021, 618, 126472. [Google Scholar] [CrossRef]
- Lung, C.Y.K.; Liu, D.; Matinlinna, J.P. Silica coating of zirconia by silicon nitride hydrolysis on adhesion promotion of resin to zirconia. Mater. Sci. Eng. C 2015, 46, 103–110. [Google Scholar] [CrossRef] [PubMed]
- Touris, A.; Turcios, A.; Mintz, E.; Pulugurtha, S.R.; Thor, P.; Jolly, M.; Jalgaonkar, U. Effect of molecular weight and hydration on the tensile properties of polyamide 12. Results Mater. 2020, 8, 100149. [Google Scholar] [CrossRef]
- Lewenstam, A.; Bartoszewicz, B.; Migdalski, J.; Kochan, A. Solid contact reference electrode with a PVC-based electroactive element fabricated by 3D printing. Electrochem. Commun. 2019, 109, 106613. [Google Scholar] [CrossRef]
- ISO 527:2012 Standard—Plastics—Determination of Tensile Properties; ISO: Geneva, Switzerland, 2012.
- Lindau, I.; Pianetta, P.; Yu, K.Y.; Spicer, W.E. Photoemission of gold in the energy range 30-300 eV using synchrotron radiation. Phys. Rev. B 1976, 16, 492. [Google Scholar] [CrossRef]
- Available online: www.casaxps.com (accessed on 10 September 2021).
- Oliver, W.C.; Pharr, G.N.L. An improved technique for determining hardness and elastic modulus using load and displacement sensing indentation experiments. J. Mater. Res. 1992, 7, 1564–1583. [Google Scholar] [CrossRef]
- Liu, C.; Shih, K.; Gao, Y.; Li, F.; Wei, L. Dechlorinating transformation of propachlor through nucelophilic substitution by dithionite on the surface of alumina. J. Soils Sediments 2012, 12, 724–733. [Google Scholar] [CrossRef] [Green Version]
- Ren, T.Z.; Yuan, Z.Y.; Su, B.L. Microwave-assisted preparation of hierarchical mesoporous–macroporous boehmite AlOOH and γ-Al2O3. Langmuir 2004, 20, 1531–1534. [Google Scholar] [CrossRef] [PubMed]
- Antsiferov, V.N.; Gilev, V.G.; Marmanov, V.I. Infrared spectra and structure of Si3N4, SiOn2 and sialons. Refract. Ind. Ceram. 2003, 44, 108–114. [Google Scholar] [CrossRef]
- Khan, A.S.; Khalid, H.; Sarfraz, Z.; Khan, M.; Iqbal, J.; Muhammad, N.; Fareed, M.A.; Rehman, I.U. Vibrational spectroscopy of selective dental restorative materials. Appl. Spectrosc. 2016, 52, 507–540. [Google Scholar] [CrossRef]
- Available online: www.campusplastics.com/campus/en/datasheet/VESTAMID%C2%AE+Care+ML94/Evonik+Industries+AG/66/cbf4d285 (accessed on 12 August 2021).
- Llorca, J. Deformation and Damage in Particle-Reinforced Composites: Experiments and Models. In Mechanics of Microstructured Materials; Böhm, H.J., Ed.; International Centre for Mechanical Science; Springer: Vienna, Austria, 2004; Volume 464. [Google Scholar]
- Balaskrishnan, A.; Pizette, P.; Martin, C.L.; Joshi, S.V.; Saha, B.P. Effect of particle size in aggregated and agglomerated ceramic powders. Acta Mater. 2010, 58, 802–812. [Google Scholar] [CrossRef]
- Vacche, S.D.; Michaud, V.; Damjanovic, D.; Manson, J.A.E.; Leterrier, Y. Improved mechanical dispersion or use of coupling agents? Advantages and disadvantages for the properties of fluoropolymer/ceramic composites. Polymer 2018, 154, 8–16. [Google Scholar] [CrossRef]
- Valarivan, R.; Pillai, C.N.; Swamy, C.S. Decomposition of 2-propanol on an intermetallic compound for hydrogen storage. React. Kinet. Catal. Lett. 1994, 53, 429–440. [Google Scholar] [CrossRef]
- Abdullah, A.M.; Rahim, T.N.A.T.; Mohamad, D.; Akil, H.M.; Rajion, Z.A. Mechanical and physical properties of highly ZrO2/β-TCP filled polyamide 12 prepared via fused deposition modelling (FDM) 3D printer for potential craniofacial reconstruction application. Mater. Lett. 2017, 189, 307–309. [Google Scholar] [CrossRef]
- Available online: https://sumikamaterials.com/wp-content/uploads/2021/01/AA-Brochure.pdf (accessed on 12 August 2021).
- Available online: https://www.sigmaaldrich.com/PL/pl/sds/aldrich/204994 (accessed on 12 August 2021).
- Rahim, T.N.A.T.; Abdullah, A.M.; Md Akil, H.; Mohamad, D.; Rajion, Z.A. The improvement of mechanical and thermal properties of polyamide 12 3D printed parts by fused deposition modelling. Express Polym. Lett. 2017, 11, 963–982. [Google Scholar] [CrossRef]


| Printing Parameters | Batch 1 | Batch 2 | Batch 3 | Batch 4 |
|---|---|---|---|---|
| Material | PA-ZrO2 | PA-ZrO2 | PA-Al2O3 | PLA |
| Nozzle diameter (mm) | 0.4 mm | 0.8 mm | 0.8 mm | 0.8 mm |
| Layer thickness (mm) | 0.2 mm | 0.2 mm | 0.2 mm | 0.2 mm |
| Build orientation | z (vertically) | x (horizontally) | x (horizontally) | x (horizontally) |
| Infill density | 90% | 100% | 100% | 100% |
| Infill pattern | Linear (+45°/−45°) | Linear aligned (0°) | Linear aligned (0°) | Linear aligned (0°) |
| Outer layers | 2 | 2 | 2 | 2 |
| Extruder temp. (°C) | 230–255 °C (5 °C increments) | 250 °C | 250 °C | 210 °C |
| Dimensions of the Sample | Dimensions, mm |
|---|---|
| l3—overall length | 75 |
| l1—length of narrow parallel-sided portion | 30.5 |
| r—radius | 37 |
| l2—distance between broad parallel-sided portions | 57.5 |
| b2—width at ends | 10 |
| b1—width of narrow portion | 5 |
| h—thickness | 2.35 |
| L0—gauge length | 25 |
| L—initial distance between grips | 54 |
| Printing Parameters | ||
|---|---|---|
| Material | PA-ZrO2 | PA-Al2O3 |
| Nozzle diameter (mm) | 0.5 mm | 0.5 mm |
| Layer thickness (mm) | 0.35 mm | 0.35 mm |
| Build orientation | x (horizontally) | x (horizontally) |
| Infill density | 100% | 100% |
| Infill pattern | Linear aligned (0°) | Linear aligned (0°) |
| Outer layers | 2 | 2 |
| Extruder temp. (°C) | 210 °C | 210 °C |
| Compound | Na2HPO4 | NaCl | KSCN | KH2PO4 | NaHCO3 | KCl |
|---|---|---|---|---|---|---|
| Concentration, g/L | 0.260 | 0.700 | 0.330 | 0.200 | 1.500 | 1.200 |
| Material | Dx 10 [μm] | Dx 50 [μm] | Dx 90 [μm] |
|---|---|---|---|
| ZrO2 | 2.76 (±0.01) | 12 (±0) | 31.86 (±0.23) |
| Al2O3 | 13.4 (±0) | 21.9 (±0) | 32.52 (±0.04) |
| Sample | Concentration, % | |||||
|---|---|---|---|---|---|---|
| Al | Si | Zr | C | N | O | |
| Al2O3_1 | 44.69 | 0.00 | 0.00 | 7.34 | 0.00 | 47.97 |
| ZrO2_1 | 0.00 | 0.00 | 30.57 | 22.68 | 0.00 | 46.75 |
| Al2O3_2 | 43.60 | 6.31 | 0.00 | 7.28 | 6.22 | 36.59 |
| ZrO2_2 | 0.00 | 7.59 | 23.15 | 24.68 | 7.74 | 36.84 |
| PA12-ZrO2 Initial State | PA12-ZrO2 14 Days | PA12-ZrO2 21 Days | PA12-ZrO2 29 Days | PA12-Al2O3 Initial State | PA12-Al2O3 14 Days | PA12-Al2O3 21 Days | PA12-Al2O3 29 Days | |
|---|---|---|---|---|---|---|---|---|
| Vickers hardness, HVIT | 11 ± 1 | 22 ± 3 | 9 ± 1 | 19 ± 2 | 17 ± 2 | 14 ± 1 | 5 ± 1 | 12 ± 1 |
| Microhardness HIT, MPa | 120 ± 8 | 229 ± 31 | 100 ± 10 | 202 ± 29 | 175 ± 20 | 151 ± 8 | 58 ± 16 | 128 ± 11 |
Publisher’s Note: MDPI stays neutral with regard to jurisdictional claims in published maps and institutional affiliations. |
© 2021 by the authors. Licensee MDPI, Basel, Switzerland. This article is an open access article distributed under the terms and conditions of the Creative Commons Attribution (CC BY) license (https://creativecommons.org/licenses/by/4.0/).
Share and Cite
Nakonieczny, D.S.; Kern, F.; Dufner, L.; Antonowicz, M.; Matus, K. Alumina and Zirconia-Reinforced Polyamide PA-12 Composites for Biomedical Additive Manufacturing. Materials 2021, 14, 6201. https://doi.org/10.3390/ma14206201
Nakonieczny DS, Kern F, Dufner L, Antonowicz M, Matus K. Alumina and Zirconia-Reinforced Polyamide PA-12 Composites for Biomedical Additive Manufacturing. Materials. 2021; 14(20):6201. https://doi.org/10.3390/ma14206201
Chicago/Turabian StyleNakonieczny, Damian S., Frank Kern, Lukas Dufner, Magdalena Antonowicz, and Krzysztof Matus. 2021. "Alumina and Zirconia-Reinforced Polyamide PA-12 Composites for Biomedical Additive Manufacturing" Materials 14, no. 20: 6201. https://doi.org/10.3390/ma14206201
APA StyleNakonieczny, D. S., Kern, F., Dufner, L., Antonowicz, M., & Matus, K. (2021). Alumina and Zirconia-Reinforced Polyamide PA-12 Composites for Biomedical Additive Manufacturing. Materials, 14(20), 6201. https://doi.org/10.3390/ma14206201