
Corrosion Inhibition Mechanism of Steel Reinforcements in Mortar Using Soluble Phosphates: A Critical Review


Abstract
:1. Introduction
2. Description of Phosphate Behavior, Methodology
3. Effect of Phosphate on the Mortar Matrix
4. Effect of Phosphate on the Steel Reinforcement
5. Thermodynamics and Reactivity of Phosphate Corrosion Inhibitors
6. Conclusions
Author Contributions
Funding
Institutional Review Board Statement
Informed Consent Statement
Data Availability Statement
Acknowledgments
Conflicts of Interest
Abbreviations
| ACI | Admixed corrosion inhibitor |
| D | Diffusion coefficient |
| EDX | Energy dispersive X-ray |
| Ecorr | Potential of corrosion |
| EPZC | Potential of zero charge |
| EPMA | Electron probe micro-analysis |
| ∆Gf° | Standard free-energy of formation |
| icorr | Corrosion current density |
| IE | Inhibitor efficiency |
| Ka | Acid dissociation constant |
| Keq | Equilibrium constant |
| LPR | Linear polarization resistance |
| MCI | Migrating corrosion inhibitor |
| OPC | Ordinary Portland cement |
| RH | Relative humidity |
| RT | Room temperature |
| Rp | Polarization resistance |
| SCE | Saturated calomel electrode |
| SCPS | Simulated concrete pore solution |
| TEM | Transmission electron microscopy |
| TGA | Thermogravimetric analysis |
| Vmolar | Molar volume |
| ∆V | Variation in volume |
| XRD | X-ray diffraction |
References
- Wu, M.; Johannesson, B.; Geiker, M. A review: Self-healing in cementitious materials and engineered cementitious composite as a self-healing material. Constr. Build. Mater. 2012, 28, 571–583. [Google Scholar] [CrossRef]
- Fajardo, S.; Bastidas, J.M.; Criado, M.; Romero, M. Corrosion behaviour of a new low-nickel stainless steel in saturated calcium hydroxide solution. Constr. Build. Mater. 2011, 25, 4190–4196. [Google Scholar] [CrossRef]
- Page, C.L.; Treadaway, K.W.J. Aspects of the electrochemistry of steel in concrete. Nat. Cell Biol. 1982, 297, 109–115. [Google Scholar] [CrossRef]
- González, J.A. 2007 FN Speller award lecture: Prediction of reinforced concrete structure durability by electrochemical techniques. Corrosion 2007, 63, 811–818. [Google Scholar] [CrossRef]
- Dong, B.; Wang, Y.; Ding, W.; Li, S.; Han, N.; Xing, F.; Lu, Y. Electrochemical impedance study on steel corrosion in the simulated concrete system with a novel self-healing microcapsule. Constr. Build. Mater. 2014, 56, 1–6. [Google Scholar] [CrossRef]
- Ormellese, M.; Lazzari, L.; Goidanich, S.; Fumagalli, G.; Brenna, A. A study of organic substances as inhibitors for chloride-induced corrosion in concrete. Corros. Sci. 2009, 51, 2959–2968. [Google Scholar] [CrossRef]
- Ress, J.; Martin, U.; Bosch, J.; Bastidas, D.M. pH-triggered release of NaNO2 corrosion inhibitors from novel colophony microcapsules in simulated concrete pore solution. ACS Appl. Mater. Interfaces 2020, 12, 46686–46700. [Google Scholar] [CrossRef] [PubMed]
- Génin, J.-M.R.; Dhouibi, L.; Refait, P.; Abdelmoula, M.; Triki, E. Influence of phosphate on corrosion products of iron in chloride-polluted-concrete-simulating solutions: Ferrihydrite vs. green rust. Corrosion 2002, 58, 467–478. [Google Scholar] [CrossRef]
- Soeda, K.; Ichimura, T. Present state of corrosion inhibitors in Japan. Cem. Concr. Compos. 2003, 25, 117–122. [Google Scholar] [CrossRef]
- Tritthart, J. Transport of a surface-applied corrosion inhibitor in cement paste and concrete. Cem. Concr. Res. 2003, 33, 829–834. [Google Scholar] [CrossRef]
- De Gutierrez, R.M.; Aguirre, A.M. Durabilidad del hormigón armado expuesto a condiciones agresivas. Mater. Constr. 2013, 63, 7–38. [Google Scholar] [CrossRef] [Green Version]
- Lee, H.-S.; Saraswathy, V.; Kwon, S.-J.; Karthick, S. Corrosion inhibitors for reinforced concrete: A review. In Corrosion Inhibitors, Principles and Recent Applications; Aliofkhazraei, M., Ed.; IntechOpen: London, UK, 2018; pp. 95–120. [Google Scholar] [CrossRef] [Green Version]
- Page, M.M.; Ngala, V.T.; Page, C.L. Corrosion inhibitors in concrete repair systems. Mag. Concr. Res. 2000, 52, 25–37. [Google Scholar] [CrossRef]
- Li, W.; Dong, B.; Yang, Z.; Xu, J.; Chen, Q.; Li, H.; Xing, F.; Jiang, Z. Recent advances in intrinsic self-healing cementitious materials. Adv. Mater. 2018, 30, e1705679. [Google Scholar] [CrossRef]
- Ngala, V.; Page, C.; Page, M. Corrosion inhibitor systems for remedial treatment of reinforced concrete. Part 2: Sodium monofluorophosphate. Corros. Sci. 2003, 45, 1523–1537. [Google Scholar] [CrossRef]
- Gaidis, J.M. Chemistry of corrosion inhibitors. Cem. Concr. Compos. 2004, 26, 181–189. [Google Scholar] [CrossRef]
- Nmai, C.K. Multi-functional organic corrosion inhibitor. Cem. Concr. Compos. 2004, 26, 199–207. [Google Scholar] [CrossRef]
- Garcés, P.; Saura, P.; Méndez, A.; Zornoza, E.; Andrade, C. Effect of nitrite in corrosion of reinforcing steel in neutral and acid solutions simulating the electrolytic environments of micropores of concrete in the propagation period. Corros. Sci. 2008, 50, 498–509. [Google Scholar] [CrossRef]
- Muralidharan, S.; Saraswathy, V.; Thangavel, K.; Srinivasan, S. Competitive role of inhibitive and aggressive ions in the corrosion of steel in concrete. J. Appl. Electrochem. 2000, 30, 1255–1259. [Google Scholar] [CrossRef]
- Lee, H.-S.; Ryu, H.-S.; Park, W.-J.; Ismail, M.A. Comparative study on corrosion protection of reinforcing steel by using amino alcohol and lithium nitrite inhibitors. Materials 2015, 8, 251–269. [Google Scholar] [CrossRef] [PubMed]
- Sail, L.; Ghomari, F.; Khelidj, A.; Bezzar, A.; Benali, O. The effect of phosphate corrosion inhibitor on steel in synthetic concrete solutions. Adv. Mater. Res. 2013, 2, 155–172. [Google Scholar] [CrossRef] [Green Version]
- Sail, L.; Benbrahim, A.; Mekami, M. Analytical kinetic study of steel corrosion inhibition by Na3PO4 in synthetic concrete solutions. Int. J. Chem. Kinet. 2019, 51, 123–130. [Google Scholar] [CrossRef]
- Sail, L.; Benbrahim, A. Comparative behavior study of steel corrosion inhibition kinetics by three phosphate inhibitors with mass loss measurements. J. Adhes. Sci. Technol. 2019, 34, 48–66. [Google Scholar] [CrossRef]
- Feng, X.; Tang, Y.; Zhao, X.; Zuo, Y. The influence of Ce(NO3)3·6H2O on the inhibitive effect of Ca(NO2)2 in simulated concrete pore solution. J. Wuhan Univ. Technol. Sci. Ed. 2012, 27, 994–998. [Google Scholar] [CrossRef]
- Rosenberg, A.M.; Gaidis, J.M. The mechanism of nitrite inhibition of chloride attack on reinforcing steel in alkaline aqueous environments. Mater. Perform. 1979, 18, 45–48. [Google Scholar]
- Pastore, T.; Cabrini, M.; Coppola, L.; Lorenzi, S.; Marcassoli, P.; Buoso, A. Evaluation of the corrosion inhibition of salts of organic acids in alkaline solutions and chloride contaminated concrete. Mater. Corros. 2011, 62, 187–195. [Google Scholar] [CrossRef]
- Fei, F.-L.; Hu, J.; Wei, J.-X.; Yu, Q.-J.; Chen, Z.-S. Corrosion performance of steel reinforcement in simulated concrete pore solutions in the presence of imidazoline quaternary ammonium salt corrosion inhibitor. Constr. Build. Mater. 2014, 70, 43–53. [Google Scholar] [CrossRef]
- Mandal, S.; Singh, J.K.; Lee, D.-E.; Park, T. Ammonium phosphate as inhibitor to mitigate the corrosion of steel rebar in chloride contaminated concrete pore solution. Molecules 2020, 25, 3785. [Google Scholar] [CrossRef]
- Ormellese, M.; Bolzoni, F.M.; Goidanich, S.; Pedeferri, M.; Brenna, A.; Pedeferri, M. Corrosion inhibitors in reinforced concrete structures Part 3—migration of inhibitors into concrete. Corros. Eng. Sci. Technol. 2011, 46, 334–339. [Google Scholar] [CrossRef]
- Ress, J.; Martin, U.; Bosch, J.; Bastidas, D.M. Protection of carbon steel rebars by epoxy coating with smart environmentally friendly microcapsules. Coatings 2021, 11, 113. [Google Scholar] [CrossRef]
- Rajabalizadeh, Z.; Seifzadeh, D. Strontium phosphate conversion coating as an economical and environmentally-friendly pretreatment for electroless plating on AM60B magnesium alloy. Surf. Coat. Technol. 2016, 304, 450–458. [Google Scholar] [CrossRef]
- Chen, X.-B.; Birbilis, N.; Abbott, T. Effect of [Ca2+] and [PO43−] levels on the formation of calcium phosphate conversion coatings on die-cast magnesium alloy AZ91D. Corros. Sci. 2012, 55, 226–232. [Google Scholar] [CrossRef]
- Jiang, C.; Gao, Z.; Pan, H.; Cheng, X. The initiation and formation of a double-layer phosphate conversion coating on steel. Electrochem. Commun. 2020, 114, 106676. [Google Scholar] [CrossRef]
- Fuchs-Godec, R.; Doleček, V. A effect of sodium dodecylsulfate on the corrosion of copper in sulphuric acid media. Colloids Surf. A Physicochem. Eng. Asp. 2004, 244, 73–76. [Google Scholar] [CrossRef]
- Zin, I.; Lyon, S.; Pokhmurskii, V. Corrosion control of galvanized steel using a phosphate/calcium ion inhibitor mixture. Corros. Sci. 2003, 45, 777–788. [Google Scholar] [CrossRef]
- Alibakhshi, E.; Ghasemi, E.; Mahdavian-Ahadi, M. Corrosion inhibition by lithium zinc phosphate pigment. Corros. Sci. 2013, 77, 222–229. [Google Scholar] [CrossRef]
- Lu, X.; Zuo, Y.; Zhao, X.; Tang, Y. The influence of aluminum tri-polyphosphate on the protective behavior of Mg-rich epoxy coating on AZ91D magnesium alloy. Electrochim. Acta 2013, 93, 53–64. [Google Scholar] [CrossRef]
- Simões, A.; Torres, J.; Picciochi, R.; Fernandes, J. Corrosion inhibition at galvanized steel cut edges by phosphate pigments. Electrochim. Acta 2009, 54, 3857–3865. [Google Scholar] [CrossRef]
- Liu, B.; Xiao, G.-Y.; Lu, Y.-P. Effect of pH on the Phase composition and corrosion characteristics of calcium zinc phosphate conversion coatings on titanium. J. Electrochem. Soc. 2016, 163, C477–C485. [Google Scholar] [CrossRef]
- Salinas, R.; Stoytcheva, M.; Gonzalez, A.; Zlatev, R.; Schorr, M. Motor vehicles protection against corrosion by phosphatization. In Proceedings of the 23rd International Materials Research Congress, Cancun, Mexico, 17–21 August 2014. [Google Scholar]
- Söylev, T.A.; Richardson, M. Corrosion inhibitors for steel in concrete: State-of-the-art report. Constr. Build. Mater. 2008, 22, 609–622. [Google Scholar] [CrossRef]
- Bastidas, D.M.; La Iglesia, V.M.; Criado, M.; Fajardo, S.; La Iglesia, A.; Bastidas, J.M. A prediction study of hydroxyapatite entrapment ability in concrete. Constr. Build. Mater. 2010, 24, 2646–2649. [Google Scholar] [CrossRef]
- Bastidas, D.M.; Criado, M.; La Iglesia, V.M.; Fajardo, S.; La Iglesia, A.; Bastidas, J.M. Comparative study of three sodium phosphates as corrosion inhibitors for steel reinforcements. Cem. Concr. Compos. 2013, 43, 31–38. [Google Scholar] [CrossRef]
- Criado, M.; Bastidas, D.M.; La Iglesia, V.M.; La Iglesia, A.; Bastidas, J.M. Precipitation mechanism of soluble phosphates in mortar. Eur. J. Environ. Civ. Eng. 2017, 23, 1265–1274. [Google Scholar] [CrossRef]
- Etteyeb, N.; Dhouibi, L.; Takenouti, H.; Alonso, M.; Triki, E. Corrosion inhibition of carbon steel in alkaline chloride media by Na3PO4. Electrochim. Acta 2007, 52, 7506–7512. [Google Scholar] [CrossRef]
- Bastidas, D.M.; Criado, M.; Fajardo, S.; La Iglesia, A.; Bastidas, J.M. Corrosion inhibition mechanism of phosphates for early-age reinforced mortar in the presence of chlorides. Cem. Concr. Compos. 2015, 61, 1–6. [Google Scholar] [CrossRef]
- Dhouibi, L.; Triki, E.; Raharinaivo, A.; Trabanelli, G.; Zucchi, F. Electrochemical methods for evaluating inhibitors of steel corrosion in concrete. Br. Corros. J. 2000, 35, 145–149. [Google Scholar] [CrossRef]
- Nahali, H.; Ben Mansour, H.; Dhouibi, L.; Idrissi, H. Effect of Na3PO4 inhibitor on chloride diffusion in mortar. Constr. Build. Mater. 2017, 141, 589–597. [Google Scholar] [CrossRef]
- Iravani, D.; Arefinia, R. Effectiveness of one-to-one phosphate to chloride molar ratio at different chloride and hydroxide concentrations for corrosion inhibition of carbon steel. Constr. Build. Mater. 2020, 233, 117200. [Google Scholar] [CrossRef]
- Shi, J.-J.; Sun, W. Electrochemical and analytical characterization of three corrosion inhibitors of steel in simulated concrete pore solutions. Int. J. Miner. Met. Mater. 2012, 19, 38–47. [Google Scholar] [CrossRef]
- Mohagheghi, A.; Arefinia, R. Corrosion inhibition of carbon steel by dipotassium hydrogen phosphate in alkaline solutions with low chloride contamination. Constr. Build. Mater. 2018, 187, 760–772. [Google Scholar] [CrossRef]
- Ben Mansour, H.; Dhouibi, L.; Idrissi, H. Effect of phosphate-based inhibitor on prestressing tendons corrosion in simulated concrete pore solution contaminated by chloride ions. Constr. Build. Mater. 2018, 171, 250–260. [Google Scholar] [CrossRef]
- Chen, Y.; Jiang, L.; Yan, X.; Song, Z.; Guo, M.; Zhao, S.; Gong, W. Impact of phosphate corrosion inhibitors on chloride binding and release in cement pastes. Constr. Build. Mater. 2020, 236, 117469. [Google Scholar] [CrossRef]
- Paulson, B.M.; Thomas, K.J.; Raphael, V.P.; Shaju, K.S.; Ragi, K. Mitigation of concrete reinforced steel corrosion by penta sodium triphosphate: Physicochemical and electrochemical investigations. SN Appl. Sci. 2020, 2, 1–11. [Google Scholar] [CrossRef]
- Lee, H.-S.; Yang, H.-M.; Singh, J.K.; Prasad, S.K.; Yoo, B. Corrosion mitigation of steel rebars in chloride contaminated concrete pore solution using inhibitor: An electrochemical investigation. Constr. Build. Mater. 2018, 173, 443–451. [Google Scholar] [CrossRef]
- Yohai, L.; Valcarce, M.; Vázquez, M. Testing phosphate ions as corrosion inhibitors for construction steel in mortars. Electrochim. Acta 2016, 202, 316–324. [Google Scholar] [CrossRef]
- Dhouibi, L.; Triki, E.; Salta, M.; Rodrigues, P.; Raharinaivo, A. Studies on corrosion inhibition of steel reinforcement by phosphate and nitrite. Mater. Struct. 2003, 36, 530–540. [Google Scholar] [CrossRef]
- Shi, J.; Sun, W. Effects of phosphate on the chloride-induced corrosion behavior of reinforcing steel in mortars. Cem. Concr. Compos. 2014, 45, 166–175. [Google Scholar] [CrossRef]
- Bastidas, D.M. Interpretation of impedance data for porous electrodes and diffusion processes. Corrosion 2007, 63, 515–521. [Google Scholar] [CrossRef]
- Yohai, L.; Vazquez, M.; Valcarce, M. Phosphate ions as corrosion inhibitors for reinforcement steel in chloride-rich environments. Electrochim. Acta 2013, 102, 88–96. [Google Scholar] [CrossRef] [Green Version]
- Chaussadent, T.; Nobel-Pujol, V.; Farcas, F.; Mabille, I.; Fiaud, C. Effectiveness conditions of sodium monofluorophosphate as a corrosion inhibitor for concrete reinforcements. Cem. Concr. Res. 2006, 36, 556–561. [Google Scholar] [CrossRef]
- Etteyeb, N.; Sánchez, M.; Dhouibi, L.; Alonso, C.; Andrade, C.; Triki, E. Corrosion protection of steel reinforcement by a pretreatment in phosphate solutions: Assessment of passivity by electrochemical techniques. Corros. Eng. Sci. Technol. 2006, 41, 336–341. [Google Scholar] [CrossRef]
- Nahali, H.; Dhouibi, L.; Idrissi, H. Effect of Na3PO4 addition in mortar on steel reinforcement corrosion behavior in 3% NaCl solution. Constr. Build. Mater. 2015, 78, 92–101. [Google Scholar] [CrossRef]
- El Aal, E.A.; El Wanees, S.A.; Diab, A.; El Haleem, S.A. Environmental factors affecting the corrosion behavior of reinforcing steel III. Measurement of pitting corrosion currents of steel in Ca(OH)2 solutions under natural corrosion conditions. Corros. Sci. 2009, 51, 1611–1618. [Google Scholar] [CrossRef]
- Millard, S.; Law, D.; Bungey, J.; Cairns, J. Environmental influences on linear polarisation corrosion rate measurement in reinforced concrete. NDT E Int. 2001, 34, 409–417. [Google Scholar] [CrossRef]
- Etteyeb, N.; Dhouibi, L.; Sánchez, M.; Alonso, C.; Andrade, C.; Triki, E. Electrochemical study of corrosion inhibition of steel reinforcement in alkaline solutions containing phosphates based components. J. Mater. Sci. 2007, 42, 4721–4730. [Google Scholar] [CrossRef]
- ASTM C876-15. Standard Test Method for Corrosion Potentials of Uncoated Reinforcing Steel in Concrete; ASTM International: West Conshohocken, PA, USA, 2015. [Google Scholar] [CrossRef]
- Laamari, M.; Derja, A.; Benzakour, J.; Berraho, M. Calcium monofluorophosphate: A new class of corrosion inhibitors in NaCl medium. J. Electroanal. Chem. 2004, 569, 1–6. [Google Scholar] [CrossRef]
- Loqmane, S.; Laamari, R.; Derja, A.; Berraho, M. Synthesis and characterization of ZnPO3F,5/2H2O – Evaluation of its anticorrosion properties vis a vis iron substrates. Ann. Chim. Sci. Mater. 2000, 25, 127–141. [Google Scholar] [CrossRef]
- Laamari, M.R.; Derja, A.; Benzakour, J.; Berrekhis, F. Contribution to study corrosion inhibition of iron by manganese monofluorophosphate. Curr. Top. Electrochem. 2010, 5, 45–52. [Google Scholar]
- Feng, X.; Shi, R.; Lu, X.; Xu, Y.; Huang, X.; Chen, D. The corrosion inhibition efficiency of aluminum tripolyphosphate on carbon steel in carbonated concrete pore solution. Corros. Sci. 2017, 124, 150–159. [Google Scholar] [CrossRef]
- Kempl, J.; Copuroglu, O. EH-pH- and main element analyses of blast furnace slag cement paste pore solutions activated with sodium monofluorophosphate—implications for carbonation and self-healing. Cem. Concr. Compos. 2016, 71, 63–76. [Google Scholar] [CrossRef]
- Zhou, X.; Yang, H.; Wang, F. Investigation on the inhibition behavior of a pentaerythritol glycoside for carbon steel in 3.5% NaCl saturated Ca(OH)2 solution. Corros. Sci. 2012, 54, 193–200. [Google Scholar] [CrossRef]
- Li, Y.; Xu, N.; Guo, X.; Zhang, G. Inhibition effect of imidazoline inhibitor on the crevice corrosion of N80 carbon steel in the CO2-saturated NaCl solution containing acetic acid. Corros. Sci. 2017, 126, 127–141. [Google Scholar] [CrossRef]
- Mechmeche, L.B.; Dhouibi, L.; Ben Ouezdou, M.; Triki, E.; Zucchi, F. Investigation of the early effectiveness of an amino-alcohol based corrosion inhibitor using simulated pore solutions and mortar specimens. Cem. Concr. Compos. 2008, 30, 167–173. [Google Scholar] [CrossRef]
- Rakanta, E.; Zafeiropoulou, T.; Batis, G. Corrosion protection of steel with DMEA-based organic inhibitor. Constr. Build. Mater. 2013, 44, 507–513. [Google Scholar] [CrossRef]
- Diamanti, M.; Rosales, E.P.; Raffaini, G.; Ganazzoli, F.; Brenna, A.; Pedeferri, M.; Ormellese, M. Molecular modelling and electrochemical evaluation of organic inhibitors in concrete. Corros. Sci. 2015, 100, 231–241. [Google Scholar] [CrossRef] [Green Version]
- Broomfield, J.P.; Davies, K.; Hladky, K. The use of permanent corrosion monitoring in new and existing reinforced concrete structures. Cem. Concr. Compos. 2002, 24, 27–34. [Google Scholar] [CrossRef]
- Blankson, M.A.; Erdem, S. Comparison of the effect of organic and inorganic corrosion inhibitors on the rheology of self-compacting concrete. Constr. Build. Mater. 2015, 77, 59–65. [Google Scholar] [CrossRef]
- Monticelli, C.; Frignani, A.; Trabanelli, G. A study on corrosion inhibitors for concrete application. Cem. Concr. Res. 2000, 30, 635–642. [Google Scholar] [CrossRef]
- Trabanelli, G.; Monticelli, C.; Grassi, V.; Frignani, A. Electrochemical study on inhibitors of rebar corrosion in carbonated concrete. Cem. Concr. Res. 2005, 35, 1804–1813. [Google Scholar] [CrossRef]
- Sagoe-Crentsil, K.; Yilmaz, V.; Glasser, F.; Yılmaz, V. Corrosion inhibition of steel in concrete by carboxylic acids. Cem. Concr. Res. 1993, 23, 1380–1388. [Google Scholar] [CrossRef]
- Criado, M.; Monticelli, C.; Fajardo, S.; Gelli, D.; Grassi, V.; Bastidas, J.M. Organic corrosion inhibitor mixtures for reinforcing steel embedded in carbonated alkali-activated fly ash mortar. Constr. Build. Mater. 2012, 35, 30–37. [Google Scholar] [CrossRef]
- Nguyen, D.T.; To, H.T.X.; Gervasi, J.; Paint, Y.; Gonon, M.; Olivier, M.-G. Corrosion inhibition of carbon steel by hydrotalcites modified with different organic carboxylic acids for organic coatings. Prog. Org. Coat. 2018, 124, 256–266. [Google Scholar] [CrossRef]
- Ma, S.; Li, W.; Zhang, S.; Hu, Y.; Shen, X. Study on the hydration and microstructure of Portland cement containing diethanol-isopropanolamine. Cem. Concr. Res. 2015, 67, 122–130. [Google Scholar] [CrossRef]
- Wong, H.; Pappas, A.; Zimmerman, R.; Buenfeld, N. Effect of entrained air voids on the microstructure and mass transport properties of concrete. Cem. Concr. Res. 2011, 41, 1067–1077. [Google Scholar] [CrossRef] [Green Version]
- De Rincón, O.; Millano, V.; Aboulhosn, M.; Morales, C.; Bravo, J.; Sánchez, M.; Contreras, D.; Hernández, Y. Evaluation of hydrophobic concrete coatings in tropical marine environments. Corrosion 2011, 67, 115001. [Google Scholar] [CrossRef]
- Lalitha, A.; Ramesh, S.; Rajeswari, S. Surface protection of copper in acid medium by azoles and surfactants. Electrochim. Acta 2005, 51, 47–55. [Google Scholar] [CrossRef]
- Luo, H.; Guan, Y.C.; Han, K.N. Inhibition of mild steel corrosion by sodium dodecyl benzene sulfonate and sodium oleate in acidic solutions. Corrosion 1998, 54, 619–627. [Google Scholar] [CrossRef]
- Llorente, I.; Fajardo, S.; Bastidas, J.M. Applications of electrokinetic phenomena in materials science. J. Solid State Electrochem. 2013, 18, 293–307. [Google Scholar] [CrossRef] [Green Version]
- Dong, B.; Wang, Y.; Fang, G.; Han, N.; Xing, F.; Lu, Y. Smart releasing behavior of a chemical self-healing microcapsule in the stimulated concrete pore solution. Cem. Concr. Compos. 2015, 56, 46–50. [Google Scholar] [CrossRef]
- Volpi, E.; Foiadelli, C.; Trasatti, S.; Koleva, D.A. Development of smart corrosion inhibitors for reinforced concrete structures exposed to a microbial environment. Ind. Eng. Chem. Res. 2017, 56, 5778–5794. [Google Scholar] [CrossRef]
- Auqui, N.U.; Baykara, H.; Rigail-Cedeño, A.; Cornejo, M.; Villalba, J.L. An investigation of the effect of migratory type corrosion inhibitor on mechanical properties of zeolite-based novel geopolymers. J. Mol. Struct. 2017, 1146, 814–820. [Google Scholar] [CrossRef]
- Brocas, A.-L.; Llevot, A.; Mantzaridis, C.; Cendejas, G.; Auvergne, R.; Caillol, S.; Carlotti, S.; Cramail, H. Epoxidized rosin acids as co-precursors for epoxy resins. Des. Monomers Polym. 2013, 17, 301–310. [Google Scholar] [CrossRef] [Green Version]
- Panda, S.; Pattnaik, S.; Maharana, L.; Botta, G.B.; Mahapatra, A.K. Design and evaluation of zidovudine loaded natural biodegradable microcapsules employing colophony resin as microencapsulating agent. Int. J. Phar. Pharm. Sci. 2013, 5, 799–805. [Google Scholar]
- Palanisamy, S.; Maheswaran, G.; Selvarani, A.G.; Kamal, C.; Venkatesh, G. Ricinus communis—a green extract for the improvement of anti-corrosion and mechanical properties of reinforcing steel in concrete in chloride media. J. Build. Eng. 2018, 19, 376–383. [Google Scholar] [CrossRef]
- Loto, C.; Joseph, O.; Loto, R.; Popoola, P. Inhibition effect of Vernonia amygdalina extract on the corrosion of mild steel reinforcement in concrete in 3.5M NaCl environment. Int. J. Electrochem. Sci. 2013, 8, 11087–11100. [Google Scholar]
- Jiang, S.; Jiang, L.; Wang, Z.; Jin, M.; Bai, S.; Song, S.; Yan, X. Deoxyribonucleic acid as an inhibitor for chloride-induced corrosion of reinforcing steel in simulated concrete pore solutions. Constr. Build. Mater. 2017, 150, 238–247. [Google Scholar] [CrossRef]
- Feugeas, F.; Tran, M.; Chakri, S. Bio-based admixture with substances derived from bacteria for the durability of concrete. In Eco-Efficient Repair and Rehabilitation of Concrete Infrastructures; Woodhead Publishing: Sawston, UK, 2018; pp. 569–587. [Google Scholar] [CrossRef]
- Tittarelli, F.; Mobili, A.; Bellezze, T. The use of a phosphate-based migrating corrosion inhibitor to repair reinforced concrete elements contaminated by chlorides. IOP Conf. Ser. Mater. Sci. Eng. 2017, 225, 012106. [Google Scholar] [CrossRef]
- Andrade, C.; Alonso, M.; Gonzalez, J. An initial effort to use the corrosion rate measurements for estimating rebar durability. In Corrosion Rates of Steel in Concrete; ASTM International: West Conshohocken, PA, USA, 2009; p. 29. [Google Scholar]
- Criado, M.; Martínez-Ramirez, S.; Fajardo, S.; Gómez, P.P.; Bastidas, J.M. Corrosion rate and corrosion product characterisation using raman spectroscopy for steel embedded in chloride polluted fly ash mortar. Mater. Corros. 2013, 64, 372–380. [Google Scholar] [CrossRef] [Green Version]
- Vieillard, P.; Tardy, Y. Thermochemical properties of phosphates. In Phosphate Minerals; Gabler: Wiesbaden, Germany, 1984; pp. 171–198. [Google Scholar]
- Egan, E.P.; Wakefield, Z.T.; Luff, B.B. Low temperature heat capacity, entropy and heat of formation of crystalline and colloidal ferric phosphate dihydrate. J. Phys. Chem. 1961, 65, 1265–1270. [Google Scholar] [CrossRef]
- Ebbing, D.D. General Chemistry, 3rd ed.; Houghton Mifflin Company: Boston, MA, USA, 1990. [Google Scholar]
- Kotz, J.C.; Treichel, P.; Weaver, G. Chemistry & Chemical Reactivity, 6th ed.; Thomson Brooks/Cole: Belmont, CA, USA, 2006. [Google Scholar]
- Gayer, K.H.; Wootner, L. The hydrolysis of ferrous chloride at 25°. J. Am. Chem. Soc. 1956, 78, 3944–3946. [Google Scholar] [CrossRef]
- La Iglesia, A.; La Iglesia, V.M.; Fajardo, S.; Gómez, P.P.; Bastidas, J.M. Reaction between sodium monofluorophosphate and portlandite and impact on steel reinforcement corrosion inhibition. Constr. Build. Mater. 2012, 37, 46–50. [Google Scholar] [CrossRef]
- Tacker, R.C.; Stormer, J.C., Jr. A thermodynamic model for apatite solid solutions, applicable to high-temperature geologic problems. Am. Mineral. 1989, 74, 877–888. [Google Scholar]
- Reed, J.J. Digitizing “the NBS tables of chemical thermodynamic properties: Selected values for inorganic and C1 and C2 organic substances in Si units.”. J. Res. Natl. Inst. Stand. Technol. 2020, 125, 125007. [Google Scholar] [CrossRef]
- Rowley, H.H.; Stuckey, J.E. Preparation and properties of calcium monofluorophosphate dihydrate. J. Am. Chem. Soc. 1956, 78, 4262–4263. [Google Scholar] [CrossRef]
- Mehta, S.; Simpson, D.R. Fluoride in apatite: Substitution of monofluorophosphate for orthophosphate. Am. Mineral. 1975, 60, 134–138. [Google Scholar]
- Tavassoli, Z.; Sear, R.P. Homogeneous nucleation near a second phase transition and Ostwald’s step rule. J. Chem. Phys. 2002, 116, 5066–5072. [Google Scholar] [CrossRef] [Green Version]
- Duff, E.J. The transformation: Brushite → calcium monofluorophosphate under aqueous conditions. J. Appl. Chem. Biotechnol. 1972, 22, 475–481. [Google Scholar] [CrossRef]
- Yu, H.; Hartt, W.H. Effects of reinforcement and coarse aggregates on chloride ingress into concrete and time-to-corrosion: Part 1—spatial chloride distribution and implications. Corrosion 2007, 63, 843–849. [Google Scholar] [CrossRef]
- Christian, G.D. Analytical Chemistry, 6th ed.; Wiley: New Delhi, India, 2007. [Google Scholar]
- Mandal, S.; Singh, J.K.; Lee, D.-E.; Park, T. Effect of phosphate-based inhibitor on corrosion kinetics and mechanism for formation of passive film onto the steel rebar in chloride-containing pore solution. Materials 2020, 13, 3642. [Google Scholar] [CrossRef] [PubMed]
- Bastidas, D.M.; Ress, J.; Martin, U.; Bosch, J.; La Iglesia, A.; Bastidas, J.M. Crystallization pressure and volume variation during rust development in marine and urban-continental environments: Critical factors influencing exfoliation. Rev. Met. 2020, 56, 164. [Google Scholar] [CrossRef]

 ), Mix B (
  ) and Mix C (
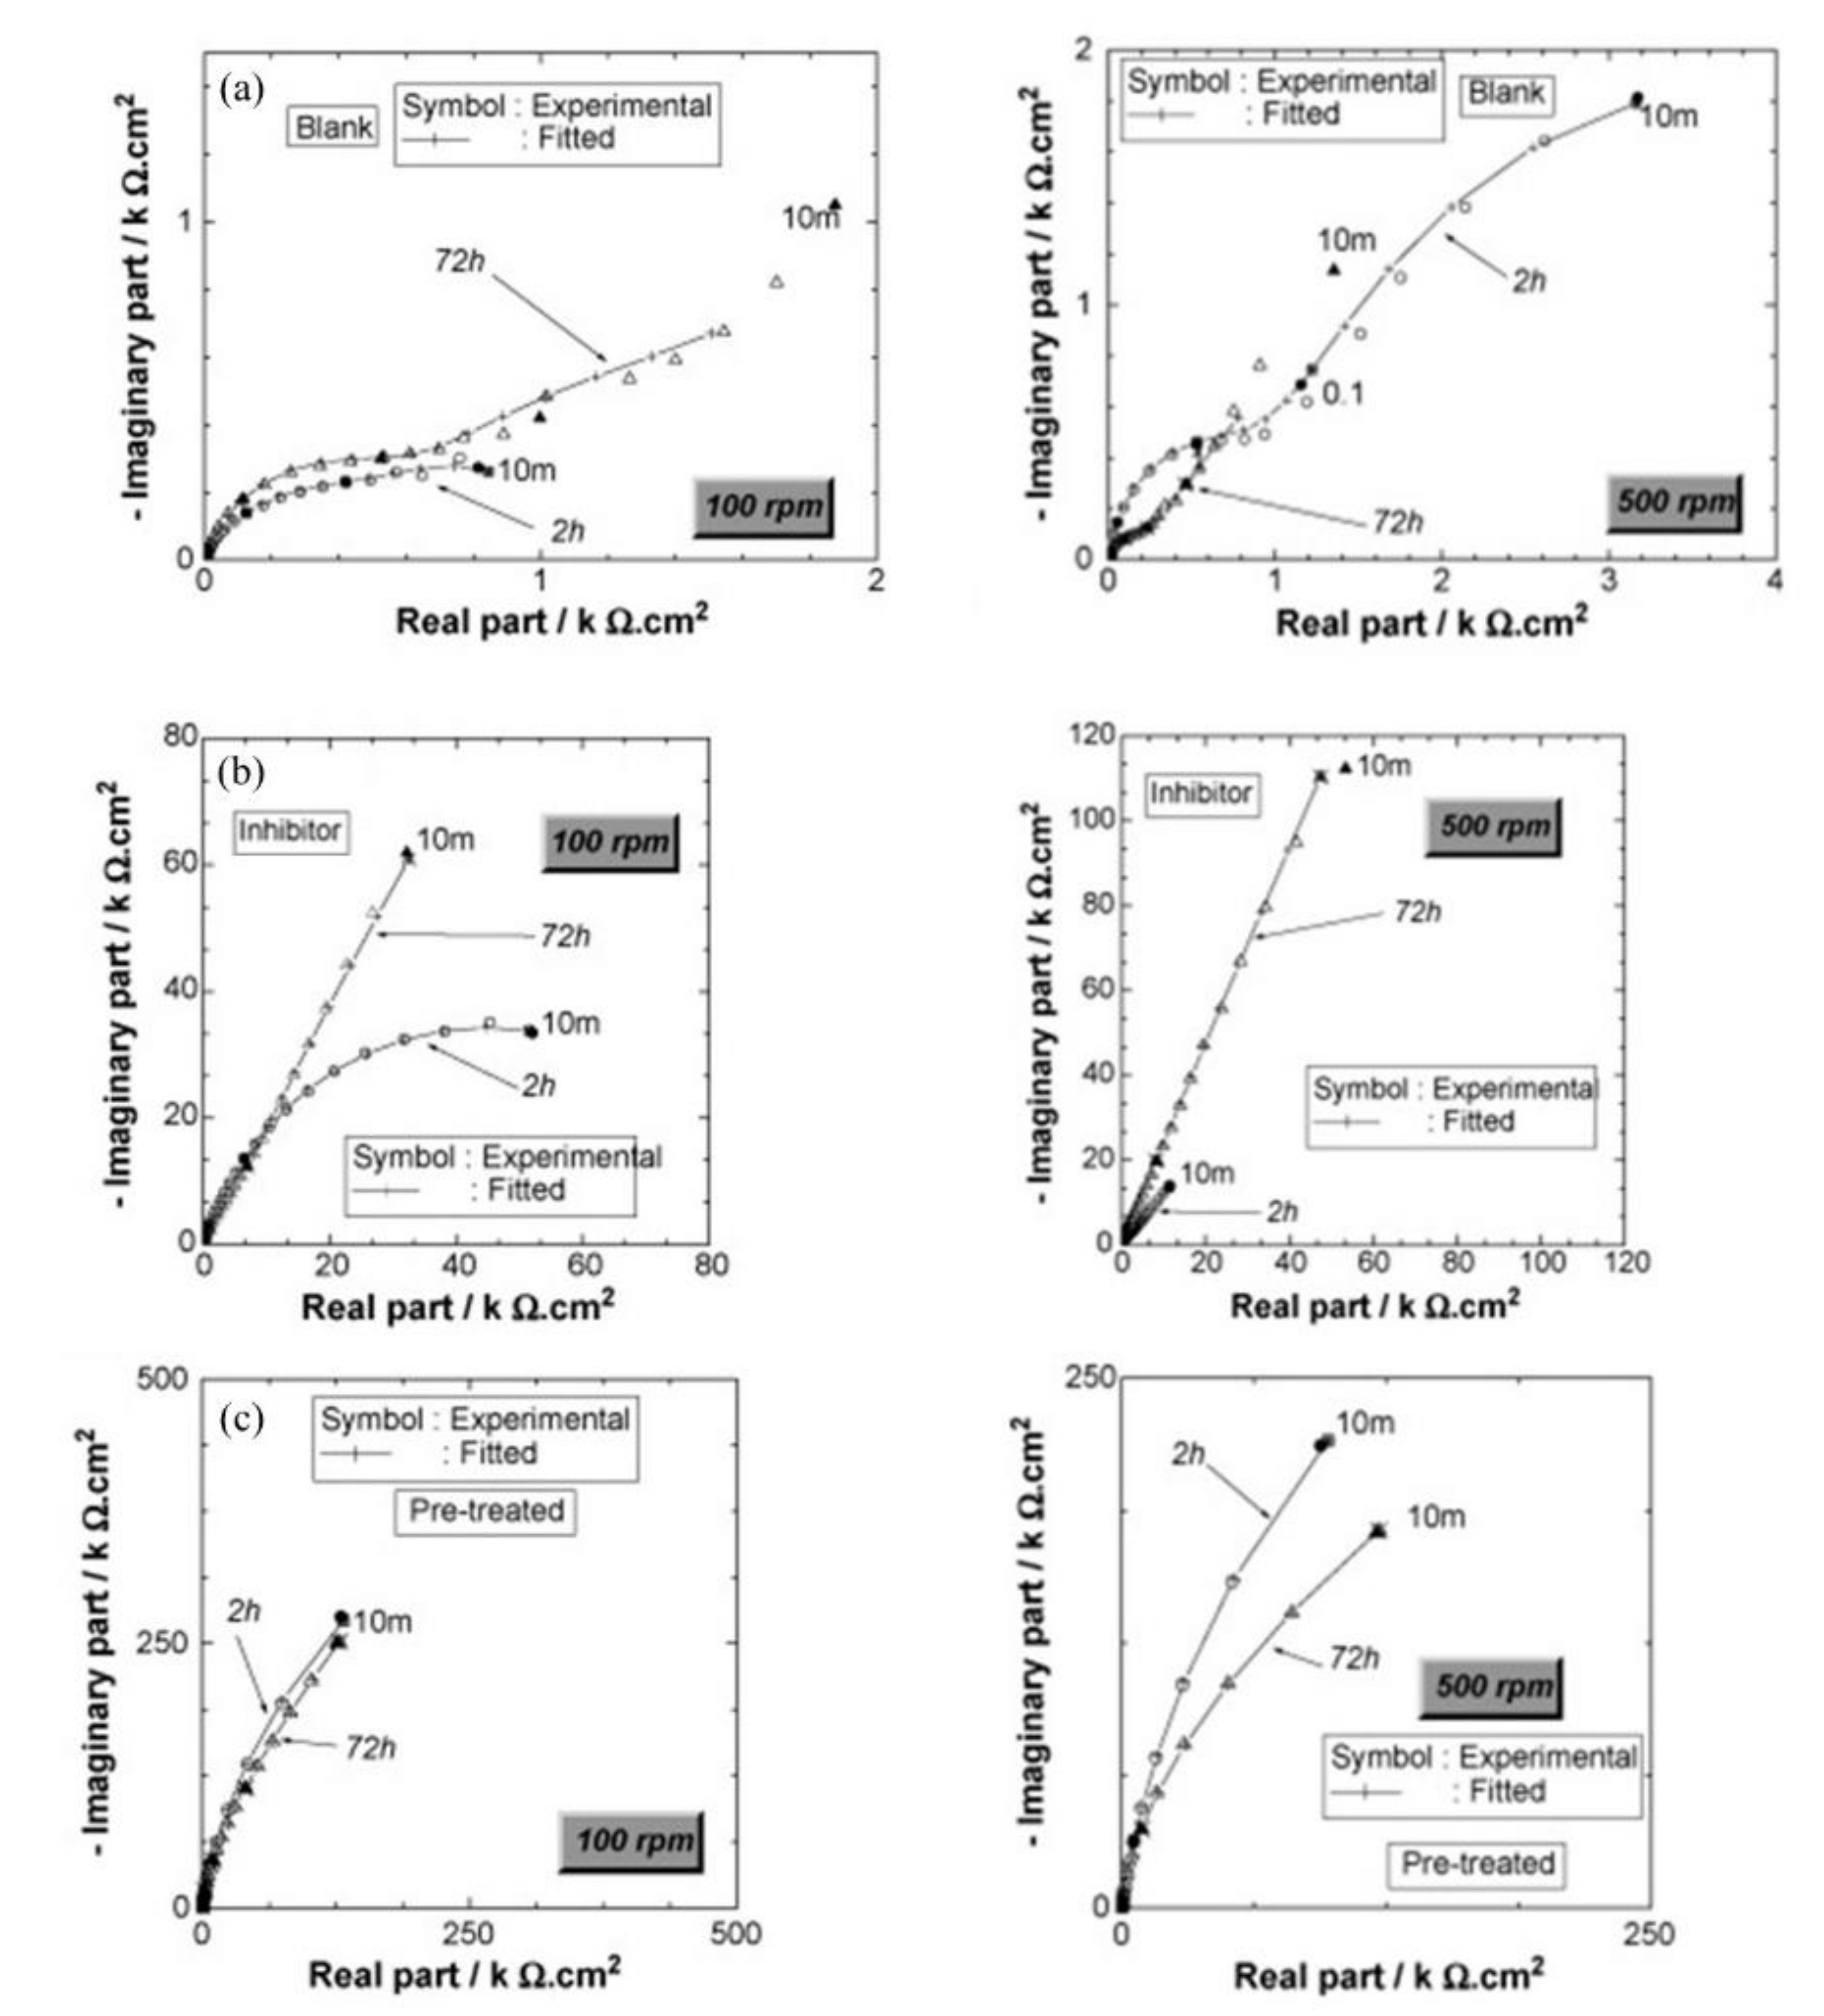
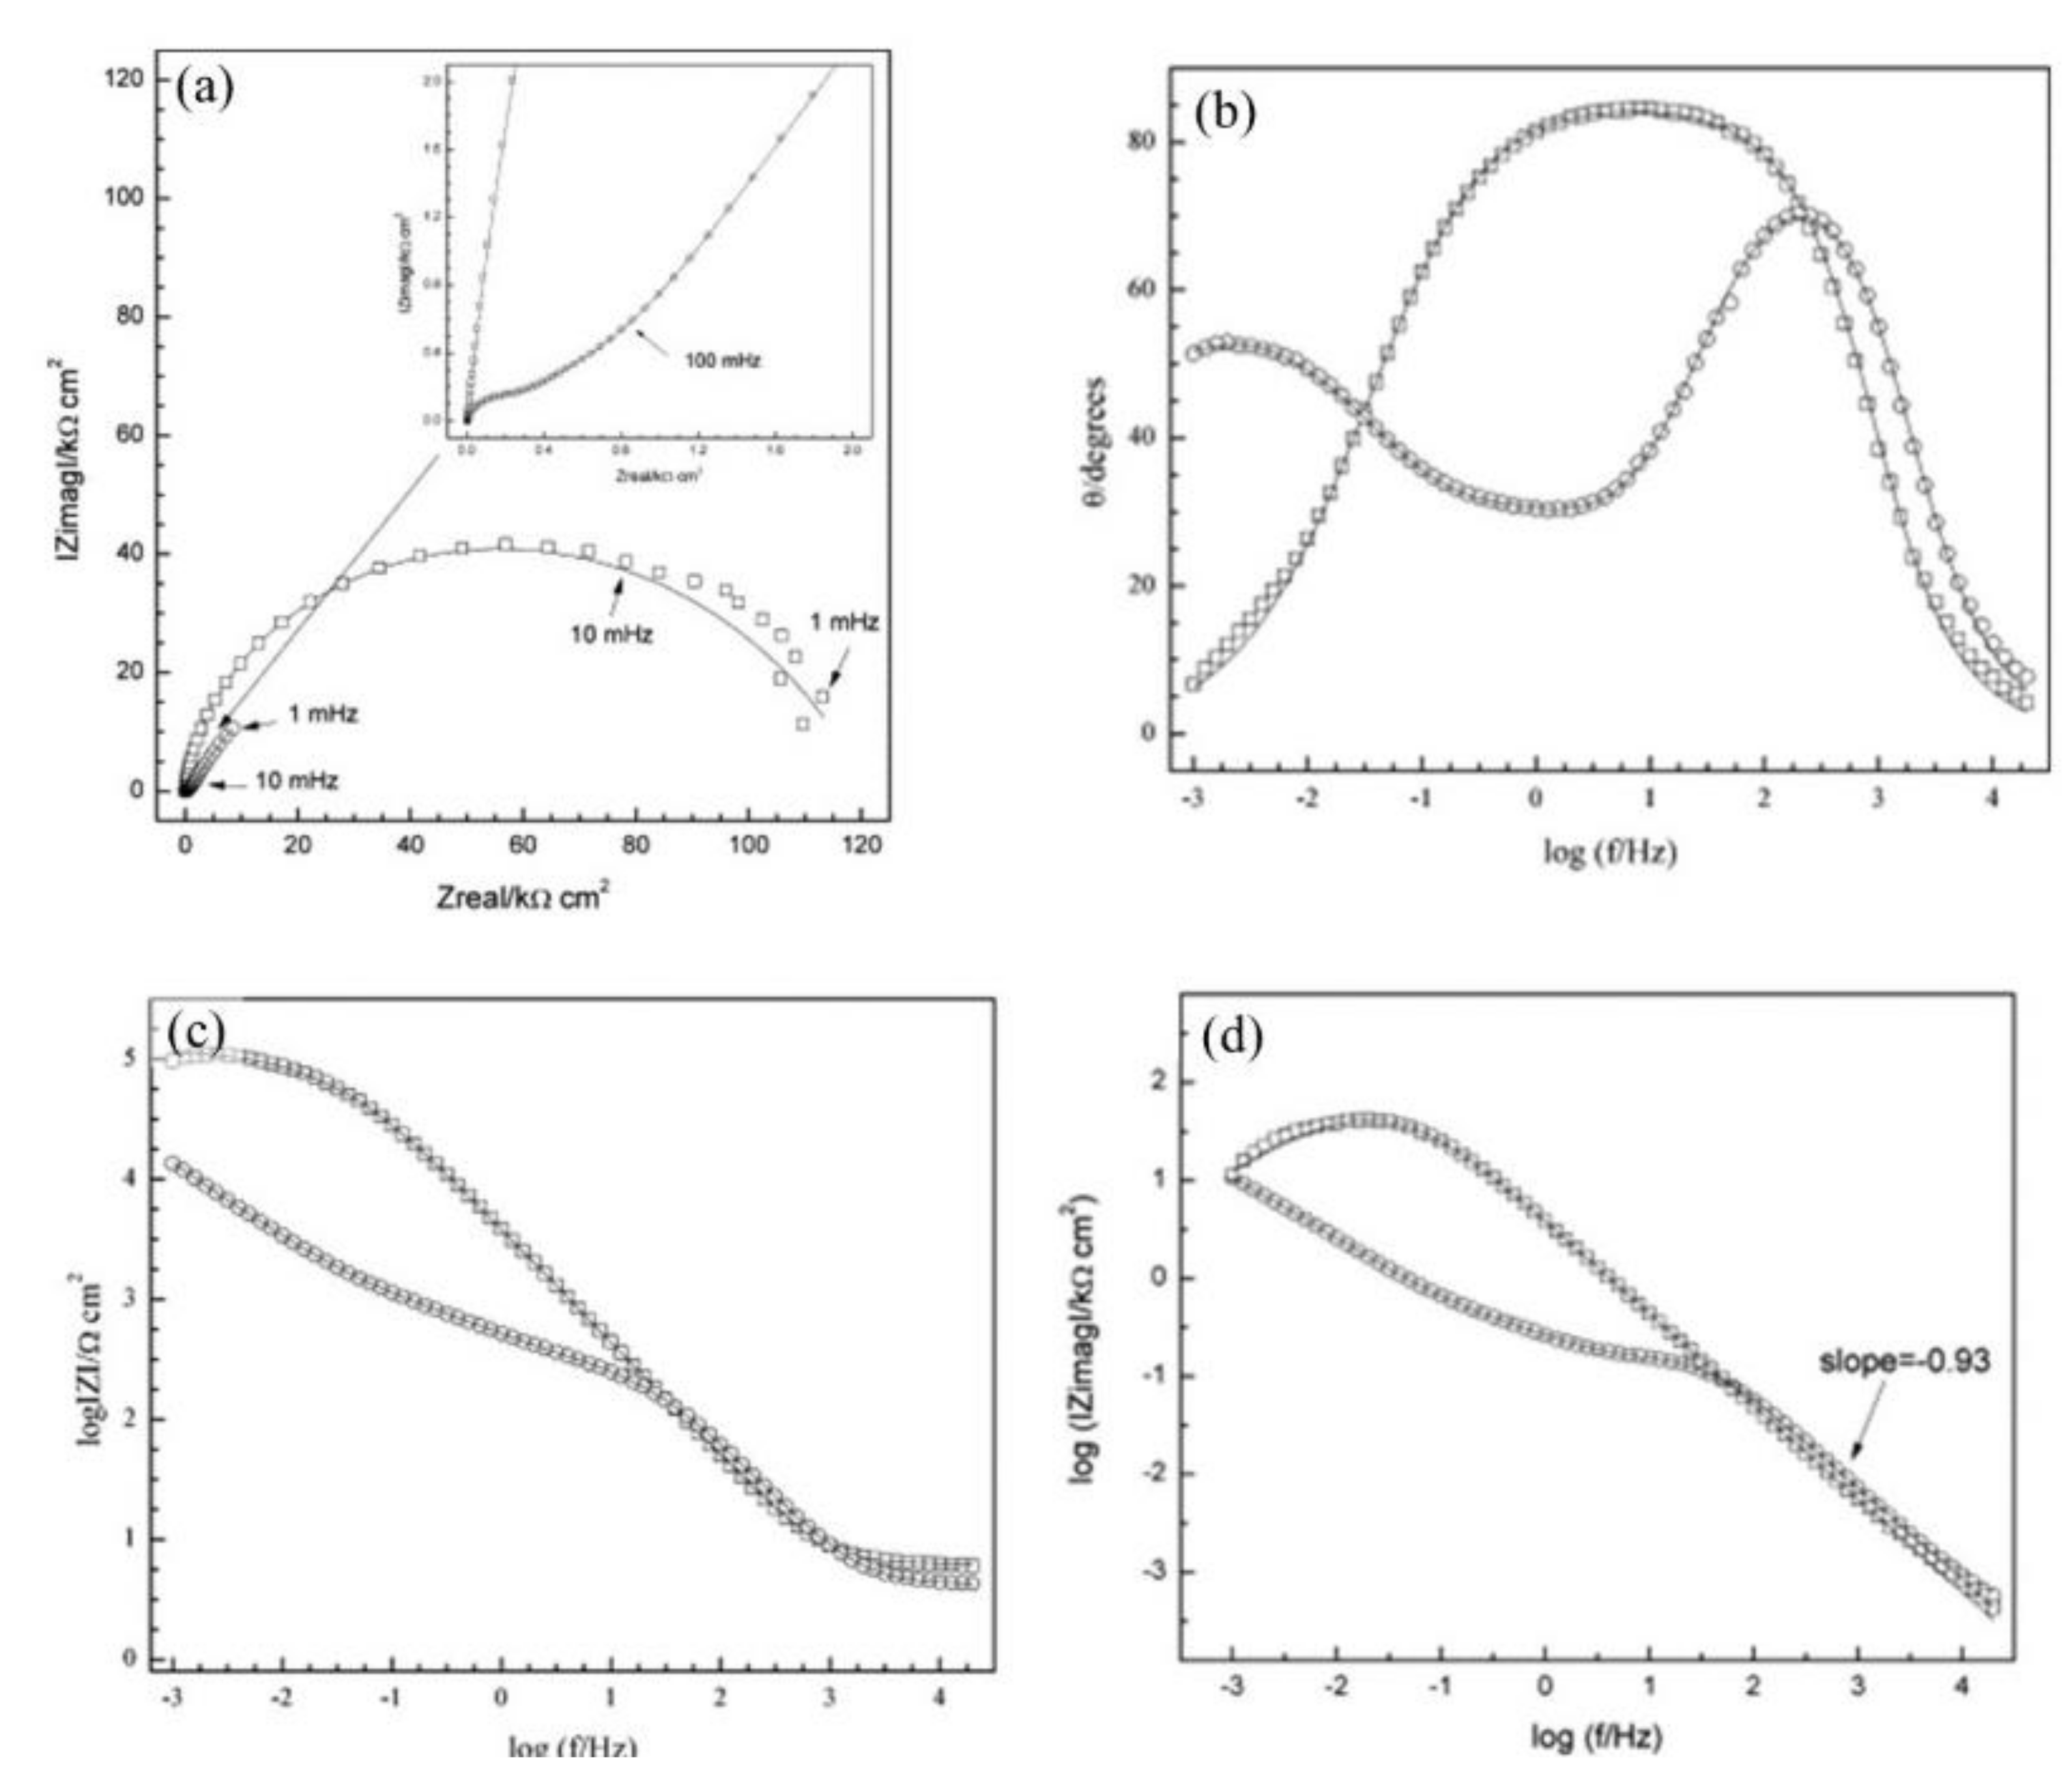
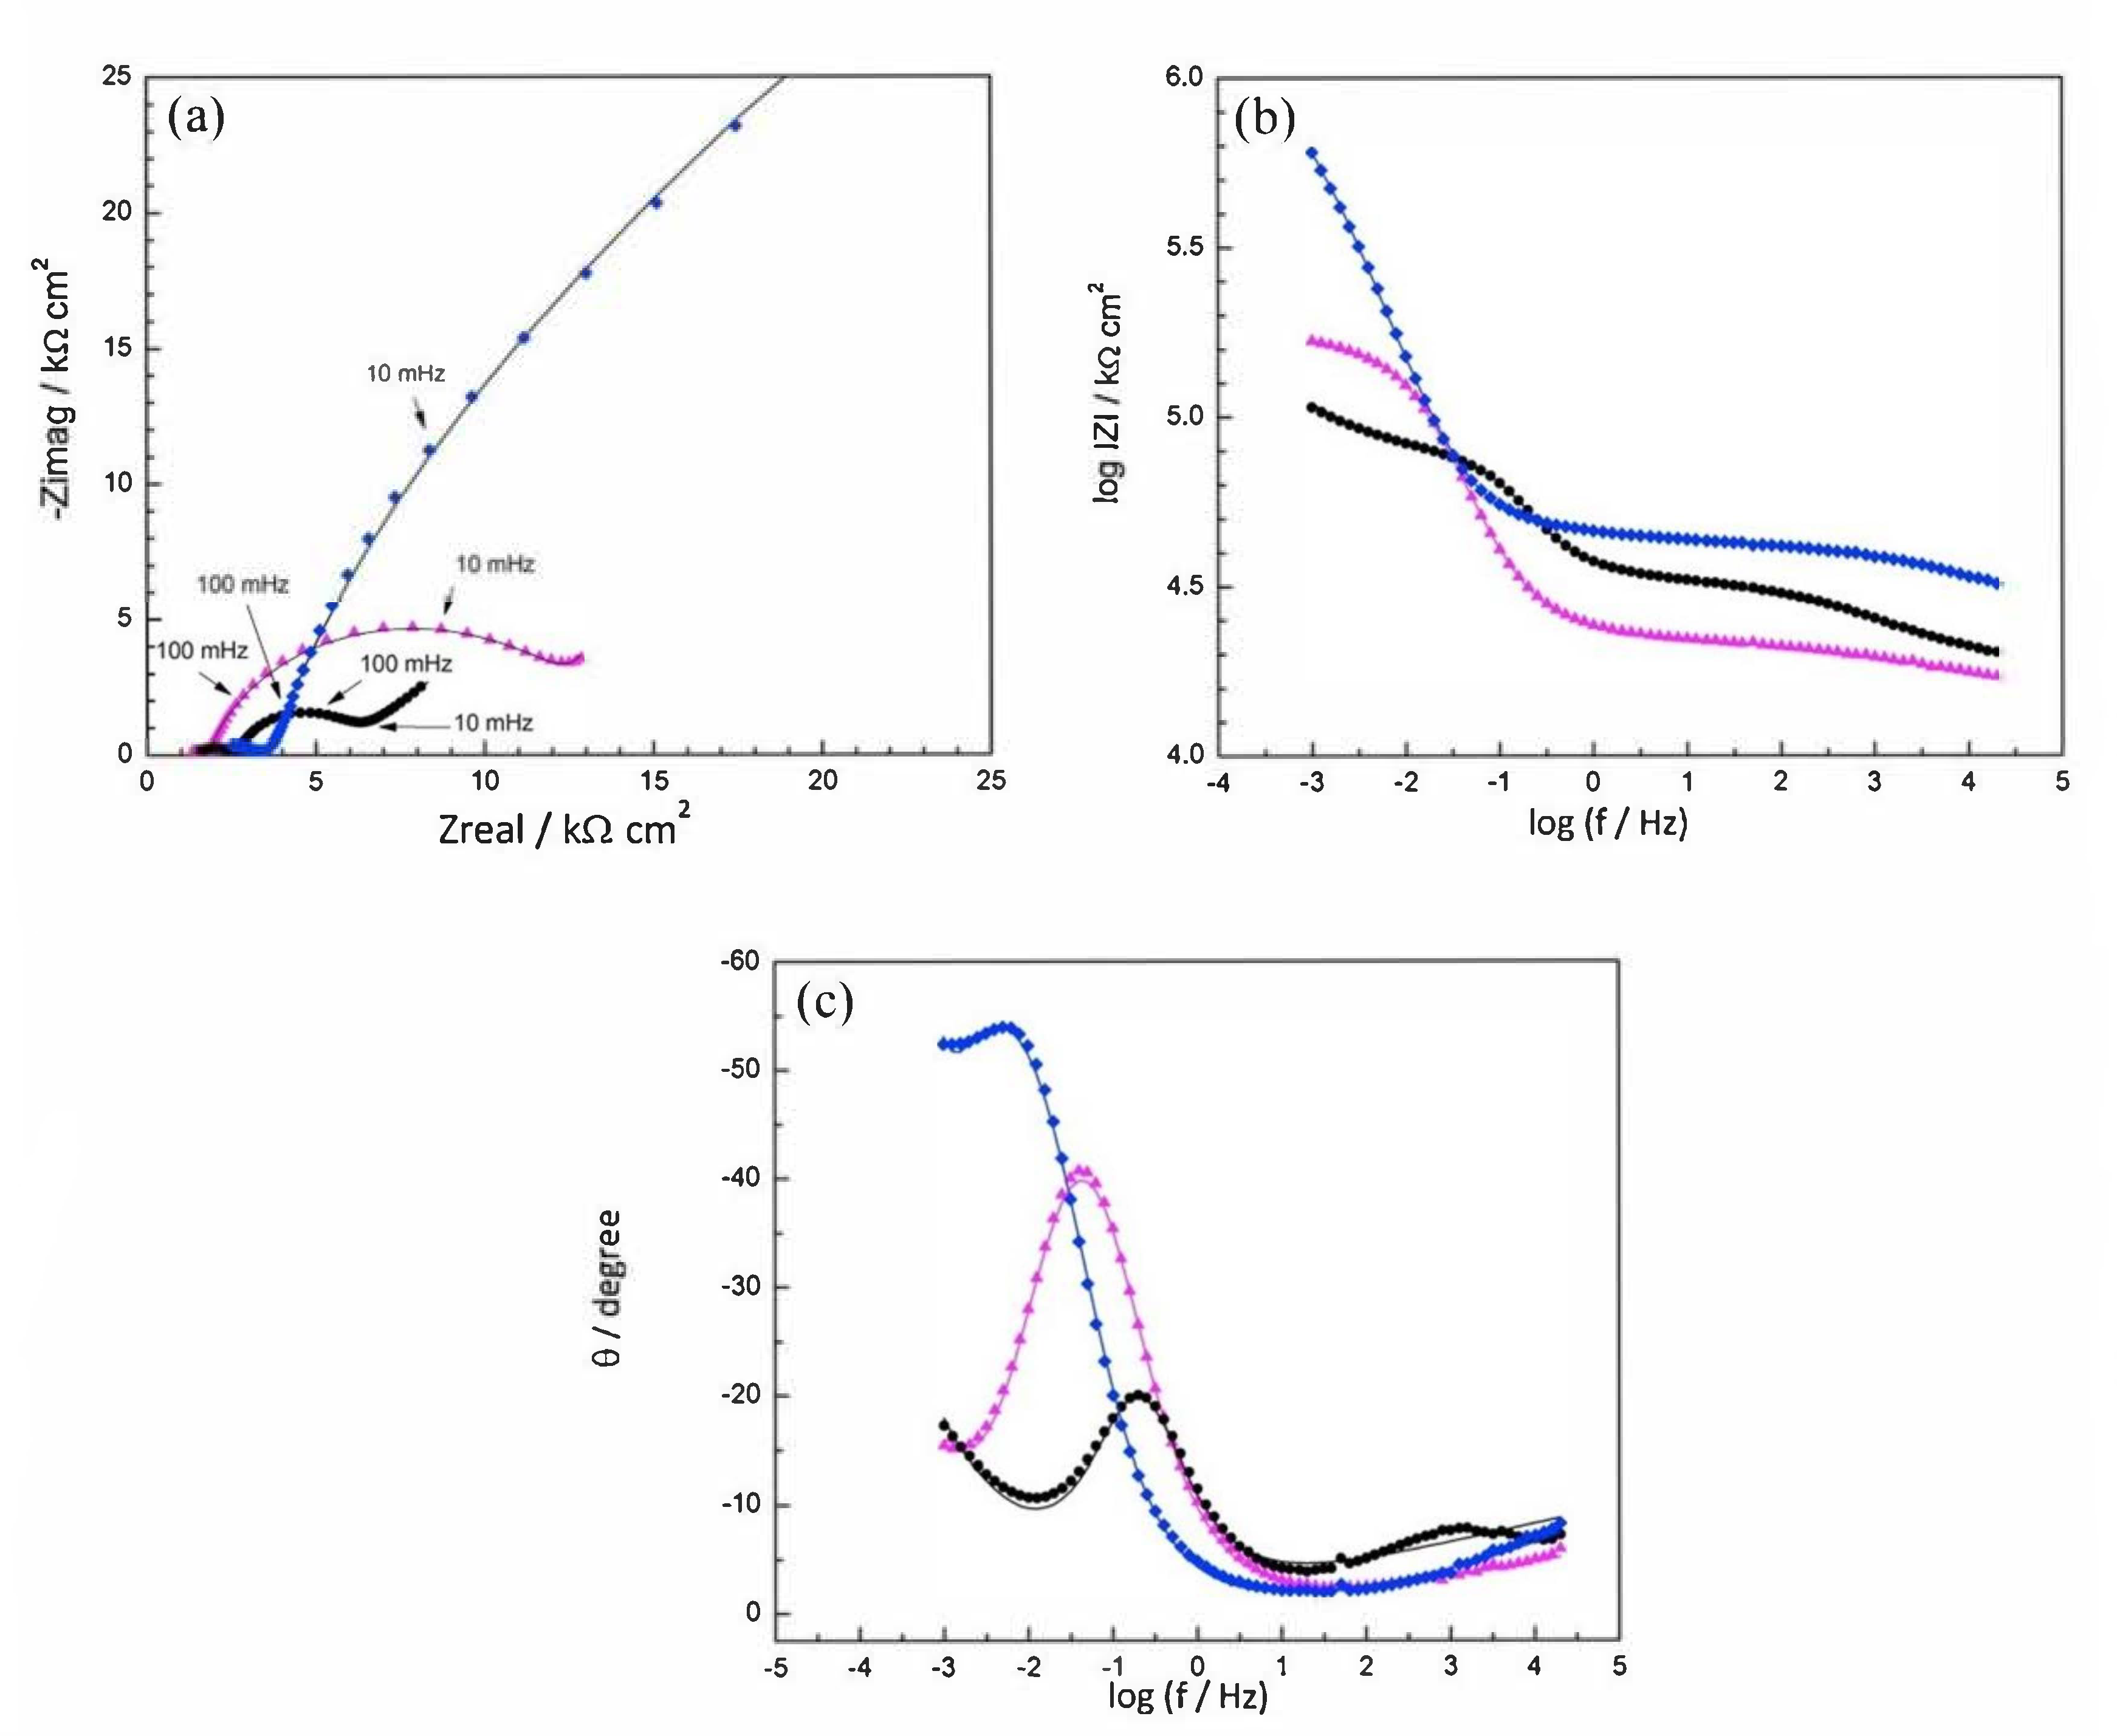
  ), registered after 720 days of exposure. Points represent the experimental EIS data and lines show the fitting results: (a) Nyquist plot, (b) and (c) Bode plots [56]. Reproduced with permission from Yohai, L. et al., Electrochim. Acta; published by Elsevier, 2016.
), Mix B ( ) and Mix C ( ), registered after 720 days of exposure. Points represent the experimental EIS data and lines show the fitting results: (a) Nyquist plot, (b) and (c) Bode plots [56]. Reproduced with permission from Yohai, L. et al., Electrochim. Acta; published by Elsevier, 2016.
), registered after 720 days of exposure. Points represent the experimental EIS data and lines show the fitting results: (a) Nyquist plot, (b) and (c) Bode plots [56]. Reproduced with permission from Yohai, L. et al., Electrochim. Acta; published by Elsevier, 2016.
), Mix B ( ) and Mix C ( ), registered after 720 days of exposure. Points represent the experimental EIS data and lines show the fitting results: (a) Nyquist plot, (b) and (c) Bode plots [56]. Reproduced with permission from Yohai, L. et al., Electrochim. Acta; published by Elsevier, 2016.


| Corrosion Rate | Rp, kΩ cm2 | icorr, µA/cm2 | Mass Loss, µm/Year |
|---|---|---|---|
| Very High | 2.5−0.25 | 10−100 | 100−1000 |
| High | 25−2.5 | 1–10 | 10–100 |
| Low | 250−25 | 0.1–1 | 1–10 |
| Passive | >250 | <0.1 | <1 |
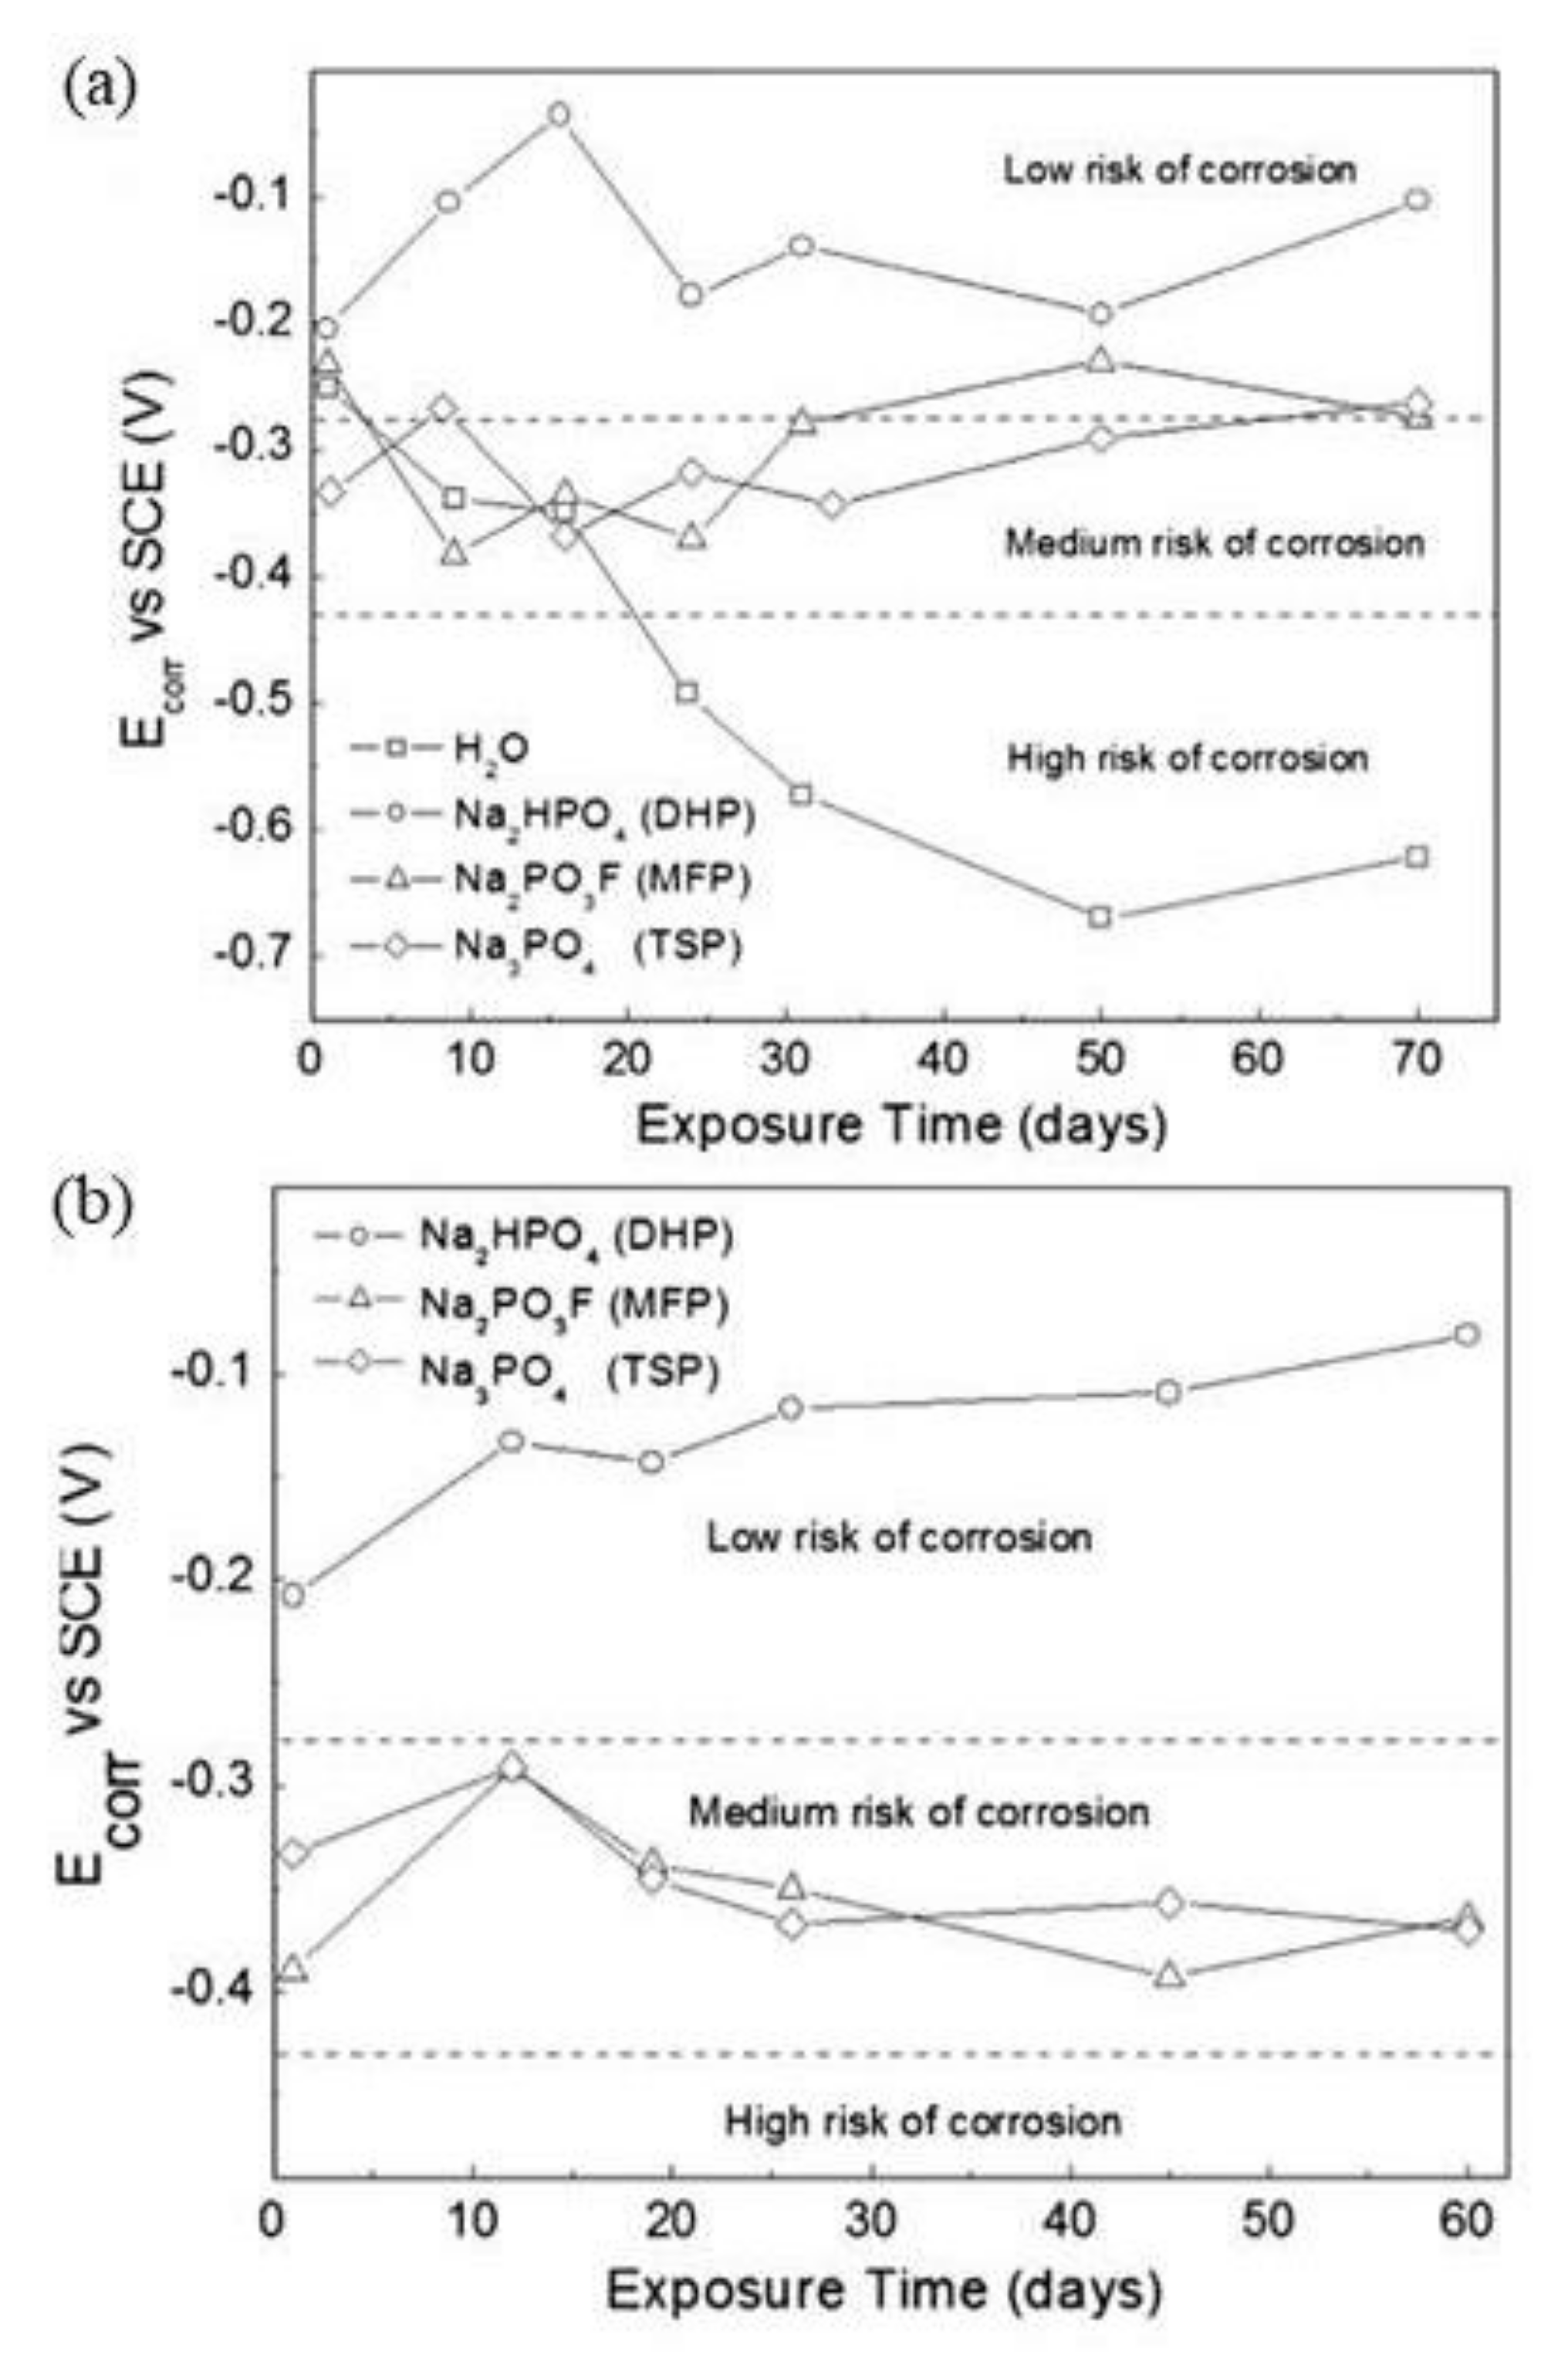
| Phosphate Inhibitor | Electrolyte | Ecorr (mVSCE) | icorr (μA/cm2) | Reference |
|---|---|---|---|---|
| TSP | SCP solution | −519 | <0.1 | [8] |
| 0.1M NaCl 0.1M NaCl + TSP | −450 −350 | 0.1 0.07 | [38] | |
| Blank solution (SCP) SCP + 0.5M NaCl + 0.5M TSP | −500 −250 | 5600 700 | [45] | |
| Portland mortar Portland mortar + Cl− Portland mortar + Cl− + TSP | −550 −400 −500 | 1300 1300 520 | [56] | |
| Portland concrete | −100 | <0.1 | [57] | |
| Portland mortar | −650 | 5200 | [58] | |
| Blank solution (SCP) SCP + Cl−, [Cl−]/[OH−] = 3 SCP + Cl− + PO43−, [PO43−]/[Cl−] = 1 | −208 −237 −263 | 0.006 14.0 0.02 | [60] | |
| Blank solution (SCP) SCP + TSP | −200 −500 | 10.0 0.1 | [62] | |
| Portland mortar + TSP | −246 | 0.1 | [63] | |
| Blank solution (SCP) SCP + Cl−, 3% NaCl SCP + Cl− + TSP | −180 −540 −430 | 0.1 10 1.0 | [66] | |
| TSPP | SCP + Cl− + TSPP | −500 | 9 | [66] |
| HEDP | SCP + Cl− + HEDP | −520 | 9 | [66] |
| MFP | Portland concrete + 0.6% Cl− Carbonated Portland concrete + 0.6% Cl− | − − | <0.1 >0.1 | [15] |
| Portland mortar + (0.5−0.8%) Cl− | −450 | >0.1 | [61] |
| CaO | SiO2 | Al2O3 | Fe2O3 | MgO | MnO | TiO2 | K2O | Na2O | SO3 | LOI * | IR ** |
|---|---|---|---|---|---|---|---|---|---|---|---|
| 57.84 | 20.33 | 3.40 | 4.68 | 1.51 | 0.10 | 0.09 | 0.72 | 0.51 | 7.26 | 3.42 | 1.23 |
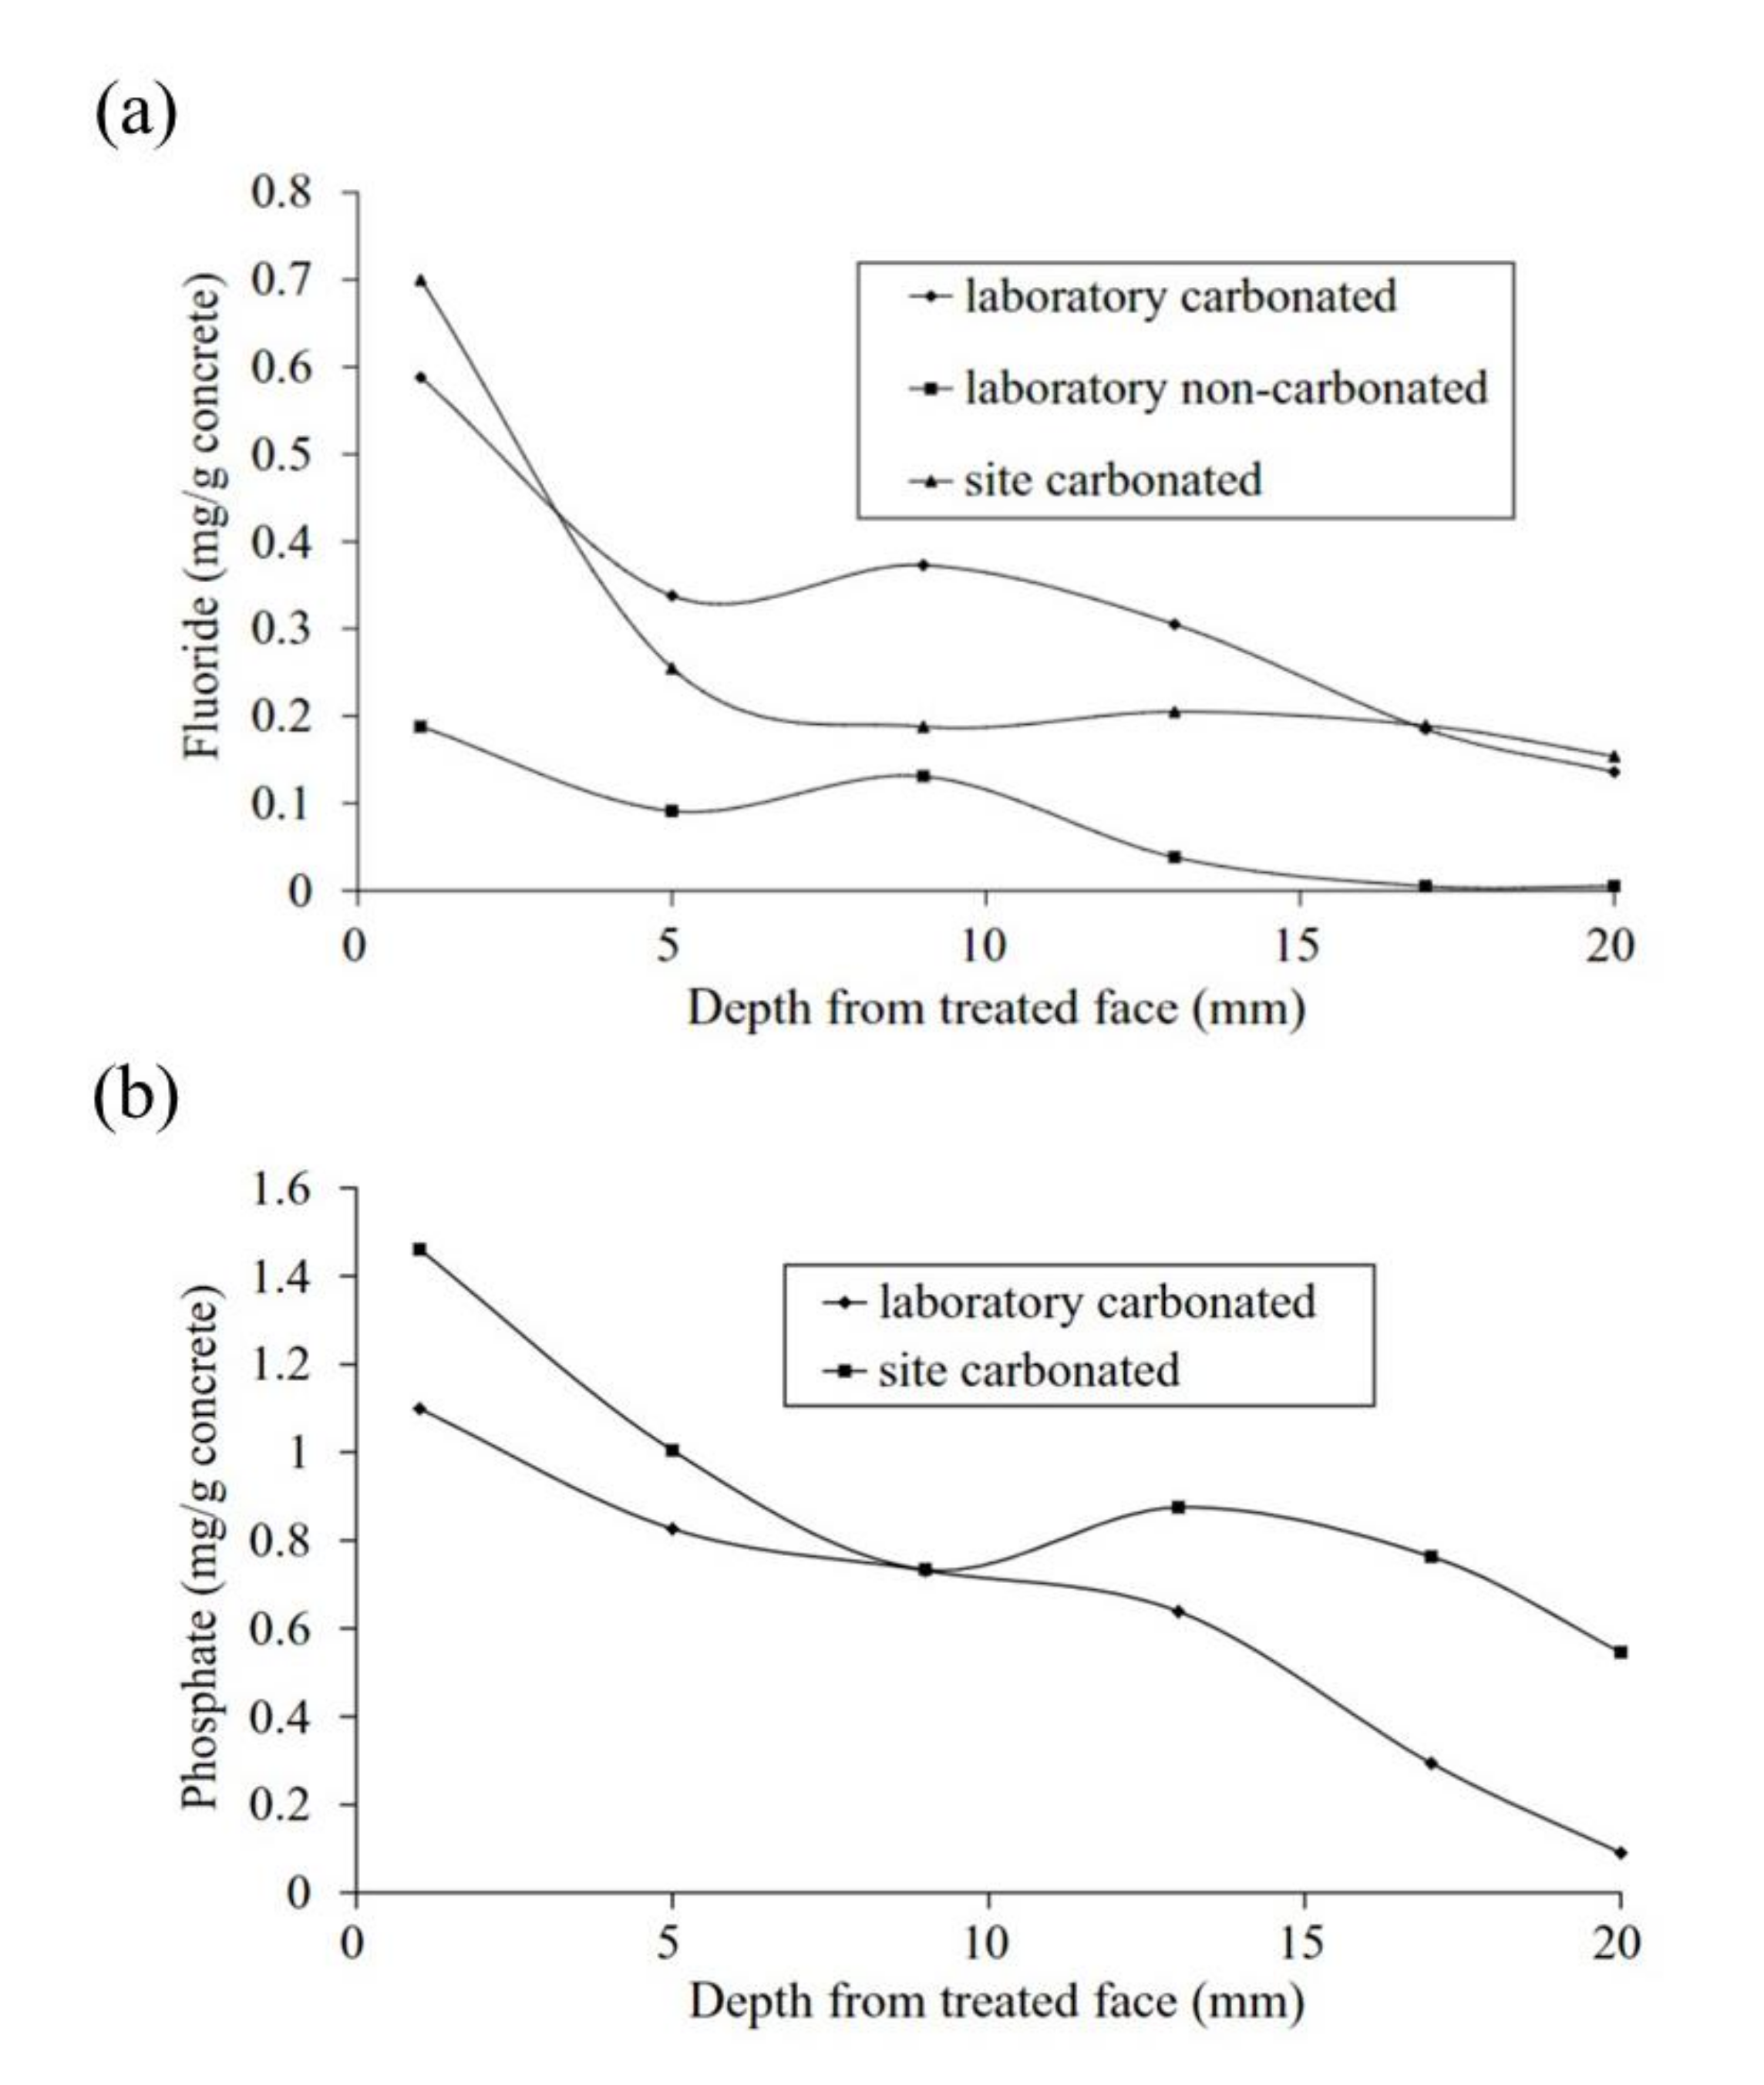
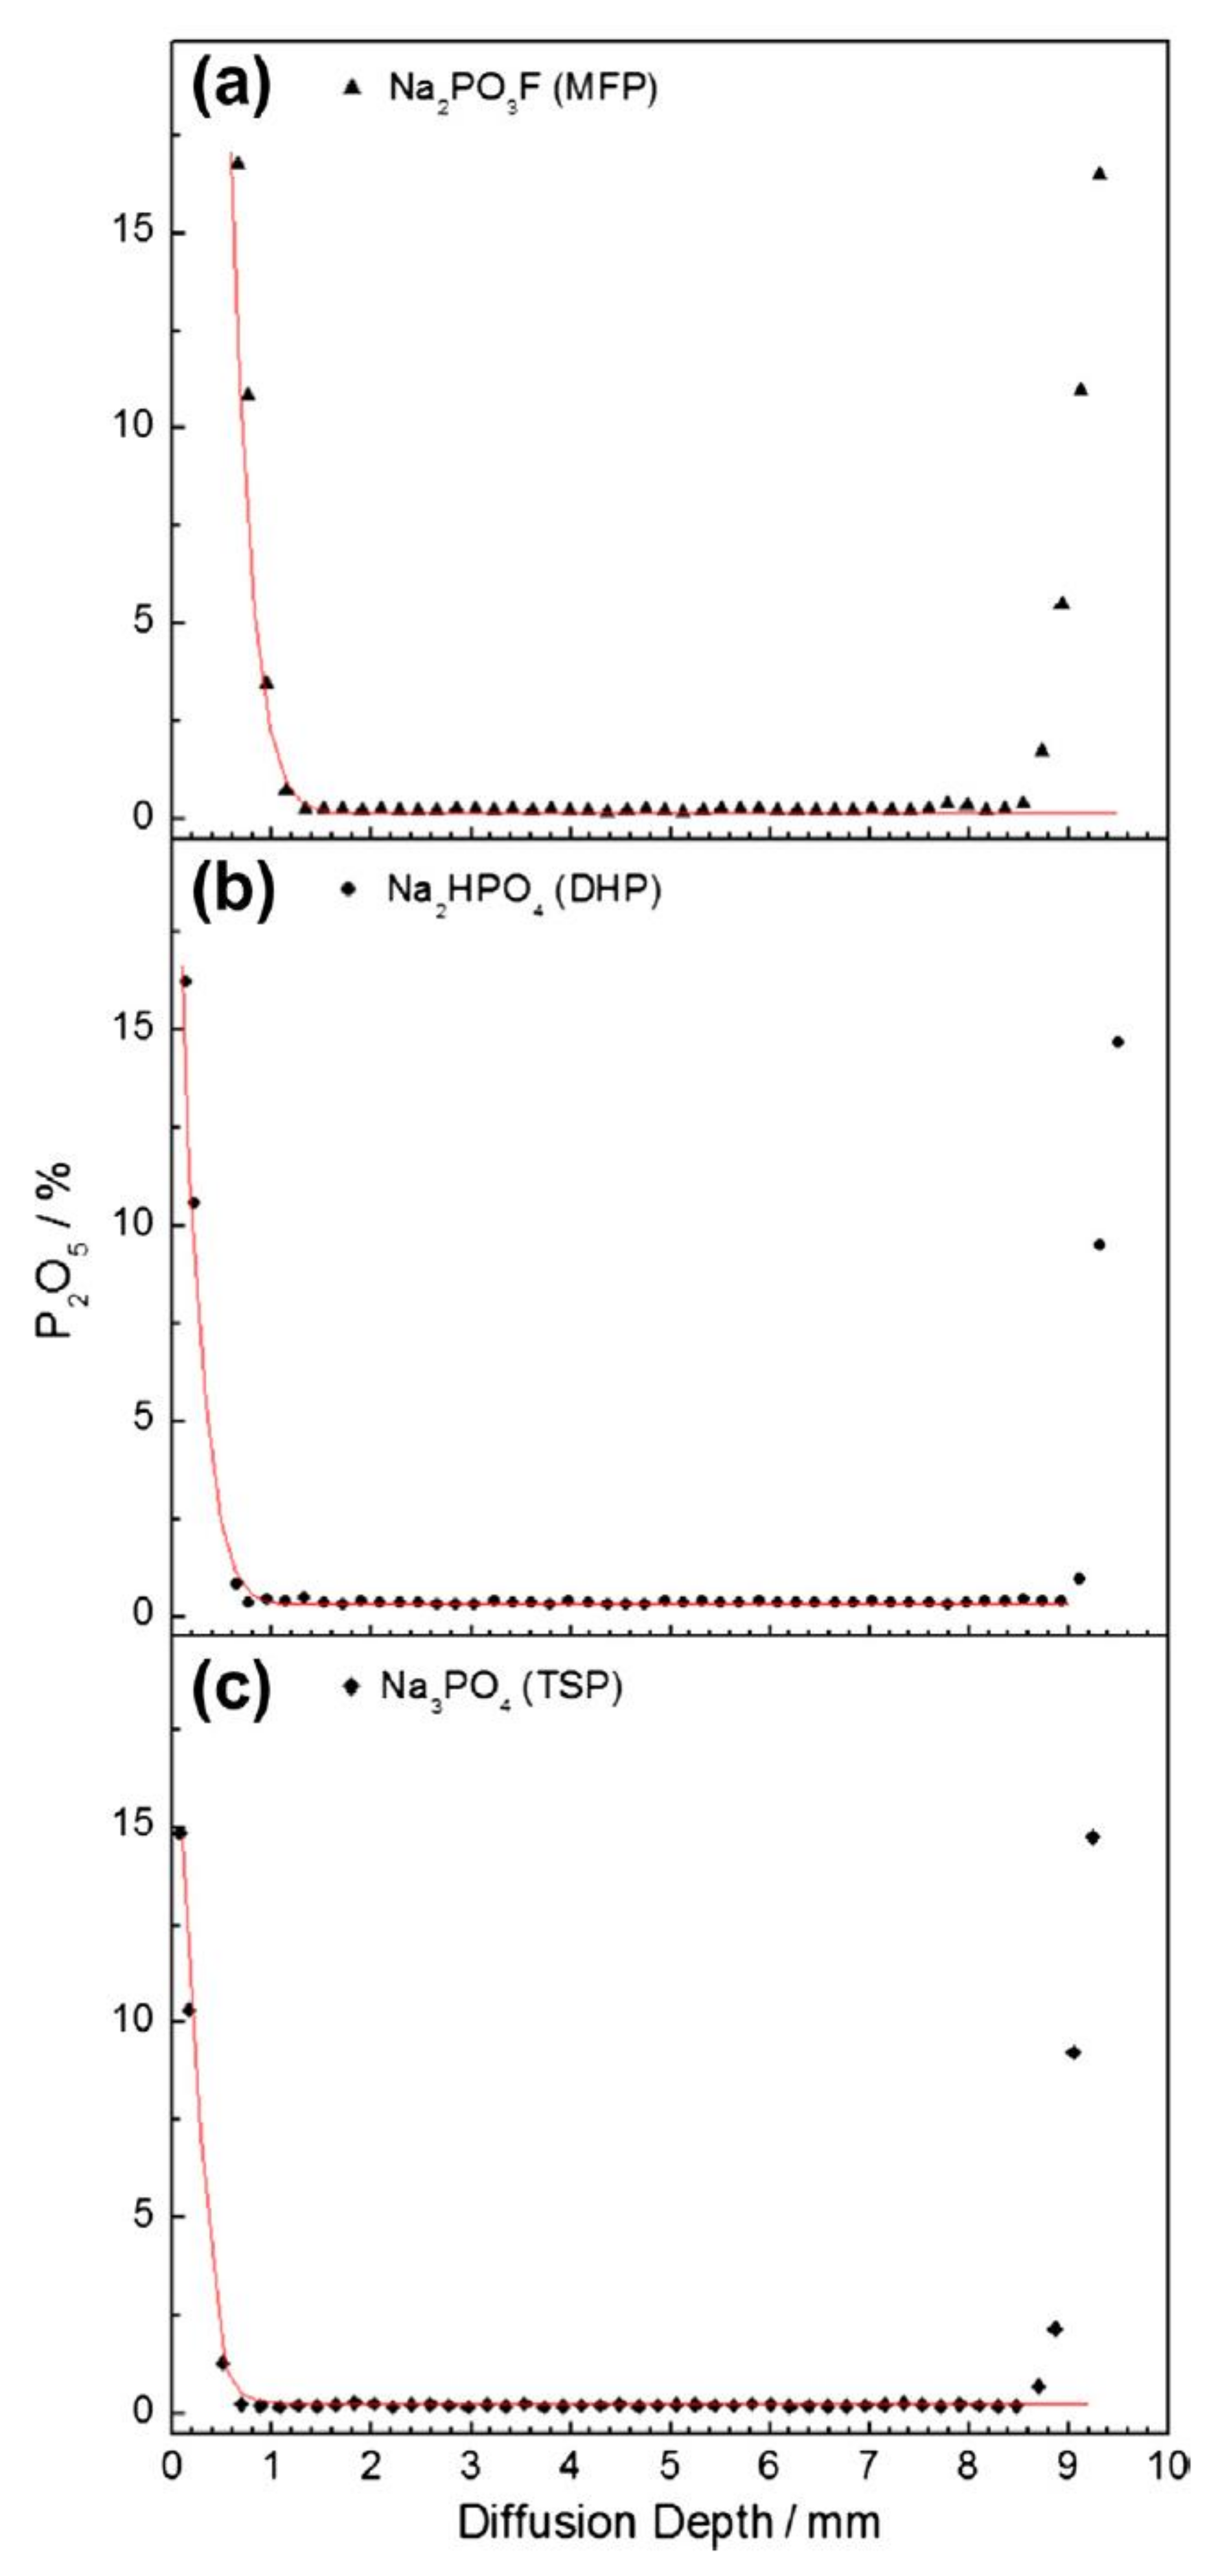
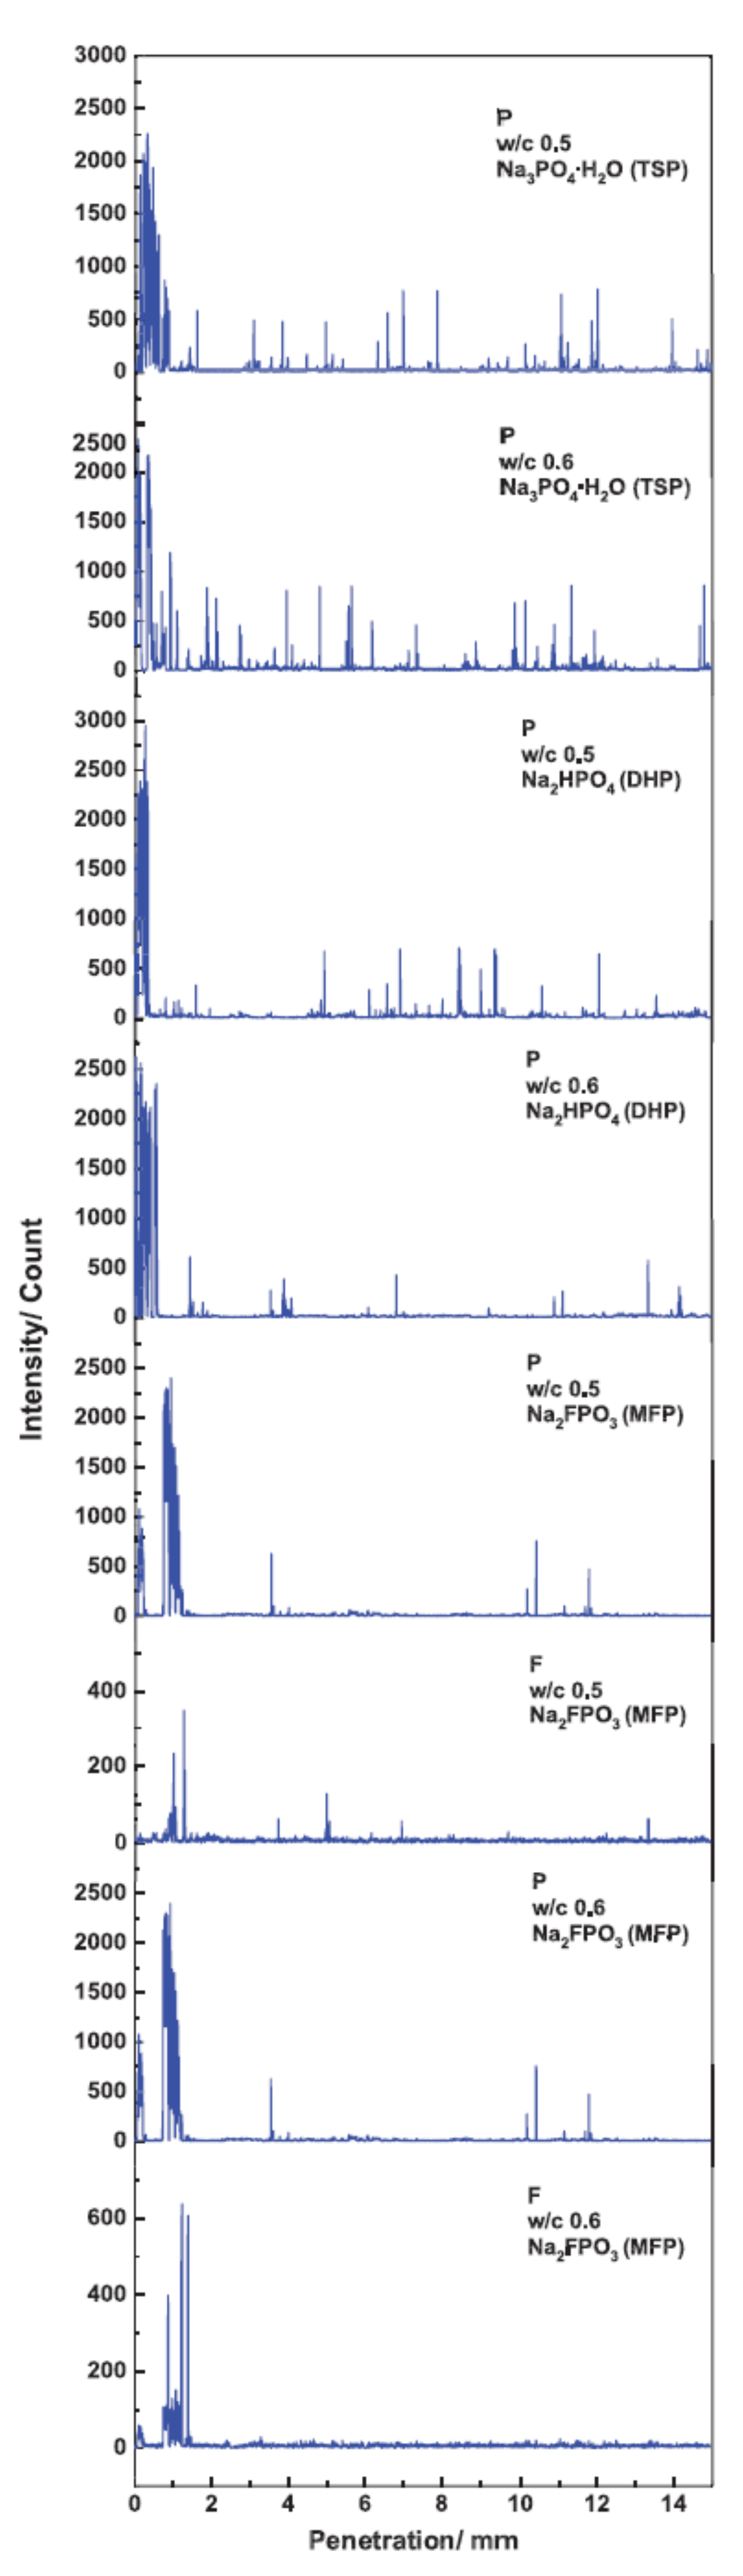
| Penetration Depth (mm) | ||||||
|---|---|---|---|---|---|---|
| Element | TSP w/c 0.5 | TSP w/c 0.6 | DHP w/c 0.5 | DHP w/c 0.6 | MFP w/c 0.5 | MFP w/c 0.6 |
| P | 0.88 | 1.10 | 0.36 | 0.64 | 1.33 | 1.23 |
| F | – | – | – | – | 1.36 | 1.40 |
Publisher’s Note: MDPI stays neutral with regard to jurisdictional claims in published maps and institutional affiliations. |
© 2021 by the authors. Licensee MDPI, Basel, Switzerland. This article is an open access article distributed under the terms and conditions of the Creative Commons Attribution (CC BY) license (https://creativecommons.org/licenses/by/4.0/).
Share and Cite
Bastidas, D.M.; Martin, U.; Bastidas, J.M.; Ress, J. Corrosion Inhibition Mechanism of Steel Reinforcements in Mortar Using Soluble Phosphates: A Critical Review. Materials 2021, 14, 6168. https://doi.org/10.3390/ma14206168
Bastidas DM, Martin U, Bastidas JM, Ress J. Corrosion Inhibition Mechanism of Steel Reinforcements in Mortar Using Soluble Phosphates: A Critical Review. Materials. 2021; 14(20):6168. https://doi.org/10.3390/ma14206168
Chicago/Turabian StyleBastidas, David M., Ulises Martin, Jose M. Bastidas, and Jacob Ress. 2021. "Corrosion Inhibition Mechanism of Steel Reinforcements in Mortar Using Soluble Phosphates: A Critical Review" Materials 14, no. 20: 6168. https://doi.org/10.3390/ma14206168
APA StyleBastidas, D. M., Martin, U., Bastidas, J. M., & Ress, J. (2021). Corrosion Inhibition Mechanism of Steel Reinforcements in Mortar Using Soluble Phosphates: A Critical Review. Materials, 14(20), 6168. https://doi.org/10.3390/ma14206168