Author Contributions
Conceptualization, Z.-N.J. and G.-H.X.; Data curation, Z.-N.J.; D.L.; and R.-G.L.; Formal analysis, Z.-N.J., and R.-G.L.; Funding acquisition, R.-G.L. and G.-H.X.; Investigation, R.-G.L.; Z.-N.J.; and G.-H.X.; Project administration, R.-G.L.; Resources, R.-G.L. and G.-H.X.; Supervision, R.-G.L. and G.-H.X.; Validation, R.-G.L. and G.-H.X.; Writing—original draft, Z.-N.J.; Writing—review & editing, Z.-N.J. and G.-H.X. All authors have read and agreed to the published version of the manuscript.
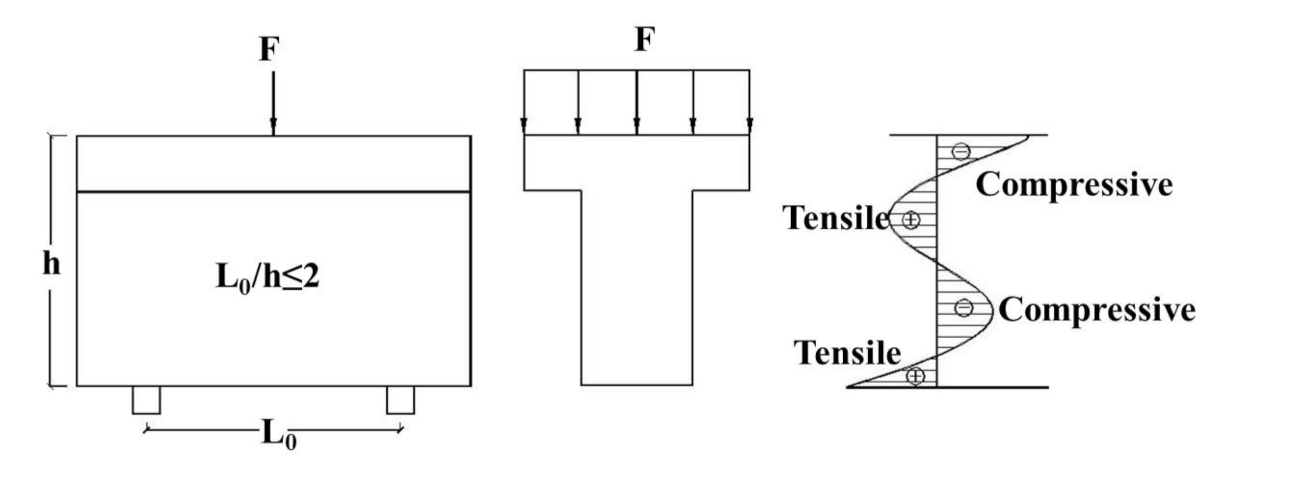
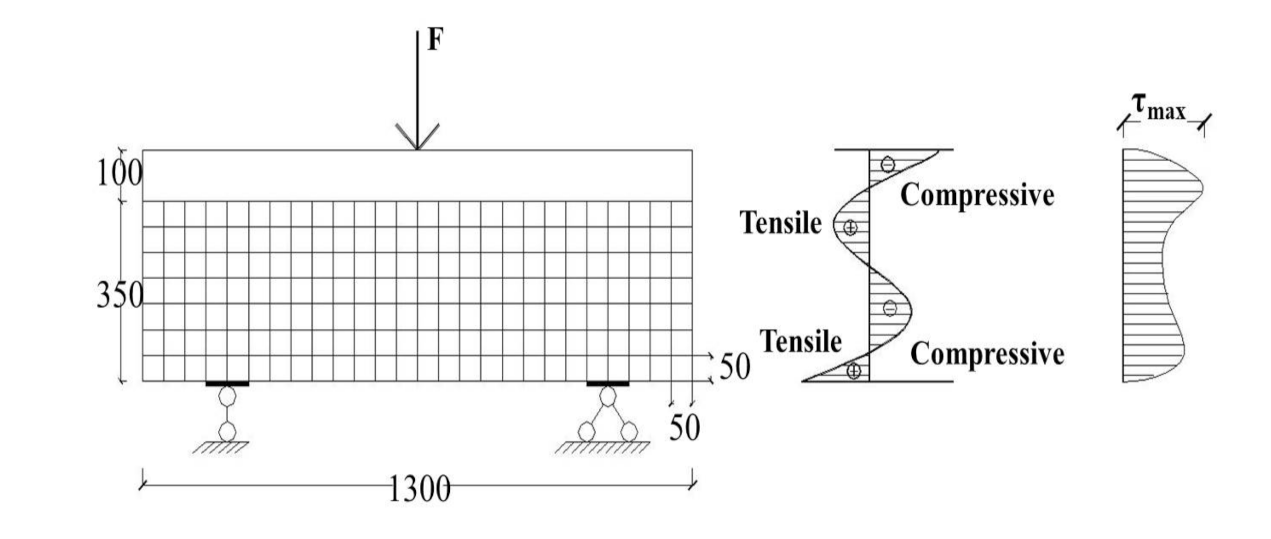
Figure 1.
Strain distribution on mid-span section of deep T-cross section beam. Note: F: Load, h: the height of T beam, L0: clear span of T beam.
Figure 1.
Strain distribution on mid-span section of deep T-cross section beam. Note: F: Load, h: the height of T beam, L0: clear span of T beam.
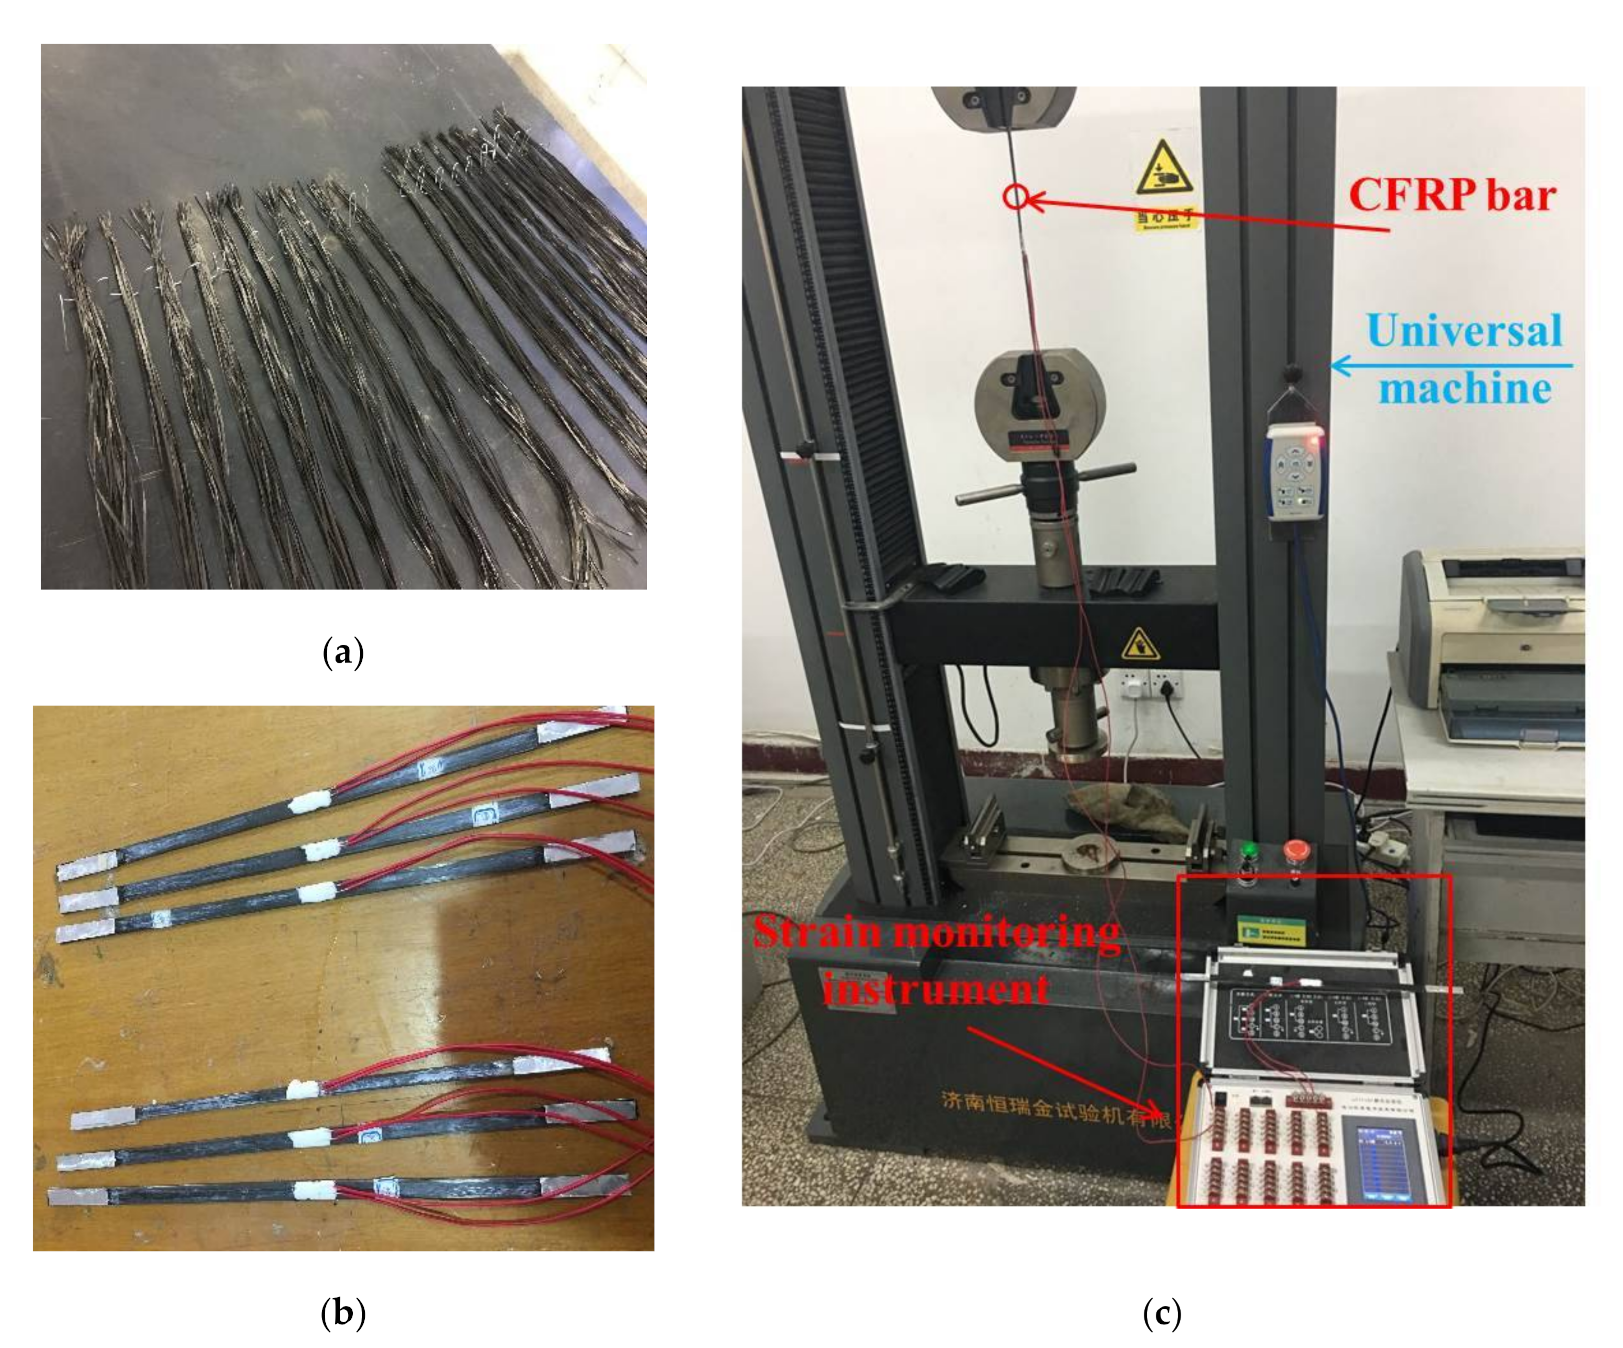
Figure 2.
Original materials and CFRP bars test: (a) Carbon fiber filaments; (b) Manufactured CFRP bars: (c) Setup in tensile tests.
Figure 2.
Original materials and CFRP bars test: (a) Carbon fiber filaments; (b) Manufactured CFRP bars: (c) Setup in tensile tests.
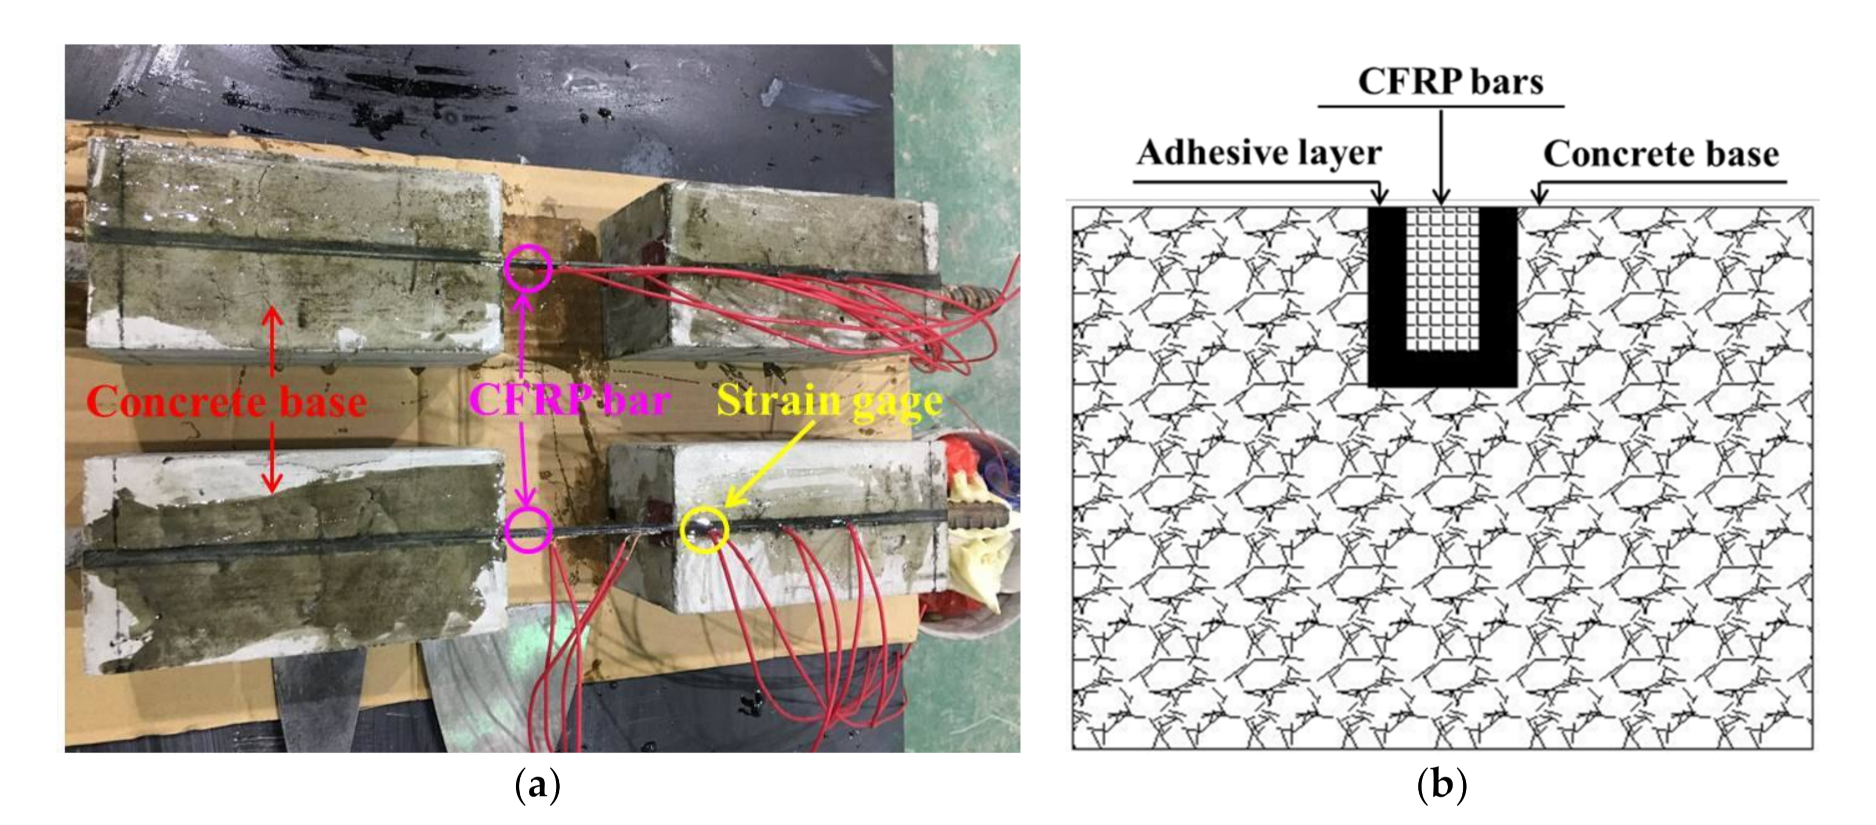
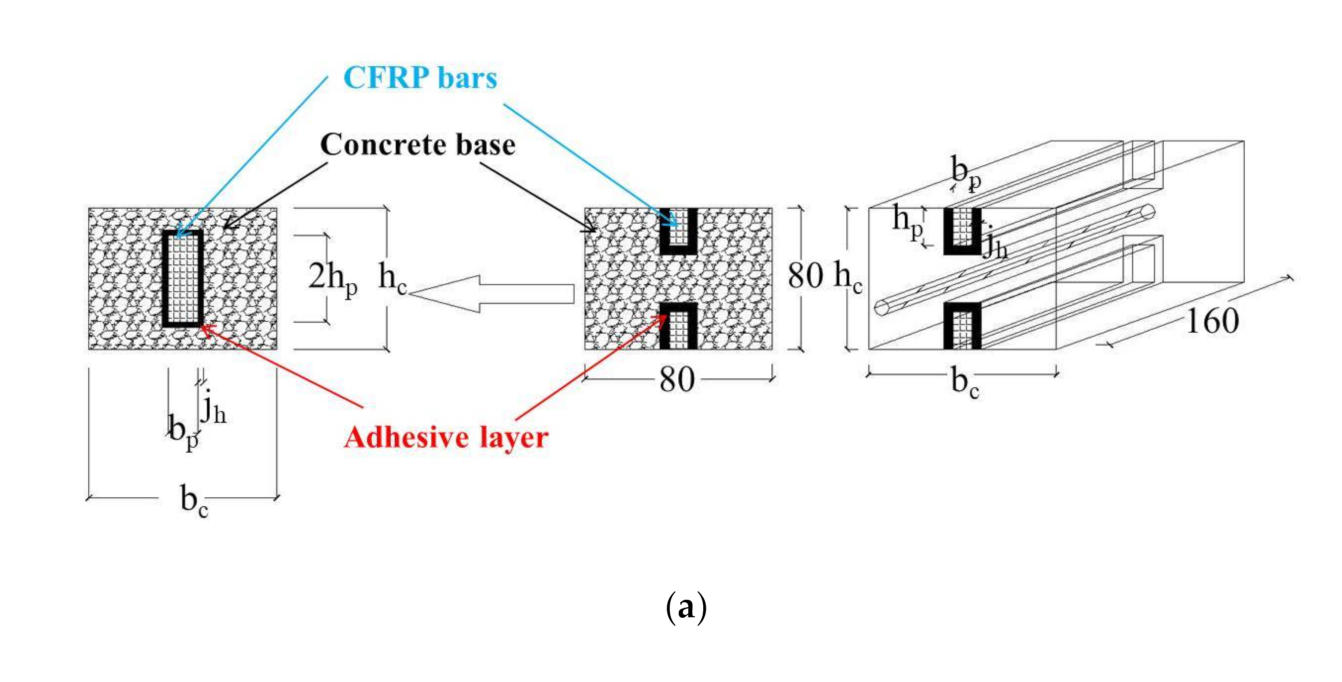
Figure 3.
The Optimization coefficient of adhesive layer thickness: (a) Specimens; (b) Schematic diagram of cross-section by NSM.
Figure 3.
The Optimization coefficient of adhesive layer thickness: (a) Specimens; (b) Schematic diagram of cross-section by NSM.
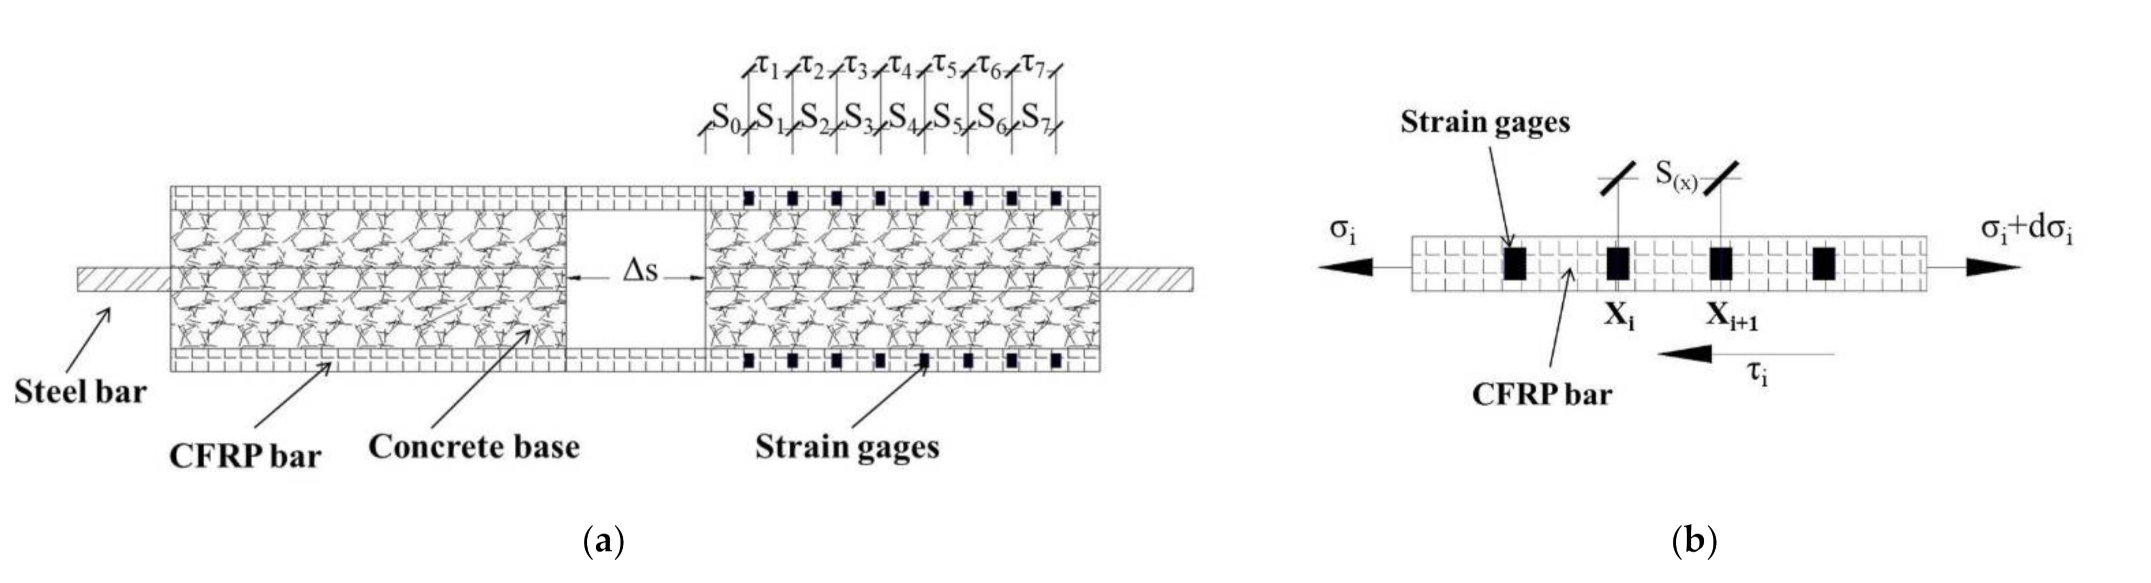
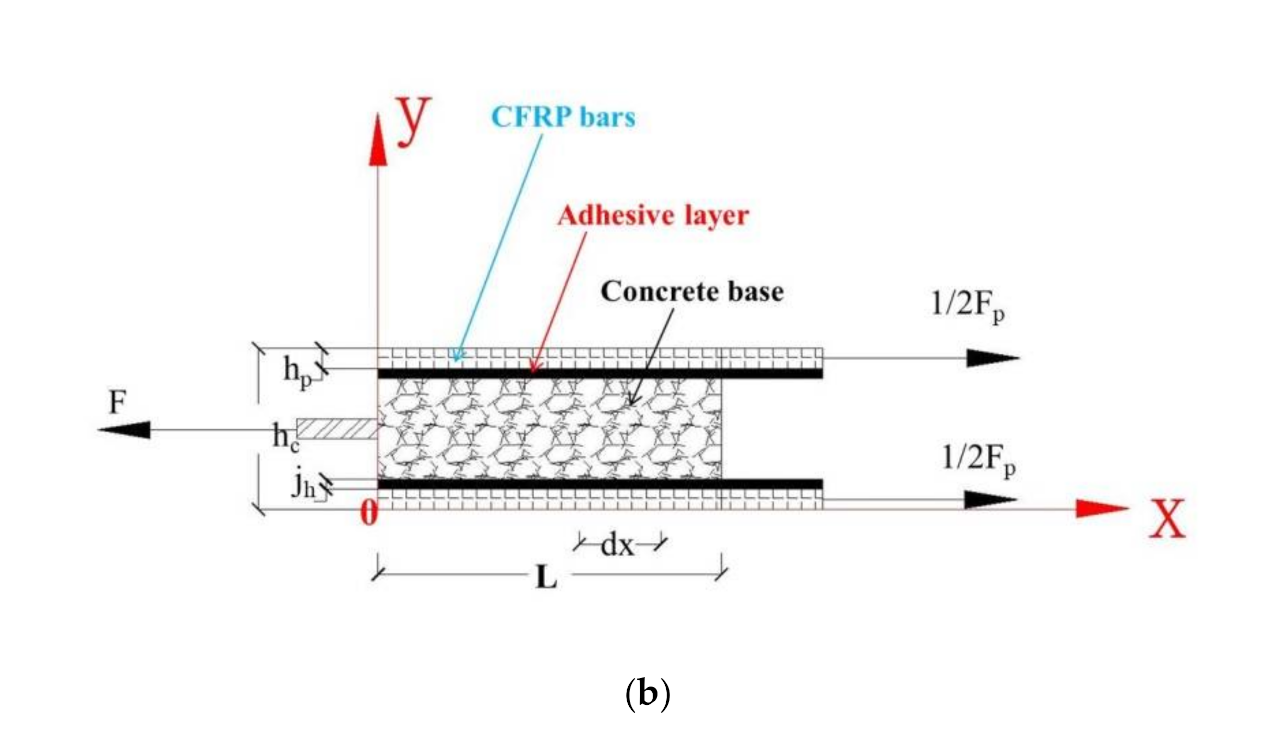
Figure 4.
Distribution of strain gages on bonding slip specimen: (a) Layout of strain gauges in pull-out tests; (b) Schematic diagram of free body.
Figure 4.
Distribution of strain gages on bonding slip specimen: (a) Layout of strain gauges in pull-out tests; (b) Schematic diagram of free body.
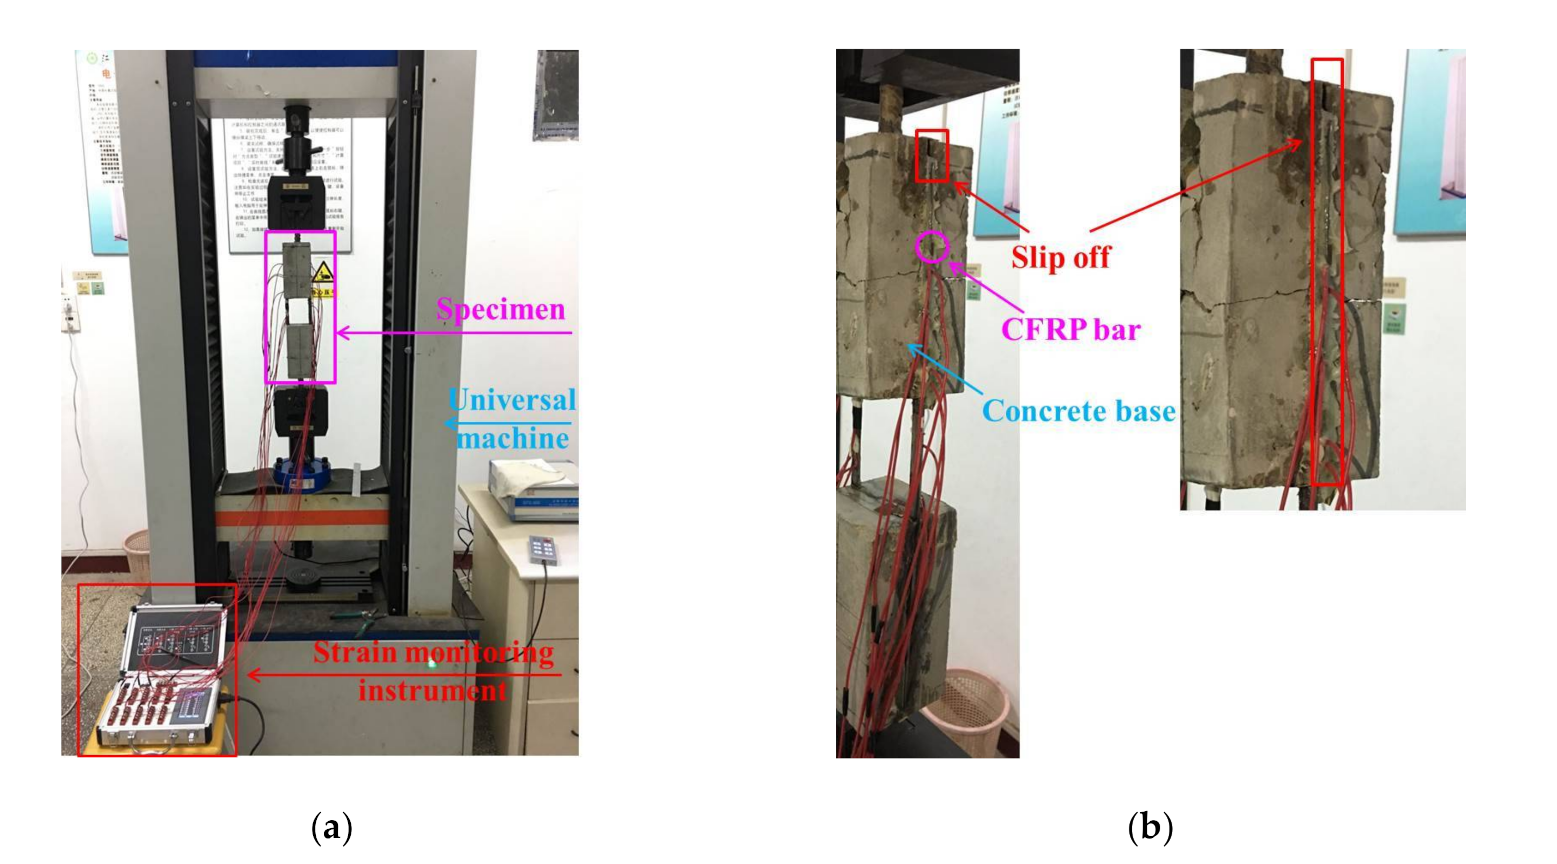
Figure 5.
Test details in pull-out tests: (a) Setup and specimen; (b) Failed specimen.
Figure 5.
Test details in pull-out tests: (a) Setup and specimen; (b) Failed specimen.
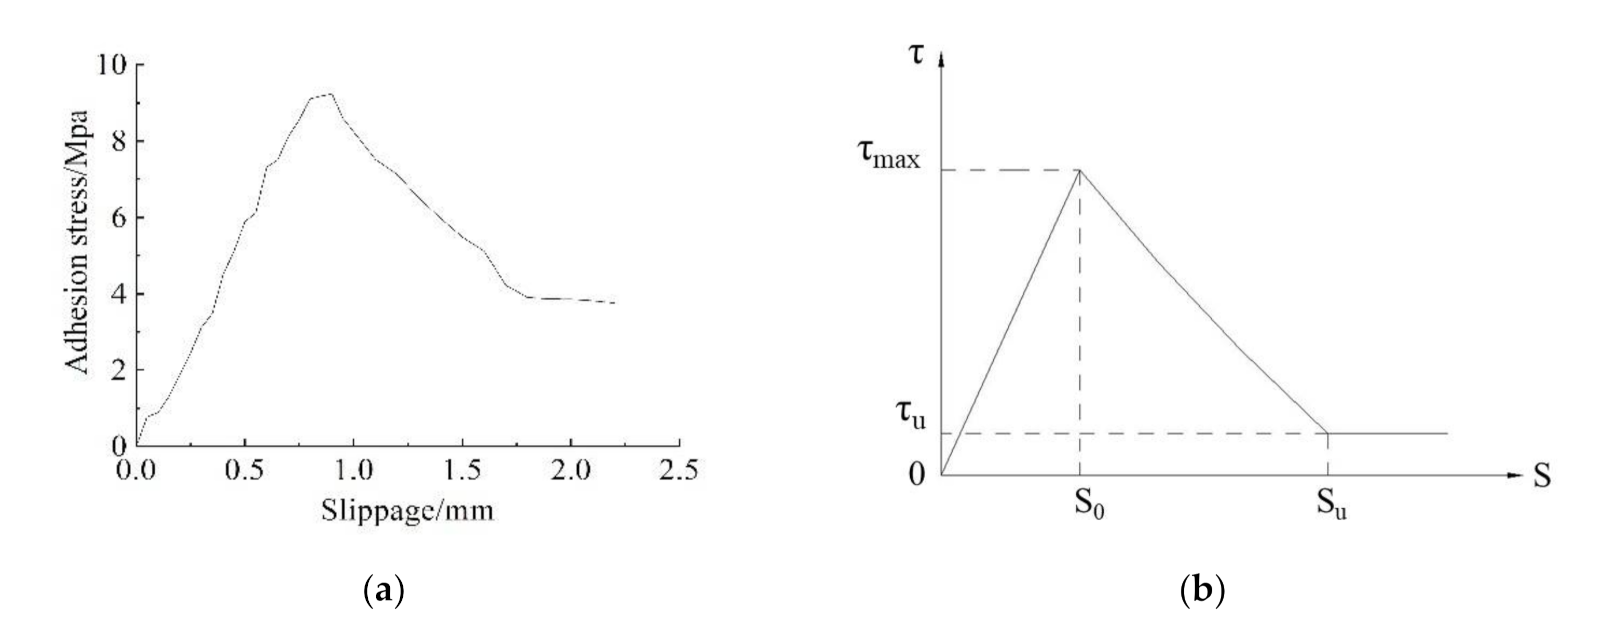
Figure 6.
Relationship between bond stress and slip at interface: (a) Measured bond stress vs. slip curve; (b) Simplified bond stress vs. slip law.
Figure 6.
Relationship between bond stress and slip at interface: (a) Measured bond stress vs. slip curve; (b) Simplified bond stress vs. slip law.
Figure 7.
Interface bond model: (a) Mechanical equivalent model; (b) Boundary conditions model.
Figure 7.
Interface bond model: (a) Mechanical equivalent model; (b) Boundary conditions model.
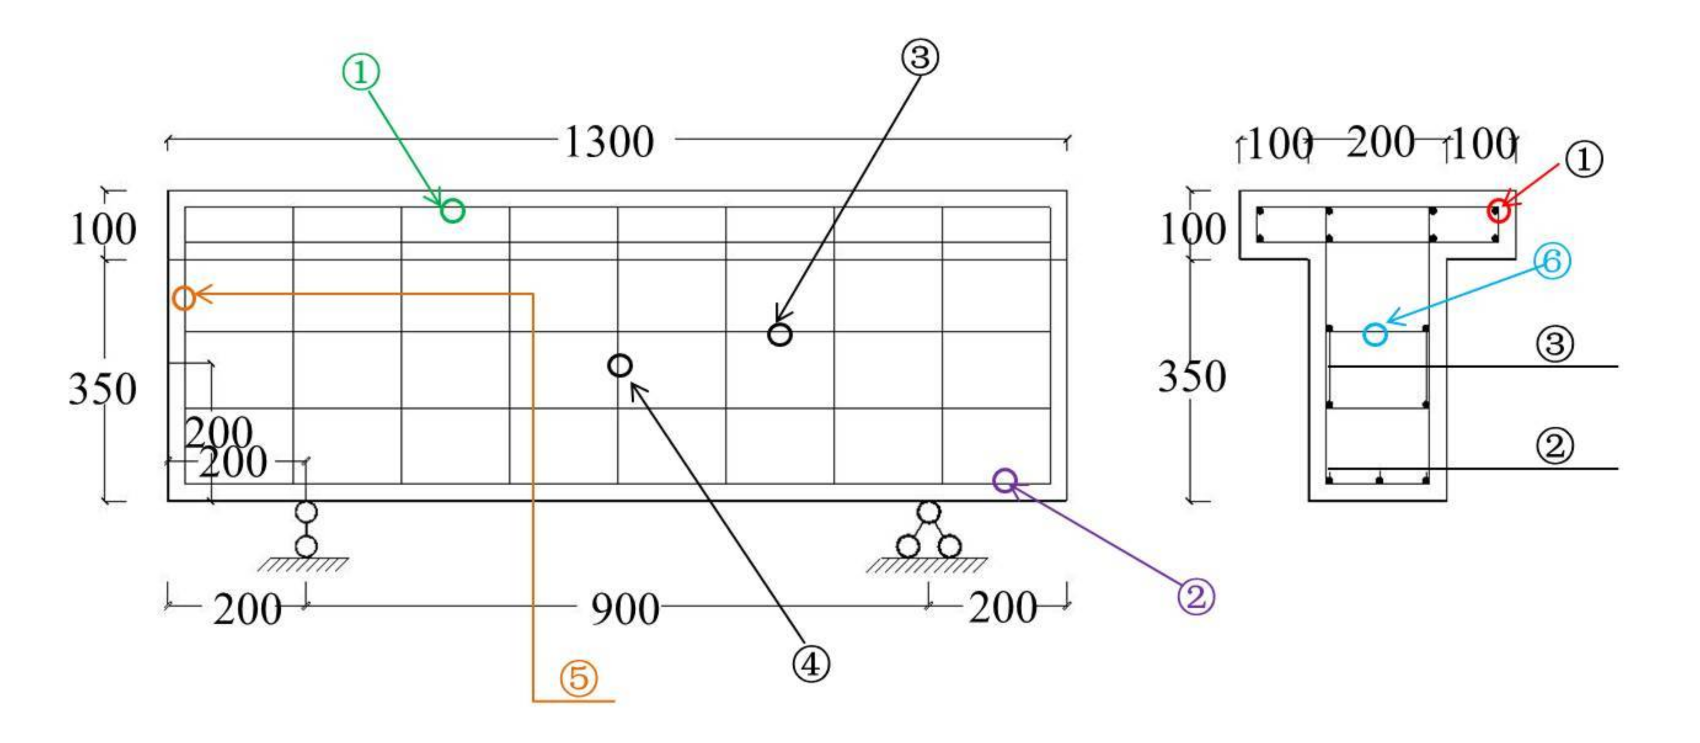
Figure 8.
Layout of deep T-beam. Note: Size unit: mm.
Figure 8.
Layout of deep T-beam. Note: Size unit: mm.
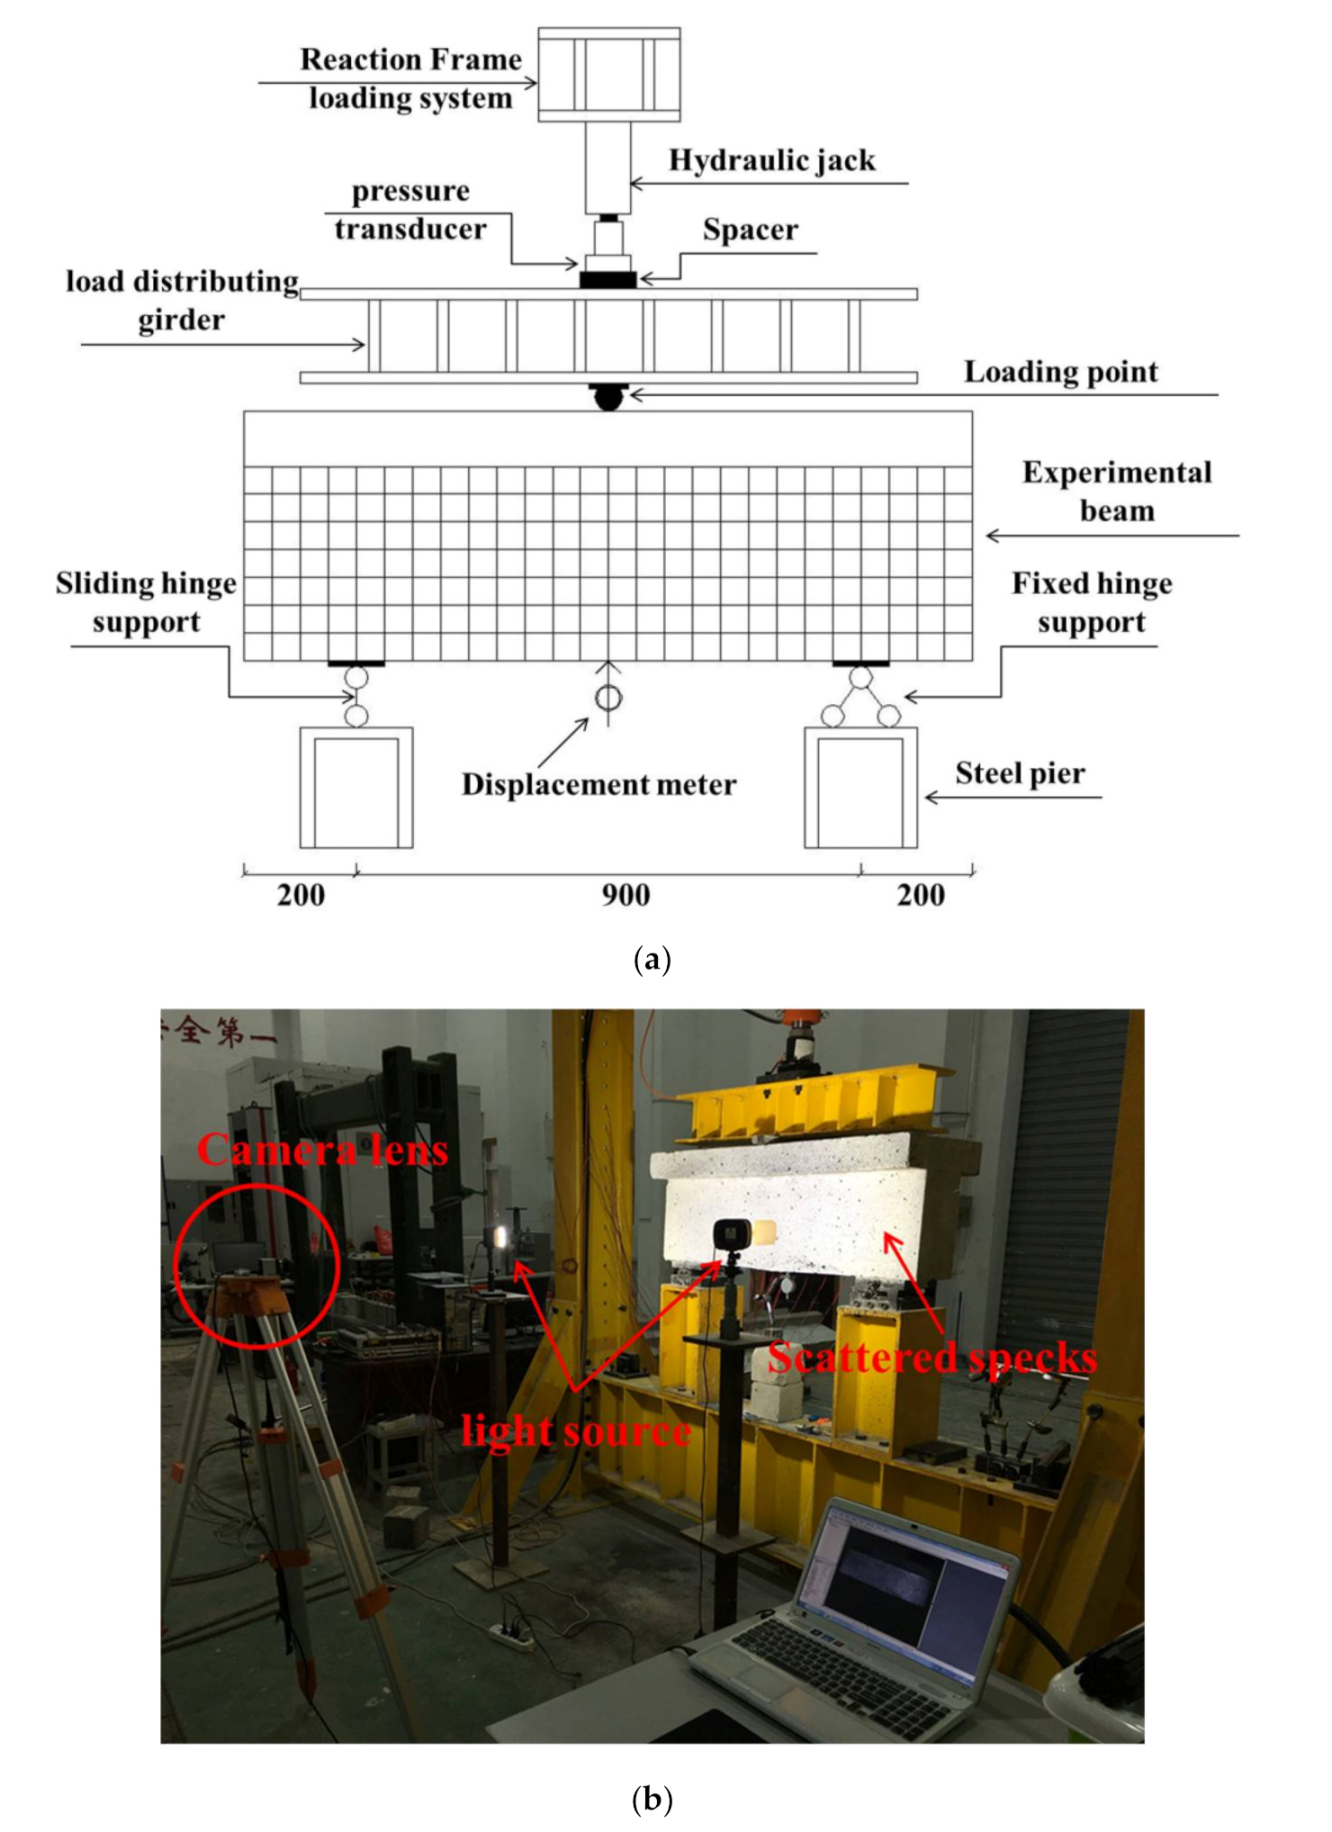
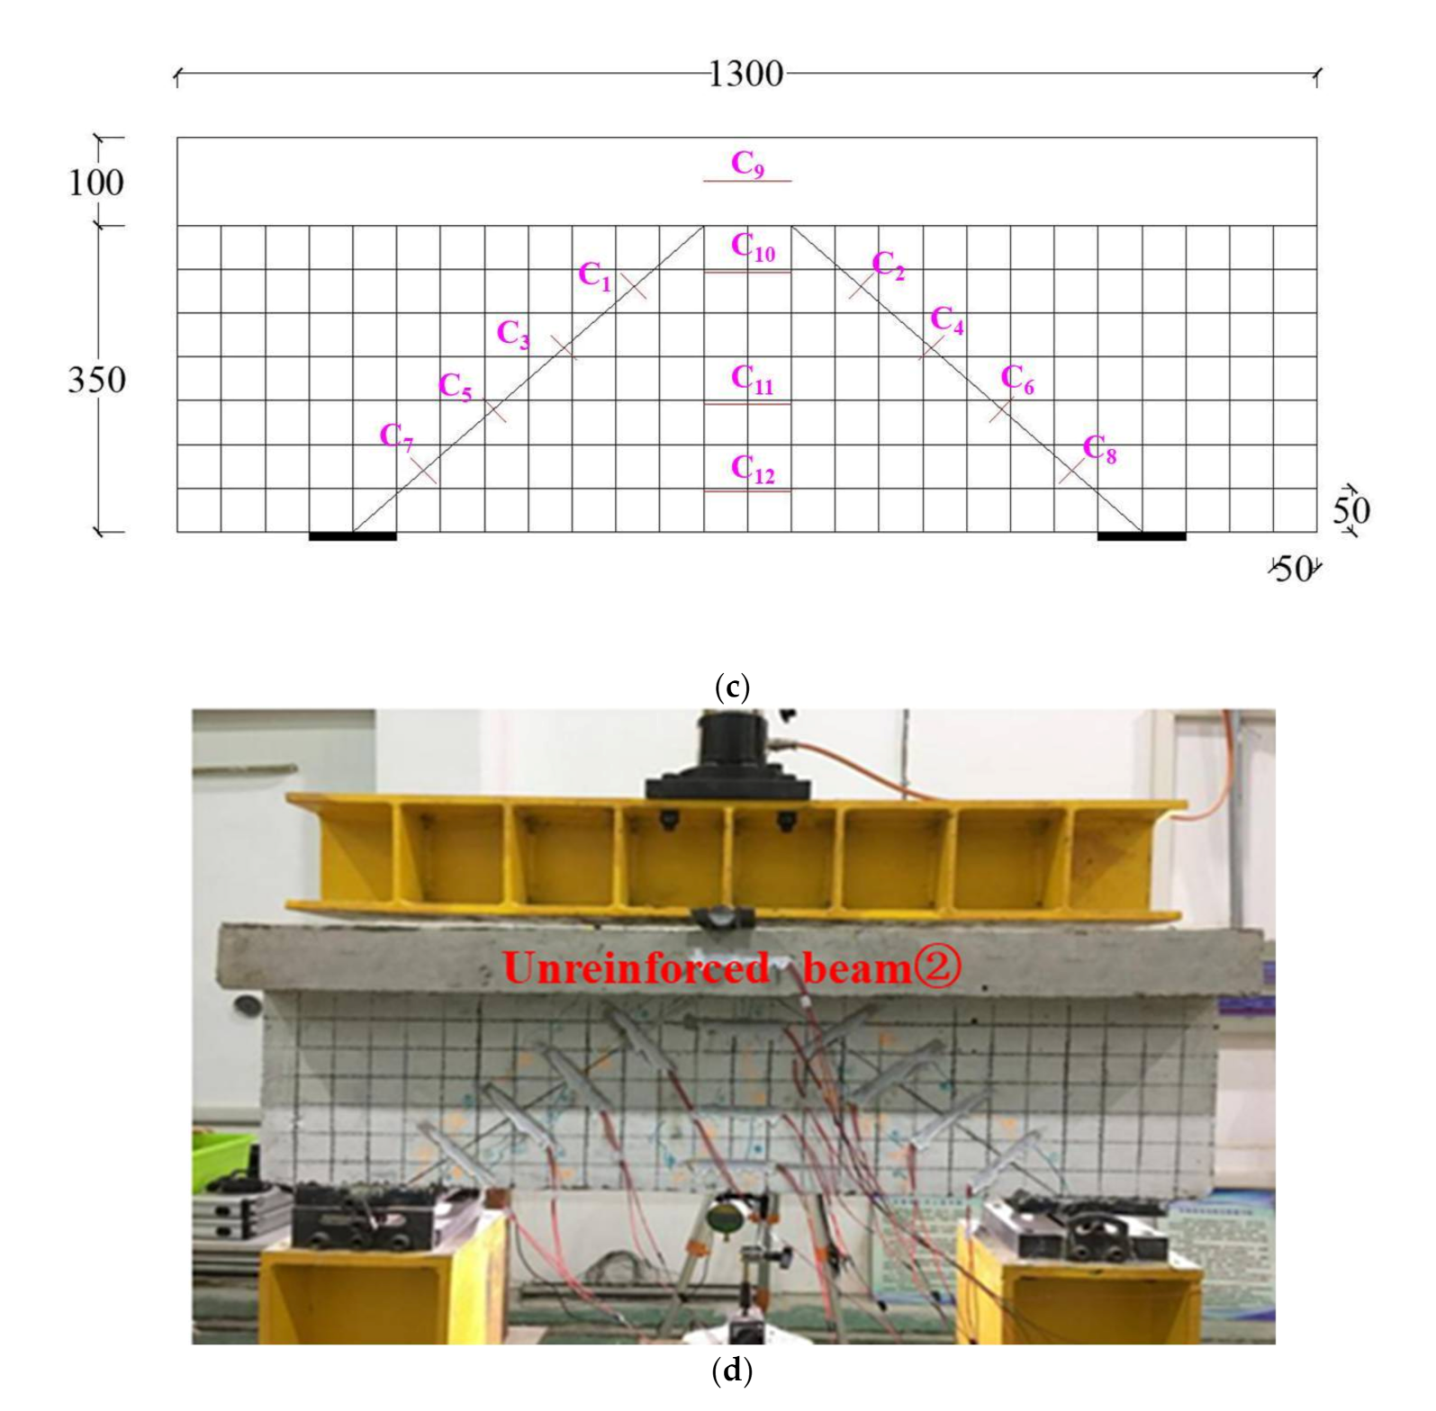
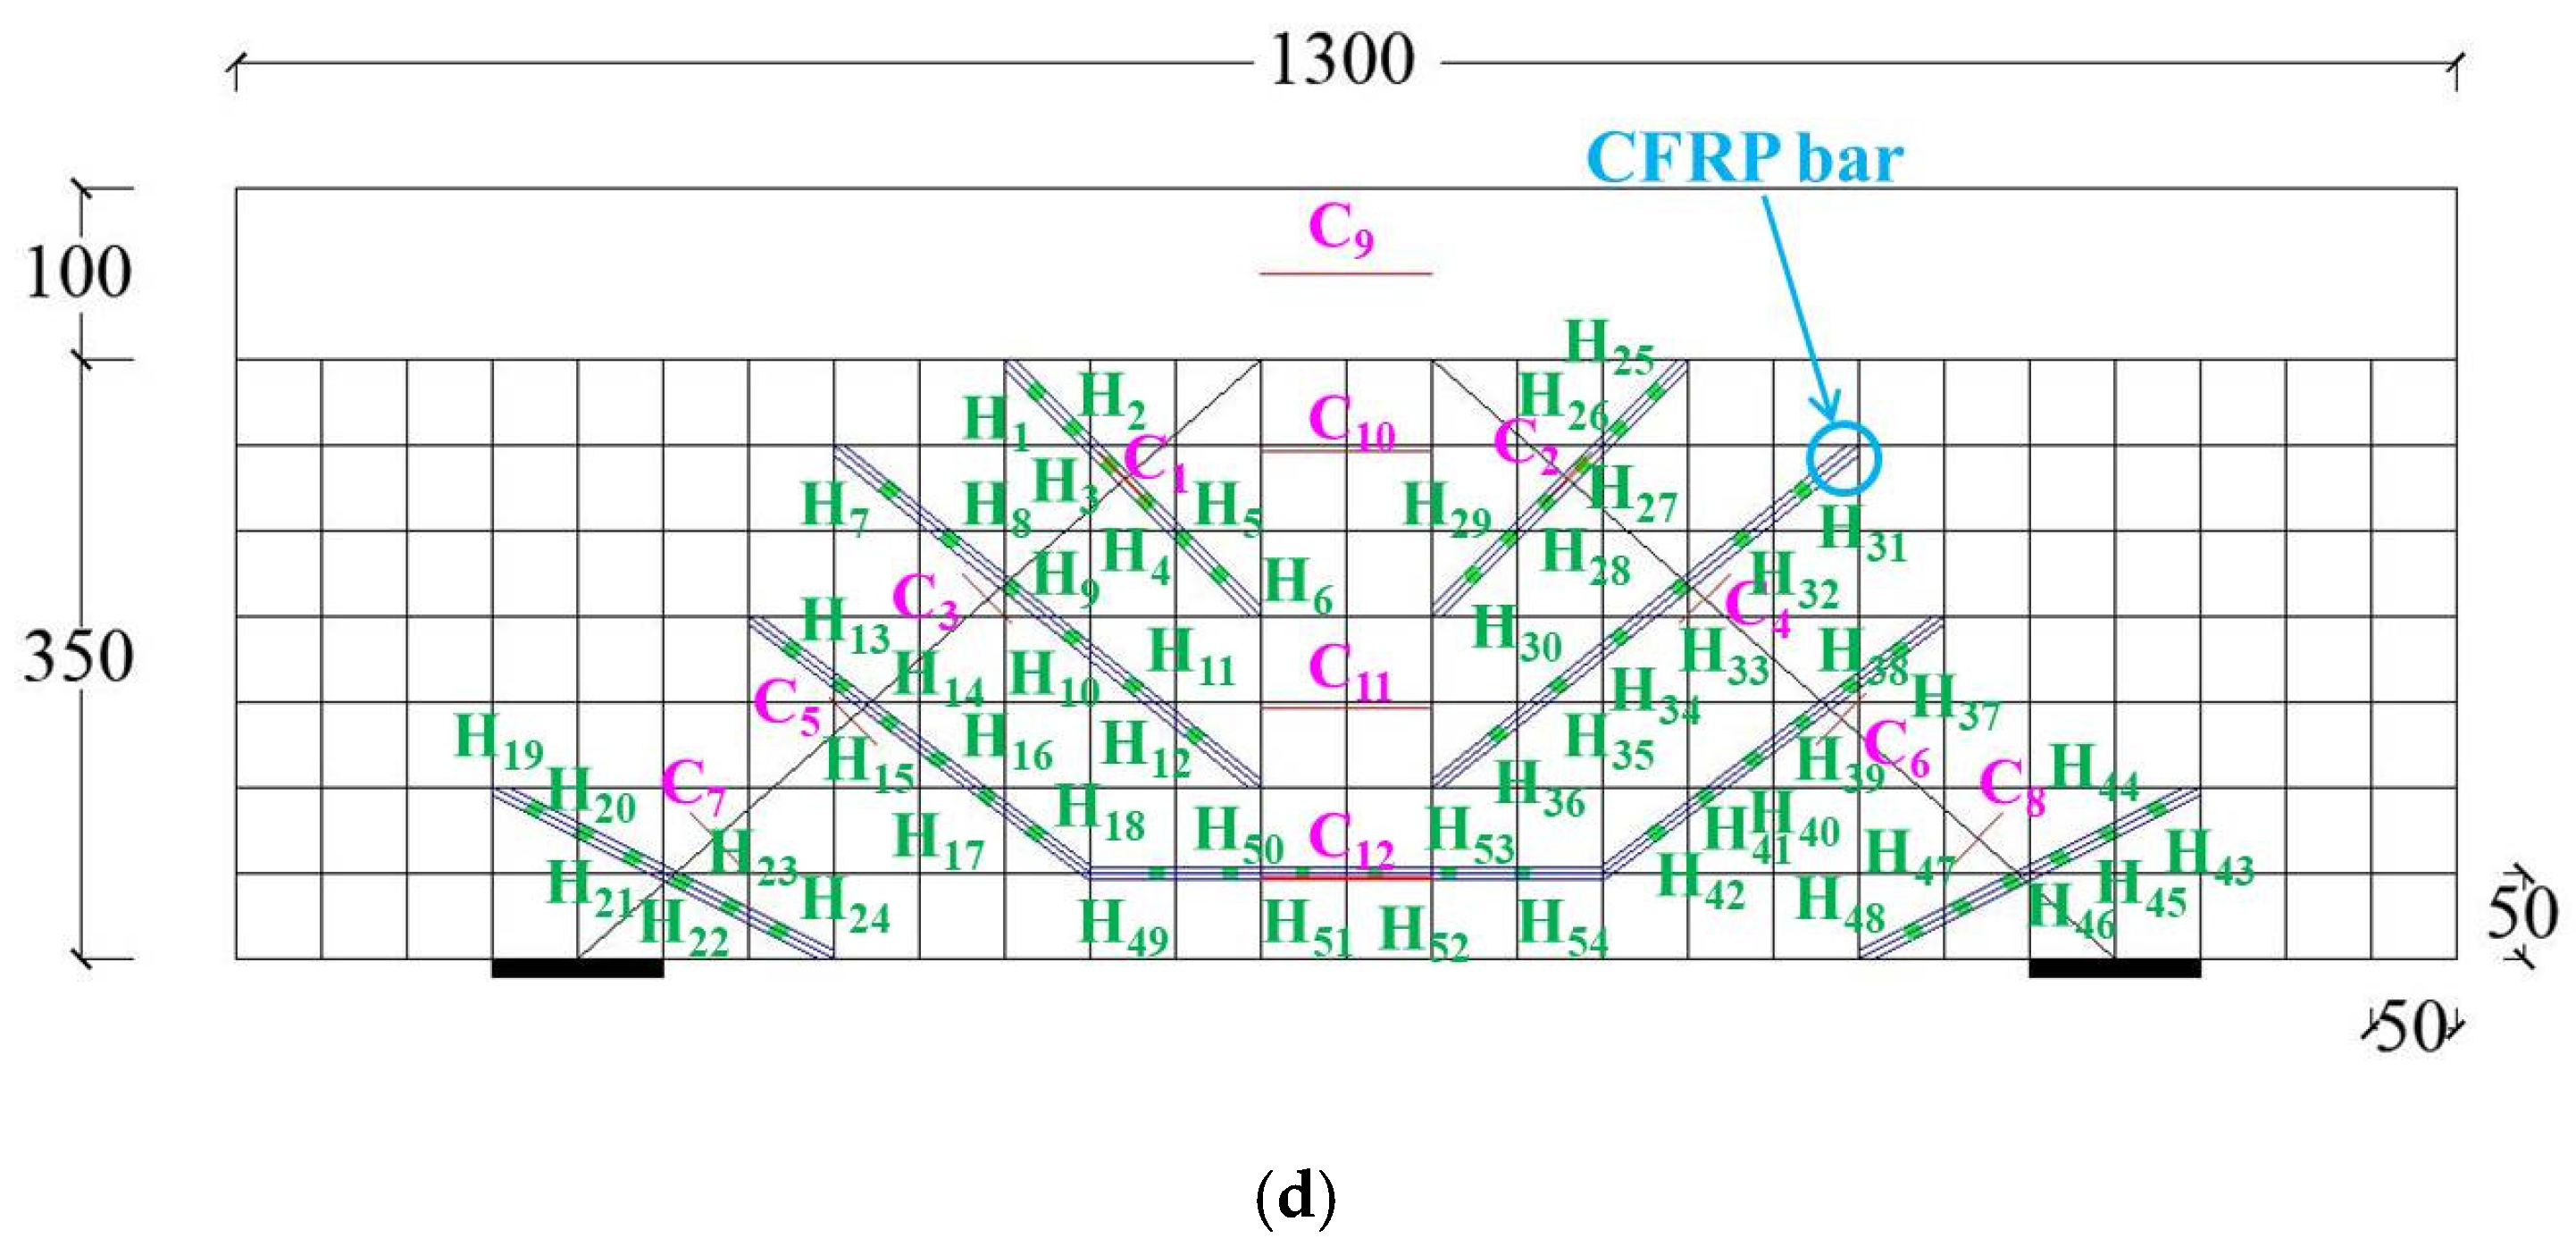
Figure 9.
The setup of unreinforced deep T-beams under three-point bending loading: (a) Diagram of three-point beading test setup; (b) Diagram of three-point beading tests by DIC; (c) The location of strain gages in unreinforced beam. Note: strain gages C1-C12 are pasted on beam surface; (d) Unreinforced beam.
Figure 10.
Normal strain and shear stress in cross-section.
Figure 10.
Normal strain and shear stress in cross-section.
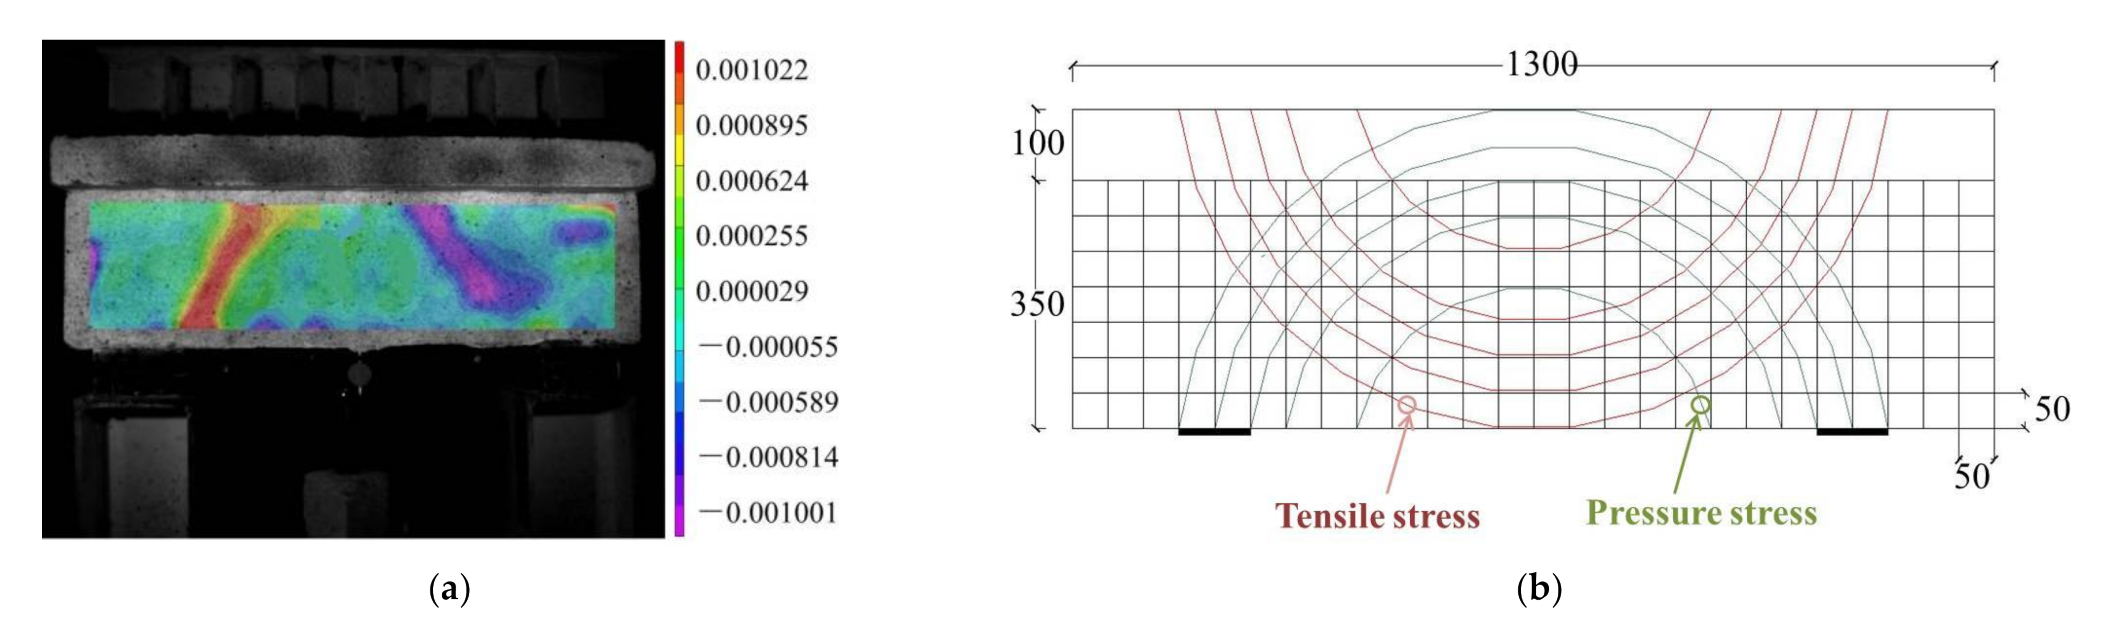
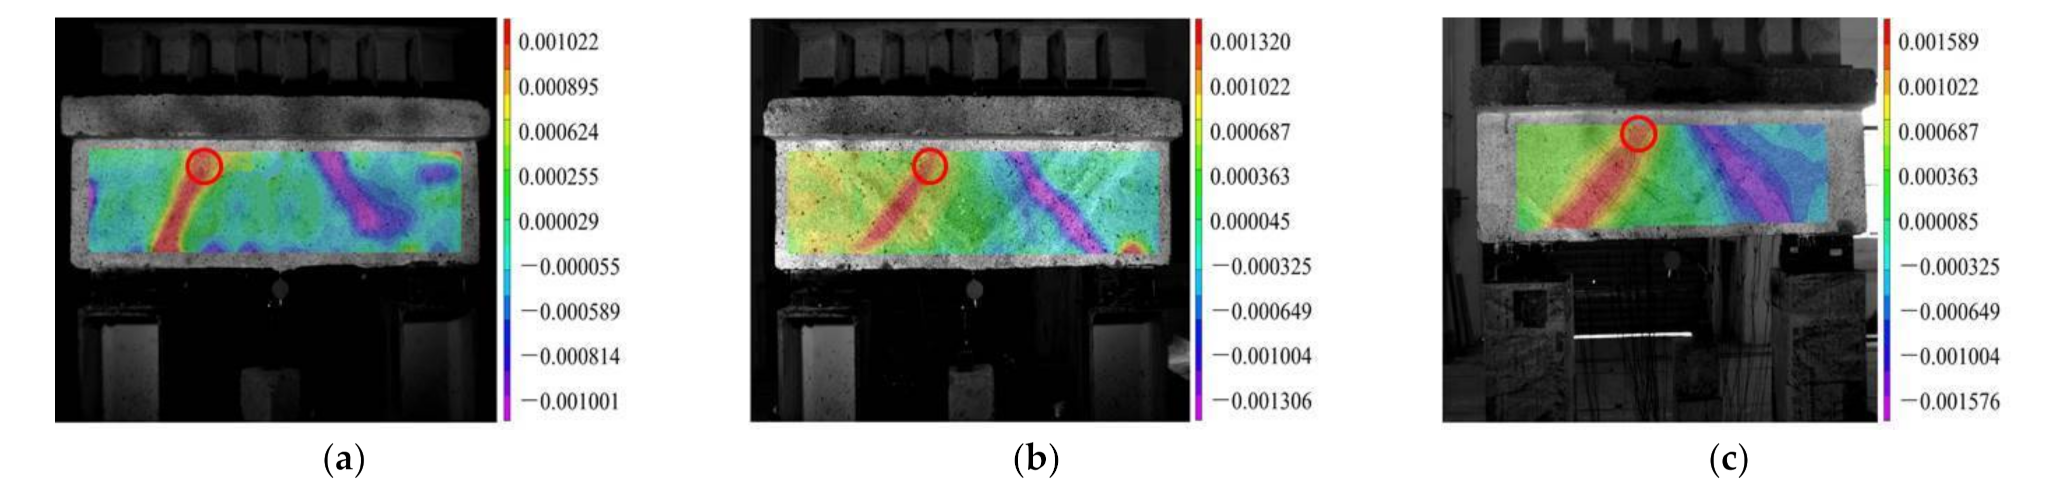
Figure 11.
The full field strain distribution and principal stress trajectory of the beam by DIC of unreinforced deep T-section beam: (a) The full field strain distribution of the beam by DIC; (b) Principal stress trajectory.
Figure 11.
The full field strain distribution and principal stress trajectory of the beam by DIC of unreinforced deep T-section beam: (a) The full field strain distribution of the beam by DIC; (b) Principal stress trajectory.
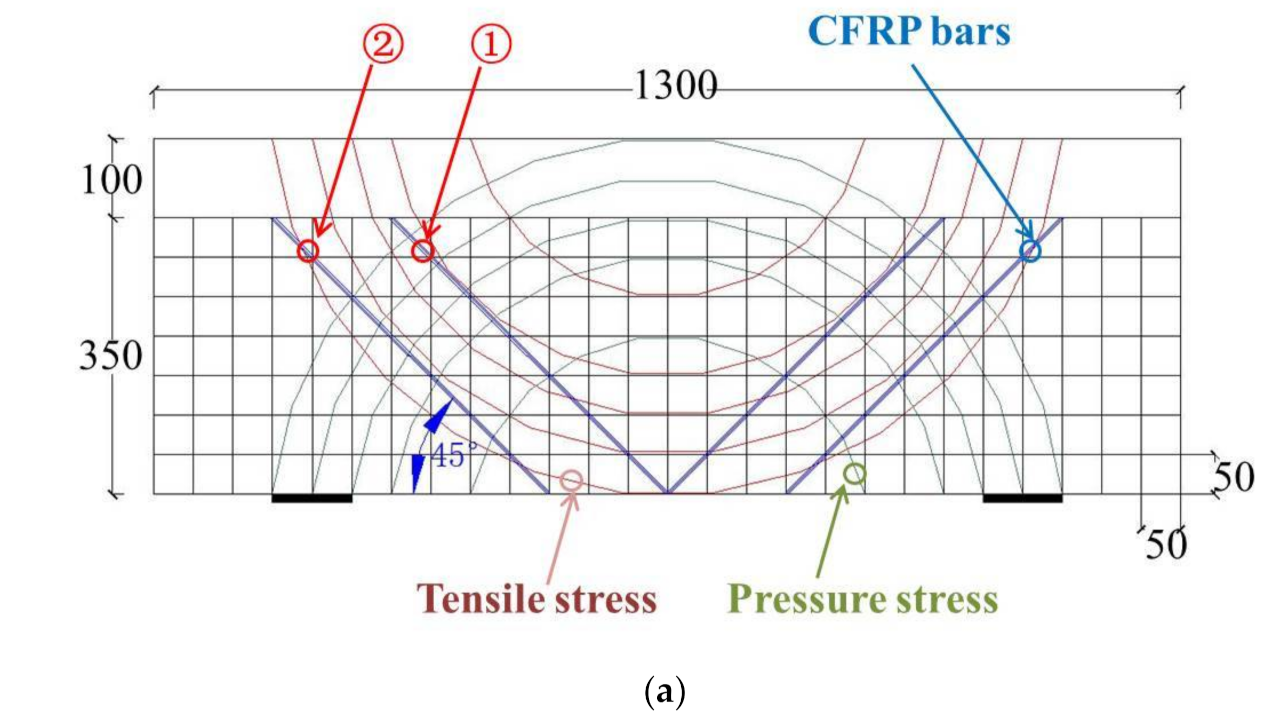
Figure 12.
Reinforcement schemes: (a) Scheme I. Note: ①,② are CFRP bars; (b) Scheme II. Note: ①,②,③,④,⑤ are CFRP bars.
Figure 12.
Reinforcement schemes: (a) Scheme I. Note: ①,② are CFRP bars; (b) Scheme II. Note: ①,②,③,④,⑤ are CFRP bars.
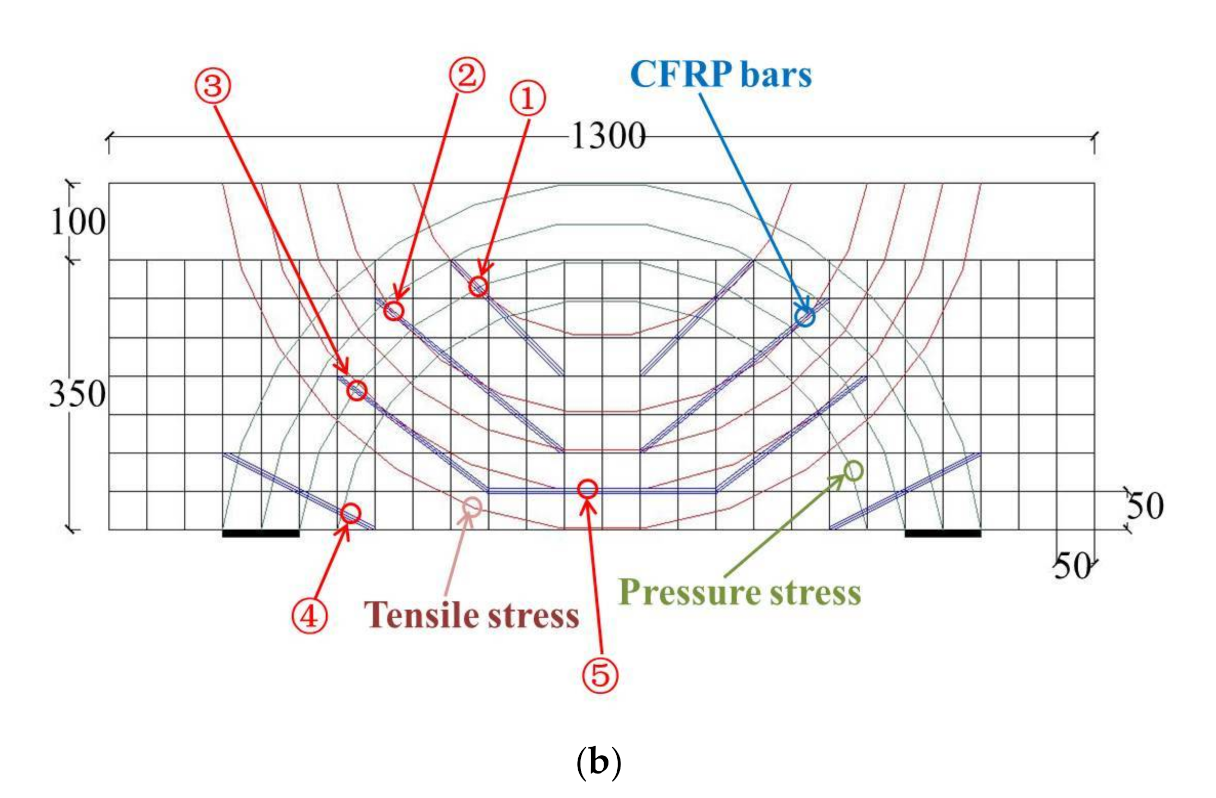
Figure 13.
Deep T-beams under three-point bending loading: (a) Reinforced beam by Scheme I; (b) The location of strain gages in scheme I beam. Note: strain gages C1–C12 are pasted on beam surface, strain gages H1–H32 are pasted on CFRP bars surface; (c) Reinforced beam by Scheme II; (d) The location of strain gages in scheme II beam. Note: strain gages C1–C12 are pasted on beam surface, strain gages H1–H54 are pasted on CFRP bars surface.
Figure 14.
Failure strain distribution in different beams: (a) Failure strain distribution of unreinforced beam; (b) Failure strain distribution in Scheme I; (c) Failure strain distribution in Scheme II.
Figure 14.
Failure strain distribution in different beams: (a) Failure strain distribution of unreinforced beam; (b) Failure strain distribution in Scheme I; (c) Failure strain distribution in Scheme II.
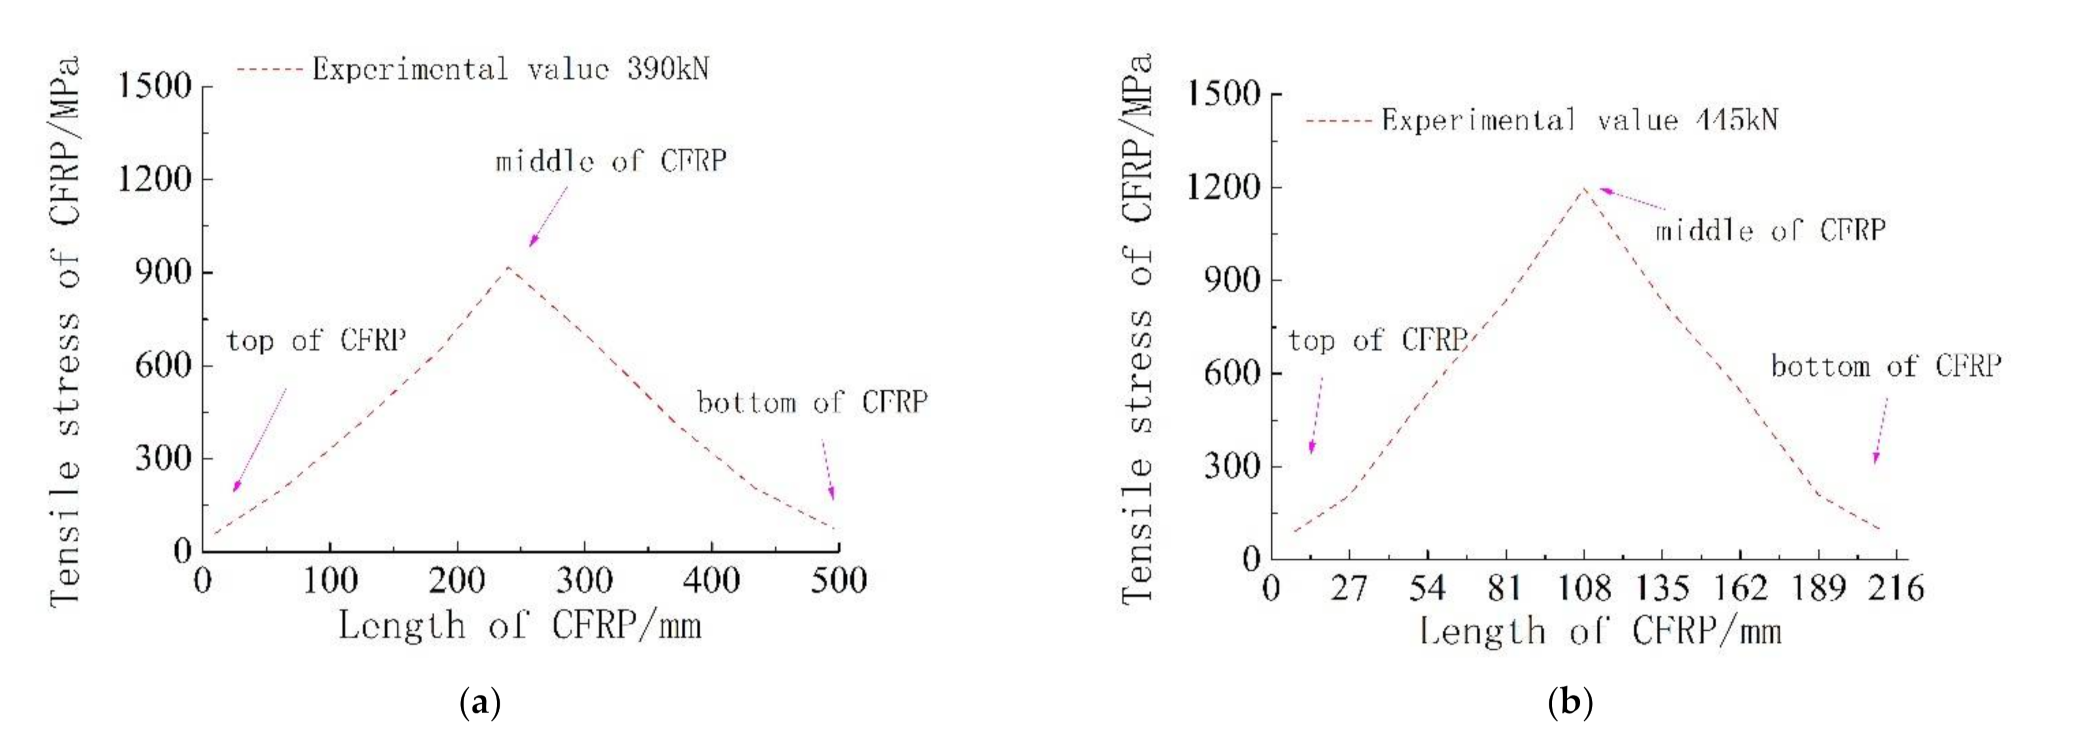
Figure 15.
Tensile stress of middle CFRP bar in strengthened beams: (a) Middle CFRP bar’s tensile stress in Scheme I; (b) Middle CFRP bar’s tensile stress in Scheme II.
Figure 15.
Tensile stress of middle CFRP bar in strengthened beams: (a) Middle CFRP bar’s tensile stress in Scheme I; (b) Middle CFRP bar’s tensile stress in Scheme II.
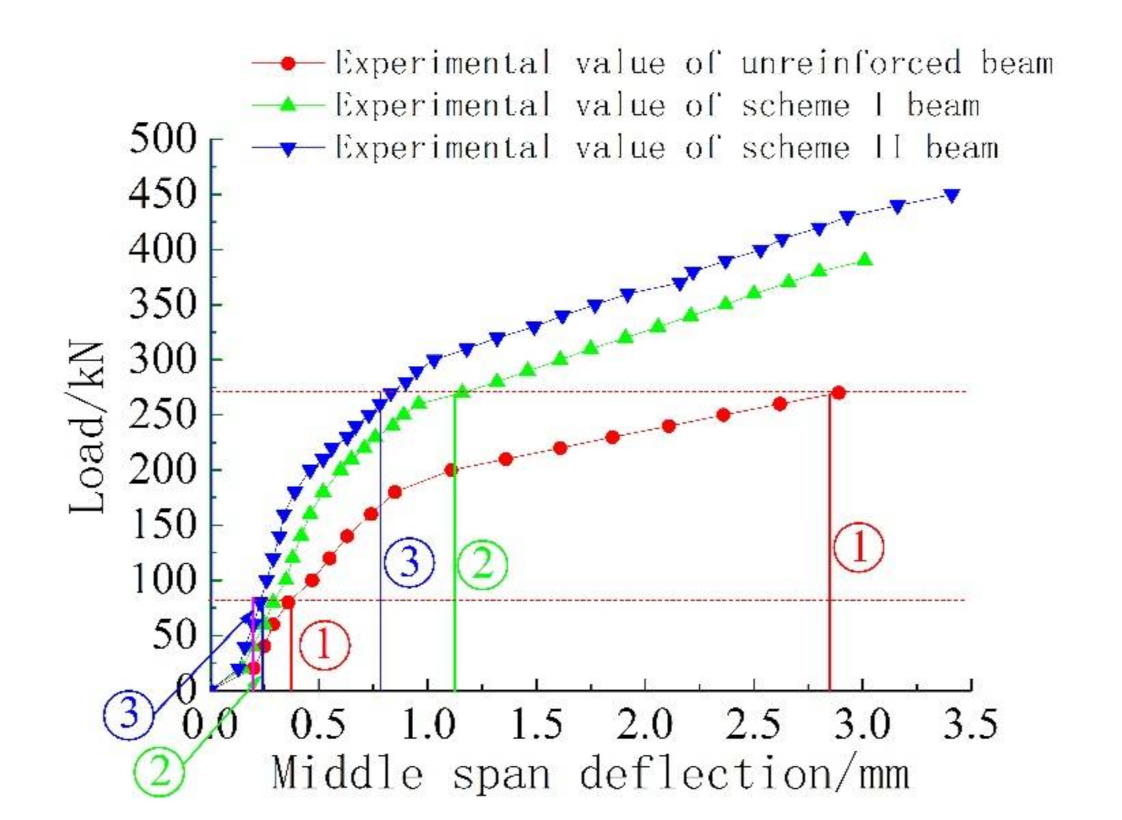
Figure 16.
The experimental value of mid-span deflection under three working conditions. Note: ① ② ③ represent Unreinforced beam, Scheme I beam and Scheme II beam, respectively.
Figure 16.
The experimental value of mid-span deflection under three working conditions. Note: ① ② ③ represent Unreinforced beam, Scheme I beam and Scheme II beam, respectively.
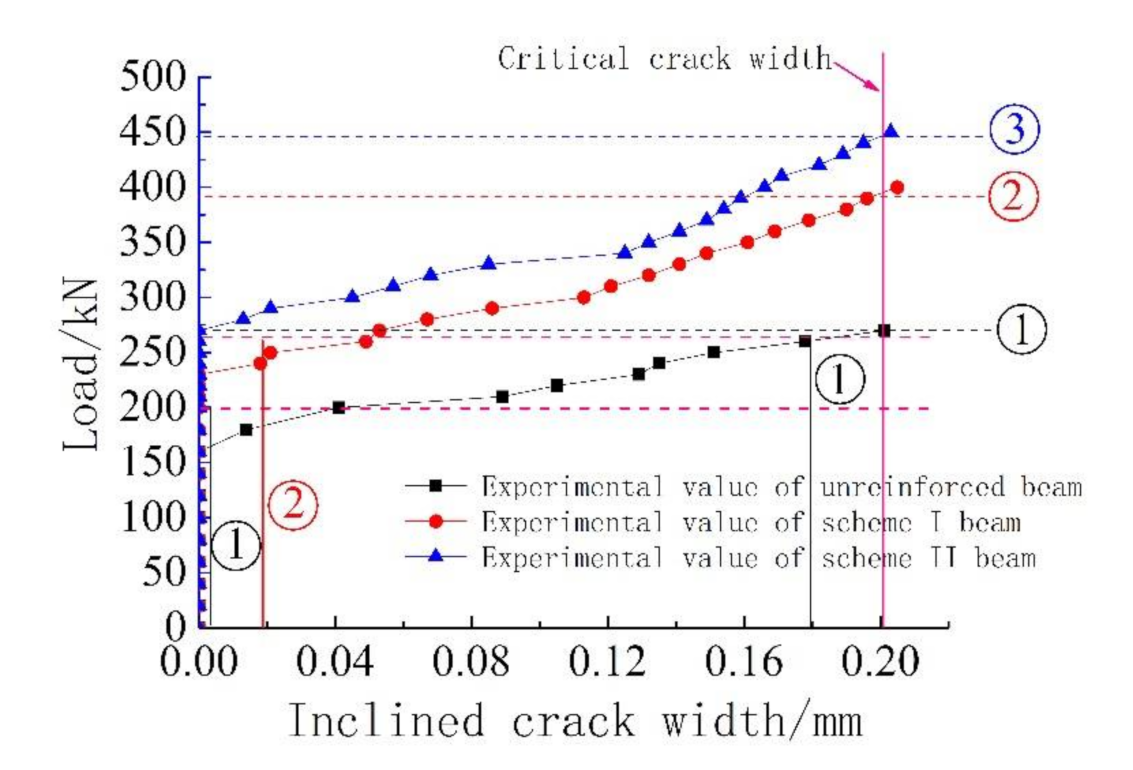
Figure 17.
The experimental value of inclined crack width under three working conditions. Note: ① ② ③ represent Unreinforced beam, Scheme I beam and Scheme II beam, respectively.
Figure 17.
The experimental value of inclined crack width under three working conditions. Note: ① ② ③ represent Unreinforced beam, Scheme I beam and Scheme II beam, respectively.
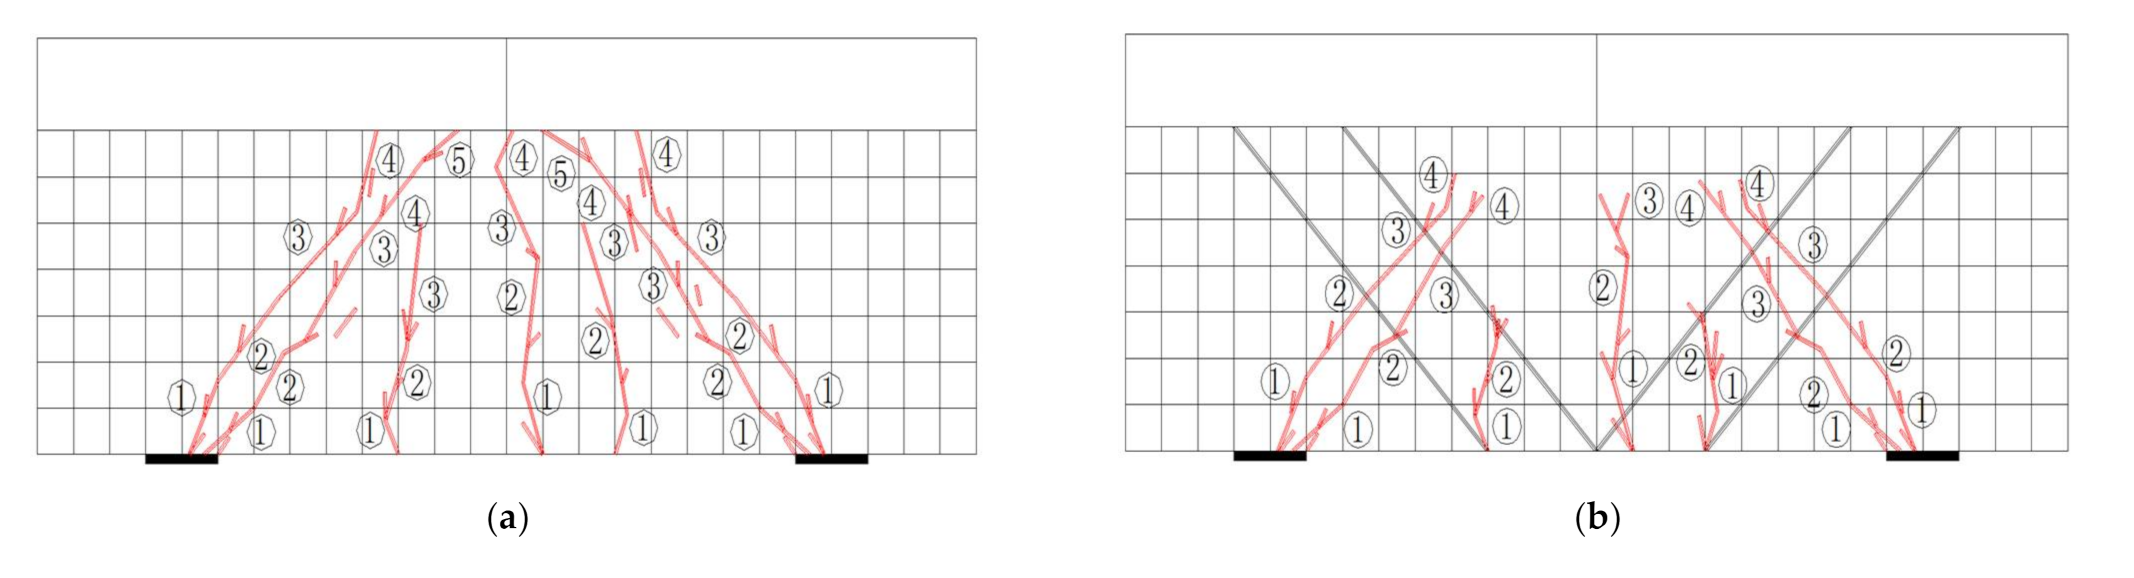
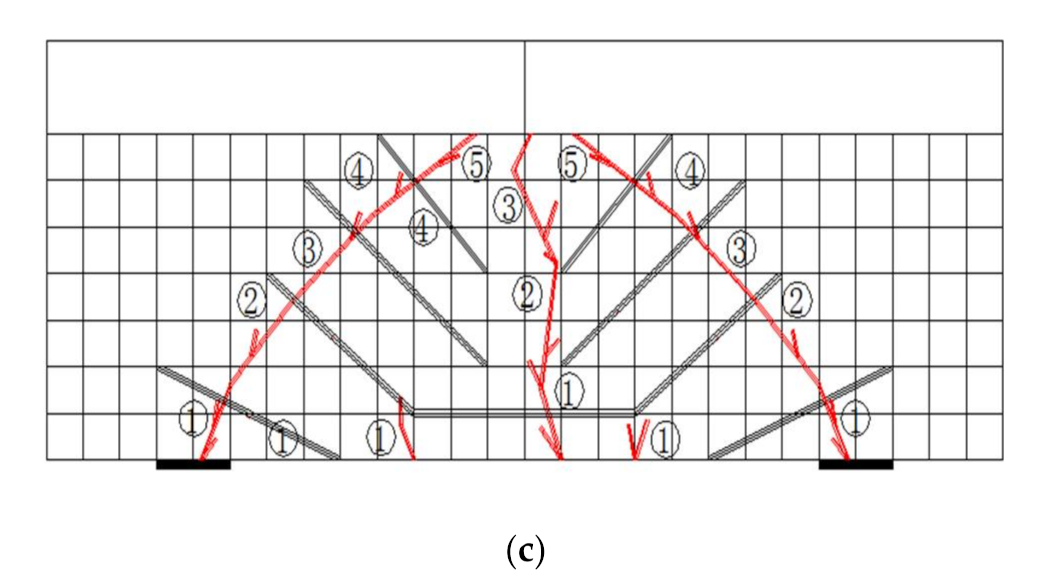
Figure 18.
Crack distributions in three-point bending tests: (a) Unreinforced beam; (b) Scheme I; (c) Scheme II.
Figure 18.
Crack distributions in three-point bending tests: (a) Unreinforced beam; (b) Scheme I; (c) Scheme II.
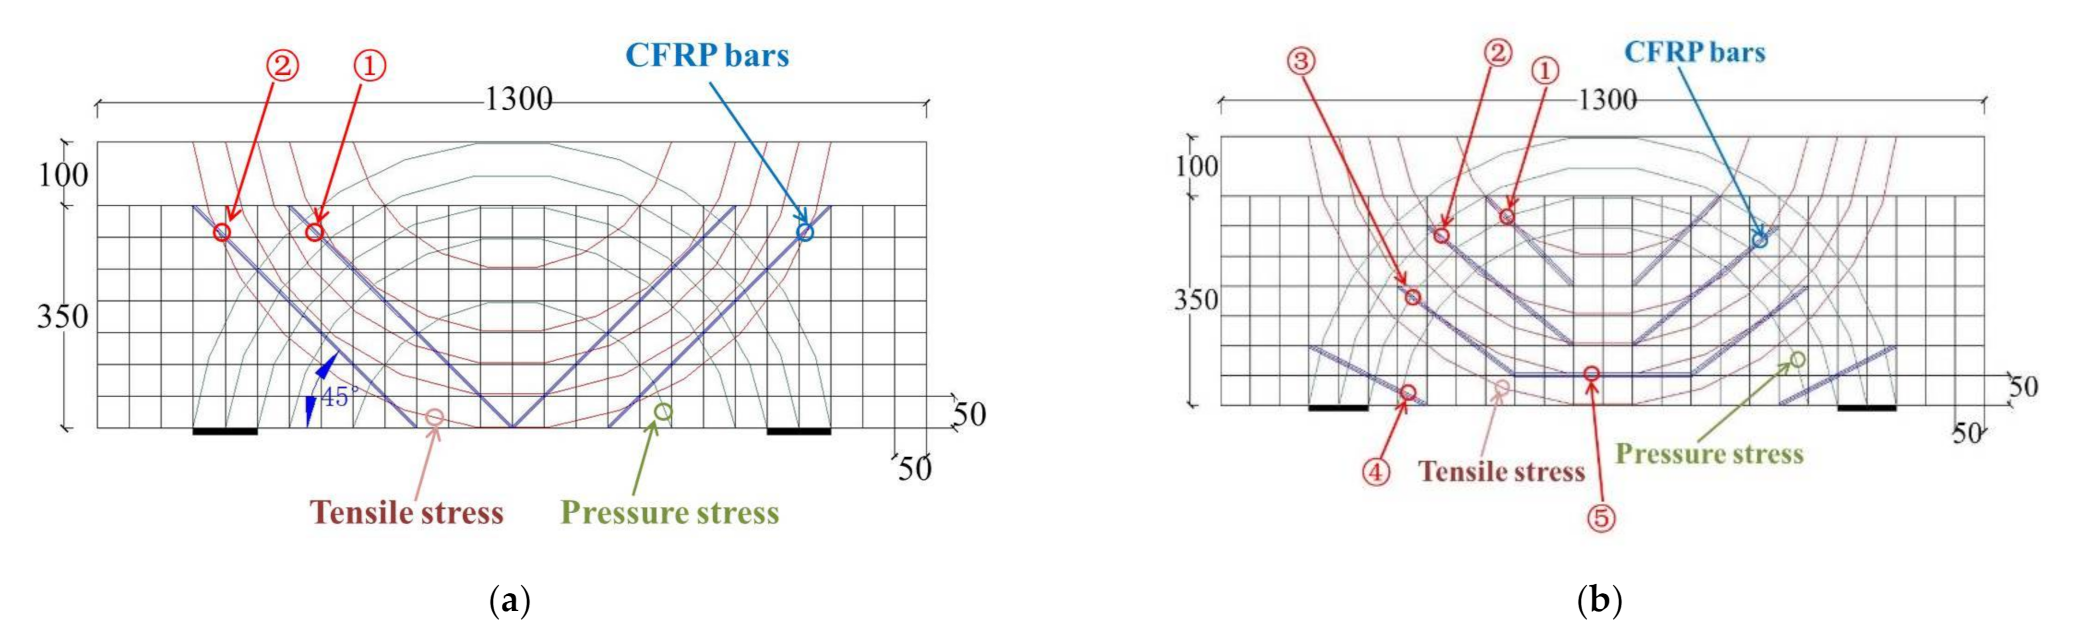
Figure 19.
Scheme I and Scheme II: (a) Simple reinforced scheme I distribution of CFRP bars; (b) Optimized reinforced scheme II distribution of CFRP bars.
Figure 19.
Scheme I and Scheme II: (a) Simple reinforced scheme I distribution of CFRP bars; (b) Optimized reinforced scheme II distribution of CFRP bars.
Table 1.
Properties of Epoxy Adhesive parameters and CFRP filament.
Table 1.
Properties of Epoxy Adhesive parameters and CFRP filament.
| Epoxy Adhesive | Compressive Strength/MPa | Bonding Strength/MPa | Shear Modulus/GPa |
| 32 | 10 | 3.8 |
| CFRP filament | Brand | Type | Density/ | Tensile Strength/MPa | Elasticity Modulus/GPa |
| RORAY | T-300 | 1500 | 3500 | 230 |
Table 2.
Properties of CFRP bars.
Table 2.
Properties of CFRP bars.
| Strand Number | Sectional Area/mm2 | Tensile Strength/MPa | Elasticity Modulus/GPa |
|---|
| 16 | 10 × 1.8 | 885.73 | 119.71 |
| 24 | 10 × 2.1 | 1312.45 | 119.18 |
| 32 | 10 × 2.5 | 1572.79 | 120.05 |
| 40 | 10 × 2.8 | 1424.36 | 119.87 |
| 48 | 10 × 3.1 | 1345.26 | 119.78 |
Table 3.
Properties of adhesive layer.
Table 3.
Properties of adhesive layer.
| Adhesive Layer Thickness/mm | Tensile Strength/MPa | Adhesive Layer Thickness/mm | Tensile Strength/MPa |
|---|
| 0.1 | 348.78 | 1.1 | 1088.18 |
| 0.2 | 418.53 | 1.2 | 1130.04 |
| 0.3 | 502.24 | 1.3 | 1213.74 |
| 0.4 | 585.94 | 1.4 | 1255.59 |
| 0.5 | 655.70 | 1.5 | 1325.35 |
| 0.6 | 697.55 | 1.6 | 1227.69 |
| 0.7 | 767.31 | 1.7 | 1143.99 |
| 0.8 | 837.06 | 1.8 | 1088.18 |
| 0.9 | 906.82 | 1.9 | 1032.38 |
| 1.0 | 1004.48 | 2.0 | 962.62 |
Table 4.
Results from pull-out tests.
Table 4.
Results from pull-out tests.
| No. | Embedded Length/mm | Embedded Depth/mm | Embedded Width/mm | Ultimate Load/kN | Relative Displacement/mm |
|---|
| SJ-1 | 160 | 11.5 | 5 | 35.54 | 4.52 |
| SJ-2 | 160 | 11.5 | 5 | 35.18 | 4.31 |
| SJ-3 | 160 | 11.5 | 5 | 34.89 | 4.17 |
Table 5.
Properties of steel bars.
Table 5.
Properties of steel bars.
| No. | Diameter/mm | Type | Average Elastic Limit/kN | Average Yield Strength/MPa |
|---|
| 1 | 8 | HRB335 | 20.72 | 412.45 |
| 2 | 10 | HRB335 | 34.26 | 436.37 |
| 3 | 18 | HRB335 | 118.48 | 465.83 |
Table 6.
Mechanical properties of concrete.
Table 6.
Mechanical properties of concrete.
| Cube Crushing Strength/MPa | Axial Compressive Strength/MPa | Tensile Strength
/MPa | Elasticity Modulus
/GPa | Poisson Ratio
/MPa |
|---|
| 40.5 | 38.6 | 3.6 | 25.2 | 0.2 |
Table 7.
The reinforcement layout of the deep T-beam specimens.
Table 7.
The reinforcement layout of the deep T-beam specimens.
| Order | Reinforcement Layout | Order | Reinforcement Layout |
|---|
| ① | The upper longitudinal steel bar 8ϕ10 | ② | The lower longitudinal steel bar 3ϕ18 |
| ③ | Horizontally distributed steel bar ϕ8@150 | ④ | Vertically distributed steel bar ϕ8@150 |
| ⑤ | Vertically distributed steel bar ϕ8@150 | ⑥ | Tie steel bar ϕ8@300 |
Table 8.
CFRP bars on the two reinforced schemes (Scheme II).
Table 8.
CFRP bars on the two reinforced schemes (Scheme II).
| Order | Central Position of CFRP Bars/mm | Maximum Tension Stress/MPa | Maximum Effective Length/mm | Angle/° |
|---|
| 1 | (525,275) | 3.85 | 212 | 45.0 |
| 2 | (475,200) | 5.61 | 320 | 38.7 |
| 3 | (400,125) | 4.79 | 250 | 36.9 |
| 4 | (250,12) | 4.25 | 224 | 26.6 |
| 5 | (653,55) | 5.24 | 300 | 0 |
Table 9.
Experimental average of three level loads on the three working conditions.
Table 9.
Experimental average of three level loads on the three working conditions.
| Working Conditions | Cracking Load/kN | Inclined Crack Load/kN | Shear Failure Load/kN |
|---|
| Unreinforced | 80 | 200 | 270 |
| Scheme I | 160 | 260 | 390 |
| Scheme II | 190 | 300 | 445 |


