Study of Concrete Strength and Pore Structure Model Based on Grey Relation Entropy


Abstract
:1. Introduction
2. Analysis of Sensitive Factors of Concrete Compressive Strength
2.1. GRE Theory
2.2. Sensitivity Analysis of Pore Structure Parameters Based on GRE Method
3. Revise Compressive Strength-Pore Structure Model
3.1. Sensitive Pore Size Distribution Rate Bs and Sensitivity Coefficient ƞ
3.2. Revised Strength-Pore Structure Model
4. Verification of the Revised Model
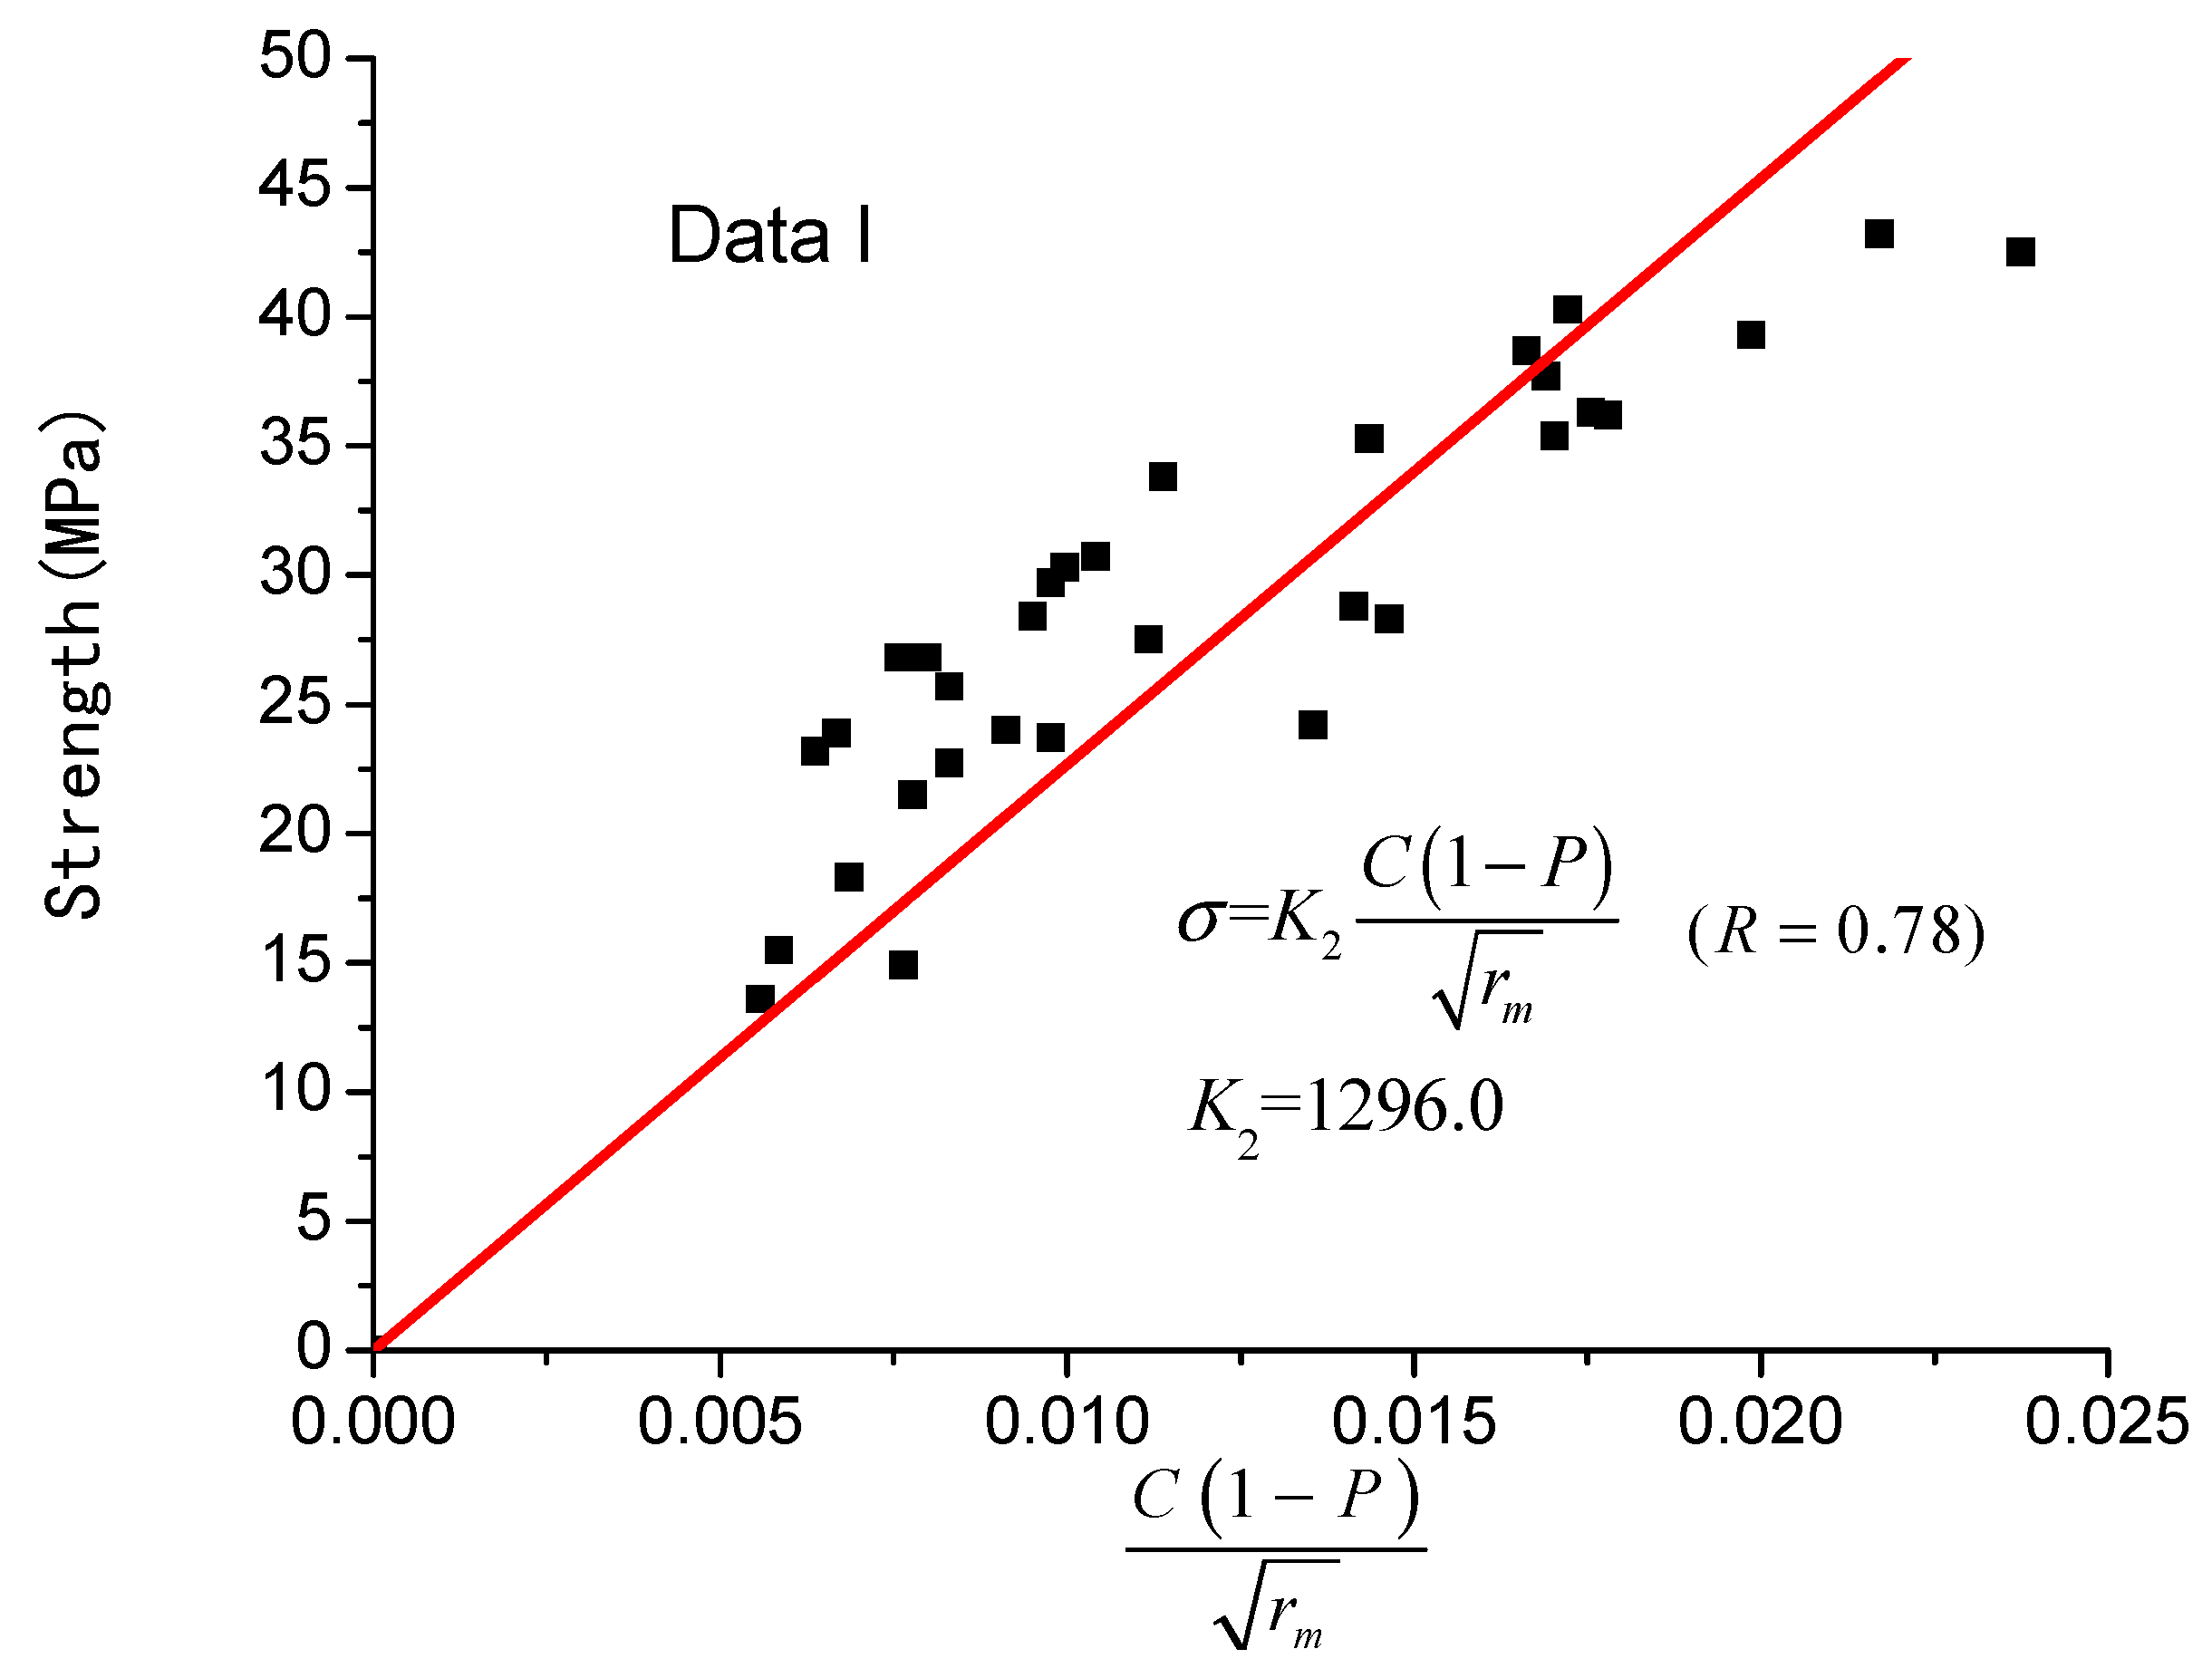
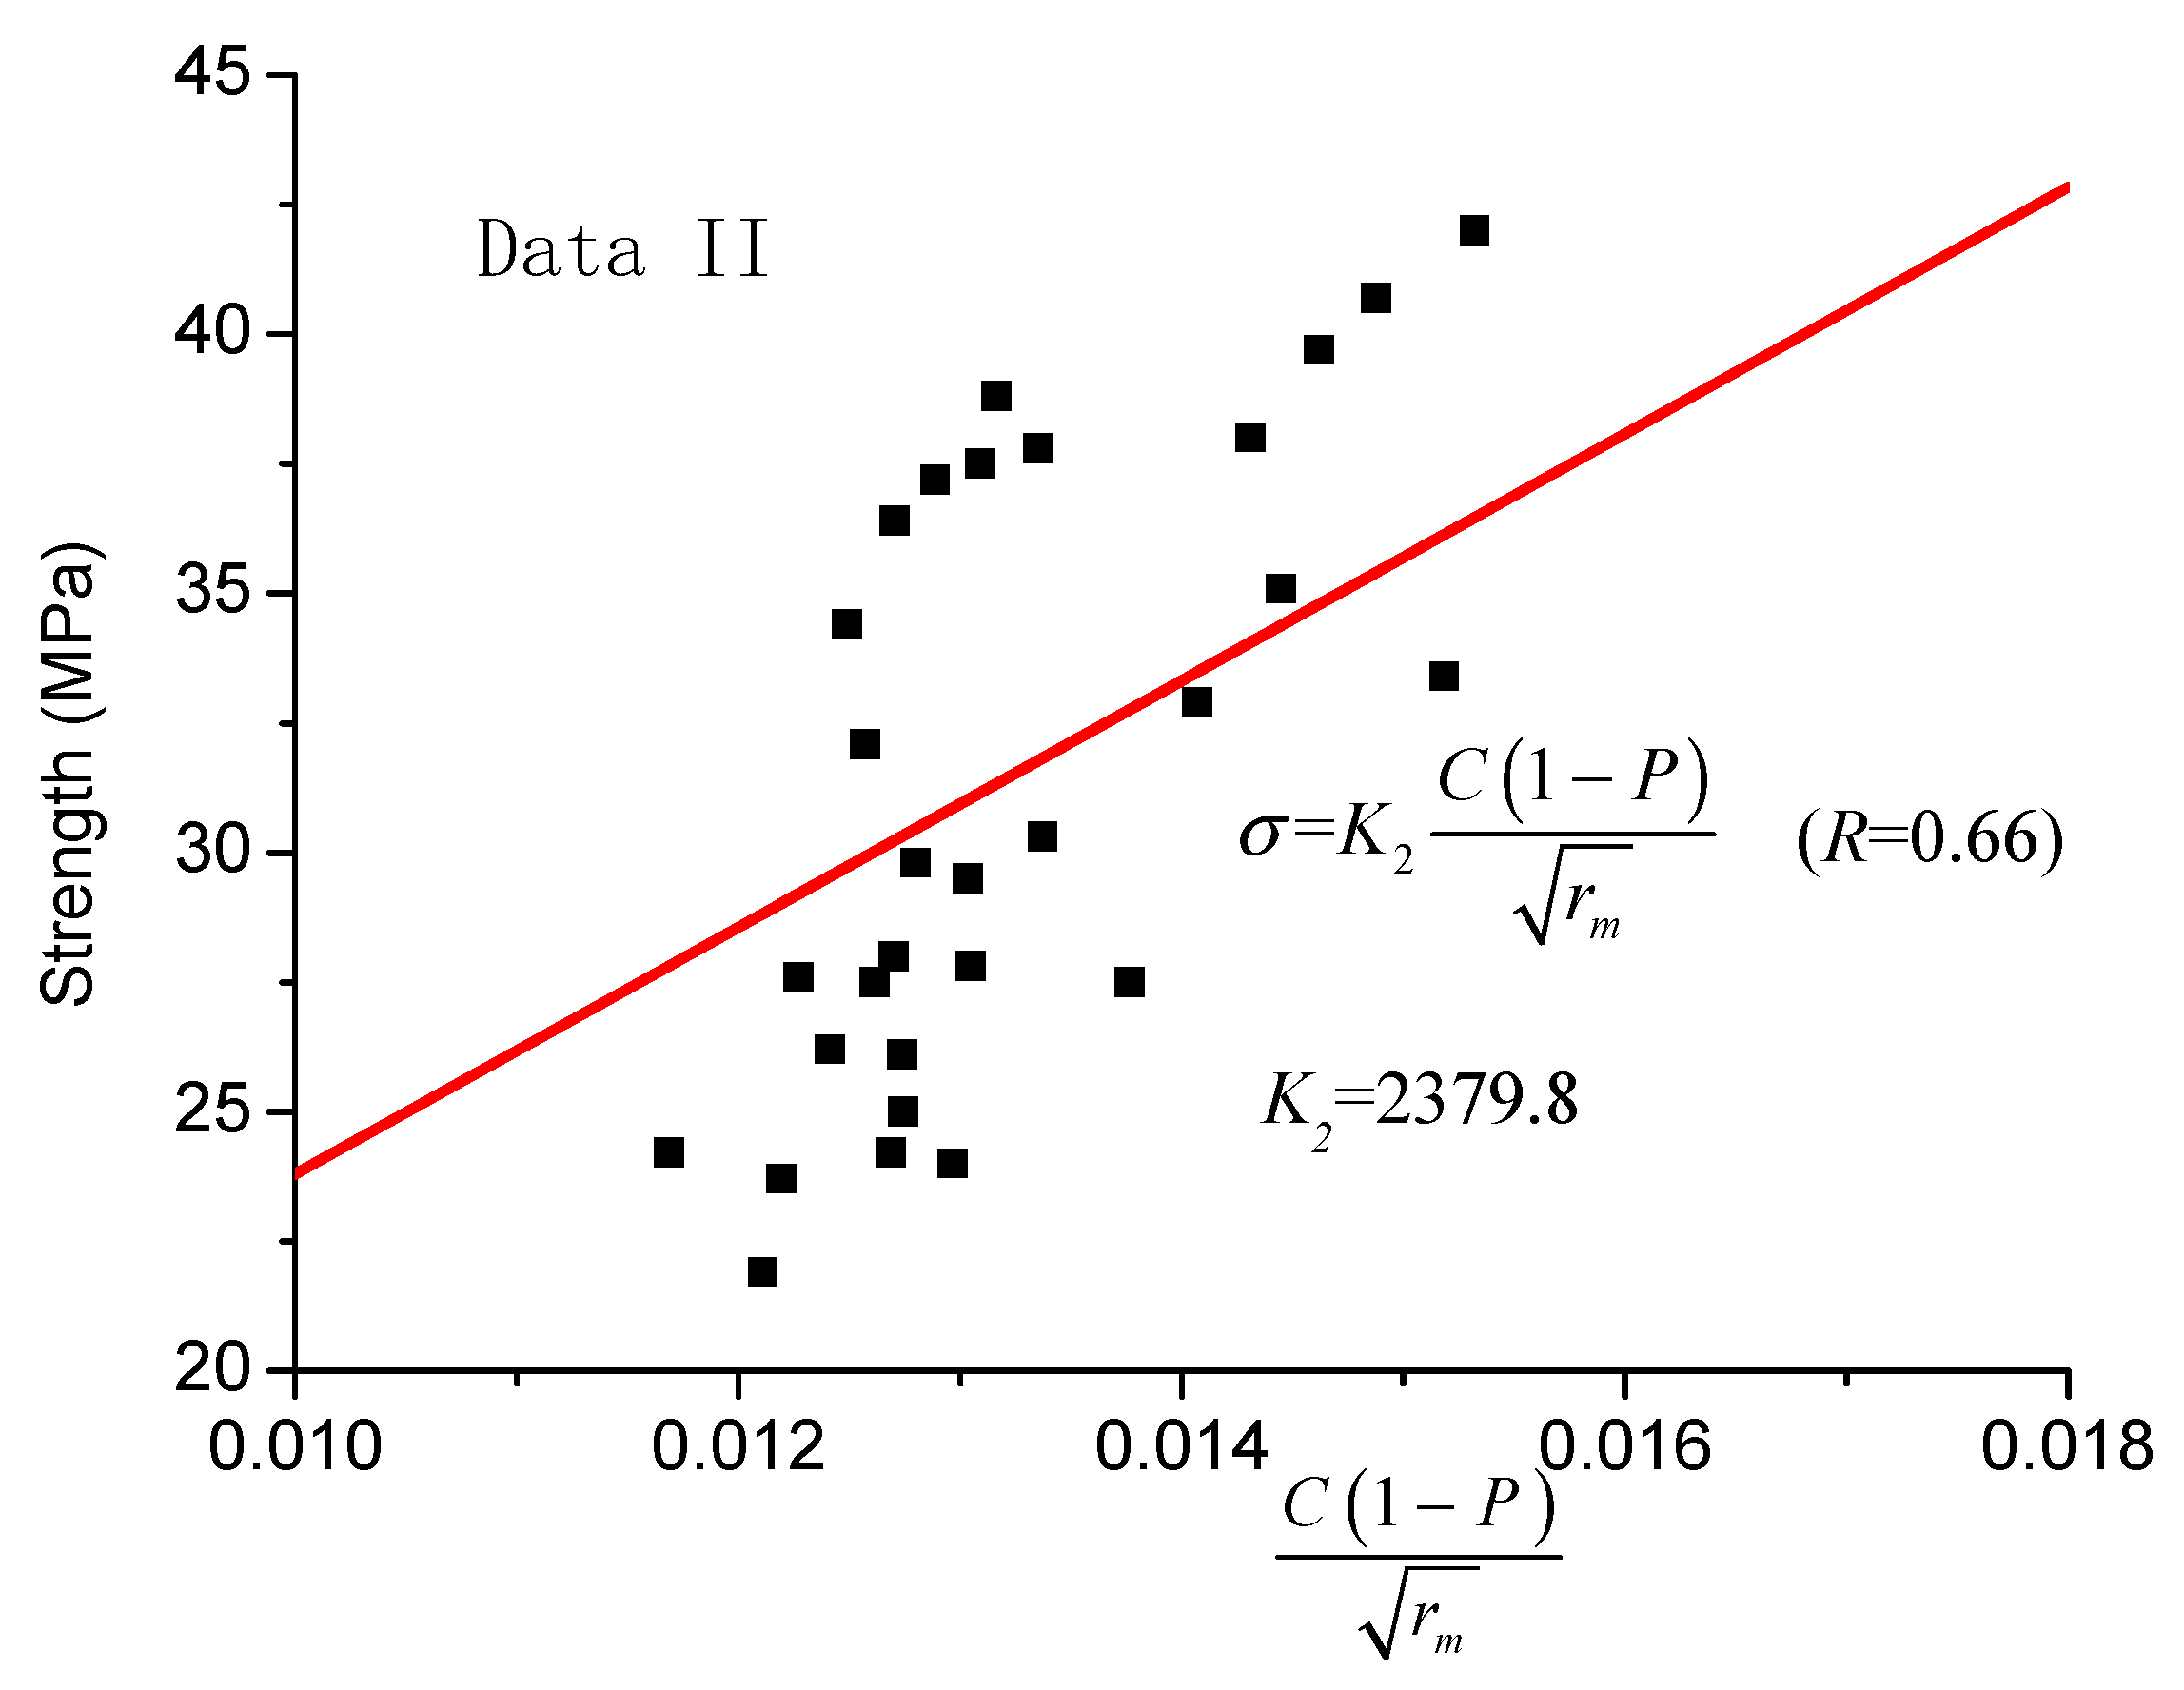
4.1. Common Strength-Pore Structure Model
4.2. Verification of the Revised Model with Data I
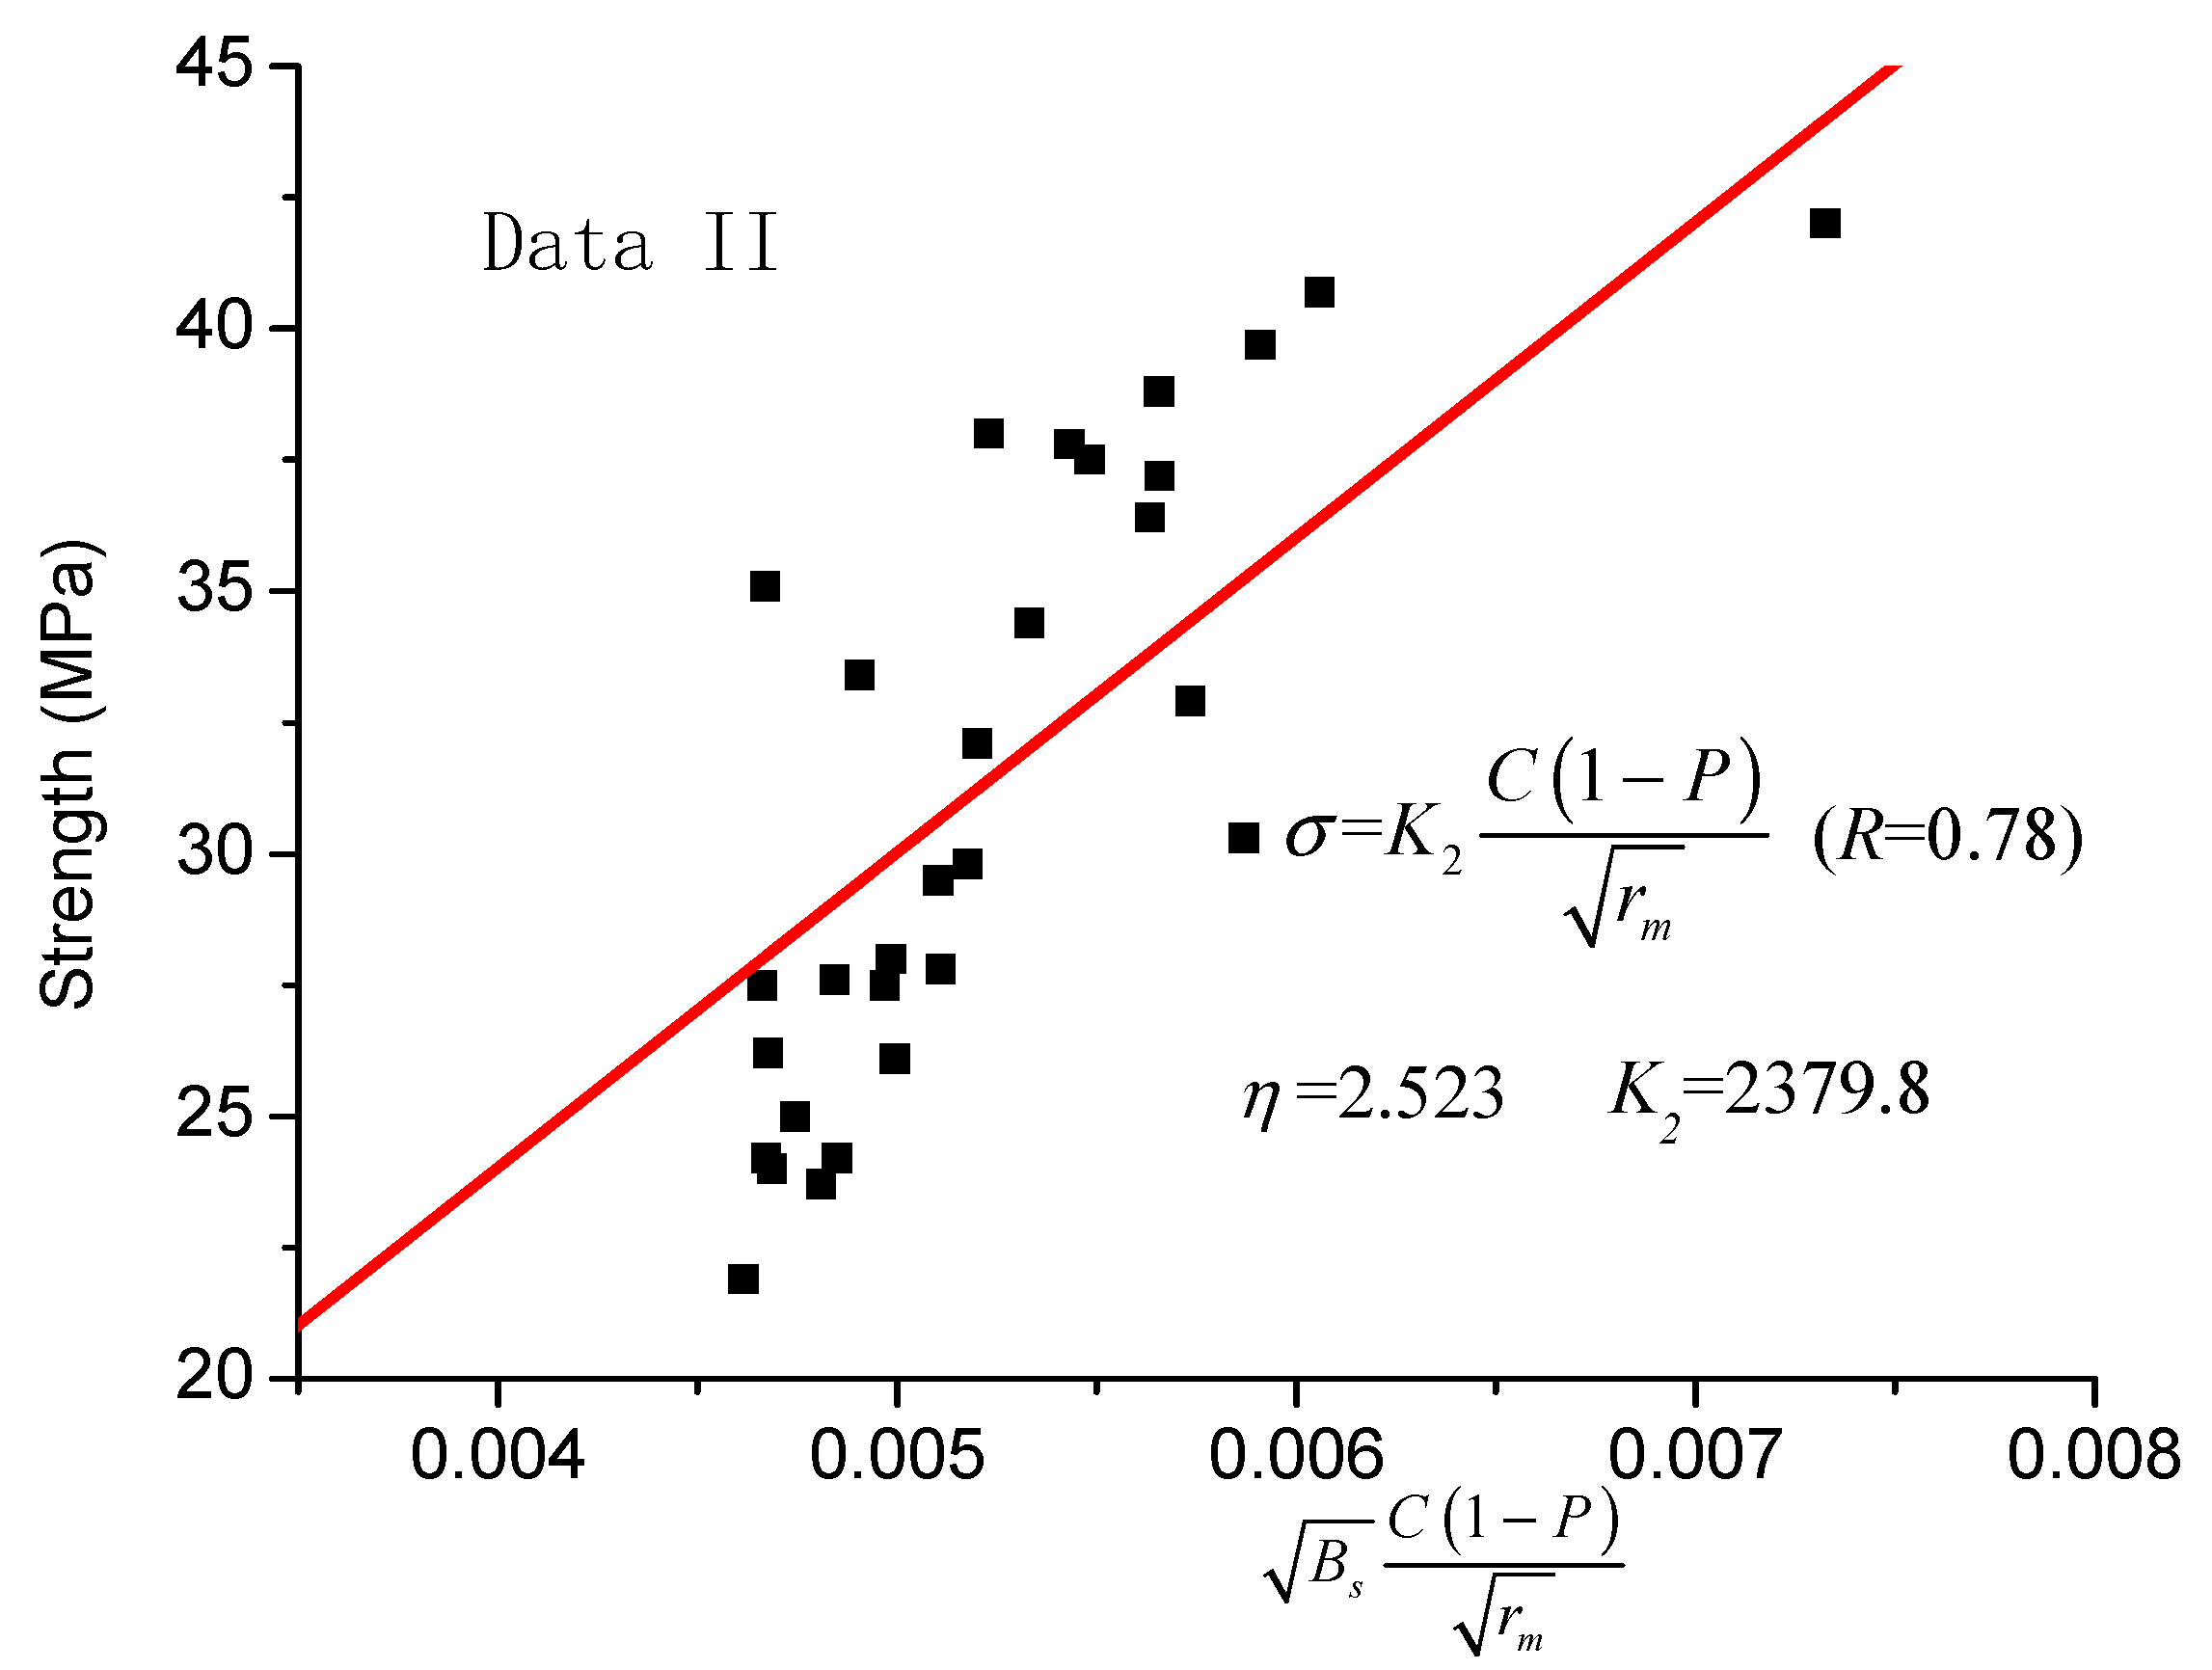
4.3. Verification of the Revised Model with Data II
5. Conclusions
- (1)
- Based on the GRE theory, it was concluded that the most sensitive factors that affect the compressive strength of concrete is the distribution rate of the pore radius with the maximum value of relation degree.
- (2)
- A new strength and pore structure model is proposed, considering the influence of sensitive pore radius and introducing the concept of sensitivity coefficient.
- (3)
- The revised model proposed in this paper and the existing strength model, used to calculate the compressive strength of concrete, are compared with test results, which shows that the revised model and the test results are in better agreement.
- (4)
- In the revised model, the concrete’s strength is related not only to porosity, average pore radius and cement content, but also to sensitive pore radius. The consideration of the influence of the sensitive pore radius on the strength of concrete leads to a better estimation of the concrete’s strength.
- (5)
- This paper only considers the influence of the sensitive pore radius on the strength of concrete, but does not consider the influence of capillary pores, gel pores, location of pores, and interconnectivity of pores on concrete strength. In the future, the author intends to conduct a porosity test on studied concrete, taking into account the influence of the pore structure on the permeability of the concrete and the influence of internal and external temperature differences on the sensitive pore radius.
Author Contributions
Funding
Data Availability Statement
Conflicts of Interest
References
- Zhang, S.; Cao, K.; Wang, C.; Wang, X.; Deng, G.; Wei, P. Influence of the Porosity and Pore Size on the Compressive and Splitting Strengths of Cellular Concrete with Millimeter-Size Pores. Constr. Build. Mater. 2020, 235, 117508. [Google Scholar] [CrossRef]
- Liu, H.; Liu, C.; Bai, G.; Zhu, C. Impact of Chloride Intrusion on the Pore Structure of Recycled Aggregate Concrete Based on the Recycled Aggregate Porous Interface. Constr. Build. Mater. 2020, 259, 120397. [Google Scholar] [CrossRef]
- Mingshu, X.Z.T. Some Problems in T. C. Powers’ Model. J. Chin. Ceram. Soc. 1991, 3, 104–111. (In Chinese) [Google Scholar]
- Chen, X.; Wu, S.; Zhou, J. Influence of Porosity on Compressive and Tensile Strength of Cement Mortar. Constr. Build. Mater. 2013, 40, 869–874. [Google Scholar] [CrossRef]
- Brandt, A.M. Cement-Based Composites: Materials, Mechanical Properties and Performance, 2nd ed.; CRC Press: Boca Raton, FL, USA, 2009; pp. 26–48. [Google Scholar]
- Hansen, T.C. Physical Structure of Hardened Cement Paste. A Classical Approach. Mater. Struct. 1986, 19, 423–436. [Google Scholar] [CrossRef]
- Ryshkewitch, E. Compression Strength of Porous Sintered Alumina and Zirconia. J. Am. Ceram. Soc. 1953, 36, 65–68. [Google Scholar] [CrossRef]
- Guo, Y.; Wu, S.; Lyu, Z.; Shen, A.; Yin, L.; Xue, C. Pore Structure Characteristics and Performance of Construction Waste Composite Powder-Modified Concrete. Constr. Build. Mater. 2021, 269, 121262. [Google Scholar] [CrossRef]
- Jons, E.; Osbaeck, B. The Effect of Cement Composition on Strength Described by a Strength-Porosity Model. Cem. Concr. Res. 1982, 12, 167–178. [Google Scholar] [CrossRef]
- Pann, K.S.; Yen, T.; Tang, C.-W.; Lin, T.D. A New Strength Model Based on Water/Cement Ratio and Capillary Porosity. ACI Mater. J. 2003, 100, 311–318. [Google Scholar]
- Kolias, S. Investigation of the Possibility of Estimating Concrete Strength by Porosity Measurements. Mater. Struct. 1994, 27, 265–272. [Google Scholar] [CrossRef]
- Jambor, J. Pore Structure and Strength Development of Cement Composites. Cem. Concr. Res. 1990, 20, 948–954. [Google Scholar] [CrossRef]
- Wu, Z.W.; Lian, H.Z. High Performance Concrete; China Railway Publishing House: Beijing, China, 1999. (In Chinese) [Google Scholar]
- Huang, Y.Y. Some Progress in the Scientific Research of Concrete Materials (Part 1). Concr. World 2016, 7, 35–39. (In Chinese) [Google Scholar]
- Odler, M.R. Investigations on the Relationship between Porosity, Structure and Strength of Hydrated Portland Cement Pastes. II. Effect of Pore Structure and of Degree of Hydration. Cem. Concr. Res. 1985, 15, 401–410. [Google Scholar] [CrossRef]
- Atzeni, C.; Massidda, L.; Sanna, U. Effect of Pore Size Distribution on Strength of Hardened Cement Pastes. In Proceedings of the First International RILEM Congress on Pore Structure and Material Properties, Paris, France, 7–11 September 1987; pp. 195–202. [Google Scholar]
- Wittmann, F.H.; Rokugo, K.; Brühwiler, E.; Mihashi, H.; Simonin, P. Fracture Energy and Strain Softening of Concrete as Determined by Means of Compact Tension Specimens. Mater. Struct. 1988, 21, 21–32. [Google Scholar] [CrossRef]
- Kumar, R.; Bhattacharjee, B. Porosity, Pore Size Distribution and In Situ Strength of Concrete. Cem. Concr. Res. 2003, 33, 155–164. [Google Scholar] [CrossRef]
- Tang, L. A Study of the Quantitative Relationship between Strength and Pore-Size Distribution of Porous Materials. Cem. Concr. Res. 1986, 16, 87–96. [Google Scholar]
- Zhang, Y.; Zhang, X. Grey Correlation Analysis between Strength of Slag Cement and Particle Fractions of Slag Powder. Cem. Concr. Compos. 2007, 29, 498–504. [Google Scholar] [CrossRef]
- Gao, H. Study on the Relationship between Air Void Structure and Strength of Concrete Based on BP Neural Network. Constr. Technol. 2017, 46, 292–295. (In Chinese) [Google Scholar]
- Yao, X.; Li, L.; Guan, J.; Zhang, M.; Liu, Z.; Han, R.; He, S. Initial Cracking Strength and Initial Fracture Toughness from Three-Point Bending and Wedge Splitting Concrete Specimens. Fatigue Fract. Eng. Mater. Struct. 2020. [Google Scholar] [CrossRef]
- Shilpa, M.; Prakash, G.; Shivakumar, M. A combinatorial Approach to Optimize the Properties of Green Sand Used in Casting Mould. Mater. Today: Proc. 2020. [Google Scholar] [CrossRef]
- Guo, R.; Nian, T.; Zhou, F. Analysis of Factors That Influence Anti-Rutting Performance of Asphalt Pavement. Constr. Build. Mater. 2020, 254, 119237. [Google Scholar] [CrossRef]
- Mokhtar, M.; Abo-El-Enein, S.; Hassaan, M.Y.; Morsy, M.; Khalil, M. Mechanical Performance, Pore Structure and Micro-Structural Characteristics of Graphene Oxide Nano Platelets Reinforced Cement. Constr. Build. Mater. 2017, 138, 333–339. [Google Scholar] [CrossRef]
- Jin, S.; Zhang, J.; Han, S. Fractal Analysis of Relation between Strength and Pore Structure of Hardened Mortar. Constr. Build. Mater. 2017, 135, 1–7. [Google Scholar] [CrossRef]
- Chen, C.L.; Yang, H.S.; Li, W.W.; Chen, R. Micro-Pore Structures of MgO Concrete at Long-Term Age. J. Hydroelectr. Eng. 2016, 35, 118–124. (In Chinese) [Google Scholar]
- Xie, C.; Wang, Q.; Li, S.; Hui, B. Relations of Pore Structure and Compressive Strength of Concrete under Different Water to Binder Ratio and Curing Condition. Bull. Chin. Ceram. Soc. 2015, 34, 3695–3702. (In Chinese) [Google Scholar]
- Wu, H.; Li, P.; Nian, T.; Zhang, G.; He, T.; Wei, X. Evaluation of Asphalt and Asphalt Mixtures’ Water Stability Method under Multiple Freeze-Thaw Cycles. Constr. Build. Mater. 2019, 228, 117089. [Google Scholar] [CrossRef]
- Sanghvi, N.; Vora, D.; Patel, J.; Malik, A. Optimization of End Milling of Inconel 825 with Coated Tool: A Mathematical Comparison between GRA, TOPSIS and Fuzzy Logic Methods. Mater. Today Proc. 2020. [Google Scholar] [CrossRef]
- Berodier, E.; Bizzozero, J.; Muller, A. Mercury Intrusion Porosimetry. A Practical Guide to Microstructural Analysis of Cementitious Materials; CRC Press: Boca Raton, FL, USA, 2015. [Google Scholar]


| Strength (MPa) | C (%) | P (%) | rm (nm) | Distribution Rate of Pore Radius (%) | |||
|---|---|---|---|---|---|---|---|
| <10.6 (nm) | 10.6–53 (nm) | 53–106 (nm) | >106 (nm) | ||||
| 18.3 | 10.8 | 12.96 | 34.3 | 23.44 | 37.86 | 13.92 | 30.33 |
| 28.4 | 12.6 | 11.93 | 38.7 | 24.04 | 31.25 | 7.93 | 36.78 |
| 26.8 | 12.6 | 10.87 | 58.7 | 19.90 | 24.77 | 8.26 | 47.53 |
| 22.7 | 12.6 | 11.10 | 41.3 | 18.60 | 34.59 | 7.35 | 39.53 |
| 21.5 | 12.6 | 13.53 | 42.3 | 23.26 | 32.34 | 7.40 | 37.00 |
| 27.5 | 12.6 | 12.75 | 26.6 | 26.60 | 39.69 | 9.87 | 23.81 |
| 29.7 | 12.6 | 10.80 | 39.3 | 23.19 | 32.55 | 7.56 | 36.71 |
| 26.8 | 12.6 | 10.83 | 52.9 | 21.44 | 25.31 | 7.93 | 44.94 |
| 30.3 | 13.9 | 11.80 | 45.8 | 15.27 | 38.72 | 11.39 | 34.62 |
| 35.3 | 15.2 | 11.22 | 31.2 | 24.16 | 39.61 | 7.25 | 28.98 |
| 40.3 | 16.9 | 11.50 | 30.4 | 25.06 | 39.44 | 7.89 | 27.61 |
| 43.2 | 19.3 | 9.26 | 28.1 | 24.46 | 38.59 | 8.96 | 27.99 |
| 38.7 | 19.3 | 10.38 | 41.9 | 19.56 | 34.55 | 7.19 | 38.71 |
| 28.3 | 19.3 | 16.55 | 34.2 | 26.13 | 36.13 | 6.77 | 30.97 |
| 42.5 | 19.3 | 9.50 | 23.0 | 28.79 | 42.44 | 8.83 | 19.94 |
| 39.3 | 19.3 | 9.63 | 30.3 | 27.40 | 37.83 | 8.82 | 25.93 |
| 15.5 | 10.8 | 11.22 | 41.6 | 22.37 | 34.14 | 6.39 | 37.10 |
| 24.0 | 12.6 | 12.04 | 35.4 | 23.66 | 37.70 | 8.27 | 30.37 |
| 23.2 | 12.6 | 11.39 | 71.3 | 15.08 | 27.07 | 7.64 | 50.21 |
| 14.9 | 12.6 | 12.23 | 31.2 | 29.78 | 30.61 | 7.38 | 32.20 |
| 13.6 | 12.6 | 15.37 | 49.6 | 21.28 | 28.91 | 8.91 | 40.90 |
| 23.7 | 12.6 | 12.01 | 30.5 | 25.06 | 37.25 | 9.31 | 28.38 |
| 25.7 | 12.6 | 10.38 | 47.5 | 20.52 | 32.48 | 7.12 | 39.88 |
| 23.9 | 12.6 | 10.40 | 68.3 | 15.17 | 29.05 | 7.71 | 48.07 |
| 30.7 | 13.9 | 11.30 | 43.0 | 18.14 | 38.97 | 8.82 | 34.06 |
| 33.8 | 15.2 | 13.55 | 45.0 | 18.15 | 36.89 | 6.91 | 38.07 |
| 37.7 | 16.9 | 11.85 | 29.3 | 23.35 | 43.48 | 7.09 | 26.08 |
| 35.4 | 19.3 | 9.90 | 36.9 | 22.35 | 35.78 | 7.16 | 34.67 |
| 28.8 | 19.3 | 9.92 | 43.6 | 19.34 | 37.29 | 6.35 | 37.02 |
| 24.2 | 19.3 | 13.31 | 36.9 | 22.41 | 39.29 | 7.41 | 30.86 |
| 36.2 | 19.3 | 9.28 | 35.0 | 19.45 | 44.05 | 8.20 | 28.25 |
| 36.3 | 19.3 | 9.54 | 35.9 | 23.79 | 38.58 | 5.79 | 32.46 |
| 14.2 | 12.1 | 33.7 | 146.9 | 11.45 | 14.14 | 8.94 | 65.46 |
| 16.4 | 14.4 | 33.14 | 126.7 | 12.27 | 16.29 | 10.53 | 60.89 |
| 17.7 | 12.1 | 33.60 | 122.1 | 12.89 | 15.85 | 11.60 | 59.67 |
| 19.6 | 14.4 | 31.70 | 109.1 | 14.14 | 18.11 | 10.38 | 57.03 |
| Relation Degree | P | rm | C | Distribution Rate of Pore Radius (%) | |||
|---|---|---|---|---|---|---|---|
| <10.6 nm | 10.6–53 nm | 53–106 nm | >106 nm | ||||
| D(xi)/% | D(x1) | D(x2) | D(x3) | D(x4) | D(x5) | D(x6) | D(x7) |
| 99.26 | 99.17 | 99.90 | 99.81 | 99.91 | 99.70 | 99.57 | |
| Type | Strength (MPa) | P/% | rm/µm | Distribution Rate of Pore Size (%) | |||||
|---|---|---|---|---|---|---|---|---|---|
| 10–200 µm | 200–400 µm | 400–600 µm | 600–800 µm | 800–1200 µm | 1200–1600 µm | ||||
| 0 | 42 | 1.05 | 91 | 0.1 | 0.11 | 0.18 | 0.24 | 0.20 | 0.21 |
| A1 | 28 | 5.78 | 120 | 0.5 | 1.55 | 1.87 | 0.89 | 0.65 | 0.32 |
| A2 | 27.8 | 6.07 | 113 | 0.56 | 1.76 | 1.89 | 0.93 | 0.55 | 0.39 |
| A3 | 24.2 | 8.28 | 114 | 0.81 | 2.22 | 2.82 | 1.21 | 0.75 | 0.46 |
| B1 | 27.5 | 6.81 | 119 | 0.48 | 2.00 | 2.71 | 0.93 | 0.47 | 0.22 |
| B2 | 26.1 | 7.09 | 116 | 0.63 | 1.85 | 2.51 | 1.09 | 0.55 | 0.45 |
| B3 | 25 | 8.29 | 113 | 0.90 | 2.38 | 2.96 | 1.15 | 0.59 | 0.31 |
| C1 | 39.7 | 2.51 | 97 | 0.44 | 0.64 | 0.57 | 0.41 | 0.21 | 0.24 |
| C2 | 30.3 | 4.62 | 111 | 0.46 | 0.94 | 1.44 | 0.89 | 0.56 | 0.32 |
| D1 | 37.8 | 2.60 | 116 | 0.28 | 0.62 | 0.75 | 0.43 | 0.28 | 0.23 |
| D2 | 29.8 | 5.87 | 118 | 0.31 | 1.51 | 2.36 | 0.96 | 0.49 | 0.24 |
| E1 | 37.2 | 1.66 | 127 | 0.20 | 0.2 | 0.50 | 0.32 | 0.18 | 0.17 |
| E2 | 34.4 | 2.47 | 133 | 0.21 | 0.23 | 0.84 | 0.45 | 0.44 | 0.29 |
| E3 | 27.6 | 6.74 | 126 | 0.57 | 1.60 | 2.81 | 1.05 | 0.53 | 0.19 |
| F1 | 24.2 | 6.70 | 139 | 0.23 | 1.55 | 2.86 | 1.07 | 0.59 | 0.40 |
| F2 | 26.2 | 7.18 | 122 | 0.52 | 2.07 | 2.44 | 1.02 | 0.63 | 0.49 |
| F3 | 23.7 | 7.33 | 126 | 0.55 | 1.87 | 2.70 | 1.14 | 0.68 | 0.39 |
| G1 | 29.5 | 5.35 | 115 | 0.49 | 1.31 | 1.79 | 0.82 | 0.52 | 0.41 |
| G2 | 24.0 | 8.34 | 109 | 0.92 | 2.41 | 2.94 | 1.09 | 0.57 | 0.41 |
| G3 | 21.9 | 8.68 | 124 | 0.82 | 2.36 | 3.07 | 1.26 | 0.70 | 0.47 |
| H1 | 40.7 | 1.81 | 95 | 0.36 | 0.45 | 0.41 | 0.30 | 0.15 | 0.14 |
| H2 | 38.0 | 2.62 | 101 | 0.38 | 0.61 | 0.73 | 0.35 | 0.35 | 0.20 |
| H3 | 32.9 | 3.31 | 103 | 0.37 | 0.79 | 1.04 | 0.55 | 0.36 | 0.20 |
| H4 | 35.1 | 3.16 | 98 | 0.62 | 0.97 | 0.90 | 0.33 | 0.23 | 0.10 |
| H5 | 33.4 | 4.12 | 87 | 0.61 | 1.39 | 1.31 | 0.43 | 0.25 | 0.13 |
| H6 | 27.5 | 8.21 | 97 | 1.06 | 2.56 | 2.74 | 1.07 | 0.50 | 0.28 |
| L1 | 38.8 | 1.95 | 121 | 0.28 | 0.34 | 0.50 | 0.36 | 0.25 | 0.24 |
| L2 | 37.5 | 2.11 | 122 | 0.31 | 0.39 | 0.55 | 0.37 | 0.31 | 0.17 |
| L3 | 36.4 | 2.29 | 129 | 0.32 | 0.40 | 0.62 | 0.45 | 0.23 | 0.26 |
| L4 | 32.1 | 3.33 | 129 | 0.50 | 0.65 | 1.20 | 0.57 | 0.29 | 0.12 |
| Relation Degree | P | rm | Distribution Rate of Pore Radius (%) | |||||
|---|---|---|---|---|---|---|---|---|
| 10–200 µm | 200–400 µm | 400–600 µm | 600–800 µm | 800–1200 µm | 1200–1600 µm | |||
| D(xi)/% | D(x1) | D(x2) | D(x3) | D(x4) | D(x5) | D(x6) | D(x7) | D(x8) |
| 99.28 | 99.74 | 99.70 | 99.12 | 99.60 | 99.81 | 99.66 | 99.29 | |
| Equation Number | Equation | Regression Equation | R |
|---|---|---|---|
| Equation (6) | 0.780 | ||
| Equation (8) | 0.850 | ||
| Equation (9) | 0.554 | ||
| Equation (10) | 0.522 | ||
| Equation (11) | 0.557 | ||
| Equation (12) | 0.551 | ||
| Equation (13) | 0.578 |
| K2 | ƞ | Test Strength | Equation (6) Strength | Error (%) | Equation (8) Strength | Error (%) |
|---|---|---|---|---|---|---|
| 2379.8 | 2.523 | 42 | 36.46 | 13.19 | 43.99 | 4.73 |
| 2379.8 | 2.523 | 28 | 30.23 | 7.97 | 29.94 | 6.91 |
| 2379.8 | 2.523 | 27.8 | 31.06 | 11.72 | 30.68 | 10.35 |
| 2379.8 | 2.523 | 24.2 | 30.19 | 24.77 | 29.13 | 20.36 |
| 2379.8 | 2.523 | 27.5 | 30.03 | 9.19 | 28.00 | 1.82 |
| 2379.8 | 2.523 | 26.1 | 30.32 | 16.18 | 30.00 | 14.94 |
| 2379.8 | 2.523 | 25 | 30.32 | 21.30 | 28.50 | 14.00 |
| 2379.8 | 2.523 | 39.7 | 34.79 | 12.36 | 35.48 | 10.62 |
| 2379.8 | 2.523 | 30.3 | 31.82 | 5.02 | 35.24 | 16.31 |
| 2379.8 | 2.523 | 37.8 | 31.79 | 15.91 | 32.62 | 13.70 |
| 2379.8 | 2.523 | 29.8 | 30.46 | 2.21 | 31.08 | 4.30 |
| 2379.8 | 2.523 | 37.2 | 30.67 | 17.55 | 33.98 | 8.65 |
| 2379.8 | 2.523 | 34.4 | 29.73 | 13.59 | 32.02 | 6.93 |
| 2379.8 | 2.523 | 27.6 | 29.20 | 5.81 | 29.09 | 5.38 |
| 2379.8 | 2.523 | 24.2 | 27.82 | 14.94 | 28.05 | 15.91 |
| 2379.8 | 2.523 | 26.2 | 29.54 | 12.74 | 28.09 | 7.23 |
| 2379.8 | 2.523 | 23.7 | 29.02 | 22.44 | 28.88 | 21.84 |
| 2379.8 | 2.523 | 29.5 | 31.02 | 5.16 | 30.65 | 3.89 |
| 2379.8 | 2.523 | 24 | 30.86 | 28.58 | 28.15 | 17.30 |
| 2379.8 | 2.523 | 21.9 | 28.83 | 31.62 | 27.71 | 26.54 |
| 2379.8 | 2.523 | 40.7 | 35.41 | 13.00 | 36.38 | 10.62 |
| 2379.8 | 2.523 | 38 | 34.06 | 10.37 | 31.41 | 17.34 |
| 2379.8 | 2.523 | 32.9 | 33.49 | 1.79 | 34.45 | 4.70 |
| 2379.8 | 2.523 | 35.1 | 34.38 | 2.04 | 28.04 | 20.12 |
| 2379.8 | 2.523 | 33.4 | 36.13 | 8.18 | 29.45 | 11.81 |
| 2379.8 | 2.523 | 27.5 | 32.76 | 19.12 | 29.84 | 8.52 |
| 2379.8 | 2.523 | 38.8 | 31.33 | 19.25 | 33.97 | 12.45 |
| 2379.8 | 2.523 | 37.5 | 31.15 | 16.93 | 32.92 | 12.22 |
| 2379.8 | 2.523 | 36.4 | 30.24 | 16.93 | 33.82 | 7.08 |
| 2379.8 | 2.523 | 32.1 | 29.92 | 6.80 | 31.23 | 2.70 |
Publisher’s Note: MDPI stays neutral with regard to jurisdictional claims in published maps and institutional affiliations. |
© 2021 by the authors. Licensee MDPI, Basel, Switzerland. This article is an open access article distributed under the terms and conditions of the Creative Commons Attribution (CC BY) license (http://creativecommons.org/licenses/by/4.0/).
Share and Cite
Zhang, M.; Yao, X.; Guan, J.; Li, L.; Wang, J.; Qing, L. Study of Concrete Strength and Pore Structure Model Based on Grey Relation Entropy. Materials 2021, 14, 432. https://doi.org/10.3390/ma14020432
Zhang M, Yao X, Guan J, Li L, Wang J, Qing L. Study of Concrete Strength and Pore Structure Model Based on Grey Relation Entropy. Materials. 2021; 14(2):432. https://doi.org/10.3390/ma14020432
Chicago/Turabian StyleZhang, Min, Xianhua Yao, Junfeng Guan, Lielie Li, Juan Wang, and Longbang Qing. 2021. "Study of Concrete Strength and Pore Structure Model Based on Grey Relation Entropy" Materials 14, no. 2: 432. https://doi.org/10.3390/ma14020432
APA StyleZhang, M., Yao, X., Guan, J., Li, L., Wang, J., & Qing, L. (2021). Study of Concrete Strength and Pore Structure Model Based on Grey Relation Entropy. Materials, 14(2), 432. https://doi.org/10.3390/ma14020432