A Numerical Study of Geometry’s Impact on the Thermal and Mechanical Properties of Periodic Surface Structures


Abstract
1. Introduction
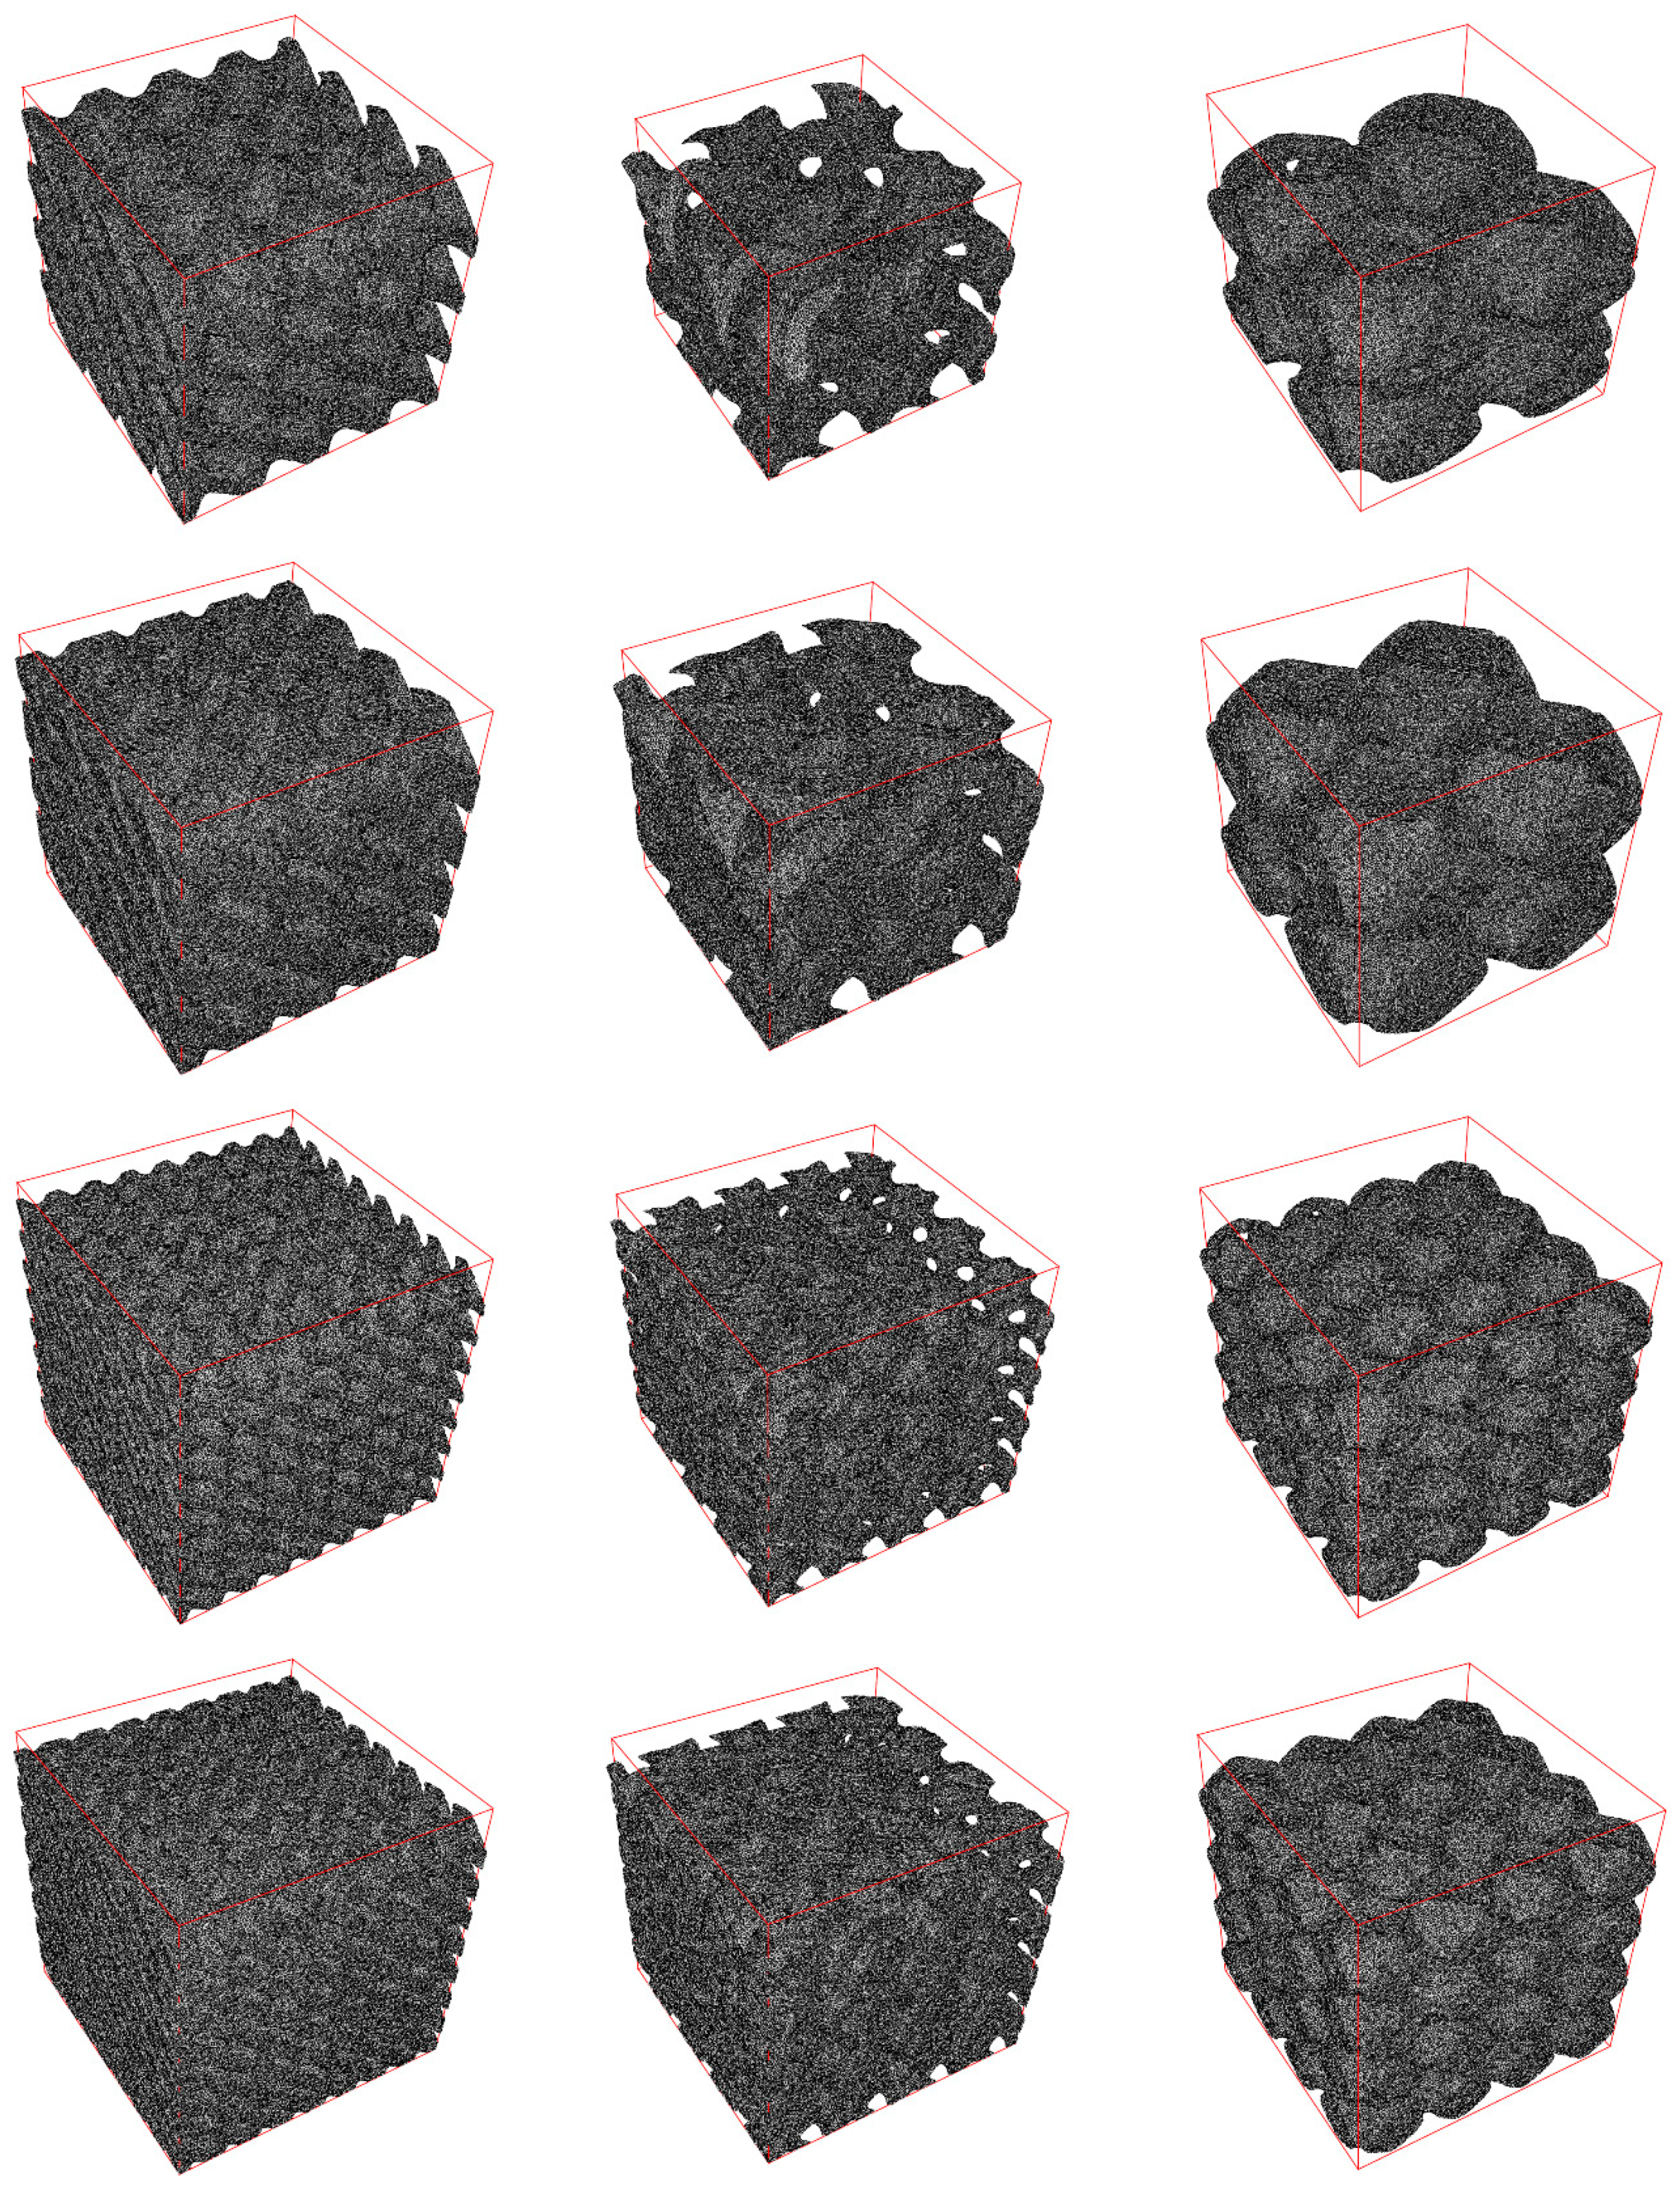
2. Methods
3. Numerical Simulations Results and Discussion
4. Conclusions
Author Contributions
Funding
Institutional Review Board Statement
Informed Consent Statement
Data Availability Statement
Conflicts of Interest
References
- Fee, C. 3D-printed porous bed structures. Curr. Opin. Chem. Eng. 2017, 18, 10–15. [Google Scholar] [CrossRef]
- Maskery, I.; Aboulkhair, N.T.; Aremu, A.O.; Tuck, C.J.; Ashcroft, I.A. Compressive failure modes and energy absorption in additively manufactured double gyroid lattices. Addit. Manuf. 2017, 16, 24–29. [Google Scholar] [CrossRef]
- Sychov, M.; Lebedev, L.; Dyachenko, S.V.; Nefedova, L.A. Mechanical properties of energy-absorbing structures with triply periodic minimal surface topology. Acta Astronaut. 2017, 150, 81–84. [Google Scholar] [CrossRef]
- Khan, K.; Abu Al-Rub, R. Time dependent response of architectured neovius foams. Int. J. Mech. Sci. 2017, 126, 106–119. [Google Scholar] [CrossRef]
- Monkova, K.; Monka, P.; Zetkova, I.; Hanzl, P.; Mandulak, D. Three approaches to the gyroid structure modelling as a base of lightweight component produced by additive technology. In Proceedings of the 2nd International Conference on Computational Modeling, Simulation and Applied Mathematics (CMSAM 2017), Beijing, China, 22–23 October 2017. [Google Scholar] [CrossRef][Green Version]
- Kapfer, S.C.; Hyde, S.T.; Mecke, K.; Arns, C.H.; Schroder-Turk, G.E. Minimal surface scaffold designs for tissue engineering. Biomaterials 2011, 32, 6875–6882. [Google Scholar] [CrossRef]
- Ya, C.; Hao, L.; Hussein, A.; Young, P. Ti–6Al–4V triply periodic minimal surface structures for bone implants fabricated via selective laser melting. J. Mech. Behav. Biomed. Mater. 2015, 51, 61–73. [Google Scholar]
- Schoen, A. Infinite Periodic Minimal Surfaces without Self-Intersections; TN D-5541; NASA: Washington, DC, USA, 1970. [Google Scholar]
- Torquato, S.; Hyun, S.; Donev, A. Multifunctional composites: Optimizing microstructures for simultaneous transport of heat and electricity. Phys. Rev. Lett. 2002, 89, 266601. [Google Scholar] [CrossRef]
- Shi, J.; Zhu, L.; Li, L.; Li, Z.; Yang, J.; Wang, X. A TPMS-based method for modeling porous scaffolds for bionic bone tissue engineering. Sci. Rep. 2018, 8, 7395. [Google Scholar] [CrossRef]
- Chandler, D.L. 3-D-Graphene-Strongest-Lightest-Materials. Available online: http://news.mit.edu/2017/3-d-graphene-strongest-lightest-materials-0106 (accessed on 15 January 2021).
- Jung, G.S.; Yeo, J.; Tian, Z.; Qin, Z.; Buehler, M.J. Unusually low and density-insensitive thermal conductivity of three-dimensional gyroid graphene. Nanoscale 2017, 9, 13477–13484. [Google Scholar] [CrossRef]
- Krawiec, P.; Domek, G.; Warguła, Ł.; Waluś, K.; Adamiec, J. The application of the optical system ATOS II for rapid prototyping methods of non-classical models of cogbelt pulleys. In Proceedings of the Machine Modelling and Simulations 2017 (MMS 2017), Sklené Teplice, Slovakia, 5–8 September 2017. [Google Scholar]
- Maresky, H.S.; Rootman, J.M.; Klar, M.M.; Levitt, M.; Kossar, A.P.; Zucker, D.; Glazier, M.; Kalmanovich-Avnery, S.; Aviv, R.; Ertl-Wagner, B.; et al. Bringing prevost’s sign into the third dimension: Artificial intelligence estimation of conjugate gaze adjusted length (CGAL) and correlation with acute ischemic stroke. Medicine 2020, 99, e23330. [Google Scholar] [CrossRef]
- Fabri, A.; Pion, S. CGAL–The Computational Geometry Algorithms Library. In Proceedings of the 17th ACM SIGSPATIAL International Conference on Advances in Geographic Information Systems (ACM GIS ’09), Seattle, WA, USA, 4–6 November 2009; pp. 538–539. [Google Scholar]
- Wang, B.; Mei, G.; Xu, N. Method for generating high-quality tetrahedral meshes of geological models by utilizing CGAL. MethodsX 2020, 7, 101061. [Google Scholar] [CrossRef] [PubMed]
- Yang, L.; Yan, C.; Han, C.; Chen, P.; Yang, S.; Shi, Y. Mechanical response of a triply periodic minimal surface cellular structures manufactured by selective laser melting. Int. J. Mech. Sci. 2018, 148, 149–157. [Google Scholar] [CrossRef]
- Abueidda, D.W.; Bakir, M.; Al-Rub RK, A.; Bergström, J.S.; Sobh, N.A.; Jasiuk, I. Mechanical properties of 3D printed polymeric cellular materials with triply periodic minimal surface architectures. Mater. Des. 2017, 122, 255–267. [Google Scholar] [CrossRef]
- Wang, X.; Wang, C.; Zhou, X.; Wang, D.; Zhang, M.; Gao, Y.; Wang, L.; Zhang, P. Evaluating lattice mechanical properties for lightweight heat-resistant load-bearing structure design. Materials 2020, 13, 4786. [Google Scholar] [CrossRef] [PubMed]
- Mangipudi, K.R.; Epler, E.; Volkert, C.A. Topology-dependent scaling laws for the stiffness and strength of nanoporous gold. Acta Mater. 2016, 119, 115–122. [Google Scholar] [CrossRef]
- Zienkiewicz, O.C.; Taylor, R.L.; Zhu, J.Z. The Finite Element Method: Its Basis and Fundamentals, 7th ed.; Butterworth-Heinemann: Oxford, UK, 2013; ISBN 9781856176330. [Google Scholar]
- Gawronska, E.; Dyja, R.; Sczygiol, N. Numerical simulations of stress distribution in complex structures with various average volume fraction. Lect. Notes Eng. Comput. Sci. 2018, 2238, 677–681. [Google Scholar]
- Dyja, R.; Gawronska, E.; Grosser, A. Numerical Problems Related to Solving the Navier-Stokes Equations in Connection with the Heat Transfer with the Use of FEM. Procedia Eng. 2017, 177, 78–85. [Google Scholar] [CrossRef]
- Lord, E.; Mackay, A. Periodic Minimal Surfaces of Cubic Symmetry. Curr. Sci. 2003, 85, 346–362. [Google Scholar]
- Weatherburn, C.E. Differential Geometry of Three Dimensions; Cambridge University Press: Cambridge, UK, 1927; Volume 1. [Google Scholar]
- Jung, Y.; Chu, K.T.; Torquato, S. A Variational Level Set Approach for Surface Area Minimization of Triply Periodic Surfaces. J. Comput. Phys. 2006, 223, 711–730. [Google Scholar] [CrossRef][Green Version]
- CGAL software. Available online: https://www.cgal.org/ (accessed on 15 January 2021).
- Wang, Z.; Wang, X.; Gao, T.; Shi, C. Mechanical behavior and deformation mechanism of triply periodic minimal surface sheet under compressive loading. Mech. Adv. Mater. Struct. 2020, 1–13. [Google Scholar] [CrossRef]
- Zhang, L.; Feih, S.; Daynes, S.; Chang, S.; Wang, M.Y.; Wei, J.; Lu, F.U. Energy absorption characteristics of metallic triply periodic minimal surface sheet structures under compressive loading. Addit. Manuf. 2018, 23, 505–515. [Google Scholar] [CrossRef]
- Yang, E.; Leary, M.; Lozanovski, B.; Downing, D.; Mazur, M.; Sarker, A.; Khorasani, A.; Jones, A.; Maconachie, T.; Bateman, S.; et al. Effect of geometry on the mechanical properties of Ti-6Al-4V Gyroid structures fabricated via SLM: A numerical study. Mater. Des. 2019, 184, 108165. [Google Scholar] [CrossRef]
- Wilczyński, D.; Malujda, I.; Talaśka, K.; Długi, R. The study of mechanical properties of natural polymers in the compacting process. Procedia Eng. 2017, 177, 411–418. [Google Scholar] [CrossRef]
- Byrne, D.P.; Lacroix, D.; Planell, J.A.; Kelly, D.J.; Prendergast, P.J. Simulation of tissue differentiation in a scaffold as a function of porosity, Young’s modulus and dissolution rate: Application of mechanobiological models in tissue engineering. Biomaterials 2008, 28, 5544–5554. [Google Scholar] [CrossRef] [PubMed]
- Hehl, F.; Yakov, I. The Cauchy Relations in Linear Elasticity Theory. J. Elast. 2002, 66. [Google Scholar] [CrossRef]
- Downing, D.; Jones, A.; Brandt, M.; Leary, M. Increased efficiency gyroid structures by tailored material distribution. Mater. Des. 2021, 197, 109096. [Google Scholar] [CrossRef]
- Khogalia, E.H.; Choo, H.L.; Yap, W.H. Performance of Triply Periodic Minimal Surface Lattice Structures Under Compressive Loading for Tissue Engineering Applications. AIP Conf. Proc. 2020, 2233, 020012. [Google Scholar]


| Name | Relative Thickness δ [.] | Thickness [m] | Volume [m3] | Volume Fraction [.] | Side Area [m2] | Side Area Fraction [.] |
|---|---|---|---|---|---|---|
| cube | - | - | 6.400 × 10⁻⁵ | 1.0000 | 16.000 × 10⁻⁴ | 1.0000 |
| diamond (D) 2 cells | 0.125 | 0.0023 | 2.633 × 10⁻⁵ | 0.4114 | 4.385 × 10⁻⁴ | 0.2741 |
| diamond (D) 2 cells | 0.2 | 0.0041 | 4.254 × 10⁻⁵ | 0.6647 | 8.389 × 10⁻⁴ | 0.5243 |
| diamond (D) 4 cells | 0.125 | 0.0011 | 2.638 × 10⁻⁵ | 0.4122 | 3.555 × 10⁻⁴ | 0.2222 |
| diamond (D) 4 cells | 0.2 | 0.0020 | 4.266 × 10⁻⁵ | 0.6666 | 7.536 × 10⁻⁴ | 0.4710 |
| gyroid (G) 2 cells | 0.125 | 0.0023 | 2.069 × 10⁻⁵ | 0.3233 | 3.603 × 10⁻⁴ | 0.2252 |
| gyroid (G) 2 cells | 0.2 | 0.0040 | 3.343 × 10⁻⁵ | 0.5223 | 6.603 × 10⁻⁴ | 0.4127 |
| gyroid (G) 4 cells | 0.125 | 0.0012 | 2.071 × 10⁻⁵ | 0.3235 | 2.892 × 10⁻⁴ | 0.1808 |
| gyroid (G) 4 cells | 0.2 | 0.0020 | 3.347 × 10⁻⁵ | 0.5230 | 5.876 × 10⁻⁴ | 0.3673 |
| primitive (P) 2 cells | 0.125 | 0.0028 | 1.828 × 10⁻⁵ | 0.2856 | 3.138 × 10⁻⁴ | 0.1961 |
| Primitive (P) 2 cells | 0.2 | 0.0045 | 2.930 × 10⁻⁵ | 0.4579 | 5.545 × 10⁻⁴ | 0.3466 |
| primitive (P) 4 cells | 0.125 | 0.0012 | 1.829 × 10⁻⁵ | 0.2857 | 2.733 × 10⁻⁴ | 0.1708 |
| primitive (P) 4 cells | 0.2 | 0.0024 | 2.933 × 10⁻⁵ | 0.4584 | 5.096 × 10⁻⁴ | 0.3185 |
| Name | Relative Thickness [.] | Number of Nodes | Number of Elements |
|---|---|---|---|
| cube | - | 45,142 | 245,979 |
| diamond (D) 2 cells | 0.125 | 325,910 | 1,087,687 |
| diamond (D) 2 cells | 0.2 | 322,198 | 1,122,255 |
| diamond (D) 4 cells | 0.125 | 551,898 | 1,731,035 |
| diamond (D) 4 cells | 0.2 | 544,391 | 1,911,853 |
| gyroid (G) 2 cells | 0.125 | 269,511 | 890,282 |
| gyroid (G) 2 cells | 0.2 | 283,175 | 967,104 |
| gyroid (G) 4 cells | 0.125 | 457,834 | 1,410,877 |
| gyroid (G) 4 cells | 0.2 | 479,653 | 1,610,759 |
| primitive (P) 2 cells | 0.125 | 211,320 | 706,578 |
| Primitive (P) 2 cells | 0.2 | 224,711 | 775,721 |
| primitive (P) 4 cells | 0.125 | 355,299 | 1,096,937 |
| primitive (P) 4 cells | 0.2 | 378,416 | 1,274,439 |
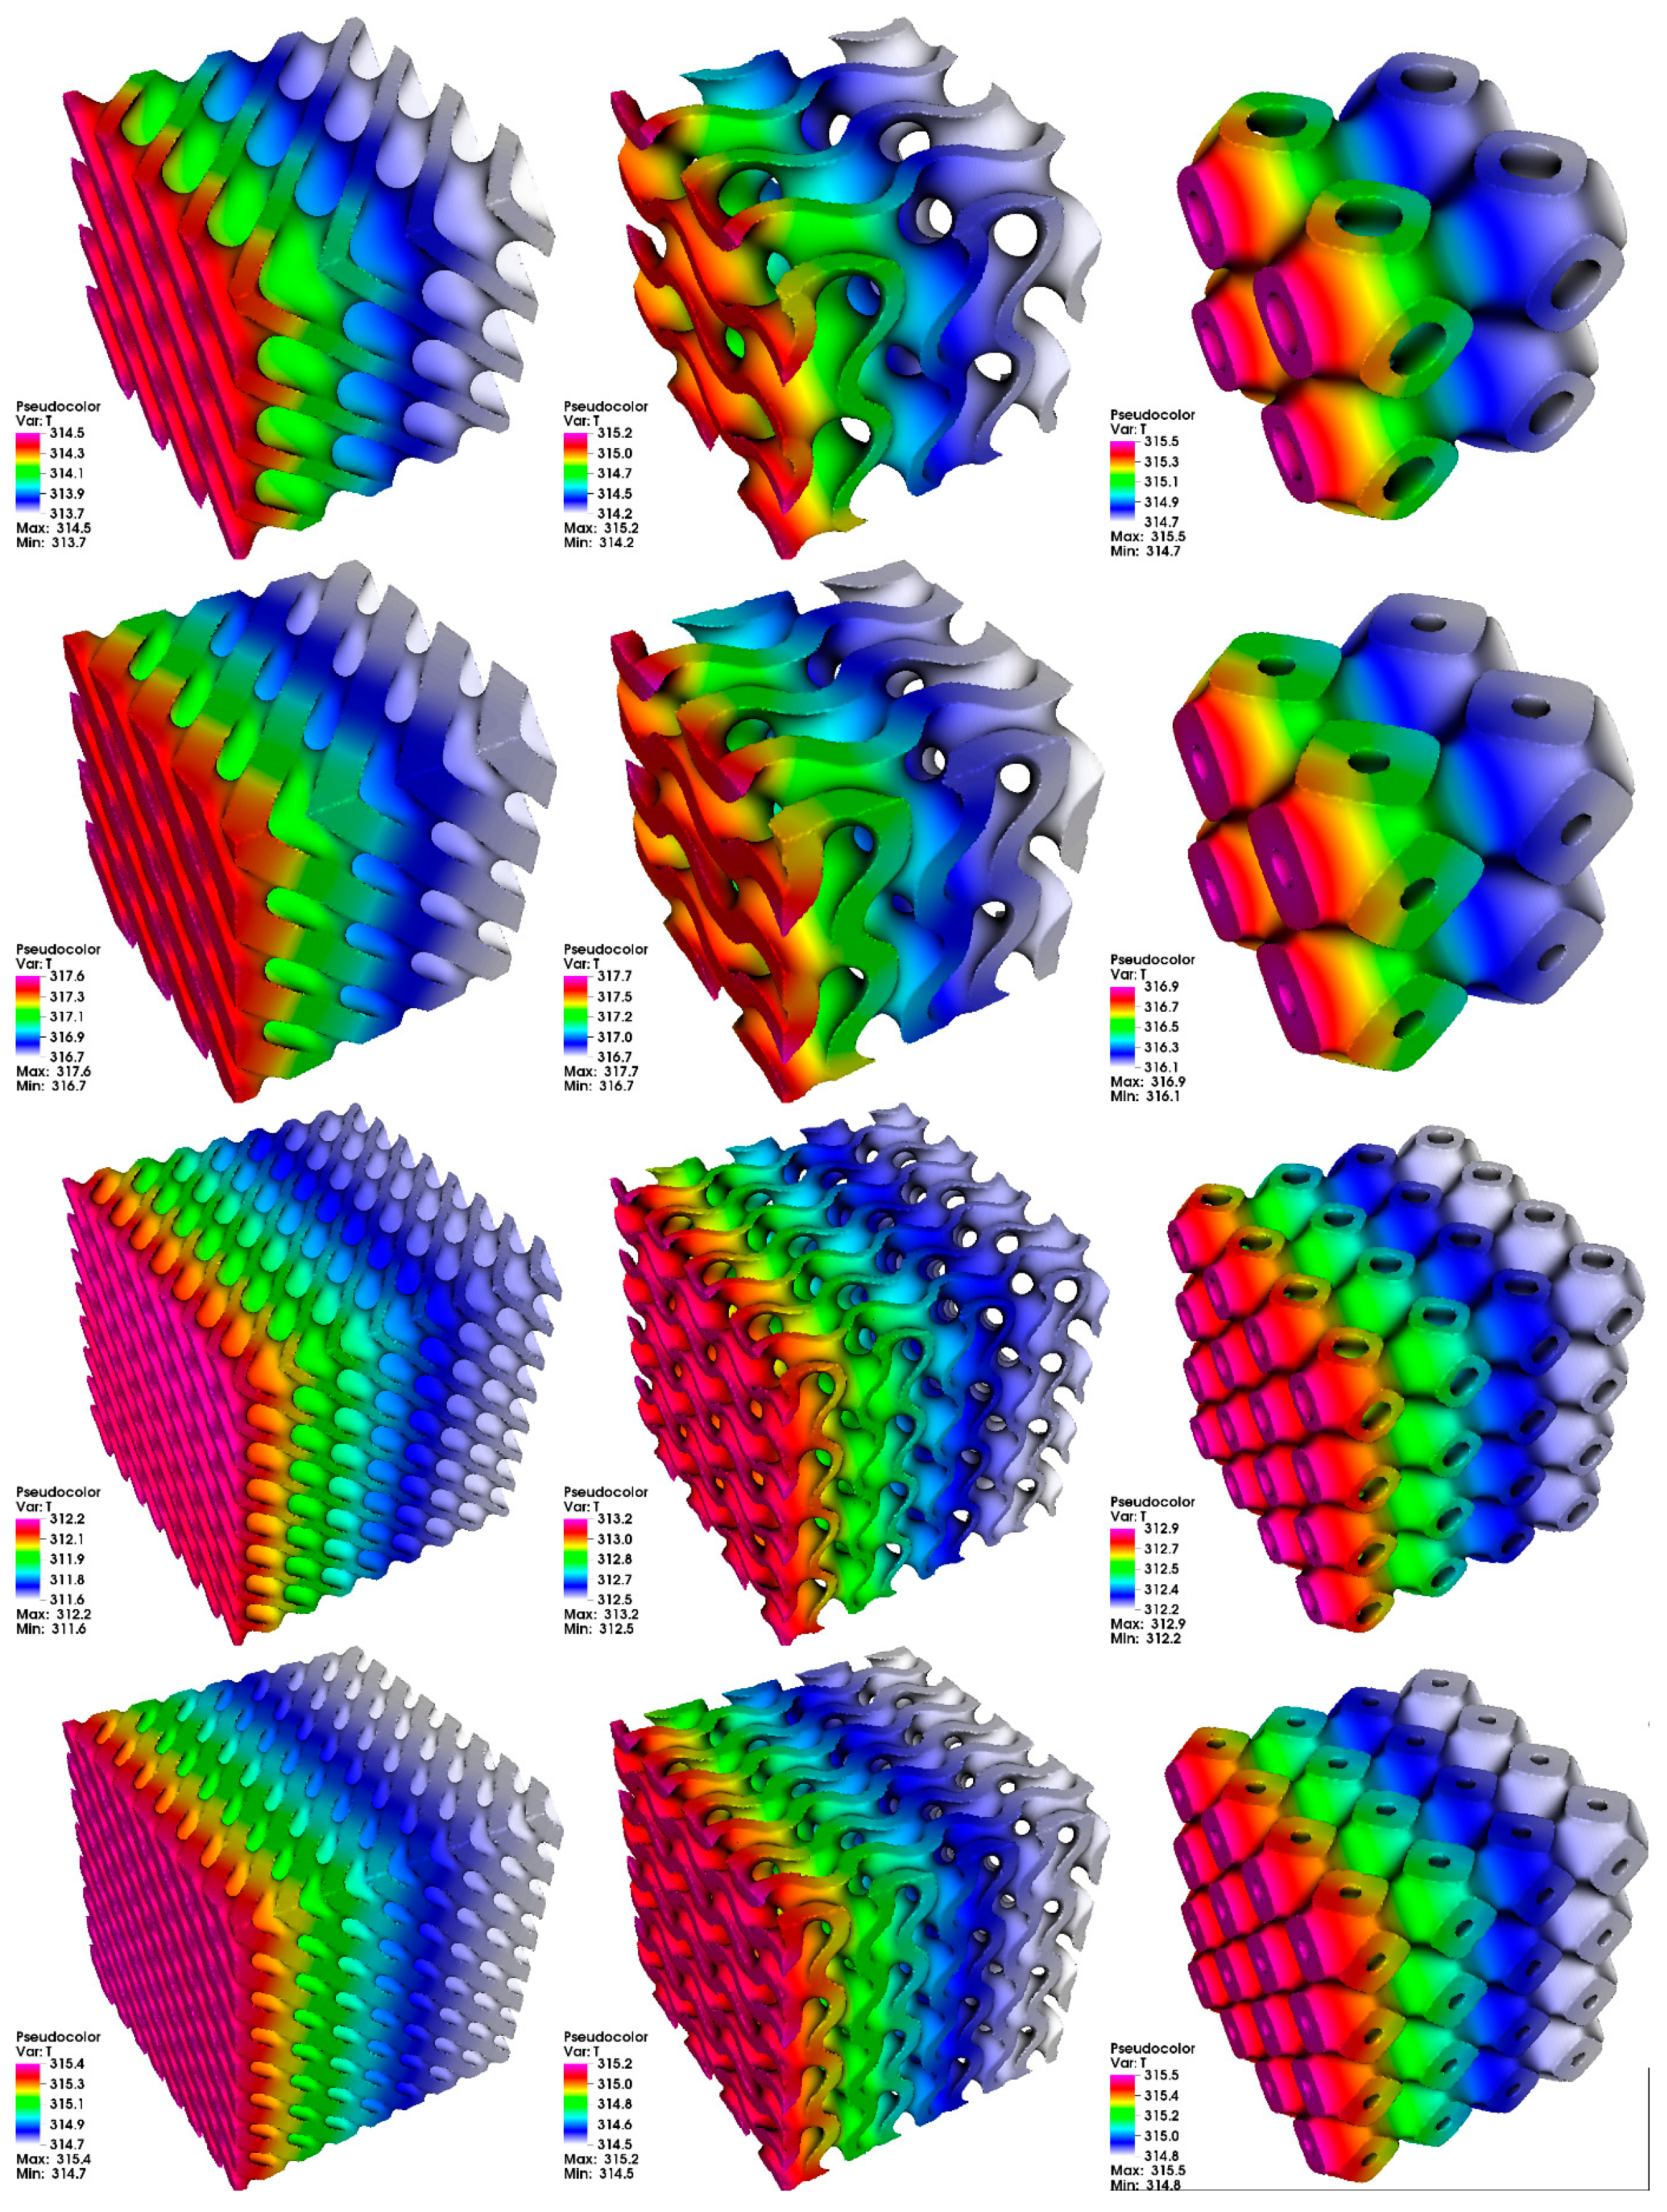
| Name | Relative Thickness [.] | Minimum Temperature [K] | Maximum Temperature [K] | Temperature Difference ΔT [K] |
|---|---|---|---|---|
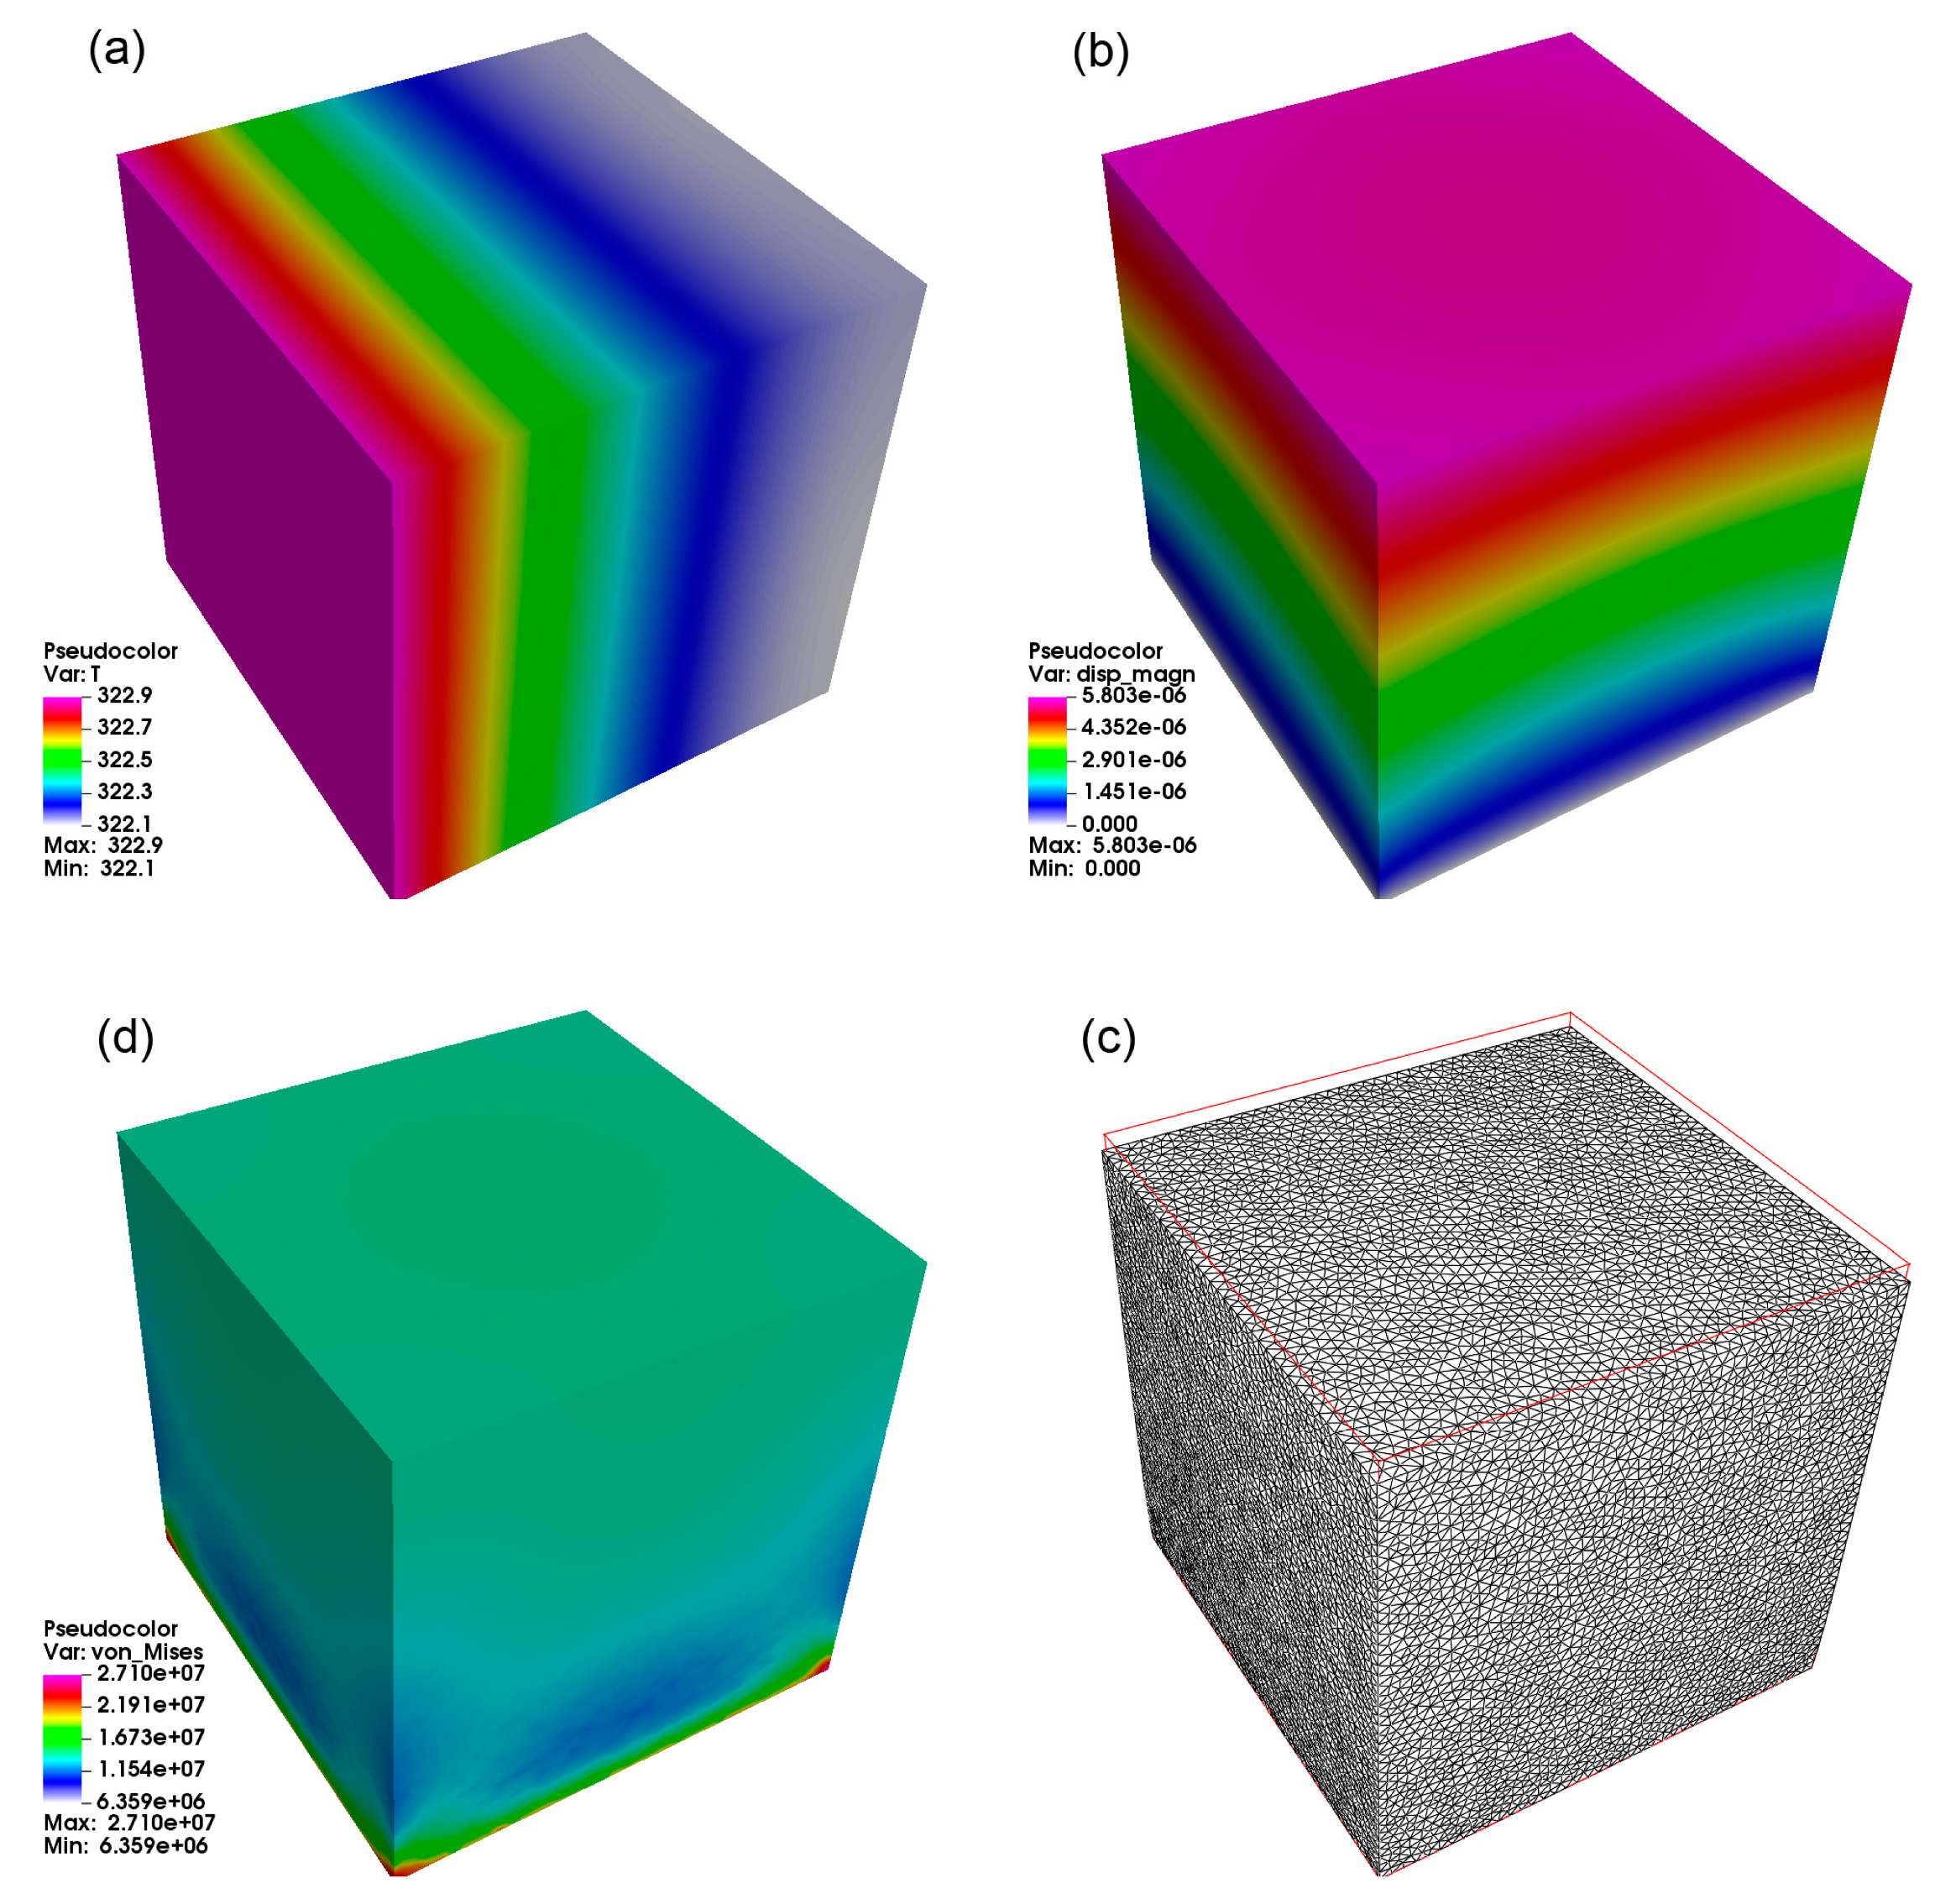
| cube | - | 322.1 | 322.9 | 0.8 |
| diamond (D) 2 cells | 0.125 | 313.7 | 314.5 | 0.8 |
| diamond (D) 2 cells | 0.2 | 316.7 | 317.6 | 0.9 |
| diamond (D) 4 cells | 0.125 | 311.6 | 312.2 | 0.6 |
| diamond (D) 4 cells | 0.2 | 314.7 | 315.4 | 0.7 |
| gyroid (G) 2 cells | 0.125 | 314.2 | 315.2 | 1.0 |
| gyroid (G) 2 cells | 0.2 | 316.7 | 317.7 | 1.0 |
| gyroid (G) 4 cells | 0.125 | 312.5 | 313.2 | 0.7 |
| gyroid (G) 4 cells | 0.2 | 314.5 | 315.2 | 0.7 |
| primitive (P) 2 cells | 0.125 | 314.7 | 315.5 | 0.8 |
| Primitive (P) 2 cells | 0.2 | 316.1 | 316.9 | 0.8 |
| primitive (P) 4 cells | 0.125 | 312.2 | 312.9 | 0.7 |
| primitive (P) 4 cells | 0.2 | 314.8 | 315.5 | 0.7 |
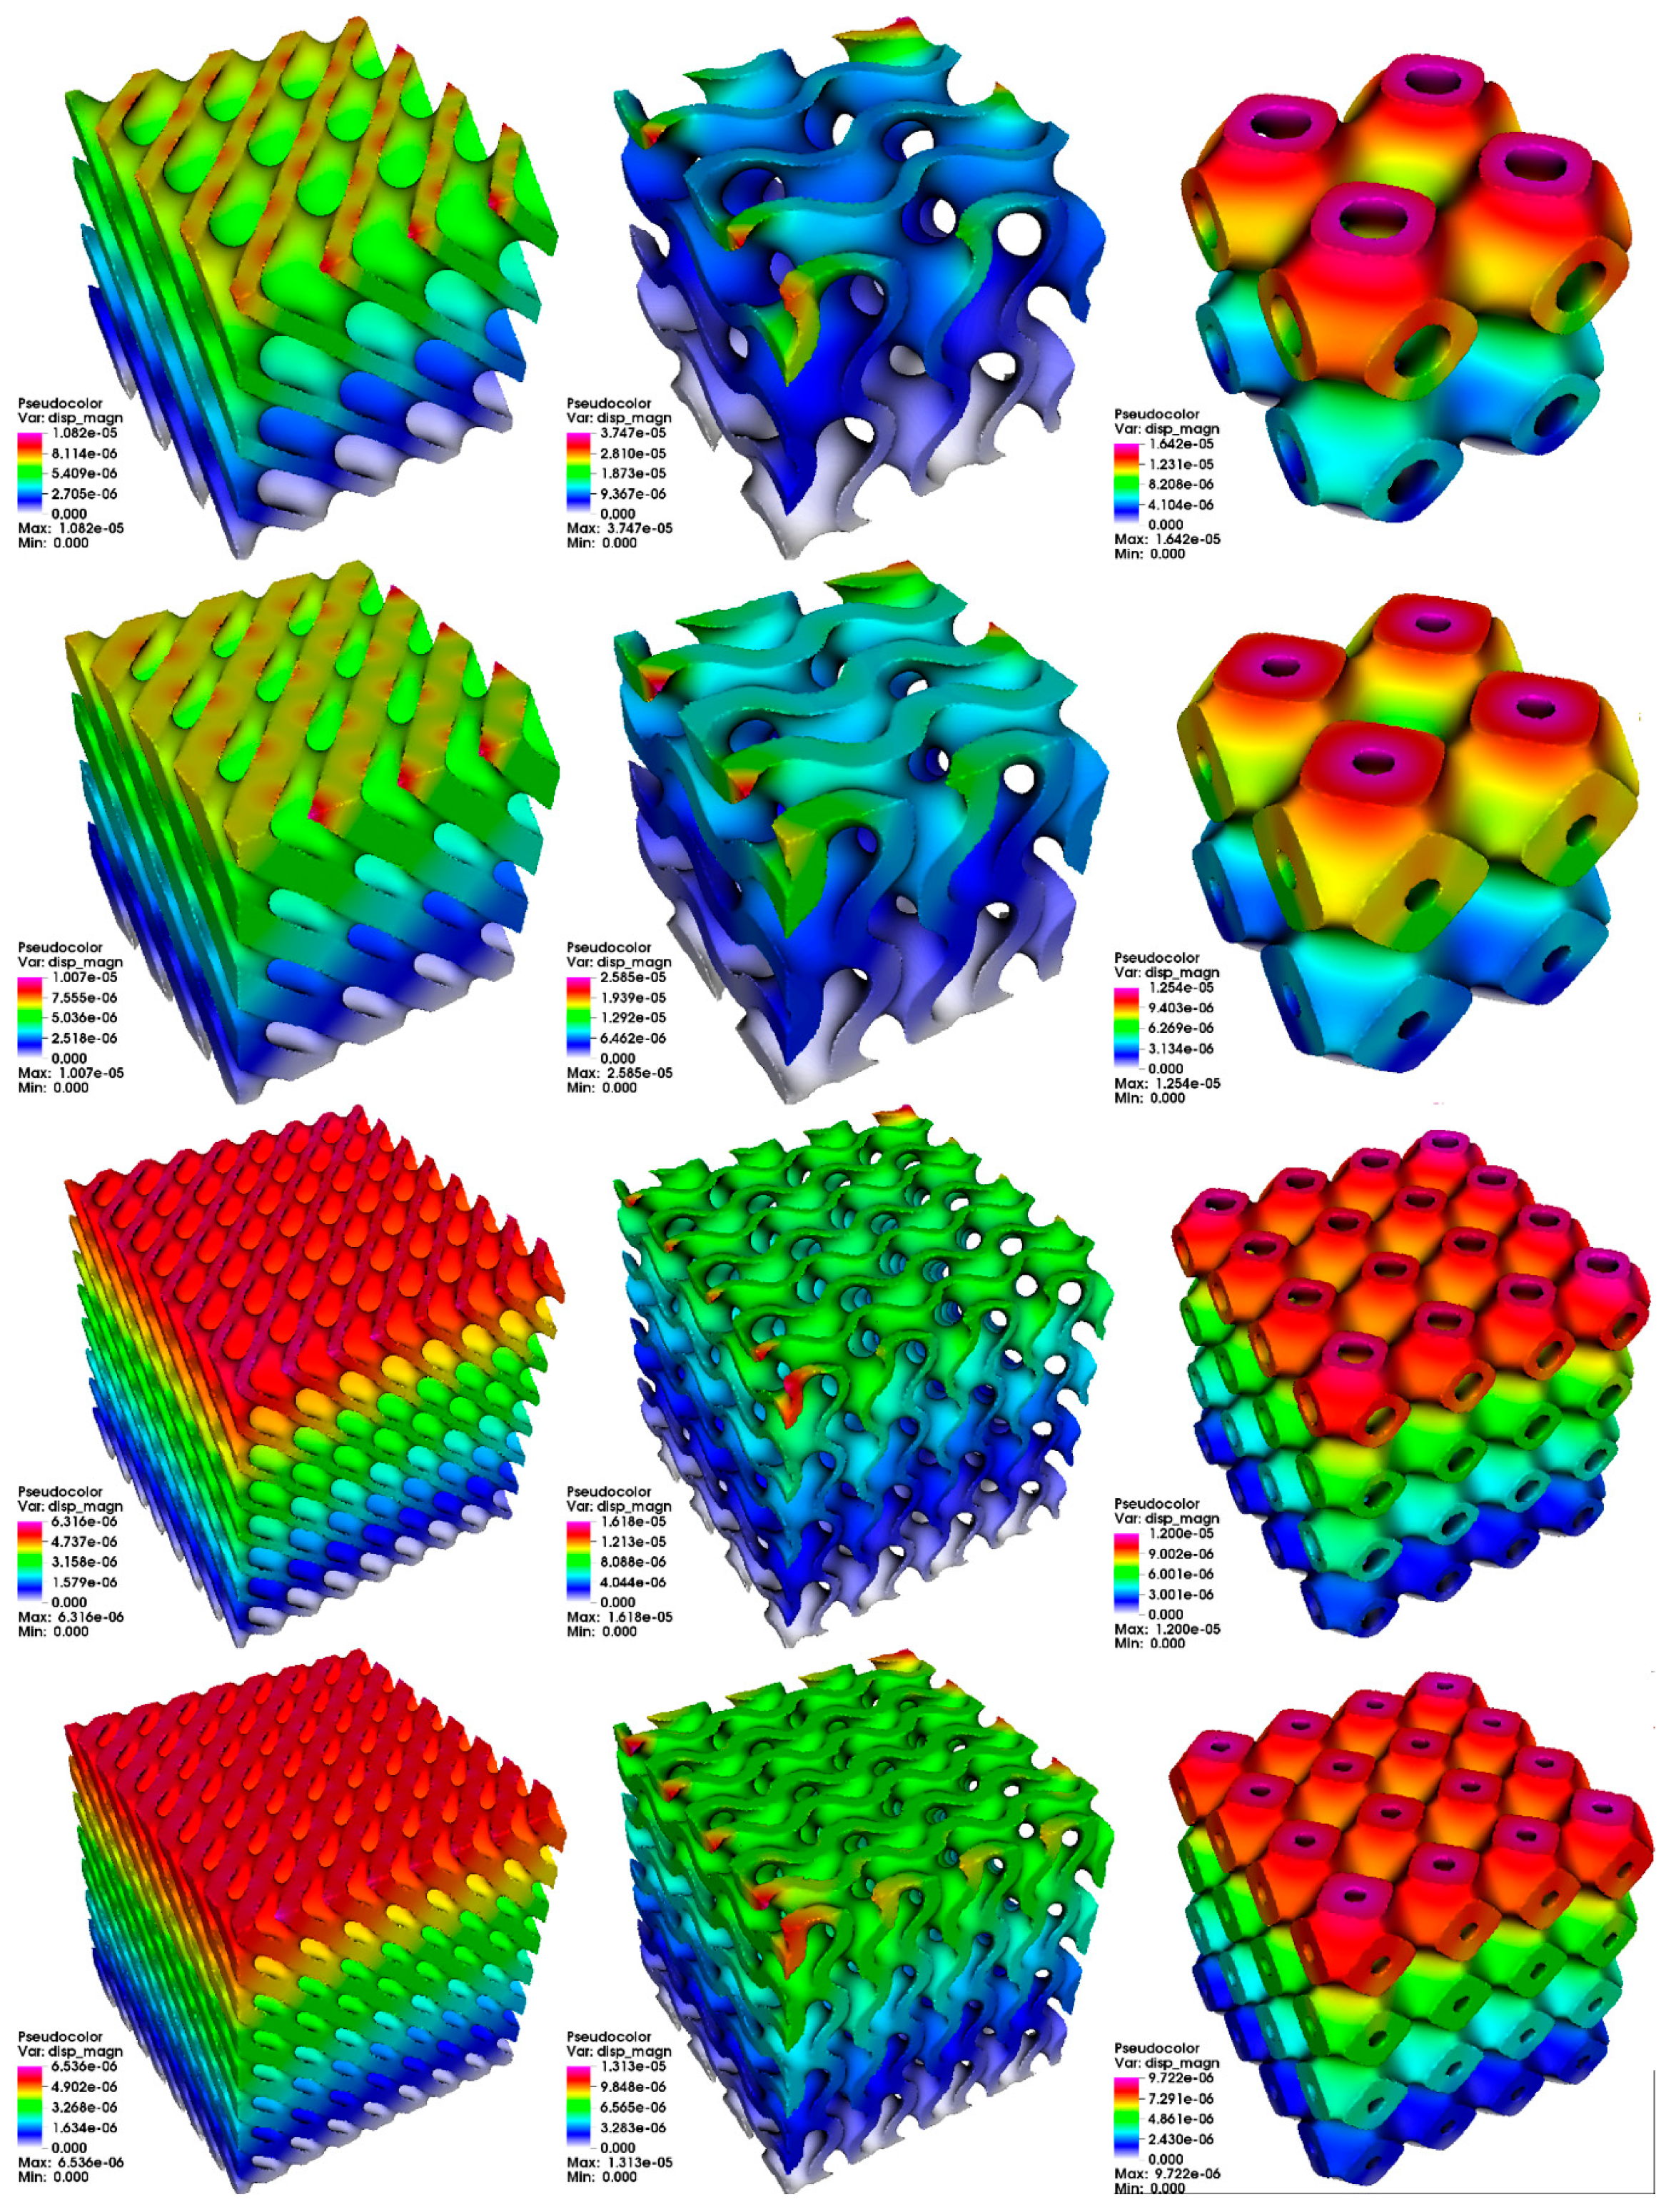
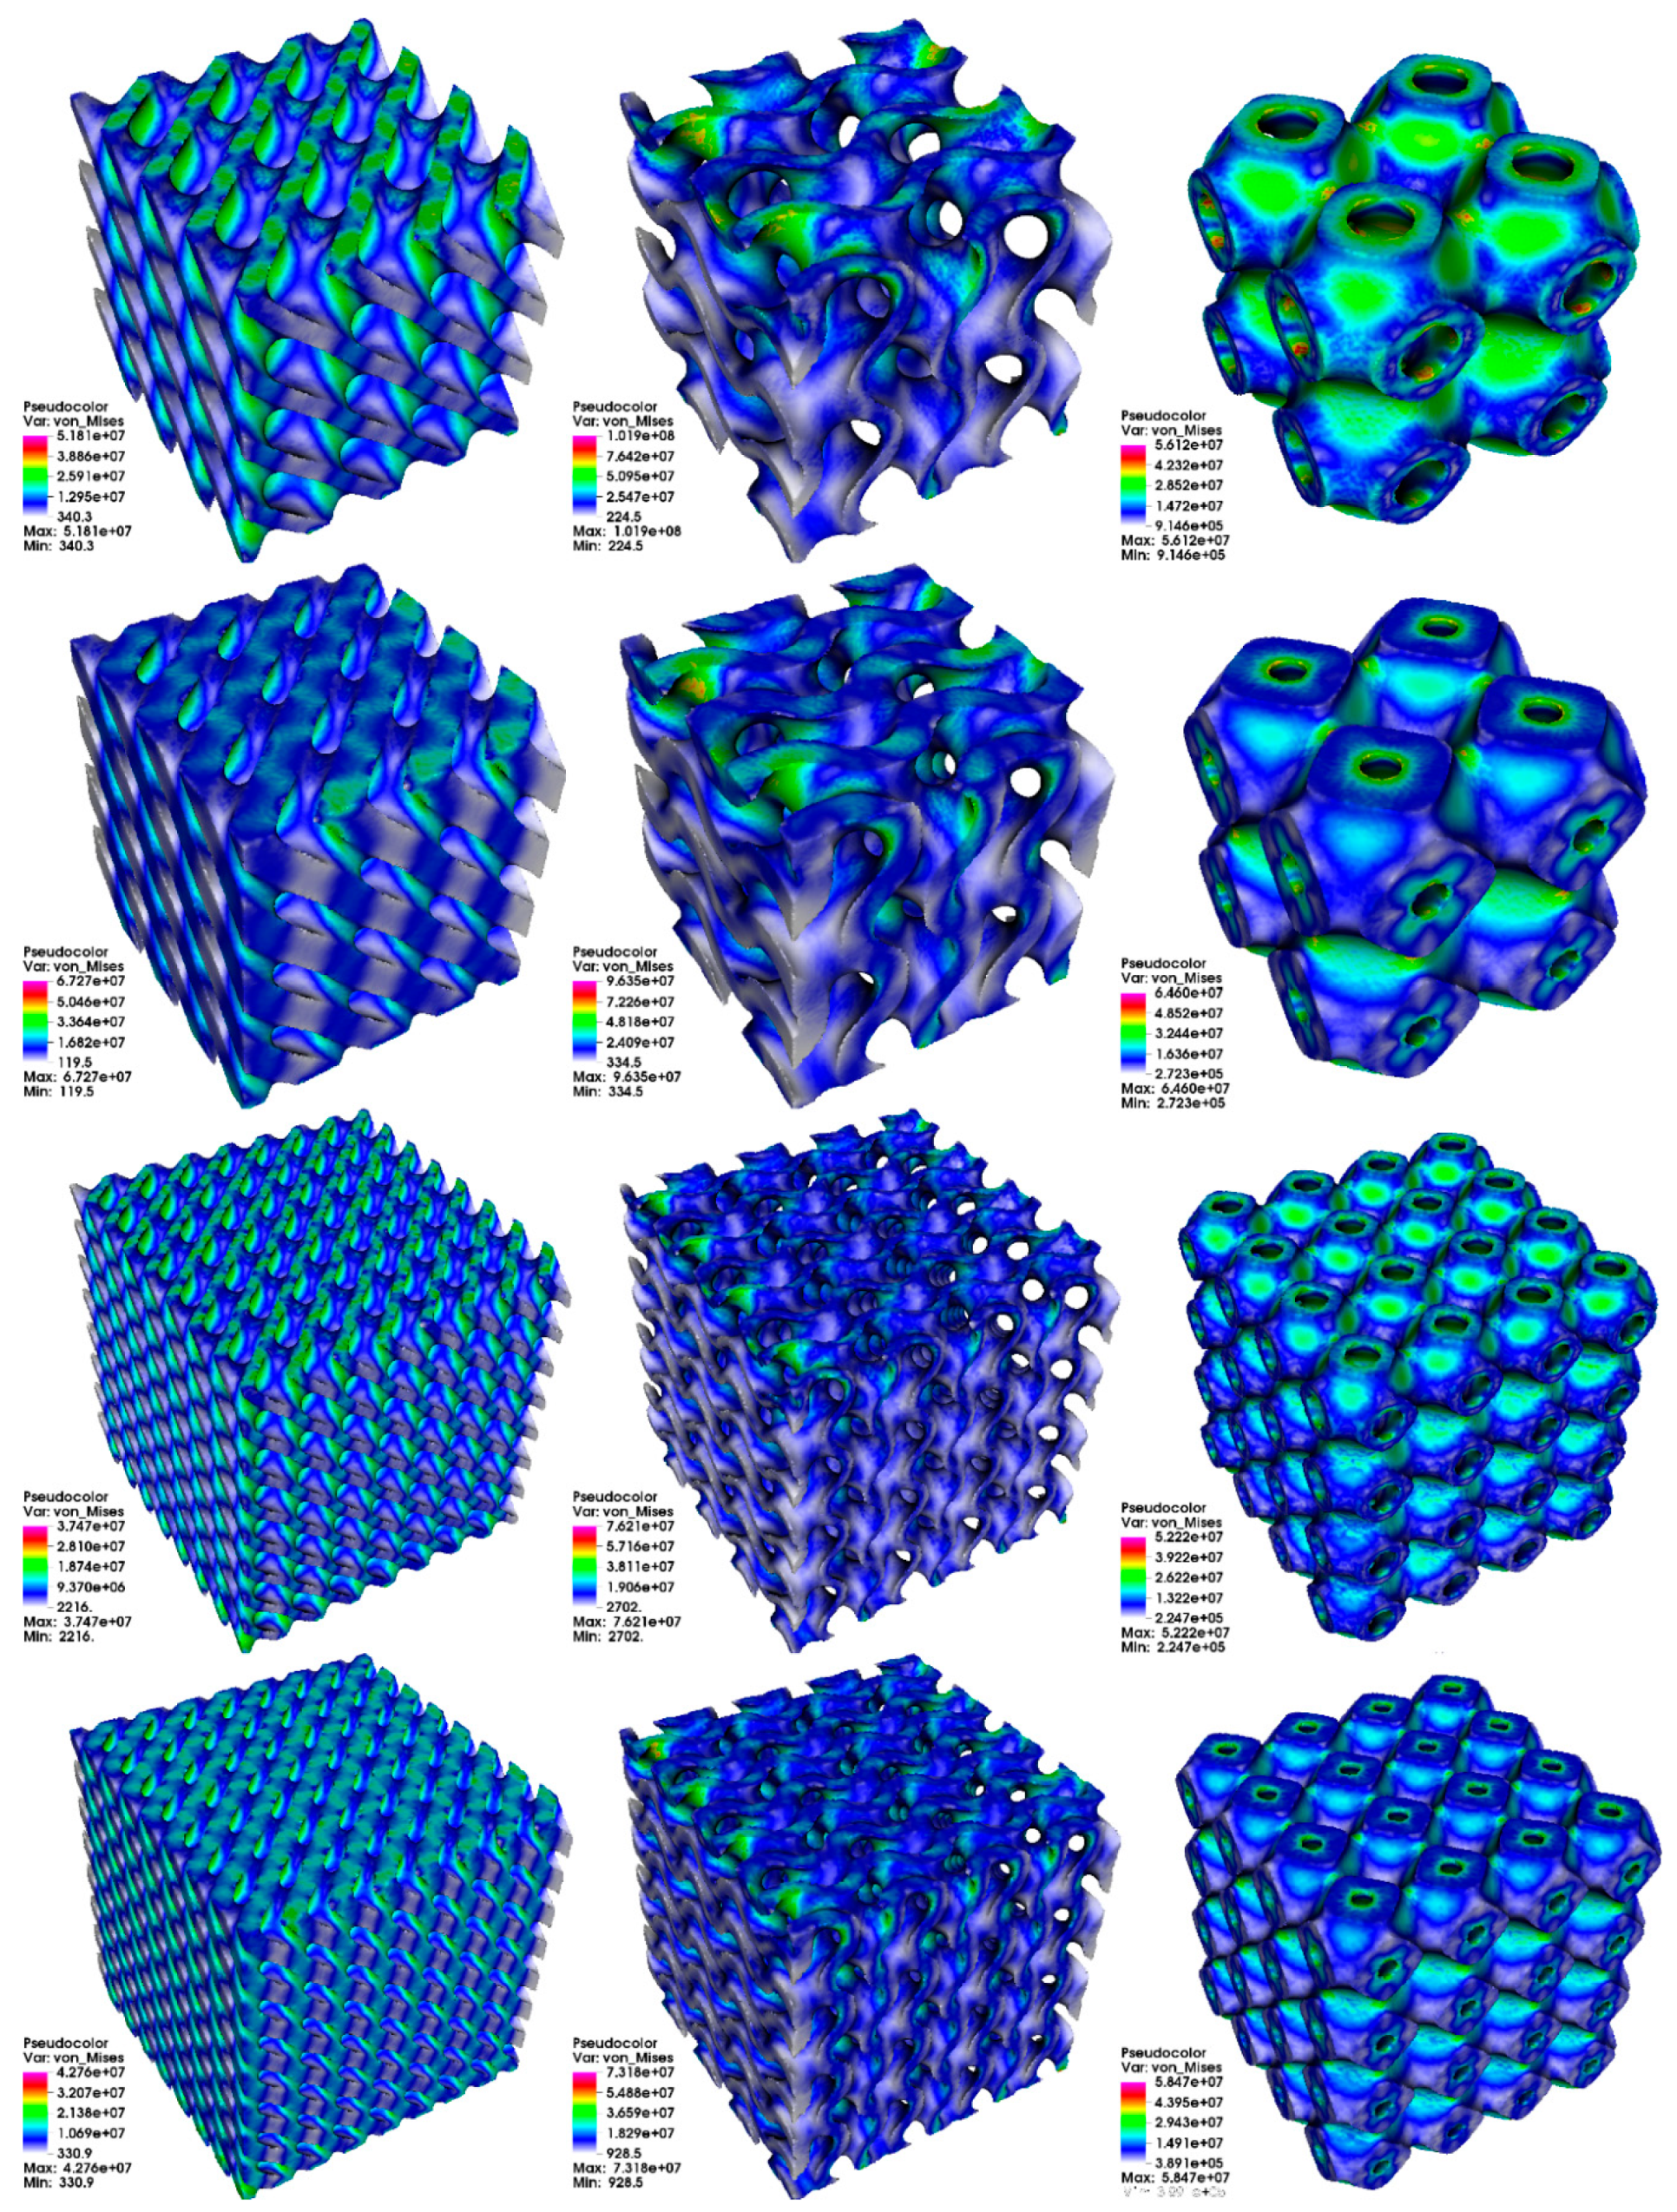
| Name | Relative Thickness [.] | Maximum Total Displacement [m] | Minimum von Mises Stress [MPa] | Maximum von Mises Stress [MPa] |
|---|---|---|---|---|
| cube | - | 5.803 × 10⁶ | 6.359 × 10⁶ | 2.710 × 10⁷ |
| diamond (D) 2 cells | 0.125 | 1.062 × 10⁵ | 340.3 | 5.161 × 10⁷ |
| diamond (D) 2 cells | 0.2 | 1.007 × 10⁵ | 119.5 | 6.727 × 10⁷ |
| diamond (D) 4 cells | 0.125 | 6.316 × 10⁶ | 2216 | 3.747 × 10⁷ |
| diamond (D) 4 cells | 0.2 | 6.536 × 10⁶ | 330.9 | 4.276 × 10⁷ |
| gyroid (G) 2 cells | 0.125 | 3.747 × 10⁵ | 224.5 | 1.019 × 10⁸ |
| gyroid (G) 2 cells | 0.2 | 2.585 × 10⁵ | 334.5 | 9.635 × 10⁷ |
| gyroid (G) 4 cells | 0.125 | 1.618 × 10⁵ | 2702 | 7.621 × 10⁷ |
| gyroid (G) 4 cells | 0.2 | 1.313 × 10⁵ | 928.5 | 7.318 × 10⁷ |
| primitive (P) 2 cells | 0.125 | 1.642 × 10⁵ | 9.146 × 10⁵ | 5.612 × 10⁷ |
| Primitive (P) 2 cells | 0.2 | 1.254 × 10⁵ | 2.723 × 10⁵ | 6.460 × 10⁷ |
| primitive (P) 4 cells | 0.125 | 1.200 × 10⁵ | 2.247 × 10⁵ | 5.222 × 10⁷ |
| primitive (P) 4 cells | 0.2 | 9.722 × 10⁶ | 3.891 × 10⁵ | 5.847 × 10⁷ |
Publisher’s Note: MDPI stays neutral with regard to jurisdictional claims in published maps and institutional affiliations. |
© 2021 by the authors. Licensee MDPI, Basel, Switzerland. This article is an open access article distributed under the terms and conditions of the Creative Commons Attribution (CC BY) license (http://creativecommons.org/licenses/by/4.0/).
Share and Cite
Gawronska, E.; Dyja, R. A Numerical Study of Geometry’s Impact on the Thermal and Mechanical Properties of Periodic Surface Structures. Materials 2021, 14, 427. https://doi.org/10.3390/ma14020427
Gawronska E, Dyja R. A Numerical Study of Geometry’s Impact on the Thermal and Mechanical Properties of Periodic Surface Structures. Materials. 2021; 14(2):427. https://doi.org/10.3390/ma14020427
Chicago/Turabian StyleGawronska, Elzbieta, and Robert Dyja. 2021. "A Numerical Study of Geometry’s Impact on the Thermal and Mechanical Properties of Periodic Surface Structures" Materials 14, no. 2: 427. https://doi.org/10.3390/ma14020427
APA StyleGawronska, E., & Dyja, R. (2021). A Numerical Study of Geometry’s Impact on the Thermal and Mechanical Properties of Periodic Surface Structures. Materials, 14(2), 427. https://doi.org/10.3390/ma14020427