Effect of the Test Procedure and Thermoplastic Composite Resin Type on the Curved Beam Strength


Abstract
:1. Introduction
2. Experiment
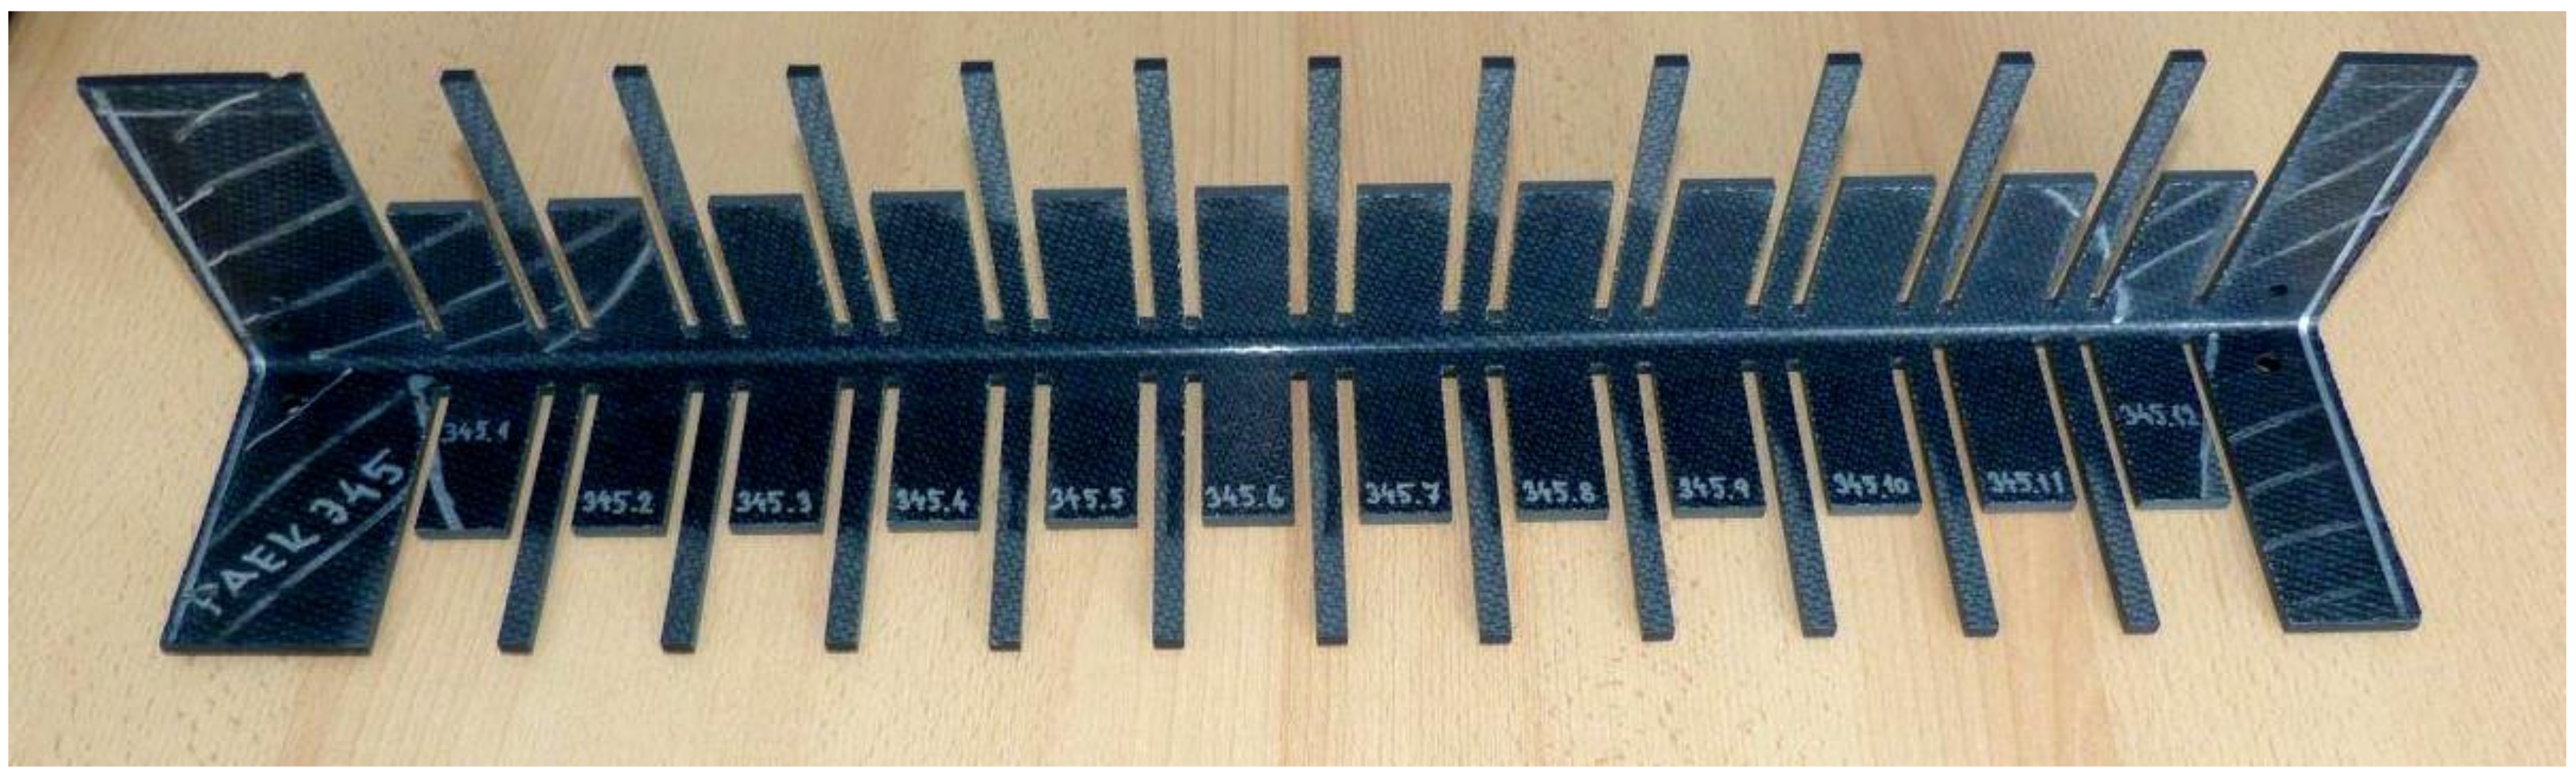
2.1. Material


| Property | PPS | PEEK | PAEK |
|---|---|---|---|
| Specific gravity (g/cm3) | 1.35 | 1.3 | 1.4 |
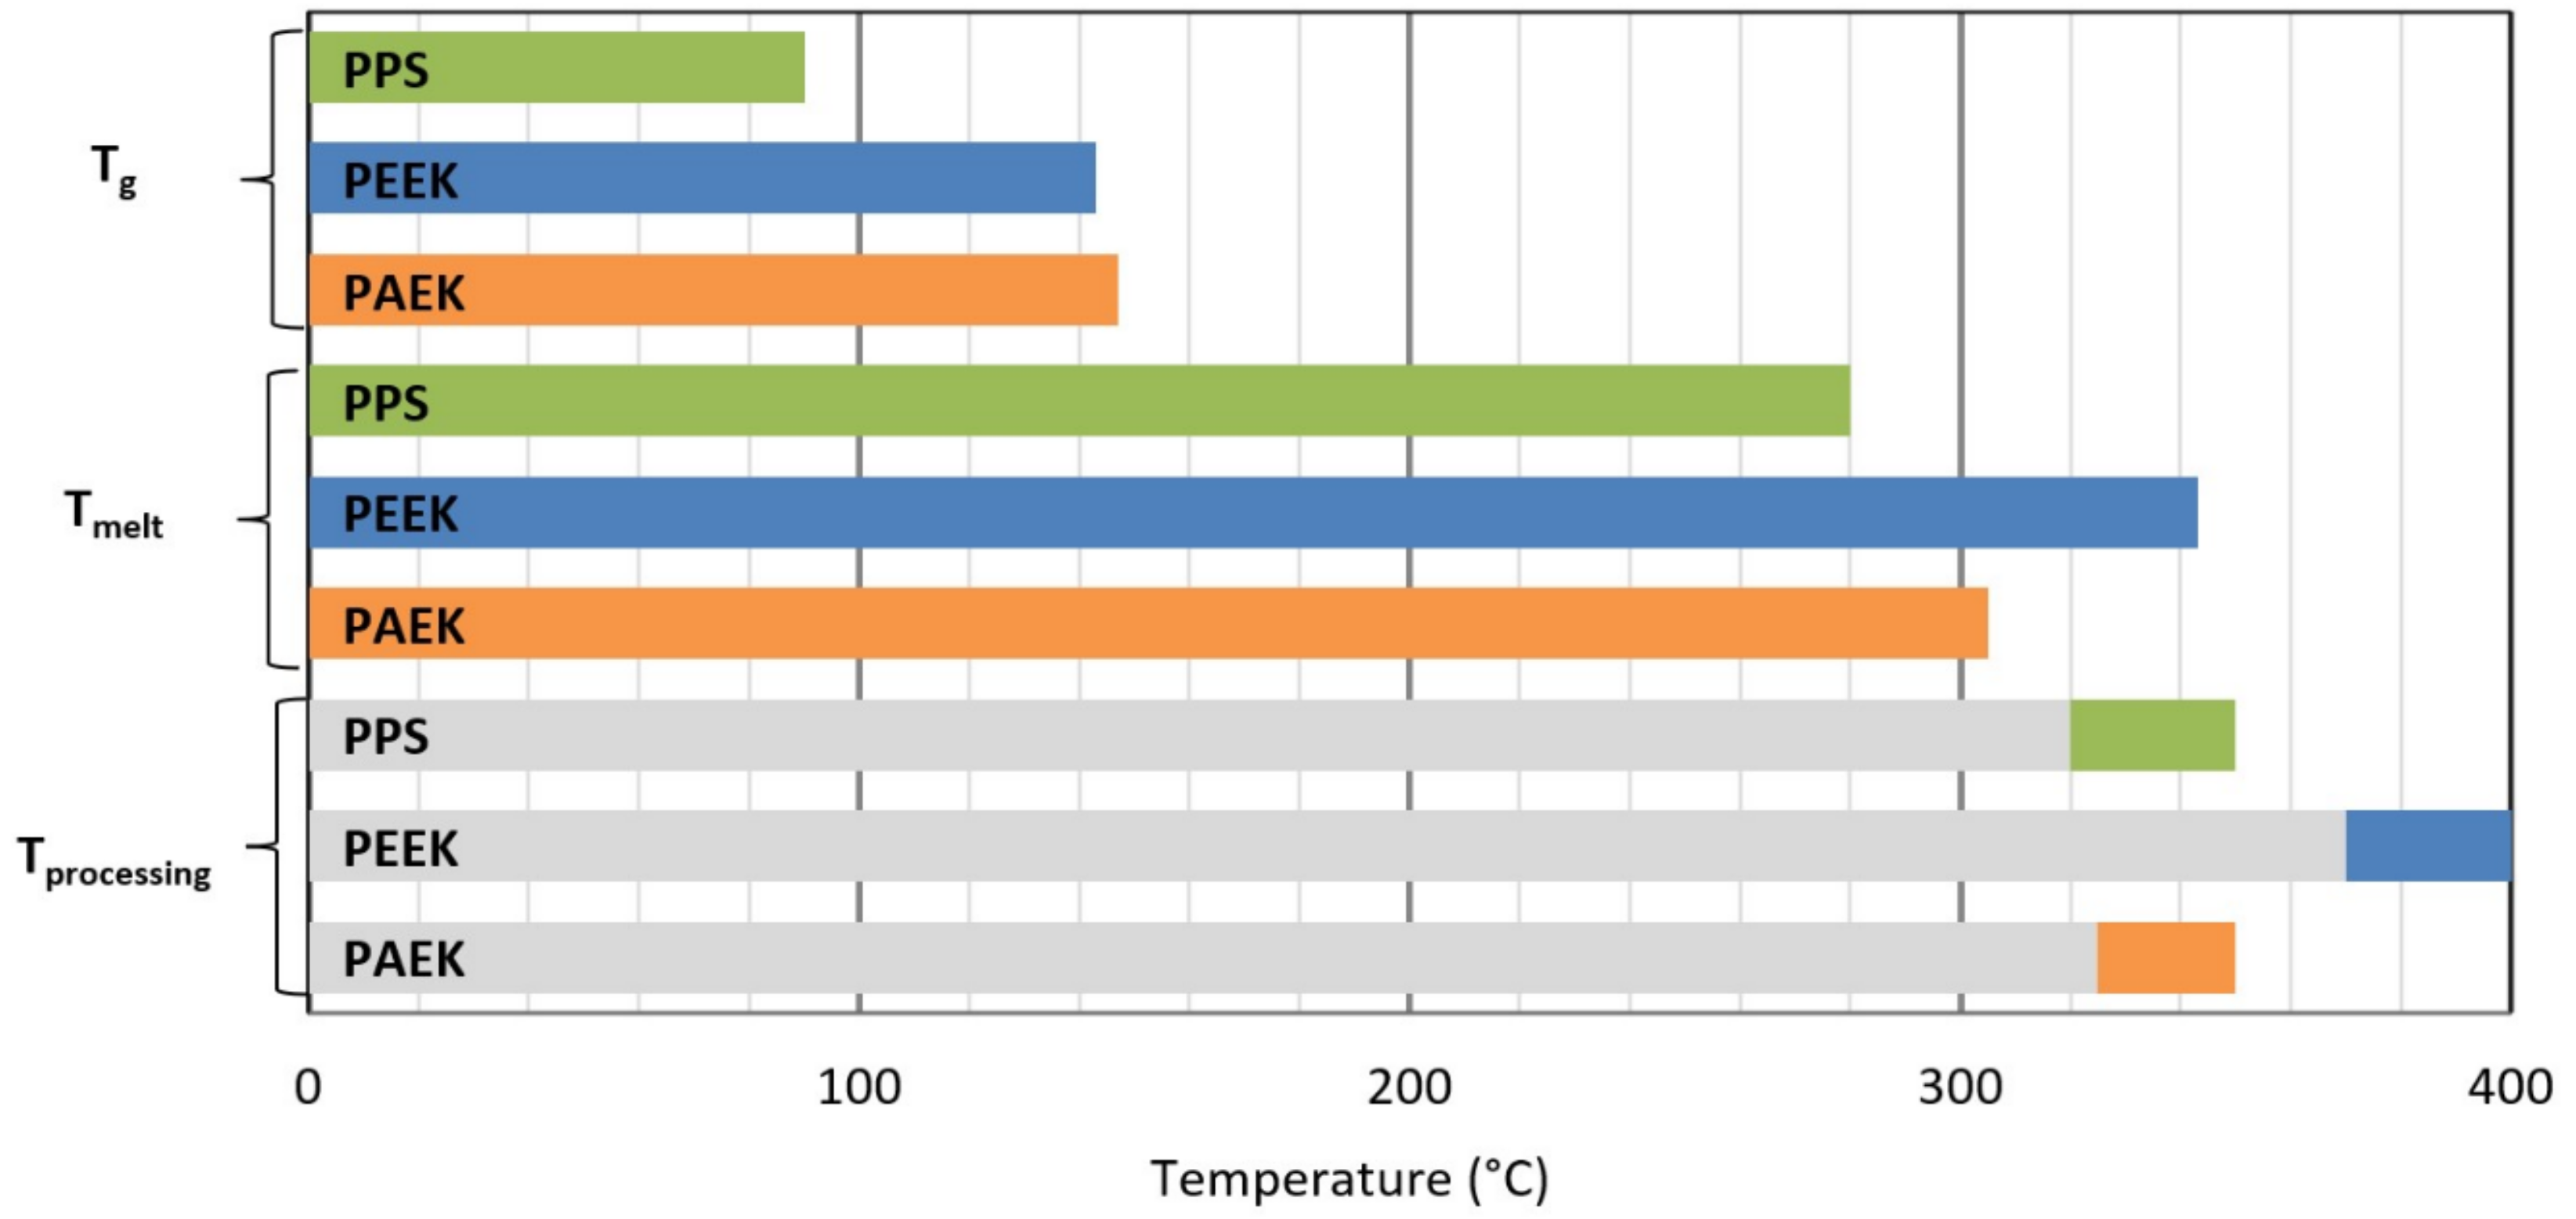
| Tg (°C) | 90 | 143 | 147 |
| Melt temperature Tm (°C) | 280 | 343 | 305 |
| Moisture absorption (%) | 0.02 | 0.2 | 0.2 |
| Tensile strength (MPa) | 90.3 | 97.2 | 95 |
| Tensile modulus (GPa) | 3.8 | 3.59 | 3.7 |
| Elongation at yield (%) | 3 | 3 | 4.5 |
| Compression strength (MPa) | 148 | 120 | 117 |
| Compression modulus (GPa) | 3.0 | - | - |
| Flexural strength (MPa) | 125 | 138 | 141 |
| Flexural modulus (GPa) | 3.7 | 4.1 | 4.2 |
| Processing temperature (°C) | 320–350 | 370–400 | 325–350 |
| Property | PPS | PEEK | PAEK |
|---|---|---|---|
| Tensile strength 0° (MPa) | 757 | 776 | 805 |
| Tensile modulus 0° (GPa) | 55.8 | 56.1 | 58 |
| Tensile strength 90° (MPa) | 754 | 827 | 739 |
| Tensile modulus 90° (GPa) | 53.8 | 55.6 | 59 |
| Compressive strength 0° (MPa) | 643 | 585 | 628 |
| Compressive modulus 0° (GPa) | 51.7 | 51.6 | 52 |
| Compressive strength 90° (MPa) | 637 | 595 | 676 |
| Compressive modulus 90° (GPa) | 51.7 | 49.7 | 53 |
| In Plane Shear Strength (MPa) | 119 | 155 | 147 |
| In Plane Shear Modulus (GPa) | 4.4 | 4.5 | 4.1 |
| Flexural strength 0° (MPa) | 1027 | - | 1040 |
| Flexural modulus 0° (GPa) | 60 | - | 60 |
| Flexural strength 90° (MPa) | 831 | 859 | 879 |
| Flexural modulus 90° (GPa) | 44.8 | 46.3 | 48 |
2.2. Material Structure Analysis
2.3. Test Method
2.4. Statistical Analysis
3. Results and Discussion
3.1. Test Method Evaluation
3.2. Thermoplastic Type and Temperature Evaluation
4. Conclusions
Author Contributions
Funding
Data Availability Statement
Conflicts of Interest
References
- Dale, B. Thermosets vs. Thermoplastics: Is the Battle Over? 2015. Available online: www.compositesword.com (accessed on 10 February 2020).
- Ye, L.; Beehag, A.; Friedrich, K. Mesostructural Aspects of Interlaminar Fracture in Thermoplastic Composites: Is Crystallinity a Key? Compos. Sci. Technol. 1995, 53, 167–173. [Google Scholar] [CrossRef]
- Brown, K.A.; Brooks, R.; Warrior, N. Characterizing the Strain Rate Sensitivity of the Tensile Mechanical Properties of a Thermoplastic Composite. JOM 2009, 61, 43–46. [Google Scholar] [CrossRef]
- Čoban, O.; Bora, M.Ö.; Sinmazçelik, T.; Cürgül, İ.; Günay, V. Fracture Morphology and Deformation Characteristics of Repeatedly Impacted Thermoplastic Matrix Composites. Mater. Des. 2009, 30, 628–634. [Google Scholar] [CrossRef]
- Lee, J.H.; Vogel, J.H. An Investigation of the Formability of Long Fiber Thermoplastic Composite Sheets. J. Eng. Mater. Technol. 1995, 117, 127–132. [Google Scholar] [CrossRef]
- Martin, T.A.; Bhattacharyya, D.; Pipes, R.B. Deformation Characteristics and Formability of Fibre-reinforced Thermoplastic Sheets. Compos. Manuf. 1992, 3, 165–172. [Google Scholar] [CrossRef]
- Ageorges, C.; Ye, L. Resistance Welding of Thermosetting Composite/Thermoplastic Composite Joints. Compos. Part A 2001, 32, 1603–1612. [Google Scholar] [CrossRef]
- Yousefpour, A.; Hojjati, M.; Immarigeon, J.P. Fusion Bonding/Welding of Thermoplastic Composites. J. Thermoplast. Compos. Mater. 2004, 17, 303–341. [Google Scholar] [CrossRef]
- Yuan, Y.C.; Yin, T.; Rong, M.Z.; Zhang, M.Q. Self Healing in Polymers and Polymer Composites. Concepts, Realization and Outlook: A Review. eXPRESS Polym. Lett. 2008, 2, 238–250. [Google Scholar] [CrossRef]
- Yao, L.; Rong, M.Z.; Zhang, M.Q.; Yuan, Y.C. Self-healing of Thermoplastics via Reversible Addition—Fragmentation Chain Transfer Polymerization. J. Mater. Chem. 2011, 21, 9060–9065. [Google Scholar] [CrossRef]
- Schinner, G.; Brandt, J.; Richter, H. Recycling Carbon-fiber-reinforced Thermoplastic Composites. J. Thermoplast. Compos. Mater. 1996, 9, 239–245. [Google Scholar] [CrossRef]
- Šedek, J.; Hron, R.; Kadlec, M. Bond Joint Analysis of Thermoplastic Composite Made from Stacked Tailored Blanks. Appl. Mech. Mater. 2016, 827, 161–168. [Google Scholar] [CrossRef]
- Kruse, T.; Körwien, T.; Růžek, R. Fatigue behaviour and damage tolerant design of bonded joints for aerospace application. In Proceeding of the ECCM 2016 17th European Conference on Composite Materials, ECCM 2016, Munich, Germany, 26–30 June 2016; ISBN 978-300053387-7. [Google Scholar]
- Růžek, R.; Šedek, J.; Kadlec, M.; Kucharský, P. Mechanical behavior of thermoplastic rib under loading representing real structure conditions. In Proceedings of the EAN 2016—54th International Conference on Experimental Stress Analysis, Srní, Czech Republic, 30 May–2 June 2016. [Google Scholar]
- Kadlec, M.; Nováková, L.; Růžek, R. An Experimental Investigation of Factors Considered for the Short Beam Shear Strength Evaluation of Carbon Fiber–reinforced Thermoplastic Laminates. J. Test. Eval. 2014, 42, 580–592. [Google Scholar] [CrossRef]
- Hron, R.; Kadlec, M.; Růžek, R. Effect of Temperature on the Interlaminar Strength of Carbon Fibre Reinforced Thermoplastic. In Proceedings of the EAN 2020—58th International Conference on Experimental Stress Analysis, Online, Czech Republic, 19–22 October 2020. [Google Scholar]
- Guo, Y.; Bradshaw, R.D. Isothermal physical aging characterization of Polyether-ether-ketone (PEEK) and Polyphenylene sulfide (PPS) films by creep and stress relaxation. Mech. Time Depend. Mater. 2017, 11, 61–89. [Google Scholar] [CrossRef]
- Escale, L.; de Almeida, O.; Bernhart, G.; Ferrero, G.J. Comparison of the Impast Resistance of Carbon/ Epoxy and Carbon /PEEK Composite Laminates. In Proceedings of the ECCM15—15th European Conference on Composite Materials, Venice, Italy, 24–28 June 2012. [Google Scholar]
- Nikishkov, Y.; Makeev, A.; Seon, G. Simulation of damage in composites based on solid finite elements. J. Am. Helicopter Soc. 2010, 55, 042009. [Google Scholar] [CrossRef]
- Nikishkov, Y.; Makeev, A.; Seon, G. Progressive fatigue damage simulation method for composites. Int. J. Fatigue 2013, 48, 266–279. [Google Scholar] [CrossRef]
- Makeev, A.; Seon, G.; Nikishkov, Y.; Lee, E. Methods for assessment of interlaminar tensile strength of composite materials. J. Compos. Mater. 2015, 49, 783–794. [Google Scholar] [CrossRef]
- ASTM D6415-06a Standard Test Method for Measuring the Curved Beam Strength of Fiber-Reinforced Polymer-Matrix Composite; ASTM International: West Conshohocken, PA, USA, 2013.
- Airbus, S.A.S. AITM1-00069, Issue2, Determination of Curved-Beam Failure; Engineering Directorate: Blagnac, France, 2011. [Google Scholar]
- ASTM D7291-15 Standard Test Method for Through-Thickness “Flatwise” Tensile Strength and Elastic Modulus of a Fiber-Reinforced Polymer Matrix Composite Material; ASTM International: West Conshohocken, PA, USA, 2015.
- Jackson, W.C.; Martin, R.H. An interlaminar tensile strength specimen. Compos. Mater. Test. Des. 1993, 11, 333–354. [Google Scholar]
- Armanios, E.; Ronald, B.; Dale, W.; O’Brien, T.; Chawan, A.; Demarco, K.; Paris, I. Influence of specimen configuration and size on composite transverse tensile strength and scatter measured through flexure testing. J. Compos Technol. Res. 2003, 25, 3–21. [Google Scholar] [CrossRef]
- O’Brien, T.K.; Chawan, A.D.; Krueger, R.; Paris, I. Transverse tension fatigue life characterization through flexure testing of composite materials. Int. J. Fatigue 2002, 24, 127–145. [Google Scholar] [CrossRef]
- Hao, W.; Ge, W.; Ma, Y.; Yao, X.; Shi, Y. Experimental investigation on deformation and strength of carbon/epoxy laminated curved beams. Polym. Test. 2012, 31, 520–526. [Google Scholar] [CrossRef]
- Tencate Advanced Composites, Introducing Tencate Cetex® TC1225; Toray Advanced Composites: Morgan Hill, CA, USA, 2016.
- Tencate Advanced Composites, TenCate Cetex® TC1200 PEEK Resin System, Product Data Sheet; Toray Advanced Composites: Morgan Hill, CA, USA, 2017.
- Tencate Advanced Composites, TenCate Cetex® TC1100 PPS Resin System, Product Data Sheet; Toray Advanced Composites: Morgan Hill, CA, USA, 2016.
- Tencate Advanced Composites, TenCate Cetex® TC1225 PAEK Resin System, Product Data Sheet; Toray Advanced Composites: Morgan Hill, CA, USA, 2017.


| Set (Resin) | Fabric | Lay-Up | Ø Width (mm) | Ø Thickness (mm) | Ø α (Deg) | Number of Samples | |
|---|---|---|---|---|---|---|---|
| RT | CT | ||||||
| PEEK | T300JB 3K, 5HS, 280 gsm FAW, 42% RC (50% BV) | [(0,90)/(±45)]4/(0,90) | 25.31 | 2.78 | 91.0 | 6 | 5 |
| PPS | T300 3K, 5HS, 280 gsm FAW, 43% RC (50% BV) | [[(0,90)/(±45)]4] | 25.14 | 4.95 | 89.5 | 5 | 5 |
| PAEK | T300JB 3K, 5HS, 277 gsm FAW, 42% RC (50% BV) | [[(0,90)/(±45)]4] | 25.24 | 4.65 | 90.7 | 5 | 5 |
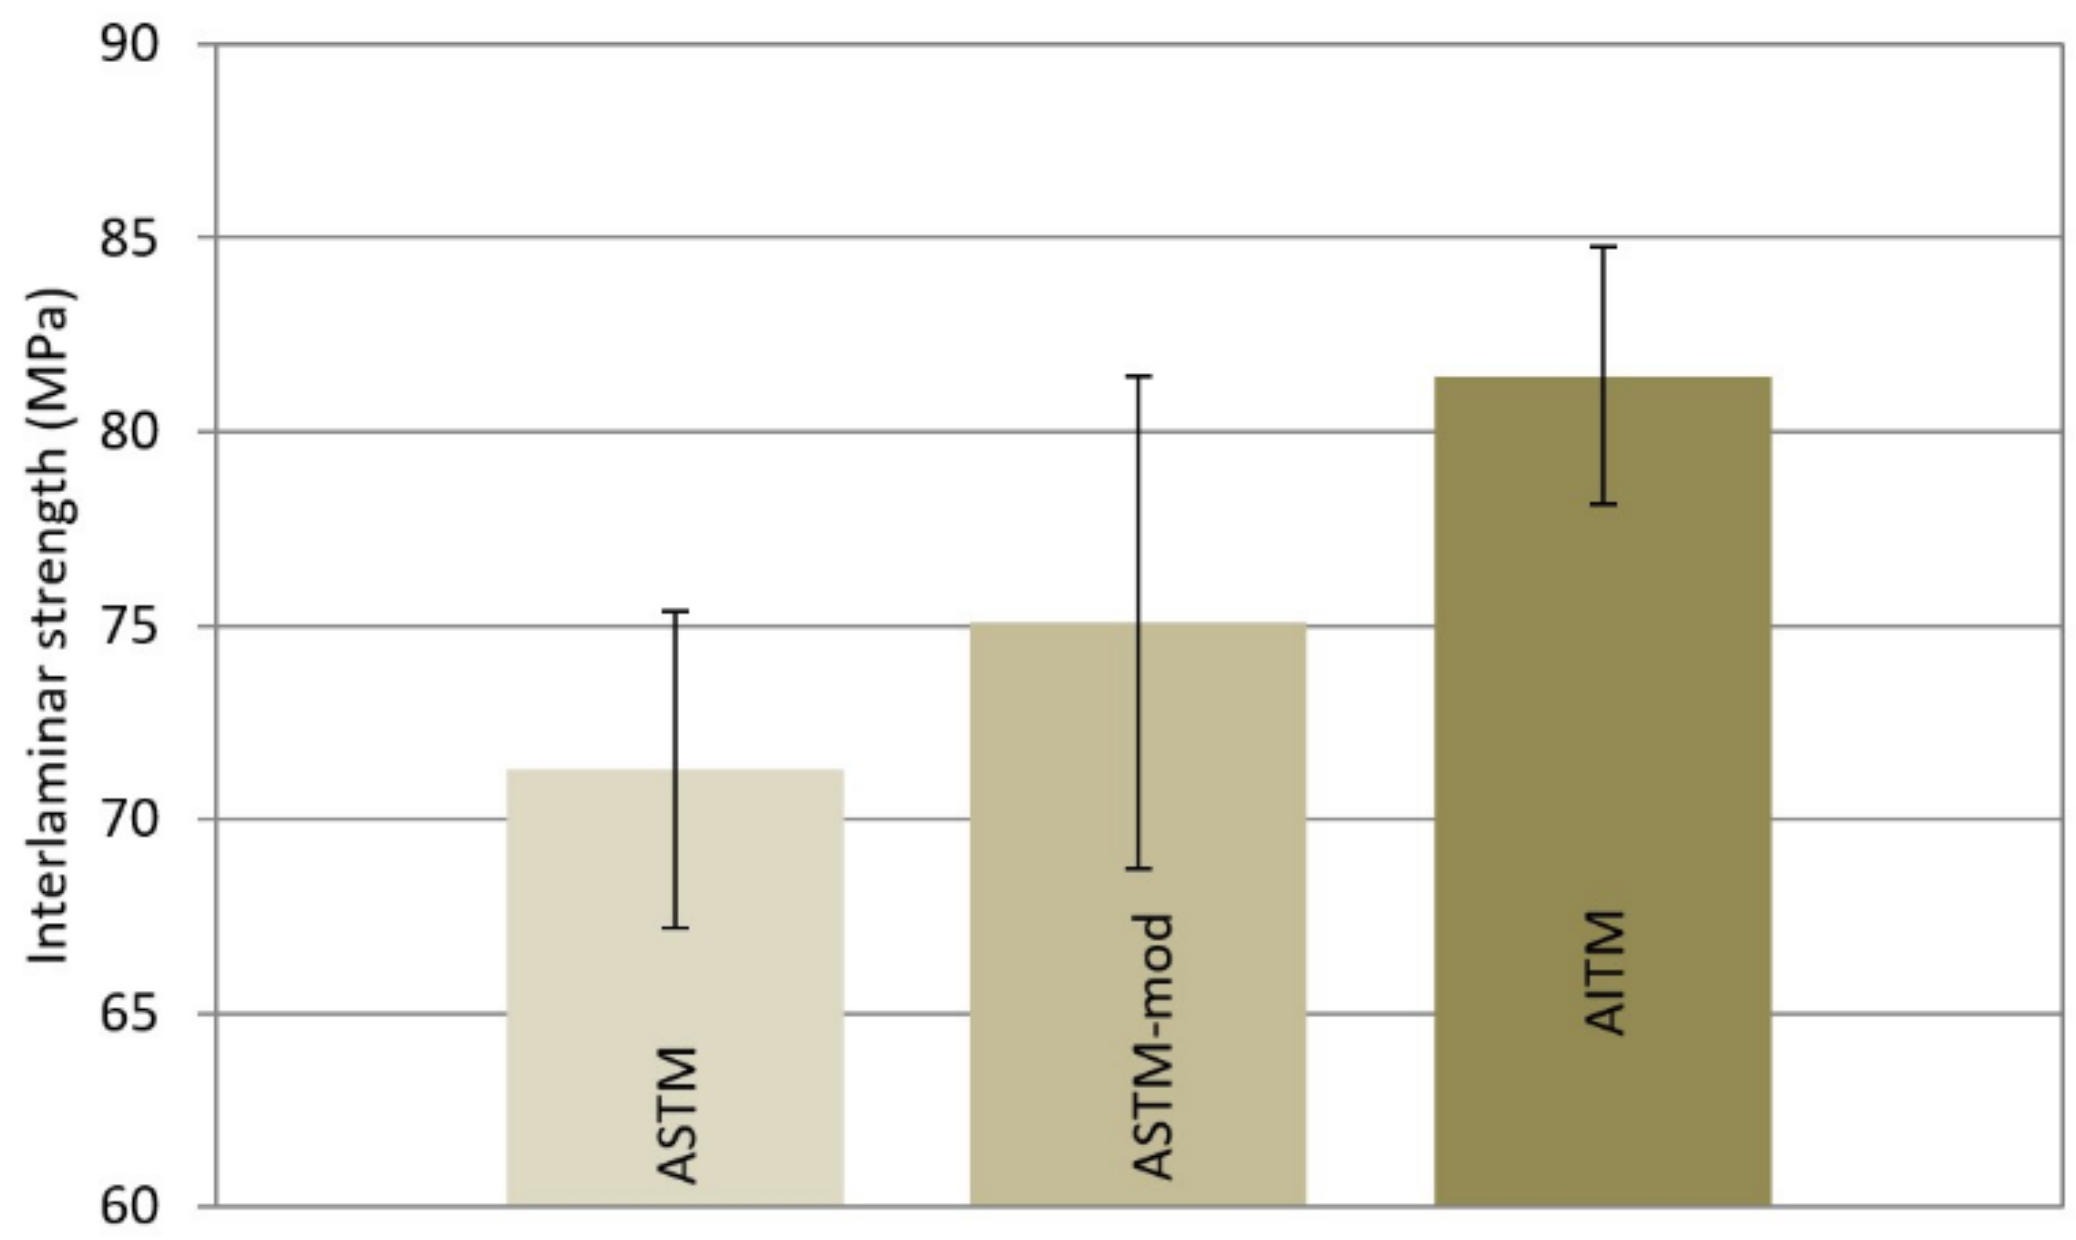
| σr (MPa) | PPS | ||
|---|---|---|---|
| ASTM | ASTM Mod | AITM | |
| Mean | 71.3 | 75.1 | 81.4 |
| S.D. | 4.09 | 6.36 | 3.33 |
| C.V. | 5.73 | 8.47 | 4.09 |
| Min. | 65.4 | 68.9 | 84.7 |
| Max. | 78.8 | 85.6 | 77.4 |
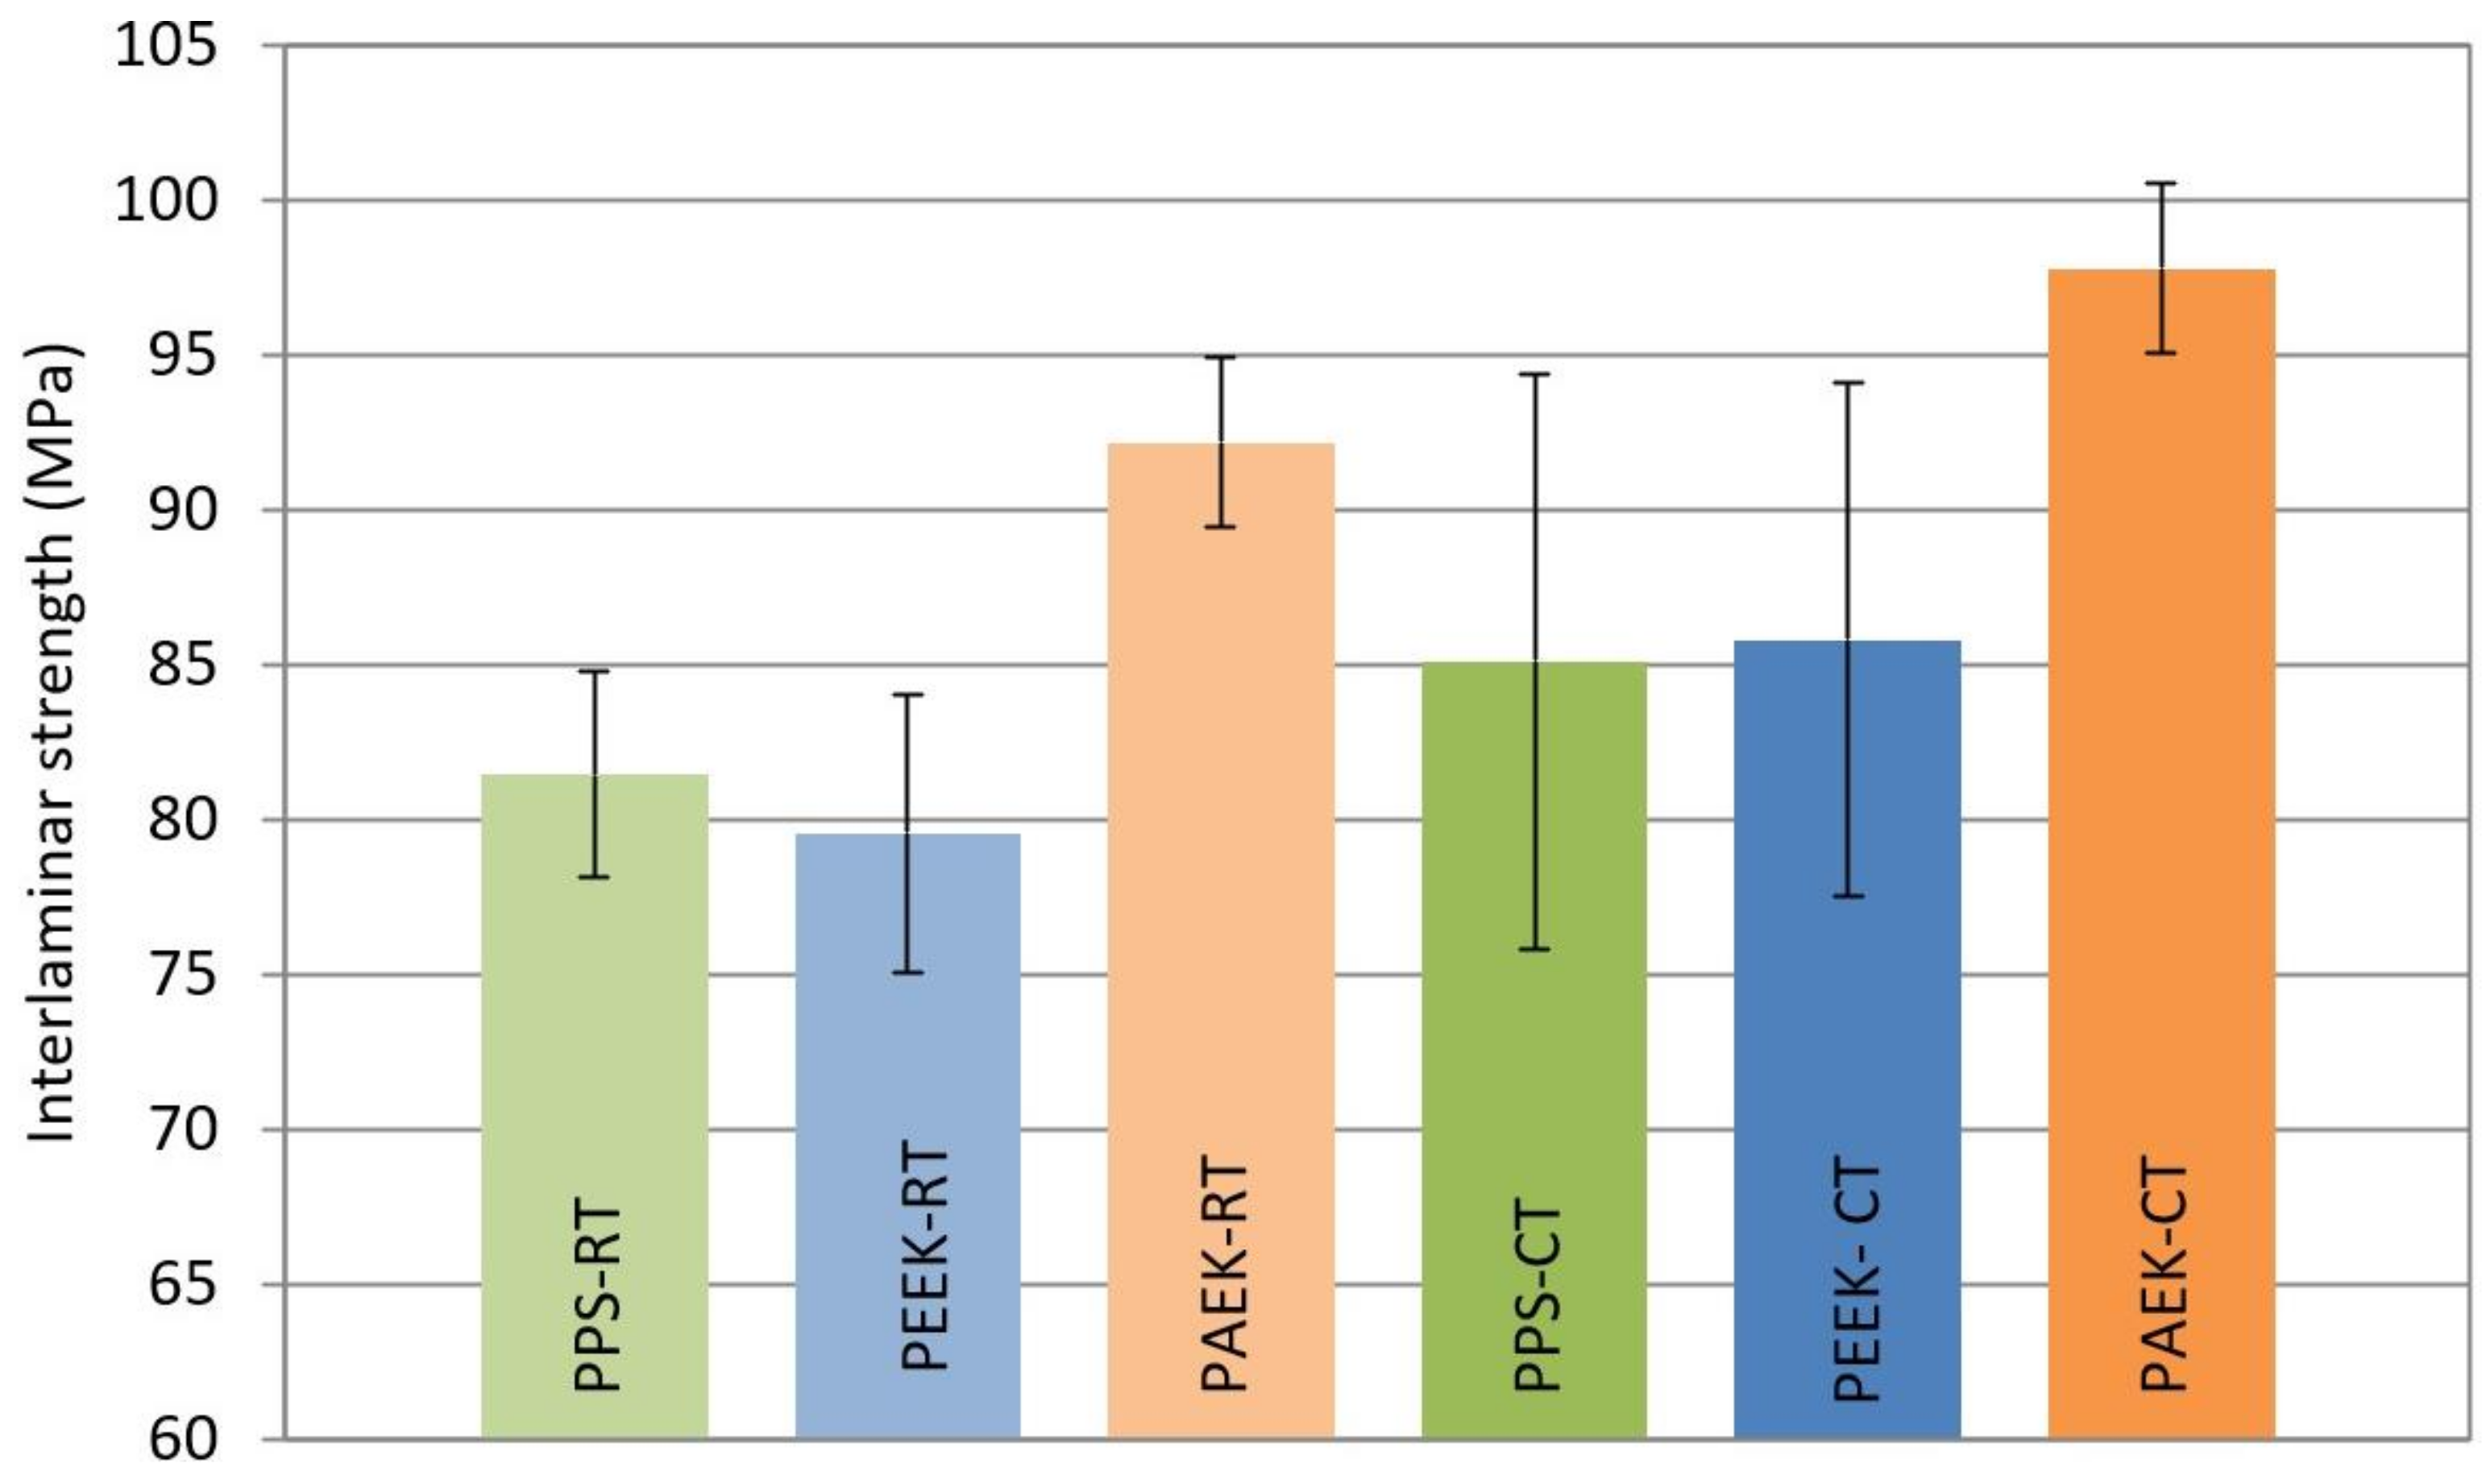
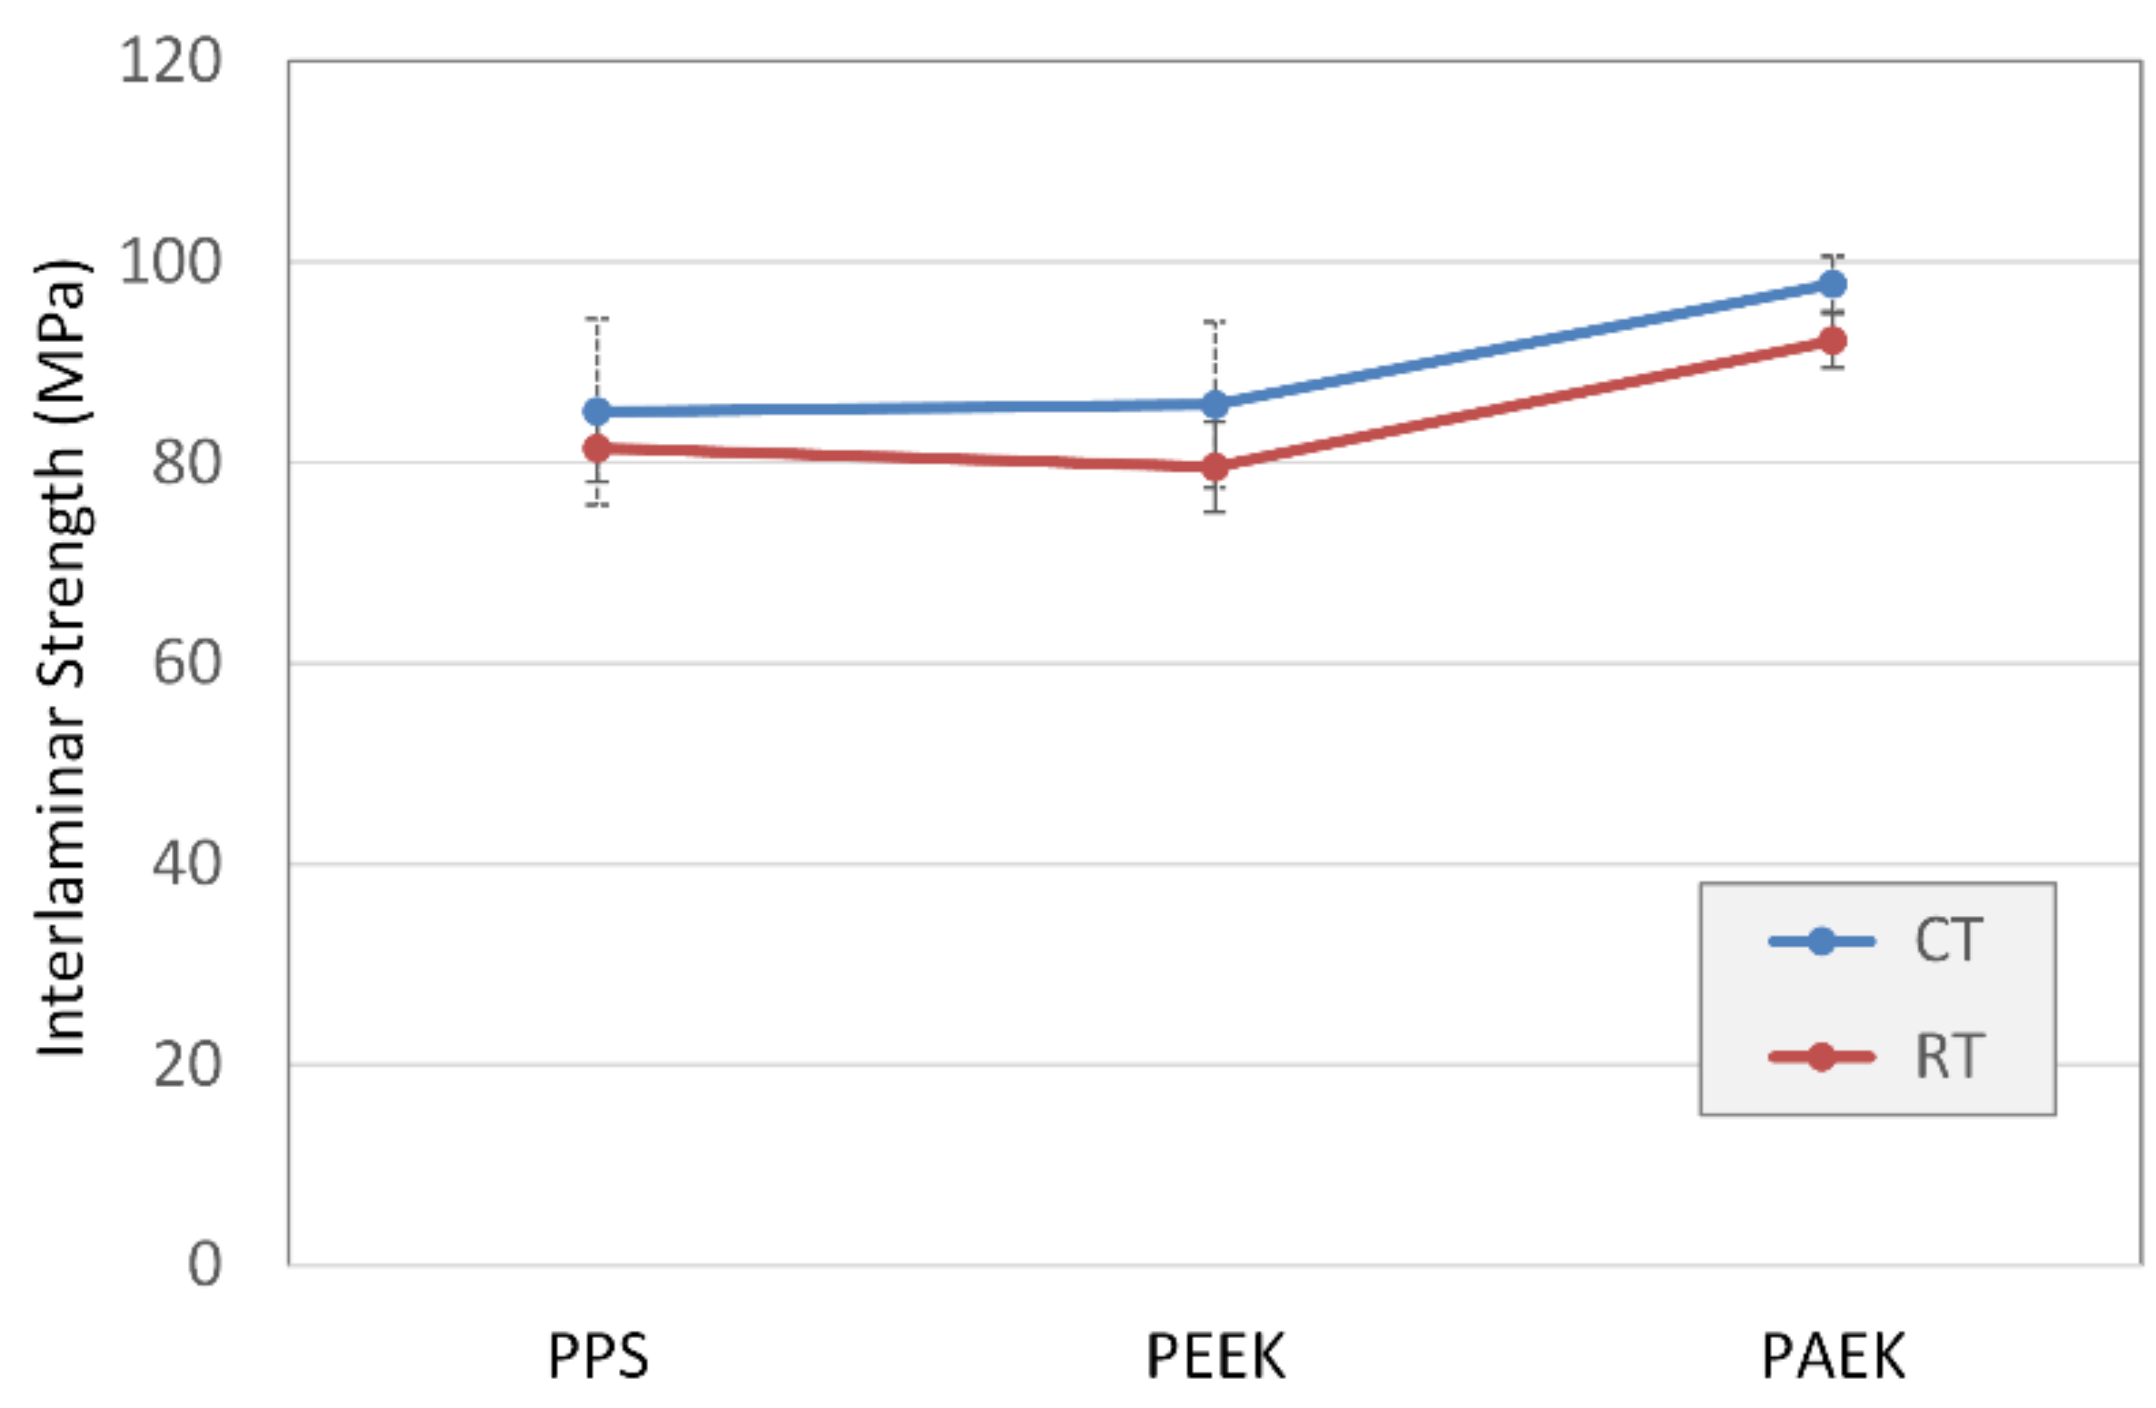
| - | Interlaminar Strength (MPa) | |||||
| RT | CT | |||||
| PPS | PEEK | PAEK | PPS | PEEK | PAEK | |
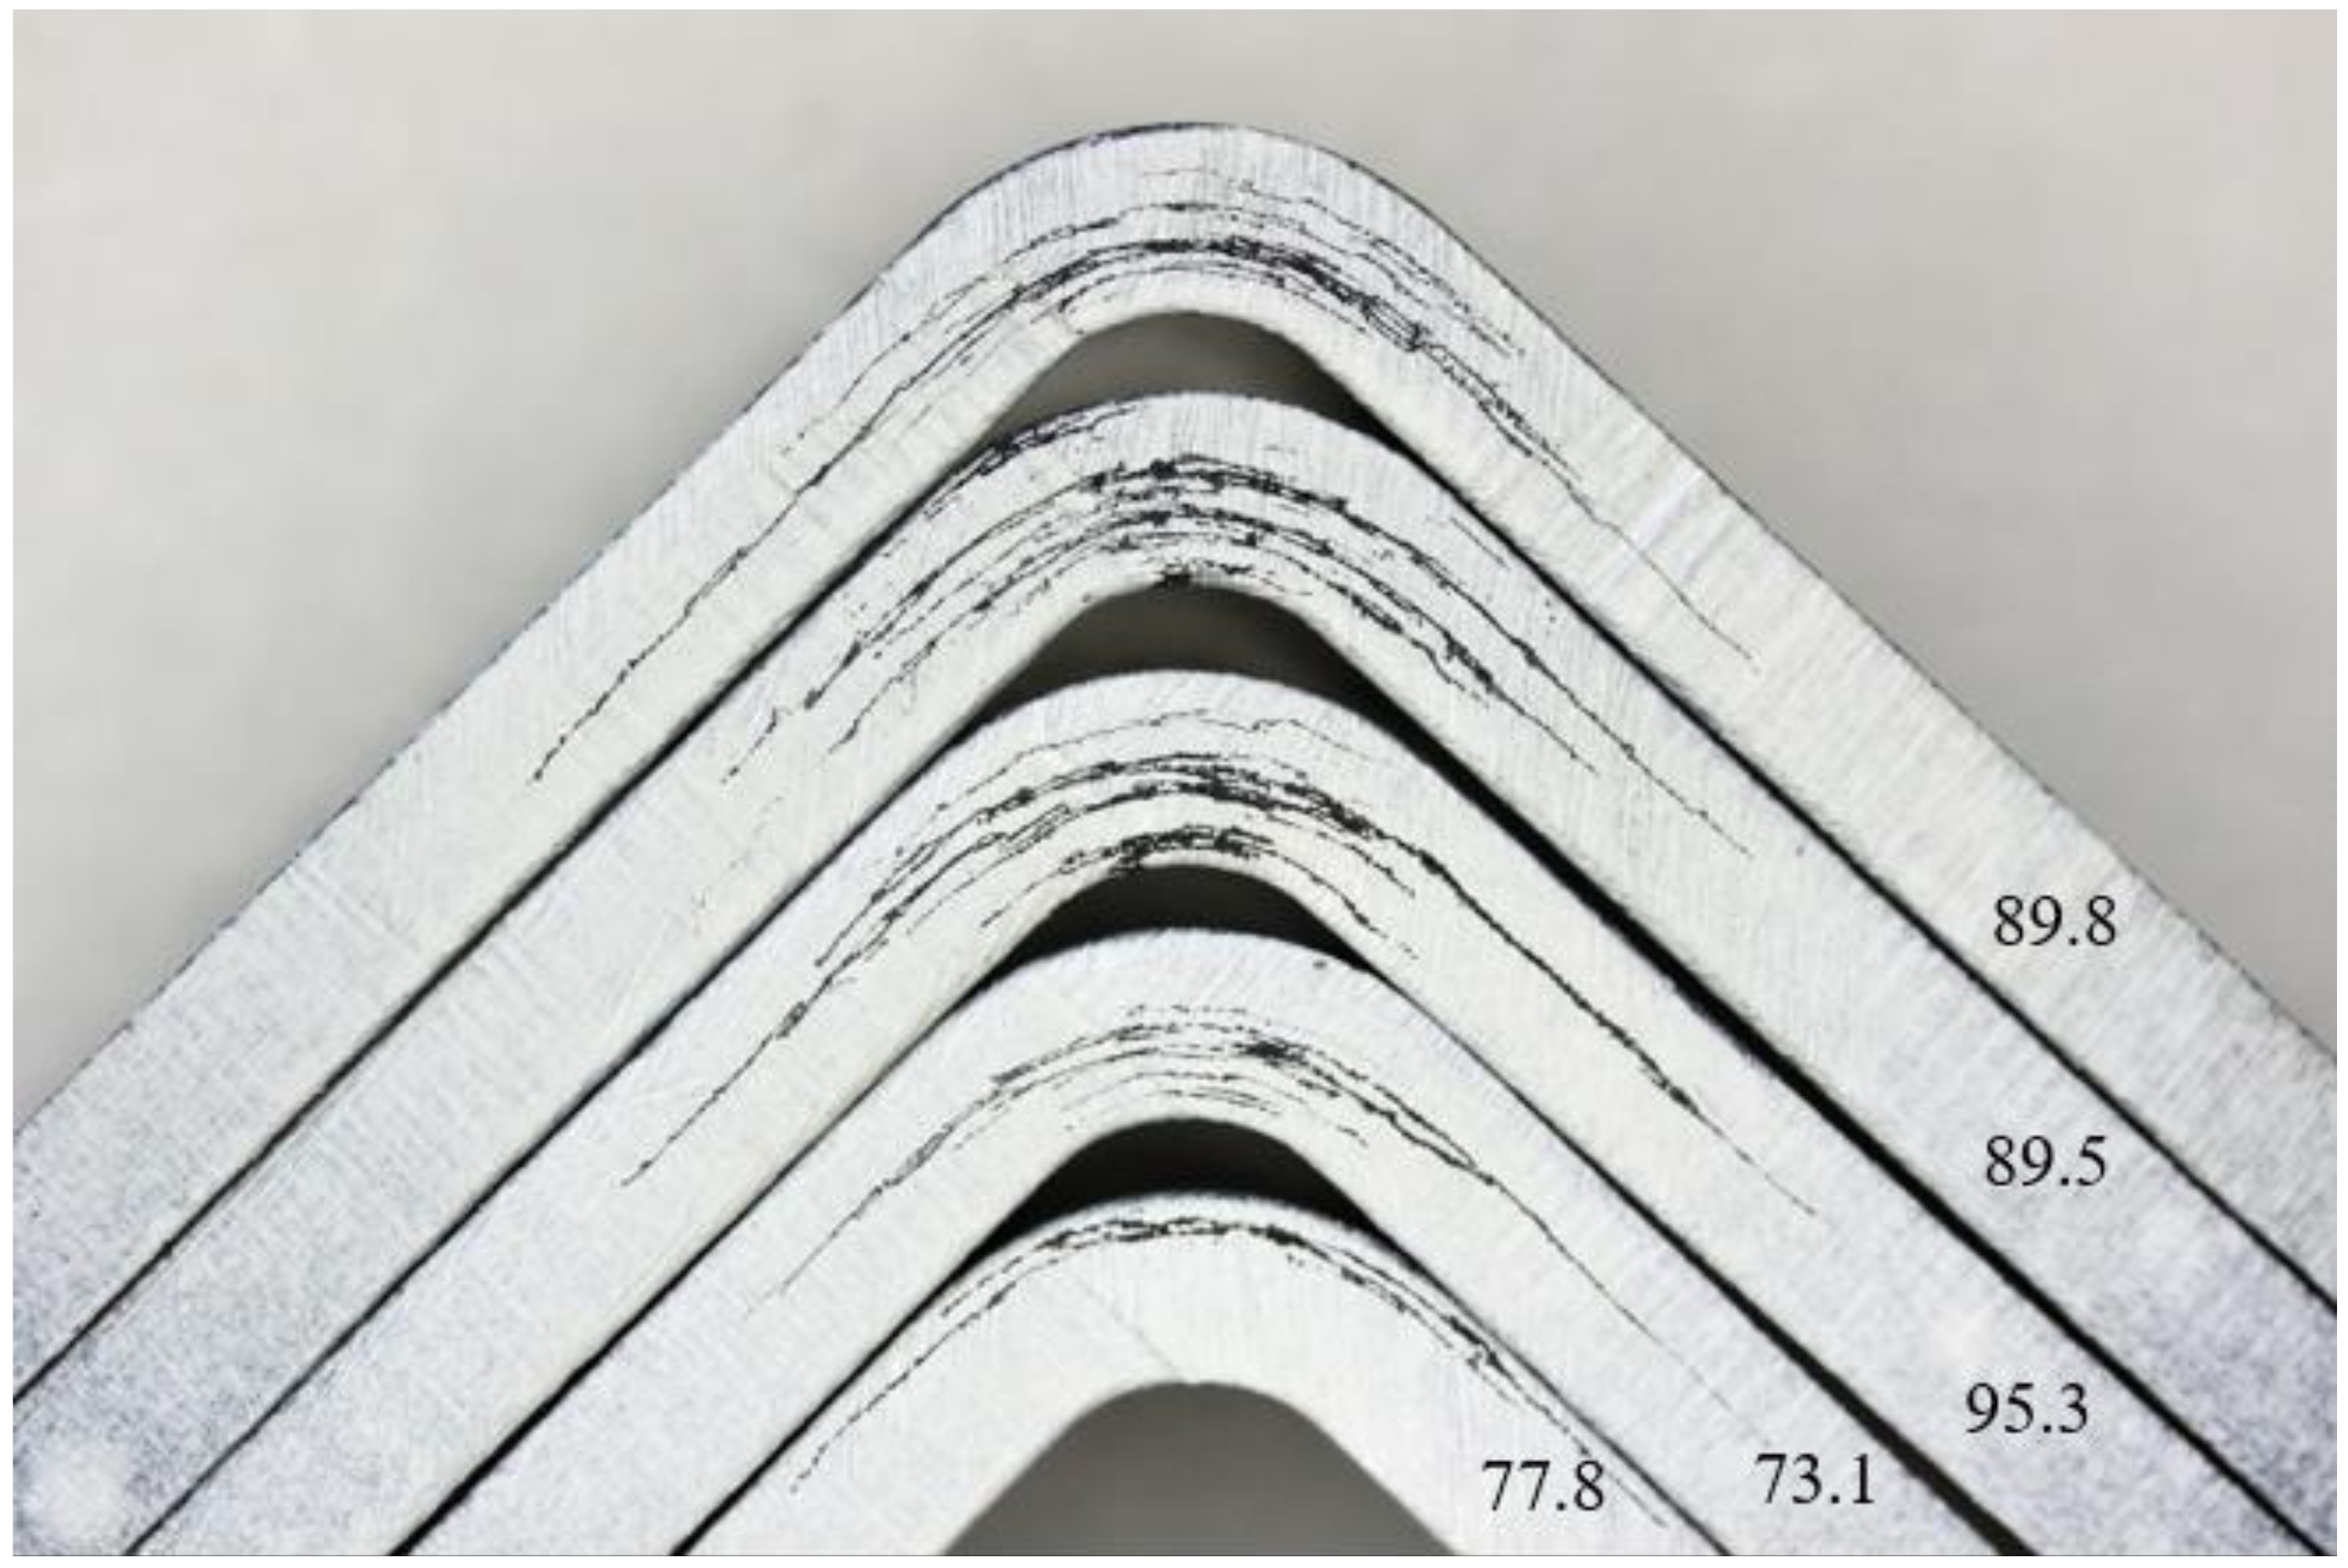
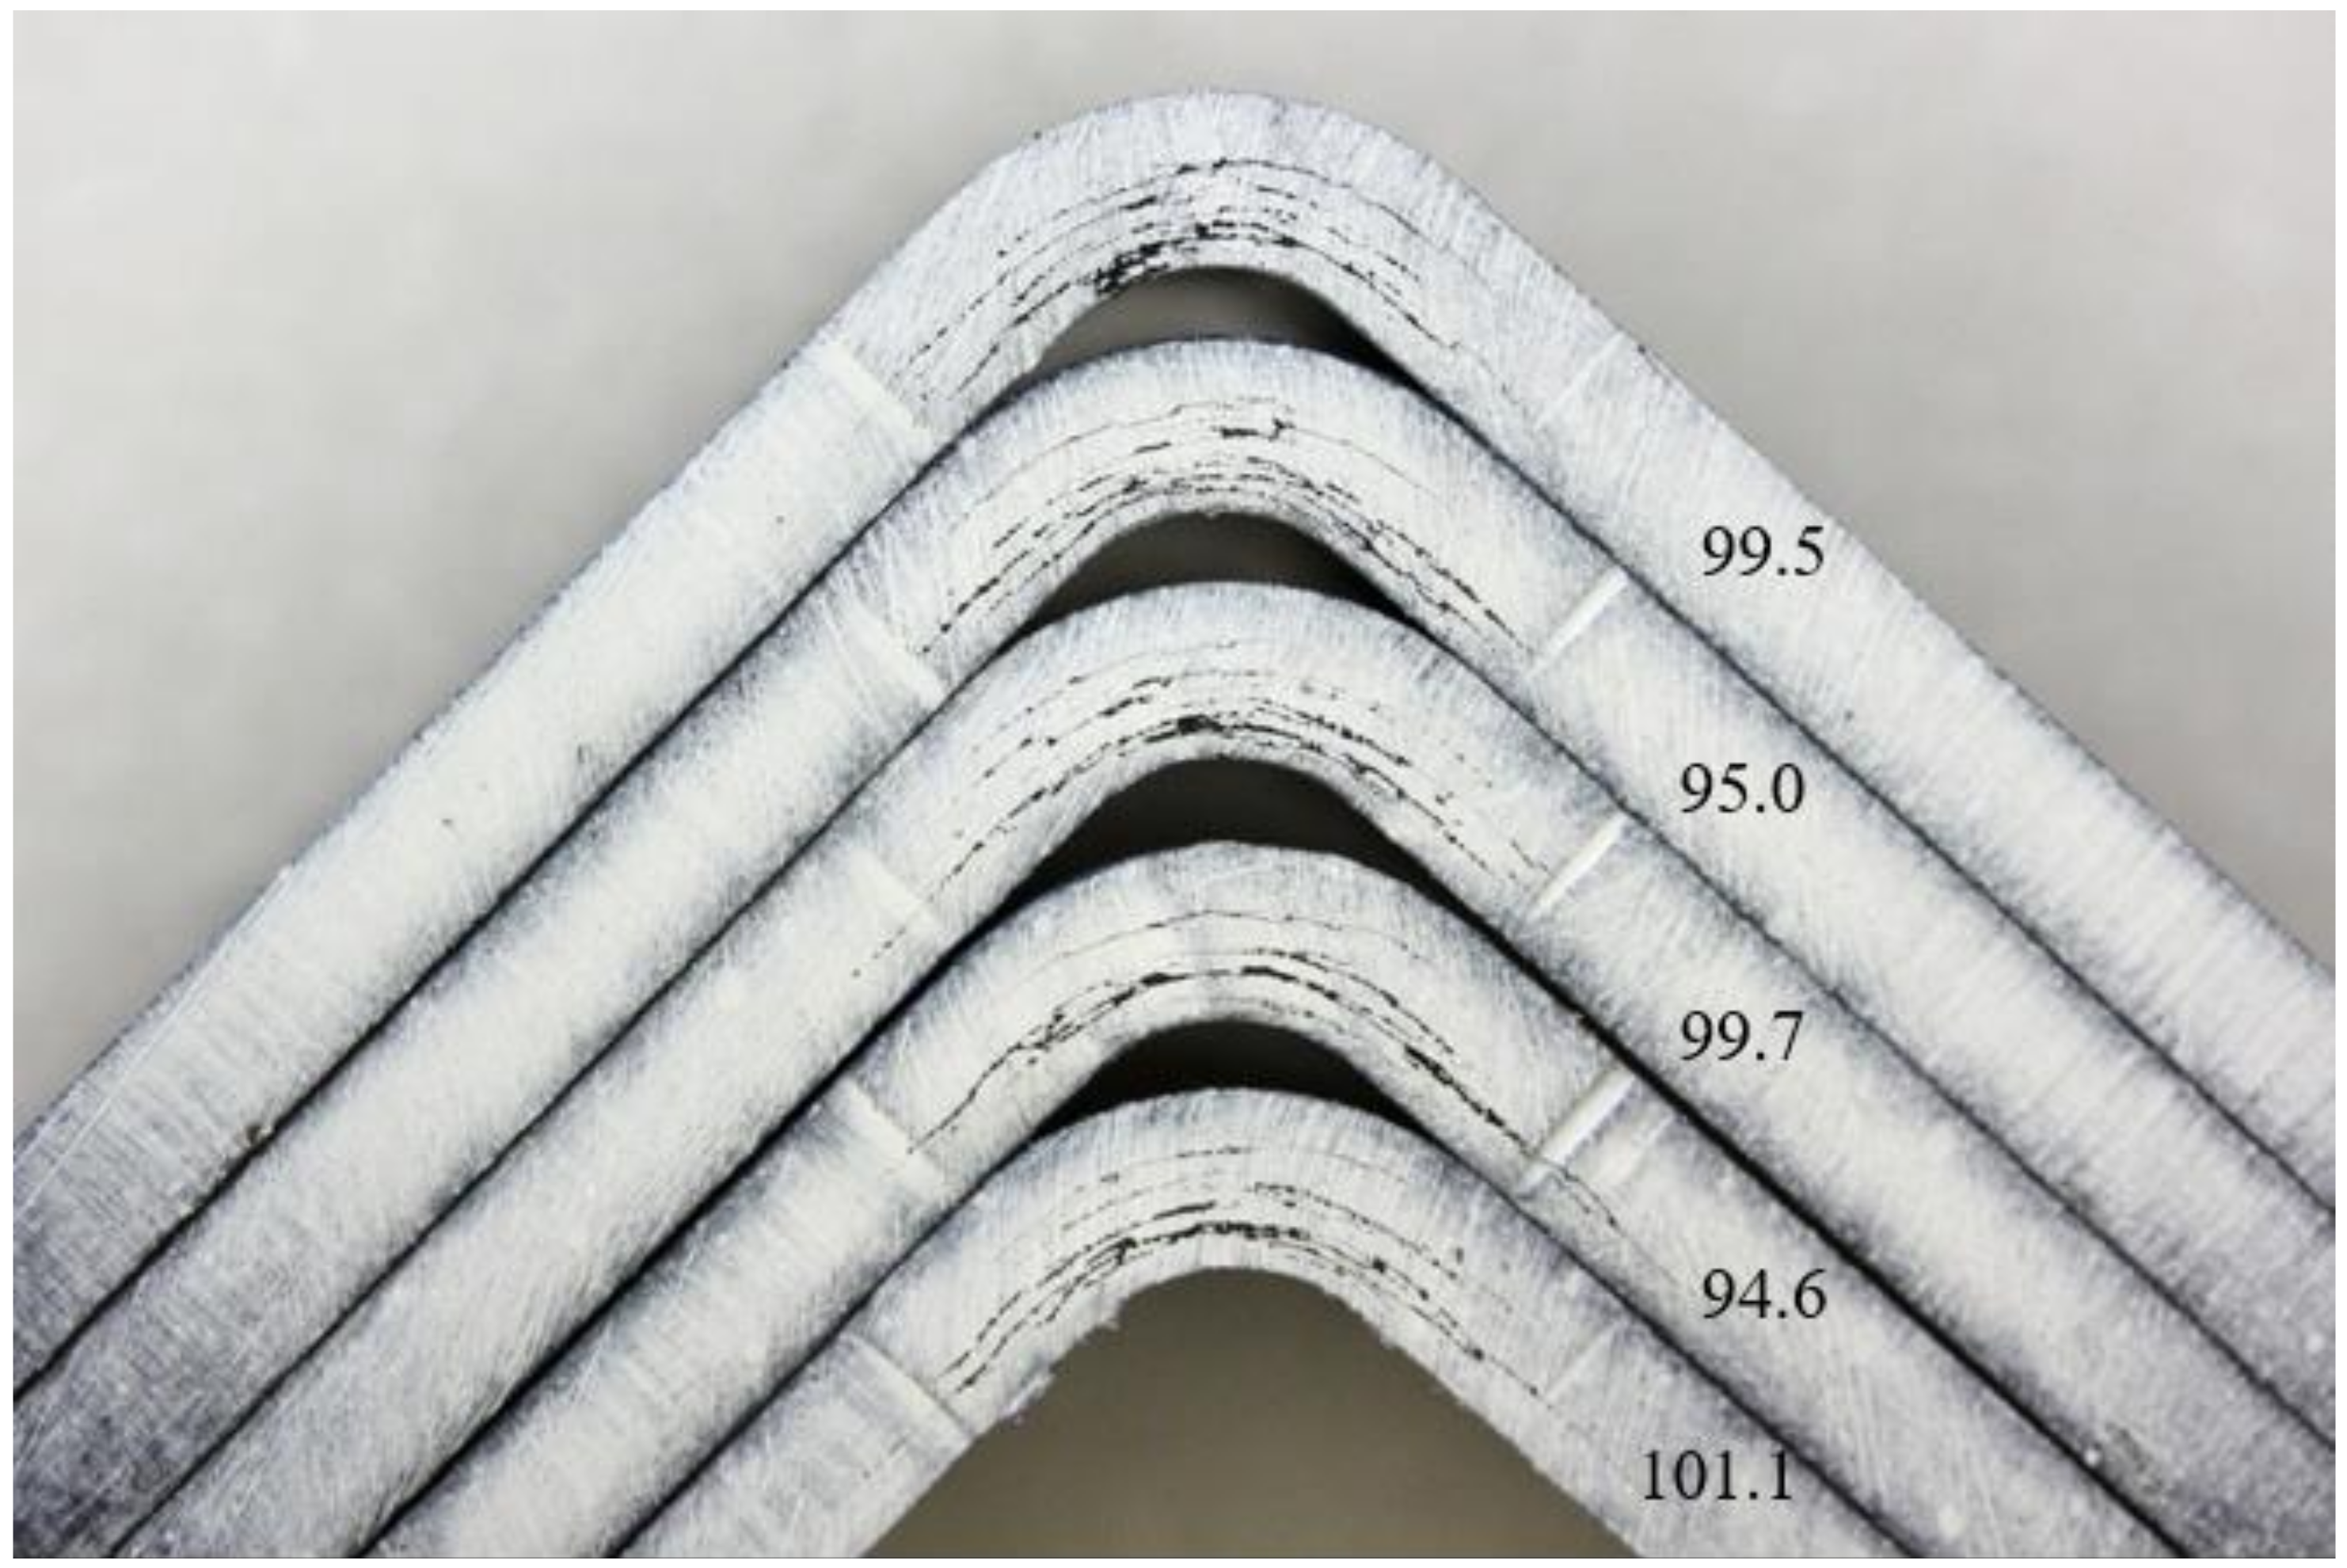
| 83.6 | 79.8 | 91.8 | 89.8 | 87.3 | 99.5 | |
| 84.7 | 86.4 | 88.3 | 89.5 | 78.2 | 95.0 | |
| 80.0 | 73.3 | 92.0 | 95.3 | 78.1 | 99.7 | |
| 63.5 | 78.6 | 96.0 | 73.1 | 87.0 | 94.6 | |
| 77.4 | 82.3 | 92.7 | 77.8 | 98.2 | 100.1 | |
| - | 77.0 | - | - | - | - | |
| Mean | 77.9 | 79.6 | 92.2 | 85.1 | 85.8 | 97.8 |
| S.D. | 8.52 | 4.49 | 2.73 | 9.26 | 8.29 | 2.75 |
| C.V. | 10.95 | 5.65 | 2.97 | 10.89 | 9.66 | 2.81 |
| Min. | 63.5 | 73.3 | 88.3 | 73.1 | 78.1 | 94.6 |
| Max. | 84.7 | 86.4 | 96.0 | 95.3 | 98.2 | 100.1 |
| Source of Variation | Degrees of Freedom | Sum of Squares (Partial) | Mean Squares (Partial) | F Ratio | p-Value |
|---|---|---|---|---|---|
| Model | 5 | 1468.419 | 293.6838 | 6.8664 | 0.0004 |
| A: thermoplastic type | 2 | 1128.575 | 564.2875 | 13.1932 | 0.0001 |
| B: Temperature | 1 | 312.3451 | 312.3451 | 7.3027 | 0.0122 |
| AB | 2 | 3.4559 | 1.7279 | 0.0404 | 0.9605 |
| Residual | 25 | 1069.2783 | 42.7711 | ||
| Pure Error | 25 | 1069.2783 | 42.7711 | ||
| Total | 30 | 2537.6973 |
| - | RT | CT | |||||
|---|---|---|---|---|---|---|---|
| PPS | PEEK | PAEK | PPS | PEEK | PAEK | ||
| RT | PPS | - | ND | D | ND | ND | D |
| PEEK | ND | - | D | ND | ND | D | |
| PAEK | D | D | - | ND | ND | D | |
| CT | PPS | ND | ND | ND | - | ND | D |
| PEEK | ND | ND | ND | ND | - | D | |
| PAEK | D | D | D | D | D | - | |
Publisher’s Note: MDPI stays neutral with regard to jurisdictional claims in published maps and institutional affiliations. |
© 2021 by the authors. Licensee MDPI, Basel, Switzerland. This article is an open access article distributed under the terms and conditions of the Creative Commons Attribution (CC BY) license (http://creativecommons.org/licenses/by/4.0/).
Share and Cite
Hron, R.; Kadlec, M.; Růžek, R. Effect of the Test Procedure and Thermoplastic Composite Resin Type on the Curved Beam Strength. Materials 2021, 14, 352. https://doi.org/10.3390/ma14020352
Hron R, Kadlec M, Růžek R. Effect of the Test Procedure and Thermoplastic Composite Resin Type on the Curved Beam Strength. Materials. 2021; 14(2):352. https://doi.org/10.3390/ma14020352
Chicago/Turabian StyleHron, Robin, Martin Kadlec, and Roman Růžek. 2021. "Effect of the Test Procedure and Thermoplastic Composite Resin Type on the Curved Beam Strength" Materials 14, no. 2: 352. https://doi.org/10.3390/ma14020352
APA StyleHron, R., Kadlec, M., & Růžek, R. (2021). Effect of the Test Procedure and Thermoplastic Composite Resin Type on the Curved Beam Strength. Materials, 14(2), 352. https://doi.org/10.3390/ma14020352