3.1. Thermophysical Parameters and Elemental Distribution
The vast number of HEAs that can be designed from stable elements [
10,
13,
69] makes searching for technologically interesting compositions by trial and error clearly inadequate [
8], despite the rapid evolution of various combinatorial high-throughput methods for simultaneous production of a range of compositions (e.g., [
70]). Accordingly, a large effort has been devoted to the prediction of the phase formation in HEAs [
9,
10,
11,
12,
13,
14,
15,
16,
17,
57,
71]. Several semi-empirical criteria for the formation of different phases, single-phase solid solutions (SSs) and intermetallic compounds (IM) and their mixtures with an SS and/or an amorphous phase, a-HEAs, have been developed [
9,
10,
11,
12,
13,
14,
15,
16,
17,
57]. These criteria are mainly based on thermophysical parameters such as the mixing or formation enthalpy [
70], ∆
Hmix, the ideal configurational entropy, ∆
Sconf, the atomic size mismatch,
δ, the valence electron concentration, VEC, and electronegativity (see, e.g., [
10,
11,
12,
13,
61]).
δ and ∆
Hmix are defined as
where
ci and
ri denote the atomic fraction and atomic radius of the
ith element, respectively, and
denotes the enthalpy of mixing of the binary liquid between the
ith and
jth elements at an equiatomic composition [
10,
12].
Despite their limitations and some erroneous predictions (such as the occurrence of an IM in the SS region and an SS in the a-HEA region, e.g., [
10,
11,
12,
13,
16,
23,
54,
55,
56]), as illustrated in
Figure 2,
Figure 3 and
Figure 4, these criteria are useful for a quick comparison of different HEA systems (
Figure 4). The variation of thermophysical parameters with the composition within a given alloy system can, on the other hand, provide an insight into the evolution of the properties of this system (
Figure 2 and
Figure 3, [
24,
25,
52]).
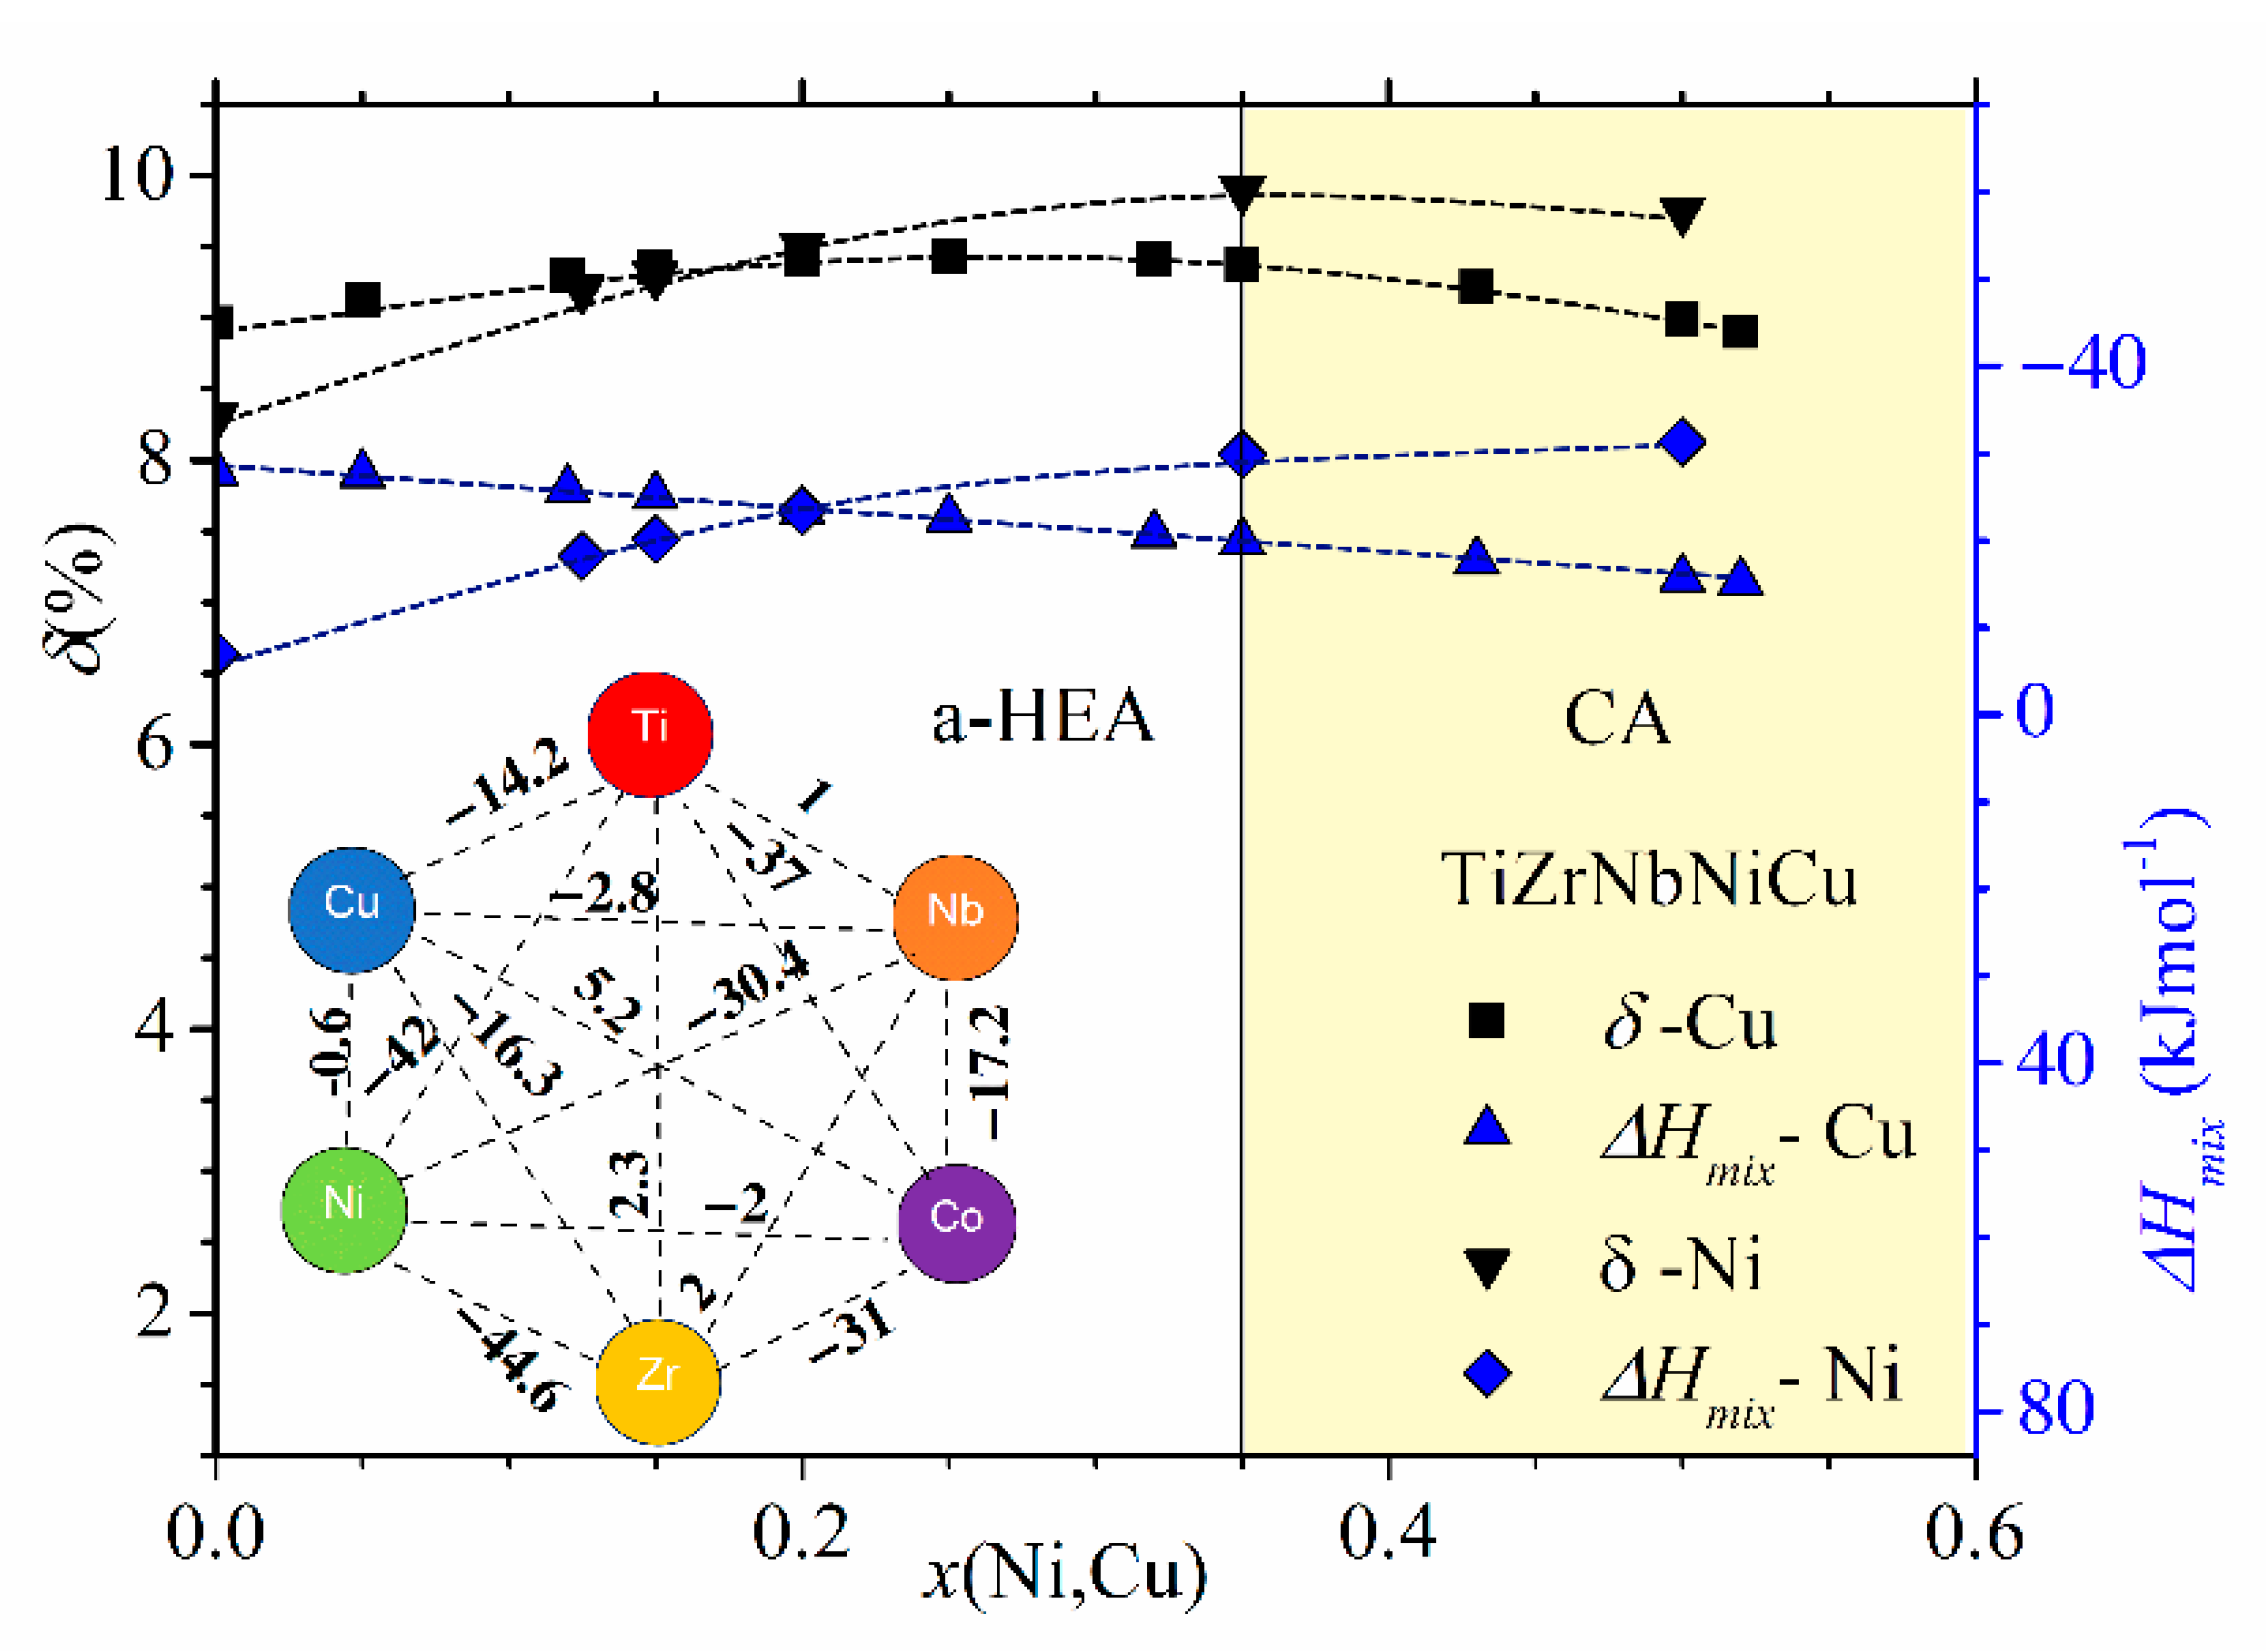
In
Figure 2 and
Figure 3, we show the compositional variations of selected thermophysical parameters in characteristic quinary TE-TL [
24,
25] and Cantor-type alloys [
45,
47], respectively. In the calculation of these parameters, we used standard expressions (see, e.g., [
12,
13,
24,
25]), and the input parameters for ∆
Hmix and
δ in
Figure 2 and
Figure 3 and their insets were taken from References [
71,
72], respectively. For simplicity, a rather well-known variation of ∆
Sconf [
25], which depends only on the number of alloying components and not on their type [
10,
11,
12,
13], is not shown in these figures. In
Figure 2, showing the variations of parameters of (TiZrNbCu)
1−xNi
x and (TiZrNbNi)
1−xCu
x alloys with
x, the concentration range of HEAs,
x ≤ 0.35, is distinguished from that of Ni- or Cu-rich alloys by a different color. The range of values of ∆
Hmix (from −32 to −6.6 kJmol
−1) and of
δ (from about 8% to 10%) places our alloys in a standard ∆
Hmix−
δ plot [
12] within the region occupied with an IM (
x = 0 Ni) and a-HEAs (other alloys), which is consistent with our experimental findings. As it can be seen in the inset, small values of ∆
Hmix are the consequence of strong interatomic interactions between TE and TL atoms [
71], and a large
δ is similarly due to the large difference in size between TE and TL atoms. Since a small ∆
Hmix and large
δ are general features of TE-TL alloys, this facilitates the comparison of the results for our quinary MGs with previous results for properties of similar binary ones [
73,
74,
75].
The comparison of ∆
Hmix and
δ in
Figure 2 shows that both the magnitudes and variations of
δs are quite similar in the two alloy systems, whereas the corresponding variations of ∆
Hmix are quite different. In (TiZrNbCu)
1−xNi
x alloys, ∆
Hmix decreases rapidly from −6.6 for
x = 0 to −32 kJmol
−1 at
x = 0.5, whereas in (TiZrNbNi)
1−xCu
x alloys, ∆
Hmix increases nearly linearly from −28.2 to −15 kJmol
−1 within the same concentration range. The inset in
Figure 2 shows that the values of ∆
Hmix between Cu and Ti, Zr or Nb [
71] are about three or more times larger than those between Ni and Ti, Zr or Nb, which probably explains the linear increase in ∆
Hmix with the Cu content. This large reduction in interactions between Cu and TE atoms strongly affects all properties of (TiZrNbNi)
1−xCu
x alloys. These MGs show an ideal solution behavior [
25] which results in linear variations of their properties with
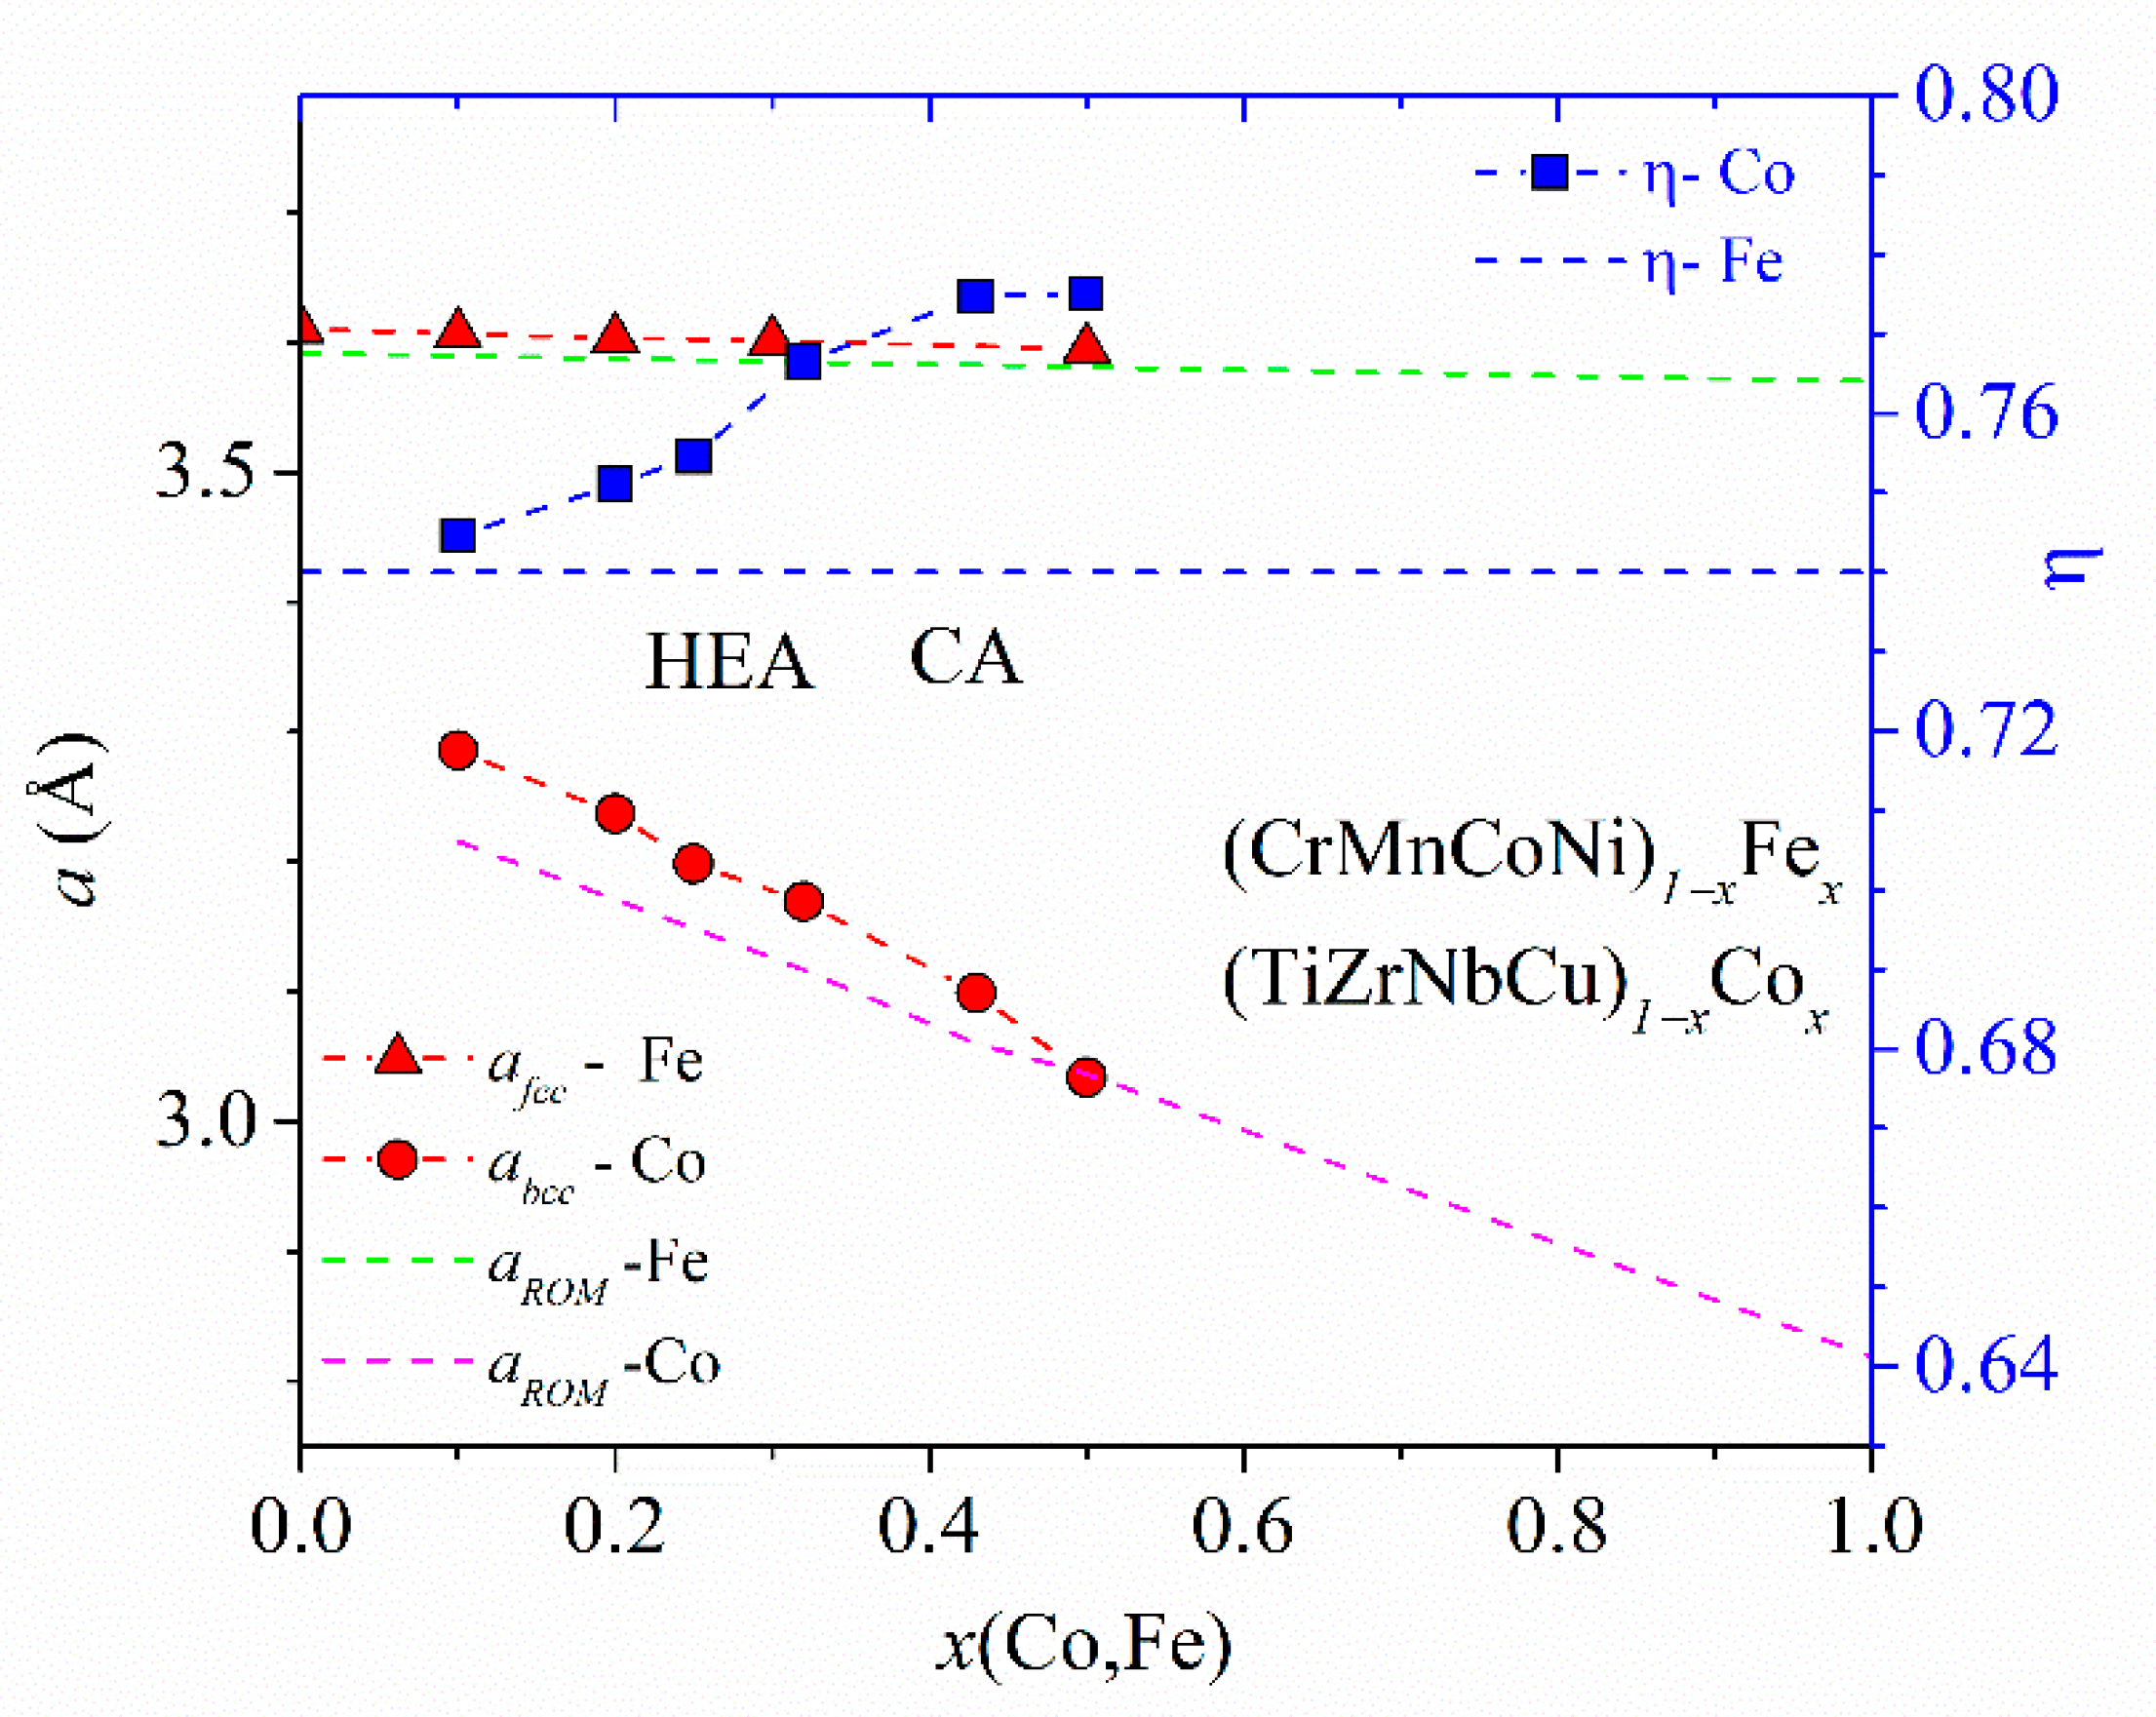
x such as that depicted in
Figure 1. In contrast, stronger interactions of Co and Ni atoms with TE ones (inset in
Figure 2) lead to more complex variations of their properties with the concentration [
24,
26,
37,
52].
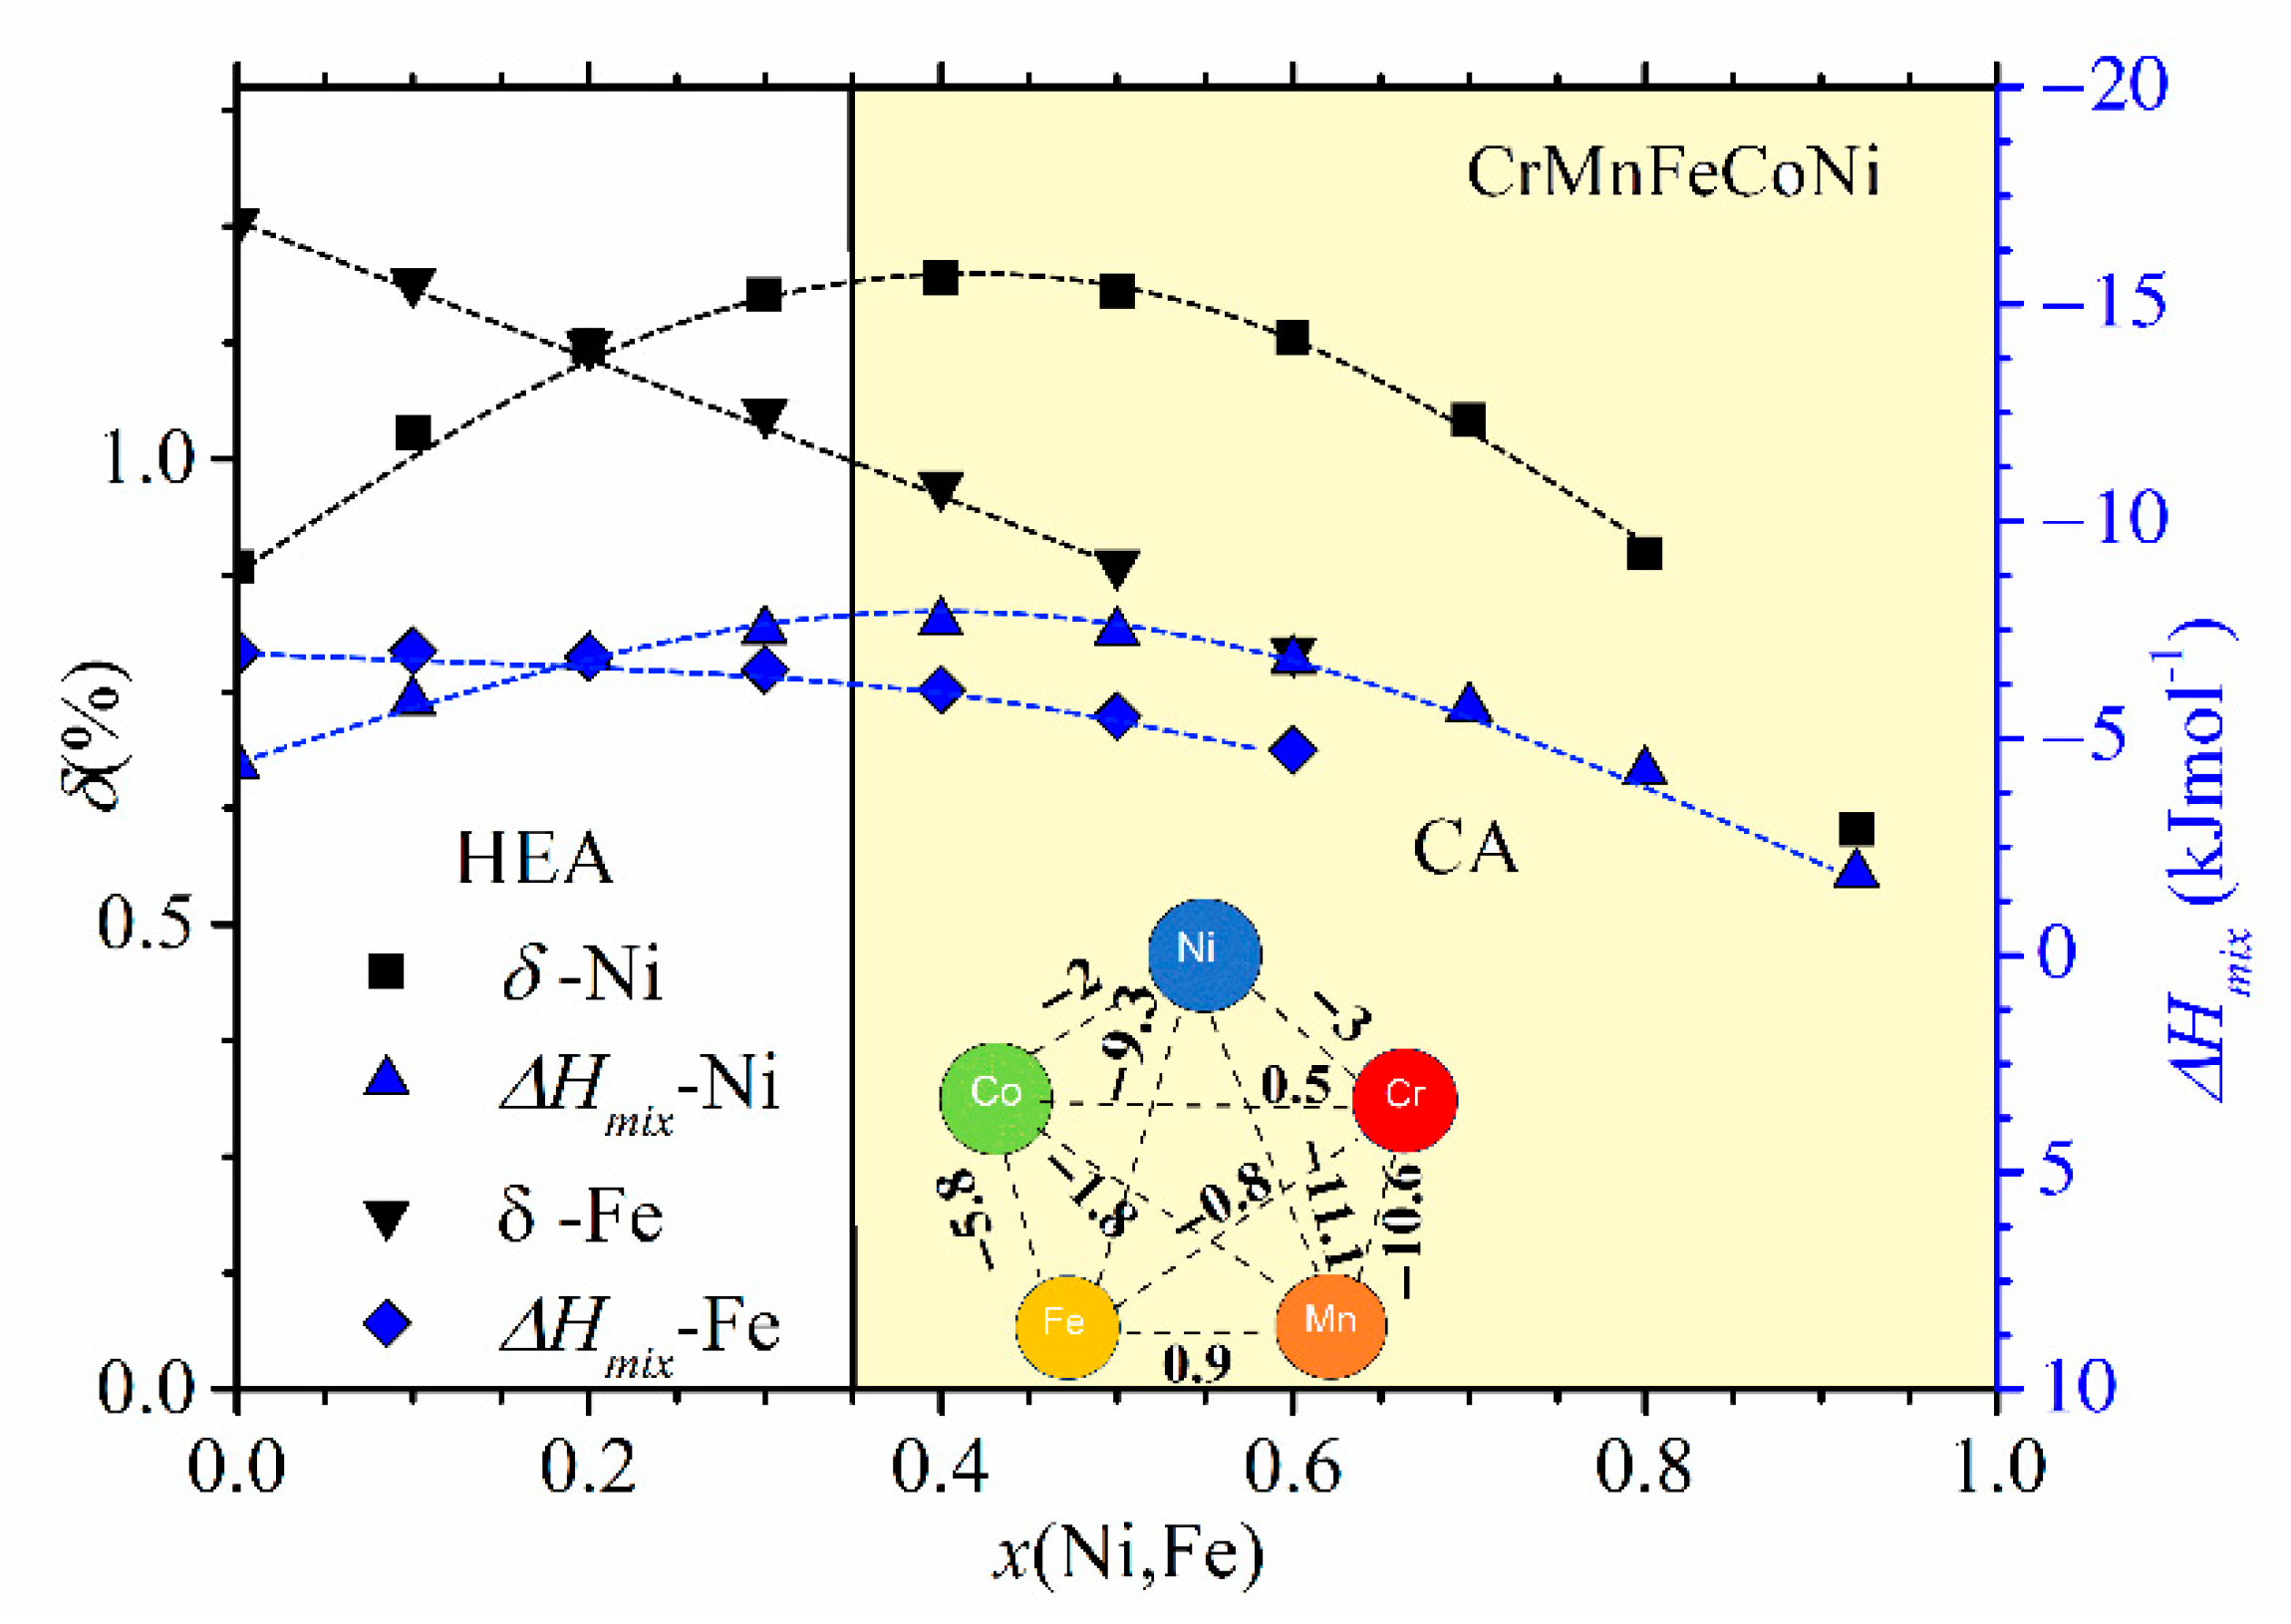
Compositional variations of ∆
Hmix and
δ in (CrMnFeCo)
1−xNi
x and (CrMnCoNi)
1−xFe
x alloys are shown in
Figure 3. We selected these two alloy systems because they, as with those shown in
Figure 2, exhibit very different variations of their properties with the composition [
45,
47]. In these alloy systems, an FCC crystalline structure forms over a broad concentration range [
45,
46,
47]. We note that the concentration scale in
Figure 3 extends up to
x = 1 due to the very broad concentration range of a single-phase solid solution with an FCC structure in (CrMnFeCo)
1−xNi
x [
45]. Taking into account that the studied concentration range in
Figure 3 is considerably broader than that in
Figure 2, the variations of thermophysical parameters in
Figure 2 and
Figure 3 are qualitatively similar. The variation of ∆
Hmix of (CrMnFeCo)
1−xNi
x alloys with
x is qualitatively similar to that in (TiZrNbCu)
1−xNi
x alloys, whereas that in (CrMnCoNi)
1−xFe
x alloys is similar to the variation observed in (TiZrNbNi)
1−xCu
x alloys. As with the quinary TE-TL alloys [
24,
25,
26], different variations of ∆
Hmix with
x correspond to different compositional variations of their properties [
45,
46,
47]. Some properties of (CrMnCoNi)
1−xFe
x alloys vary linearly with
x within the range of FCC SSs [
46], which is similar to what is observed in (TiZrNbNi)
1−xCu
x MGs [
25], whereas those in (CrMnFeCo)
1−xNi
x alloys show a more complex behavior similar to that illustrated in
Figure 1. Since the alloying components in a Cantor type of alloy seem to form a common valence band (see PES results in
Section 3.4 and [
30]), VEC should provide a reasonable approximation for their ES. Accordingly, the VEC criterion for the selection of the crystalline phase in HEAs [
60] should describe both the crystalline phases of Cantor alloys and their evolution with the composition. According to this criterion, the alloys with VEC ≥ 8 should have a stable FCC phase. This criterion is consistent with a single FCC phase in (CrMnFeCo)
1−xNi
x alloys (since VEC ≥ 8 throughout the explored concentration range) but is at variance with the onset of a BCC phase in (CrMnCoNi)
1−xFe
x alloys for
x ≥ 0.7 (since in these alloys, VEC = 8 and does not depend on
x).
Despite the qualitatively similar variations of thermophysical parameters in
Figure 2 and
Figure 3, the magnitudes of these parameters are quite different. As it could be expected for alloys composed of similar, adjacent elements, the values of
δ in
Figure 3 are small, around 1%, thus about ten times smaller than those in
Figure 2. The corresponding ∆
Hmix values are larger than −7.5 kJmol
−1, thus, on average, several times larger than those in
Figure 2. Such relatively large values of ∆
Hmix in
Figure 3 result from moderate interatomic interactions between the alloying components [
71], as seen in the inset in
Figure 3. Indeed, the smallest value of ∆
Hmix among these elements is that between Mn and Ni (−11.1 kJmol
−1). (The relatively strong interaction between Ni and Mn atoms is reflected in the modest fluctuations in the composition between the dendritic and interdendritic regions in as-cast Cantor-type alloys [
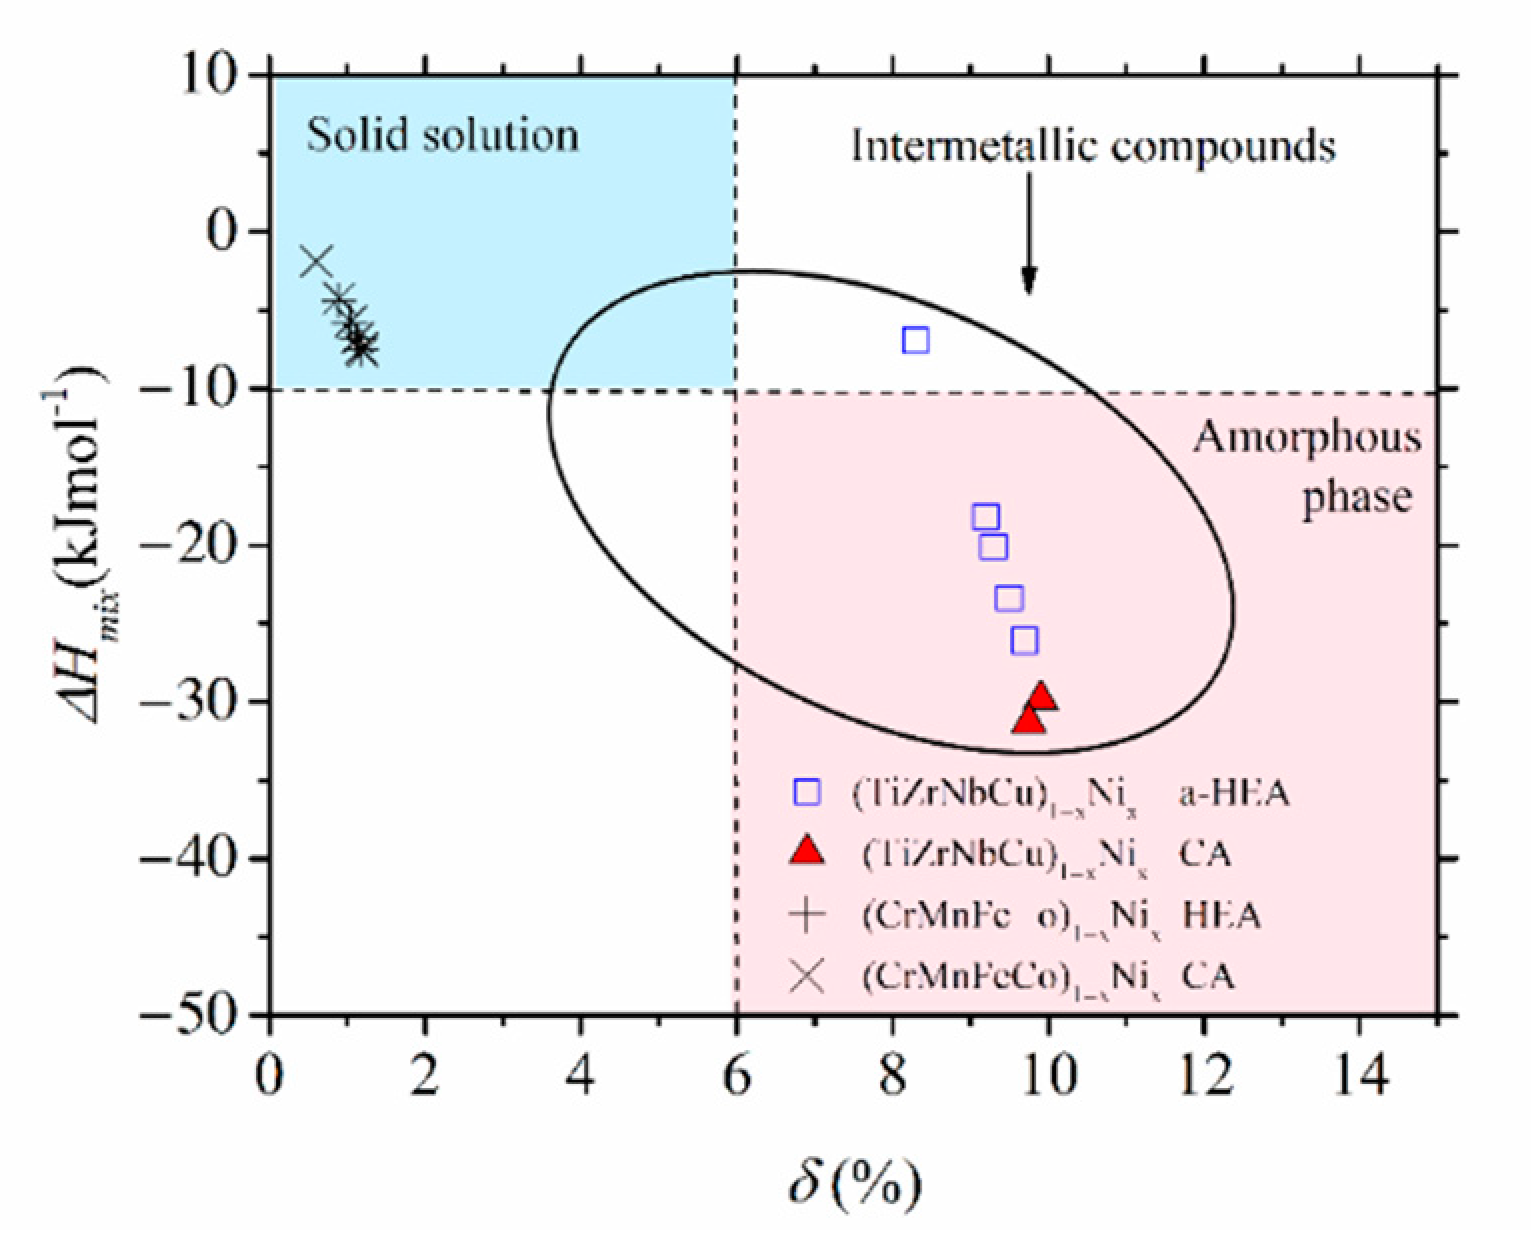
45].) As a result of large differences in the magnitudes of thermophysical parameters, Cantor-type alloys and quinary TE-TL alloys occupy very different parts of the standard ∆
Hmix vs.
δ diagram [
9,
10,
11,
12,
13]. This is illustrated for (CrMnFeCo)
1−xNi
x and (TiZrNbCu)
1−xNi
x alloys in
Figure 4: the first alloys are placed in the SS region, characterized by a small
δ ≤ 6.5% and modest interatomic interactions, −15 kJmol
−1 ≤ ∆
Hmix ≤ −5 kJmol
−1 (both consistent with the Hume-Rothery rules [
12]), whereas the second alloys are placed in the opposite region of large
δs, extending from that occupied by IMs for
x = 0 to that of a-HEAs for
x ≥ 0. We note that the ∆
Hmix−
δ diagram, although useful for the classification of HEAs into SS, IM and a-HEA groups, is not associated solely with HEAs. Despite their broad compositional range covering both HEAs and CAs (denoted in
Figure 4 with different symbols), the data for all (CrMnFeCo)
1−xNi
x alloys are neatly grouped within the region of SSs and those of (TiZrNbCu)
1−xNi
x alloys in the IM/a-HEA region. Moreover, all alloys obeying the Hume-Rothery rules will be placed within the SS region [
12], regardless of their composition and the number of alloying components, whereas those in accordance with Inoue´s rules [
59] are likely to be placed in the IM or a-HEA region. There are, however, some alloys which can be prepared as MGs, but the final phase of these alloys depends on the preparation and processing conditions [
51,
53,
54,
55,
56]; thus, the ∆
Hmix−
δ diagram is not sufficient for their classification.
Rather strong interactions of Ni, Co and Cu atoms with TE atoms (inset in
Figure 2) and a high melting point of Nb can all affect the distribution of constituents in our TE-TL alloys [
53]. Similarly, very different strengths of interatomic interactions between different components of Cantor-type alloys (inset in
Figure 3) can produce a somewhat inhomogeneous distribution of elements within these alloys [
9]. Since Cantor-type alloys contain large fractions of magnetic elements, their magnetic properties will be strongly affected by their distribution. Accordingly, we performed EDS mapping of the distribution of constituent elements in all as-cast TE-TL MGs and homogenized Cantor-type alloys. As described in
Section 2 and previous papers [
23,
24,
25,
45,
46,
47,
48,
52], elemental mapping was performed on three different areas of each alloy to access the eventual inhomogeneity in the distribution of the constituents caused by the composition variation in different areas of the same sample. Mapping was also used to obtain information about the possible size and shape of such inhomogeneity (e.g., [
9,
53]). This is illustrated in
Supplementary Materials Figures S1 and S2, which show the evolution of the microstructure and elemental distribution (chemical homogeneity) in the as-cast and rolled and annealed (homogenized) (CrMnFeCO)
1−xNi
x samples with
x = 0.3 and 0.92, respectively. As previously described in some detail [
23,
24,
25,
45,
46,
47,
48,
52] and illustrated in
Supplementary Materials Figures S1 and S2, the distributions of constituent elements were random down to micrometer scale in all studied alloys. We did not observe any clear correlation or anticorrelation between the distributions of different elements in the elemental mappings. Although these elemental mappings cannot exclude some compositional fluctuations on a nanometric scale, such fluctuations, even if present, are not likely to have any larger effect on the macroscopic (bulk) properties of nonmagnetic TE-TL MGs. However, such fluctuations can affect the magnetism in 3d transition metal alloys, as seen from the very different descriptions of the magnetic state of the Cantor alloy in different papers (e.g., [
5,
7,
13,
15]). Further, in all samples, the composition calculated from EDS at different locations was the same within about 1 at. %, which is an indication of their macroscopic homogeneity. Since the average concentrations of all alloys obtained from EDS were within about 1 at. % of the corresponding nominal ones, we will continue to use the nominal compositions in our further analyses.
3.2. Thermal Parameters
Thermal parameters are particularly important since they determine the useful temperature range in all alloys (e.g., [
8,
13,
76,
77,
78]). Further, these parameters are related to the strength of interatomic bonding in an alloy and can also provide an insight into the glass-forming ability (GFA) of alloys that can be vitrified. Unfortunately, thermal analysis of HEAs is frequently ignored, and their thermal parameters are estimated by using the rule of mixtures [
8] which often provides erroneous values of these parameters in both c-HEAs (e.g., [
45,
46,
47,
78]) and a-HEAs [
23,
24,
25,
37]. We note, however, that for some alloy systems, such as those based on refractory elements, the temperature span of commercial DSCs (usually
T ≤ 1400 °C) may not be sufficient for their complete thermal analysis.
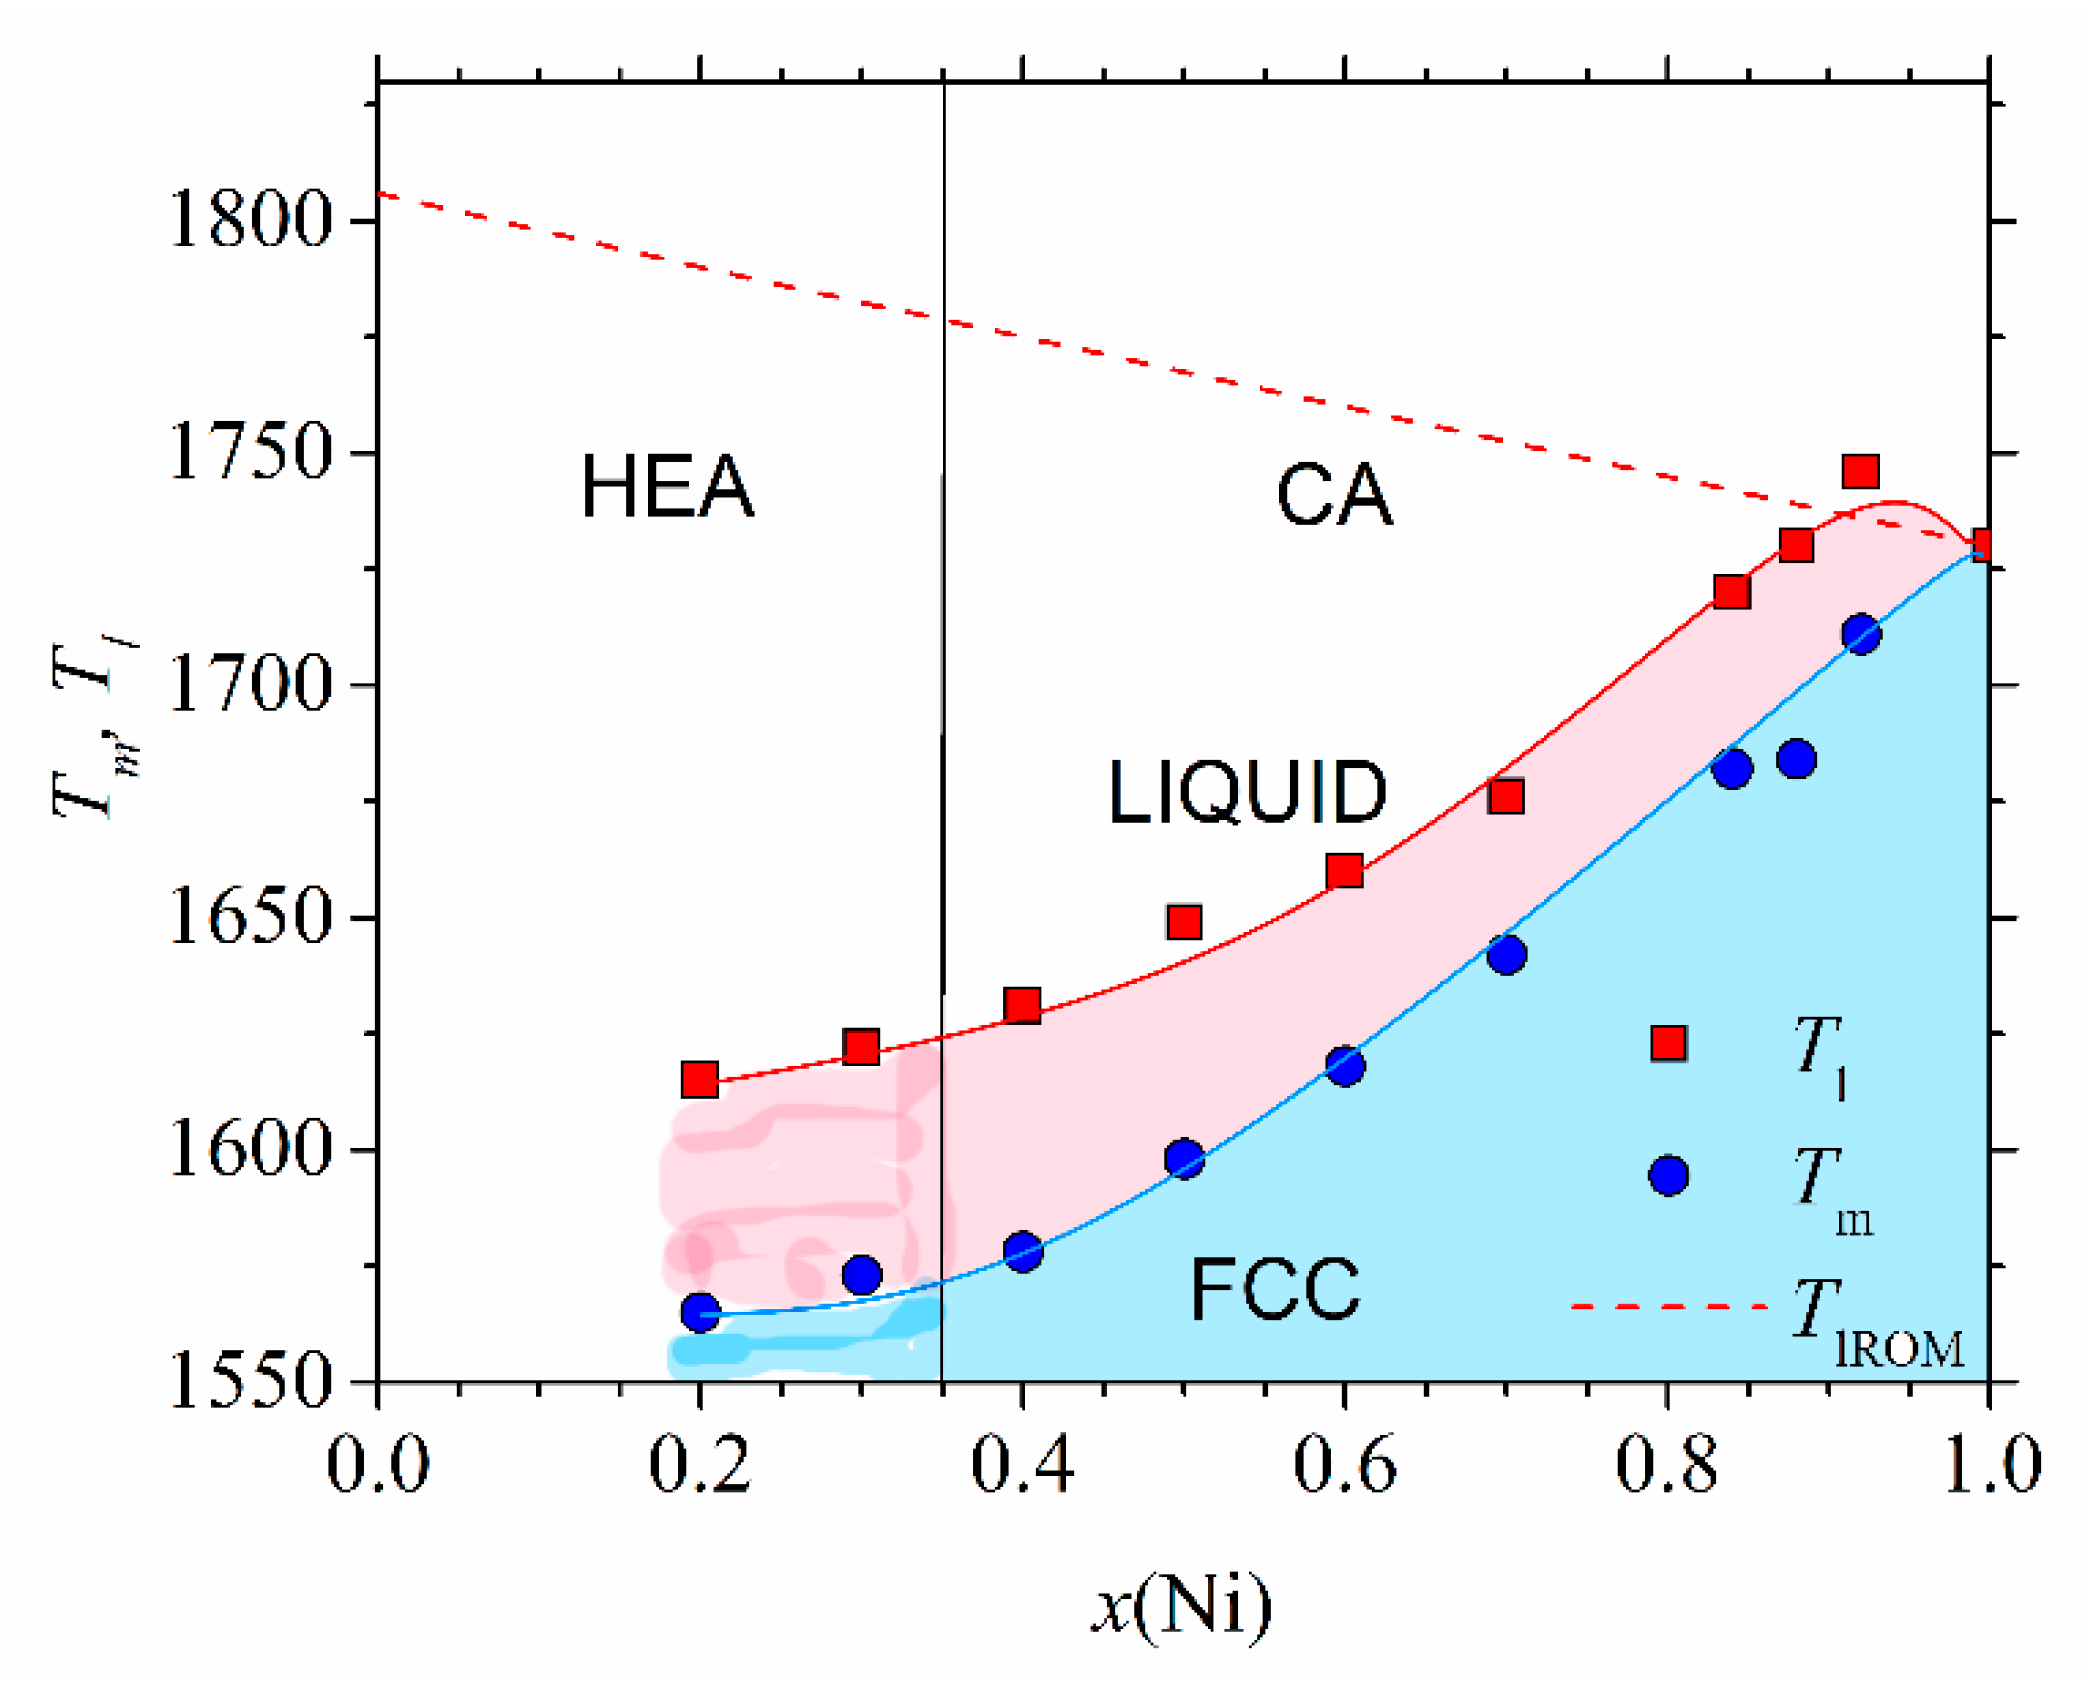
Figure 5 shows the high-temperature part of the experimental phase diagram of (CrMnFeCo)
1−xNi
x alloys obtained from DSC measurements (similar to those shown in [
78]). Only the part of the phase diagram corresponding to alloys with an FCC crystalline structure (
x ≥ 0.2) is shown. Different colors denote different phases: above
Tl, the alloy is in a liquid state, and in the temperature interval between
Tl and
Tm, a coexistence of a solid phase and liquid is established. Below
Tm, all alloys with
x ≥ 0.02 possess a single-phase FCC structure as verified by using their XRD patterns [
45,
46]. This part of the phase diagram agrees rather well, both qualitatively and quantitatively, with that calculated by using CALPHAD [
46]. Only a small maximum of
Tl around
x = 0.9 is not reproduced by the calculation. The values of
Tm (dashed line), calculated by using the rule of mixtures, are at variance with the experimental ones. The rule of mixtures predicts a linear decrease in
Tm from 1792 K for
x = 0.2 towards that of pure Ni, whereas the experimental values increase nonlinearly from 1563 to 1728 K for pure Ni. As it will be seen later, a rapid increase in
Tm for
x ≥ 0.4 coincides with the onset of ferromagnetism in these alloys. In contrast, the values of
Tm in (CrMnCoNi)
1−xFe
x alloys increase practically linearly with
x from 1505 K for
x = 0 to that of pure Fe (1808 K) [
47]. Thus, in both these alloy systems, the thermal stability of CAs (
x ≥ 0.35) is better than that of HEAs; hence, these HEAs are unlikely to be used at elevated temperatures. We note that the values of
Tm calculated from the rule of mixtures would lead to an opposite, apparently erroneous conclusion on the evolution of thermal stability with the concentration. Indeed, as already noted in
Figure 5, the rule of mixtures predicted both incorrect values of
Tm and erroneous concentration dependence. The predictions of the rule of mixtures for
Tm of other Cantor types of alloys [
47] were similarly erroneous as those in
Figure 5. At lower temperatures, the phase diagram of (CrMnFeCo)
1−xNi
x alloys [
46] and other Cantor types of alloys [
47] becomes much more complex, composed of different phases in different temperature and concentration ranges. As a result, prolonged annealing of these initially single-phase alloys, at temperatures below about 900 K, results in precipitation of other phases within the matrix [
9,
13], which further limits their applicability at higher temperatures.
Similarly, DSC/DTA analysis [
23,
24,
25,
37,
52] was used to determine thermal parameters of (TiZrNbCu)
1−xCo
x, (TiZrNbCu)
1−xNi
x and (TiZrNbCu)
1−xCu
x alloys exhibiting an amorphous XRD pattern after melt spinning. Thermal analysis of amorphous alloys enables, in addition to the determination of
Tm and
Tl, the extraction of the glass transition (
Tg) and crystallization (
Tx) temperatures. These thermal parameters form the non-equilibrium phase diagram of glass-forming systems [
25,
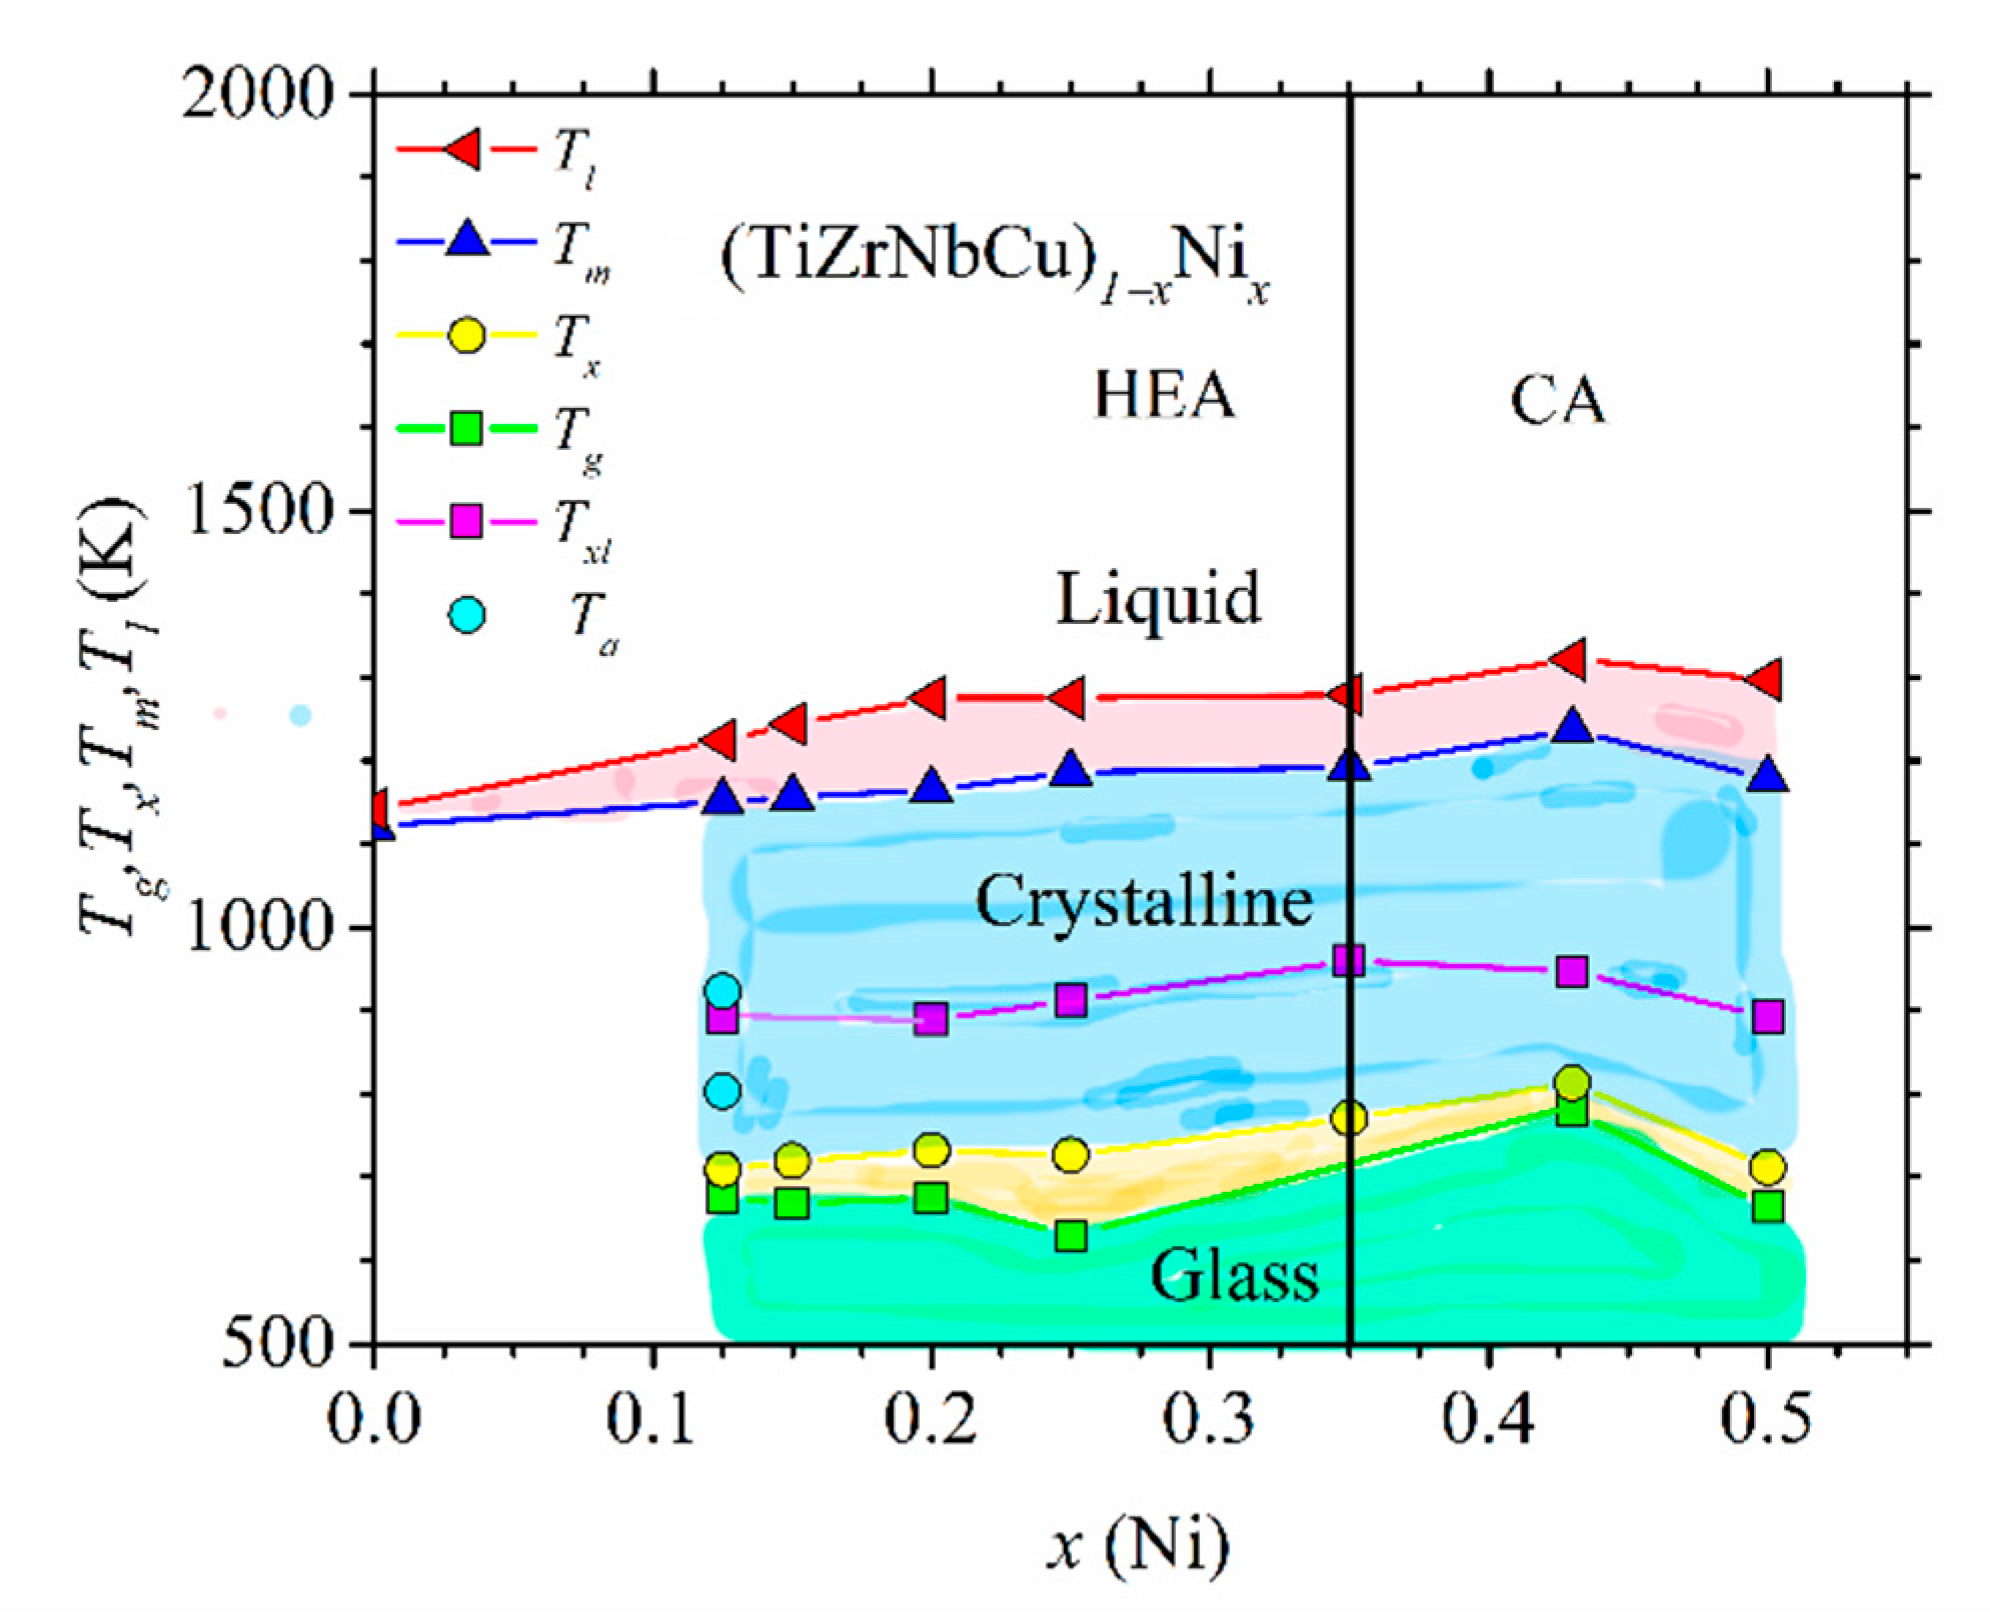
52]. In
Figure 6, we show such a diagram for (TiZrNbCu)
1−xNi
x alloys.
As in
Figure 5, different phases are colored with different colors. Here, in addition to three phases appearing in
Figure 5, the diagram contains the amorphous state below
Tg and a supercooled liquid state situated between
Tg and
Tx. All quinary TE-TL MGs studied by us [
23,
24,
25,
37,
52] showed complex crystallization patterns reflected in three or more exothermic maxima spread over a broad temperature range. These consecutive crystallizations are consistent with a strong but quantitatively different bonding tendency between different TE and TL atoms inferred from their thermophysical parameters shown in the inset in
Figure 2. Due to this, in
Figure 6,
Tx denotes the onset of the first crystallization event, and
Txl denotes the temperature of the exothermic maximum corresponding to the last crystallization event appearing in the corresponding DSC trace. Rather complex crystallization processes in quinary TE-TL MGs will make future studies of the evolution of crystallization products with the composition and temperature much more complicated than those for the corresponding binary MGs [
73,
76,
77]. Thus far, we have crystallized only an MG with
x = 0.125, and the corresponding annealing temperatures are denoted by
Ta in
Figure 6. The selected values of
Ta are above
Tx and
Txl.
Thermal parameters associated with the thermal stability of different phases and the interatomic bonding, such as
Tx and
Tm, increase somewhat with the Ni content in
Figure 6. Thus, as in the Cantor-type alloys shown in
Figure 5, the thermal stability of these alloys in the HEA concentration range is inferior to that of the corresponding CAs. Further, as in crystalline (CrMnFeCo)
1−xNi
x alloys (
Figure 5) and other quinary TE-TL alloys [
25,
52], the values of
Tm calculated by using the rule of mixtures are at variance with those in
Figure 6. The rule of mixtures predicts a linear decrease in
Tm from 2041 for
x = 0 to 1883 K for
x = 0.5, whereas the experimental values increase from 1121 to 1179 K over the same concentration range. The observed strong deviation of experimental values of
Tm from those calculated by using the rule of mixtures is probably associated with a strong bonding tendency between alloying elements (inset in
Figure 2) and with the local atomic arrangements around Ti and Zr atoms which are different from those in the stable phases of the corresponding pure metals [
23,
24,
25,
52,
66]. By using the experimental values of
Tm, we can compare the contributions to the free energy from ∆
Hmix (
Figure 2) and ∆
Sconf Tm. As is common in TE-TL alloys [
23,
25,
52,
53,
54,
66], ∆
Hmix outweighs ∆
Sconf Tm due to the strong interatomic bonding in all our alloys containing Ni (
x ≥ 0.125). Since our as-cast alloy TiZrNbCu, in which ∆
Sconf Tm (12.84 kJ/mole) considerably outweighs ∆
Hmix (6.6 kJ/mole,
Figure 2), ∆
Sconf Tm/∆
Hmix = 1.95, was multiphase (IM) [
23], it seems that in our alloys, configurational entropy has limited influence on the formation of either an SS or an amorphous phase.
The ratio
Ω = ∆
Sconf Tm/∆
Hmix, where
Tm is calculated by using the rule of mixtures, is a commonly accepted criterion for the phase formation of HEAs [
12,
79]. In particular, single-phase SSs are expected for
Ω ≥ 1.11, whereas a-HEAs are situated below that value in the
Ω vs.
δ plot. Since the values of
Tm calculated by using the rule of mixtures are much larger than the experimental ones, the corresponding values of Ω place all our alloys above the region occupied by amorphous alloys in the
Ω vs.
δ plot [
79]. (As already noted in
Section 3.1 and shown in
Figure 4, our alloys are correctly placed in the IM and a-HEA regions of the ∆
Hmix vs.
δ plot [
12].) This indicates that some erroneous predictions of the phase of HEAs obtained by using the Ω criterion in both a- and c-HEAs (e.g., [
80]) may arise from the use of the calculated instead of the observed value of
Tm in the definition of this criterion [
79]. This again emphasizes the importance of measurements of the thermal parameters of HEAs and other CCAs.
The increase in thermal parameters with
x in
Figure 6 is the usual behavior of binary and ternary TE-TL MGs [
73,
81,
82,
83,
84,
85], which was recently also observed in quinary TE-TL MGs [
24,
25,
52]. Such behaviors are usually accompanied by a simultaneous enhancement of the mechanical properties and the Debye temperatures with increasing
TL content, all of which support an increase in the strength of interatomic bonding [
24,
52,
66,
81,
82,
83,
84]. However, the variations of thermal parameters with
x in our alloys (
Figure 6) are somewhat different from those in binary [
66] and quinary [
25] TE-Cu alloys. In TE-Cu MGs, quasi-linear variations of all thermodynamic properties with the Cu content indicate an ideal solution behavior, and thus a smooth transition from HEAs to Cu-rich conventional alloys in (TiZrNbNi)
1−xCu
x MGs [
25]. In our alloys,
Tx,
Tm and
Tg (except for the value at
x = 0.25) increase linearly with
x for
x ≤ 0.43 and then decrease a little at
x = 0.5 (
Figure 6). This change in the variations of thermal parameters at
x = 0.43 coincides with that observed in all studied properties of (TiZrNbCu)
1−xNi
x MGs, including the atomic short-range order (SRO), magnetic and mechanical properties [
24], electronic transport properties and ES [
26]. Thus, in these alloys, the transition from HEAs to Ni-rich conventional alloys is accompanied by a change in all intrinsic properties. However, since in (TiZrNbCu)
1−xCo
x MGs [
52], a change in properties seems to occur around
x = 0.25, thus deep within the HEA concentration range, the change in properties of these alloy systems with the composition is not caused by the transition from HEAs to CAs; instead, it merely reflects the evolution of their ES with
x.
Next, we use the results for the thermal parameters from
Figure 6 in order to discuss a well-known discrepancy between the relatively good thermal stability of a-HEAs and their modest GFA (e.g., [
23,
63]). It has been proposed [
63] that a higher
Tx of the equiatomic TiZrCuNiBe a-HEA compared to that of a benchmark glass Vitreloy 1 (Zr
41.2Ti
13.
8Cu
12.5Ni
19Be
22.5) results from sluggish crystallization kinetics in the a-HEA. However, as seen in
Figure 6, the higher
TL (Cu + Ni) content in the a-HEA probably also contributes to its better thermal stability. Further, the vicinity of the composition of Vitreloy 1 to that of a stable intermetallic compound composed of these elements (such as Zr
2(Cu,Ni) which precipitates first on annealing of Vitreloy 1) probably also compromises its thermal stability in respect to the HEA with a composition far from that of any stable IM composed of the same elements [
23]. As noted recently [
52], the discrepancy between good thermal stability and a modest GFA of a-HEAs, and more generally quinary TE-TL MGs, can be influenced not only by the proposed different diffusion mechanisms in the solid and liquid a-HEAs [
63] but also by complex crystallization patterns in these MGs. As seen in
Figure 6, the composition dependence of the temperatures of the first (
Tx) and the last (
Txl) crystallization event (which affect the stability of the glass and melt, respectively) can be very different. In particular, if in these alloys, rather stable crystalline compounds form during the last crystallization event around
Txl, their GFA may be compromised since it could be difficult to avoid crystallization during insufficiently rapid cooling of the melt. (Alternatively, a small amount of some very stable phase may considerably increase the liquidus temperature, thus affecting the magnitudes of GFA criteria containing
Tl, but without compromising the actual GFA.) Since, the thermal stability of the same MG is associated with the separate first crystallization event (occurring around
Tx), it may remain high, regardless of its low GFA. This complex crystallization behavior probably reduces the reliability of criteria for predicting GFA based on thermal parameters in multicomponent TE-TL MGs [
25,
52,
63,
86,
87]. Such problems almost do not exist in binary and some ternary TE-TL MGs, since their DSC traces usually show a single exothermic maximum; thus,
Tx controls both their thermal stability and GFA [
66,
73,
81,
82,
83,
84,
85]. Accordingly, their GFA is usually well described with criteria based on thermal parameters [
32,
33,
66,
76,
77,
81,
82,
83,
84,
85].
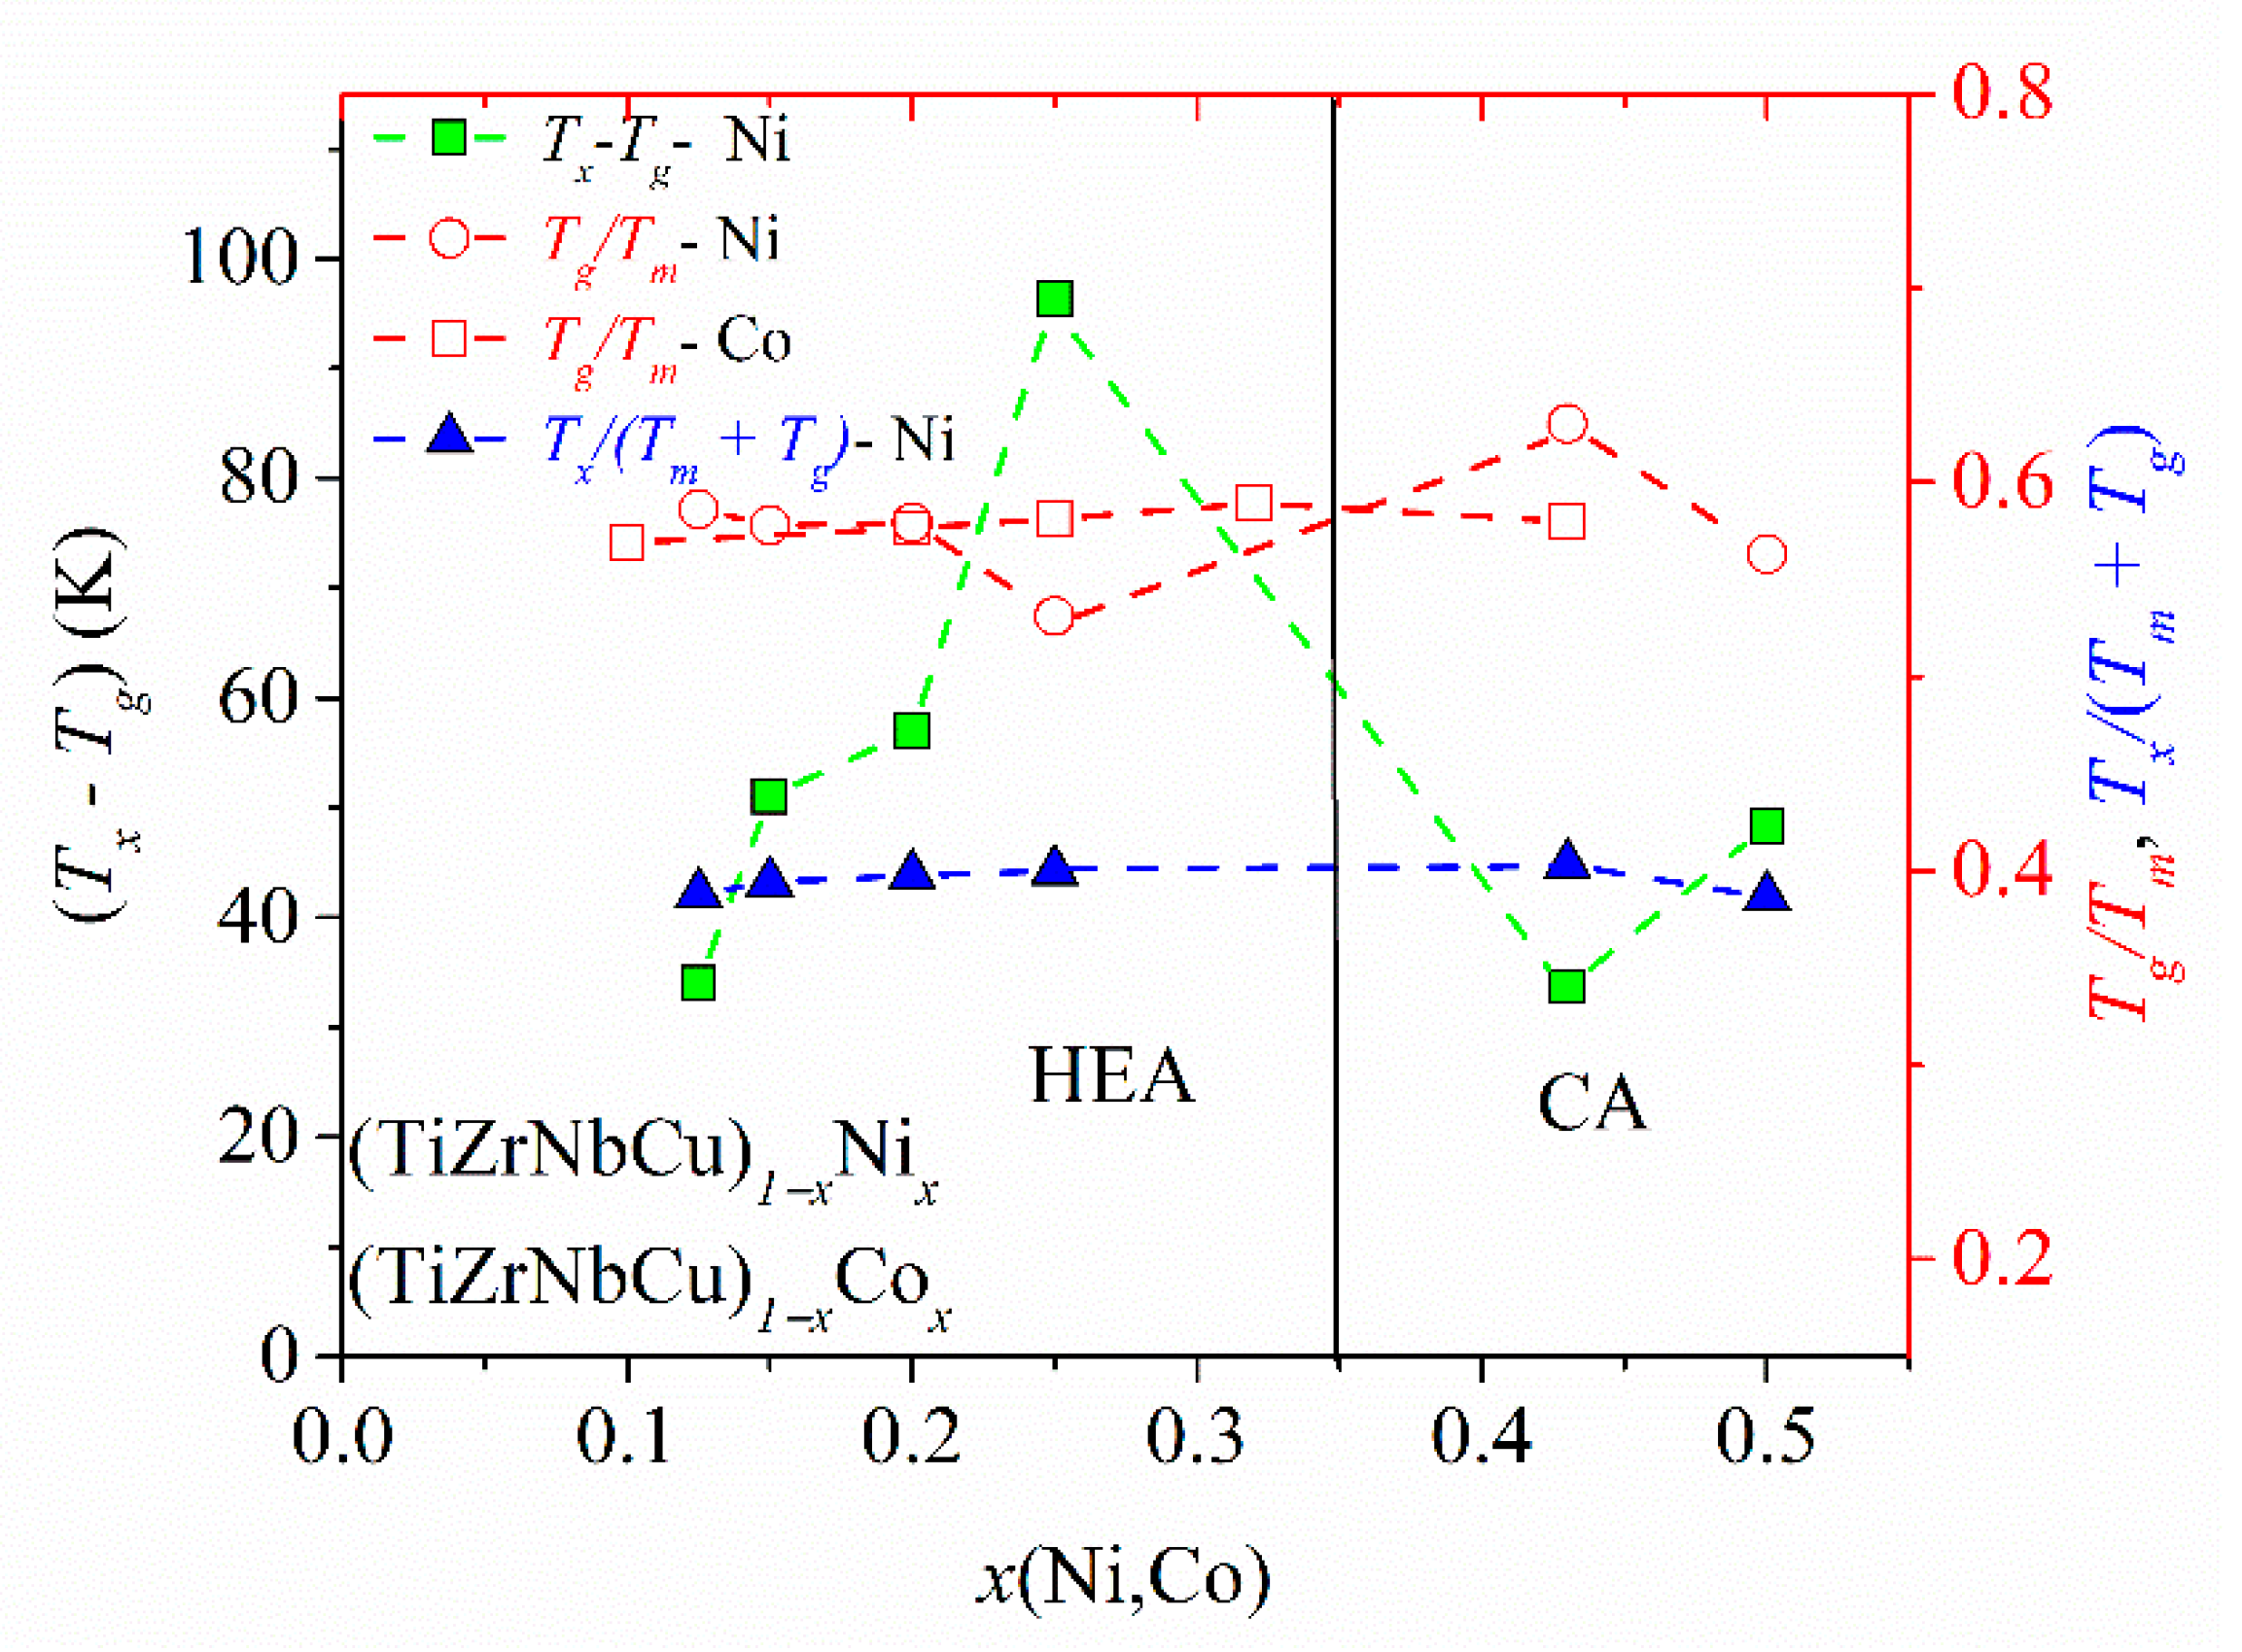
The variation of the three most common criteria for GFA: the reduced glass transition temperature,
Trg =
Tg/
Tl, [
88], the
γ criterion for GFA,
γ =
Tx/(
Tg +
Tl) [
87], and the width of the supercooled liquid range, ∆
Tx =
Tx −
Tg [
59], with the composition in (TiZrNbNi)
1−xCu
x and (TiZrNbCu)
1−xCo
x alloys was previously reported [
25,
52]. In both systems, an enhancement of
Tl at the equiatomic composition,
x = 0.2, led to a local minimum in the values of
Trg and
γ, which would imply a low GFA since, in all three criteria, large values correspond to a high GFA. However, an experimental study of the GFA in (TiZrNbNi)
1−xCu
x alloys with
x ≤ 0.35 [
25] showed the largest GFA around
x = 0.2, in contrast to the predictions of
Trg and
γ. As seen in
Figure 6,
Tl of the TiZrNbCuNi alloy is also somewhat larger than that at neighboring compositions, which would lead to low values of
Trg and
γ, and thus the erroneous prediction of a low GFA of the same alloy which showed the best GFA in the (TiZrNbNi)
1−xCu
x system [
25]. Since the values of
Tm did not show such anomalies at
x = 0.2 [
25,
52], in
Figure 7, we inserted
Tm instead of
Tl into the denominators of the expressions for
Trg and
γ. This change removed the minima of
Trg in both (TiZrNbCu)
1−xNi
x and (TiZrNbCu)
1−xCo
x alloys (
Figure 7).
Figure 7 also shows the variation of ∆
Tx with the composition in (TiZrNbCu)
1−xNi
x alloys, exhibiting a large maximum around
x = 0.25. A large ∆
Tx is important for the application of MGs [
89] and has been found to correlate quite well with the GFA in several a-HEAs (e.g., [
25,
63]) including that in
Figure 7. As already noted [
25,
52], the rather low values of
Trg and
γ in the studied alloys are consistent with their modest GFA. Indeed, in contrast to the similar TiZrHfCuNi alloy [
1], none of these alloys formed a bulk metallic glass [
25]. This could be associated with somewhat weaker interatomic interactions and a smaller mismatch of the atomic size in alloys containing Nb than these in alloys containing Hf [
59].
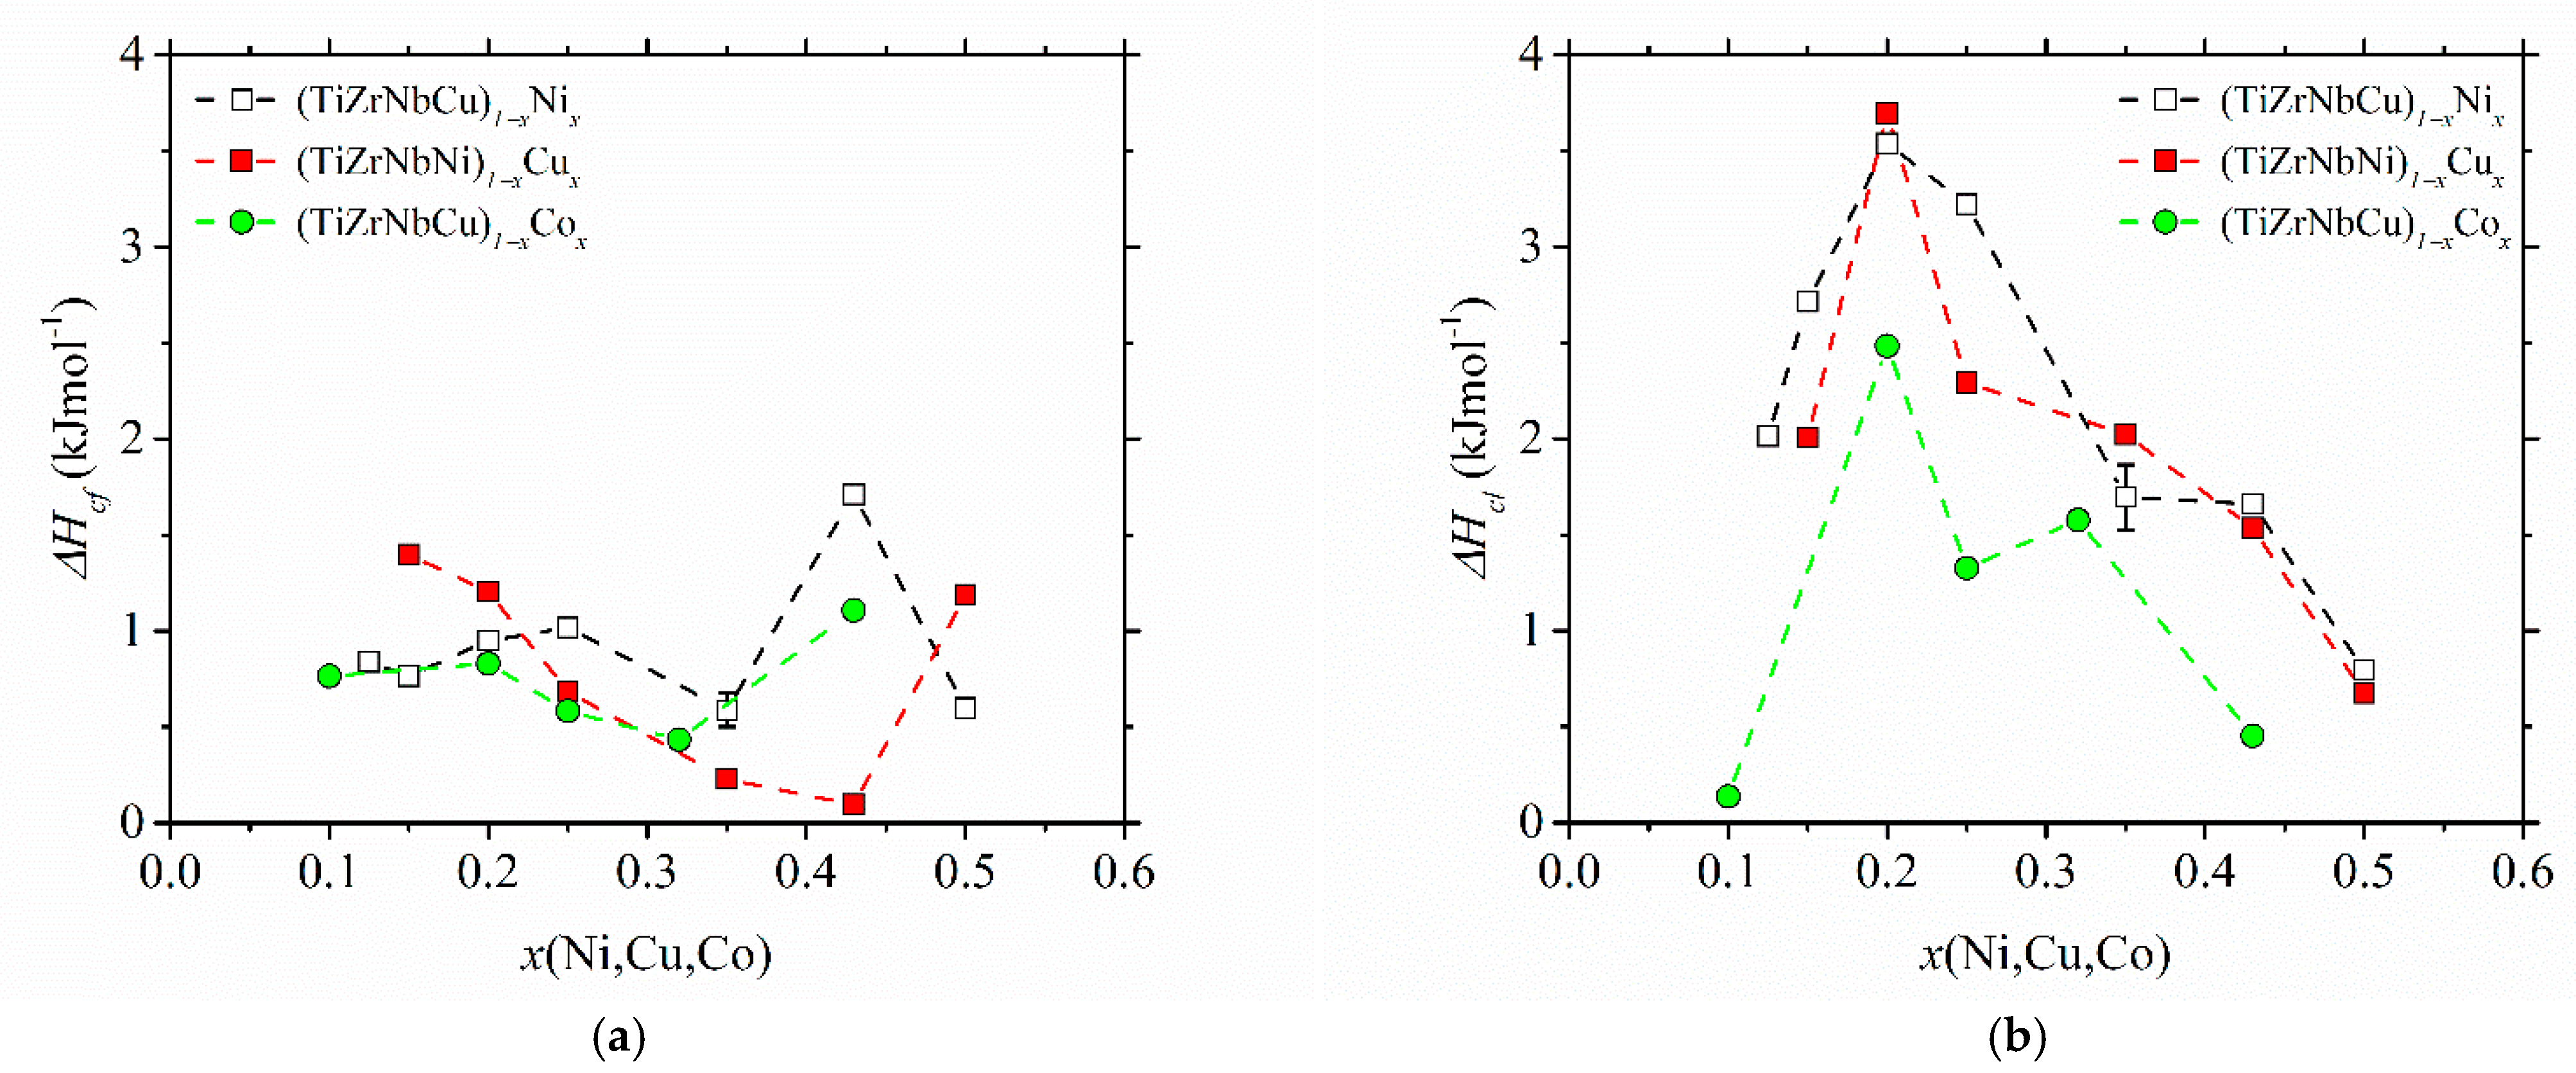
The variations of the enthalpy change in crystallization, ∆
Hc, with the composition in the studied alloys are shown in
Figure 8. ∆
Hc values were determined from the crystallization DSC peak areas. Due to some partially overlapping peaks [
25,
37,
52], their values are not that accurate. In cases of overlapping peaks (e.g., the first peak in (TiZrNbCu)
0.57Co
0.43 in [
52]), we arbitrarily assigned half of the total ∆
Hc to each of the two crystallization events. However, the reproducibility of measurements was quite good, as seen from the error bars based on measurements of two different samples for alloy (TiZrNbCu)
0.65Ni
0.35. The measurements of ∆
Hc, which shows the change in free energy between the competing phases [
73], are apparently important both for understanding thermal stability and the GFA [
32,
33] in glass-forming alloys. It is therefore surprising that, to our knowledge, no previous results for ∆
Hc of a-HEAs exist. Comparing the results for the change in enthalpy associated with the first crystallization event (∆
Hcf in
Figure 8a) with those for the last (final) crystallization event (∆
Hcl in
Figure 8b), we note that both the compositional variations and magnitudes of the two quantities are quite different. The magnitudes of ∆
Hcf are fairly small, and their compositional variations do not show any obvious tendency. Their increase at
x = 0.43 in alloys with variable Ni and Co contents may be affected by the overlap of the two peaks. The values of ∆
Hcl are considerably larger, and all show a pronounced maximum centered around an equiatomic composition, both indicating the formation of a relatively stable phase during the last crystallization around this composition in all studied alloys. Thus, these results provide some support to the former discussion of the evolution of thermal stability, compositional variation of thermal parameters and GFA of the studied alloys. However, for a more detailed insight into these issues, XRD analysis of the phases associated with each crystallization event is required.
3.3. Atomic Structure
Comprehensive studies of the atomic arrangements and their evolution with the composition in Cantor-type alloys possessing a single FCC phase [
45,
47] and quinary MGs composed of Ti, Zr, Nb, Cu and Ni or Co have already been reported [
24,
25,
37,
52], or are in preparation for submission [
62]. For completeness, we will briefly describe the main features of these results and then compare the results for two types of alloys. Some new results will also be shown.
The lattice parameters,
aFCC, and corresponding average atomic volumes,
VFCC =
aFCC3/4, of Cantor-type alloys with a variable Mn, Fe or Co content vary linearly with the composition within the range of stability of a single FCC phase in homogenized samples [
45,
47]. Hence, the same variation extends from the HEA to the Mn-, Fe- or Co-rich concentration range. (Although this concentration range extends to
x = 0.5 for Mn, Fe and Co, the results for two-phase alloys indicate that a linear variation of
VFCC may extend up to
x = 0.7 and 0.9 for Fe and Co, respectively [
47].) The slopes of the linear variations of
VFCCs and ∆
VFCC/∆
x are negative for principal alloying elements Fe and Co, zero for Cr (
x ≤ 0.3) and large and positive for Mn [
47]. These slopes probably reflect both the atomic size mismatch and the strength of the interatomic bonding (inset in
Figure 3) in each alloy system. Accordingly, these variations of
VFCCs strongly affect their mechanical properties [
47,
48]. (CrMnFeCo)
1−xNi
x alloys are exceptional among these alloys in that their
aFCC hardly changes until
x ≤ 0.5 and then decreases linearly with x according to Vegard´s law to that of pure Ni [
45]. This change in the variation of
aFCC in the Ni-rich concentration region seems to be associated with both the compositional variation of the alloys’ thermal stability (
Figure 5) and that of their mechanical properties [
45,
47,
48].
Analysis of the atomic arrangements in amorphous solids is more involved, and the results of this type of analysis are less detailed than those for crystalline solids [
90,
91]. In principle, analysis of the XRD pattern of amorphous alloys can provide the average distances between the nearest neighbor atoms [
92],
d, but these are not that accurate and may also not be reliable [
93]. High-energy XRD (HEXRD) can provide the radial distribution function,
R(
r), and pair distribution functions, PDF, from which more accurate and reliable interatomic distances and numbers of atoms in neighboring shells around an atom (coordination numbers,
N) can be calculated. However, neither simple XRD nor HEXRD can provide direct insight into the local atomic arrangements in an amorphous alloy.
As seen in
Figure 9, an insight into a probable local atomic arrangement in the glassy alloy can be obtained from the product(s) of the primary crystallization in that alloy. The XRD patterns in this figure show how the atomic structure of (TiZrNbCu)
0.875Ni
0.125 evolves upon annealing at different temperatures above
Tx marked in
Figure 6. We note that the primary crystallization produces a dominant, fine-grained BCC crystal structure with a lattice parameter close to that of β-titanium (vertical dashed lines), around 0.326 nm [
23]. This BCC phase is, however, metastable since the XRD pattern obtained after crystallization at a temperature surpassing the last crystallization event (
Figure 6) bears no resemblance to that for the primary crystallization,
Figure 9.
In these alloys, the good agreement between the calculated mass density obtained by assuming a BCC atomic structure and the measured one [
23] also provides strong support for a BCC-like local atomic structure. As discussed in some detail elsewhere [
52], there are several reasons which support BCC-like local atomic arrangements in the studied glassy alloys composed of Ti, Zr, Nb, Cu and Ni or Co and probably all other a-HEAs composed of TE and TL atoms (e.g., [
51,
54,
56]). We note that the large difference between the sizes of TE and TL atoms [
72] and the corresponding atomic size mismatch,
δ, (
Figure 2) also make the formation of a BCC-like local atomic arrangement in TE-TL alloys more likely than the FCC one [
12,
53,
54,
56]. Indeed, in all ∆
Hmix vs.
δ diagrams, the single-phase BCC alloys are situated at larger values of
δ than those with an FCC crystalline structure [
10,
11,
12,
13]. The strong bonding tendency between the TE and TL atoms may also favor the formation of a BCC-like atomic arrangement since the ordering of different atoms seems easier to achieve on a BCC than on an FCC atomic structure [
51,
54].
Accordingly, we used the values of
d, obtained both from the first maximum of the XRD pattern [
91] and from
R(
r) [
89,
90], to calculate the average BCC-like lattice parameters,
aBCC = 2
d/3
0.5, and the corresponding average atomic volume,
VBCC =
aBCC3/2, of all studied alloys [
24,
25,
52,
61]. From these average atomic volumes, we calculated the mass densities and the average local atomic packing fractions (APFs, [
24,
25,
52]),
ηa, which depend on the local atomic arrangements, whereas from
R(
r), we calculated the corresponding coordination number,
N. Two types of compositional variations of these parameters were observed. In (TiZrNbNi)
1−xCu
x MGs, showing an ideal solution behavior [
25], both
aBCC and
VBCC decrease linearly with
x, whereas the average APF (around 0.75) and
N (around 13) practically do not change with
x (implying no changes in the local atomic arrangements) [
25]. As illustrated in
Figure 10, qualitatively, the same behavior of these parameters is observed in FCC (CrMnCoNi)
1−xFe
x alloys [
47]:
aFCC is very close to that calculated by using Vegard´s law and decreases linearly with
x, whereas the APF is constant at around 0.74 (which is consistent with the close-packed FCC structure composed of atoms of a similar size).
The other type of behavior of parameters associated with the atomic structures observed in (TiZrNbCu)
1−xNi
x and (TiZrNbCu)
1−xCo
x MGs [
24,
52] can be broadly compared to that in (CrMnFeCo)
1−xNi
x FCC alloys [
45]. In these alloy systems,
d and
VBCC slightly changed their variations with
x around some concentrations specific to a given alloy system. These concentrations were around 0.43 and 0.25 in alloys with a variable Ni or Co content, respectively. Around these concentrations, APFs and
N exhibited a rapid change [
24,
52,
62]. This is illustrated in
Figure 10, which shows the variations of
aBCC and the APF with the concentration in (TiZrNbCu)
1−xCo
x MGs (including the results for the new alloy with
x = 0.5). A very large decrease in
aBCC with
x compared to that of an FCC structure is due to a large atomic size mismatch in TE-TL MGs. A sudden increase in the APF around
x = 0.25 is accompanied with a similar increase in
N [
61] at the same concentration. A similar change in the APF and
N was observed in (TiZrNbCu)
1−xNi
x MGs, but around
x = 0.43 [
24,
62]. Thus, in the studied TE-TL MGs, the crossover concentrations increase going from Co to Ni. This is different from the behavior observed in Cantor-type alloys [
47], where alloys with a variable Co content did not seem to show any change in parameters associated with the atomic structure throughout the explored concentration range,
x ≤ 0.7. As already noted, a change in variations of parameters associated with the atomic structure is accompanied by a change in the intrinsic properties of the same alloys, both in Cantor-type FCC alloys [
45,
47,
48] and quinary TE-TL MGs [
24,
26,
52]. In the next section, a brief discussion of differences in the ES of two types of alloys is presented.
3.4. Electronic Structure and Physical Properties
As already pointed out in the Introduction, the ES determines all intrinsic properties of materials [
44]. Thus, detailed knowledge of the ES is necessary both for understanding the properties of materials and for the design of new materials with desired characteristics. It has been known for some time that the ES controls the atomic structure and properties in dilute Al-based alloys with 3d transition metals [
94]. However, a study of simple binary TE-TL MGs [
66] showed that the relationship between the ES and some properties such as the electronic transport properties is not necessarily simple. It is a notorious fact that electronic transport properties are quite simple to measure but fairly difficult to interpret.
The relationship between the ES and intrinsic properties that are barely affected by the exact preparation and/or post-processing conditions is particularly simple in TE-TL MGs [
66,
67,
74,
75,
81,
82,
83,
84,
95]. Early ultraviolet photoemission spectroscopy (UPS) and X-ray photoemission spectroscopy (XPS) studies of these alloys [
96,
97,
98,
99] revealed a split valence band (VB) structure with the full or nearly full d-sub-bands of TL elements positioned well below the Fermi level (
EF). With the sub-band of TL remaining well below
EF, there is an approximately linear variation of most intrinsic properties of these MGs with the TL content over a broad concentration range [
66,
67,
74,
75,
81,
82,
83,
84,
95,
100]. Further, it was shown that the split band shape of the VB of TE-TL alloys also applies to crystalline alloys [
99] and is rather insensitive to the number of alloying components [
97]. In these alloys, the d-band shift from the Fermi level of 3d transition metals increases with the increasing atomic number of 3d elements, i.e., the binding energy
EB increases as we go from Mn to Cu [
97]. Additionally, a decrease in
EB is observed for a given TL when its relative content in the alloy is increased [
96]. The magnitude of the decrease in
EB depends on TL and increases as we go from Cu to Mn [
96].
As seen in
Figure 11 and
Figure 12, qualitatively, the same behavior of UPS spectra and
EB was also recently observed in quinary TE-TL MGs studied by us [
22,
24,
25,
26].
Figure 11 shows the UPS spectra of the (TiZrNbCu)
0.875Ni
0.125 alloy in its (i) as-cast state, amorphous state (denoted by “sputtered only” as a reference to the surface cleaning performed by accelerated Ar ions) and (ii) after crystallization (denoted “annealed”), corresponding to conditions associated with the uppermost XRD pattern of
Figure 9. Having in mind the effect of the photon energy-dependent photoemission cross-section [
98], these spectra reflect the variation of the electronic density of states (DOS) within the VB. Further, due to the generally low contribution of sp-bands to the photoemission intensity, these spectra largely reflect the DOS of d electrons [
24]. The spectra in
Figure 11 confirm that crystallization has little influence on the ES of TE-TL MGs, as the variation of the DOS within the VB remains virtually unchanged upon crystallization, and a split band shape of the DOS is retained despite the chemical complexity of the studied alloy. We note three distinct features in both spectra in
Figure 11: the maximum around 3.5 eV below the
EF, which we assigned to the 3d states of Cu [
25,
96,
97], and two shallow humps centered around 1.8 eV and close to the
EF, probably related to the d states of Ni and TEs (Ti, Zr and, to a somewhat lesser extent, Nb), respectively [
24]. The poorly resolved 3d band maximum of Ni in our alloy is probably due to the nearby maximum of the Nb 4d band [
24] as well as the generally very large photoemission cross-sections of TEs at low photon energies [
98]. To obtain more accurate information on the position and contribution of the 3d bands of Ni and other TL elements to the DOS of this and other studied alloy systems, XPS measurements using a higher photon energy are required. It is remarkable and probably specific to TE-TL alloys and their GFA [
32,
33] that a change from an amorphous to a complex crystalline structure (
Figure 9) has so little influence on the shape of the UPS spectrum.
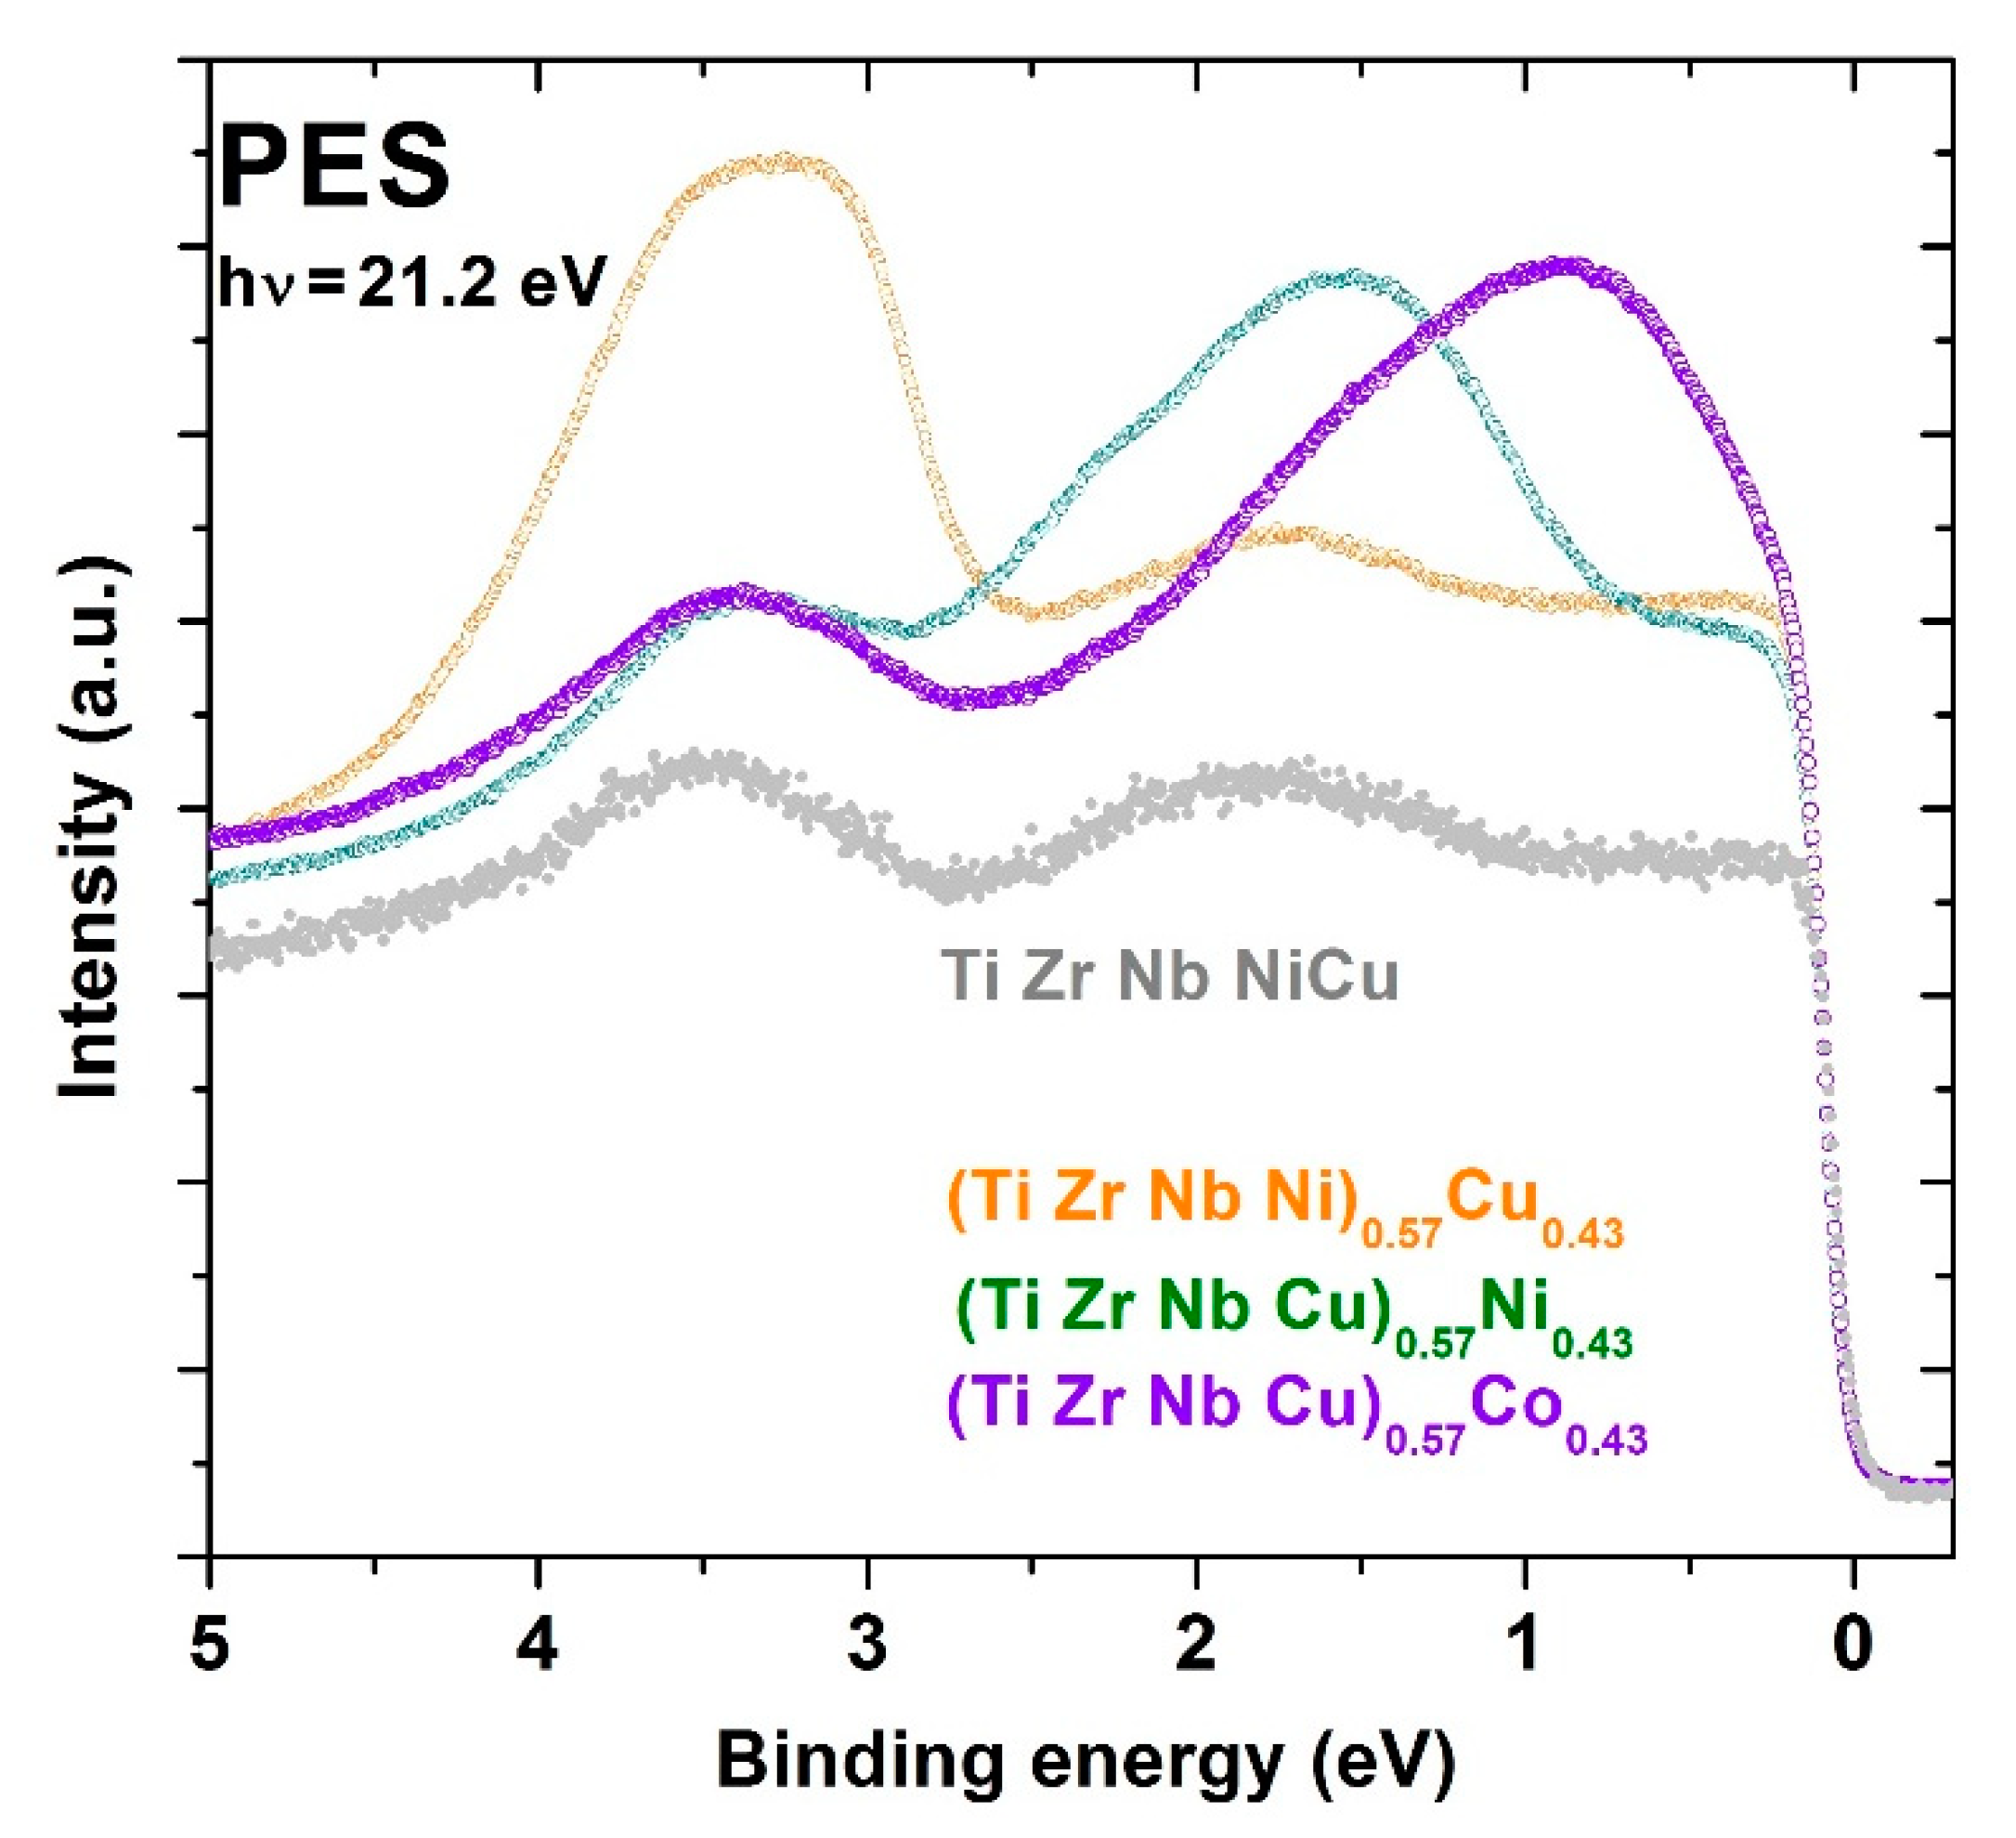
Figure 12 shows UPS spectra for three quinary MGs with the same fractions of Co, Ni or Cu,
x = 0.43, and thus with a concentration within the CA concentration range. For comparison, the UPS spectrum for the equiatomic a-HEA TiZrNbCuNi (
x = 0.2 [
24,
25]) is also shown in this figure. Hence, spectra in
Figure 12 show the evolution of the DOS of d electrons from the TL components in these alloys when crossing from the HEA to the CA concentration range. Notice that the peak corresponding to the Cu d-band shifts only slightly towards
EF on increasing
x, whereas that corresponding to the Ni d-band experiences a considerable shift from about 1.85 to 1.6 eV. However, with an increasing fraction of Co from
x = 0.2 [
52] to 0.43, the peak corresponding to the Co 3d band strongly shifts from 1.3 to 0.8 eV. Thus, despite some uncertainty in the actual position and shape of the peaks associated with the d states of Co and Ni caused by the low energy of the employed photons [
97], these spectra clearly show that in MGs with a sufficiently high Co or Ni content, the band crossing, as observed in Zr-Co and Zr-Ni MGs [
74,
75], takes place at an elevated
x > 0.43. This band crossing, involving a change in the DOS at
EF,
N(
EF), dominated, in one case, by d electrons of TE elements and, in another case, by those of TL, results in a change in all intrinsic properties of the given alloys.
Figure 12 shows that this crossover concentration [
74],
xc, is probably lower for TL = Co [
52] than for Ni [
24,
26], and that in alloys with a variable Cu content [
25], showing an ideal solution behavior, this crossover may occur at pure Cu,
xc = 1, only. More quantitative insight into the approach to the band crossing can be obtained from the variation of
N(
EF) with the composition, calculated from the LTSH (e.g., [
24,
26]).
As previously explained [
22,
23,
24], a combination of the results from PES and LTSH with those from ab initio (
ai) calculations (which, in addition to the total DOS, also provide information on the contribution of each alloying element to the DOS, pDOS) is required to fully comprehend the ES of an alloy. However, in alloys exhibiting a split band DOS, the experimental results from PES and LTSH may be sufficient to reach that goal, provided that the samples are probed by PES with different photon energies [
98]. The use of different photon energies is essential for reliable separation of the contributions of the states of the TL and TE components to the total DOS. This is particularly important when the separation in the energy between these contributions becomes relatively small (see
Figure 12). In the simplest case, such as that of (TiZrNbNi)
1−xCu
x MGs, in which the d states of Cu are well below
EF and their position hardly changes with
x (
Figure 10 and
Figure 12 in Reference [
25]), the LTSH measurements are sufficient to determine the evolution of the ES and the intrinsic properties with the composition. New results [
101] for the variation of the Sommerfeld coefficient of the linear term of LTSH [
24,
26],
γ = π
2 kB2 N(
EF)/3, where
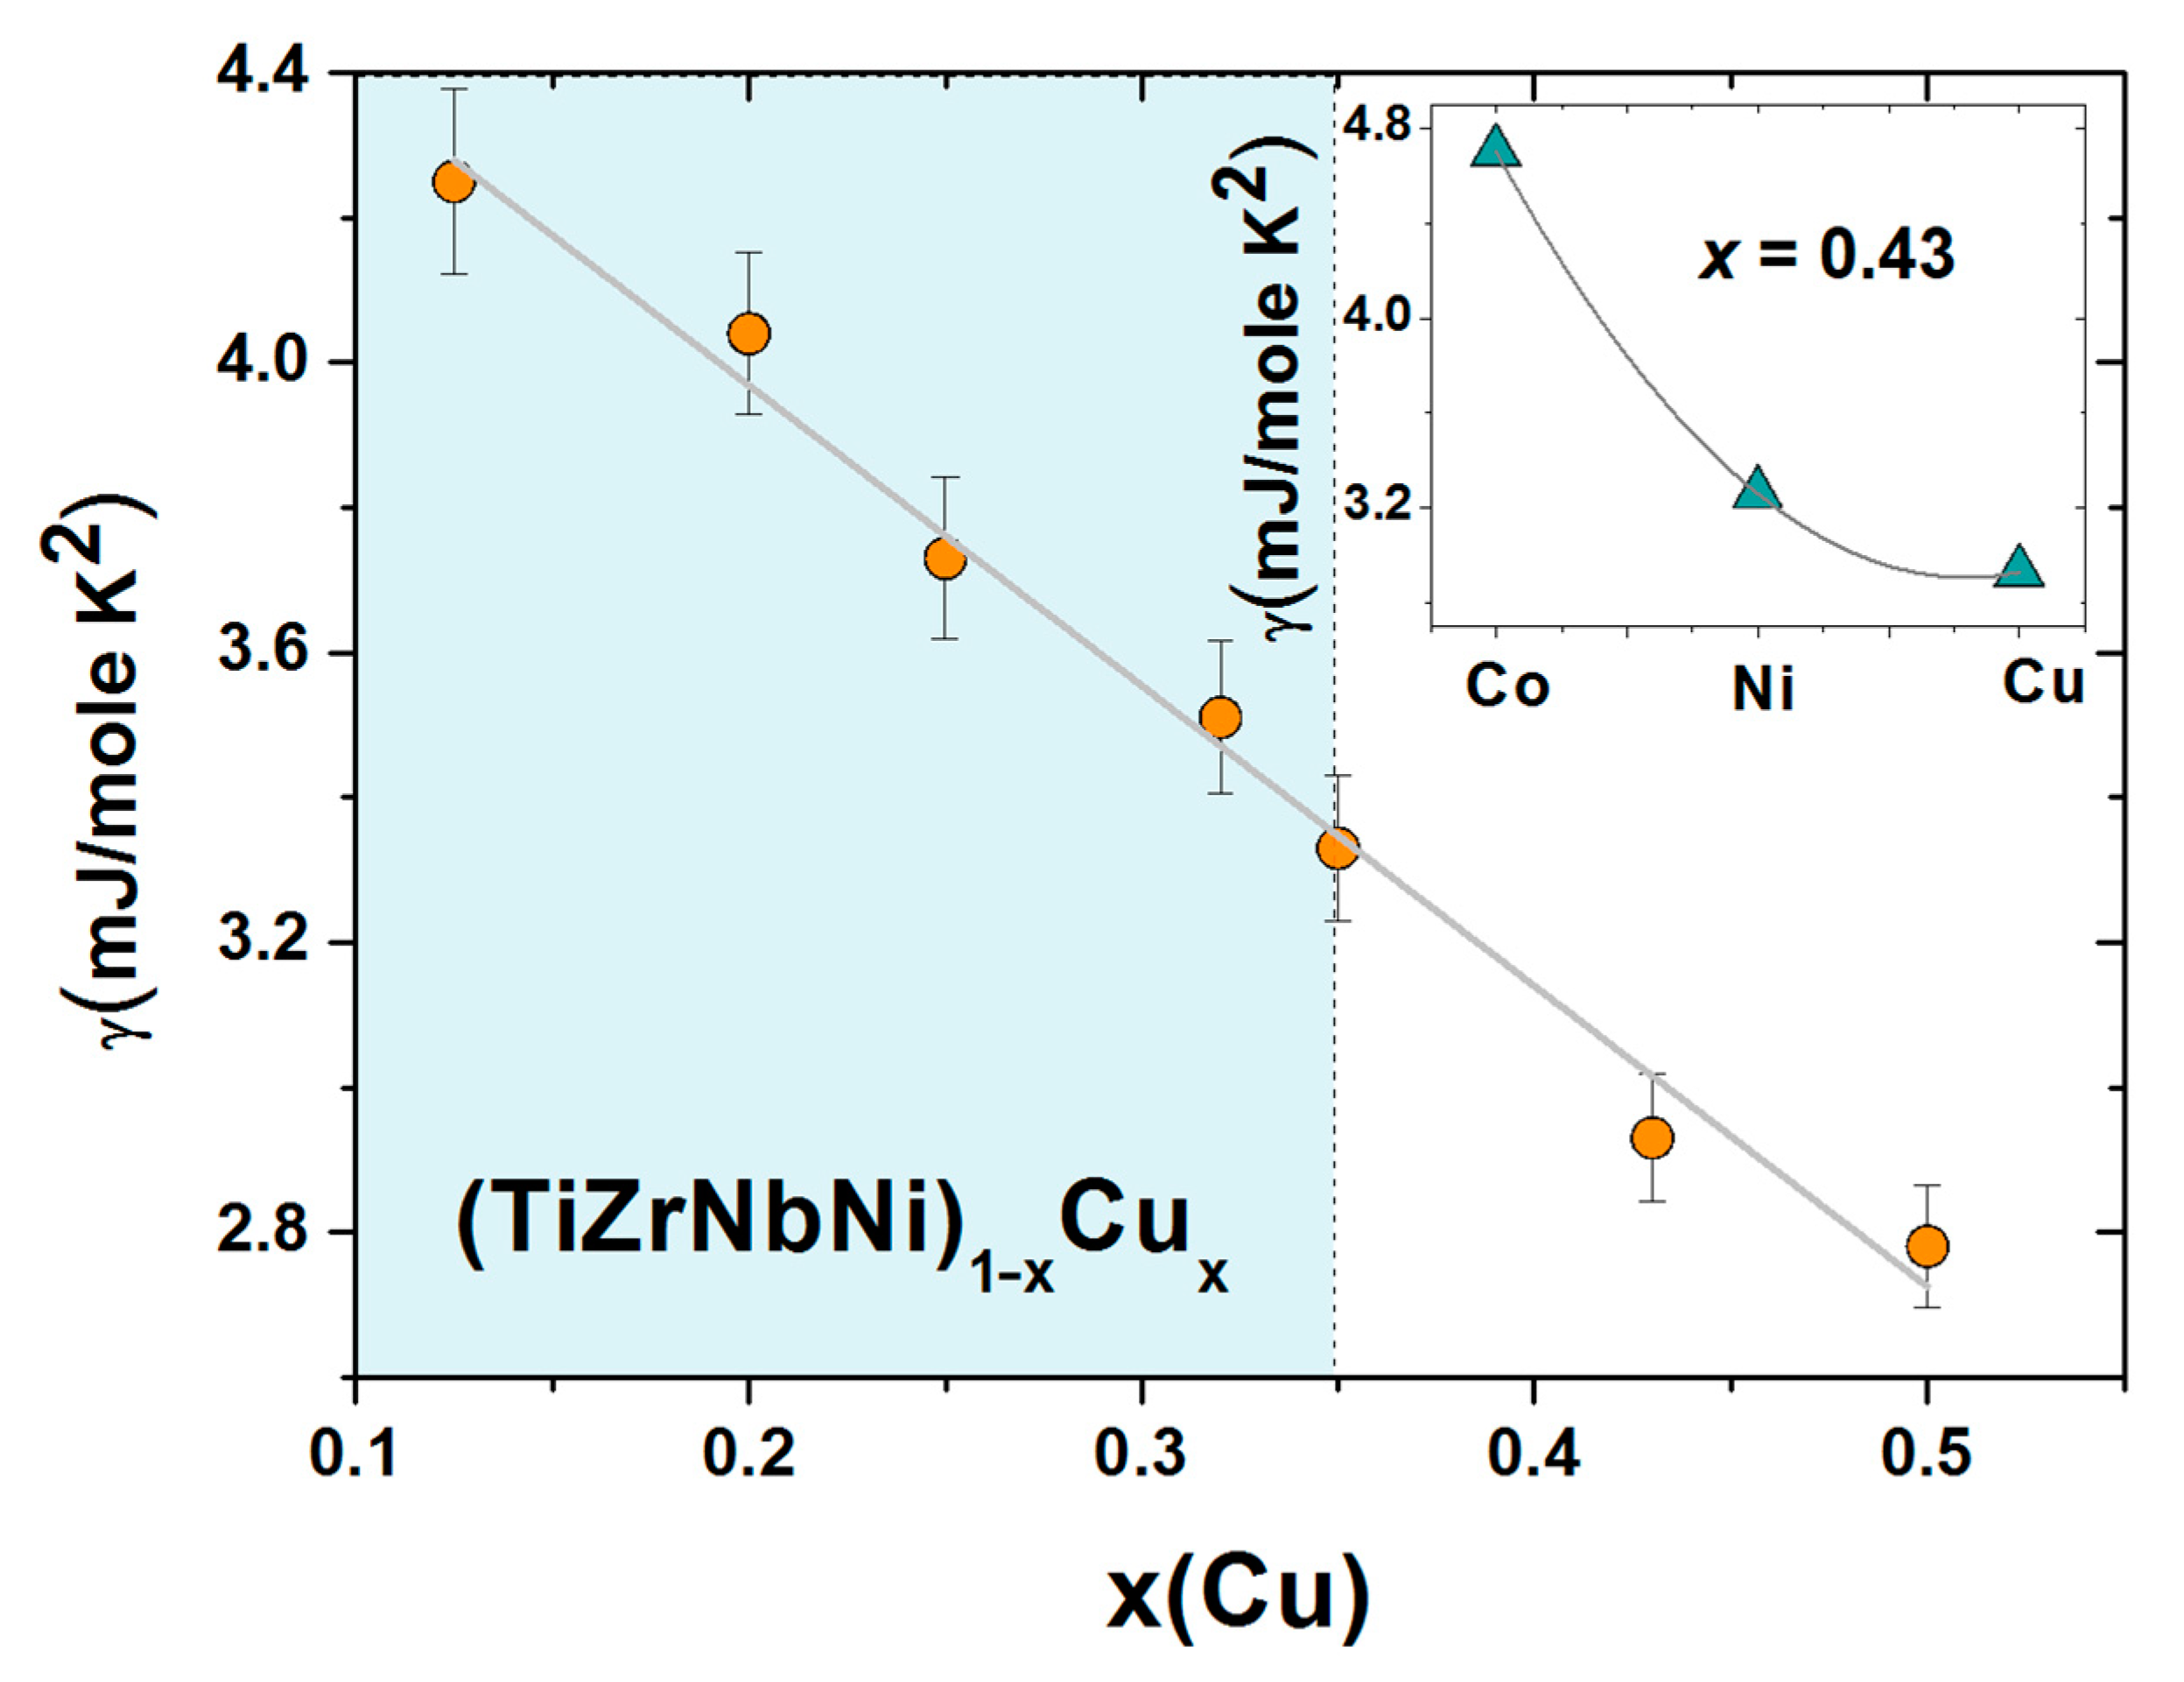
kB is the Boltzmann constant, with the composition of these alloys are shown in
Figure 13. This figure shows that
γ decreases linearly with increasing
x over a broad composition range, covering both the HEA (light blue color) and CA concentrations, and extrapolates close to that of pure Cu,
γ = 0.69 mJ/mole K
2 [
102], for
x = 1. This variation is probably the best evidence for the ideal solution behavior which marks all properties of this alloy system from the parameters associated with the atomic structure [
25] to the magnetic and mechanical parameters, which will be addressed later in the next section. The ideal solution behavior in these chemically complex MGs is likely, as in binary TE-Cu MGs [
66,
95], caused by the moderate bonding tendency between the TE and Cu atoms (
Figure 2) and the nonmagnetic nature of Cu.
As previously discussed in some detail [
24,
26,
52], the variations of
γ in (TiZrNbCu)
1−xCo
x and (TiZrNbCu)
1−xNi
x MGs, which are chemically very similar, deviate from the ideal solution behavior at elevated values of
x. This is associated with the smaller and concentration-dependent values of
EB in these alloys, which results in the presence of the d states of Co or Ni at
EF at an elevated
x. In the inset of
Figure 13, we illustrate this effect by comparing the values of
γ for the alloys with
x = 0.43 of Co, Ni or Cu. The very strong increase in
γ for Co, in respect to that for Ni, may, in addition to the enhanced presence of d states of Co at
EF, compared to Ni (
Figure 12), also be affected by the onset of electronic correlations, signaling the vicinity of a ferromagnetic percolation threshold around
x = 0.5 of Co [
52]. Since the ES, and often
N(
EF) alone [
44], determines the intrinsic properties of alloys, the variations of
γ, going from Co to Cu, will be reflected in the variations of other properties of these alloys.
The LTSH measurements were also used to deduce the individual contributions of each TE to
N(
EF). To this end, we analyzed the values of
γ for three MGs with an enlarged content of the selected TE at the expense of the other two TEs while keeping the content of TLs the same, e.g., Ti
0.3Zr
0.15Nb
0.15Ni
0.2Cu
0.2. The sample with an enhanced Ti content showed the largest
γ = 4.14 mJ/mole K
2, which is about 2.5% larger than that of the equiatomic alloy (
x = 0.2) in
Figure 13. This increase in
γ may arise from the somewhat narrower VB of Ti as compared to that of Zr and Nb, but since
γ reflects the dressed DOS at
EF, knowledge of the electron–phonon coupling strength [
26] is required to gain a more detailed insight into the nature of the observed enhancement of
γ. The values of
γ for alloys with an enhanced (0.3) Zr or Nb content were nearly the same and around 2.8% lower than that of the equiatomic alloy, possibly due to the somewhat lower Ti content and wider VBs of Zr and Nb than that of Ti. Accordingly, as in binary and ternary TE-TL MGs [
96,
97], the d states of Ti contribute slightly more to
N(
EF) than those of Zr or Nb. The planned UPS and XPS studies of these alloys will probably provide a more detailed insight into the individual contributions of the d states of TEs to the DOS of these MGs.
As seen from the former discussion, the split band structure of the VB in the TE-TL alloys (both crystalline and amorphous,
Figure 11) has important consequences on the compositional variation of their properties. However, this also affects the validity of approximate descriptions of the ES, such as those in terms of the average VEC [
44], in these alloys [
67]. The average VEC quite often provides a reasonable description of the variations of some properties with the composition, such as the superconducting transition temperatures
Tc [
103] and magnetic moments (Slater–Pauling curve, see, e.g., [
104]), in transition metal alloys composed of neighboring elements. However, as noted 40 years ago [
67], this approximation is not good for the properties that depend mainly on
N(
EF) in alloys composed of elements which are far apart in the periodic table, such as TE and TL elements. In these alloys, the contribution(s) of the d states of the TL(s) to
N(
EF) is (are) small, if any, as shown in
Figure 11,
Figure 12 and
Figure 13 and demonstrated in numerous literature reports [
22,
23,
24,
25,
26,
95,
96,
97,
98,
99]. Therefore, using the full values of the VEC of TLs in calculating the average VEC of an alloy is, apparently, wrong and leads to erroneous variations of the studied properties with such an average VEC. In particular, in crystalline (ScZrNb)
1−x(RhPd)
x alloys with a B2 structure [
29], and all TE-TL MGs (e.g., [
22,
23,
24,
25,
26,
67,
81,
105,
106,
107,
108]),
Tcs decreases linearly with increasing average VEC, whereas in disordered films composed of neighboring transition metals from Zr to Tc [
103],
Tcs increases with increasing VEC over the same range of values of the average VEC. This seemingly unusual behavior has been attributed [
29] to the chemical complexity of these quinary alloys, whereas it merely shows that the average VEC does not sufficiently represent
N(
EF) in alloys having a split band structure of the VB. It was recently shown [
22,
26] that in all disordered transition metal alloys, regardless of their atomic structure and number of alloying components (and thus chemical complexity), for a given series of transition metals, the
N(
EF) governs their superconductivity. Note that the impact of chemical complexity is small, at best.
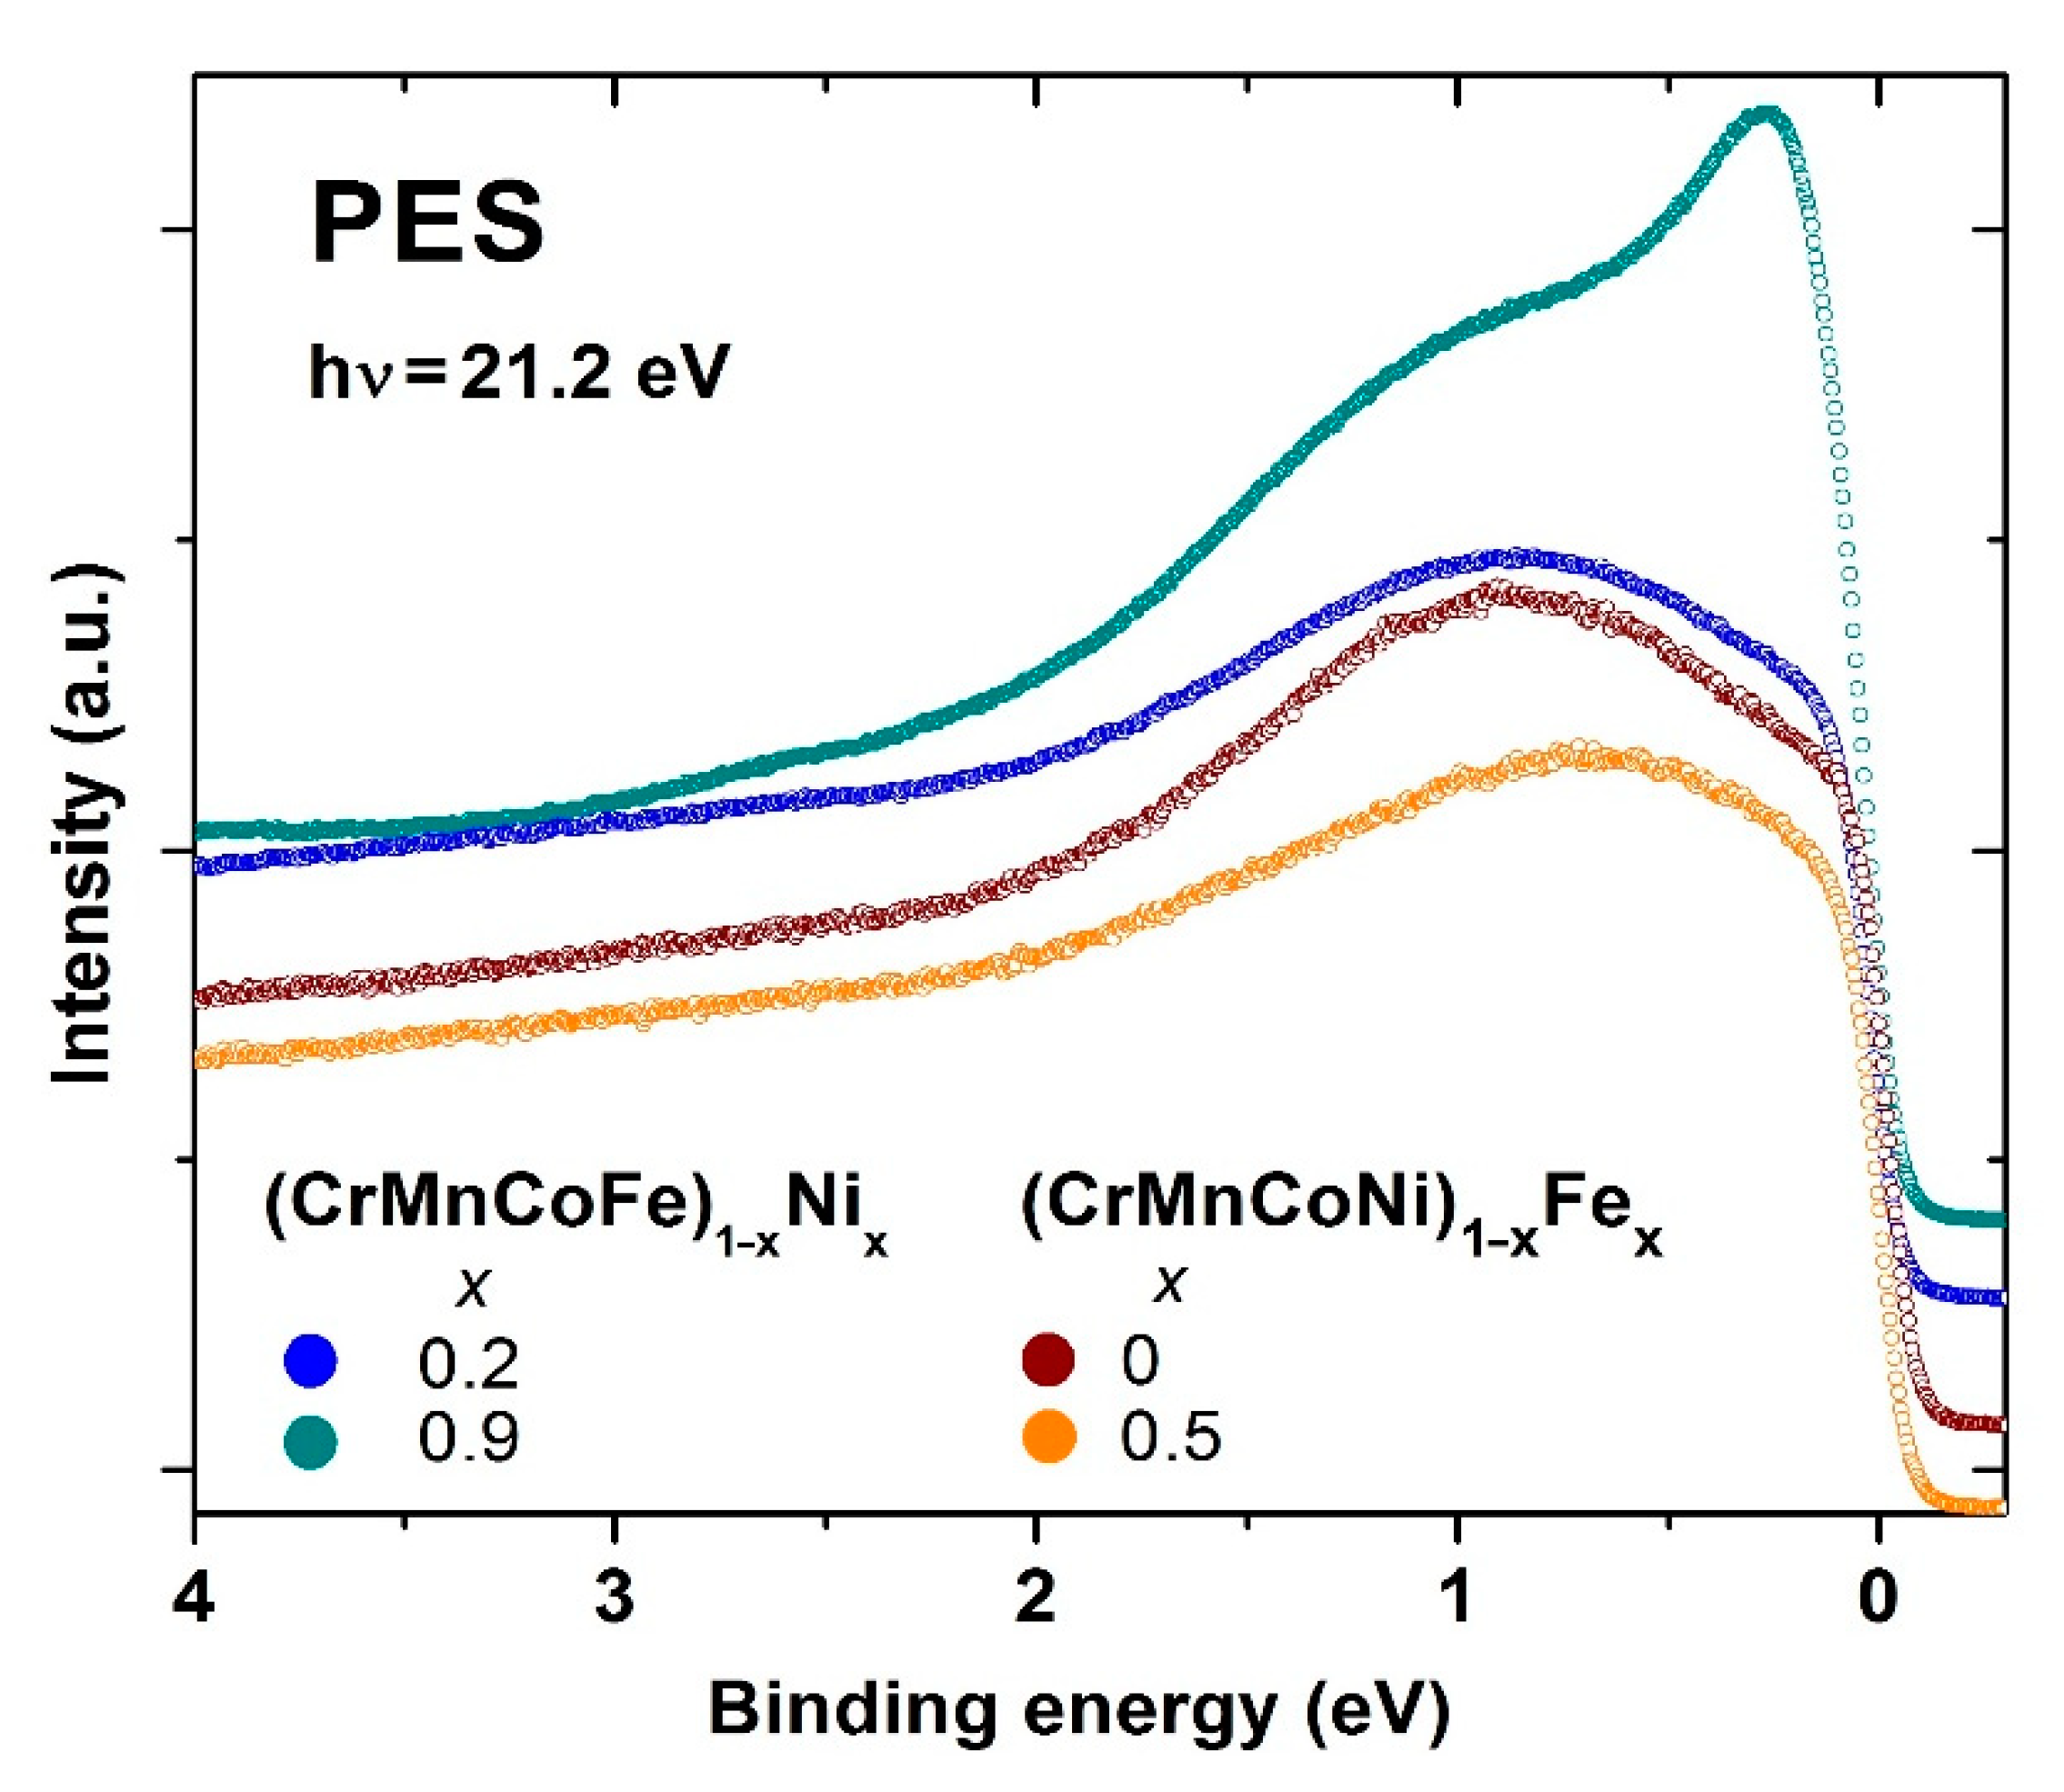
Figure 14 shows selected results of the ongoing UPS study of the ES of Cantor-type alloys possessing an FCC crystalline structure. The UPS spectra for (CrMnFeCo)
1−xNi
x and (CrMnCoNi)
1−xFe
x alloys, possessing the lowest and highest values of
x, thus belonging to the HEA and CA concentration ranges, are shown there.
Comparing these spectra with those for the quinary TE-TL MGs in
Figure 12, we note that in the Cantor-type alloys, the constituents, being the neighboring elements, seem to form a common band. There are no distinct features in these spectra which are separated in energy, as with those in
Figure 11 and
Figure 12, denoting the split band structure of the VB. In
Figure 14, the prominent feature is a moderate shift in the spectral intensity towards
EF with increasing
x. In (CrMnFeCo)
1−xNi
x alloys, the peak shifts are followed by an intensity increase and narrowing, going from
x = 0.2 to 0.92, whereas in (CrMnCoNi)
1−xFe
x a broad peak barely shifts with
x from 0.85 at
x = 0 to 0.65 eV at
x = 0.5, without any significant change of in its shape. In alloys with a variable Ni content, the study of spectra close to
EF indicated an increase in
N(
EF) with increasing
x. Our non-spin-resolved UPS study of polycrystalline samples cannot provide full information about the band structure and magnetic ground state of these alloys. However, in the case of (CrMnFeCo)
1−xNi
x alloys, a comparison of the measured spectra for selected alloys with these constituent elements (e.g., Ni) and with the results of
ai calculations of the band structure of some alloys (e.g., [
30,
40]) provides a qualitative insight into the evolution of the ES with
x. The spectrum for the alloy with
x = 0.2 in
Figure 14 is qualitatively similar to the calculated DOS of this alloy [
30], whereas that of the alloy with
x = 0.92 is similar to the UPS and XPS spectra of pure Ni. Thus, the ES of these alloys evolves with increasing
x from the Cantor alloy to that of pure Ni. This insight is strengthened by the results of the simultaneous study of the evolution of magnetism with
x in the same alloy system, which is described in the next section. In (CrMnCoNi)
1−xFe
x alloys, the situation is more complex since the shape of spectra hardly changes with x. In addition, the study of spectra close to
EF does not indicate any systematic tendency of
N(
EF). The preliminary results for the evolution of magnetism in this system show rather weak magnetic correlations which change rather slowly with the concentration of Fe. Clearly,
ai calculations are required to obtain better insight into the evolution of the ES and magnetism with the composition in both alloys and their constituents [
30]. Very recently, we noted [
108] that irrespective of line shapes and peak positions, UPS spectra of all studied alloys can be modeled rather accurately by using three Lorentzian functions (multiplied with Fermi–Dirac distribution functions) with fixed positions of maxima below
EF. The intensities of these maxima are correlated with the concentrations of the constituent elements.
3.5. Magnetic and Mechanical Properties
Knowledge of the magnetic state of a system can provide additional information about its ES [
44]. Further, the magnetic correlations contribute to the total energy of the system, which can affect its structure and other properties. As noted in the Introduction, in some HEAs and CCAs containing magnetic elements, a novel strengthening mechanism, i.e., magnetic hardening, has been found [
18,
19]. It is therefore surprising that only a qualitative description of the magnetic state at room temperature [
50] was part of detailed studies of the atomic structure and mechanical properties of isopleths made from the components of the Cantor alloy [
45,
46,
47,
48]. The exception is the Cantor alloy for which numerous studies, both theoretical and experimental, of its magnetism exist (e.g., [
30,
40,
41,
42,
43,
104,
109,
110,
111]). However, the descriptions of the magnetism of this alloy obtained in different studies differ considerably as regards the Curie temperature
TC and the average magnetic moment per atom (or formula unit)
m. This may not be surprising considering the chemical complexity of the equiatomic CrMnFeCoNi alloy, composed of five magnetic elements, each one with a concentration just above the site percolation threshold on an FCC lattice. Accordingly, there exists a wide distribution of atomic environments within the alloy which results in a very wide distribution of the exchange interactions between the constituent atoms, and a similarly wide distribution of the values and directions of the magnetic moment for each constituent atom [
19]. In theoretical studies, which invariably predict the ferromagnetic ground state of the Cantor alloy, the results for
TC and
m depend on the method of the employed calculation [
42], e.g.,
TC = 23 K and
m = 0.39
μB were calculated in [
30]. Almost all experimental studies also find a ferromagnetic ground state in this alloy but report very different results for the corresponding parameters
TC and
m. This observed scatter of measured
TC and
m values was most probably caused by the difficulty to obtain a homogeneous distribution of elements in the solid solution (as illustrated in
Supplementary Figures S1 and S2) due to the different bonding tendencies between different constituents (inset in
Figure 3), as discussed in some detail elsewhere [
45,
46,
47,
48]. One particular study [
104] attributed low values of
TC and
m of the Cantor alloy to its anti-invar behavior, similar to that of the high-temperature γ-Fe phase which has an FCC structure and a lattice parameter close to that of the Cantor alloy. Accordingly, substantial enhancement of the magnetic parameters of the Cantor alloy in respect to undoped alloys was obtained by expanding its lattice by doping it with carbon. However, the Cantor alloy with the addition of Cr and Mn contributed to the weak, if any, magnetism since the equiatomic FeCoNi alloy with an FCC structure has a
TC close to 1000 K [
112].
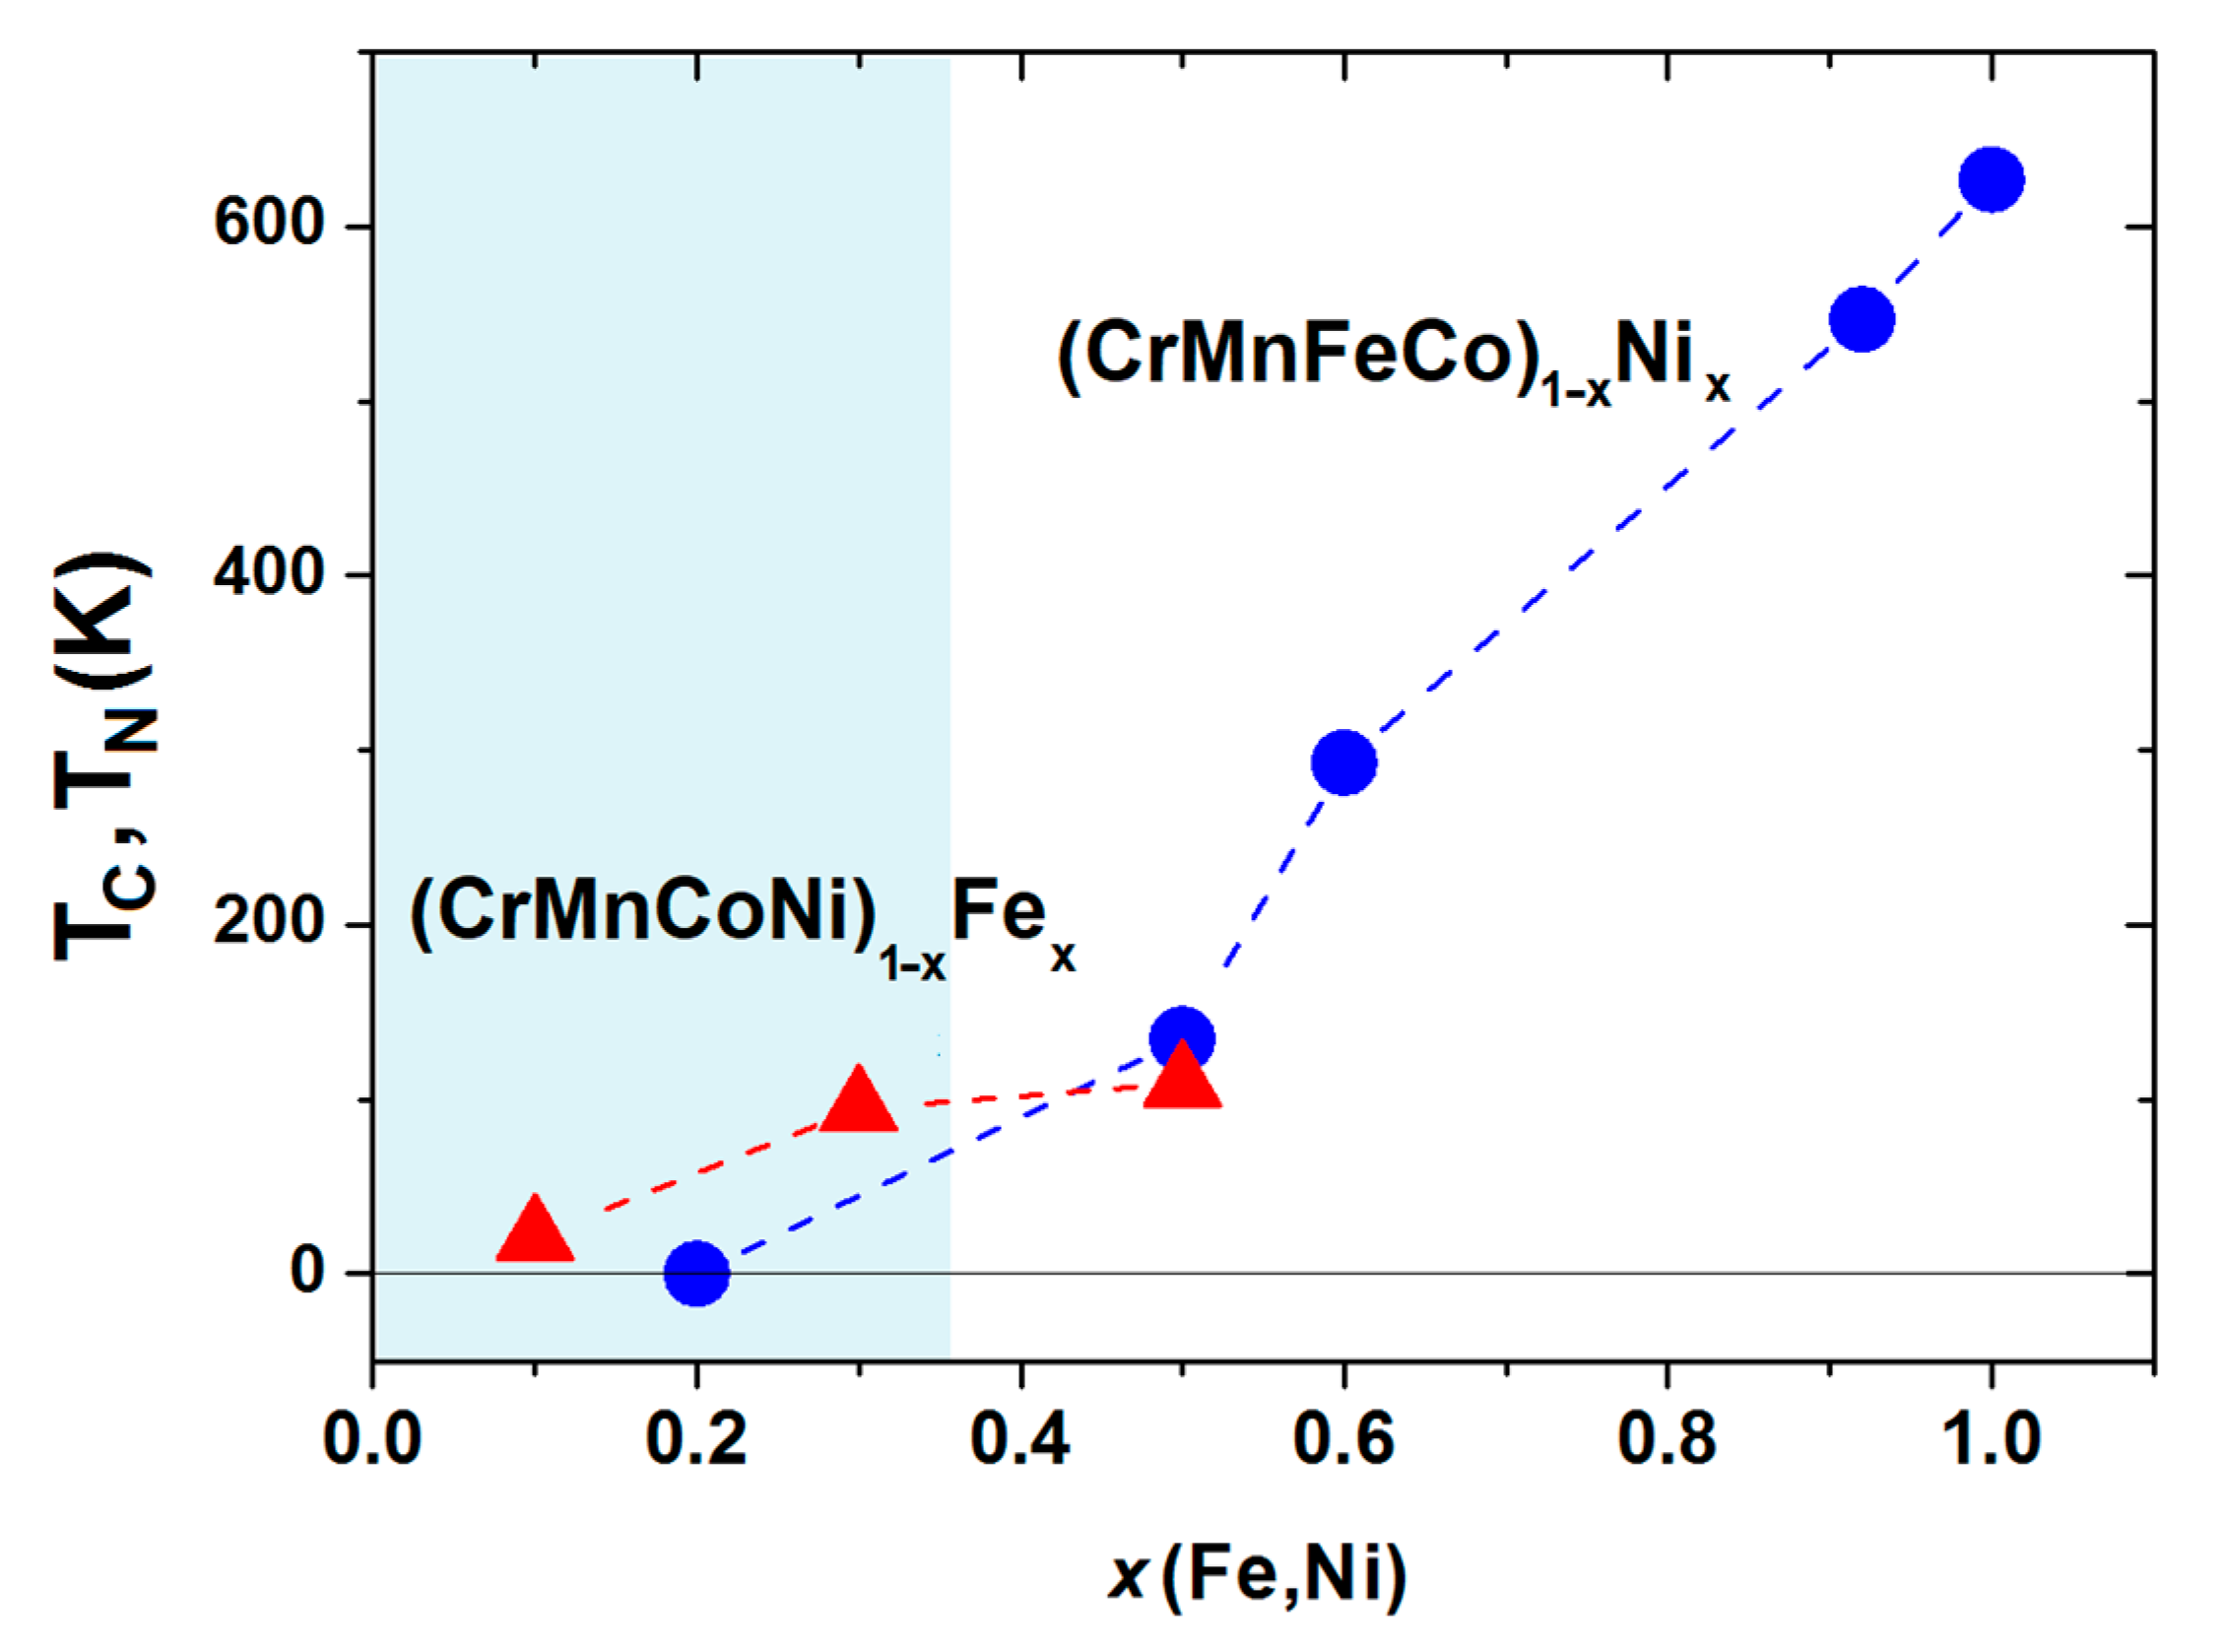
In
Figure 15 and
Figure 16, the first results of the ongoing study of the evolution of the magnetism in (CrMnFeCo)
1−xNi
x (
x = 0.2, 0.3, 0.5, 0.6, 0.92 and 1.0) and (CrMnCoNi)
1−xFe
x (
x = 0, 0.1, 0.3 and 0.5) alloys with a single-phase FCC structure are presented.
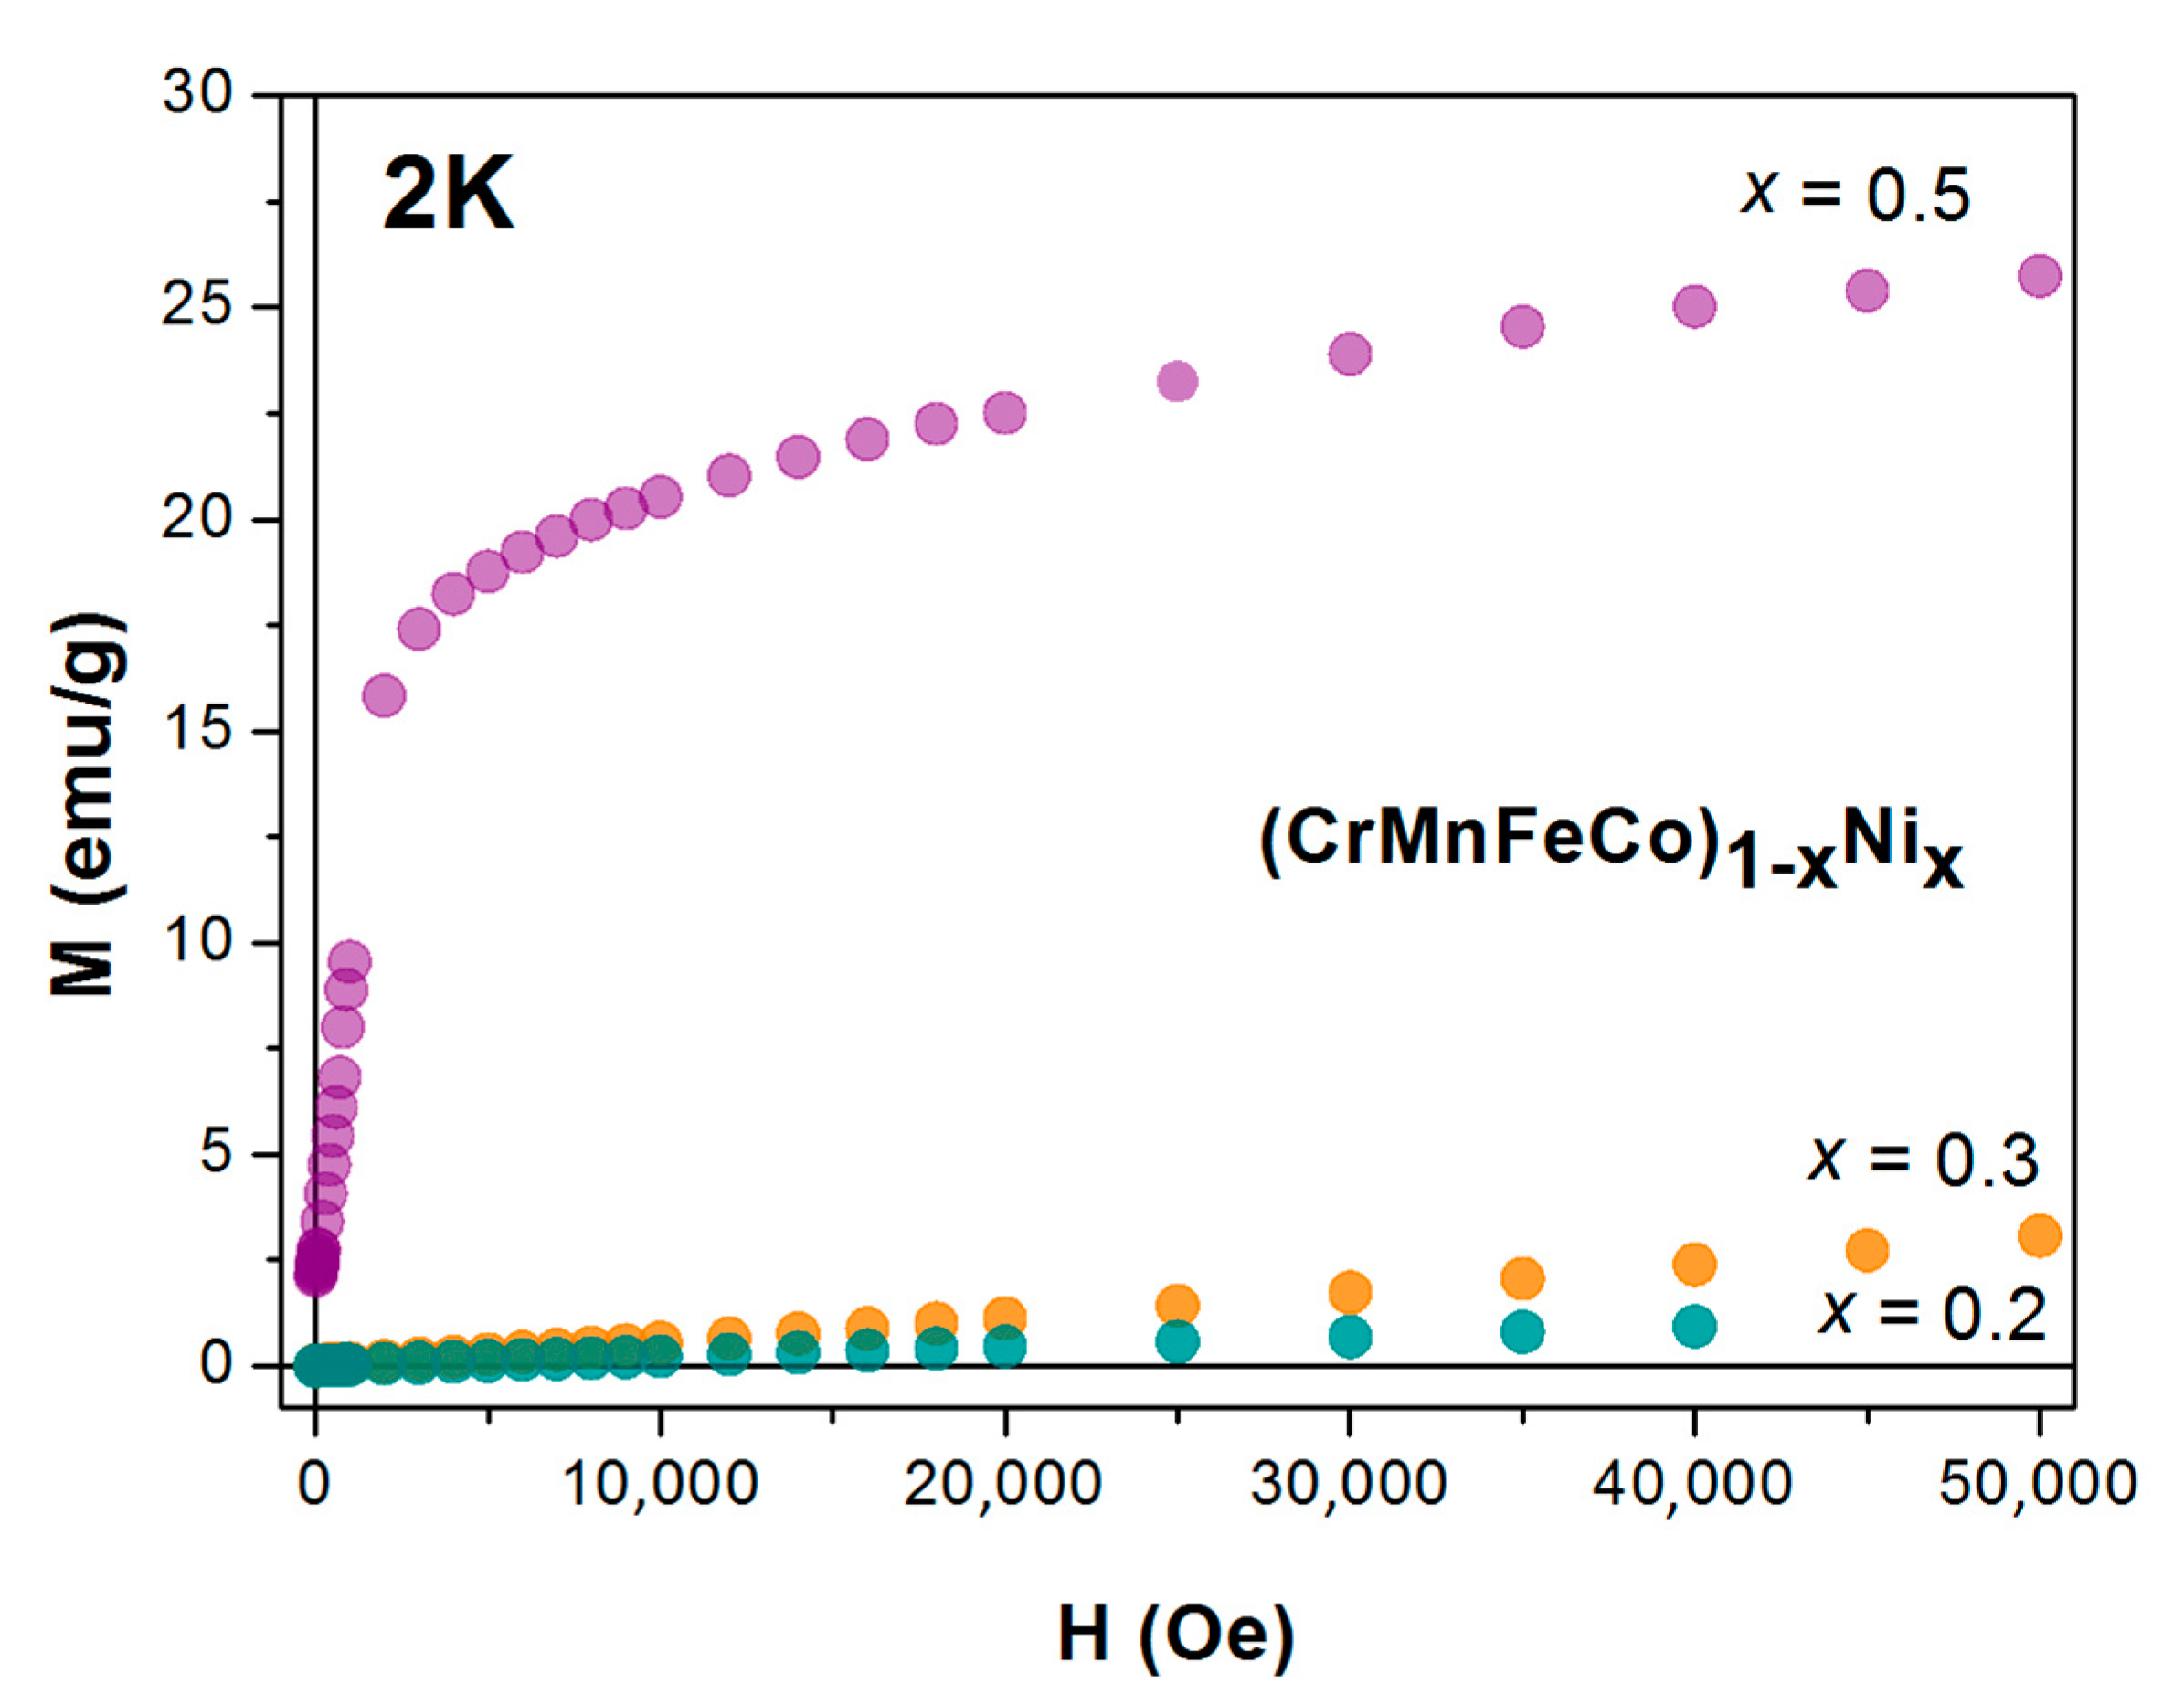
Figure 15 shows the M–H data measured at the temperature of 2 K for the alloys with low Ni contents. The linear M–H variation for
x = 0.2 shows that the ground state of the Cantor alloy with a rather homogeneous distribution of constituent elements is nonmagnetic. Thus, the ferromagnetism observed in numerous experiments is probably associated with the presence of magnetic clusters in an insufficiently homogenized sample. On the other hand, the ferromagnetism predicted in theoretical calculations is probably caused by the intricacy of these calculations. We note that
TC = 10 ± 10 K was predicted by Monte Carlo simulation of the Cantor alloy, indicating, in fact, a nonmagnetic state of this alloy [
42].
The magnetic susceptibility of the Cantor alloy in
Figure 15 has a similar value to that of the Hf
1-xFe
x MGs [
113] with
x around 0.4, which correspond to a superparamagnetic state. Although the M–H curve for the alloy with
x = 0.3 is qualitatively similar to that of the Cantor alloy (
Figure 15), it shows a somewhat more complex magnetic behavior at low temperatures. A detailed study of the M–H loops of this alloy in the temperature range 5–50 K revealed a very small hysteresis curve superposed on a large linear superparamagnetic term at temperatures below about 35 K. The very small
m = 0.008
μB corresponding to this ferromagnetic contribution at 5 K indicates the presence of magnetic clusters with a low
TC, within the superparamagnetic host, rather than bulk ferromagnetism. The origin of the formation of clusters within this alloy is not yet clear (the insufficient homogenization (see
Supplementary Materials Figure S1), or the vicinity of the magnetic percolation threshold). The M–H curve of the alloy with
x = 0.5 is ferromagnetic, but a detailed study of its transition to a paramagnetic state above
TC, using the ac susceptibility, revealed a strong magnetic inhomogeneity, similar to that observed in Hf-Fe and Zr-Fe MGs with Fe contents above the ferromagnetic percolation threshold. The magnetic phase diagram of (CrMnFeCo)
1-xNi
x alloys is shown in
Figure 16. For
x ≥ 0.5, the values of
TC monotonically increase with
x and smoothly join those of pure Ni at
x = 1. This is in accordance with the results of UPS for the same Cantor alloys which show the evolution of the DOS for
x, ranging from the Cantor alloy (calculated DOS only [
30,
40]) to the alloy close to pure Ni (
x = 0.92), as illustrated in
Figure 14. The preliminary results for the low-temperature magnetic moments of the alloys with
x≥0.5 indicate a monotonic increase in
m with the Ni content to that of pure Ni,
m = 0.62
μB, at
x = 1, qualitatively similar to that of
TC in
Figure 16. Therefore, the deviations of the average atomic volumes from Vegard´s law and of the hardness from the Mott–Nabarro–Labush law observed in the HEA composition range [
45] coincide with the disappearance of a long-range magnetic order and with the formation of magnetic inhomogeneities on an atomic scale. Thus, electronic correlations seem to favor both HEA formation and the disappearance of magnetism in the HEA range. Simultaneously, the onset of a ferromagnetic order strongly enhances the thermal stability of the alloys in the CA range, as shown in
Figure 5.
The preliminary results for the characteristic temperatures of (CrMnCoNi)
1−xFe
x alloys are also shown in
Figure 16. The sharp cusp in the magnetization and ac susceptibility of alloys with
x ≥ 0.3, accompanied by relatively low values of magnetization and magnetic susceptibility, indicates antiferromagnetic transitions occurring at the Neel temperatures
TN of around 100 K, which is close to that of γ-Fe. Thus, these alloys may, as with the Cantor alloy [
104], show anti-invar behavior (an anomalous thermal expansion at elevated temperatures). At present, it is not clear to us the true origin of the relatively broad peak in the ac susceptibility of the alloy with
x = 0.1 situated around
TP = 21 K. Notice that (CrMnCoNi)
1−xFe
x alloys are distinguished from other isopleths studied at ICMPE [
45,
46,
47,
48] in that their VEC = 8 does not depend on
x. Thus, the appearance of a phase with a BCC crystalline structure for
x > 0.5 [
47] probably indicates the limitations of a simple VEC criterion for the selection of the crystalline phase in CCAs.
A rather detailed discussion of magnetic susceptibilities of three quinary TE-TL MG systems has recently been reported [
24,
25,
52]. In this paper, we will address the compositional variations of the room temperature magnetic susceptibilities,
χexp, of these alloy systems. Due to the close relationship between the magnetic susceptibility and ES [
44], the corresponding results of UPS and LTSH studies will be used to explain the differences in the
χexp behavior in the three alloy systems.
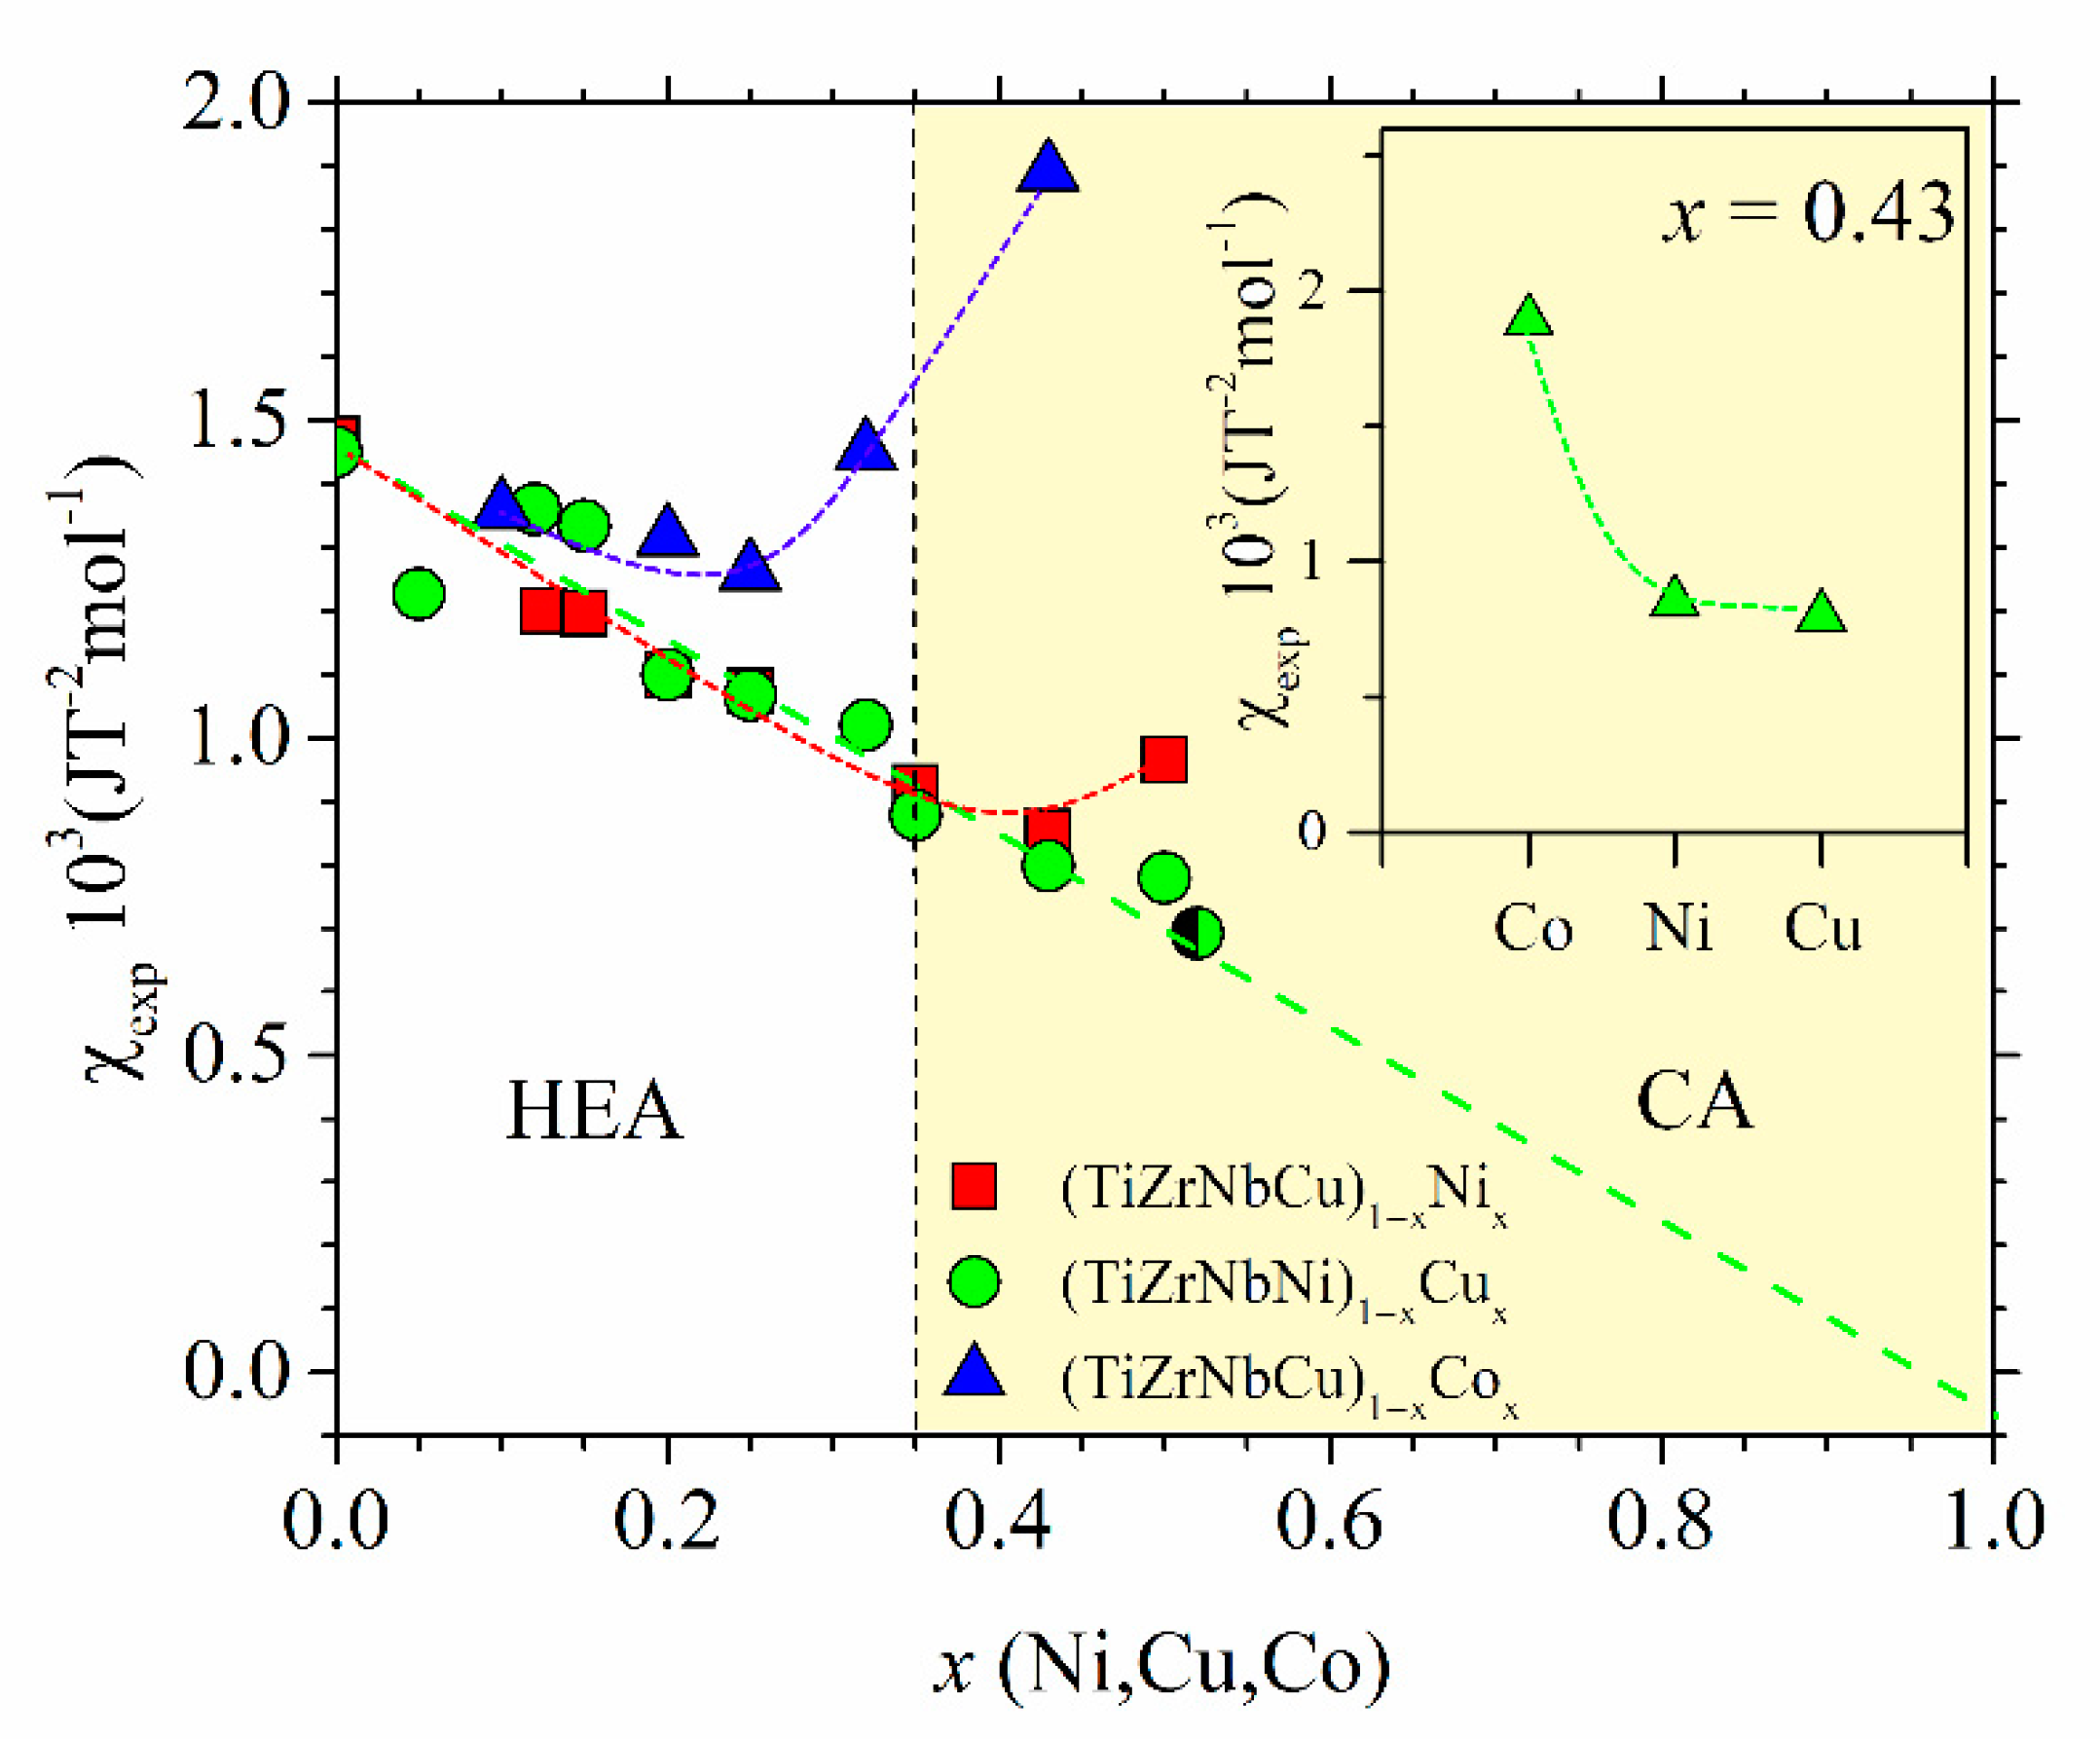
The variations of χ
exp with the TL content for all our alloys are shown in
Figure 17. These variations are qualitatively similar to those observed in the corresponding binary Zr
1−xTL
x MGs with TL = Cu, Ni or Co [
66,
67,
81,
95,
105,
107,
108]. The data for all alloy systems in
Figure 17 for
x = 0 appear to extrapolate to the same value, that of pure amorphous Zr, equal to 1.5 10
−3 JT
−2mol
−1 [
81,
114]. In addition to comparable initial values, the data for all alloy systems in
Figure 17 also show similar initial variations with
x: the small initial decrease on increasing
x to
x ≤ 0.2 probably shows that the d states of TEs dominate both χ
exp and
N(
EF) at low contents of TL (
Figure 11,
Figure 12 and
Figure 13). For
x > 0.2, two distinctly different types of behavior of χ
exp can be seen in
Figure 17. The χ
exp of (TiZrNbNi)
1−xCu
x MGs linearly decreases throughout the explored concentration range,
x ≤ 0.52, and extrapolates close to that of pure Cu for
x = 1 [
25], whereas these for (TiZrNbCu)
1−xNi
x and (TiZrNbCu)
1−xCo
x pass through a minimum value at some system-dependent
x and then start to increase at higher concentrations.
The behavior of χ
exp of (TiZrNbNi)
1−xCux MGs is qualitatively the same as that of
γ (
Figure 13) and
N(
E), which is characteristic of the ideal solution [
25]. The same behavior of both
χexp and
N(
E) has been previously observed in all binary TE
1−xCu
x MGs with TE = Ti, Zr or Hf [
66]. In all these systems, the atomic parameters, such as the average atomic volumes, vary linearly with the concentration according to Vegard’s law (
Figure 1), whereas their APFs and coordination numbers,
N, are constant, independent of
x [
25,
66,
95]. The behavior of
χexp of (TiZrNbCu)
1−xNi
x is also qualitatively the same as that of
γ and
N(
EF) [
24,
26]. All these quantities exhibit an increase at the same value of
x ≥ 0.43. Qualitatively, the same correlation between the variations of
χexp and
γ and
N(
EF) are observed in binary Zr
1−xNi
x MGs, with the distinction that the increase in all these quantities sets off around the concentration corresponding to the band crossing in this system,
x = 0.67 [
24,
74].
The crossover of
χexp and
γ in the studied alloys takes place at significantly lower values of x compared to binary MGs [
24,
74], which is surprising as the Hall effect measurements [
26] showed the band crossing in (TiZrNbCu)
1−xNi
x alloys at a higher concentration than that of the corresponding Zr
1−xNi
x MGs [
74]. An enhanced electronic correlation favoring magnetic ordering (such as the Stoner enhancement [
24,
25,
52]) in respect to that in Zr
1−xNi
x MGs [
105] is a possible explanation of the increases in both
χexp and
γ in the studied system at a concentration considerably below that expected for band crossing. Alternatively, a change in local atomic arrangements visible as a sudden increase in
N at
x ≥ 0.43 [
24] may be responsible for the simultaneous increases in
χexp and
γ in (TiZrNbCu)
1−xNi
x alloys. In the (TiZrNbCu)
1−xCo
x alloys in
Figure 17, as in (TiZrNbCu)
1−xNi
x alloys [
24], the increase in
χexp at
x ≥ 0.25 coincides with that in the APF (
Figure 10) and
N [
62], and thus with some change in local atomic arrangements.
Further, this
χexp increase occurs at the concentration of Co which is much lower than that estimated for the band crossing,
x = 0.68 [
52]. In the corresponding binary Zr
1−xCo
x MGs, this
χexp increase appears for
x > 0.4. At the same value of
x, which is close to the concentration at which the band crossing occurs in these MGs,
x = 0.5 [
74,
75],
N(
EF) also starts to increase with increasing
x [
108].
Unfortunately, there are only two experimentally determined values for
γ in (TiZrNbCu)
1−xCo
x alloys (
γ = 4.1 and 4.7 mJ/mole K
2 for
x = 0.2 and 0.43, respectively,
Figure 13 and Reference [
101]), preventing any detailed comparison between the variations of
γ and of
χexp with the Co content. However, recent magnetization measurements of our partially crystalline alloy with
x = 0.5 showed very small ferromagnetic hysteresis loops at low temperatures,
T = 2 K and 30 K. Thus, the threshold for the onset of ferromagnetism in our alloys seems to be lower than that in binary Zr
1−xCo
x MGs, which is around
x = 0.6 [
105,
108]. Accordingly, the Stoner enhancement (S) should increase more rapidly in the studied quinary alloys than that in similar binary MGs which, in turn, may explain the observed enhancement of
χexp at a relatively low Co content (within the HEA concentration range,
Figure 17).
In conclusion, we notice the self-consistency between the measured ES, local atomic arrangements and magnetic susceptibility in the studied quinary TE-TL MGs. The inset of
Figure 17 illustrates an intimate relationship between the ES, represented by γ, and intrinsic properties (such as the magnetic or mechanical properties) of the same alloys, addressed in the previous section in the discussion of
Figure 13. The data in the inset of
Figure 17 show the values of
χexp for the alloys with
x = 0.43 of Co, Ni or Cu. The variation of
χexp is almost the same as that of
γ shown in the inset of
Figure 13. This demonstrates that a change in
χexp on crossing from the HEA to the CA concentration range is largely due to the corresponding ES (more precisely, the degree of the presence of d states of TLs at
EF, and thus the amount of band splitting,
Figure 12). Thus, knowledge of the evolution of the ES with the composition is perhaps the simplest way of predicting the change in intrinsic properties on the transition from the HEA to the CA concentration range. However, as discussed elsewhere [
24,
25,
26,
32,
33,
52,
66], the striking similarity between the variations of
χexp and
γ or
N(
EF) (cf.,
Figure 13 and
Figure 17) is quite surprising considering the complexity of the
χexp in transition metals and their alloys and the fact that only one term out of three major ones is a function of
N(
EF) [
66,
100].
Several outstanding mechanical properties such as a very large strength (approaching the theoretical strength) as well as a very high hardness, fracture toughness and wear resistance make metallic glasses interesting for diverse practical applications [
89,
115]. All these properties of MGs are strongly affected by their disordered atomic structure and macroscopic homogeneity. The very large hardness of MGs compared to that of crystalline alloys is associated with the absence of extended crystal defects (caused by structural disorder) which results in the elastic-plastic type of deformation. Hence, the yield stress is practically the same as the tensile limit. Thus, the hardness of MGs is proportional to both the yield stress and Young’s modulus
E [
116]. Since MGs are macroscopically homogenous and isotropic, their hardness is also proportional to their shear and bulk modules,
G and
B, respectively. All these properties are directly related to the strength of interatomic bonding [
22,
23,
24,
25,
37,
66,
81,
82,
83,
84] as a consequence of the absence of the extended crystal defects and associated crystal slip mechanisms. Since interatomic bonding strength also affects the average atomic volume, the thermal parameters such as
Tm,
Tl and
Tx and atomic vibrations are consequently also correlated with the mechanical properties of MGs [
24,
25,
37,
81,
82,
83,
84,
89,
117]. Considering a wealth of information that can be obtained from rather simple hardness measurements in MGs, it seems surprising that the first systematic study of the variation of microhardness,
HV, with the composition, covering both HEA and CA concentration ranges, has been performed only recently on (TiZrNbCu)
1−xCo
x MGs [
52]. This study has shown that the correlation between
HV and some other parameters associated with interatomic bonding and the ES, well established for binary and ternary MGs, also applies to quinary ones. Moreover, it has been shown that by averaging enough results, the variation of
HV can reflect a subtle change in local atomic arrangements such as that affecting the APF in
Figure 10. Below, we provide new results for the
HV of (TiZrNbCu)
1−xCu
x and (TiZrNbCu)
1−xNi
x MGs and compare the results of
HV with those for some other properties of the same alloys, as well as with results for hardness obtained from nanoindentation,
Hnano, in selected Cantor-type alloys with an FCC crystalline structure [
45,
47,
48].
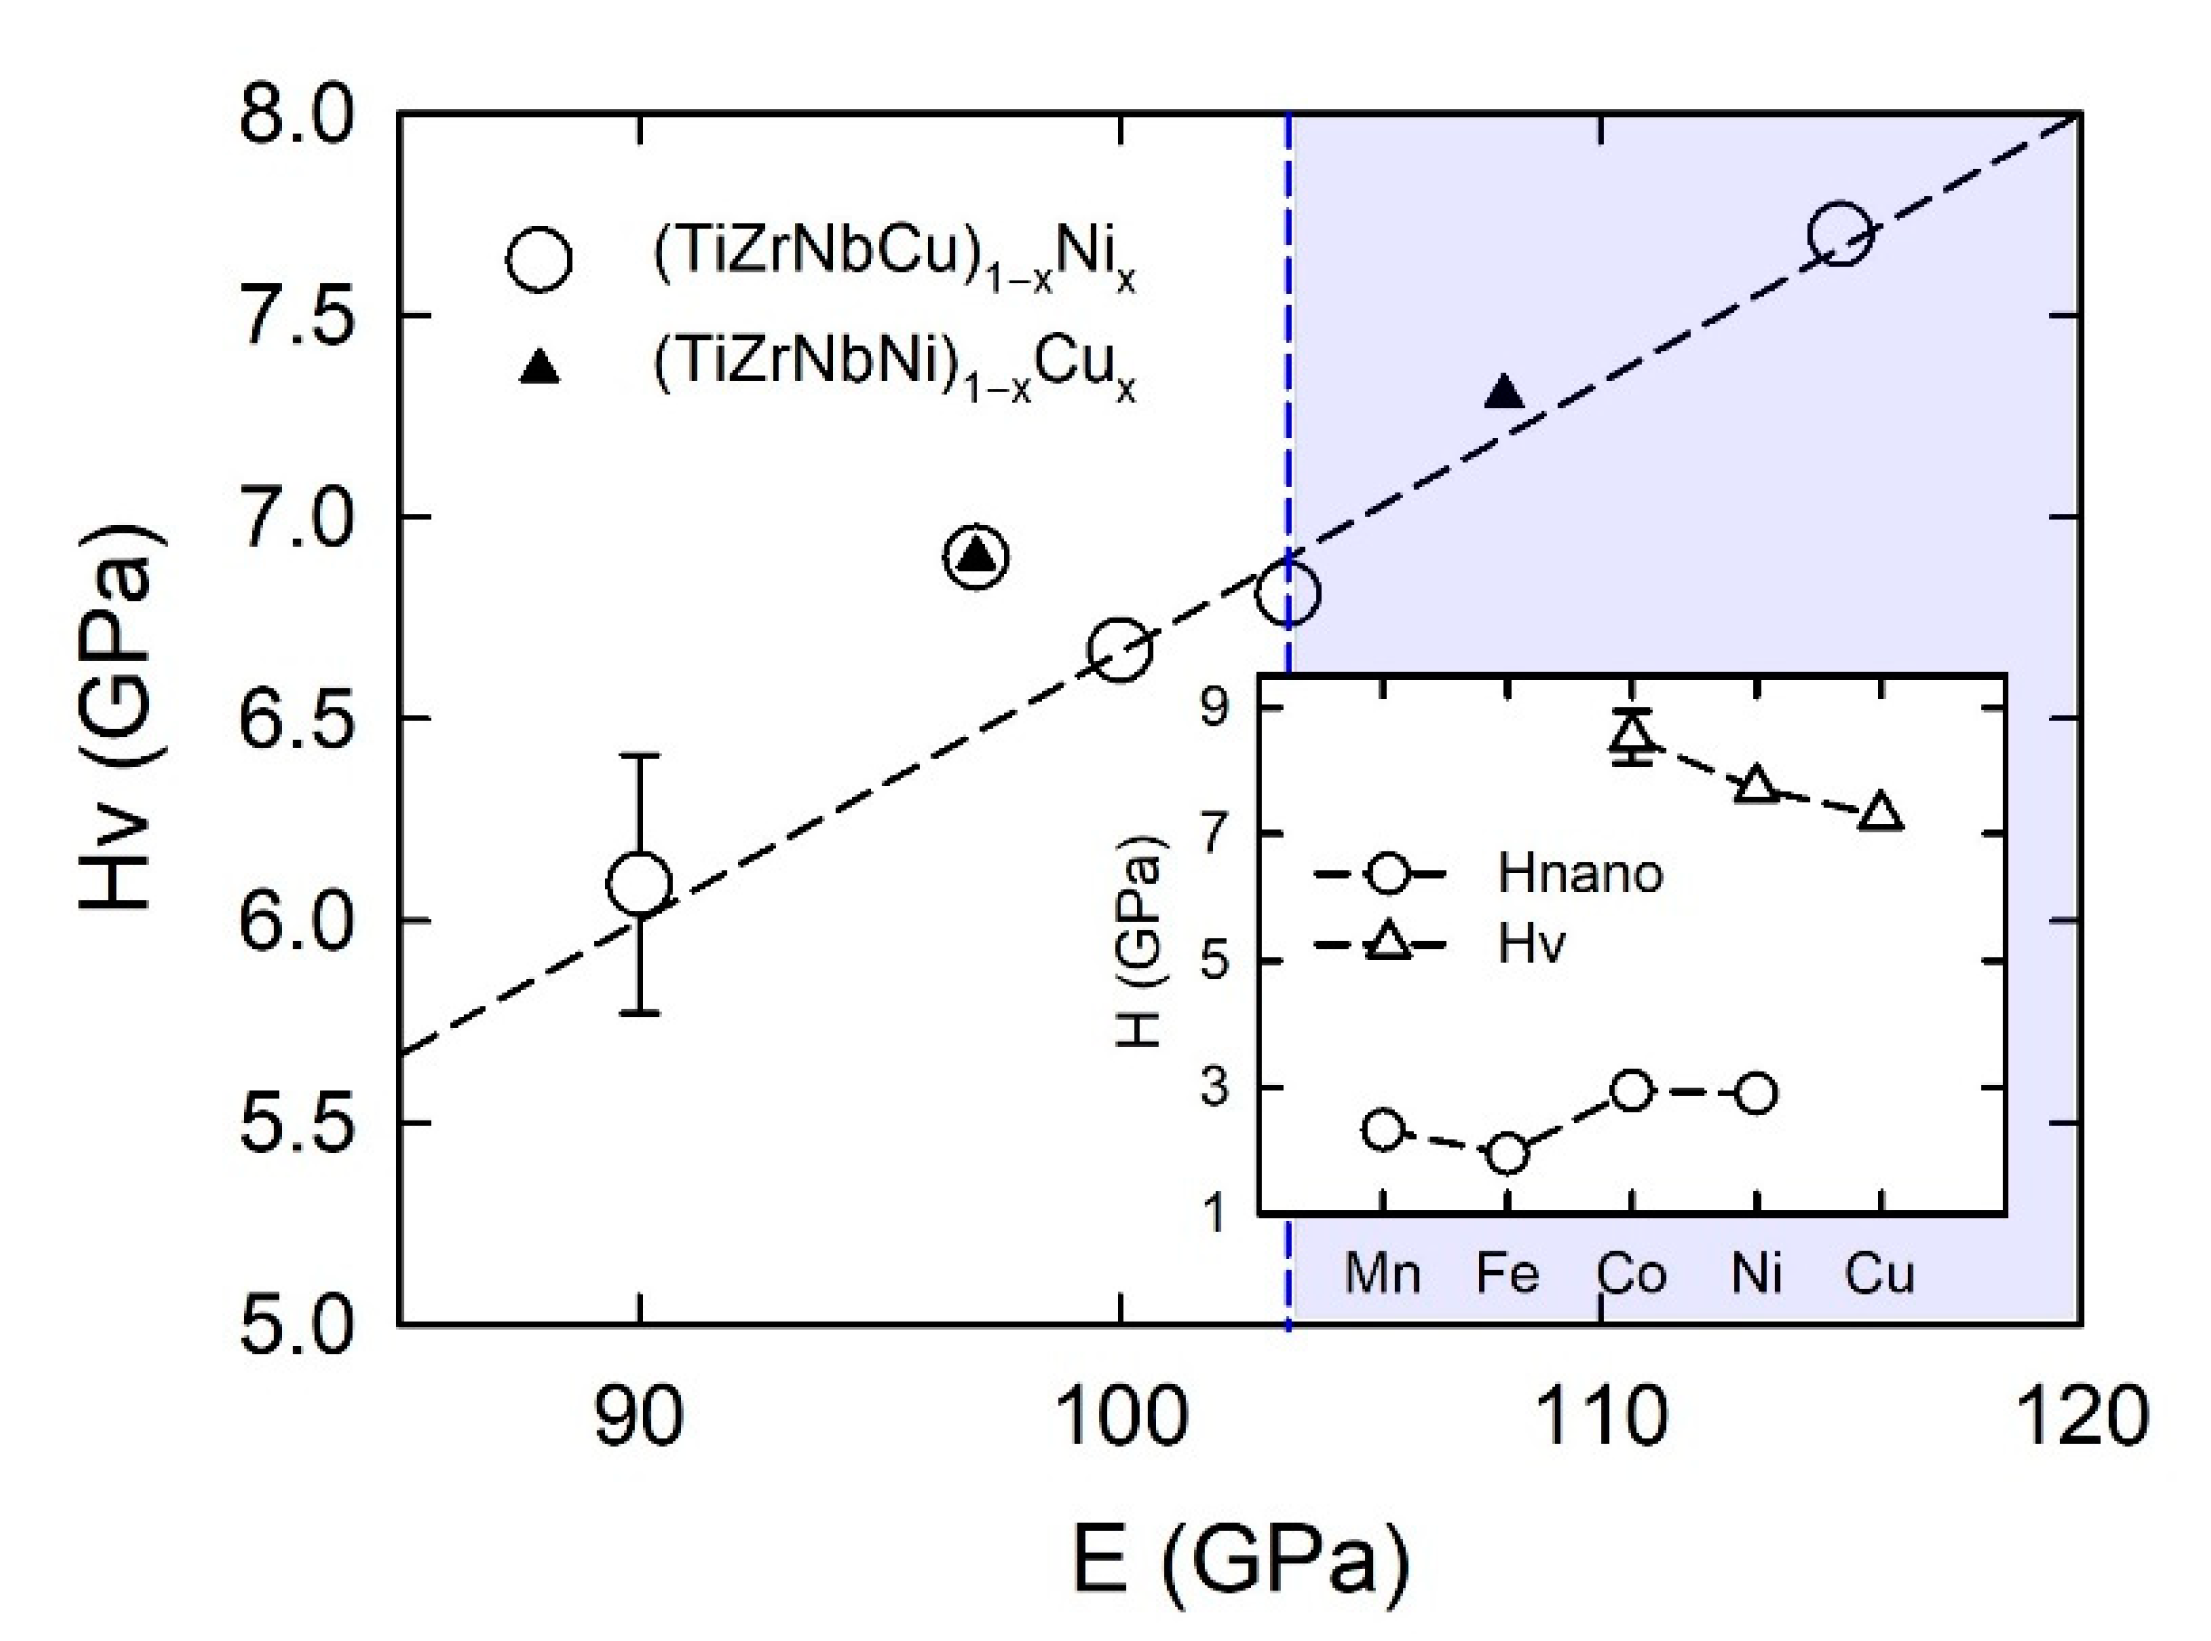
Variation of the room temperature Vickers microhardness of our as-cast (TiZrNbCu)
1−xCu
x with the Cu content on crossing from the HEA to the CA concentration range is shown in
Figure 18. The inset shows an image of a typical indentation showing its well-defined edges. The error bar on
Hv for
x = 0.12 denotes the standard deviation which was around 5% for all compositions.
A linear increase in
HV with
x is consistent with the corresponding increase in the interatomic bonding showing up in an increase in thermal parameters such as
Tx and
Tl (see
Figure 4 of [
25]). Further, the
HV (
x) variation is apparently correlated with the variations of the average atomic volume and the mass density of the same alloys (
Figure 6 in [
25]). Indeed, it seems plausible that in alloys with a similar atomic structure (amorphous), hardness increases with density. The increase in
HV with increasing
x is accompanied by a linear decrease in
γ and
N(
EF), as shown in
Figure 13. Thus, the variation of
HV with the composition in these MGs (showing no change in variation on crossing from the HEA to the CA concentration range,
Figure 18) is consistent with their ideal solution behavior [
25]. Further, it qualitatively shows the same correlation with the corresponding ES and with parameters associated with interatomic bonding as those previously observed in binary and ternary TE-TL MGs [
65,
81,
82,
83,
84,
89,
117]. As seen in
Figure 18 and explained in the previous paragraph [
82,
89,
115], the magnitude of
HV is very large and increases from about 6 to 7.3 GPa for
x = 0 and 0.5, respectively. It is of interest to compare these values with those of (TiZrNbCu)
1−xCo
x [
52] and (TiZrNbCu)
1−xNi
x MGs and with those for similar binary TE-TL MGs [
81,
82,
83,
84]. As seen in the inset of
Figure 19, in quinary TE-TL MGs at
x = 0.43,
HV decreases monotonically, going from TL = Co to Cu. This variation is similar to the variation of γ in the inset of
Figure 13 and that of
χexp in the inset of
Figure 17 (both taken at the same
x = 0.43) which shows that the variation of
HV is similar to that of γ and
χexp determined with the contribution of the d states of the given TL to
N(
EF). We note that such a rather simple correlation between
HV and
N(
EF) is believed to be specific to TE-TL MGs and uncommon in crystalline alloys [
81,
82,
83,
84]. However, a recent study of the crystalline structures and mechanical properties of (TiZrHf)
x(CuNi)
1−x crystalline alloys with 0.4 ≤
x ≤ 0.8 showed that the yield strength decreases with increasing
x (and thus the TE content) even though the crystalline phases also change with the concentration [
51]. This probably implies that the effect of the ES on the strength of quinary TE-TL crystalline alloys is stronger than that of the corresponding crystalline phase(s). Finally, we compared the value of
HV of the alloy with
x = 0.5 in
Figure 18 with that of equiatomic binary Ti-Ni or Cu (
HV around 7 GPa) and Zr-Ni or Cu (
HV around 5 GPa) MGs to deduce the effect of chemical complexity on the hardness of TE-TL MGs. This comparison shows that the type of TE constituent (such as Ti or Nb) is probably more important for the magnitude of
HV than the number of alloying components.
The dashed line in
Figure 18 illustrates the variation of
Hnano of single-phase (CrMnCoNi)
1−xFe
x FCC alloys with
x [
47]. As expected, for crystalline alloys, due to crystal slip mechanisms, the values of
Hnano are a factor of two to four times smaller than the values of
HV of (TiZrNbCu)
1−xCu
x MGs.
Hnano decreases approximately linearly with
x and extrapolates around 0.8 GPa for pure FCC iron,
x = 1. The observed variation was reproduced quite well [
47] by using the model for solid solution strengthening in FCC HEAs. The inputs in this model [
118] are the atomic volumes of the alloying components and the corresponding elastic constants (the shear modulus and the Poison ratio). The predictions of the model are more sensitive to the values of atomic volumes than those for elastic constants. The linear decrease in the atomic size mismatch
δ of these alloys with
x shown in
Figure 3 seems consistent with the observed variation of
Hnano. We note that only in (CrMnCoNi)
1−xFe
x alloys did
Hnano decrease on increasing
x. In alloy systems with a variable content of Co or Ni, it increased with increasing
x within the same concentration range. This is illustrated in the inset of
Figure 19 which shows the values of
Hnano for
x = 0.5 of Co, Mn, Fe and Ni. These values show a deep minimum at Fe. The error bar on
Hnano for
x = 0 denotes the standard deviation, which was around 5% for all compositions.
Two other isopleths of Cantor alloys that can be formed in a single-phase FCC structure, for Mn or Ni contents up to
x ≥ 0.5, showed more diverse compositional variations of the studied properties [
47]. In the isopleth with a variable Mn content, (CrFeCoNi)
1−xMn
x, a strong linear increase in the average atomic volume on increasing
x is accompanied by a small and shallow maximum of hardness centered around
x = 0.1 (thus within the HEA range, as illustrated in
Figure 1). This maximum was described reasonably well [
47] using the model for strengthening of random FCC alloys [
118]. Since in this system, the melting temperatures calculated by the Calphad method decrease rapidly with increasing Mn content [
46], it seems plausible that a combination of solid solution strengthening and decreasing the bonding strength on increasing
x affects the observed change in hardness and may explain the occurrence of the maximum at a low
x. The hardness of the isopleth with a variable Ni content showed a quite large and broad maximum centered around
x = 0.6 Ni (thus within the CA concentration range, as illustrated in
Figure 1) accompanied by a similarly complex variation of the average atomic volume: a linear decrease according to Vegard’s law for
x ≥ 0.6 and a strong negative deviation from Vegard’s law at a lower
x [
45]. The magnetic phase diagram of the same alloys presented in
Figure 16 shows that at
x = 0.6, a long-range ferromagnetic order persists up to above room temperature. Therefore, the deviations of the average atomic volumes from Vegard´s law and those of hardness from the Mott–Nabarro–Labush law [
45] coincide with the disappearance of the long-range magnetic order and with the formation of magnetic inhomogeneities on an atomic scale in the HEA concentration range. The magnitude and variation of melting temperatures within the HEA/nonmagnetic concentration range in
Figure 5 indicate a significantly reduced strength of interatomic bonding in this regime, compared to that predicted by the rule of mixtures.
In
Figure 19, we show the result of the experimental check of the validity of the universal relationship between
E and
HV of metal–metal-type (M–M) binary and ternary MGs [
116], where
E = 15
HV in our quinary TE-TL MGs. The values of
HV of all (TiZrNbCu)
1−xCu
x and (TiZrNbCu)
1−xNi
x MGs for which the corresponding values of
E exist are plotted in an
HV vs.
E diagram in
Figure 19. Considering the fairly large errors inherent in measurements of microhardness, the data agree quite well with the universal relationship between
E and
HV of metal–metal-type (M–M) binary and ternary MGs denoted with the dashed line [
115]. Finally, we used this relationship to calculate the value of
E for pure amorphous Cu by multiplying the value of
HV, obtained by extrapolation of the values in
Figure 18 to
x = 1, by 15. The resulting
E = 120 GPa agrees well with that of pure FCC Cu. The same relationship also provided a good estimate of
E of pure amorphous Co [
52].
Distinct features of MG such as a disordered atomic structure, macroscopic homogeneity and the absence of extended crystal defects possessing several remarkable mechanical properties are also favorable for some other functional properties of these materials. For example, the exceptional resistance to radiation and corrosion of many MGs is associated with their disordered atomic structure and the absence of extended defects [
89]. Moreover, Zr-based BMGs are known to possess exceptional irradiation resistance [
119] and corrosion resistance properties [
120], while some a-HEAs/CCAs containing rare-earth elements [
58,
121] have promising properties of magnetic refrigerants due to effects of the disordered atomic structure and compositional tuning of the magnetic ordering temperature.
