Article

Evaluation of Critical Dynamic Stress and Accumulative Plastic Strain of an Unbound Granular Material Based on Cyclic Triaxial Tests

1
School of Civil Engineering, Central South University, Changsha 410075, China
2
National Engineering Laboratory for High Speed Railway Construction, Central South University, Changsha 410075, China
*
Author to whom correspondence should be addressed.
Materials 2021, 14(19), 5722; https://doi.org/10.3390/ma14195722
Submission received: 26 August 2021 / Revised: 17 September 2021 / Accepted: 28 September 2021 / Published: 30 September 2021

Abstract

:
Critical dynamic stress (σcri) and accumulative plastic strain (εp) are primary indicators regarding the dynamic stability of unbound granular materials (UGMs). This study aims to seek an effective method to evaluate the dynamic stability of UGMs used in railway subgrades. First, the dynamic characteristics of an UGM used in railway subgrade bed construction were investigated by performing a series of large-scale cyclic triaxial tests, with the results showing that εp versus cycle number (N) curves can be categorized into stable, failure, and critical patterns. Grey relational analyses were then established, where the analyzed results demonstrated that the εpN curve pattern and final accumulative plastic strain (εs) of the stable curves are strongly correlated with the moisture content (w), confining pressure (σ3), and dynamic deviator stress (σd). The analyzed grey relational grades distributed in a narrow range of 0.72 to 0.81, indicating that w, σ3, and σd have similar degrees of importance on determining the εpN curve patterns and the values of εs of the UGM. Finally, a data processing method using a back-propagation (BP) neural network is introduced to analyze the test data, and an empirical approach is developed to evaluate the σcri (considering the effects of σ3 and w) and εs (considering the effects of σ3, w, and σd) of the UGM. The analyzed results illustrated that the developed method can effectively reflect the linear/non-linear relationships of σcri and εs with respect to σ3 and/or σd. The σcri approximately increases linearly with increasing σ3, and a simple empirical formula is proposed for the σcri. In addition, εs and its variation rate increase non-linearly with increasing σd but decrease non-linearly as σ3 increases.

1. Introduction

The serviceability of railway tracks is strongly associated with the dynamic stability of unbound granular layers atop weaker layers of the subgrades, of which the critical dynamic stress (σcri) and accumulative plastic/permanent stain (εp) are primary indicators regarding the dynamic stability of unbound granular materials (UGMs) [1,2,3,4,5,6]. Subgrades of railways accumulate permanent settlement under dynamic traffic loading, and excessive accumulative surface settlement typically causes problems, such as vehicle turbulence in transition sections [7,8], uneven settlement [9,10,11], and lateral expansion of embankment shoulders [12,13,14]. One of the most effective ways to control the accumulative deformation of subgrades is maintaining the traffic-induced dynamic stress to be less than a critical value (i.e., the σcri), under which the development rate of εp gradually decreases and can ultimately cease with an increase in the dynamic loading cycles [5,15,16]. Furthermore, the rapid development of high-speed transport and heavy-haul freight demands the subgrades beneath track structures must satisfy strict requirements on accumulative permanent settlements [17,18,19]. Therefore, evaluations of the critical dynamic stress and accumulative plastic strain of the UGM layers are important in the design of a railway.
The cyclic triaxial test is an efficient way to study the critical dynamic stress of subgrade materials [20,21,22,23]. Qualitative analyses of critical dynamic stress of different types of materials showed that σcri is linked to the saturation degree, stress history, and dynamic loading path of the materials [15,24]. Cheung et al. [25] designated the stress level under which 1% accumulative permanent strain was generated within 1000 loading cycles as the σcri. Frost et al. [26] presented that the σcri of fine-grained subgrades is approximately half of the deviator stress corresponding to static destruction. Wang et al. [27] reported that the initial stress state could considerably affect the σcri of a silty clay. Recently, a few empirical models were developed to predict the σcri; Zhang et al. [28] developed a regression model for predicting the σcri based on the fuzzy linear regression theory and structural element method. Xu et al. [6] presented an empirical method to predict the σcri by introducing the concept of critical stress ratio; Zhai et al. [16] predicted the σcri of UGMs as a function of confining pressure based on results of cyclic triaxial tests of specimens with optimal moisture content. Most existing studies on σcri were qualitative investigations. Several evaluation models of σcri have also been proposed on the basis of cyclic triaxial tests; however, the factors considered in the models regarding the σcri of UGMs are incomplete, and systematic studies of σcri considering the effects of both moisture content and confining pressure are desirable.
The cyclic triaxial test is also commonly used to study the accumulative plastic deformation of UGMs. Generally, the εp versus cycle number (N) curves can be identified from a cyclic triaxial test. Instances of commonly used relationships are the power-function [29], semi-logarithmic [30], and hyperbolic models [31], which simply reflect the variation relationship between the εp and dynamic loading cycles; therefore, modifications have been proposed with considerations of the effects of stress path, static strength, confining pressure, etc. Li and Selig [32] extended the power function model while including the physical state and static strength of the tested soil; Chai and Miura [33] then extended the method of Li and Selig [32] by incorporating the initial static deviator stress (σsi); Wu et al. [34] improved the original power-function model while considering the effects of cyclic stress ratio. Moghaddas-Nejad and Small [35] improved the semi-logarithmic model by incorporating confining pressure and dynamic deviator stress; Stewart [36] extended the model by including the stress path; Xu et al. [37] developed a probabilistic method to predict εp of UGMs based on the semi-logarithmic model. In addition, a few models in different formulations were also proposed to predict the εp. Lekarp et al. [38] formulated εp using the length of the stress path and shear stress ratio. El-Badawy and Witczak [39] predicted εp as a function of stress state, plasticity index, resilient response, saturation degree, N, fine contents, and material strength. Xiao et al. [40] proposed a unified prediction model of εp using the imaging-based morphological indexes of aggregate and concept of shear stress ratio.
The existing methods generally predict the εp well within small loading cycles. However, they may overestimate the εp of UGMs under large loading cycles because most of them demonstrate a monotonic increasing relationship between εp and N, which is contrary to the fact that the rate of εp of stable specimens gradually declines and finally ceases when the material enters a shakedown state [4,16,41]. Moreover, comparing with predicting the development trend of εp, it is more practical to evaluate the final accumulative deformation of the UGM layers in the design of a railway subgrade.
In this study, the dynamic stability of an UGM under long-term dynamic loading was investigated by a series of large-scale cyclic triaxial tests. The main influencing factors and their influencing extent regarding the dynamic stability of the UGM were identified by grey relational analyses of the test results. Then, a data processing method in combination with a back-propagation (BP) neural network is introduced, from which an approach is developed to evaluate the σcri (considering the effects of σ3 and w) and final εp (εs, considering the effects of σ3, w, and σd) of the UGM, where the analyzed results demonstrated that the developed method can effectively describe the linear/non-linear behavior of σcri and εs regarding the confining pressure (σ3) and/or dynamic deviator stress (σd).

2. Test Materials and Methods

The tests were performed using a UGM consisted by fine particles, sand, and gravel. The particle size (d) gradation curve of the UGM is presented in Figure 1. The specific gradation properties of the UGM are d60 = 6 mm, d30 = 0.75 mm, d10 = 0.066 mm, dmax = 50 mm, Cc = 1.42, and Cu = 80, where d60, d30, d10, dmax, Cc, and Cu are the particle diameters corresponding to 60%, 30%, and 10% finer, maximum diameter, coefficient of curvature, and coefficient of uniformity, respectively. The tested UGM is categorized as a Group A subgrade bed filling in line with a railway standard of China [42] and belongs to the silty gravel group by following the Unified Soil Classification System of ASTM D2487-17e1 [43].
The compaction curve of the UGM was tested by following the ASTM D1577-12 compaction standard using the modified proctor [44], as presented in Figure 2. In the compaction test, the UGM with different moisture contents was compacted using modified proctor with straightforward compaction energy, and the moisture contents after compaction were measured. Figure 2 also presents the zero air void curve of the UGM and basic physical parameters of each group of compacted material, including the specific gravity (Gs), final void ratio (e), and final saturation degree (Sr). Meanwhile, it can be determined from the compaction curve that the optimal moisture content (wo) and maximum dry density (ρdmax) of the UGM are 6.2% and 2.21 g/cm3, respectively.
Large-scale cyclic triaxial test equipment was used to perform the tests, which mainly consisted of a confining cell and a loading frame. The loading frame can generate dynamic or monotonic loadings on the tested specimens, of which the maximum loading value is 50 kN; the test device can therefore conduct both cyclic and static triaxial tests. Figure 3 presents a photograph of the used test device, where the displacement gauge installed on the actuator has a precision of 0.01 mm, and variations in the specimen axil displacement during the test were recorded using a computer linked to a data logger.
The prominent advantage of the test equipment is that it can facilitate tests on subgrade soils with large particle sizes. According to the ASTM D7181-20 standard [45], the diameter of specimens is required to be no less than six times the dmax of the soil for reducing the size effects of specimens on the test data. Currently, a large proportion of triaxial devices are manufactured for conducting tests with soil specimen diameters less than 150 mm (e.g., 39.1, 50, 100 and 150 mm) [46,47,48,49]. However, the dmax of UGMs used as railway subgrade fillings is generally within the range of 50–60 mm as specified by a railway standard of China [42]. Therefore, regular cyclic triaxial devices cannot satisfy the requirement on the ratio of specimen diameter to dmax. The used test equipment can facilitate tests of specimens with a diameter of 300 mm. The ratio of specimen diameter to dmax is therefore six in the present study, which satisfies the specification of ASTM D7181-20 standard [45].
Consistent compaction efforts were adopted in preparing the cyclic triaxial test specimens to ensure the reliability of test results. Similar to the compaction test, the UGM was first scattered, and then mixed by adding distilled water to reach the optimal moisture content and kept in a hermetic plastic bag to humidify for more than 48 h to homogenize the moisture content. The height and diameter of the specimens were 300 mm and 600 mm, respectively. To ensure the consistence of the prepared specimens, it was required to control the moist mass added, the thickness of each compacted layer, and the compaction efforts. In this study, the UGM with optimal moisture content was compacted into a steel specimen preparation mold by six layers, with each layer having the same moist mass of 16.065 kg. Then, each incompact layer was compacted to a target thickness of 100 mm using a 17 kg steel impact hammer with a drop distance of approximately 500 mm, to attain a target compaction degree of 0.97. It should be noted that keeping consistent layer moist mass added, consistent compaction layer thickness, and consistent impact hammer mass and drop distance (i.e., compaction efforts) is helpful to ensure the consistency of the triaxial UGM specimens.
Both optimal moisture content and saturation specimens were tested in the cyclic triaxial tests. The specimens with optimal moisture content were achieved by controlling the amount of distilled water added in the UGM, which corresponded to a saturation degree of 79.4%, as presented in Figure 2. The full saturation of UGM specimens was achieved by the following steps: (1) the specimens were firstly pre-saturated using vacuum suction for 2 h; (2) further saturation of the UGM specimens was achieved by injecting compressed carbon dioxide (CO2) and then distilled water from the bottom to the top of the specimens with a small confining pressure to reach a stationary flow state; (3) finally, back pressure was applied to reach a minimum pore pressure coefficient value of 0.95. Similar methods to ensure full saturation of specimens were also reported and recommended by Mehdizadeh [50].
In this study, 28 large-scale cyclic triaxial tests were performed, and the specific test schemes are listed in Table 1. Based on the field data reported by the China Academy of Railway Science, the maximum dynamic stress of railway subgrades is discrete in a range of 35–185 kPa when the train axle load is within 19.6–22.5 t [51]. Moreover, to consider a future developing trend that the heavy-haul train axle load will increase up to 35 t and investigate the σcri of the UGM, this study expanded the value range of the deviator stress σd. Specifically, the range of σd for the tested saturation specimens and optimal moisture content specimens are 50–250 kPa and 100–400 kPa, respectively. Moreover, the operation speed of heavy-haul freight trains is much less than the normal and high-speed passenger trains; for instance, the operation speed of heavy-haul freight trains in China is mainly in the range of 20–80 km/h [52,53,54], and the freight train speed in Australia is generally within 40–80 km/h [55,56]. The wagon length of freight trains in China is 12–14 m [57]. In the cyclic triaxial tests, a 1 Hz sine-wave cyclic deviator stress was applied by closing the drainage valve, which corresponded to a typical operation speed of 50 km/h for the heavy-haul freight train in China. A 15 kPa initial static deviator stress (σsi) was applied prior to the application of σd [42], to simulate the vertical stress resulted by the rail, sleeper, and ballast. More detailed introduction regarding the test method and procedures can refer to the study of Xu et al. [37]. Figure 4 presents the schematic dynamic loading curve applied in the cyclic triaxial tests. The tests were terminated when the specimens were destroyed or the εs was achieved. Based on a few preliminary tests, the specimen was considered to be destroyed when the accumulative plastic strain reached 15%, and when the accumulative plastic strain was lower than 10% and its increment within 2 h was less than 1 mm, the specimen was deemed to attain a shakedown state in which the further plastic strain increments are negligible.

3. Results and Discussion of Accumulative Plastic Strain Curves

Figure 5 and Figure 6 present the variation curves of the accumulative plastic strain εp with cycle number N of saturation and optimal moisture content specimens, respectively, where different curves correspond to different σd.
It can be observed that the εp and its rate decline with an increase in σ3 but increase with the increase in σd. Hence, the confining pressure and dynamic deviator stress have significant impacts on the development of εp of the UGM. The values of εp are generally greater than those reported in the existing literature [46,47,48,49]. One possible reason is that the tested confining pressures are relatively small comparing with existing studies. The low confining pressures tested in the present study can appropriately simulate the stress states of the subgrade soils in the field. The confining pressure of the subgrade soils can be approximately estimated as
σ3 = K0(σsi + γh)
where K0 is the coefficient of lateral earth pressure and a value of 0.8 is generally adopted [58], γ is the unit weight of the subgrade soil and a value of 22 kN/m3 is generally acceptable, and h is the depth. The subgrade bed layers of a railway embankment generally have a thickness of 2.5 m [42]. As a result, the confining pressure of the subgrade bed layers is generally within the range of 12–56 kPa. Therefore, the confining pressures of 15, 30, and 60 kPa were selected to simulate the stress states of the UGM in the field.
Based on the variation tendencies of the accumulative plastic strains in Figure 5 and Figure 6, the εp versus N curves can be divided into three types, i.e., the stable (class a), failure (class b), and critical (class c) patterns. A stable pattern represents that the growth rate of εp gradually attenuates and finally ceases with the increase in loading cycles. Because of the internal erosion behavior, the fine particles can provide lateral support for the coarse particles, which leads to local particle rearrangement under dynamic loading and compression of the intergranular void [50,59], thus a densification effect would be formed. Finally, a stable UGM specimen enters a dense state in which it can resist the damage effects of the cyclic loading, and no further plastic strain is produced in subsequent loading cycles. By contrast, a failure pattern illustrates that the accumulative plastic strain of the specimen continuously rapidly increases to a εp value greater than 15% within small loading cycles or collapses under σd. In addition, the εp versus N curve of a critical specimen is between the stable and failure patterns, of which the increase tendency of the accumulative plastic strain fluctuates and presents uncertainties with increasing the loading cycles. The dynamic deviator stress with respect to the critical curve pattern is generally designated as the critical dynamic stress σcri of an UGM.

4. Evaluation of Critical Dynamic Stress and Final Accumulative Plastic Strain

4.1. Evaluation of Critical Dynamic Stress

4.1.1. Grey Relation of εpN Curve Pattern Regarding w, σ3, and σd

It can be seen that the εp versus N curve pattern of the UGM is greatly affected by the dynamic deviator stress σd, confining pressure σ3, and moisture content w, as presented in Figure 5 and Figure 6. In this section, the grey correlation theory was used to investigate the correlation degree of εpN curve patterns in regard to the σd, σ3, and w.
Generally, principal component, regression, and variance analyses are commonly used to analyze systems. However, strict requirements should be met when using these methods, including (1) samples to obey typical probability distributions, (2) large size samples to ensure reliable analyses, and (3) a mass of calculations; moreover, the results between the qualitative and quantitative analyses are inconsistent at times, thereby occasionally leading to unreliable conclusions [60]. While the GRA is an advanced system analysis method and extensively employed in medical, economic, engineering, educational, and environmental fields to determine whether data sequences of a system have strong correlations. The method can effectively evaluate systems with small size data, where traditional statistical methods are unsuitable, because small size samples usually involve a great deal of grey information. Furthermore, the GRA has strong nonlinear fitting ability and convenient programming function [61]. The method can determine whether data sequences have strong correlations by comparing the similarity of their geometric curves, and greater similarities imply larger grey relational grades. The GRA does not have traditional demands on data distribution and can evaluate small size samples effectively, which would not generate disagreements between qualitative and quantitative results [60]. A brief introduction regarding the analysis steps of the GRA is as follows:
To perform GRA conveniently, non-dimensional treatment of the feature sequence (Y = (y1, y2, y3, …, yn)) and observation sequences (Xi = (xi1, xi2, xi3, …, xin), i = 1, 2, 3, …, m) is carried out by normalizing the sequences using the initial values as
X i = X i / x i 1 = ( x i 1 ,   x i 2 ,   x i 3 , x i n ) ,   i = 1 ,   2 ,   3 , m
Y = Y / y 1 = ( y 1 ,   y 2 ,   y 3 , y n )
The grey correlation coefficient (γij, i = 1, 2, 3,…m, j = 1, 2, 3, …, n) between yj and xij is calculated as
γ i j = min m i = 1 min n j = 1 x i j y j + ξ max m i = 1 max n j = 1 x i j y j x i j y j + ξ max m i = 1 max n j = 1 x i j y j
where ξ denotes a discriminant coefficient within the range of 0 to 1, and generally the value of ξ is taken as 0.5 [60,62,63,64]. The grey relational grade (γi) between Y and Xi is formulated as
γ i = 1 n j = 1 n γ i j
In this study, the sequence composed of the values of an index parameter (β) that denoting the εp versus N curve pattern was designated as the feature sequence Y1, where β values of 1.0, 2.0, and 3.0 were allotted to the stable, critical, and failure patterns, respectively, according to the recommendations of Javed et al. [65], Wu et al. [66], and Liu et al. [67]. In addition, the data sequences composed of moisture content w, confining pressure σ3, and dynamic deviator stress σd are termed as the observation sequences X1, X2, and X3, respectively. The computed values of the grey correlation coefficients γ1j, γ2j, and γ3j are presented in Table 2, and the grey relational grades (γ1, γ2, and γ3) of β regarding w, σ3, and σd obtained by Equation (5) are 0.809, 0.745, and 0.720, respectively. Generally, the feature sequence is considered to be strongly correlated with the observation sequences if the calculated grey relational grade exceeds 0.6, as recommended by previous studies [62,63,64,68]. Therefore, it is considered that β (i.e., the curve pattern) is closely related to w, σ3, and σd. In addition, slight differences appear among γ1, γ2, and γ3, implying that w, σ3, and σd have approximate importance degree on determining the εp versus N curve patterns of the UGM.

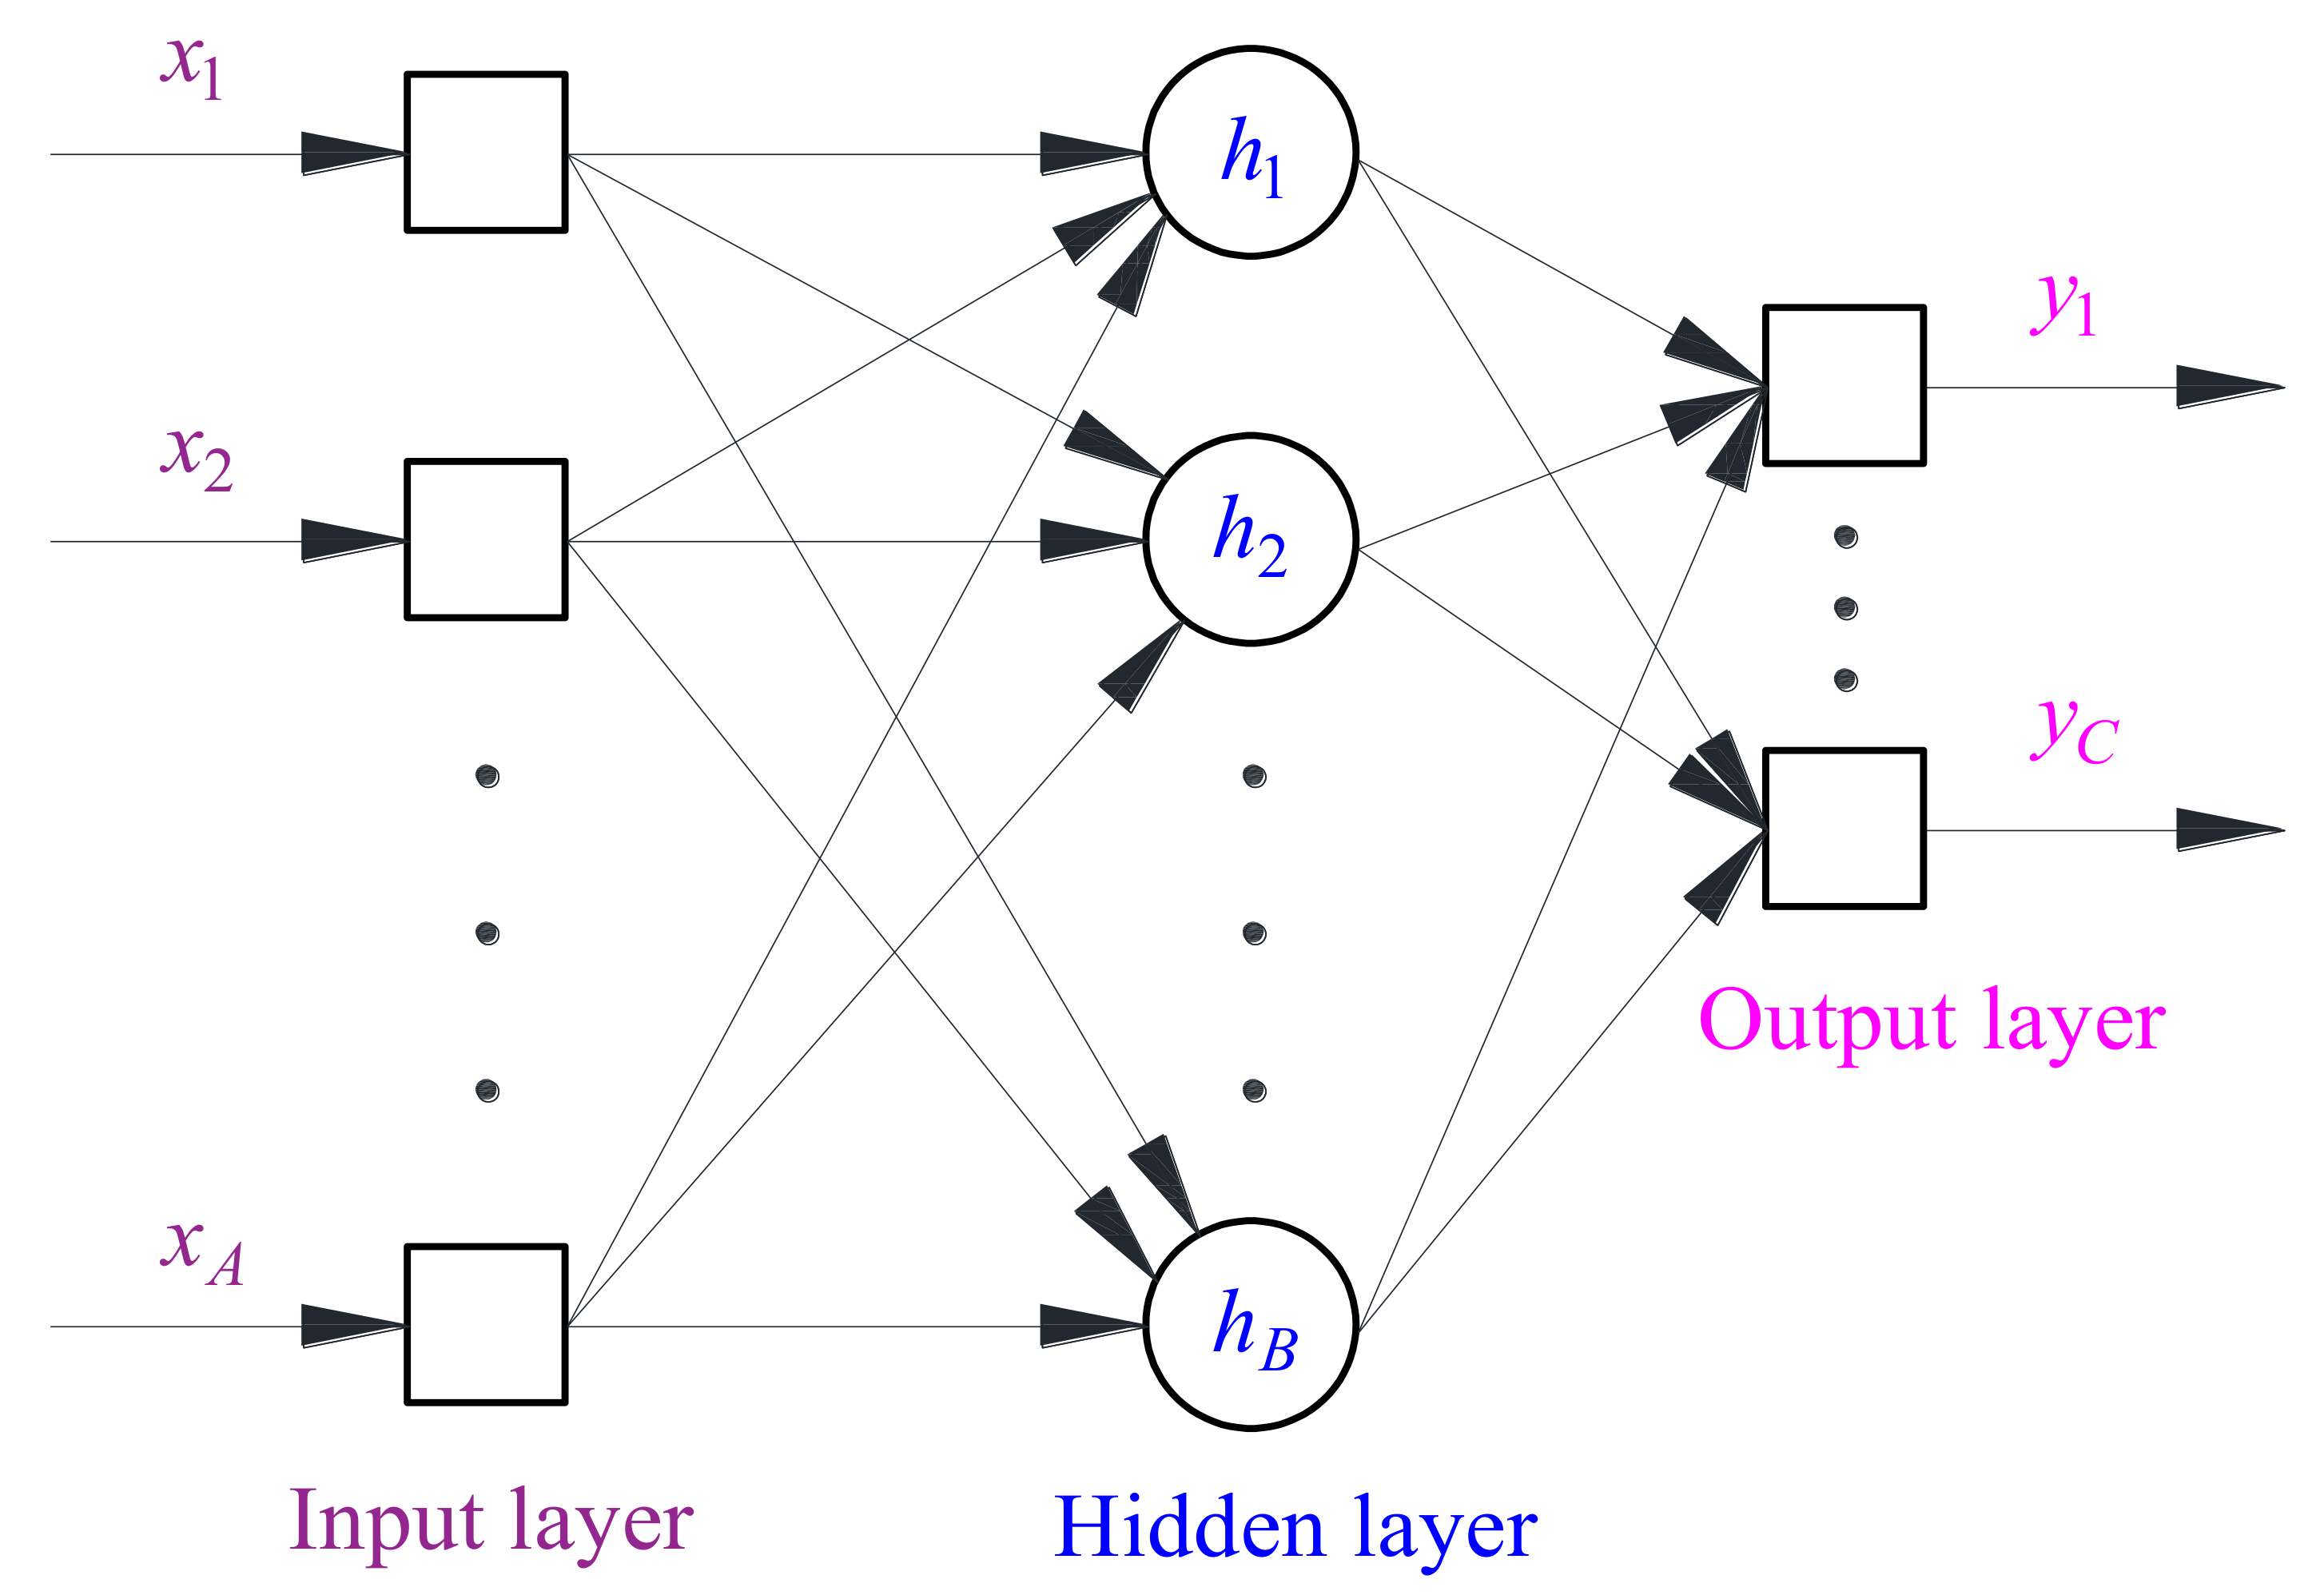
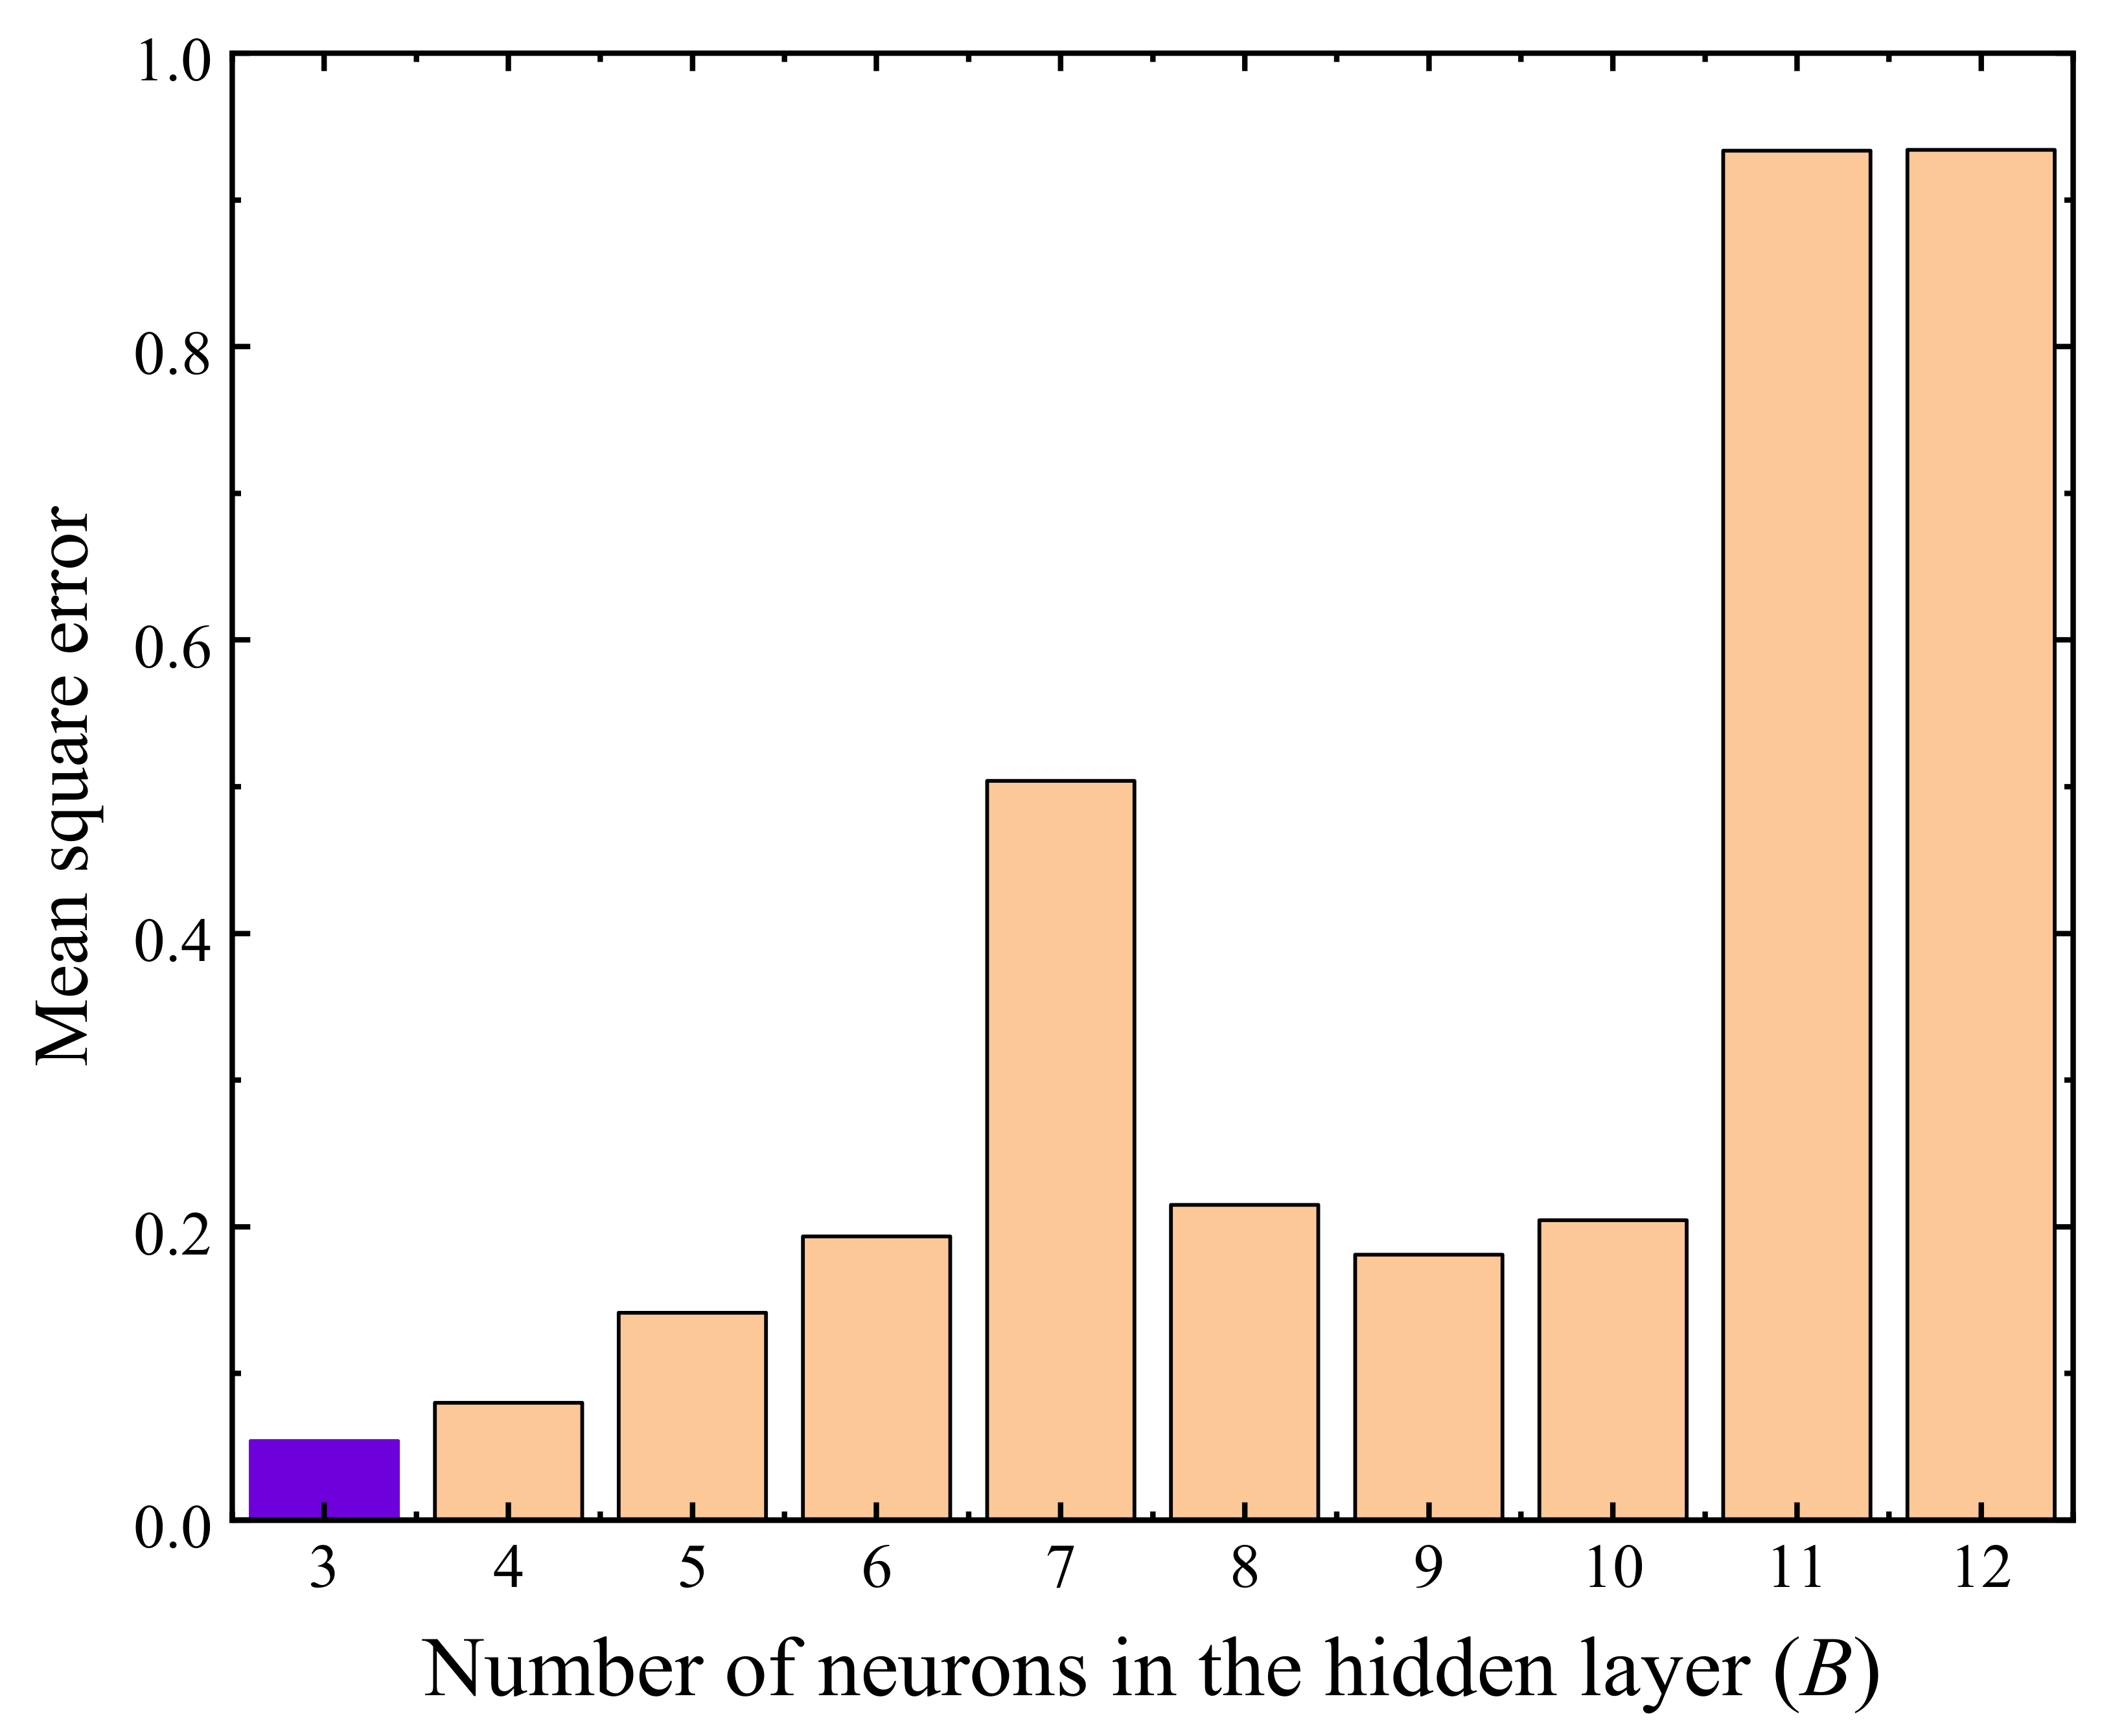
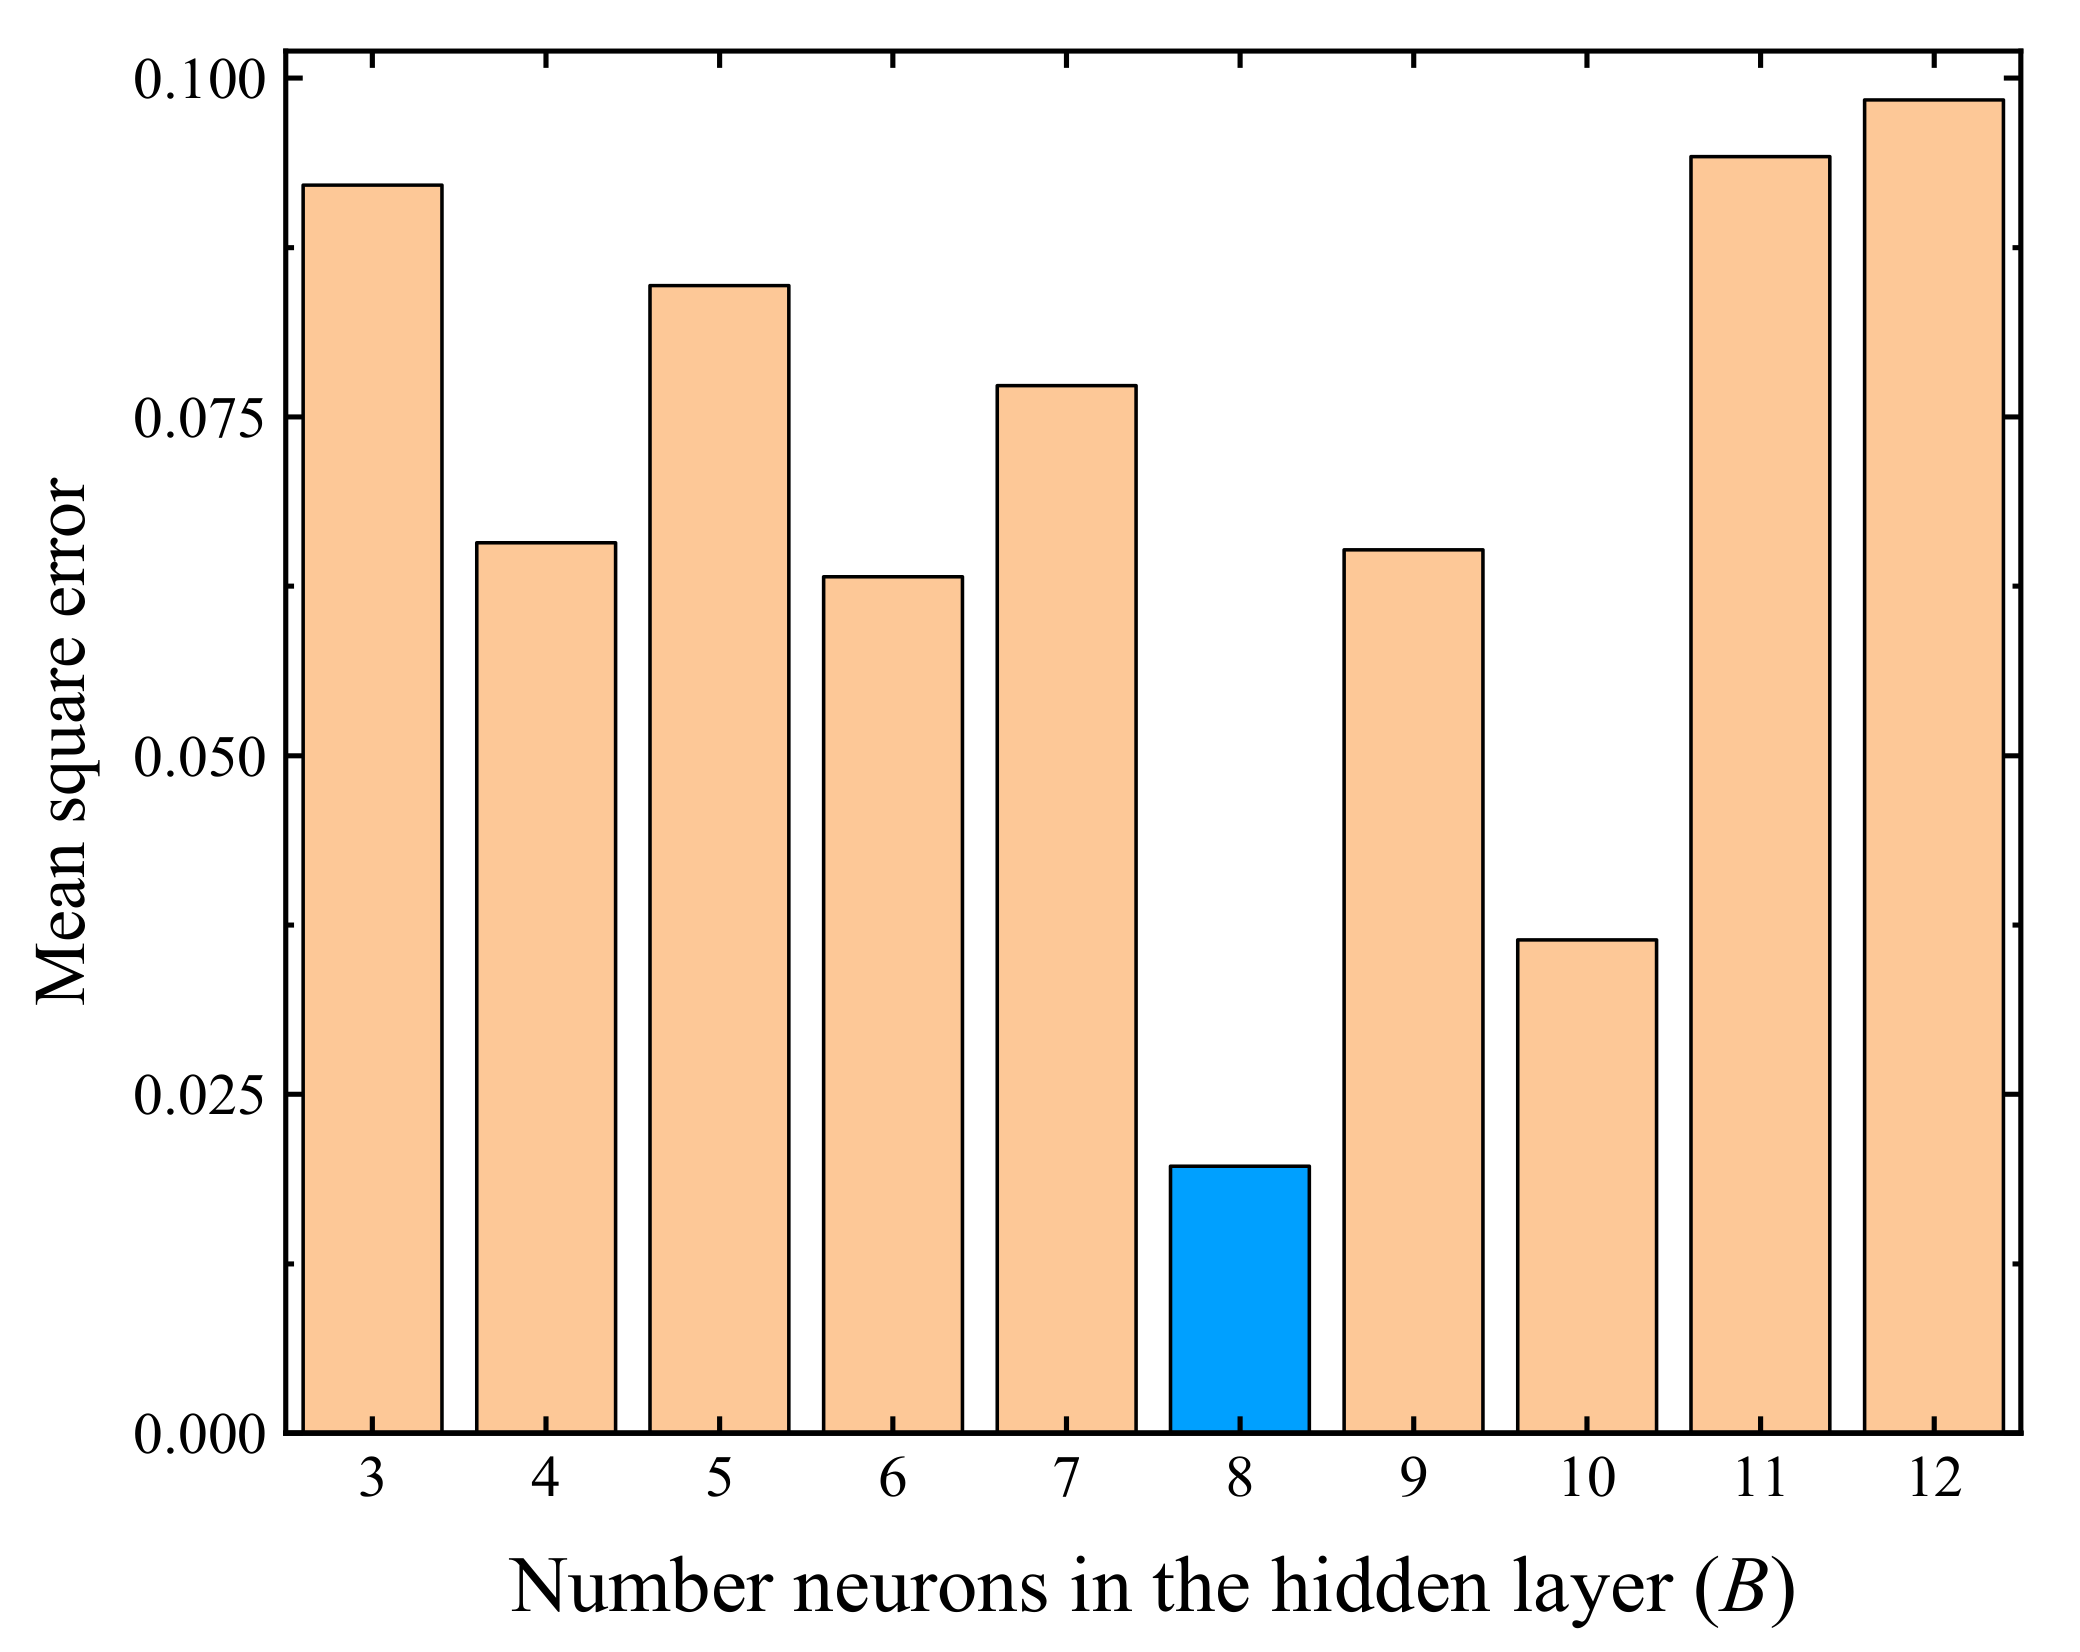
4.1.2. Analysis of Specimen Pattern using the BP Neural Network

Most existing empirical models for the critical dynamic stress and cumulative plastic strain of subgrade soils are based on explicit analyses of limited test results. However, the σcri and εs of an UGM may have considerable non-linear correlations with influencing factors such as the w, σ3, and σd, and the correlations are generally difficult to be identified by explicit analyses of the test results. In this study, the BP neural network was used to analyze the specimen pattern based on the MATLAB (version R2018b) platform. The MATLAB is a powerful and high-performance programming tool for technical computation, which integrates computation, visualization, and programming in a user-friendly environment [69]. The BP neural network generally consists of an input layer, several hidden layers, and an output layer, which exhibits strong non-linear mapping functions on multi parameters. Consequently, the BP neural network is appropriate for analyzing the σcri and εs of the UGM, and the developed empirical model is considered capable to effectively reflect the relationships of σcri and εs in regard to the σ3 and σd.
The BP neural network used in this study is a special machine learning method which focuses on intelligent predictions rather than improvements of computer algorithms, therefore the required amount of training data can be less than the traditional machine learning techniques, and a few studies have shown that training data with a size around 20 can yield acceptable training results [70,71,72,73,74]. The present study performed 28 cyclic triaxial tests on the UGM. Figure 7 presents a topological graph of a BP neural network that includes a hidden layer, in which the numbers of neurons in the input, hidden, and output layers are denoted by A, B, and C, respectively. The neurons in the input layer are specified as w, σ3, and σd, while the neuron in the output layer is specified as the index parameter β, therefore A = 3 and C = 1 in the present study.
When the neurons in the input layer are assigned a data set regarding the w, σ3, or σd, the neurons in the hidden and output layer(s) will generate values by following a transfer function, and the yielded values of the neuron in the output layer are the evaluated values of β. In the self-training of a BP neural network, the yielded values in the output layer (i.e., the evaluated values of β) generally exhibit deviations in comparison to the theoretical values or expectations. In this study, the expectations of β are 1.0, 2.0, and 3.0 regarding the stable, critical, and failure specimens, respectively. By inputting a series of data sets that correspond to different test conditions of w, σ3, or σd, the computation of the BP neural network continues until the sum of deviations meets the required precision or the iteration number achieves the maximum. In this study, a sigmoid function was adopted for the transfer function, and the maximum of iterations is 2000. For more details regarding BP neural networks, one can refer to Rumelhart et al. [75].
The number of neurons (i.e., the B value) in the hidden layer(s) is one of the key parameters that could considerably affect the trained neural network. Chen et al. [76] stated that the value range of B can be estimated as
B = A + B + S
where S is a constant that ranges between 1 and 10. The value range of B calculated by Equation (6) is 3–12. The mean square errors (MSE) of the trained BP neural network regarding the variation of parameter B are presented in Figure 8, where the results showed that the MSE attained the minimum value when B = 3, thus three neurons in the hidden layer were adopted in the following analyses.
In training of the BP neural network, a stable specimen with test conditions of w = 6.2%, σ3 = 60 kPa, and σd = 350 kPa (corresponding to a β value of 1.0) and a failure specimen with conditions of w = 9.3%, σ3 = 60 kPa, and σd = 200 kPa (corresponding to a β value of 3.0) were excluded, which were used to verify the reliability of the trained BP neural network later on. Figure 9 presents the output of the trained optimal neural network using the remaining data (including the data of stable, failure, and critical specimens). The figure shows that the evaluated β values are close to theoretical values without data distortion or local minimum problems, and the predicted β values of the two specimens used to verify the trained neural network (data points in the rectangles) also agree well with the theoretical values, indicating that the trained optimal neural network is of acceptable reliability.

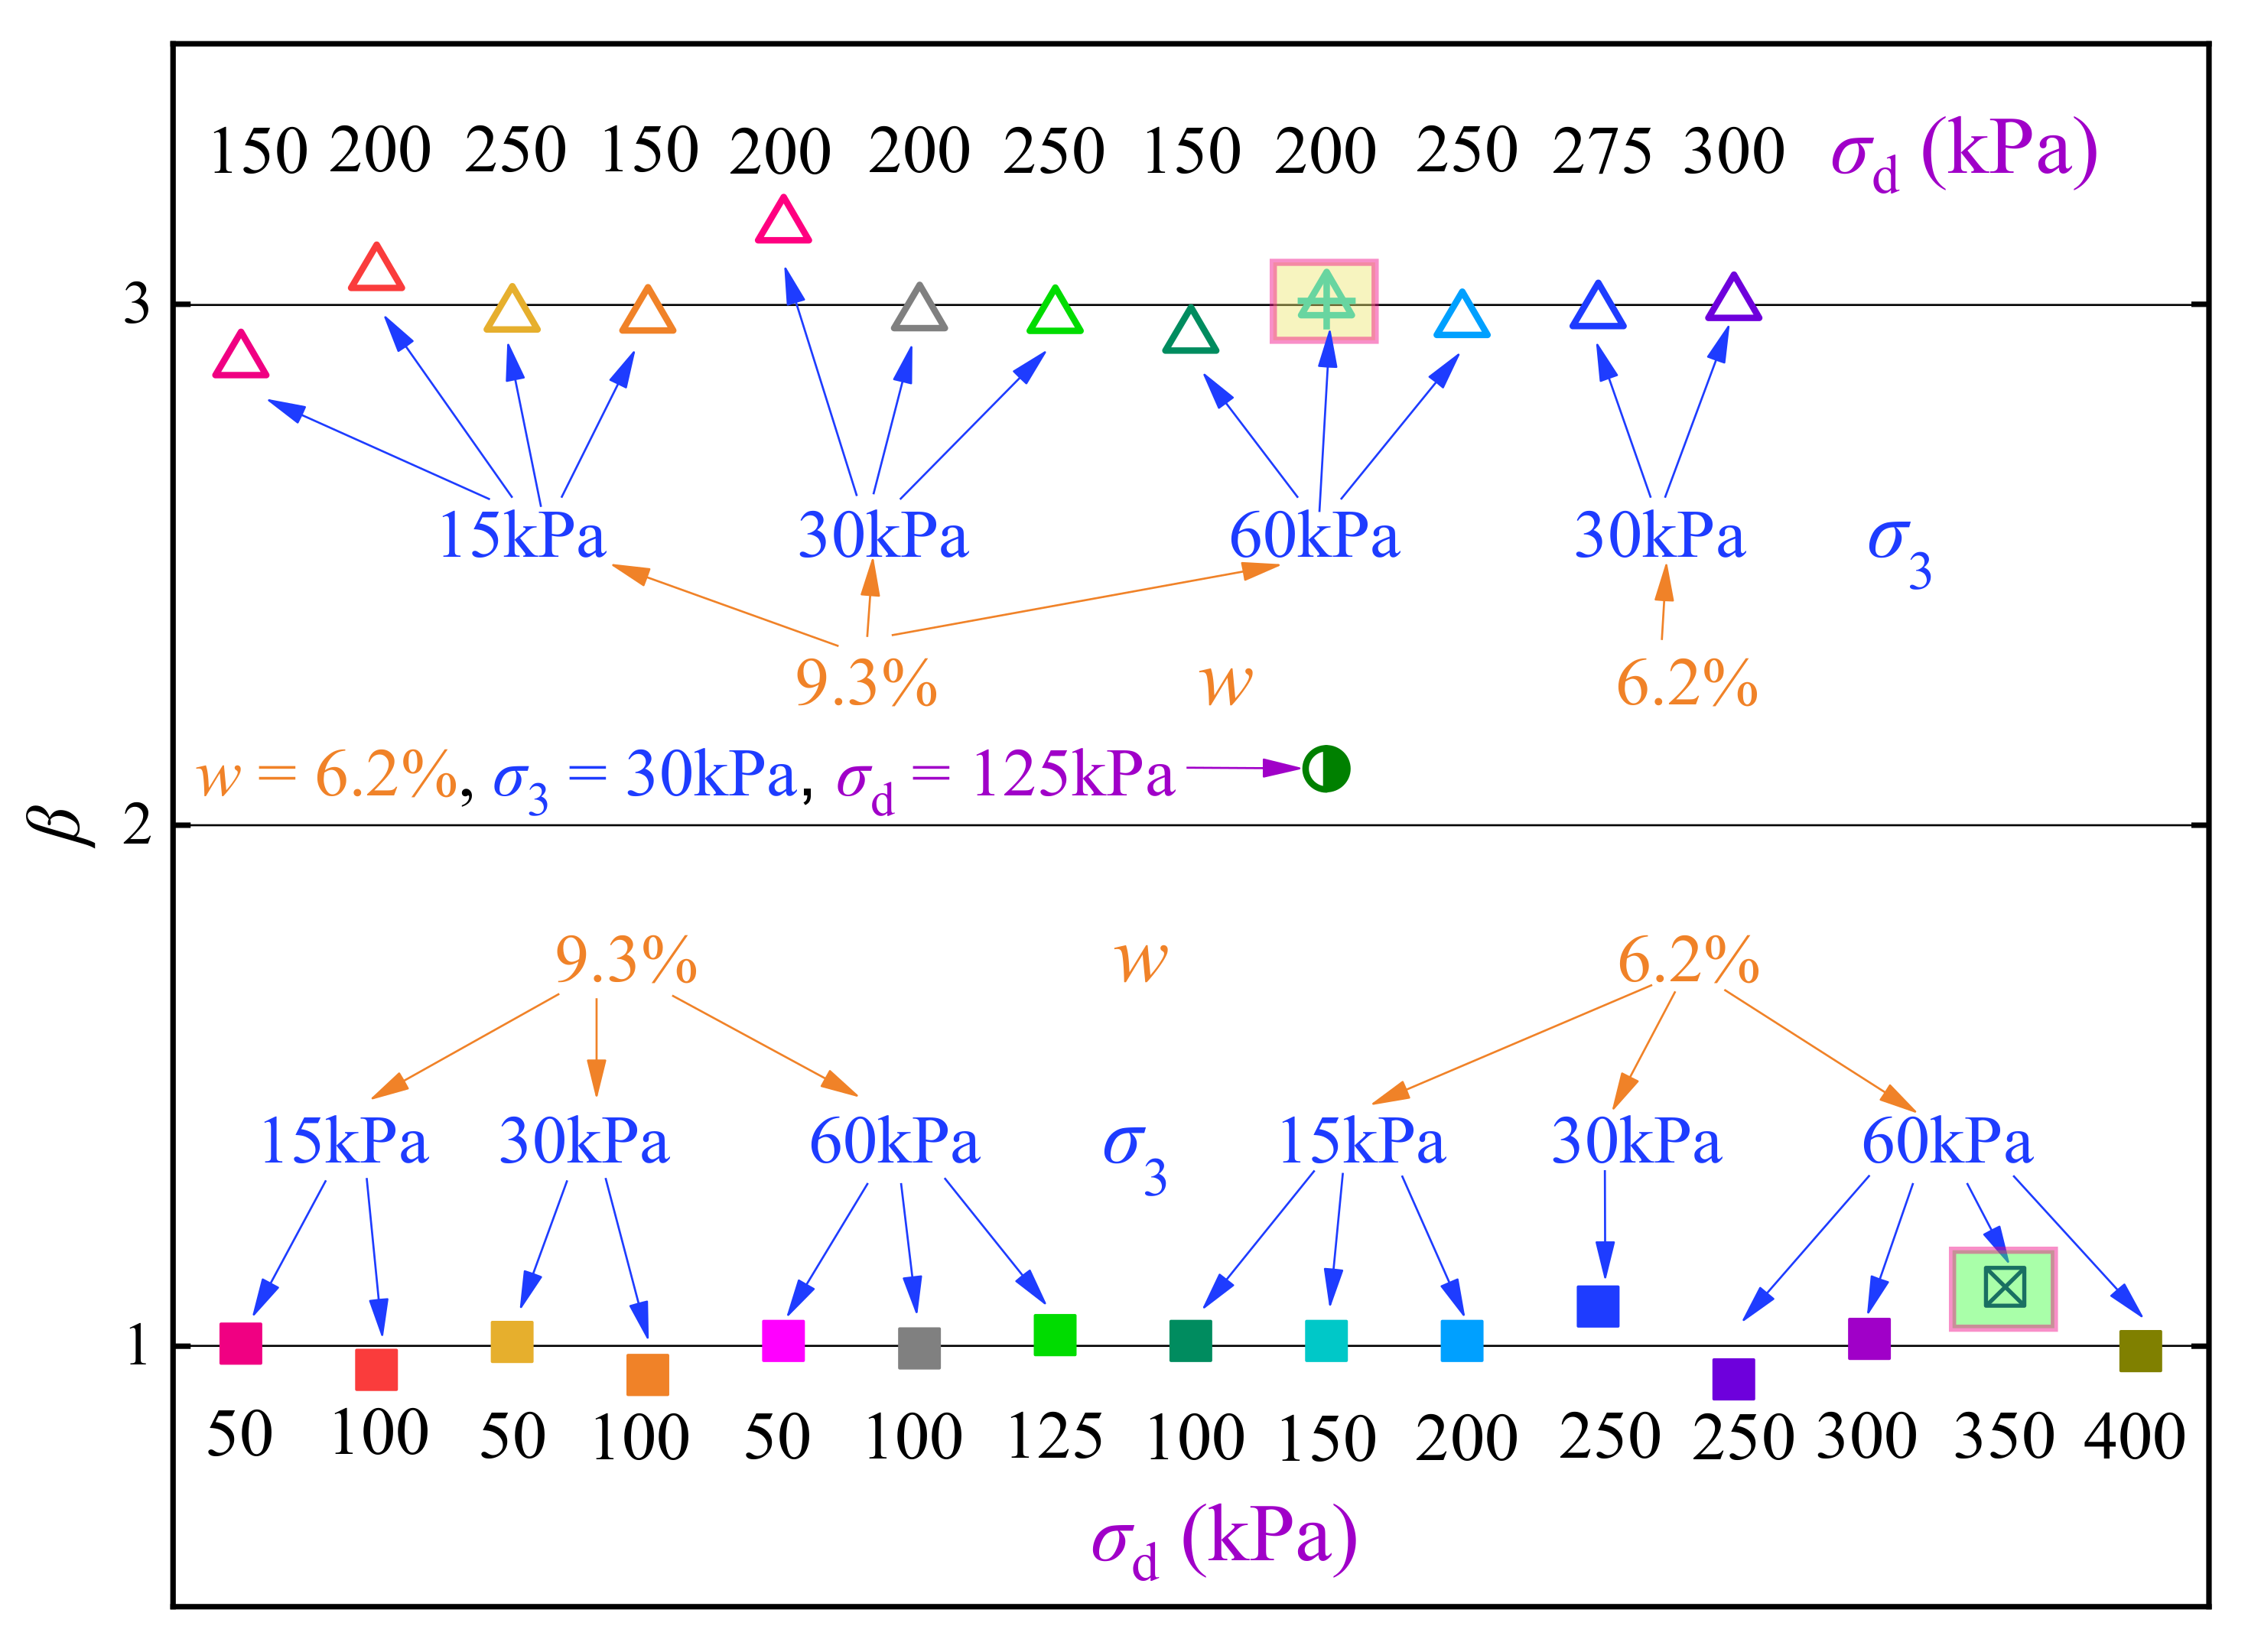
4.1.3. Evaluation of Critical Dynamic Stress Using the Trained BP Neural Network

Evaluations of the σcri under different σ3 were implemented using the trained optimal BP neural network. Predetermined moisture contents and confining pressures were first input as the neuro values in the input layer. Then, the input neuron value with respect to σd is continuously changed until the β obtains 2.0. The final input σd which generates a β value of 2.0 is therefore the evaluated value of σcri with respect to the input w and σ3. The input σ3 is altered within 15–60 kPa by a 5 kPa interval, and the evaluated σcri values using the BP neural network are presented in Table 3.
Variations of the evaluated σcri of the UGM with the confining pressure are illustrated in Figure 10, with different lines corresponding to optimal and saturation moisture contents. It is found that the σcri approximately linearly increases as the confining pressure increases, and the correlation between σcri and σ3 can be formulated as Equation (7), where m and n are fitting parameters. Therefore, it is a feasible method to improve the dynamic stability of a railway subgrade by appropriate techniques (e.g., the prestressed embankment technique [6]) to increase the confining pressure of the subgrade soil. Figure 10 indicates that the σcri of the UGM is also influenced by the moisture content of the UGM. It is therefore considered that the model parameters m and n in Equation (7) could have correlations with the w, and Equation (7) can be reformulated as Equation (8), where f1(w) and f2(w) are functions of w. However, due to the limited moisture contents tested, the expressions of f1(w) and f2(w) are still not clear, and further investigations regarding this topic are desirable in future studies.
σ cri = m × σ 3 + n
σ cri = f 1 w × σ 3 + f 2 w
Dawson et al. [77] reported that the critical total vertical stress (σ1d, the sum of σcri and σ3) of unbound granular subgrade soils can be formulated as
σ 1 d = A σ 1 d / σ 3 B
where A and B are model parameters.
Wang et al. [78] performed cyclic triaxial tests on an UGM, having a similar gradation, of which both the fine contents (less than 0.075 mm) of the materials tested by Wang et al. [78] and this study were around 10%. Wang et al. [78] reported that the values of model parameters A and B are 3838.8 and −1.583 for the UGM. Based on Equation (9), it is deduced that the correlation between the σcri and σ3 of the UGM is as
σ cri = 24.4123 × σ 3 0.6129 σ 3
The functional image of Equation (10) is presented in Figure 11. It is observed that the relationship between σcri and σ3 shows some non-linearity; however, the non-linearity is not discernible when the UGM is in a low confining pressure service state, and can be approximately replaced by a linear relationship with a high determination coefficient (R2) of 0.99, as illustrated in Figure 11. Therefore, it is rational to simplify a linear relationship between σcri and σ3 of an UGM used as subgrade material.

4.2. Evaluation of Final Accumulative Plastic Strain

4.2.1. Grey Relation of εs Regarding w, σ3, and σd

A railway generally has strict requirements on surface deformation; therefore, the failure and critical patterns of the UGM are generally not expected in engineering practice. Consequently, this section primarily focuses on evaluating the final accumulative plastic strain εs of stable specimens (i.e., the class a curves in Figure 5 and Figure 6). The grey correlation theory was used to investigate the correlation degrees of εs in regard to w, σ3, and σd by taking the sequence composed of final accumulative plastic εs as the feature sequence Y2. The computed values of the grey correlation coefficients γ1j, γ2j, and γ′3j are presented in Table 4, and the grey relational grades (γ′1, γ2, and γ3) of εs regarding w, σ3, and σd obtained by Equation (5) are 0.796, 0.733, and 0.724 (larger than 0.6), respectively; therefore, the εs is considered to be closely related to the w, σ3, and σd. Furthermore, slight differences appear among γ′1, γ′2, and γ3, implying that w, σ3, and σd have similar importance degree for the final accumulative plastic strain of the UGM.

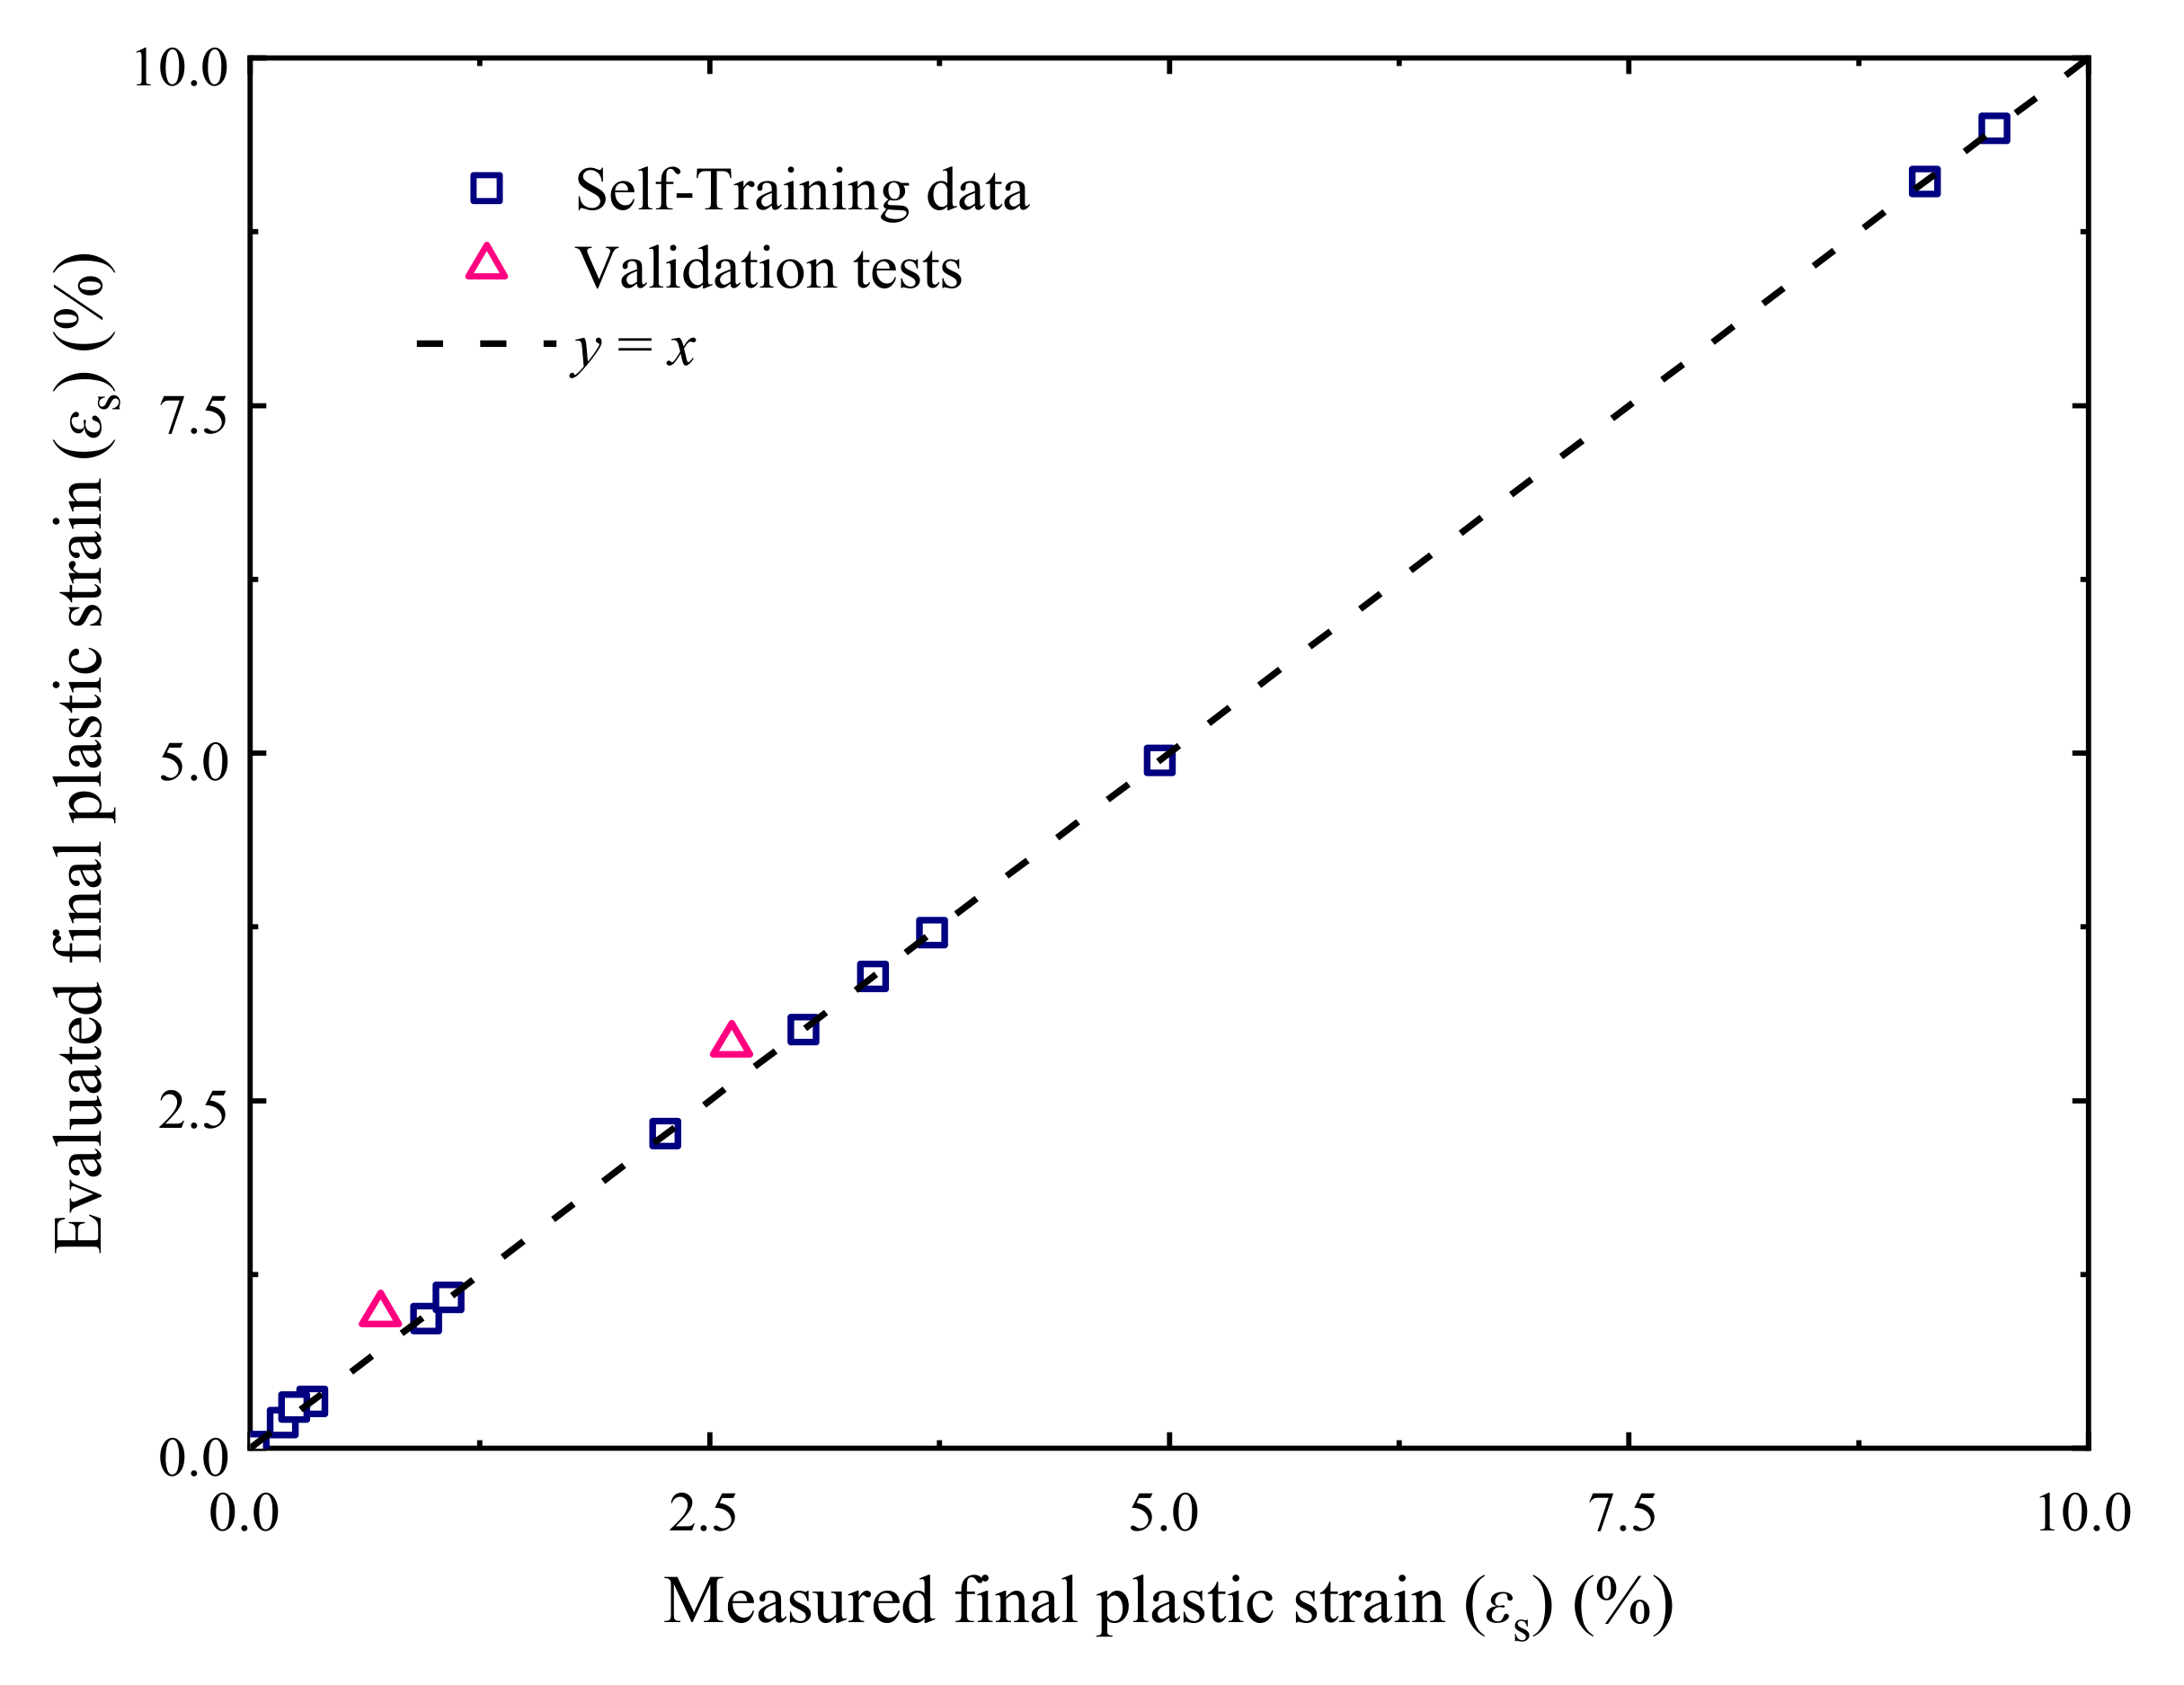
4.2.2. Evaluation of Final Accumulative Plastic Strain Using the BP Neural Network

The test data of stable specimens were used to perform the self-training of the BP neural network, excluding two specimens tested with conditions of w = 6.2%, σ3 = 60 kPa, and σd = 300 kPa (corresponding to a εs value of 2.62%) and w = 9.3%, σ3 = 30 kPa, and σd = 100 kPa (corresponding to a εs value of 0.71%), respectively, which were employed to verify the reliability of the trained BP neural network later on. The variation of the MSE of the trained BP neural network with the parameter B is presented in Figure 12, where the results show that the hidden layer of the optimal BP neural network contains eight neurons. Figure 13 presents the evaluated εs values using the trained optimal neural network, showing that the final accumulative plastic strains generated by the BP neural network agree well with the measured data, and the predicted εs of the two specimens used to verify the trained neural network also close to the measured values (see the triangular points in Figure 13), indicating that the trained optimal BP neural network is of acceptable reliability.
The εs of the UGM under different σ3 and σd can then be evaluated using the trained optimal BP neural network. The relationships of the predicted εs with respect to σd and σ3 are presented in Figure 14 and Figure 15, respectively. It can be found that εs and its variation rate non-linearly increase with increasing σd but non-linearly decrease as σ3 increases. Furthermore, the εs of saturation specimens with low confining pressures (e.g., 15 kPa in Figure 14) starts to increase in a large rate when the dynamic deviator stress exceeds 60 kPa. Freight trains operated in the heavy-haul railway system of China can generally impose a maximum dynamic stress greater than 60 kPa on the subgrade surface [17,57,79,80]. Therefore, keeping sufficient drainage capacity and preventing the subgrade approaching saturation are important in the routine maintenance of a railway. In addition, increasing the confining pressure can efficiently reduce the final accumulative plastic strain of the UGM, especially in low confining pressure conditions as illustrated in Figure 15.

5. Conclusions

The critical dynamic stress (σcri) and accumulative plastic strain (εp) are primary indicators regarding the dynamic stability of unbound granular materials (UGMs). In this study, the dynamic stability of a typical UGM employed in railway subgrade bed construction was investigated by performing a series of large-scale cyclic triaxial tests, while considering the variations of moisture contents (w), confining pressures (σ3), and dynamic deviator stresses (σd). A data processing method in combination with a back-propagation (BP) neural network is developed to analyze the test results, and an effective method is presented to evaluate the σcri and the final εp (εs) of the UGM. The main conclusions obtained are as follows:
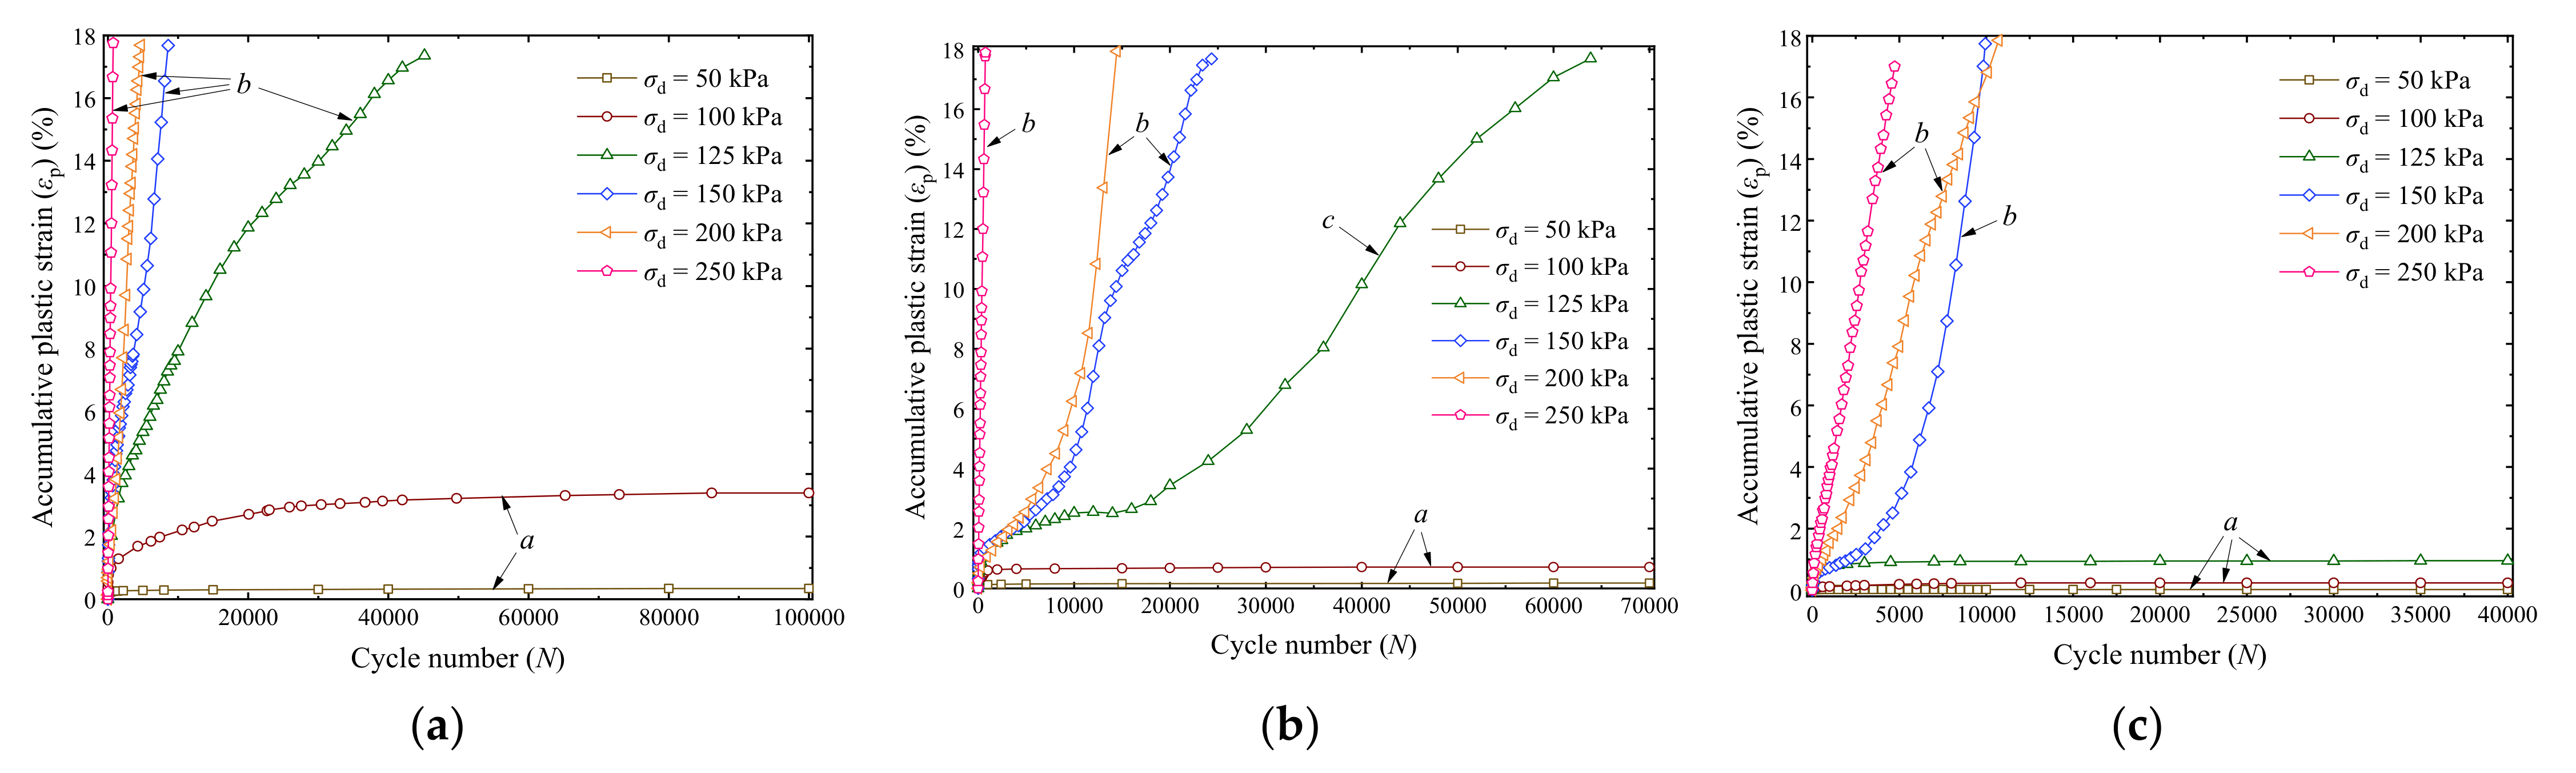
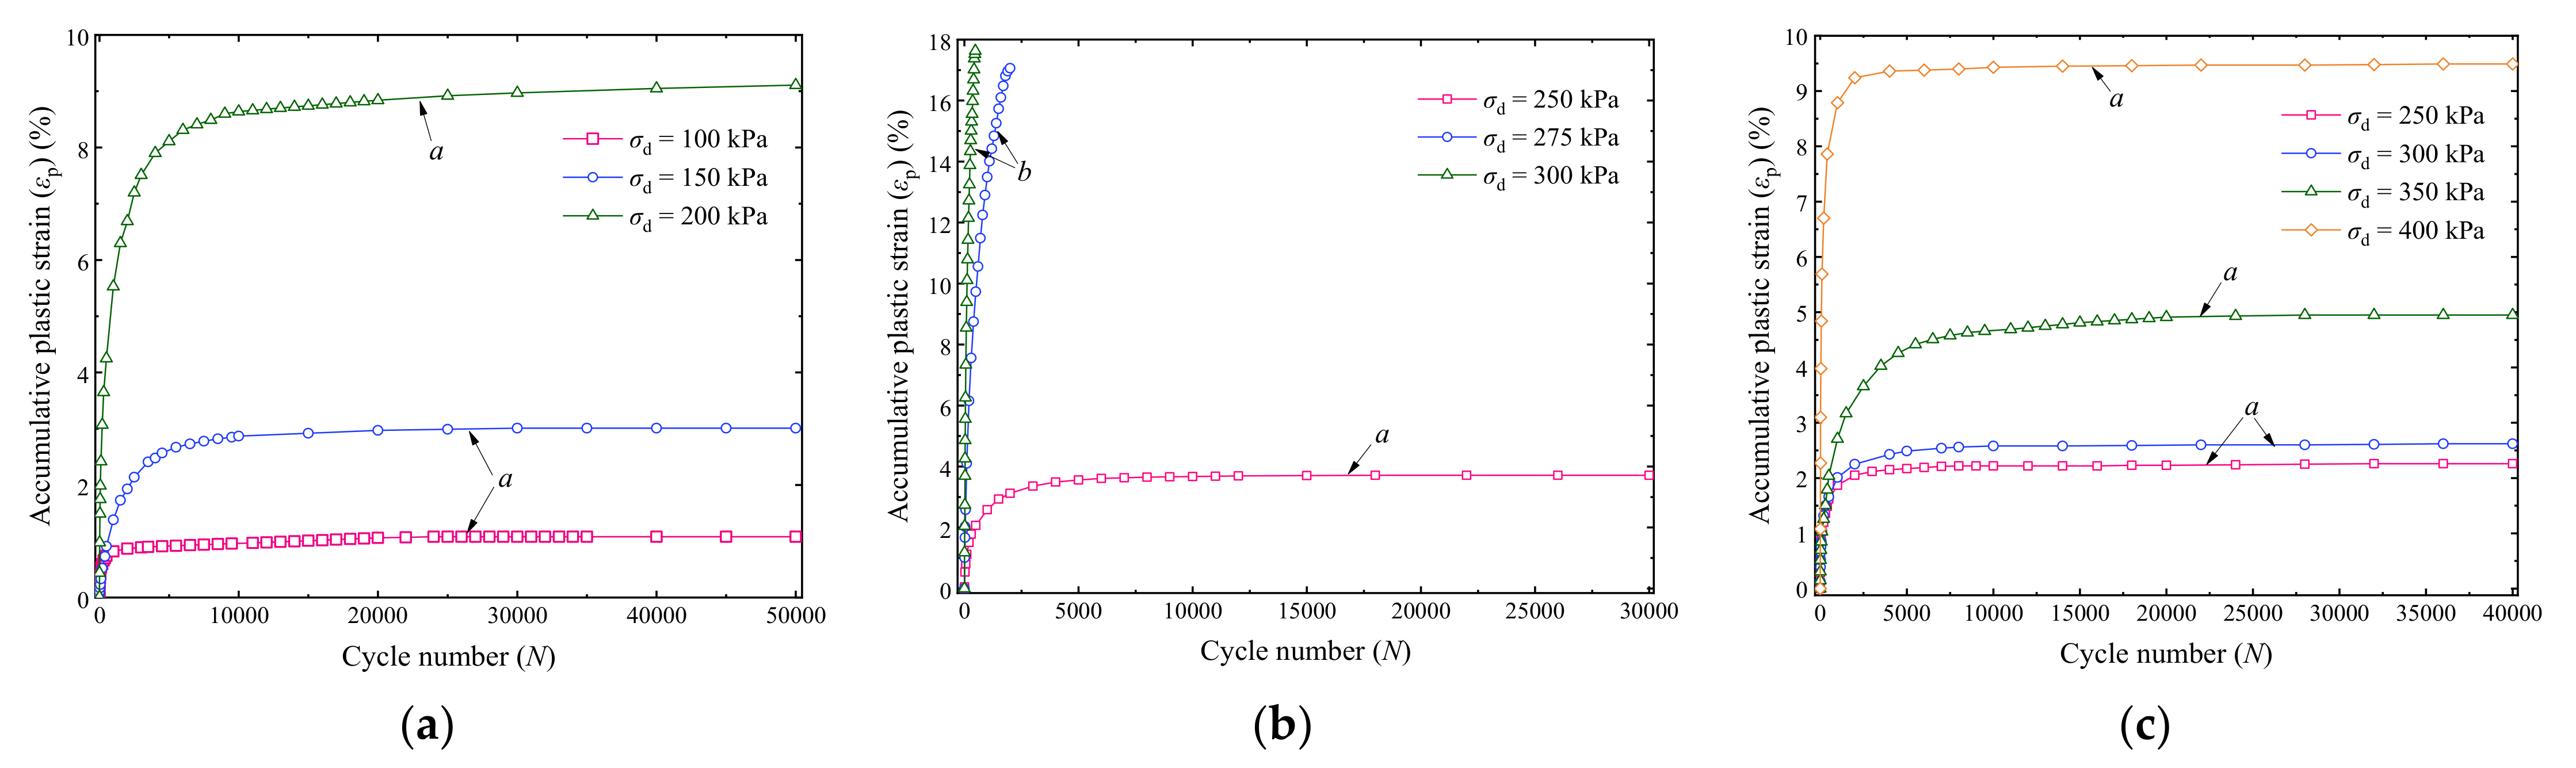
  • The variation curves of εp with cyclic number (N) can be categorized into stable, failure, and critical patterns, and the grey relational analyses shown that the curve patterns and final accumulative plastic strain εs of stable specimens are closely related to the w, σ3, and σd. In addition, the analyzed grey relational grades were in a narrow range of 0.72 to 0.81, demonstrating that the w, σ3, and σd have similar importance degrees in determining the εp versus N curve patterns and the values of εp of the UGM.
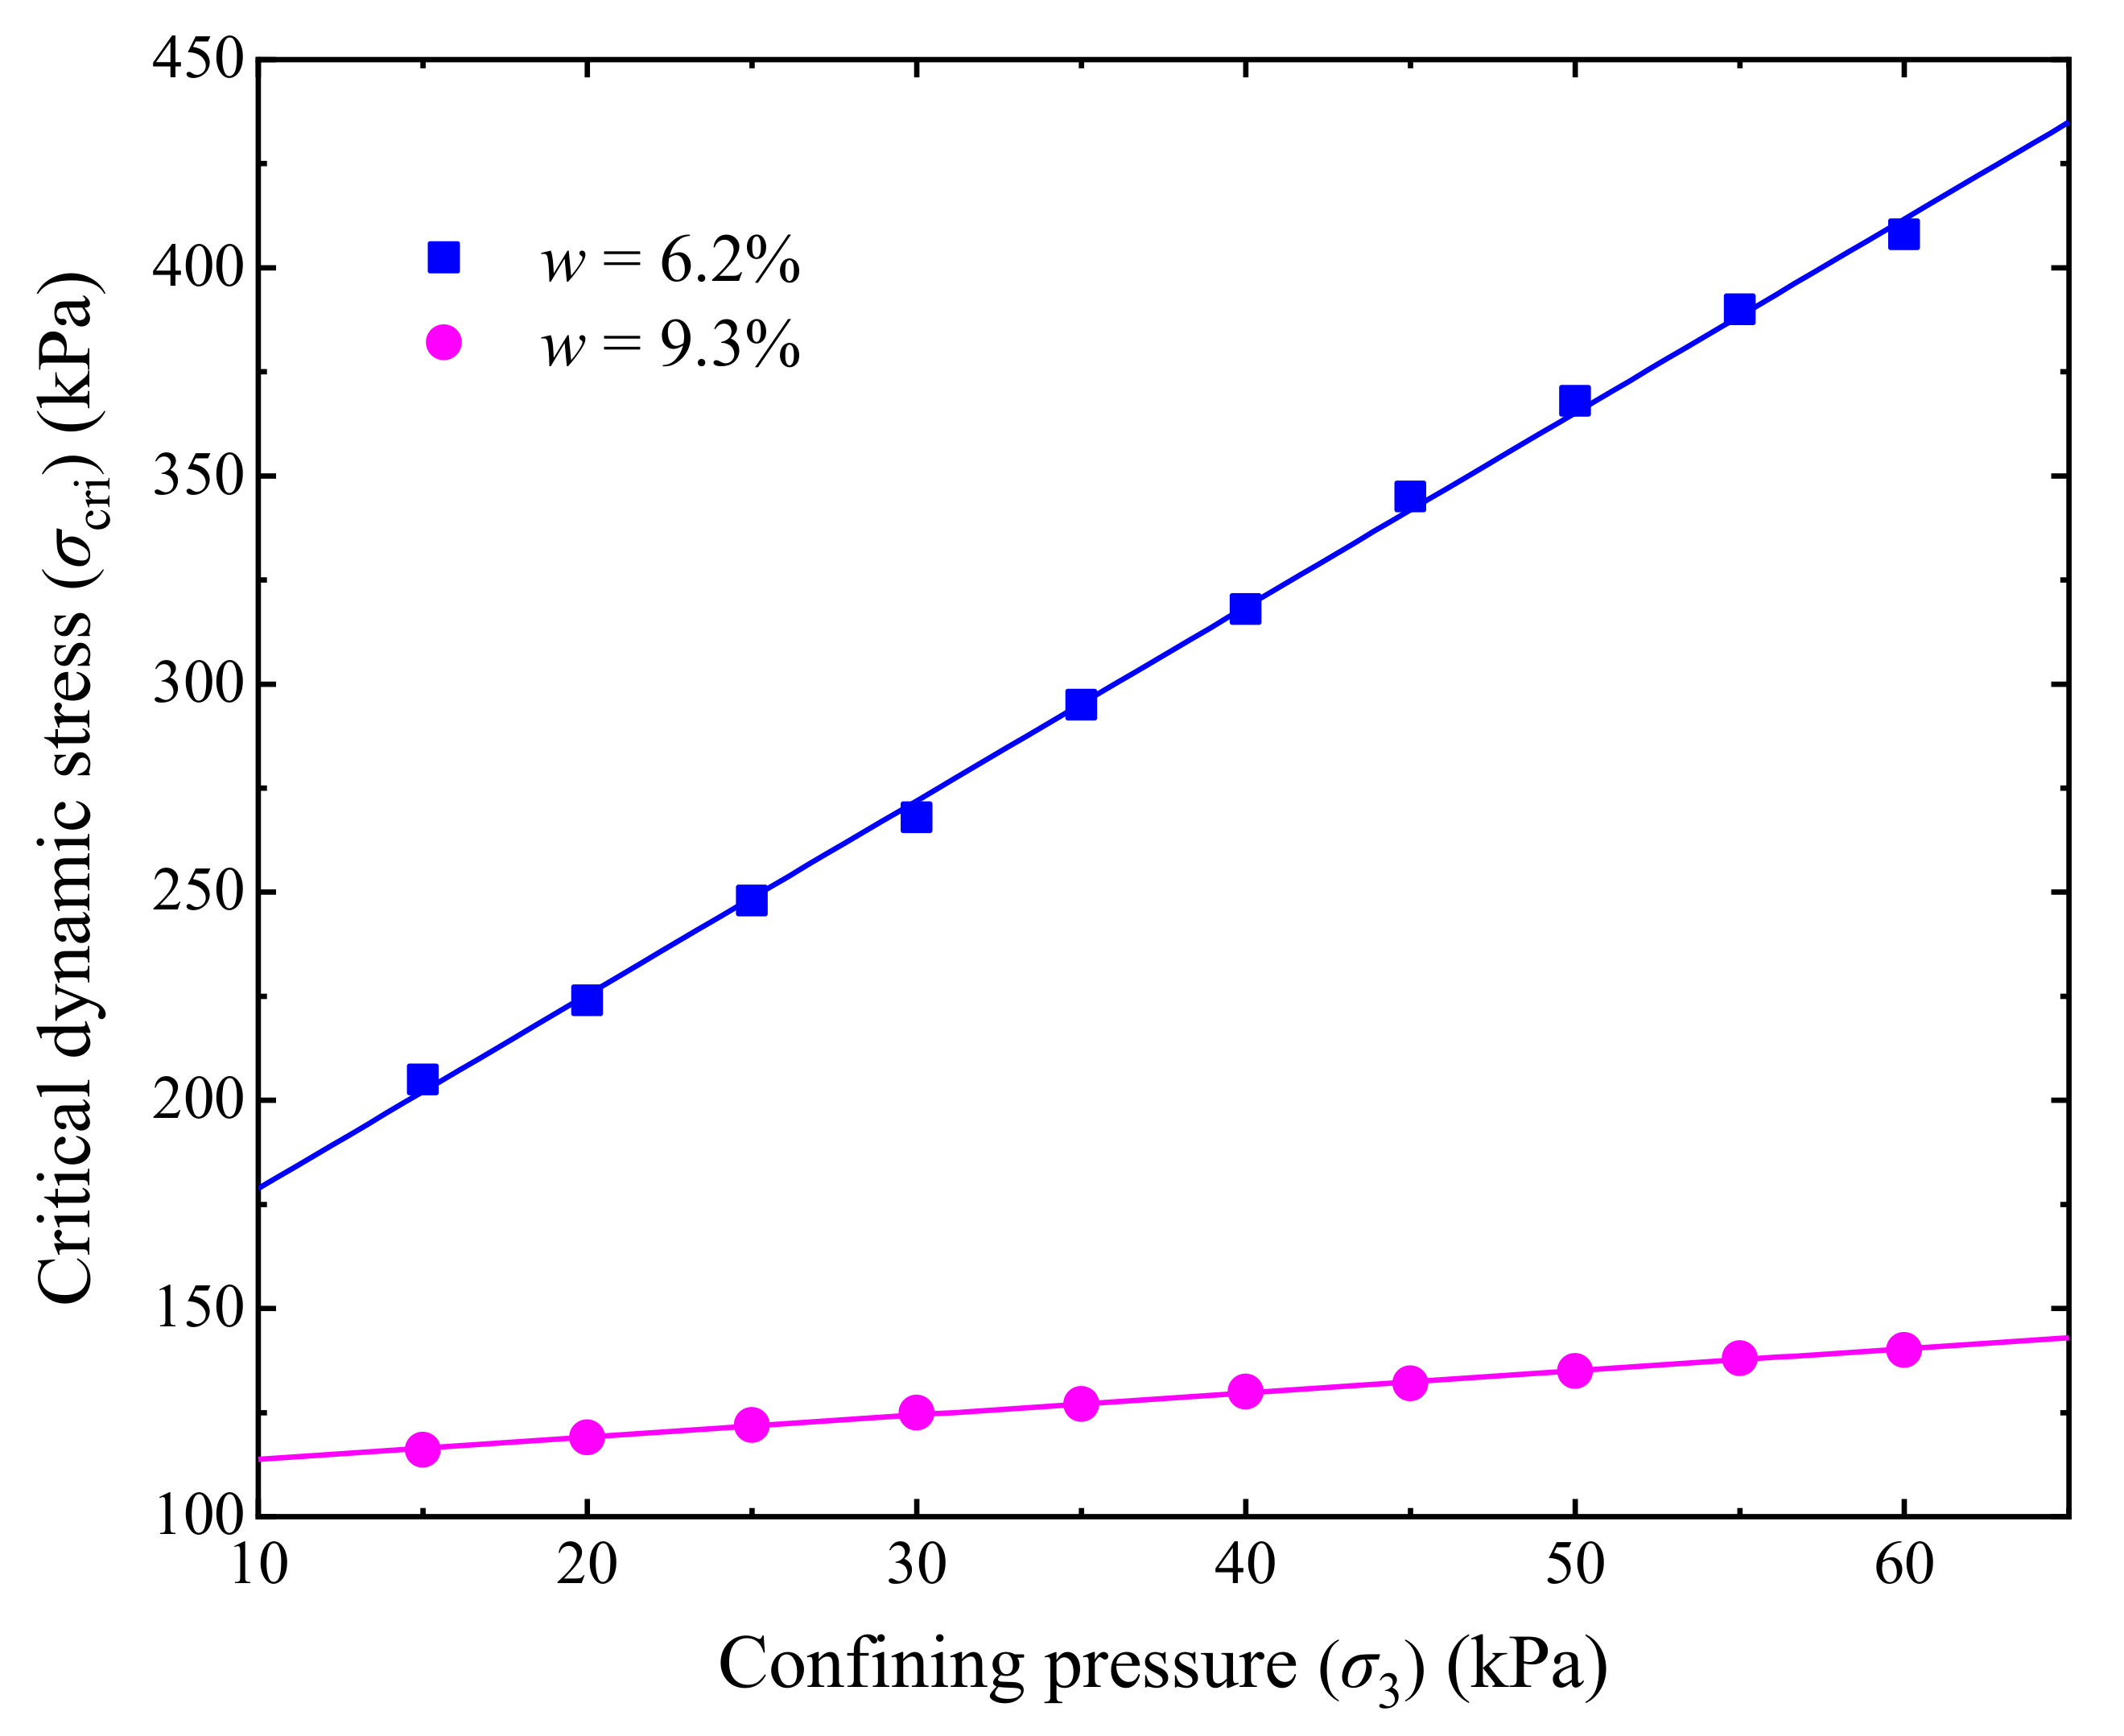
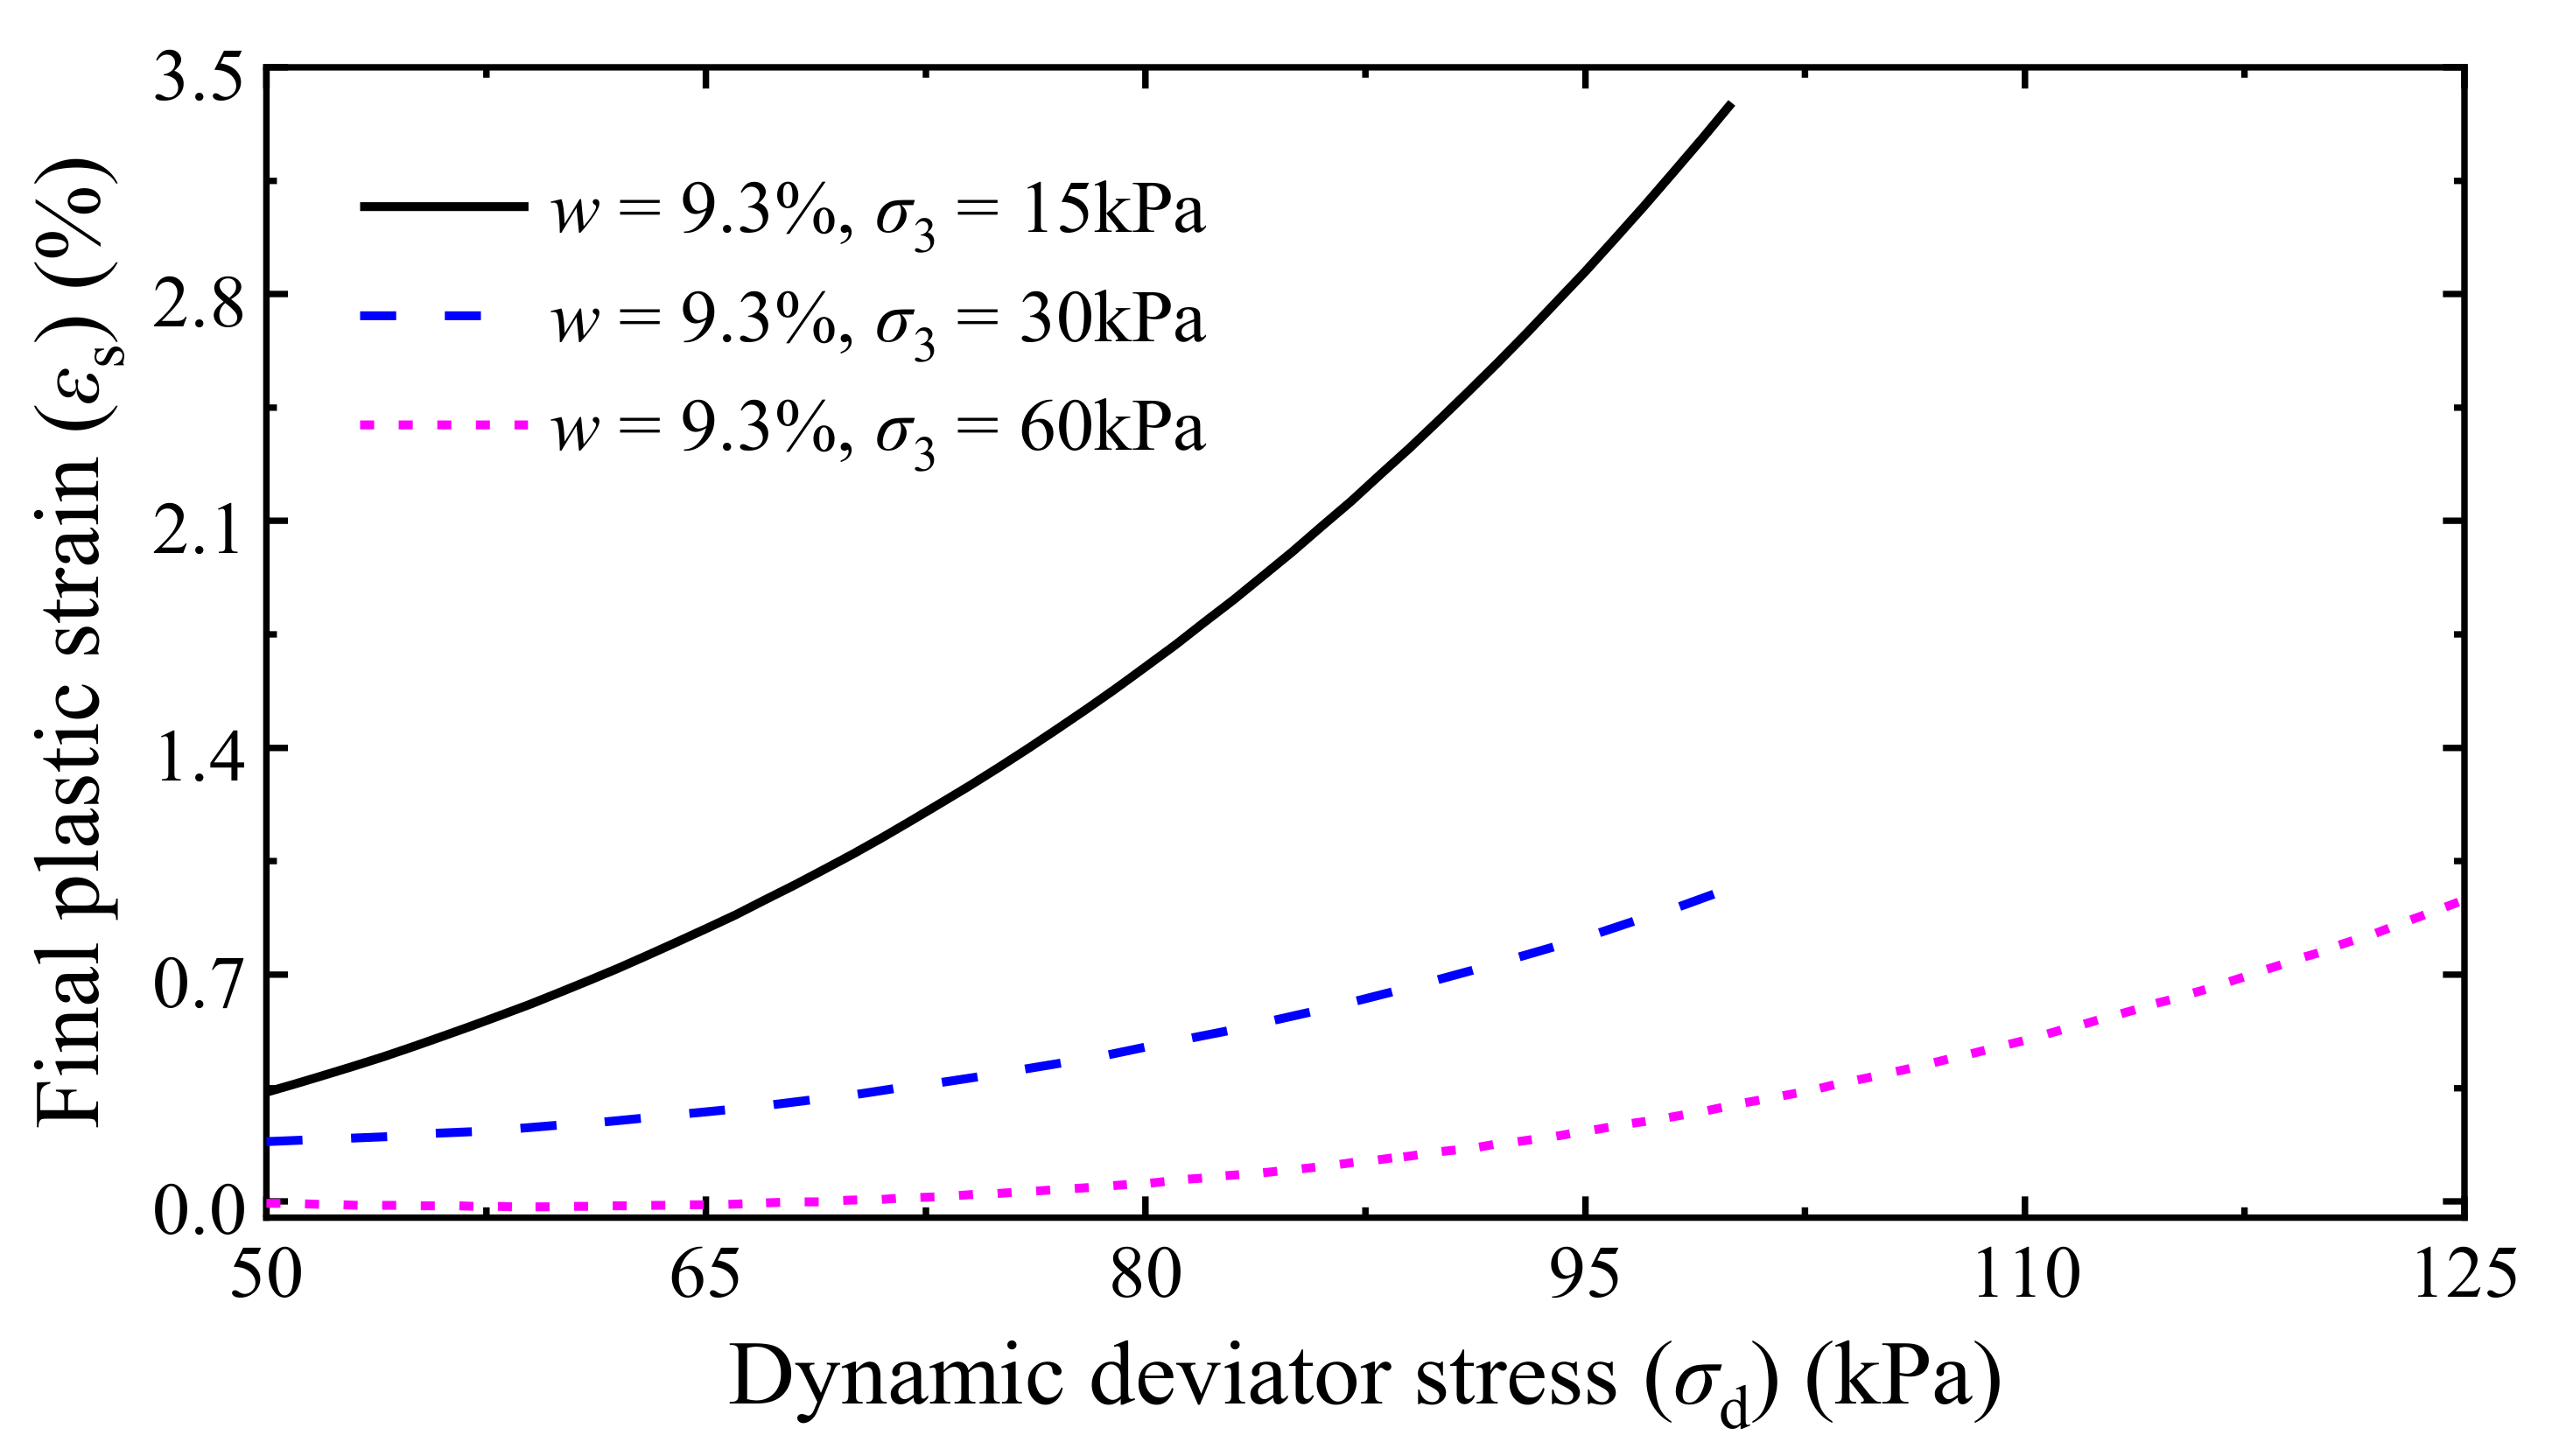
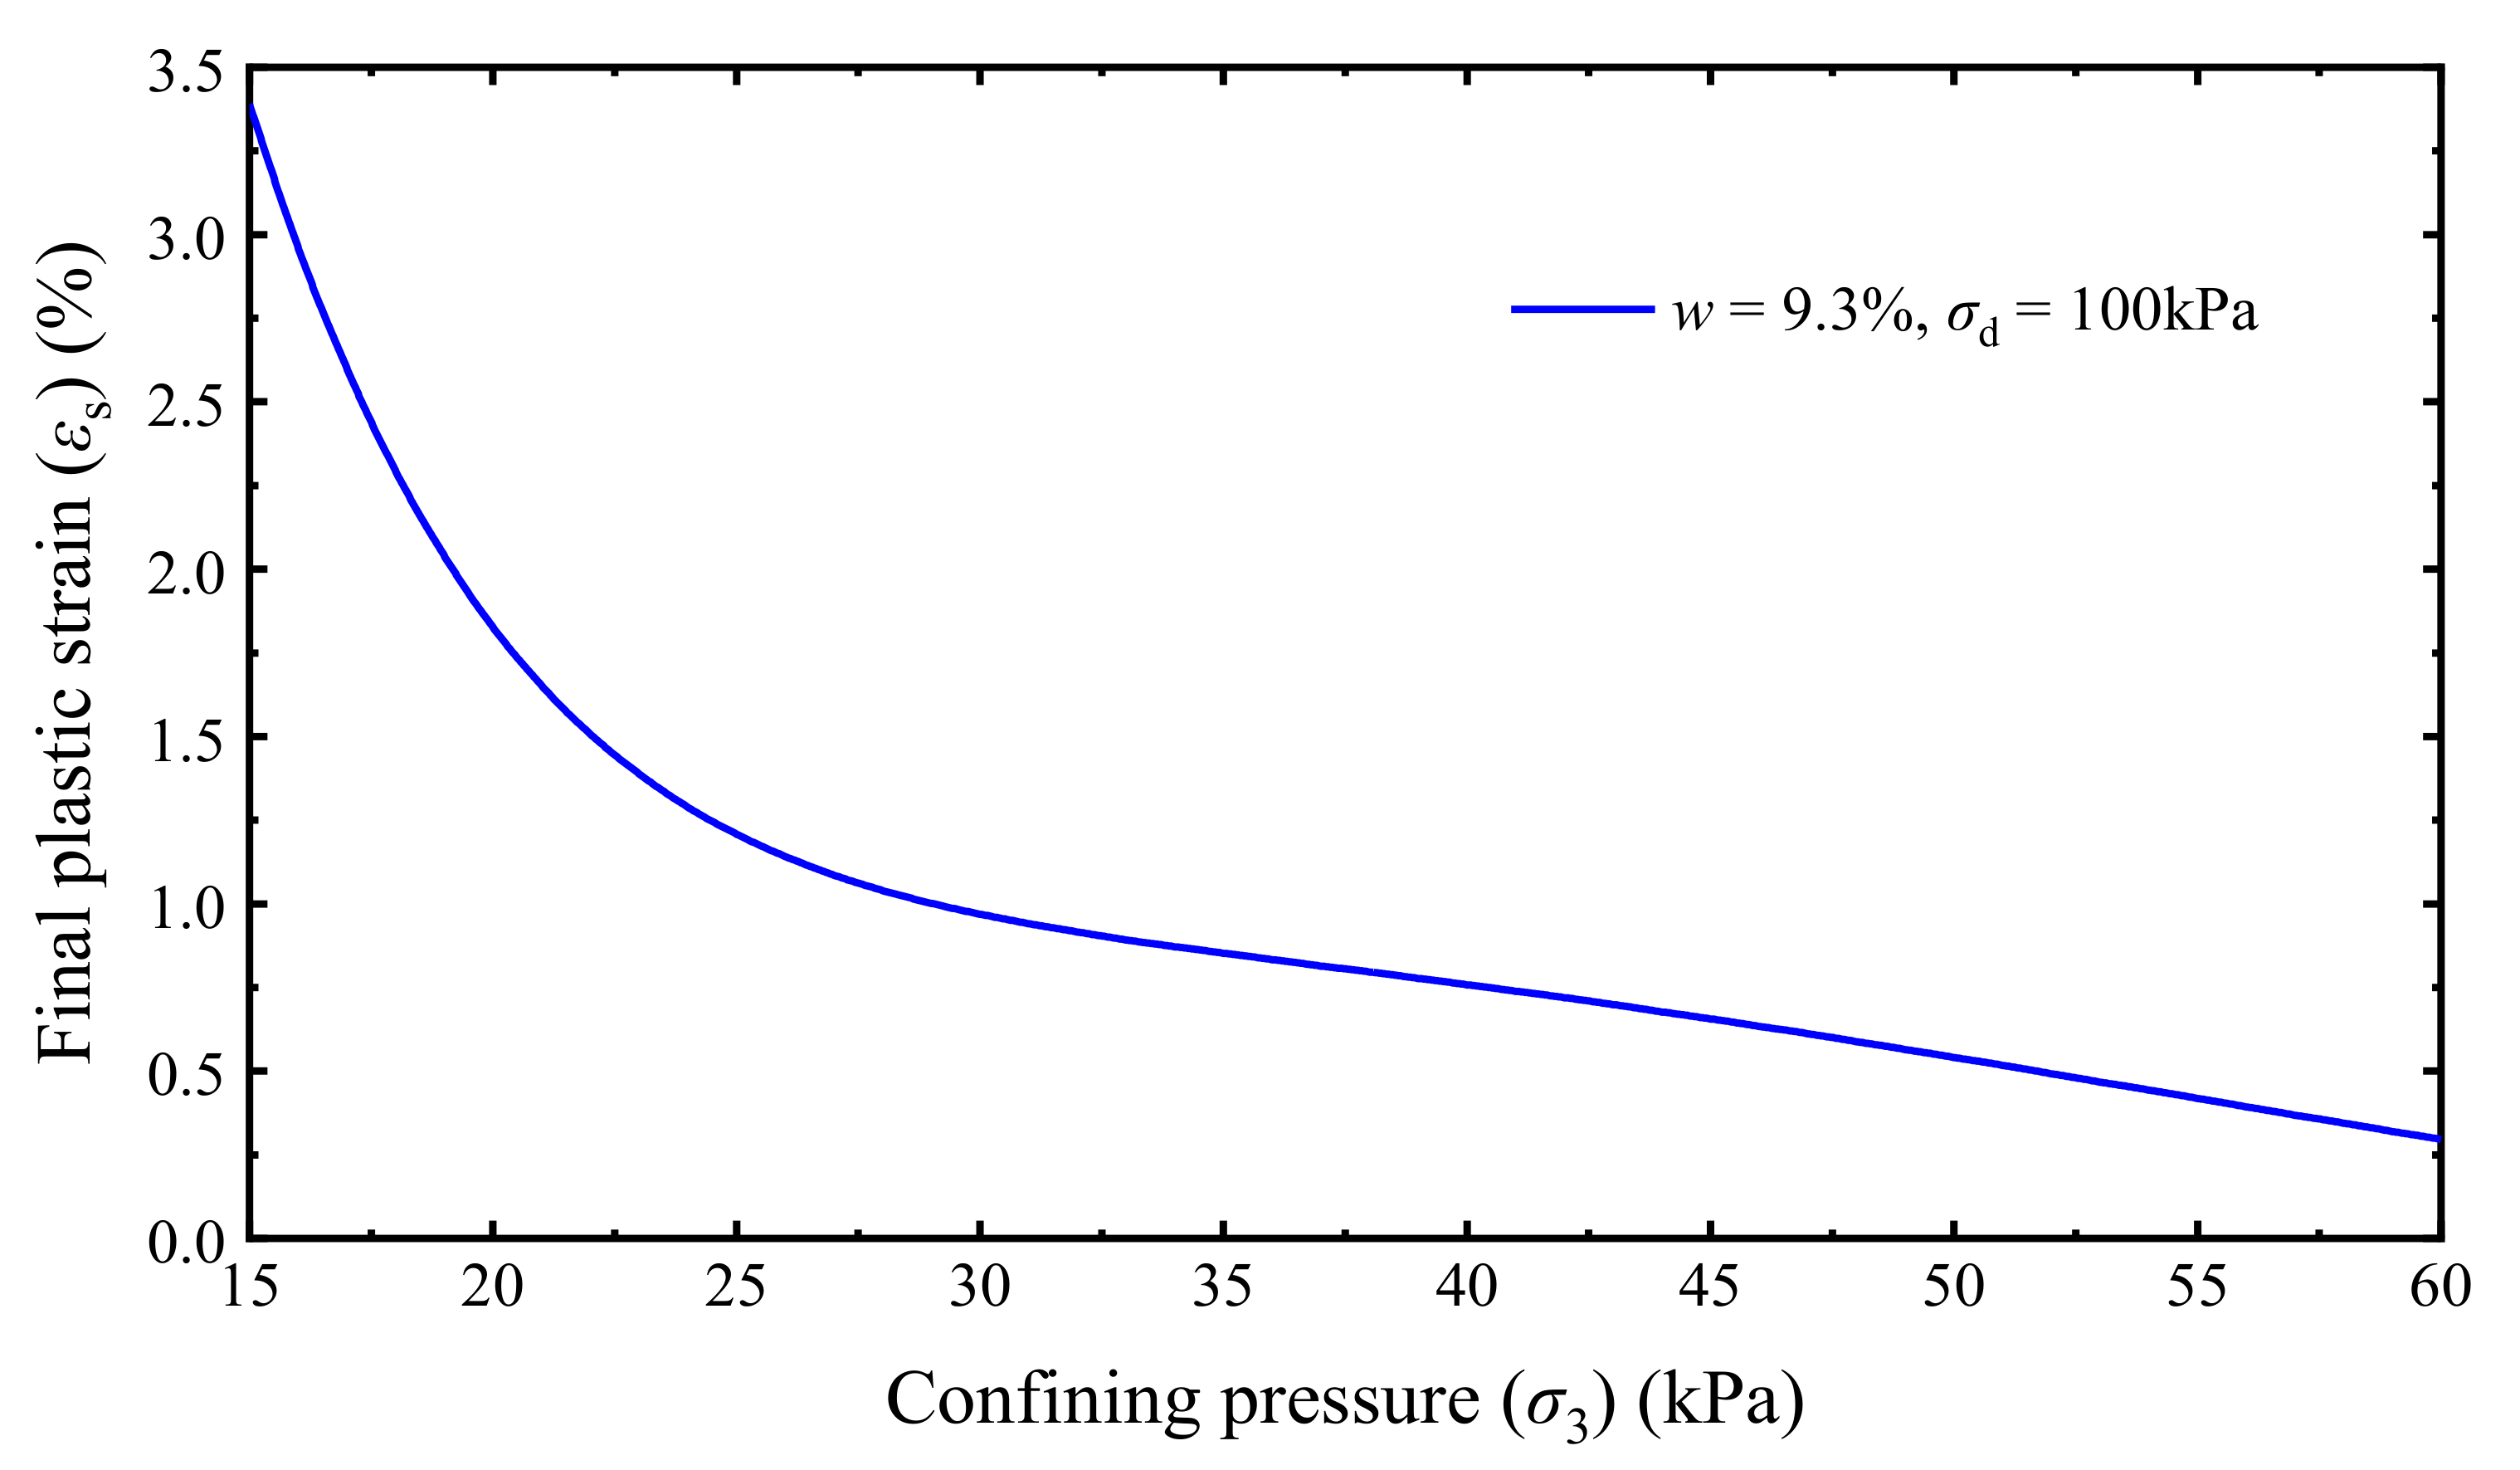
  • The developed evaluation method indicates that the σcri approximately linearly increases with increasing σ3, and a simple linear empirical equation is proposed for the σcri. In addition, εs and its variation rate non-linearly increases with increasing σd but non-linearly decreases as σ3 increases; therefore, an increase in σ3 can effectively reduce the εs, especially in low confining pressure conditions.
  • The εs of saturation specimens with a low confining pressure of 15 kPa started to increase rapidly when the σd was greater than 60 kPa which is generally less than the dynamic deviator stress on subgrade surfaces imposed by freight trains operated in heavy-haul railway lines. Therefore, keeping sufficient drainage capacity, preventing the subgrade approaching saturation, and raising the confining pressure of the subgrade by appropriate reinforcement techniques are effective ways to enhance the railway dynamic stability.

Author Contributions

Conceptualization, F.X. and W.L.; methodology, F.X. and Q.Z.; software, B.Z. and J.D.; formal analysis, B.Z. and Q.Y.; writing—original draft, Q.Z. and J.D.; writing—review and editing, F.X. and Q.Y.; funding acquisition, W.L. and F.X.; supervision, W.L. All authors have read and agreed to the published version of the manuscript.

Funding

The research was funded by the National Natural Science Foundation of China (No. 51978672) and the Research Project on Deepening Innovation and Entrepreneurship Education Reform of Central South University (No. 2020CG039).

Institutional Review Board Statement

Not applicable.

Informed Consent Statement

Not applicable.

Data Availability Statement

The data used to support the findings of this study are available from the corresponding author upon reasonable request.

Conflicts of Interest

The authors declare no conflict of interest.

References

  1. Lin, P.Y.; Tang, L.S.; Ni, P.P. Field evaluation of subgrade soils under dynamic loads using orthogonal earth pressure transducers. Soil Dyn. Earthq. Eng. 2019, 121, 12–14. [Google Scholar] [CrossRef]
  2. Saberian, M.; Li, J.; Setunge, J. Evaluation of permanent deformation of a new pavement base and subbase containing unbound granular materials, crumb rubber and crushed glass. J. Clean. Prod. 2019, 230, 38–45. [Google Scholar] [CrossRef]
  3. Xiao, Y.J.; Zheng, K.Y.; Chen, L.X.; Mao, J.F. Shakedown analysis of cyclic plastic deformation characteristics of unbound granular materials under moving wheel loads. Constr. Build. Mater. 2018, 167, 457–472. [Google Scholar] [CrossRef]
  4. Li, L.H.; Fang, Y.N.; Cheng, B.W.; Chen, N.; Tian, M.; Liu, Y.M. Characterisation of Geogrid and Waste Tyres as Reinforcement Materials in Railway Track Beds. Materials 2021, 14, 4162. [Google Scholar] [CrossRef] [PubMed]
  5. Zhang, J.H.; Zhang, A.S.; Li, J.; Li, F.; Peng, J.H. Gray Correlation Analysis and Prediction on Permanent Deformation of Subgrade Filled with Construction and Demolition Materials. Materials 2019, 12, 3035. [Google Scholar] [CrossRef] [Green Version]
  6. Xu, F.; Leng, W.M.; Nie, R.S.; Zhang, Q.S.; Yang, Q. New structure for strengthening soil embankments. Adv. Civ. Eng. 2018, 2018, 4809034. [Google Scholar] [CrossRef]
  7. Ju, S.H.; Leong, C.C.; Ho, Y.S. Safety of maglev trains moving on bridges subject to foundation settlements and earthquakes. J. Bridge Eng. 2014, 19, 91–100. [Google Scholar] [CrossRef]
  8. Remennikov, A.M.; Kaewunruen, S. A review of loading conditions for railway track structures due to train and track vertical interaction. Struct. Control Health 2008, 15, 207–234. [Google Scholar] [CrossRef]
  9. Lyu, Z.; Qian, J.G.; Shi, Z.H.; Gao, Q. Dynamic responses of layered poroelastic ground under moving traffic loads considering effects of pavement roughness. Soil. Dyn. Earthq. Eng. 2020, 130, 105996. [Google Scholar] [CrossRef]
  10. Dong, K.; Con1nolly, D.P.; Laghrouche, O.; Woodward, P.K.; Alves, C.P. The stiffening of soft soils on railway lines. Transp. Geotech. 2018, 17, 179–191. [Google Scholar] [CrossRef]
  11. Puppala, A.J.; Saride, S.; Chomtid, S. Experimental and modeling studies of permanent strains of subgrade soils. J. Geotech. Geoenviron. 2009, 135, 1379–1389. [Google Scholar] [CrossRef]
  12. Aw, E.S. Low Cost Monitoring System to Diagnose Problematic Rail Bed: Case Study at a Mud Pumping Site. Ph.D. Thesis, Massachusetts Institute of Technology, Cambridge, MA, USA, 2007. [Google Scholar]
  13. Kang, X.; Ge, L.; Chang, K.T.; Kwok, A.O. Strain-controlled cyclic simple shear tests on sand with radial strain measurements. J. Mater. Civil. Eng. 2016, 28, 0405169. [Google Scholar] [CrossRef]
  14. Zhang, Q.S.; Leng, W.M.; Xu, F.; Yang, Q.; Ai, X. Additional stress in soil embankments subjected to a new prestressed reinforcement device. J. Civ. Eng. Manag. 2019, 25, 700–714. [Google Scholar] [CrossRef]
  15. Xiao, J.H.; Juang, C.H.; Xu, C.J.; Li, X.W.; Wang, L. Strength and deformation characteristics of compacted silt from the lower reaches of the Yellow River of China under monotonic and repeated loading. Eng. Geol. 2014, 178, 49–57. [Google Scholar] [CrossRef]
  16. Zhai, B.; Leng, W.M.; Xu, F.; Zhang, S.; Ye, X.Y.; Leng, H.K. Critical dynamic stress and shakedown limit criterion of coarse-grained subgrade soil. Transp. Geotech. 2020, 23, 100354. [Google Scholar] [CrossRef]
  17. Guo, Y.; Zhai, W.M. Long-term prediction of track geometry degradation in high-speed vehicle–ballastless track system due to differential subgrade settlement. Soil Dyn. Earthq. Eng. 2018, 113, 1–11. [Google Scholar] [CrossRef]
  18. Nie, R.S.; Chen, Y.F.; Leng, W.M.; Yang, Q. Experimental measurement of dynamic load parameters for pier pile caps of high-speed railway bridges. Proc. Inst. Mech. Eng. Part F 2017, 231, 162–174. [Google Scholar] [CrossRef]
  19. NRA (TB10621-2014). Code for Design of High Speed Railway; China Railway Publishing House: Beijing, China, 2014. [Google Scholar]
  20. Atilla, M.A.; Afer, E. Undrained behavior of clay under cyclic shear stresses. J. Geotech. Eng. 1989, 115, 968–983. [Google Scholar]
  21. Liu, J.K.; Xiao, J.H. Experimental study on the stability of railroad silt subgrade with increasing train speed. J. Geotech. Geoenviron. 2010, 136, 833–841. [Google Scholar] [CrossRef]
  22. Sabine, W.; Dawson, A.R.; Frohmut, W. Permanent deformation behavior of granular materials and the shakedown concept. Transp. Res. Rec. 2001, 1757, 75–81. [Google Scholar]
  23. Wang, T.L.; Liu, J.K.; Tian, Y.H. Dynamic properties of cement- and lime-improved soil subjected to freeze-thaw cycles. Chin. J. Geotech. Eng. 2010, 32, 1733–1737. [Google Scholar]
  24. David, C.P.; Jalal, H.K. dynamic triaxial tests on remoulded clays. J. Geotech. Eng. 1984, 110, 1431–1445. [Google Scholar]
  25. Cheung, L.W. Laboratory Assessment of Pavement Foundation Materials. Ph.D. Thesis, University of Nottingham, Nottingham, UK, 1994. [Google Scholar]
  26. Frost, M.W.; Fleming, P.R.; Rogers, D.F. dynamic triaxial tests on clay subgrades for analytical pavement design. J. Transp. Eng. 2004, 130, 378–386. [Google Scholar] [CrossRef] [Green Version]
  27. Wang, J.H.; Ling, X.Z.; Li, Q.L.; Zhang, F.; Li, Y. Accumulated permanent strain and critical dynamic stress of frozen silty clay under cyclic loading. Cold. Reg. Sci. Technol. 2018, 153, 130–143. [Google Scholar] [CrossRef]
  28. Zhang, X.; Ren, K. Experimental study on dynamic elastic modulus and critical dynamic stress of cinder-improved soil subgrade. J. Highw. Transp. R. Dev. 2018, 12, 25–32. [Google Scholar] [CrossRef]
  29. Monismith, C.L.; Ogawa, N.; Freeme, C.R. Permanent deformation characteristics of subgrade soils due to repeated load. Transp. Res. Rec. 1975, 537, 1–17. [Google Scholar]
  30. Barksdale, R.D. Laboratory evaluation of rutting in base course material. In Proceedings of the 3rd International Conference on Structural Design of Asphalt Pavement, London, UK, 11–15 September 1972; pp. 161–174. [Google Scholar]
  31. Hornych, P.; Piau, J.M. Towards computation tools for the assessment of rutting of flexible pavements. In Proceedings of the 6th International Conference on the Bearing Capacity of Roads, Railways and Airfields, Lisbon, Portugal, 24–26 June 2002; pp. 57–74. [Google Scholar]
  32. Li, D.Q.; Selig, E.T. Cumulative plastic deformation for fine-grained subgrade soils. J. Geotech. Eng. 1996, 122, 1006–1013. [Google Scholar] [CrossRef]
  33. Chai, J.C.; Miura, N. Traffic-load-induced permanent deformation of road on soft subsoil. J. Geotech. Geoenviron. 2002, 128, 907–916. [Google Scholar] [CrossRef]
  34. Wu, T.Y.; Cai, Y.Q.; Guo, Y.; Ling, D.S.; Wang, J. Influence of shear stress level on cyclic deformation behaviour of intact Wenzhou soft clay under traffic loading. Eng. Geol. 2017, 228, 61–70. [Google Scholar] [CrossRef]
  35. Moghaddas-Nejad, F.; Small, J. Resilient and permanent characteristics of reinforced granular materials by repeated load triaxial tests. Geotech. Test. J. 2003, 26, 152–166. [Google Scholar]
  36. Stewart, H.E. Permanent strains from cyclic variable-amplitude loadings. J. Geotech. Eng. 1986, 112, 646–660. [Google Scholar] [CrossRef]
  37. Xu, F.; Zhai, B.; Leng, W.M.; Yang, Q.; Leng, H.K.; Nie, R.S. Probabilistic method for evaluating the permanent strain of unbound granular materials under cyclic traffic loading. Constr. Build. Mater. 2020, 251, 118975. [Google Scholar] [CrossRef]
  38. Lekarp, F.; Dawson, A. Modelling permanent deformation behaviour of unbound granular materials. Constr. Build. Mater. 1998, 12, 9–18. [Google Scholar] [CrossRef]
  39. El-Badawy, S.M.; Witczak, M. Development of a universal permanent strain model for subgrade pavement materials. In Proceedings of the 86th Annual Meeting of the Transportation Research Board, Washington, DC, USA, 21–25 January 2007; p. 07-2318. [Google Scholar]
  40. Xiao, Y.J.; Tutumluer, E.; Mishra, D. Performance evaluations of unbound aggregate permanent deformation models for various aggregate physical properties. Transp. Res. Rec. 2015, 2525, 20–30. [Google Scholar] [CrossRef]
  41. Romanoschi, S.A. Empirical models for permanent deformation of subgrade soils from the data collected at the pavement subgrade performance study. J. Mater. Civ. Eng. 2017, 29, 04016236. [Google Scholar] [CrossRef]
  42. NRA (TB 10001-2016). Code for Design of Railway Earth Structure; China Railway Publishing House: Beijing, China, 2016. [Google Scholar]
  43. ASTM (ASTM D2487–17e1). Standard Practice for Classification of Soils for Engineering Purposes (Unified Soil Classification System); ASTM: West Conshohocken, PA, USA, 2020. [Google Scholar]
  44. ASTM (ASTM D1557–12). Standard Test Methods for Laboratory Compaction Characteristics of Soil Using Modified Effort; ASTM: West Conshohocken, PA, USA, 2012. [Google Scholar]
  45. ASTM (ASTM D7181–20). Standard Test Method for Consolidated Drained Triaxial Compression Test for Soils; ASTM: West Conshohocken, PA, USA, 2020. [Google Scholar]
  46. Yan, C.B.; Wang, H.J.; Xu, X.; Zhang, Y.C. Identifying fatigue damage of mudded intercalations based on dynamic triaxial test. Eng. Geol. 2021, 280, 105933. [Google Scholar] [CrossRef]
  47. Karg, C.; Haegeman, W. Elasto-plastic long-term behavior of granular soils: Experimental investigation. Soil. Dyn. Earthq. Eng. 2009, 29, 155–172. [Google Scholar] [CrossRef]
  48. Cerni, G.; Cardone, F.; Virgili, A.; Camilli, S. Characterisation of permanent deformation behaviour of unbound granular materials under repeated triaxial loading. Constr. Build. Mater. 2012, 28, 79–87. [Google Scholar] [CrossRef]
  49. Tang, L.; Yan, M.H.; Ling, X.Z.; Tian, S. Dynamic behaviours of railway’s base course materials subjected to long-term low-level cyclic loading: Experimental study and empirical model. Géotechnique 2017, 67, 537–545. [Google Scholar] [CrossRef]
  50. Mehdizadeh, A.; Disfani, M.M.; Evans, R.; Arulrajah, A.; Ong, D. Mechanical consequences of suffusion on undrained behaviour of a gap-graded cohesionless soil—An experimental approach. Geotech. Test. J. 2017, 40, 20160145. [Google Scholar] [CrossRef] [Green Version]
  51. Li, Z.C. Study on the Vertical Load Transmission through the Track Structure and the Characteristics of Subgrade Dynamic Stress; China Academy of Railway Science: Beijing, China, 2000; pp. 4–5. [Google Scholar]
  52. Xiao, H.; Liu, G.P.; Yan, D.W.; Zhao, Y.; Wang, J.Q.; Wang, H.Y. Field test and numerical analysis of insulated rail joints in heavy-haul railway. Constr. Build. Mater. 2021, 298, 123905. [Google Scholar] [CrossRef]
  53. Shi, Z.Y.; Wang, K.Y.; Zhang, D.W.; Chen, Z.G.; Zhai, G.H.; Huang, D.X. Experimental investigation on dynamic behaviour of heavy-haul railway track induced by heavy axle load. Transport 2019, 34, 351–362. [Google Scholar] [CrossRef] [Green Version]
  54. Li, P.; Ling, C.X.; Zhang, F.; Li, Y.; Zhao, Y.Y. Field testing and analysis of embankment vibrations induced by heavy haul trains. Shock. Vib. 2017, 7410836, 1–14. [Google Scholar] [CrossRef] [Green Version]
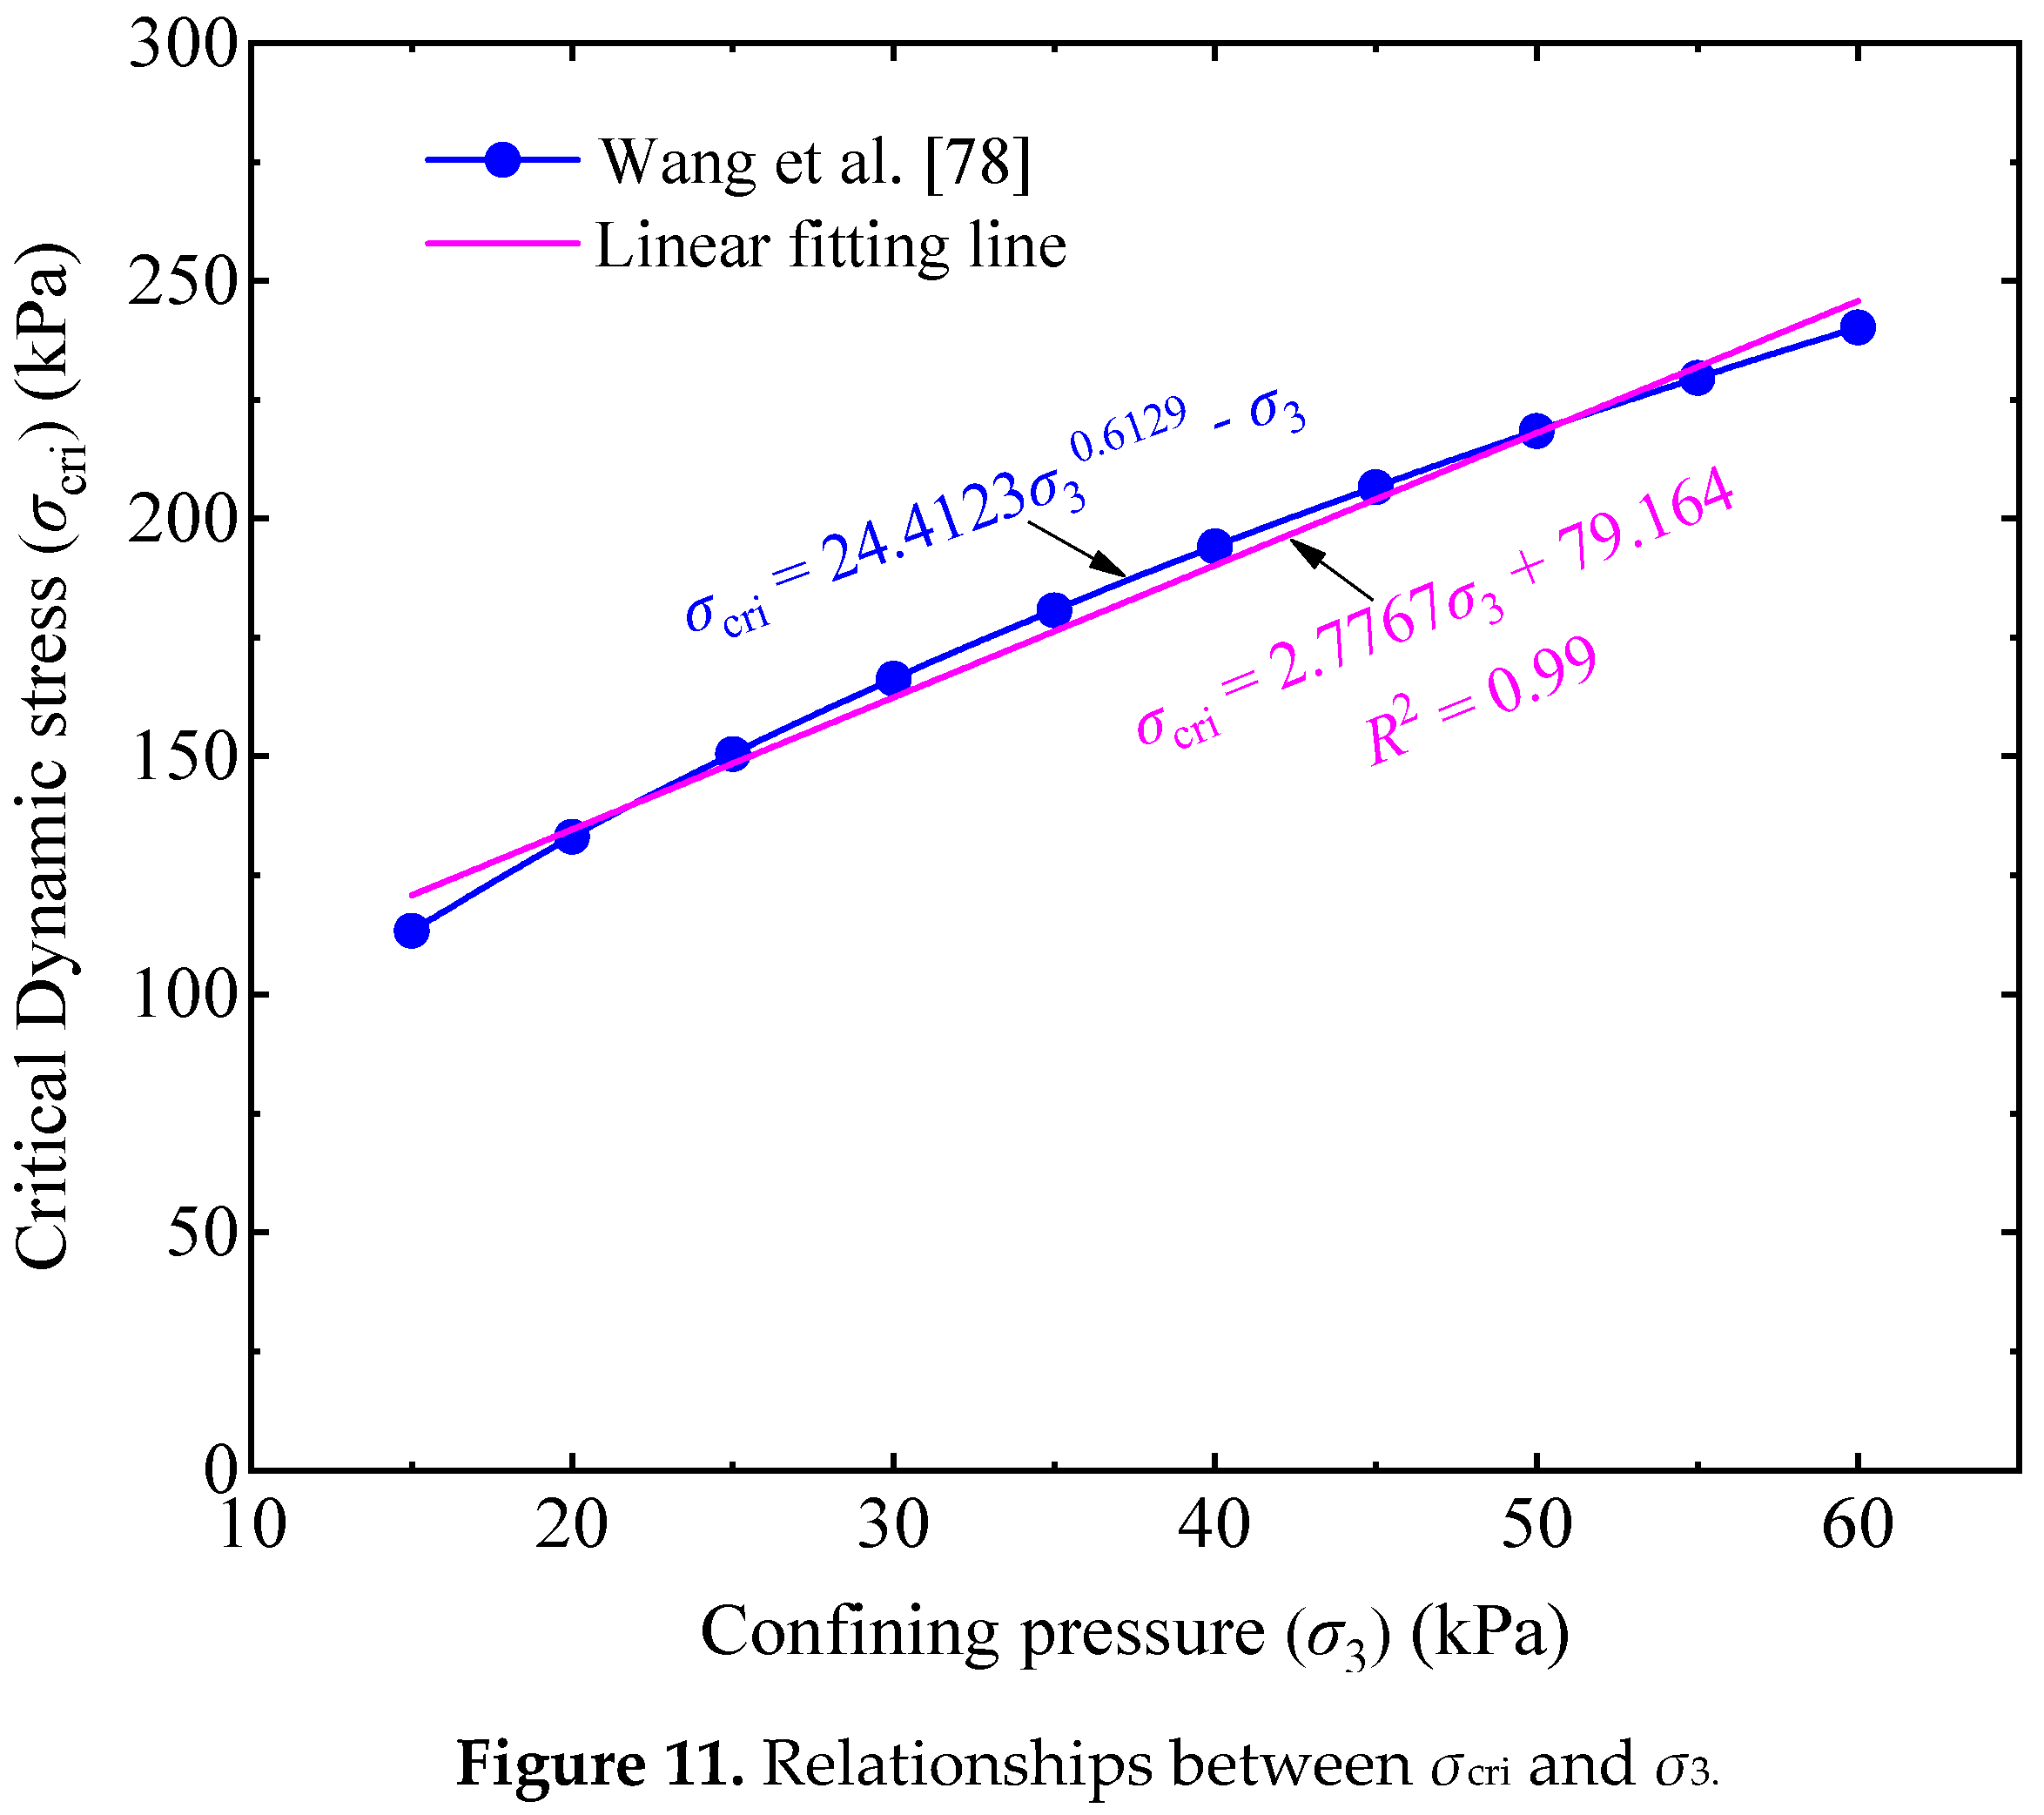
  55. Thevakumar, K.; Indraratna, B.; Ferreira, F.B.; Carter, J.; Rujikiatkamjorn, C. The influence of cyclic loading on the response of soft subgrade soil in relation to heavy haul railways. Transp. Geotech. 2021, 29, 100571. [Google Scholar] [CrossRef]
  56. Indraratna, B.; Ngo, T.; Ferreira, F.B.; Rujikiatkamjorn, C.; Tucho, A. Large-scale testing facility for heavy haul track. Transp. Geotech. 2021, 28, 100517. [Google Scholar] [CrossRef]
  57. Mei, H.H.; Leng, W.M.; Nie, R.S.; Liu, W.J.; Chen, C.; Wu, X.W. Random distribution characteristics of peak dynamic stress on the subgrade surface of heavy-haul railways considering track irregularities. Soil. Dyn. Earthq. Eng. 2019, 116, 205–214. [Google Scholar] [CrossRef]
  58. Hu, Z.X. Soil Mechanics and Environmental Geotechnology; Tongji University Press: Shanghai, China, 1997. [Google Scholar]
  59. Mehdizadeh, A.; Disfani, M.M.; Evans, R.; Arulrajah, A.; Ong, D. Discussion of ‘Development of an Internal Camera-Based Volume Determination System for Triaxial Testing’ by S.E. Salazar, A. Barnes and R.A. Coffman. Geotech. Test. J. 2016, 39, 165–168. [Google Scholar]
  60. Liu, S.F.; Yang, Y.J.; Forrest, J. Grey Data Analysis: Methods, Models, and Applications; Springer: Singapore, 2017. [Google Scholar]
  61. Cui, K.; Jing, X. Research on prediction model of geotechnical parameters based on bp neural network. Neural Comput. Appl. 2018, 31, 8205–8215. [Google Scholar] [CrossRef]
  62. Prusty, J.K.; Pradhan, B. Multi-response optimization using Taguchi-Grey relational analysis for composition of fly ash-ground granulated blast furnace slag based geopolymer concrete. Constr. Build. Mater. 2020, 241, 118049. [Google Scholar] [CrossRef]
  63. Rajeswari, B.; Amirthagadeswaran, K.S. Experimental investigation of machinability characteristics and multi-response optimization of end milling in aluminium composites using RSM based grey relational analysis. Measurement 2017, 105, 78–86. [Google Scholar] [CrossRef]
  64. Shi, S.X.; Fei, H.Y.; Xu, X.G. Application of a FMEA method combining interval 2-tuple linguistic variables and grey relational analysis in preoperative medical service process. IFAC-PapersOnLine 2019, 52, 1242–1247. [Google Scholar] [CrossRef]
  65. Javed, S.A.; Mahmoudi, A.; Khan, A.M.; Javed, A.M.; Javed, S.; Liu, S.F. A critical review: Shape optimization of welded plate heat exchangers based on grey correlation theory. Appl. Therm. Eng. 2018, 144, 593–599. [Google Scholar] [CrossRef]
  66. Wu, L.Z.; Li, S.H.; Huang, R.Q.; Xu, Q. A new grey prediction model and its application to predicting landslide displacement. Appl. Soft Comput. J. 2020, 95, 106543. [Google Scholar] [CrossRef]
  67. Liu, D.; Li, M.X.; Ji, Y.; Fu, Q.; Li, M.; Faiz, M.A.; Ali, S.; Li, T.X.; Cui, S.; Khan, M.I. Spatial-temporal characteristics analysis of water resource system resilience in irrigation areas based on a support vector machine model optimized by the modifed gray wolf algorithm. J. Hydrol. 2020, 2020, 125758. [Google Scholar] [CrossRef]
  68. Liu, W.J.; Zhang, J.; Jin, M.Z.; Liu, S.F.; Chang, X.Y.; Xie, N.M.; Wang, Y.T. Key indices of the remanufacturing industry in China using a combined method of grey incidence analysis and grey clustering. J. Clean. Prod. 2017, 168, 1348–1357. [Google Scholar] [CrossRef]
  69. Mathworks. MATLAB Version 8.6.0; The Mathworks Inc.: Natick, MA, USA, 2015. [Google Scholar]
  70. Wang, L.; Bi, X.H. Risk assessment of knowledge fusion in an innovation ecosystem based on a GA-BP neural network. Cogn. Syst. Res. 2021, 66, 201–210. [Google Scholar] [CrossRef]
  71. Jiang, C.; Wen, J.W.; Li, M.Z.; You, T.P. Calculation on enantiomeric excess of catalytic asymmetric reactions of diethylzinc addition to aldehydes with topological indices and artificial neural network. J. Mol. Catal. 2006, 258, 191–197. [Google Scholar]
  72. Costanza, G.; Tata, M.E.; Ucciardello, N. Superplasticity in PbSn60: Experimental and neural network implementation. Comp. Mater. Sci. 2006, 37, 226–233. [Google Scholar] [CrossRef]
  73. Xu, L.J.; Xing, J.D.; Wei, S.Z.; Zhang, Y.Z.; Long, R. Artificial neural network prediction of retained austenite content and impact toughness of high-vanadium high-speed steel (HVHSS). Mater. Sci. Eng. 2006, 433, 251–256. [Google Scholar] [CrossRef]
  74. Chakraverty, S.; Sigh, V.P.; Sharma, R.K. Regression based weight generation algorithm in neural network for estimation of frequencies of vibrating plates. Comput. Methods Appl. Mech. Eng. 2006, 195, 4194–4202. [Google Scholar] [CrossRef]
  75. Rumelhart, D.W.; Hinton, G.E.; Williams, R.J. Learning representations by back-propagating errors. Nature 1989, 323, 533–536. [Google Scholar] [CrossRef]
  76. Chen, M. Principle and Example of MATLAB Neural Network; Tsinghua University Press: Beijing, China, 2013. [Google Scholar]
  77. Dawson, A.; Mundy, M.; Huhtala, M. European research into granular material for pavement bases and subbases. Transp. Res. Rec. 2000, 1721, 91–99. [Google Scholar] [CrossRef]
  78. Wang, K.Y.; Zhuang, Y.; Geng, X.Y. Experimental research on critical dynamic Stress of coarse-grained soil in railway subgrade. Rock. Soil Mech. 2020, 41, 1865–1873. [Google Scholar]
  79. Xu, F.; Yang, Q.; Liu, W.J.; Leng, W.M.; Nie, R.S.; Mei, H.H. Dynamic stress of subgrade bed layers subjected to train vehicles with large axle loads. Shock. Vib. 2018, 2018, 2916096. [Google Scholar] [CrossRef]
  80. Shan, Y.; Albers, B.; Savidis, S.A. Influence of different transition zones on the dynamic response of track–subgrade systems. Comput. Geotech. 2013, 48, 21–28. [Google Scholar] [CrossRef]
Figure 1. Particle size gradation curve of the UGM [16,37].
Materials 14 05722 g001
Figure 2. Compaction curve of the UGM.
Materials 14 05722 g002
Figure 3. Photograph of the test device [16,37].
Materials 14 05722 g003
Figure 4. Cyclic loading curve [16,37].
Materials 14 05722 g004
Figure 5. εpN relationship of saturation specimens: (a) σ3 = 15 kPa; (b) σ3 = 30 kPa; (c) σ3 = 60 kPa [16].
Materials 14 05722 g005
Figure 6. εpN relationship of specimens with optimal moisture content: (a) σ3 = 15 kPa; (b) σ3 = 30 kPa; (c) σ3 = 60 kPa.
Materials 14 05722 g006
Figure 7. Topological graph of the BP neural network [16].
Materials 14 05722 g007
Figure 8. Mean square error with different B values (regarding the σcri).
Materials 14 05722 g008
Figure 9. Output results of β using the trained BP neural network.
Materials 14 05722 g009
Figure 10. Relationship between critical dynamic stress and confining pressure.
Materials 14 05722 g010
Figure 11. Relationships between σcri and σ3.
Materials 14 05722 g011
Figure 12. Mean square error with different B values (regarding the εs).
Materials 14 05722 g012
Figure 13. Output of εs using the optimal BP neural network.
Materials 14 05722 g013
Figure 14. εsσd relationship of saturation specimens.
Materials 14 05722 g014
Figure 15. εs-σ3 relationship of saturation specimens.
Materials 14 05722 g015
Table 1. Detailed program of cyclic triaxial tests.
Groupw (%)σ3 (kPa)σd (kPa)
19.3 (Sr = 100%)1550, 100, 125, 150, 200, 250
29.3 (Sr = 100%)3050, 100, 125, 150, 200, 250
39.3 (Sr = 100%)6050, 100, 125, 150, 200, 250
46.2 (Sr = 79.4%)15100, 150, 200
56.2 (Sr = 79.4%)30250, 275, 300
66.2 (Sr = 79.4%)60250, 300, 350, 400
Table 2. Grey relational coefficients of β with respect to w, σ3, and σd.
Βσ3 (kPa)σd (kPa)w (%)γ1jγ2jγ3j
115509.31.0001.0001.000
1151009.31.0001.0000.778
3151259.30.6360.6360.875
3151509.30.6360.6361.000
3152009.30.6360.6360.778
3152509.30.6360.6360.636
130509.31.0000.7781.000
1301009.31.0000.7780.778
2301259.30.7781.0000.875
3301509.30.6360.7781.000
3302009.30.6360.7780.778
3302509.30.6360.7780.636
160509.31.0000.5381.000
1601009.31.0000.5380.778
1601259.31.0000.5380.700
3601509.30.6360.7781.000
3602009.30.6360.7780.778
3602509.30.6360.7780.636
1151006.20.9131.0000.778
1151506.20.9131.0000.636
1152006.20.9131.0000.538
1302506.20.9130.7780.467
3302756.20.6000.7780.583
3303006.20.6000.7780.538
1602506.20.9130.5380.467
1603006.20.9130.5380.412
1603506.20.9130.5380.368
1604006.20.9130.5380.333
115509.31.0001.0001.000
1151009.31.0001.0000.778
Table 3. Evaluated critical dynamic stress.
w
(%)
σ3 (kPa)σcri (kPa)w
(%)
σ3 (kPa)σcri (kPa)w
(%)
σ3 (kPa)σcri (kPa)w
(%)
σ3 (kPa)σcri (kPa)
6.2152057.5151868.5151479.315116
20224202032015520119
25248252222516525122
30268302423017730125
35295352593518535127
40318402774019440130
45345452994520445132
50368503195021450135
55390553375522355138
60408603576023560140
Table 4. Grey correlation coefficients of εs with respect to w, σ3, and σd.
εs (%)σ3 (kPa)σd (kPa)w (%)γ′1jγ′2jγ′3j
0.3415509.31.0001.0001.000
3.39151009.30.6030.6030.631
0.1830509.30.9670.9030.967
0.71301009.30.9260.9940.994
0.0260509.30.9350.7760.935
0.24601009.30.9790.8050.913
0.96601259.30.8820.9210.977
1.08151006.20.8440.8620.921
3.01151506.20.6250.6340.699
9.11152006.20.3430.3460.374
3.71302506.20.5710.6050.697
2.26602506.20.6950.8370.892
2.62603006.20.6590.7860.889
4.95603506.20.4950.5630.643
9.49604006.20.3330.3630.406
Publisher’s Note: MDPI stays neutral with regard to jurisdictional claims in published maps and institutional affiliations.

