Article

Multigene Expression Programming Based Forecasting the Hardened Properties of Sustainable Bagasse Ash Concrete

by
Muhammad Nasir Amin
1,*,
Kaffayatullah Khan
1,
Fahid Aslam
2,
Muhammad Izhar Shah
3,*,
Muhammad Faisal Javed
3,
Muhammad Ali Musarat
4 and
Kseniia Usanova
5
1
Department of Civil and Environmental Engineering, College of Engineering, King Faisal University (KFU), P.O. Box 380, Al-Hofuf 31982, Saudi Arabia
2
Department of Civil Engineering, College of Engineering in Al-Kharj, Prince Sattam Bin Abdulaziz University, Al-Kharj 11942, Saudi Arabia
3
Department of Civil Engineering, COMSATS University Islamabad, Abbottabad Campus, Abbottabad 22060, Pakistan
4
Department of Civil and Environmental Engineering, Universiti Teknologi PETRONAS, Bander Seri Iskandar 32610, Malaysia
5
Department of Construction of Unique Buildings and Constructions, Peter the Great St. Petersburg Polytechnic University, 195291 St. Petersburg, Russia
*
Authors to whom correspondence should be addressed.
Materials 2021, 14(19), 5659; https://doi.org/10.3390/ma14195659
Submission received: 21 August 2021 / Revised: 23 September 2021 / Accepted: 25 September 2021 / Published: 28 September 2021
(This article belongs to the Special Issue Artificial Intelligence for Cementitious Materials)

Abstract

:
The application of multiphysics models and soft computing techniques is gaining enormous attention in the construction sector due to the development of various types of concrete. In this research, an improved form of supervised machine learning, i.e., multigene expression programming (MEP), has been used to propose models for the compressive strength ( f c ), splitting tensile strength ( f STS ), and flexural strength ( f FS ) of sustainable bagasse ash concrete (BAC). The training and testing of the proposed models have been accomplished by developing a reliable and comprehensive database from published literature. Concrete specimens with varying proportions of sugarcane bagasse ash (BA), as a partial replacement of cement, were prepared, and the developed models were validated by utilizing the results obtained from the tested BAC. Different statistical tests evaluated the accurateness of the models, and the results were cross-validated employing a k-fold algorithm. The modeling results achieve correlation coefficient (R) and Nash-Sutcliffe efficiency (NSE) above 0.8 each with relative root mean squared error (RRMSE) and objective function (OF) less than 10 and 0.2, respectively. The MEP model leads in providing reliable mathematical expression for the estimation of f c , f STS and f FS of BA concrete, which can reduce the experimental workload in assessing the strength properties. The study’s findings indicated that MEP-based modeling integrated with experimental testing of BA concrete and further cross-validation is effective in predicting the strength parameters of BA concrete.

1. Introduction

The damage caused by the construction industry to the environment is a well-known fact. The construction sector uses a third of the total energy production and emits a large amount of greenhouse gases into the atmosphere [1]. Concrete is a widely used material that emits 0.13 tons of CO2 per ton of concrete produced [2,3,4]. The idea of green concrete is gaining popularity as a way to diminish the harmful impacts of concrete while still addressing the underlying problem. Green concrete is made by substituting industrial waste with traditional cementitious materials. Commonly used wastes that can be used as cement replacement are electric arc furnace slag, rubber ash, fly ash, volcanic ash, rice husk ash, metakaolin, and sugarcane bagasse ash [5,6]. The use of these materials is seen as a low-carbon alternative to traditional building materials and a way to reduce energy use and carbon emissions effects. Sugarcane bagasse is the primary fuel used in the sugarcane industry around the world [7]. It is one of the agricultural wastes that remain after processing and extraction in the same industry. Bagasse and residue ash make up about 26% and 0.62% of each ton of sugarcane, respectively [8]. The ash is disposed of in landfills, raising significant environmental problems [9]. As a result, environmentally friendly applications for bagasse ash (BA) are being explored in the construction sector. Several experimental studies have indicated that BA can be used as a cement substitute in concrete with a substantial improvement in mechanical properties. Chusilp et al. (2009) [10] observed that concrete including 20% BA by mass of binder had greater compressive strength ( f c ) and better stability. Sobuz et al. (2014) [11] stated that maximum strength of BA concrete (BAC) could be obtained by replacing 10% of the cement. According to Jagadesh et al. (2018) [12], the f c of the concrete with 30% raw BA was reduced by nearly 50%. The reduction in f c was attributable to the larger size of particles, which expands the pore size. Almost a 27% increase in f c was observed when 10% binder was replaced with BA. The increase in f c is caused by the presence of finer silica and the finer BA particles acts as a filler, which in turn improves the density and strength of concrete. Similar observations are reported by Bahurudeen et al. (2015) [13] where the authors noted that at 25% replacement, the compressive strength of BAC decreases due to dilution effect. In addition, the durability properties of BAC are reported to be much better than normal concrete [10,14,15].
Hence, it can be concluded from the aforementioned discussion that the behavior of BAC is different for different percentages of cement replacement. This complex behavior is due to several factors, including the proportion of concrete used in the mixture, the percentage of cement replacement, the type of aggregates, and different water-to-binder ratios. The development of such relations and factors will increase the use of BAC in the building industry. Recent advances in the area of artificial intelligence (AI) and multiphysics models have brought about substantial changes in many engineering fields, including aeronautical engineering, mechanical engineering, and civil engineering [16,17,18,19]. Materials engineers used advanced soft computing techniques to predict different properties of the materials, including compressive strength ( f c ) and splitting tensile strength.
The applications of the random forest (RF) technique for modeling the compressive strength ( f c ) of high-strength concrete was reported by Farooq et al. (2020) [20]. To examine the f c of synthetic-sand concrete, the RF model was created by Zhang et al. (2020) [21]. The results of the study reported the reduced performance of RF when compared with similar models. Sun et al. (2019) [22] predicted the f c of concrete in which rubber was replaced with fine aggregate. The author combined the RF method with different optimization techniques and reported high accuracy for the combined methods. Chou et al. [23] applied a support vector machine (SVM) to forecast the f c of high-strength concrete with Kernel function for model development. Outcomes of the research indicated a reliable and high prediction accuracy of the SVM model. In another study conducted by Deng et al. (2018) [24], SVM was employed to establish a model for the f c of recycled aggregate concrete. Based on statistical analysis, the SVM showed an acceptable modeling outcome. Alexiadis et al. (2019) [25] coupled a deep multiphysics model with machine learning algorithm in parallel. The authors discussed the practical and theoretical aspects of the particle neuron duality and demonstrated it as an efficient computational method capable to learn during the simulation process. The artificial neural network (ANN) was applied to forecast the f c of rice husk ash concrete, fly ash concrete, lightweight concrete, rubberized concrete, ultra-high strength concrete and modulus of elasticity of concrete made with recycled aggregate [18,26,27,28,29,30,31]. ANN shows reliable performance based on inferential statistics in forecasting the different mechanical properties in these research programs. However, ANN does not provide information of the associated problem, thus meaning it is considered as a black-box model. The ANN models are based on the correlation among the inputs and outputs, though the relation is either linear or dependent on predefined functions [5,32,33]. Recently, gene expression programming (GEP) was employed to estimate the mechanical properties of high strength concrete (HSC), waste foundry sand concrete (WFSC), bagasse ash concrete (BAC), and modeling the bearing capacity of concrete filled steel tubes and RC frame structures [5,34,35,36]. GEP was considered advantageous in terms of providing empirical equations and high prediction capability, and comparative assessment showed better and enhanced accuracy of the GEP. However, the GEP approach was found to have some limitations as it does not take into account a large number of diverging entries for the establishment of model, thus shrinking its range of application [5]. Such outlying entries should be deleted from the GEP model domain to enhance the performance of developed model. Moreover, the GEP encodes just one chromosome, so it is appropriate for the basic connection among the dependent (response) and independent (explanatory) variables [37].
Considering the aforementioned difficulties and limitations, an advanced and improved algorithm, i.e., multigene expression programming (MEP) has been utilized to formulate the mechanical properties of BAC. To the best of the authors’ knowledge, no detailed study has been performed to date to develop a relationship and figure out the responsible factors for the development of strength of BAC using MEP. The MEP has the capability of encoding several chromosomes into a single program (code) and the best possible chromosome can be selected based on evaluating fitness [37,38]. MEP is considered an improved form of the GEP, having the capacity to forecast accurate results given the complexity of the target is unseen compared to other modeling techniques [39]. A simple decoding process is used in MEP as compared to other machine learning (ML) algorithms. Despite the unique attributes of MEP, it has been scarcely utilized in civil engineering. In the present study, the mechanical properties of BAC, such as compressive strength ( f c ), splitting tensile strength ( f STS ), and flexural strength ( f FS ) of BA concrete were modeled considering the optimum parameters of MEP to resolve a complex relationship. A large and comprehensive database was extracted from the previously published literature to train the proposed model. After that, the concrete specimen with different dosages of BA was prepared in the lab, and the results of the lab-tested specimen were used to validate and test the established MEP models. The output of the developed models was further cross-validated by the k-fold method. The performance of the final established models was assessed employing several statistical assessment indicators. The robust MEP technique supplemented with experimental tests and statistical checks could effectively solve complex problems.

2. Modeling Techniques and Database

2.1. Multigene Expression Programming

An improved form of machine learning (ML) known as multigene expression programming (MEP) is recently proposed, in which individual variables are represented by changing length entities [37,40]. The distinguishing feature of MEP is to propose simple linear and numerous solutions in a single chromosome [41]. This unique function enables searching in a broader range to find the finest viable response. Compared to gene expression programming (GEP), the MEP follows simple and easy processes [32]. MEP can handle exceptions such as incorrect expressions, infinity, statistical error type values, etc. As the gene is responsible for generating an exception, it alters to an arbitrarily terminal symbol. Therefore, no infertile individuals enter the next generation, thus providing a margin in the chromosome structure during the assessment and evaluation process. However, the GEP cannot remove such exceptions and may become part of the final solution [37]. The MEP is decoded similarly to the pascal and C compiler empirical relationship to machine coding. The result of the MEP is in a linear string of instructions form [42]. Several genes per chromosome govern the chromosome length, whereas the gene encodes the elements in function and terminal set. The abovementioned advantages of MEP over other methods can lead to accurate and reliable models in many fields. The MEP has been applied in a few research studies to estimate elastic modulus of normal and high strength concrete [41], to formulate the compressive strength of Portland cement [43], to develop models for soil deformation modulus [44], to formulate models for consolidating depth of the soil layer [42] and to develop models for polymer confined concrete columns [39].
The development of MEP model depends on several parameters which affect the overall performance of the model. Therefore, careful selection of these parameters is necessary. The values of the MEP-optimized parameters selected in the present study are presented in Table 1. The trial and error approach was used to get the optimum values of these important parameters, as suggested in the literature [45].

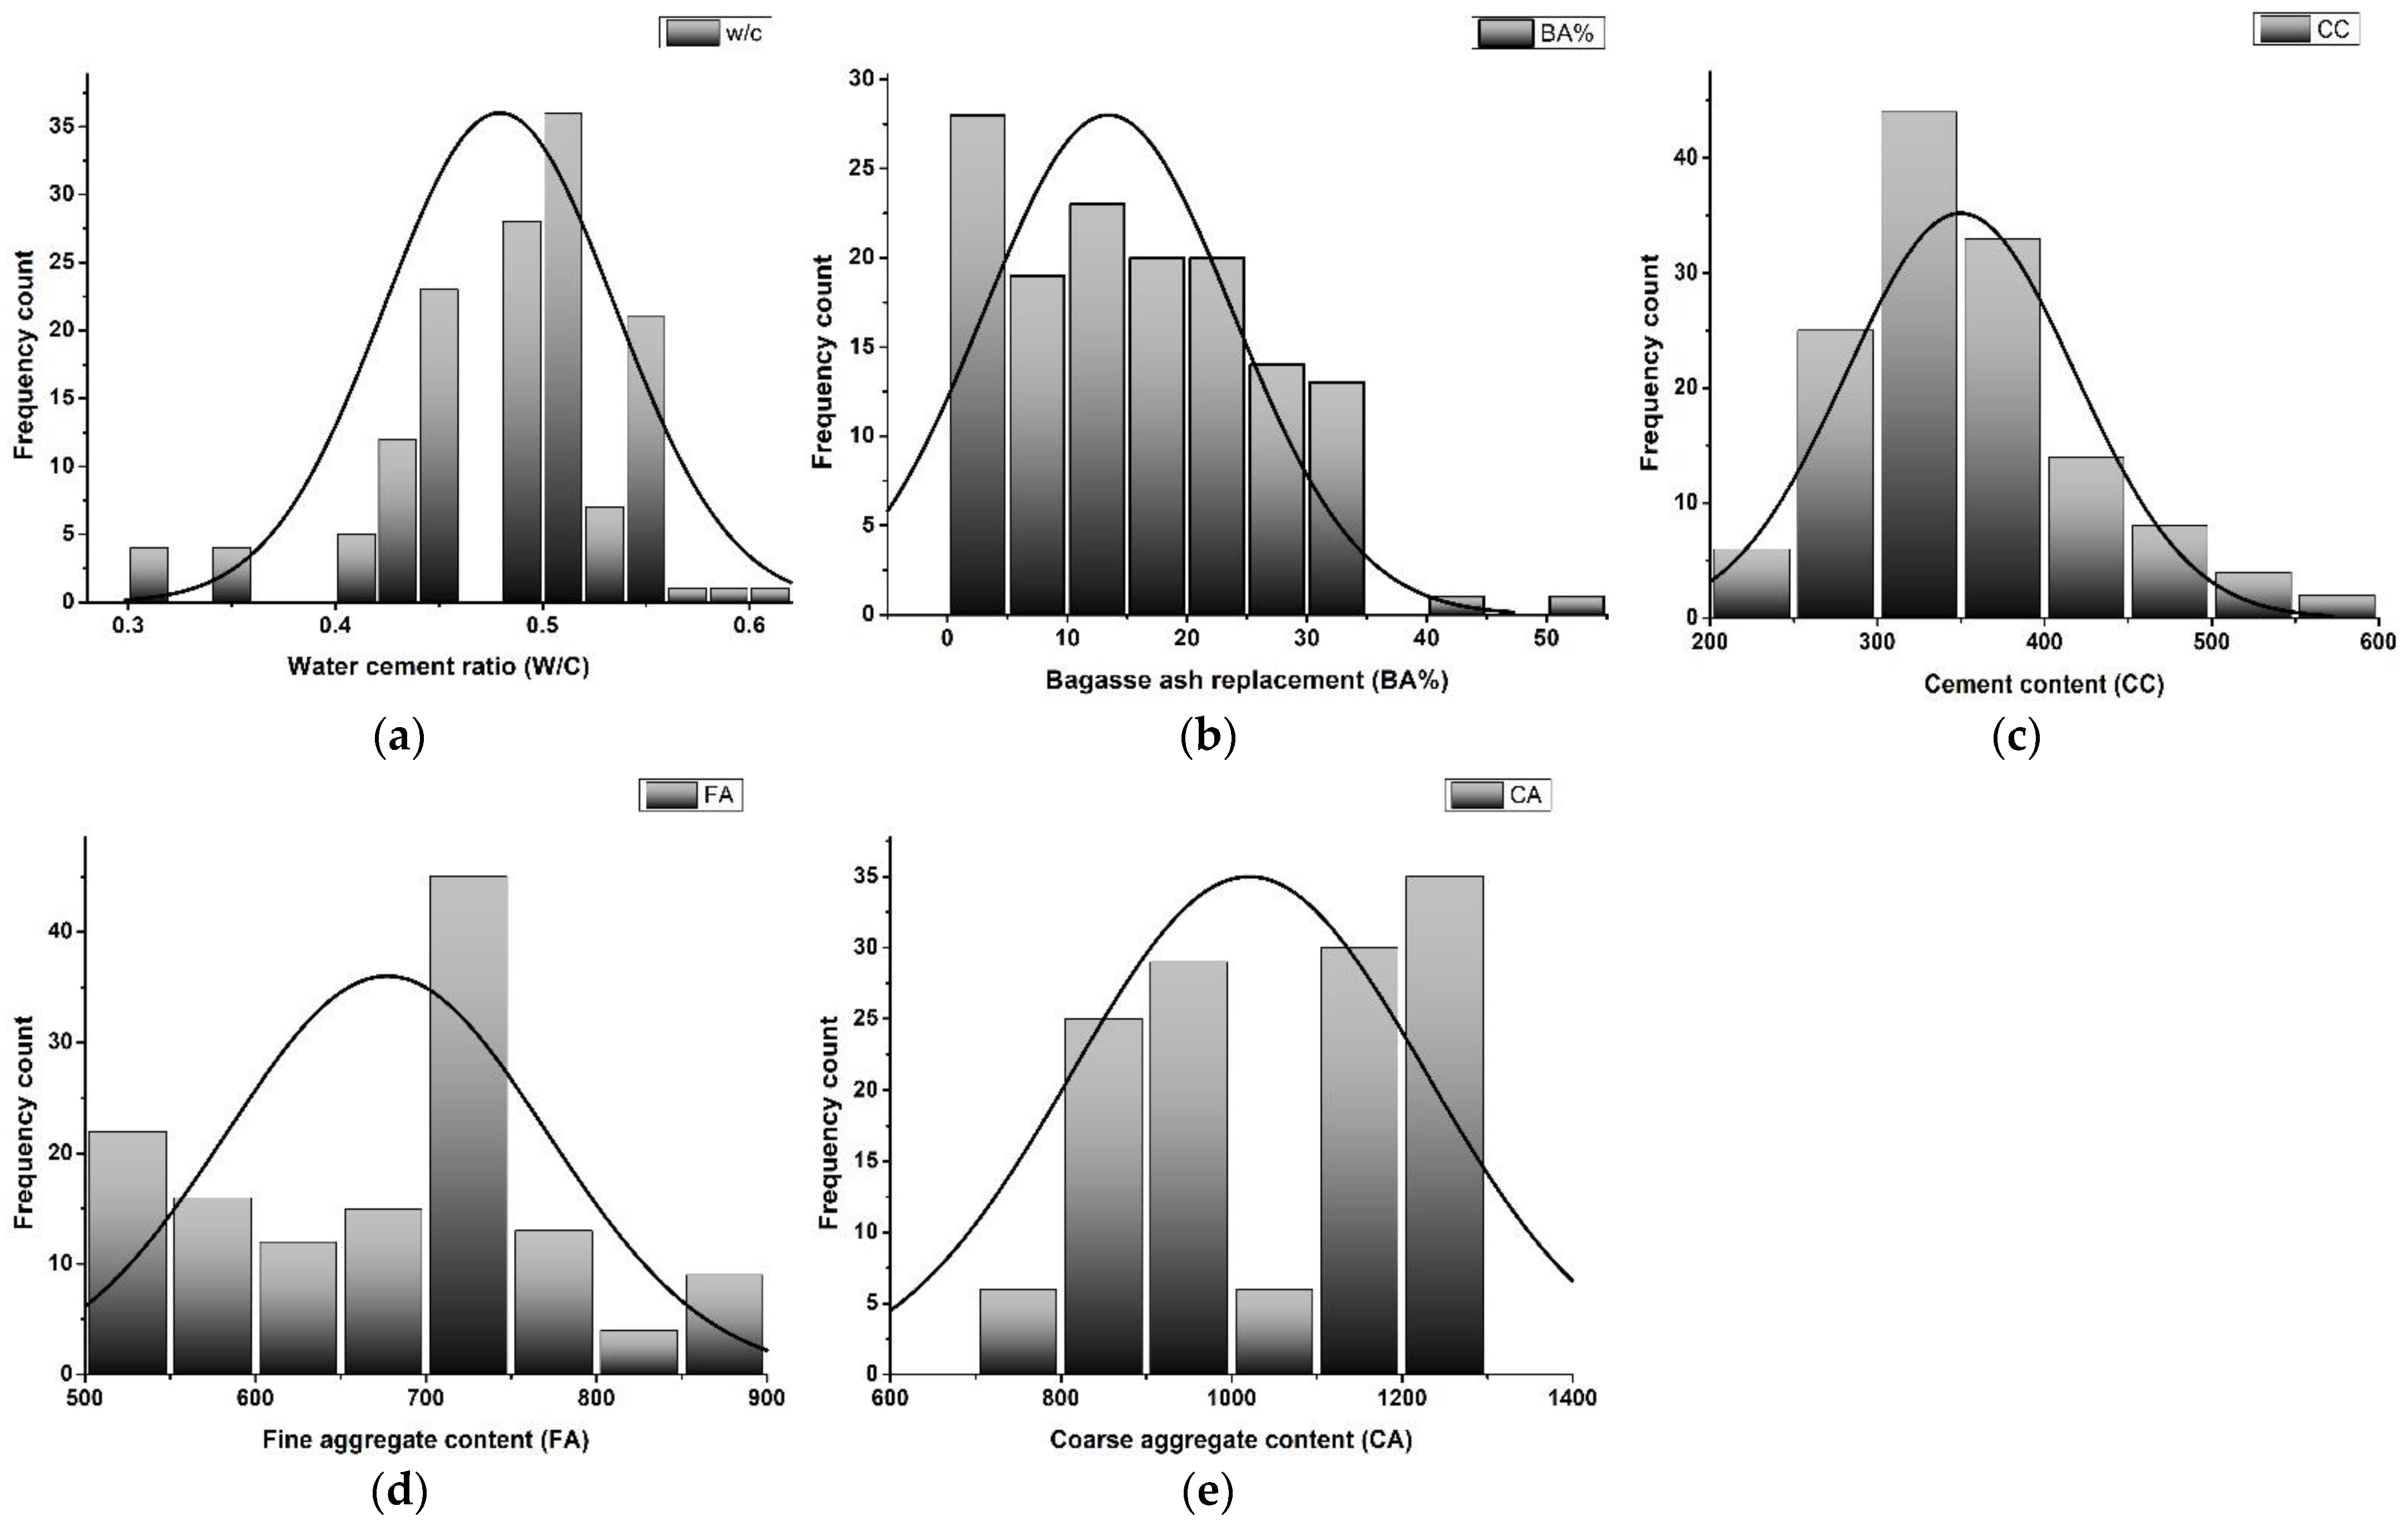
2.2. Modeling Database

A comprehensive and reliable experimental dataset on 28 days mechanical properties of bagasse ash concrete (BAC) was acquired from the published literature to train the MEP models [10,11,12,13,14,15,46,47,48,49,50,51,52,53,54,55,56,57,58,59,60,61,62,63,64,65,66,67]. The final datasets included a total of 132, 125, and 128 records of compressive strength ( f c ) , splitting tensile strength ( f STS ) and flexural strength ( f FS ) , respectively, for concrete incorporated with bagasse ash (BA). As some researchers follow the British standard during experimental testing of the compressive strength ( f c ) for concrete, the cube strength data was converted to cylindrical strength to make the data uniform [4,68]. Once all the data was collected and properly arranged, statistical analysis was applied to identify the most important and effective parameters that considerably influence the performance of BAC. The results of the data after statistical analysis are shown in Table 2. The parameters selected in the present research are water-to-binder ratio (w/c), amount of cement (CC), the quantity of coarse aggregate (CA), the quantity of fine aggregate (FA), and the percentage of BA (BA%). The frequency histograms of these modeling inputs are illustrated in Figure 1 for the purpose of visualizing the distribution of the input variables. The aforementioned parameters are considered to be a function of the f c , f STS and f FS of BAC as given in Equation (1).
f c ,   f STS ,   f FS = f ( W C ,   SCBA % ,   CA ,   CC ,   FA )

2.3. Cross-Validation with k-Fold Algorithm

The machine learning (ML) models frequently fail to generate generalizable findings when trained on data that has not been previously used for model training. Consequently, it becomes difficult to assess the accuracy of the models [69]. As a usual practice, the dataset is partitioned into train and test sets for training and testing of models, respectively, and the performance is then assessed using statistical error metrics. However, this approach only works well with the availability of a large and broad dataset. Moreover, it is not considered a reliable method as the accuracy of one dataset can be very different from the accuracy obtained for another dataset. A resampling technique, called k-fold cross-validation, is used to ensure that the model can perform well on unseen data. This technique distributes the currently available dataset to k subclasses [70]. The superior results and efficacy of the 10-fold approach are presented in the previously published literature [71]. In the current study, the 10-fold cross-validation is adopted by randomly dividing the dataset into ten subsets. Each class of the 10 subsets is utilized for validation to examine the grouping model, and the same process is reiterated for each subset left behind. The accuracy and predictability of the final model are then expressed in terms of mean accuracy obtained by the 10-fold approach in ten individual rounds.

2.4. Models Evaluation by Statistical Measures

Different researchers suggest different parameters to check the accuracy of the developed models. Some of those parameters are used in this study, and their mathematical expressions are presented in Equations (2)–(9). Researchers recently used a new parameter to avoid overfitting of the model in artificial intelligence, and ML, known as an objective function (OF), is also used in this study [41,72]. If the values are low for Equations (2) and (5), the model is said to be good [30]. Similarly, if the values obtained from Equations (3) and (4) are close to 1, the model is termed as good [73]. However, it singlehandedly cannot judge the validity of a model because of its insensitiveness to the multiplication of the division of outcome. Likewise, according to Despotovic et al. (2016) [74], a model is deemed excellent if the result of Equation (7) is between 0 and 0.10; and good if lies between 0.11 and 0.20, respectively. The values of Equations (8) and (9) lie from 0 to positive infinity with a value nearer to zero signifies a good model. Lower value of OF identifies superior model performance.
Root   means   squared   error   ( RMSE ) = i = 1 n ( P i M i ) 2 N
Nash   Sutcliff   efficiency   ( NSE ) = 1 i = 1 n ( M i P i ) 2 i = 1 n ( M i M ¯ i ) 2
Correlation   coefficient   ( R ) = i = 1 n ( M i M ¯ i ) ( P i P ¯ i ) i = 1 n ( M i M ¯ i ) 2 i = 1 n ( P i P ¯ i ) 2
Mean   absolute   error   ( MAE ) = 1 n i = 1 n | P i M i |
Relative   squared   error   ( RSE ) = i = 1 n ( P i M i ) 2 i = 1 n ( M ¯ i M ¯ i ) 2
Relative   root   mean   squared   error   ( RRMSE ) = 1 | M ¯ | i = 1 n ( P i M i ) 2 N  
Performance   index   ( ρ ) = RRMSE 1 + R
Objective   function   ( OF ) = ( n T n TE n ) ρ T + 2 ( n TE n ) ρ TE
where n , M i , P i , M ¯ i   and   P ¯ i shows the total number of data points been partitioned into subsets, measured value, predicted value, mean of measured values, and mean of predicted value, respectively of the ith domain. The T and TE are the subscripts that correspond to the train and test datasets, respectively.

3. Mix Proportions for Bagasse Ash Concrete (BAC)

A series of experimental tests of bagasse ash concrete (BAC) was completed to validate the behavior of the MEP model through the validation requirement. The modified bagasse ash concrete mixes (BAC) and normal concrete (NC) samples were casted at 25 °C, and cured for 28 days to compare their mechanical properties. Various doses of bagasse ash (BA), ranging from 0% to 40%, were used as a cement replacement. The water-to-cement ratio for all the specimens was kept constant to compare the BAC with NC. Table 3 presents the complete formulation of the mix design proportions. Standard concrete cylinders (300 mm × 150 mm) and beams (100 mm × 100 mm × 500 mm) were produced with varying dosages of BA. The f c , f STS , f FS were tested at 28 days of curing age according to ASTM C39, ASTM C496, and ASTM C293 standards, respectively. The final results of the tested specimens were used to verify the behavior of the MEP models.

4. Results and Discussion

4.1. Mechanical Properties of BAC

The fundamental mechanical properties of BAC, namely f c , f STS and f FS were evaluated in the laboratory through testing beams and concrete cylinders using BA from 0 to 40% as a partial cement replacement. It can be noticed from Figure 2 that the strength of concrete increases up to 10BA (10% cement replaced with BA) and consistently decreases for 20BA, 30BA, and 40BA. The maximum strength gained is at 10% cement replacement and may be due to the small finest BA particle dispersed throughout the mix. The silica reacts with lime (resulted from cement hydration) and produces more calcium silicate hydrate (CSH) [49,75]. Additionally, the finer particle size fills the voids and increases the packing density. The strength reduction for higher replacement levels, i.e., 20BA, 30BA, and 40BA, is 6.5%, 17.3%, and 30.3%, respectively. This reduction might be attributable to a lack of sufficient Ca(OH)2.
As shown in Figure 2, the maximum f STS has been achieved by 10BA followed by 20BA. The increase in f STS relative to NC samples is 25.3% and 15.8% for 10% and 20% substitution of BA, respectively. However, maximum f STS has been achieved at 10% substitution of BA as a replacement of cement. The f STS decreases by 7.9% and 23.8% for 30% and 40% BA replacement, respectively. For f FS , the maximum strength is also attained by 10% BA. The increased f STS and f FS at 10% BA might be attributed to the micro-fibrous character of BA, associated with CSH production and the generation of aluminates, developing in a needle-shaped structure [76,77]. The interlocking and bonding of such needles occur between hydrated pastes, which immediately enhances f STS and f FS of BAC.

4.2. Formulation of BAC Mechanical Properties

The MEP findings for f c , f STS and f FS are evaluated in order to obtain empirical formulations for predicting the abovementioned characteristics related to the five input variables (w/c, BA%, CC, FA, and CA). For f c , f STS and f FS , the resulting MEP formulae are presented as Equations (10)–(12), respectively. Firstly, the essential input parameters were selected based on significant correlation and literature study for the derived equations. The MEP model was then trained on the data acquired from published literature. After acquiring the results predicted by the model, i.e., the RMSE and NSE values, the model is considered to be successfully trained on the given data. At the end of this process, the model provides empirical equations based on the number of input parameters. Finally, the derived Equations (10)–(12), were tested given the testing dataset.
Figure 3a,b shows a comparison plot of experimental and projected f c along with the expression for the regression line for all three sets, i.e., training, and testing. The slope of the line is known to be exactly equal to one for an ideal situation. Figure 3 shows that the established MEP model included the influence of all five inputs and delivered a high correlation between experimental and projected results, as evidenced from the slopes of training and testing, i.e., 0.8951 and 0.9315, respectively. The graph also infers that the established model has been trained and has a high generalization relationship and thus will perform well on unseen data as well.
f c   ( MPa ) = ( 1.1 x 1 + 1.1 x 2 ) + ( 8 x 0 2 × x 4 x 3 x 4 ) ( 16 x 0 3 ( 1.1 x 1 + 1.1 x 2 ) + 4 ( 5 x 1 x 3 ) 1.1 x 1 + 1.1 x 2 ) 2
f STS   ( MPa ) = ( x 0 + x 0 2 x 0 0.375 ) ( x 0 0.375 ( x 0 x 1 ) + ( x 0 x 0 0.375 ) ) + ( x 0 0.375 ) 2 ( x 0 2 0.375 ) 2 ( x 0 × x 1 2 x 2 ) + x 0 2 × x 3 x 4 0.375
  f FS   ( MPa ) = ( 2 x 3 x 0 x 4 + ( 3 x 2 + 0.97 ) 2 ( 2 x 1 89 x 0 ) ) + ( 2 x 0 ( x 1 89 x 0 ) ( 100 x 0 48.5 ) )
where;
x 0 = w c ;   x 1 = BA % ;   x 2 = CC ;   x 3 = FA ;   x 4 = CA
Figure 4a,b shows a similar comparative analysis for the f STS results. It can be observed that a good correlation exists between experimental and projected f STS . The slopes of the regression lines for the training, and testing datasets are close to ideal scenario, i.e., 0.9351, and 0.8903, respectively. The model developed for   f STS also performs extremely well on the training set. As a result, the problem of model over-fitting has been mitigated to a higher extent.
The graphical results of MEP model for f FS can be observed in Figure 5a,b, which displays the regression line slope for training, and testing sets equals to 0.9494, 0.9026, respectively. It can also be observed that a better correlation between experimental and projected results was achieved for f FS which highlighted an excellent performance of MEP on both training and testing set.

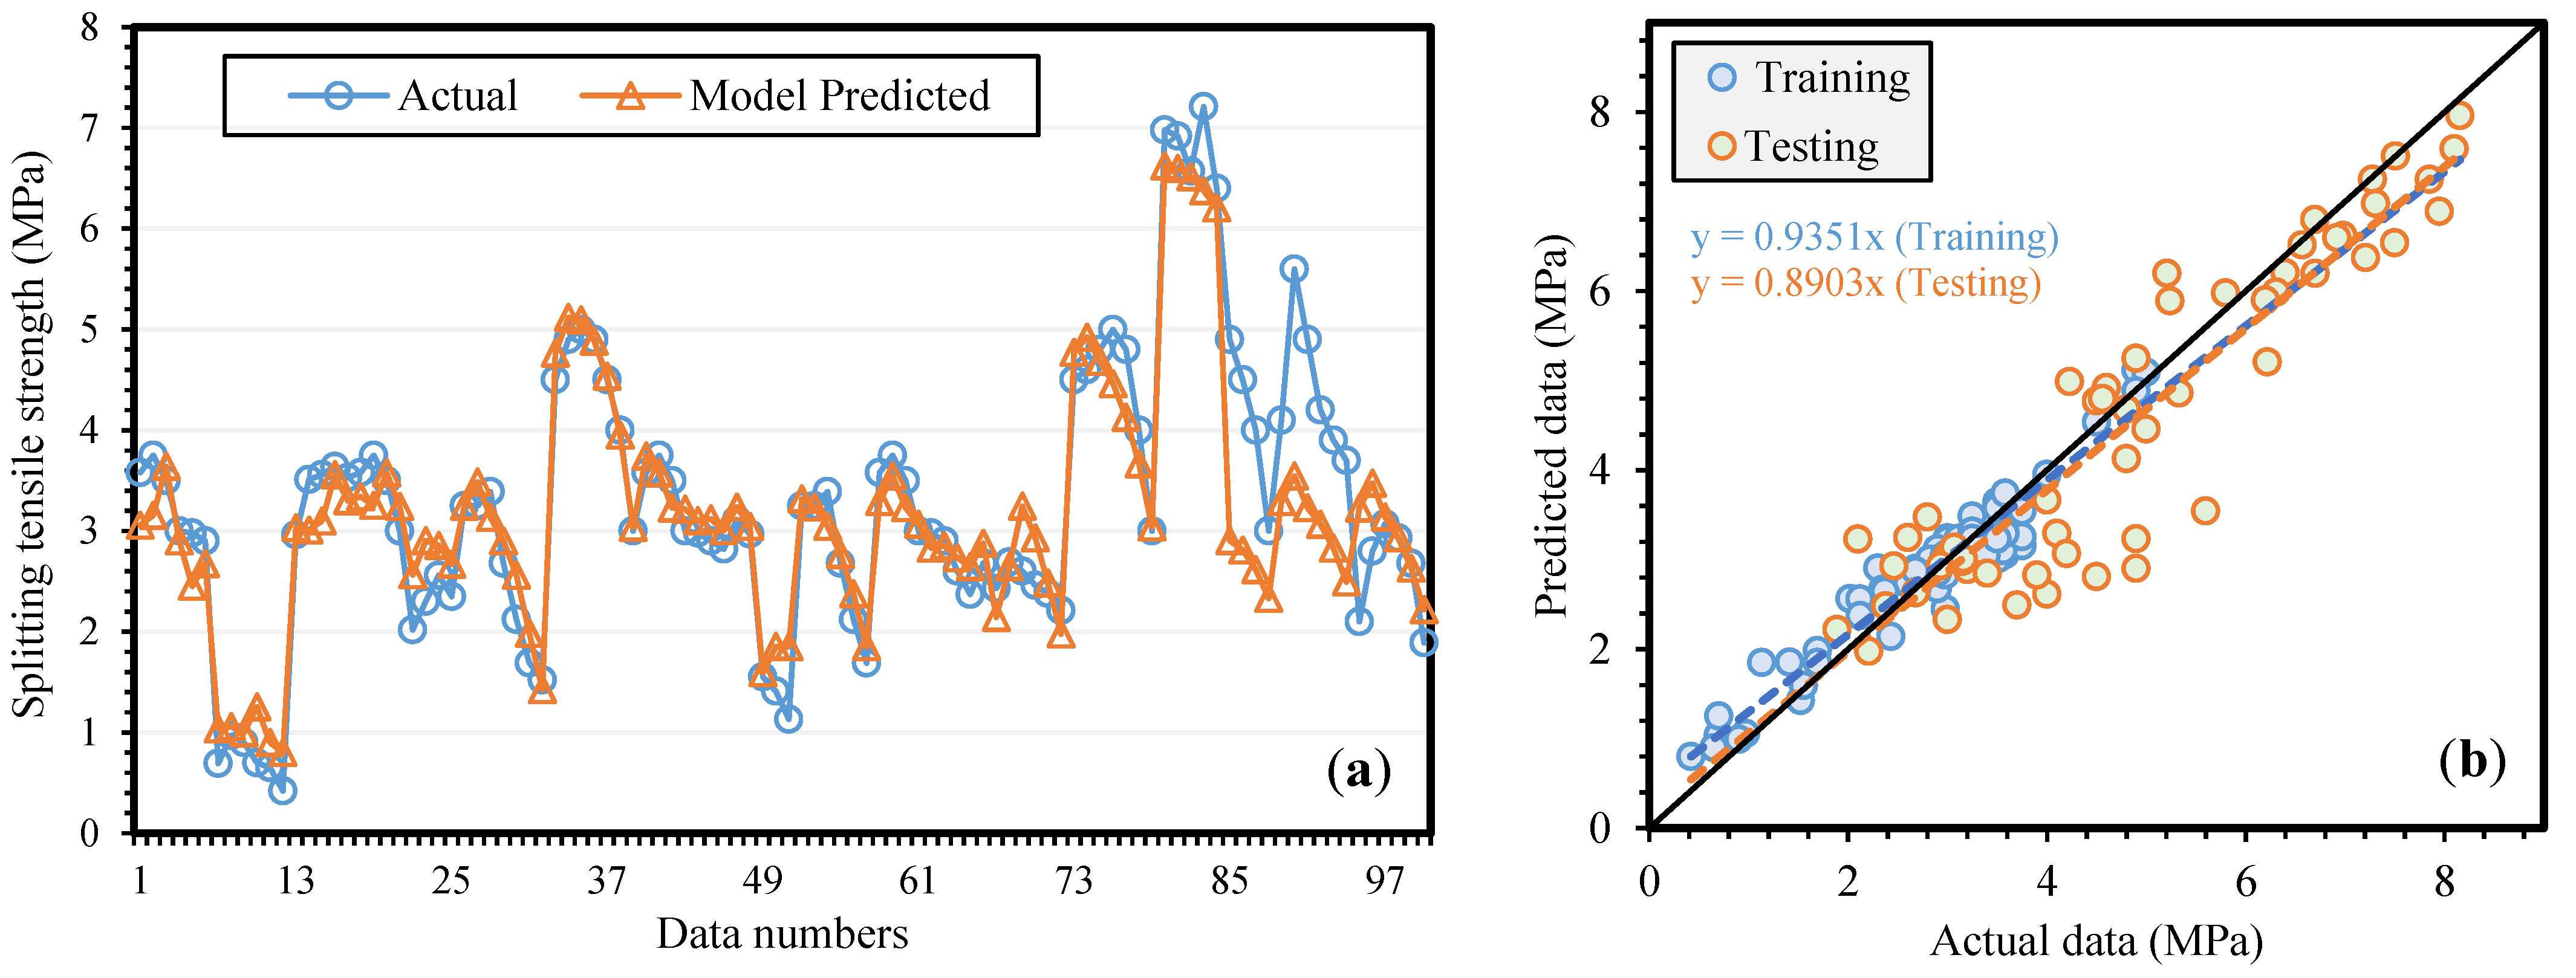
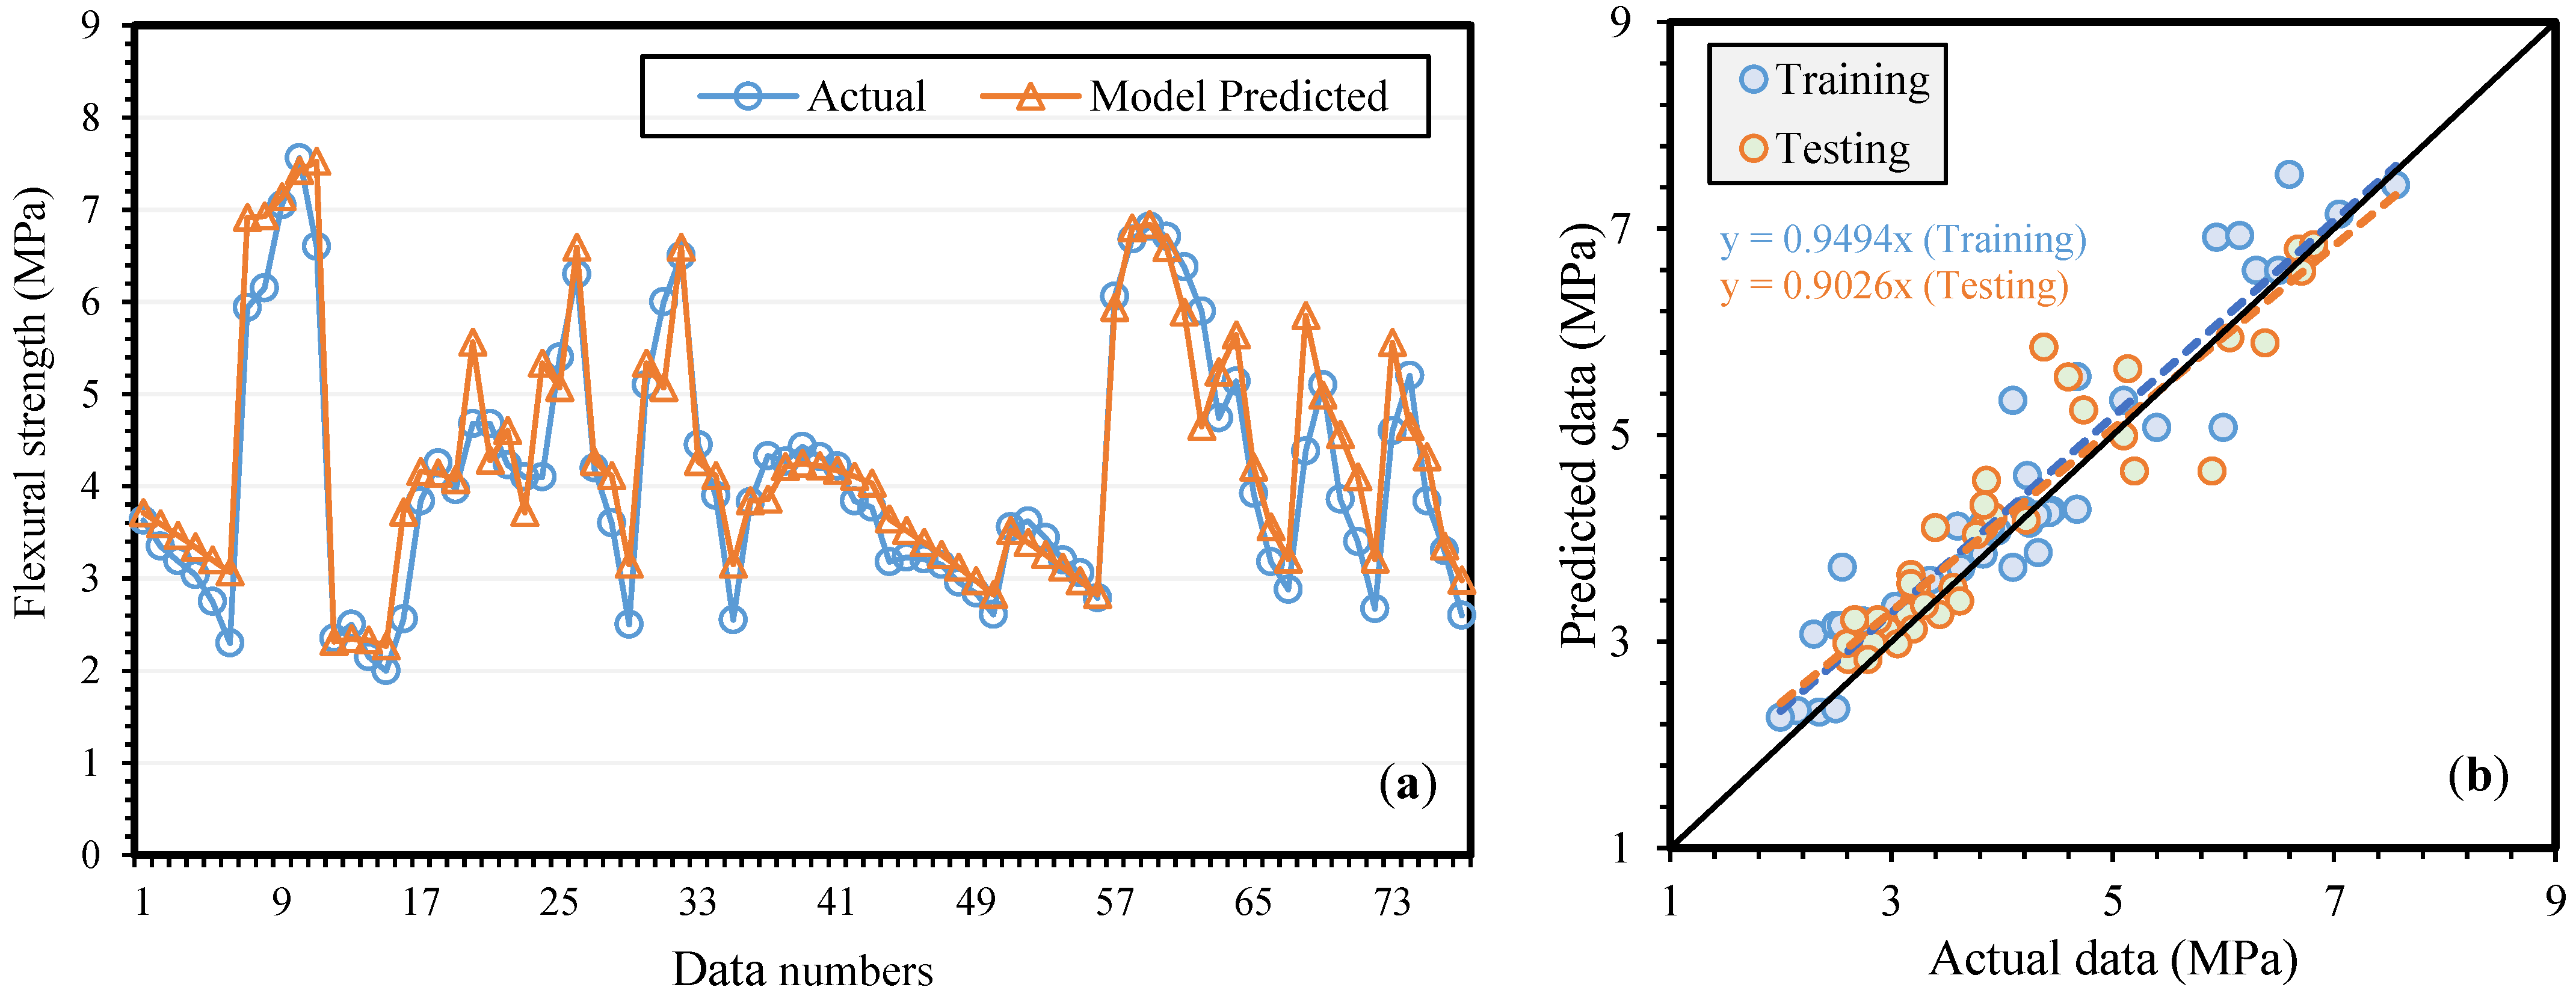
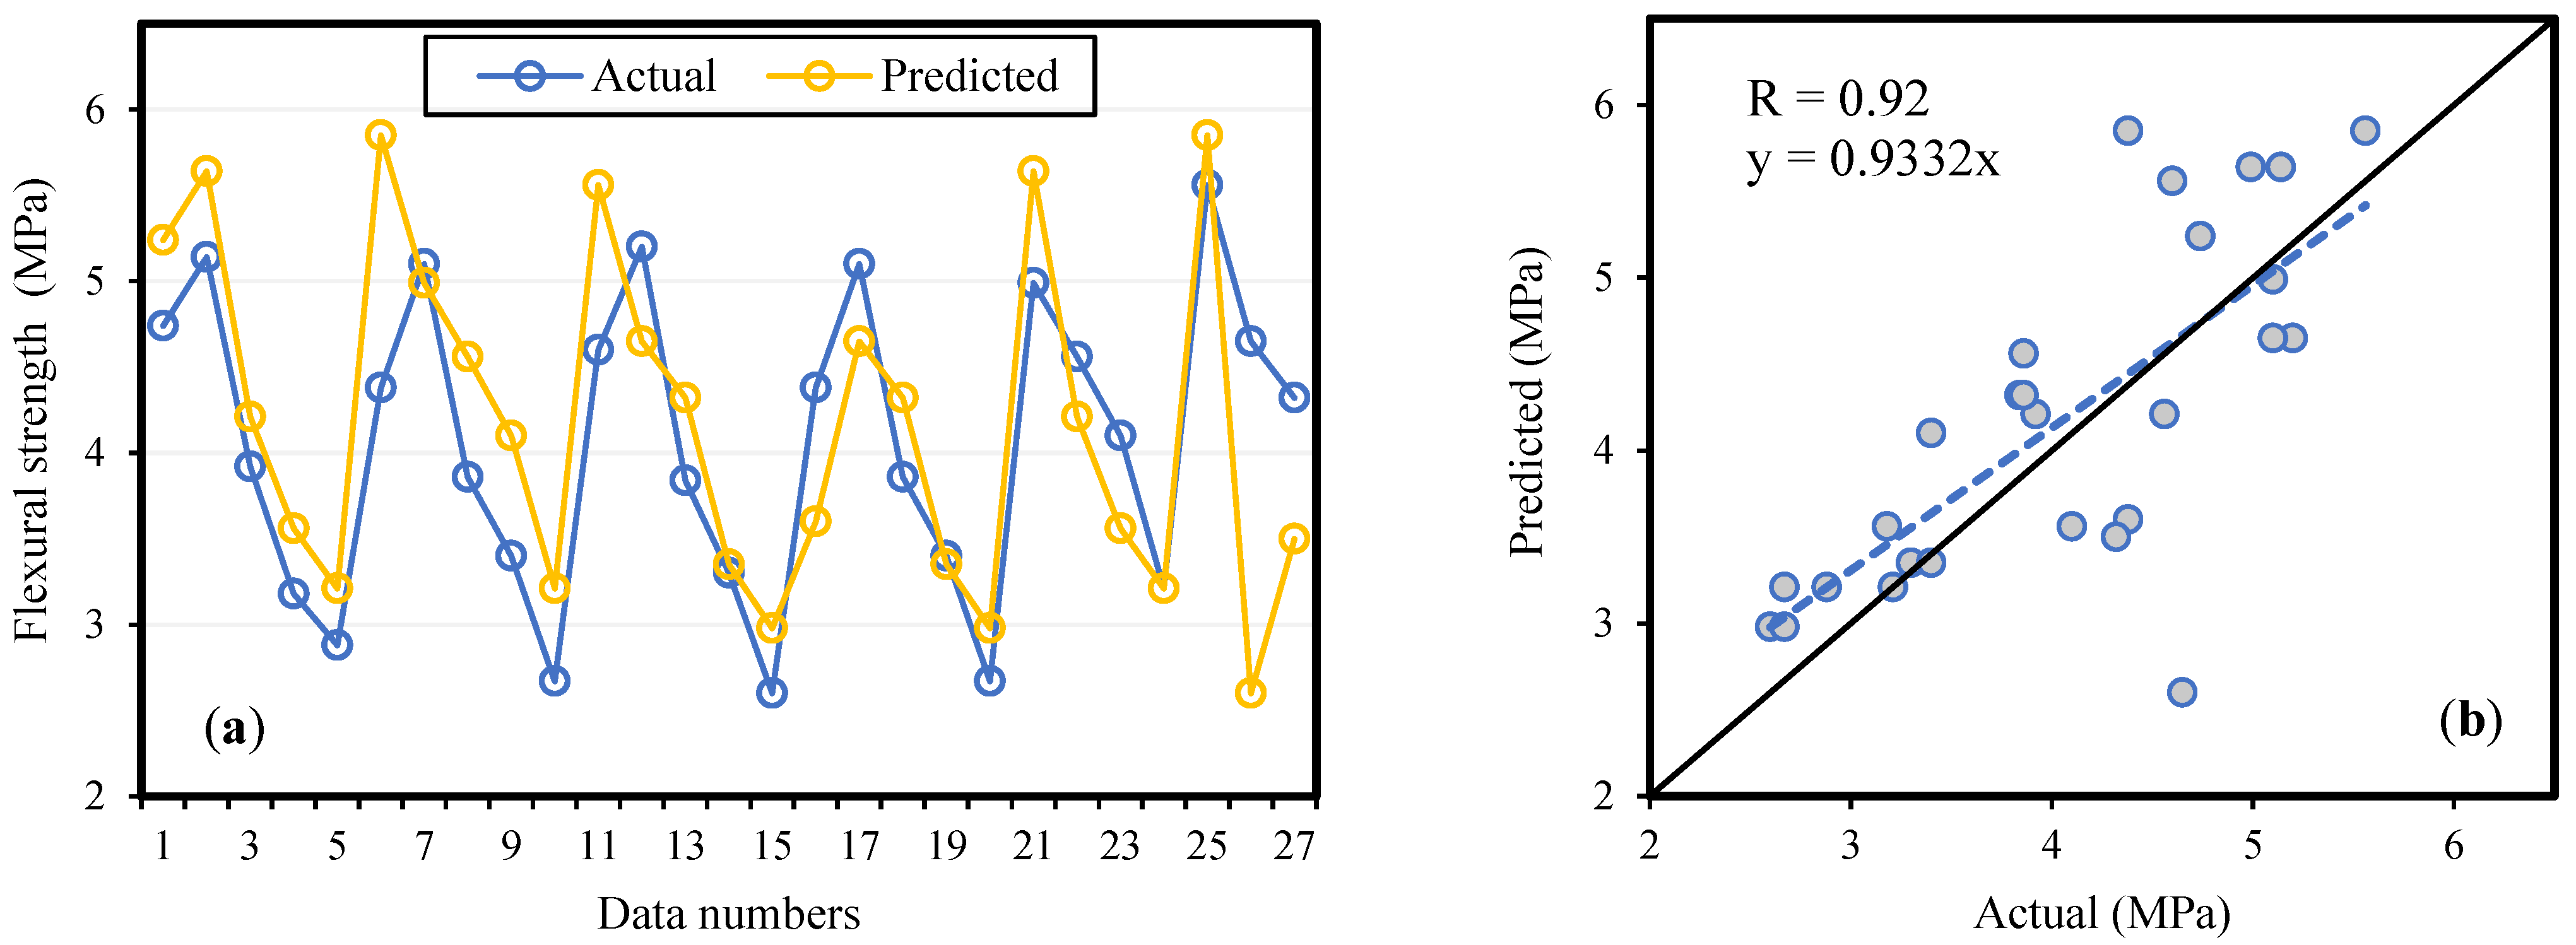
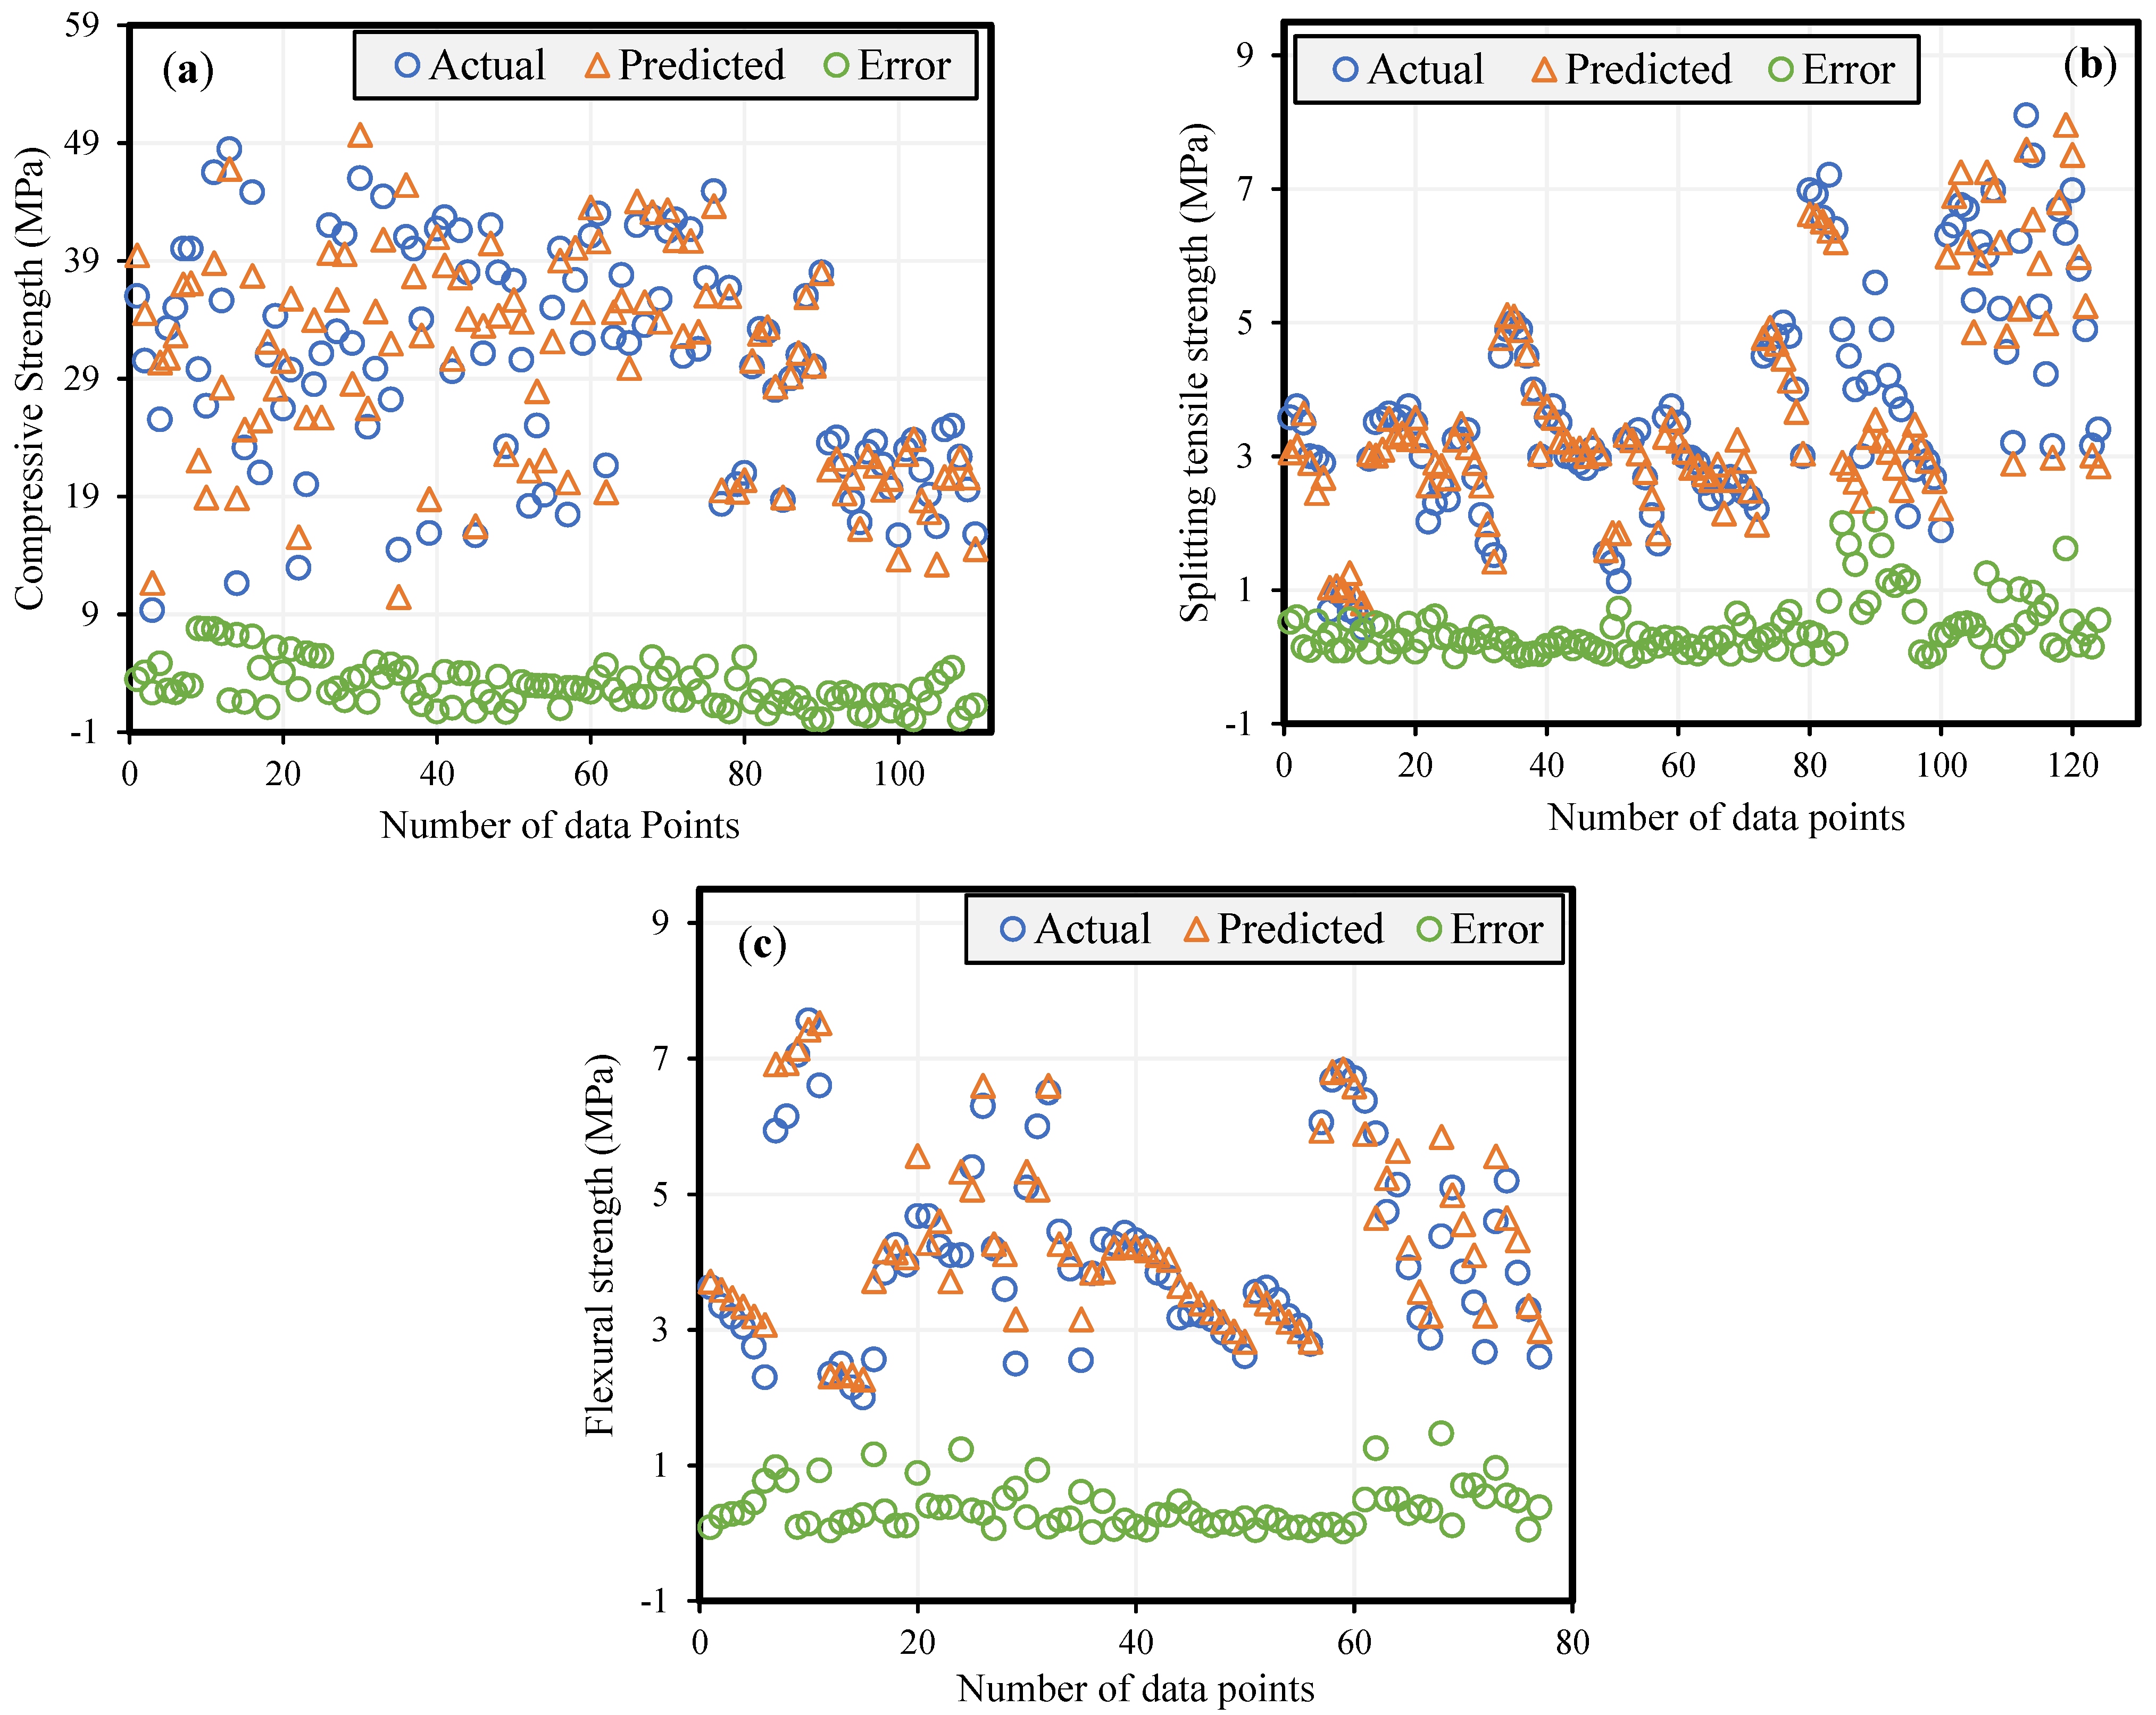
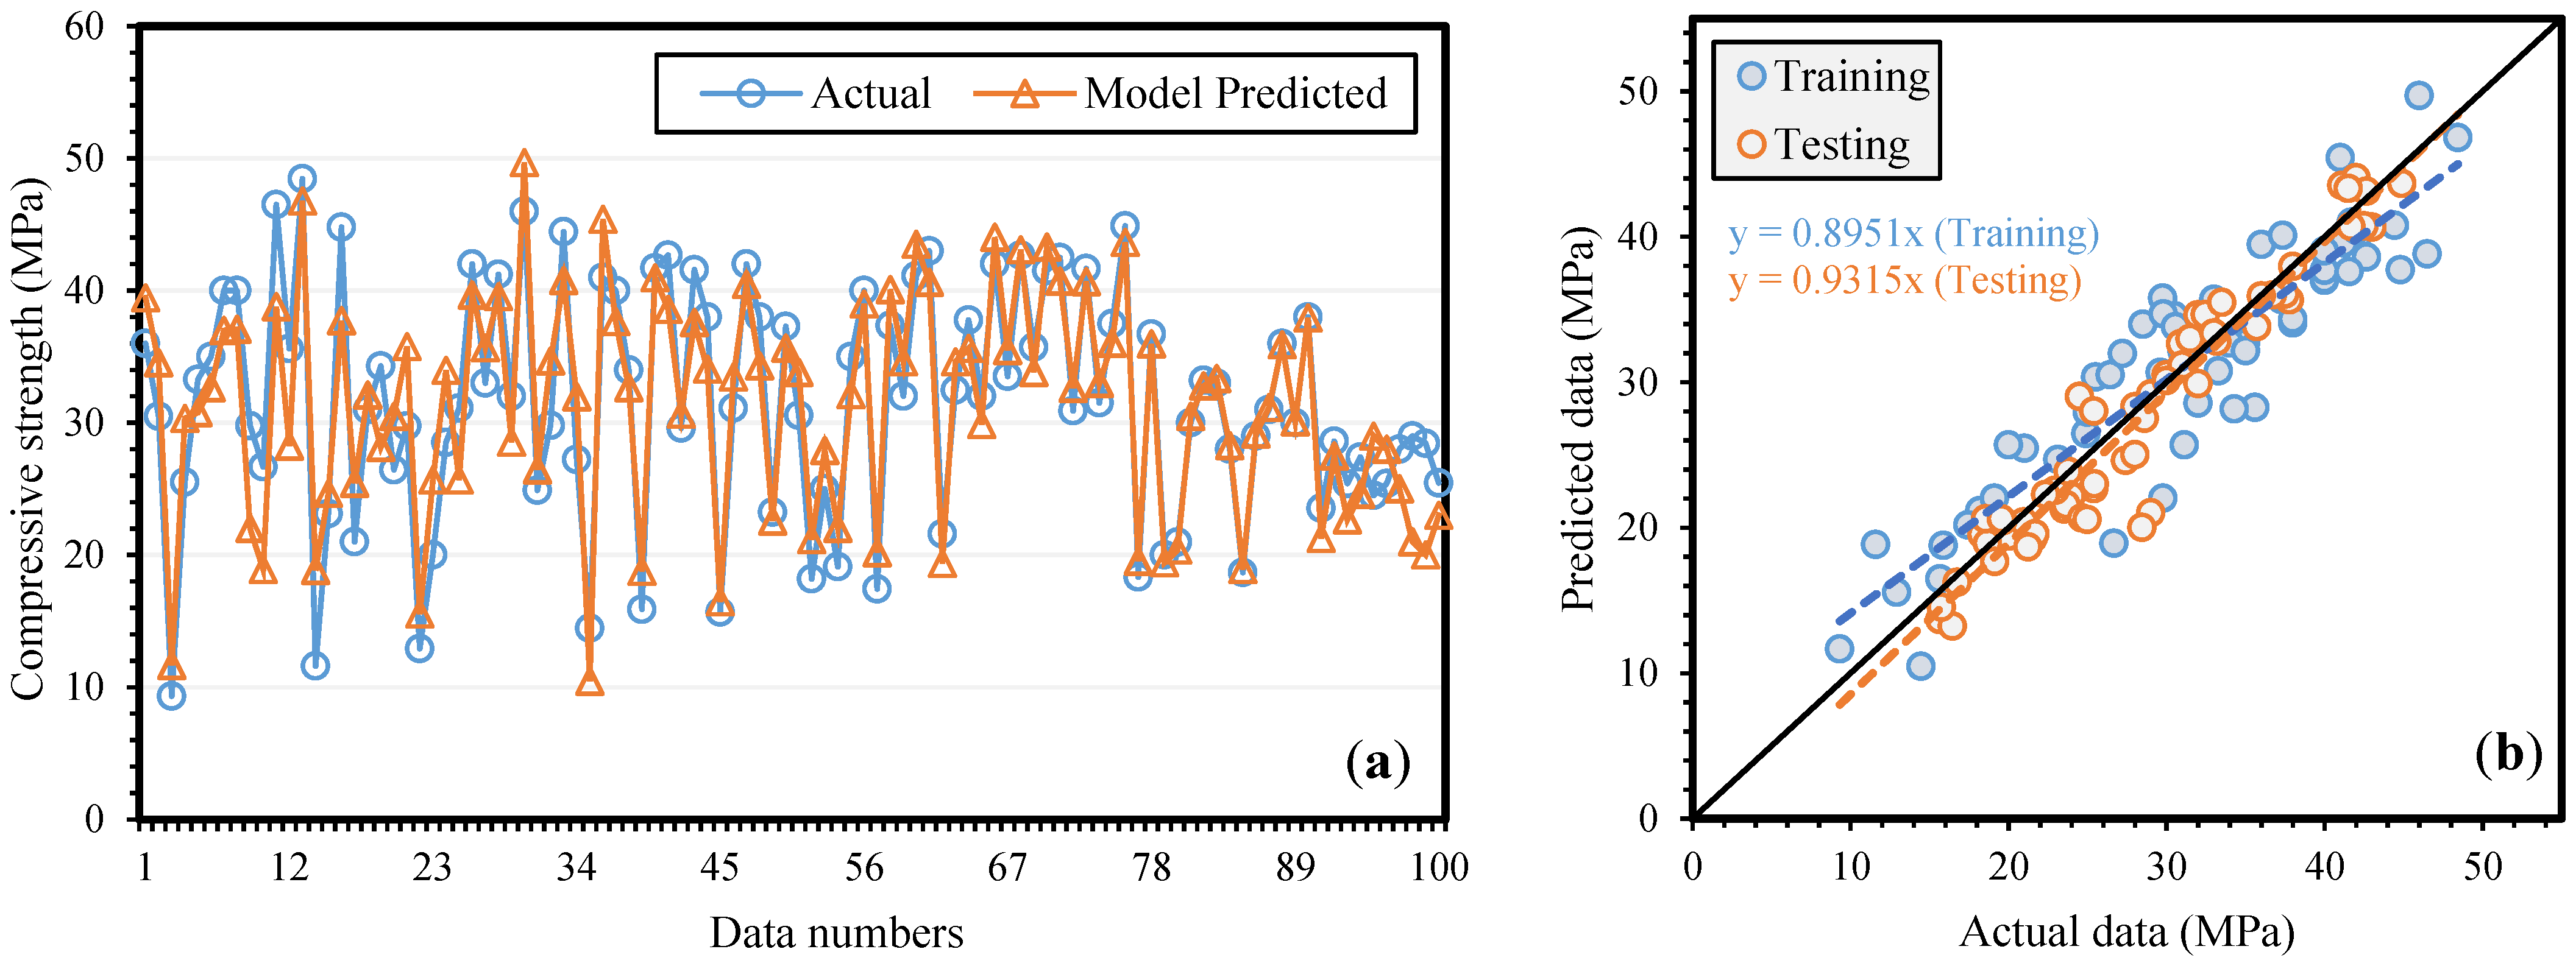
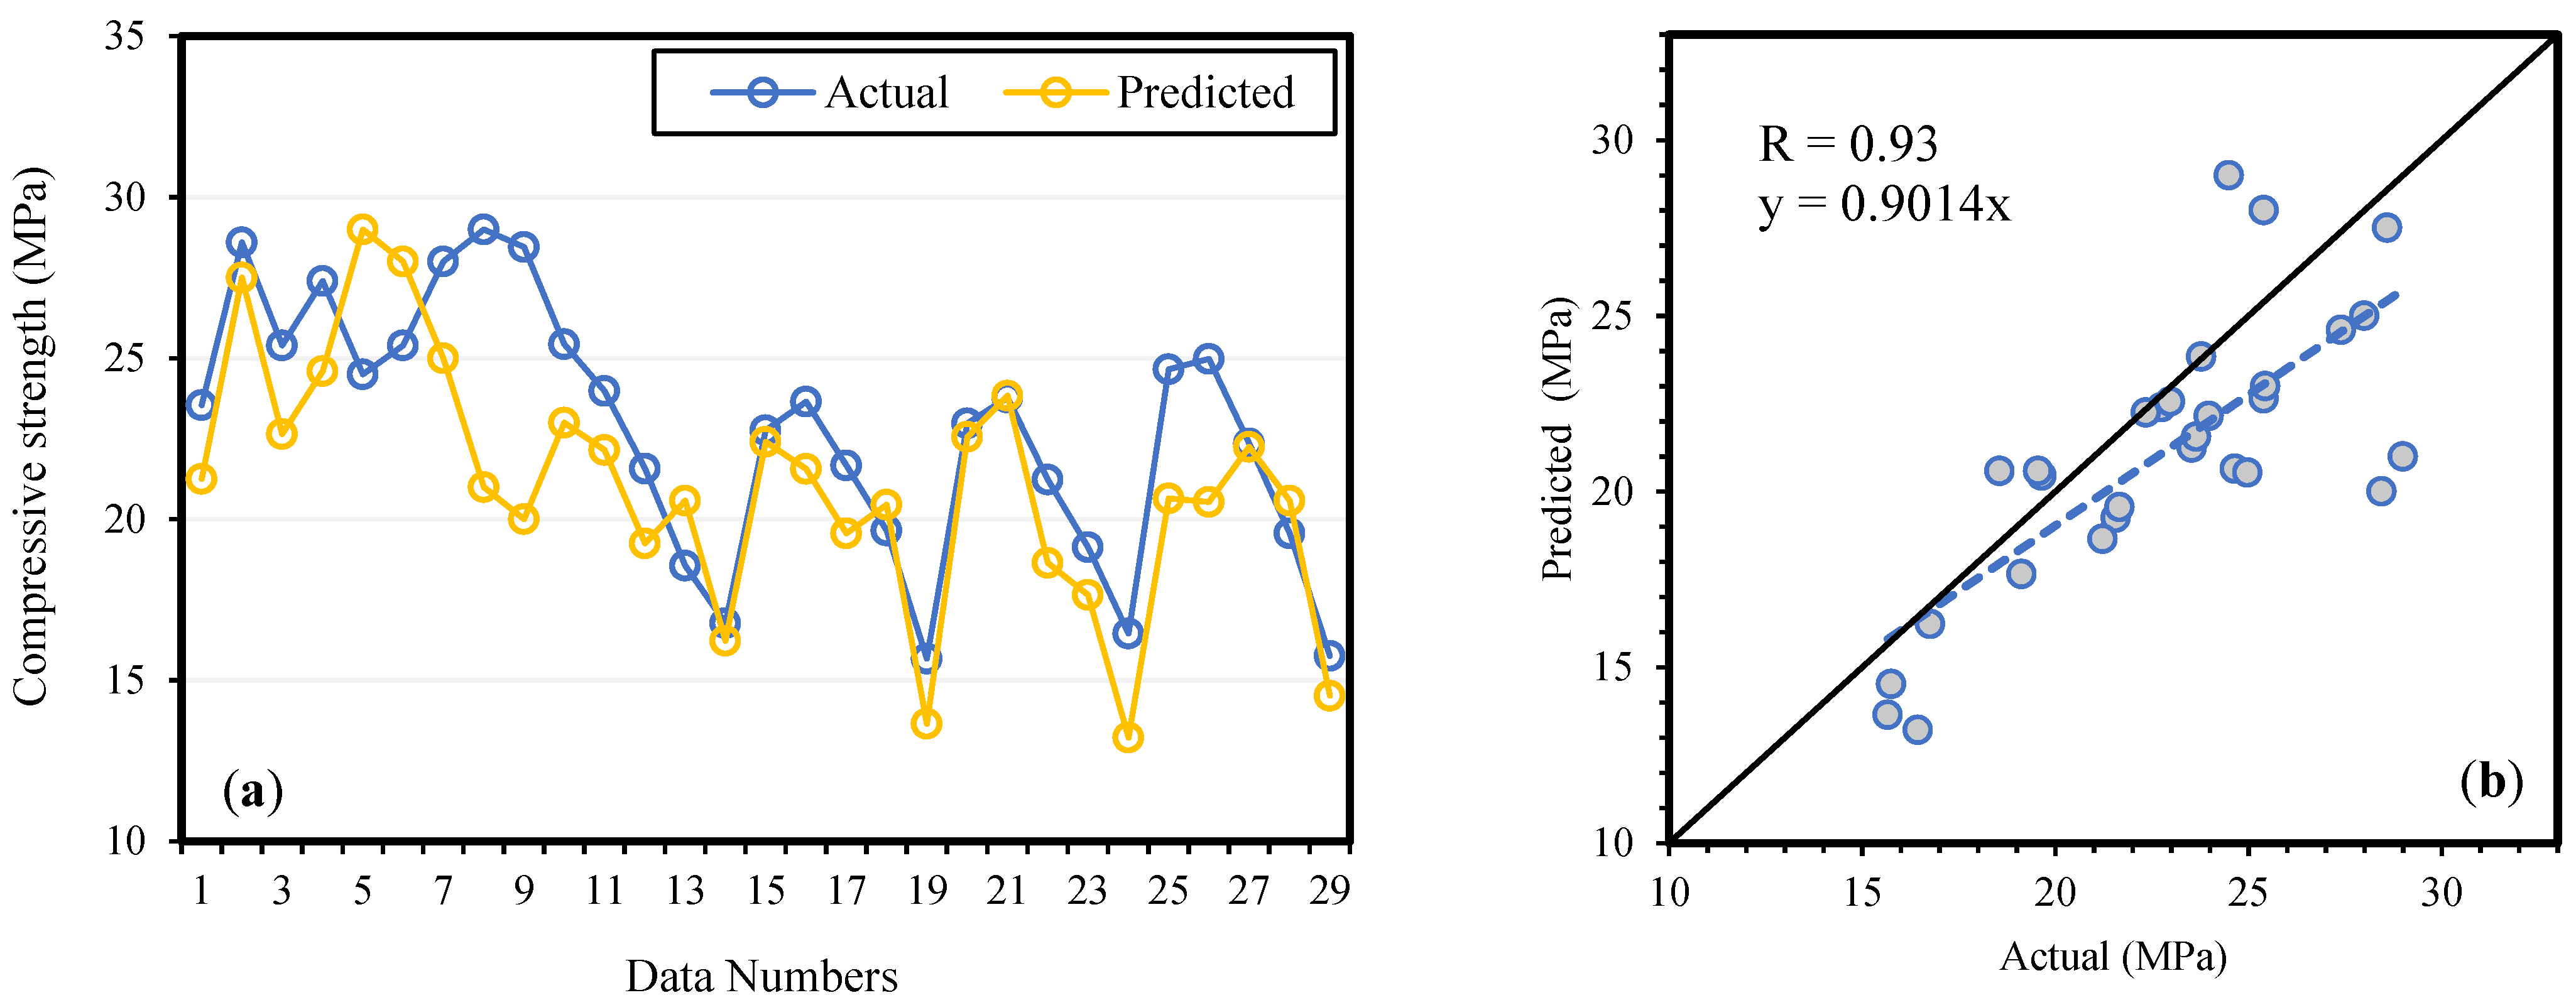
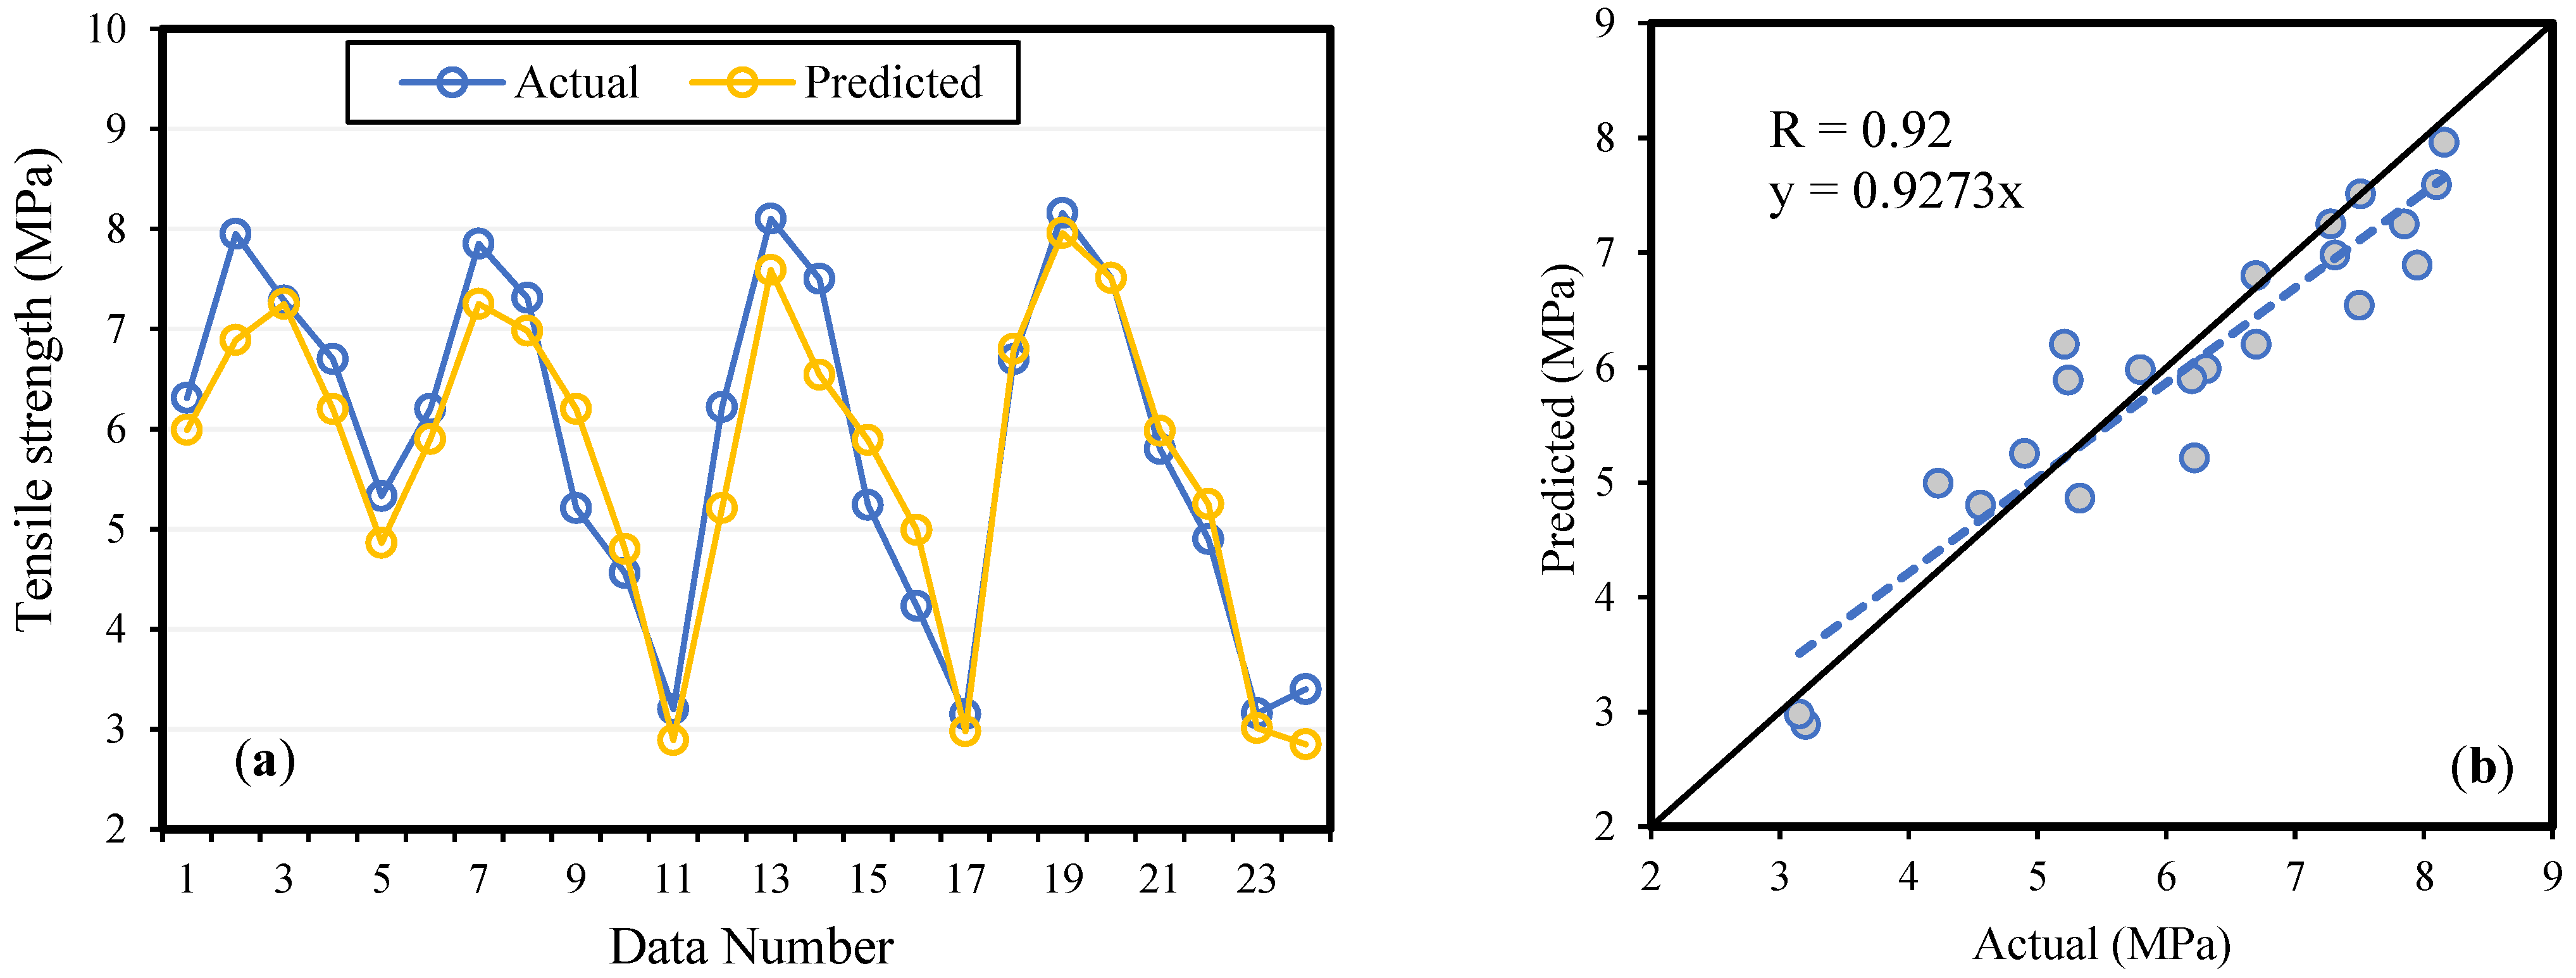
4.3. Models Validation by Experimental Data

A literature survey revealed that BA concrete behaves differently at high and low replacement levels. The results of the model validation, by experimental data, are shown in Figure 6, Figure 7 and Figure 8 for f c   ,   f STS and f FS , respectively. The slopes of the regression lines are 0.9014, 0.9273, and 0.9332 for f c , f STS and f FS , models which are nearly equal to 1 for the ideal case. During the models’ validation, the R value was observed to be 0.93, 0.92, and 0.92 for f c , f STS and f FS data, respectively. The results revealed that the modeling outcome is in line with the experimental results, and the MEP model considered the effect of the parameters essential for concrete. Therefore, it has been confirmed that the ML techniques can be easily used to model the complicated processes and interaction among concrete ingredients in predicting the properties of concrete given the significant input variables.

4.4. Statistical Analysis and Generalizability of the Models

The amount of data points utilized for model development affects its reliability. Therefore, the ratio between data points and inputs must be higher than five for both training and testing [78]. For f c , f STS and f FS datasets, the aforementioned ratio for the training set is 18.2, 17.5 and 17.1, respectively; and 6.4, 6.6 and 5.7, for the testing set, respectively. Moreover, Table 4 presents the outcomes of these statistical metrics for training, testing, and validation set of f c , f STS and f FS , respectively. It shows that all models have a high correlation coefficient (R) for the training set, i.e., 0.91, 0.90 and 0.91 for f c   , f STS and f FS , respectively; and for testing set 0.94, 0.92 and 0.91, respectively. The minimum and maximum NSE for f c , f STS and f FS models are 0.89 and 0.87; 0.91 and 0.85; and 0.86 and 0.87, respectively. The MAE and RMSE values are significantly lower for all the three sets in each model, indicating the excellent accuracy and high generalization capacity of models. The ST model can be classified as excellent based on RMSE, with values of 2.43, 2.65, and 3.25 for all three sets. Additionally, the findings show that MAE for all models is in a good range (1.45–3.98). Additionally, the OF for all three models, i.e., f c (0.036), f STS (0.031), and f FS (0.052) are near to zero, signifying excellent performance and thus confirming that the models successfully tackled the overfitting issue. The RRMSE values for all three developed models vary from 0.04 to 0.16, reflecting the accurateness of models. Figure 9 graphically shows the error between experimental and model predicted results in order to interpret the absolute error. The mean absolute error values are 2.87, 0.405 and 0.675 for f c , f STS and f FS , respectively. The max and min absolute errors are 1.95 and 0.075 for f c , 7.76 and 0.1 for f STS , 2.15 and 0.08 for f FS , respectively.
The conditions for checking the external predictability of the MEP models are given in Table 5. The researcher proposed that one of the regression line slopes (k and k’) crossing the origin must be close to 1 [79]. Additionally, the literature has mentioned that if the indicator, Rm is higher than 0.5, then the requirements for external validation of models are satisfied [80]. Table 5 shows that external validation requirements are met for all the three proposed MEP models for f c , f STS and f FS .

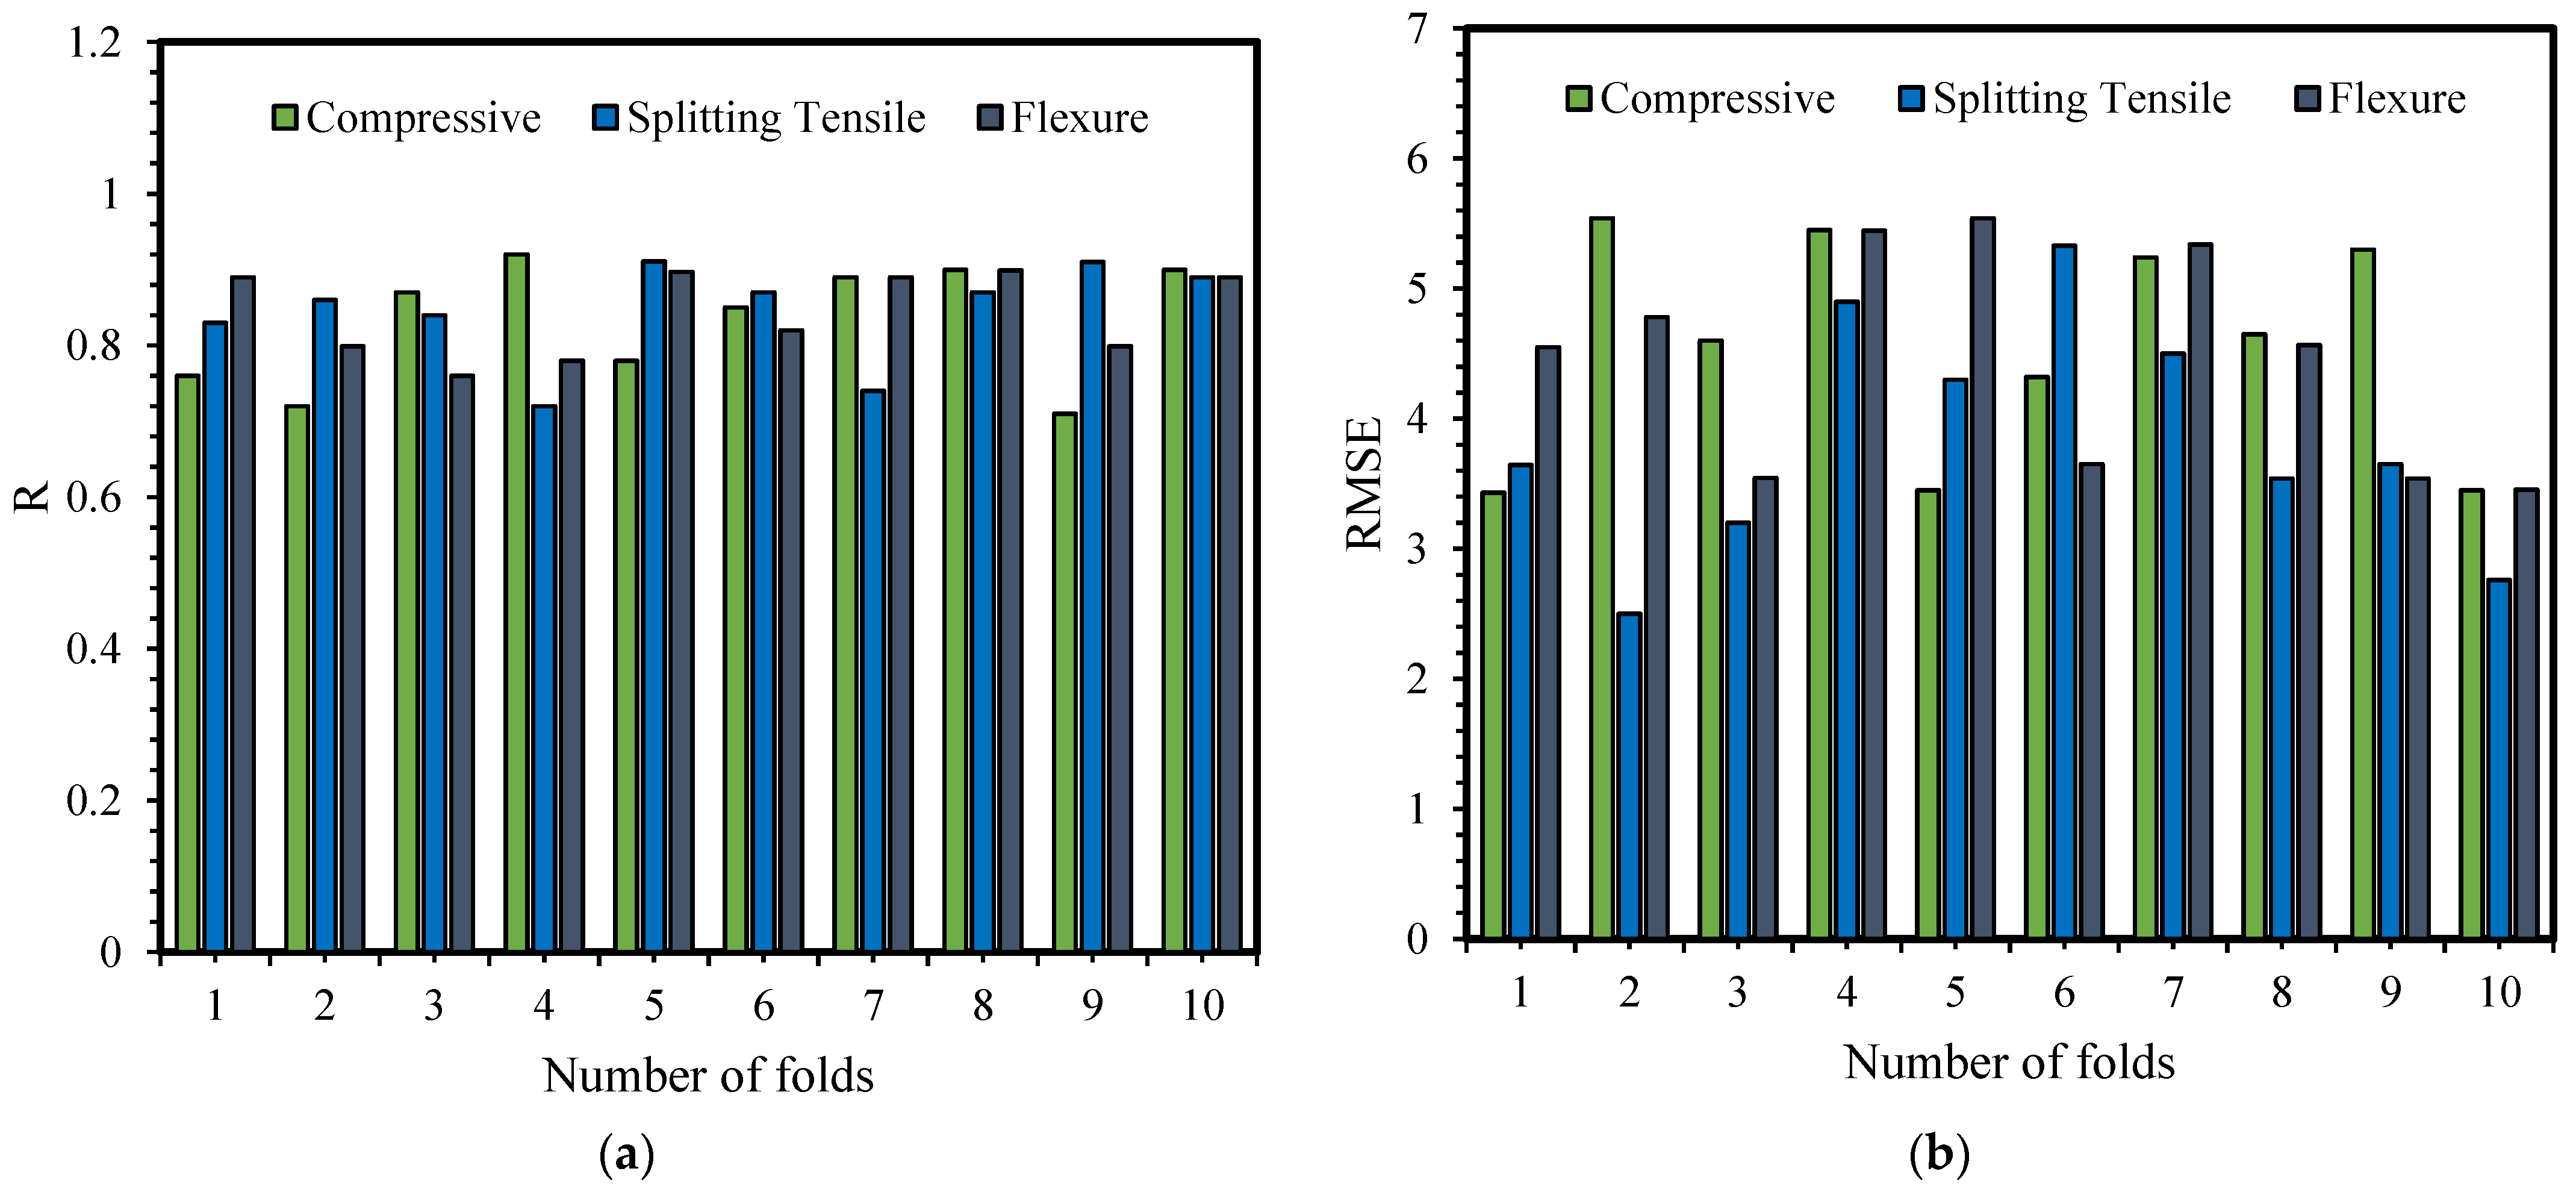
4.5. 10-Fold Cross-Validation Results

The 10-fold cross-validation can easily verify the robustness and generalized capability of ML models. This method has a parameter (k) which denotes the number of subclasses that a dataset can be split into. The 10-fold means that the given dataset can be segmented into 10 subsets or folds. This method is generally used to evaluate the ability of a model to analyze unseen data and also decreases the probability of error with random sampling.
All the three MEP models established for f c , f STS and f FS , were evaluated with 10-fold cross-validation using R and RMSE and graphically presented in Figure 10a,b, respectively. The figures show the variation in R and RMSE in each subset. However, an excellent mean accuracy can be seen. For f c , f STS and f FS , the mean value of R is 0.85, 0.89, and 0.85, respectively. In-10 fold, f STS obtained the minimum and maximum R of 0.91 and 0 0.72, respectively. Consequently f c , f STS and f FS , achieved mean RMSE of 4.54, 3.89, and 4.78, respectively. The f STS also has the smallest RMSE equals to 1.86, for the individual subset. Furthermore, the findings of 10-fold cross-validation demonstrate the MEP models are accurate and have a robust performance.

5. Conclusions

The present research implemented a twofold objective. Primarily, the mechanical properties, i.e., f c ,   f STS and f FS of bagasse ash concrete (BAC) were formulated by applying a supervised machine learning model, i.e., MEP. The training and testing of the models were accomplished based on widespread data collected from previous technical literature. Thereafter, sugarcane bagasse ash (BA) was used as a partial substitute for cement in various amounts (10%, 20%, 30% and 40%) to evaluate the mechanical properties. The developed MEP models were further validated through data obtained from experimental testing of BAC. The efficacy and performance of the projected models were reviewed via inferential statistical metrics, i.e., RMSE, RSE, NSE, MAE, RRMSE, ρ, OF and R. The final datasets were also cross-validated with k-fold algorithm, confirming the generalizability of models. The findings of developed models showed a good relationship with the experimental results, with R higher than 0.9; RMSE and MAE values less than 5, and OF values nearer to 0, for the all three projected MEP models for f c   , f STS and f FS . The proposed models also met the external validation requirements found in the previous technical literature. It is clear from the current research that the consumption of bagasse ash like waste material is essential for the production of green concrete and from the sustainability viewpoint. Moreover, the MEP model, supplemented with validation on practical laboratory dataset and further cross-validation studies, can provide such models that can directly influence the civil engineering industry.
The work presented in the current research has certain shortcomings. The main focus of this research was to examine the consequence of concrete constituents on the mechanical properties of BAC. Indeed, other important factors also need to be investigated that are important to mechanical viewpoints, such as curing conditions, type of cement, reactivity and type of ash, and testing conditions. It is strongly endorsed that further research should be accomplished with an extensive dataset for model training and testing. Moreover, some deep learning techniques, i.e., convolution neural network, neuro-fuzzy inference system, and ensemble modeling, should be considered for comparative analysis and accurate assessment of concrete properties.

Author Contributions

Supervision, review, and editing, M.N.A.; data curation and methodology, K.K.; investigation and review, F.A.; conceptualization, data analysis, writing original draft preparation, M.I.S.; formal analysis and modeling, M.F.J.; validation, proofreading, review, M.A.M. and K.U. All authors have read and agreed to the published version of the manuscript.

Funding

This research was partially funded by the ministry of science and higher education of the Russian federation as part of the world-class research center program: Advanced digital technologies (Contract No. 075-15-2020-934 dated 17 November 2020).

Institutional Review Board Statement

Not applicable.

Informed Consent Statement

Not applicable.

Data Availability Statement

The data used in this research was collected from published literature.

Conflicts of Interest

The authors declare that they have no competing interests.

References

  1. Du, H.; Dai Pang, S. Value-added utilization of marine clay as cement replacement for sustainable concrete production. J. Clean. Prod. 2018, 198, 867–873. [Google Scholar] [CrossRef]
  2. He, Z.; Zhu, X.; Wang, J.; Mu, M.; Wang, Y. Comparison of CO2 emissions from OPC and recycled cement production. Constr. Build. Mater. 2019, 211, 965–973. [Google Scholar] [CrossRef]
  3. Mao, L.X.; Hu, Z.; Xia, J.; Feng, G.L.; Azim, I.; Yang, J.; Liu, Q.F. Multi-phase modelling of electrochemical rehabilitation for ASR and chloride affected concrete composites. Compos. Struct. 2019, 207, 176–189. [Google Scholar] [CrossRef]
  4. Iqbal, M.F.; Javed, M.F.; Rauf, M.; Azim, I.; Ashraf, M.; Yang, J.; Liu, Q.F. Sustainable utilization of foundry waste: Forecasting mechanical properties of foundry sand based concrete using multi-expression programming. Sci. Total Environ. 2021, 780, 146524. [Google Scholar] [CrossRef] [PubMed]
  5. Iqbal, M.F.; Liu, Q.F.; Azim, I.; Zhu, X.; Yang, J.; Javed, M.F.; Rauf, M. Prediction of mechanical properties of green concrete incorporating waste foundry sand based on gene expression programming. J. Hazard. Mater. 2020, 384, 121322. [Google Scholar] [CrossRef] [PubMed]
  6. Frontera, P.; Malara, A.; Mistretta, M. Recent Trends in Sustainability Assessment of “Green Concrete”. In Smart Innovation, Systems and Technologies; New Metropolitan Perspectives; Bevilacqua, C., Calabrò, F., Della Spina, L., Eds.; Springer Nature: Cham, Switzerland, 2020; Volume 178, pp. 1402–1412. [Google Scholar]
  7. Pippo, W.A.; Luengo, C.A. Sugarcane energy use: Accounting of feedstock energy considering current agro-industrial trends and their feasibility. Int. J. Energy Environ. Eng. 2013, 4, 10. [Google Scholar] [CrossRef] [Green Version]
  8. Cordeiro, G.C.; Toledo Filho, R.D.; Fairbairn, E.M.; Tavares, L.M.; Oliveira, C.H. Influence of mechanical grinding on the pozzolanic activity of residual sugarcane bagasse ash. In Proceedings of the International RILEM Conference on the Use of Recycled Materials in Building and Structures, Barcelona, Spain, 8–11 November 2004; pp. 731–740. [Google Scholar]
  9. Pedersen, K.H.; Jensen, A.D.; Skjøth-Rasmussen, M.S.; Dam-Johansen, K. A review of the interference of carbon containing fly ash with air entrainment in concrete. Prog. Energy Combust. Sci. 2008, 34, 135–154. [Google Scholar] [CrossRef]
  10. Chusilp, N.; Jaturapitakkul, C.; Kiattikomol, K. Utilization of bagasse ash as a pozzolanic material in concrete. Constr. Build. Mater. 2009, 23, 3352–3358. [Google Scholar] [CrossRef]
  11. Hasan, N.M.S.; Sobuz, H.R.; Tamanna, N.; Slah, M. Properties of concrete by using bagasse ash and recycle aggregate. Concr. Res. Lett. 2014, 5, 768–785. [Google Scholar]
  12. Jagadesh, P.; Ramachandramurthy, A.; Murugesan, R. Evaluation of mechanical properties of Sugar Cane Bagasse Ash concrete. Constr. Build. Mater. 2018, 176, 608–617. [Google Scholar] [CrossRef]
  13. Bahurudeen, A.; Santhanam, M. Performance evaluation of sugarcane bagasse ash-based cement for durable concrete. In Proceedings of the 4th International Conference on the Durability of Concrete Structures, Purdue University, West Lafayette, IN, USA, 24–26 July 2014. [Google Scholar]
  14. Bahurudeen, A.; Wani, K.; Basit, M.A.; Santhanam, M. Assesment of pozzolanic performance of sugarcane bagasse ash. J. Mater. Civ. Eng. 2016, 28, 04015095. [Google Scholar] [CrossRef]
  15. Rerkpiboon, A.; Tangchirapat, W.; Jaturapitakkul, C. Strength, chloride resistance, and expansion of concretes containing ground bagasse ash. Constr. Build. Mater. 2015, 101, 983–989. [Google Scholar] [CrossRef]
  16. Khan, M.I. Predicting properties of high performance concrete containing composite cementitious materials using artificial neural networks. Autom. Constr. 2012, 22, 516–524. [Google Scholar] [CrossRef]
  17. Dantas, A.T.A.; Leite, M.B.; de Jesus Nagahama, K. Prediction of compressive strength of concrete containing construction and demolition waste using artificial neural networks. Constr. Build. Mater. 2013, 38, 717–722. [Google Scholar] [CrossRef]
  18. Golafshani, E.M.; Behnood, A.; Arashpour, M. Predicting the compressive strength of normal and High-Performance Concretes using ANN and ANFIS hybridized with Grey Wolf Optimizer. Constr. Build. Mater. 2020, 232, 117266. [Google Scholar] [CrossRef]
  19. Parichatprecha, R.; Nimityongskul, P. Analysis of durability of high performance concrete using artificial neural networks. Constr. Build. Mater. 2009, 23, 910–917. [Google Scholar] [CrossRef]
  20. Farooq, F.; Nasir Amin, M.; Khan, K.; Rehan Sadiq, M.; Javed, M.F.; Aslam, F.; Alyousef, R. A Comparative Study of Random Forest and Genetic Engineering Programming for the Prediction of Compressive Strength of High Strength Concrete (HSC). Appl. Sci. 2020, 10, 7330. [Google Scholar] [CrossRef]
  21. Zhang, J.; Li, D.; Wang, Y. Toward intelligent construction: Prediction of mechanical properties of manufactured-sand concrete using tree-based models. J. Clean. Prod. 2020, 258, 120665. [Google Scholar] [CrossRef]
  22. Sun, Y.; Li, G.; Zhang, J.; Qian, D. Prediction of the strength of rubberized concrete by an evolved random forest model. Adv. Civ. Eng. 2019, 2019. [Google Scholar] [CrossRef] [Green Version]
  23. Chou, J.S.; Chiu, C.K.; Farfoura, M.; Al-Taharwa, I. Optimizing the prediction accuracy of concrete compressive strength based on a comparison of data-mining techniques. J. Comput. Civ. Eng. 2011, 25, 242–253. [Google Scholar] [CrossRef]
  24. Deng, F.; He, Y.; Zhou, S.; Yu, Y.; Cheng, H.; Wu, X. Compressive strength prediction of recycled concrete based on deep learning. Constr. Build. Mater 2018, 175, 562–569. [Google Scholar] [CrossRef]
  25. Alexiadis, A. Deep Multiphysics and Particle–Neuron Duality: A Computational Framework Coupling (Discrete) Multiphysics and Deep Learning. Appl. Sci. 2019, 9, 5369. [Google Scholar] [CrossRef] [Green Version]
  26. Ashteyat, A.; Obaidat, Y.T.; Murad, Y.Z.; Haddad, R. Compressive strength prediction of lightweight short columns at elevated temperature using gene expression programing and artificial neural network. J. Civ. Eng. Manag. 2020, 26, 189–199. [Google Scholar] [CrossRef]
  27. Behnood, A.; Golafshani, E.M. Predicting the compressive strength of silica fume concrete using hybrid artificial neural network with multi-objective grey wolves. J. Clean. Prod. 2018, 202, 54–64. [Google Scholar] [CrossRef]
  28. Sadrmomtazi, A.; Sobhani, J.; Mirgozar, M. Modeling compressive strength of EPS lightweight concrete using regression, neural network and ANFIS. Constr. Build. Mater. 2013, 42, 205–216. [Google Scholar] [CrossRef]
  29. Öztaş, A.; Pala, M.; Özbay, E.; Kanca, E.; Caglar, N.; Bhatti, M.A. Predicting the compressive strength and slump of high strength concrete using neural network. Constr. Build. Mater. 2006, 20, 769–775. [Google Scholar] [CrossRef]
  30. Nguyen, T.; Kashani, A.; Ngo, T.; Bordas, S. Deep neural network with high-order neuron for the prediction of foamed concrete strength. Comput.-Aided Civ. Infrastruct. Eng. 2019, 34, 316–332. [Google Scholar] [CrossRef]
  31. Getahun, M.A.; Shitote, S.M.; Gariy, Z.C.A. Artificial neural network based modelling approach for strength prediction of concrete incorporating agricultural and construction wastes. Constr. Build. Mater. 2018, 190, 517–525. [Google Scholar] [CrossRef]
  32. Oltean, M.; Groşan, C. Evolving evolutionary algorithms using multi expression programming. In Advances in Artificial Life. ECAL 2003. Lecture Notes in Computer Science; Banzhaf, W., Ziegler, J., Christaller, T., Dittrich, P., Kim, J.T., Eds.; Springer: BBerlin/Heidelberg, Germany, 2003; Volume 2801, pp. 651–658. [Google Scholar] [CrossRef]
  33. Shah, M.; Alaloul, W.; Alqahtani, A.; Aldrees, A.; Musarat, M.; Javed, M. Predictive Modeling Approach for Surface Water Quality: Development and Comparison of Machine Learning Models. Sustainability 2021, 13, 7515. [Google Scholar] [CrossRef]
  34. Javed, M.F.; Farooq, F.; Memon, S.A.; Akbar, A.; Khan, M.A.; Aslam, F.; Alyousef, R.; Alabduljabbar, H.; Rehman, S.K.U. New prediction model for the ultimate axial capacity of concrete-filled steel tubes: An evolutionary approach. Crystals 2020, 10, 741. [Google Scholar] [CrossRef]
  35. Aslam, F.; Farooq, F.; Amin, M.N.; Khan, K.; Waheed, A.; Akbar, A.; Alabdulijabbar, H. Applications of Gene Expression Programming for Estimating Compressive Strength of High-Strength Concrete. Adv. Civ. Eng. 2020, 2020. [Google Scholar] [CrossRef]
  36. Shah, M.I.; Memon, S.A.; Khan Niazi, M.S.; Amin, M.N.; Aslam, F.; Javed, M.F. Machine Learning-Based Modeling with Optimization Algorithm for Predicting Mechanical Properties of Sustainable Concrete. Adv. Civ. Eng. 2021, 2021. [Google Scholar] [CrossRef]
  37. Oltean, M.; Grosan, C. A comparison of several linear genetic programming techniques. Complex Syst. 2003, 14, 285–314. [Google Scholar]
  38. Shah, M.I.; Amin, M.N.; Khan, K.; Niazi, M.S.K.; Aslam, F.; Alyousef, R.; Mosavi, A. Performance Evaluation of Soft Computing for Modeling the Strength Properties of Waste Substitute Green Concrete. Sustainability 2021, 5, 2867. [Google Scholar] [CrossRef]
  39. Arabshahi, A.; Gharaei-Moghaddam, N.; Tavakkolizadeh, M. Development of applicable design models for concrete columns confined with aramid fiber reinforced polymer using Multi-Expression Programming. Structures 2020, 23, 225–244. [Google Scholar] [CrossRef]
  40. Oltean, M.; Dumitrescu, D. Multi Expression Programming; Technical report, UBB-01-2002; Babeş-Bolyai University: Cluj-Napoca, Romania, 2002. [Google Scholar]
  41. Gandomi, A.H.; Faramarzifar, A.; Rezaee, P.G.; Asghari, A.; Talatahari, S. New design equations for elastic modulus of concrete using multi expression programming. J. Civ. Eng. Manag. 2015, 21, 761–774. [Google Scholar] [CrossRef] [Green Version]
  42. Sharifi, S.; Abrishami, S.; Gandomi, A.H. Consolidation assessment using Multi Expression Programming. Appl. Soft Comput. 2020, 86, 105842. [Google Scholar] [CrossRef]
  43. Zhang, Q.; Yang, B.; Wang, L.; Zhu, F. Predicting cement compressive strength using double-layer multi-expression Programming. In Proceedings of the 2012 Fourth International Conference on Computational and Information Sciences, Chongqing, China, 17–19 August 2012; pp. 94–97. [Google Scholar]
  44. Alavi, A.H.; Mollahasani, A.; Gandomi, A.H.; Bazaz, J.B. Formulation of secant and reloading soil deformation moduli using multi expression programming. Eng. Comput. 2012, 29, 173–197. [Google Scholar] [CrossRef]
  45. Mousavi, S.M.; Gandomi, A.H.; Alavi, A.H.; Vesalimahmood, M. Modeling of compressive strength of HPC mixes using a combined algorithm of genetic programming and orthogonal least squares. Struct. Eng. Mech. 2010, 36, 225–241. [Google Scholar] [CrossRef]
  46. Srinivasan, R.; Sathiya, K. Experimental study on bagasse ash in concrete. Int. J. Serv. Learn. Eng. 2010, 5, 60–66. [Google Scholar] [CrossRef] [Green Version]
  47. Patel, J.A.; Raijiwala, D. Experimental study on use of sugar cane bagasse ash in concrete by partially replacement with cement. Int. J. Innov. Res. Sci. Eng. Technol. 2015, 4, 2228–2232. [Google Scholar]
  48. Neeraja, D.; Jagan, S.; Kumar, S.; Mohan, P.G. Experimental Study on Strength Properties of Concrete by Partial Replacement of Cement with Sugarcane Bagasse Ash. Nat. Environ. Pollut. Technol. 2014, 13, 629. [Google Scholar]
  49. Ganesan, K.; Rajagopal, K.; Thangavel, K. Evaluation of bagasse ash as supplementary cementitious material. Cem. Concr. Compos. 2007, 29, 515–524. [Google Scholar] [CrossRef]
  50. Subramani, T.; Prabhakaran, M. Experimental study on bagasse ash in concrete. Int. J. Appl. Innov. Eng. Manag. 2015, 4, 163–172. [Google Scholar]
  51. Rukzon, S.; Chindaprasirt, P. Utilization of bagasse ash in high-strength concrete. Mater. Des. 2012, 34, 45–50. [Google Scholar] [CrossRef]
  52. Cordeiro, G.C.; Toledo Filho, R.D.; Tavares, L.M.; Fairbairn, E.D.M.R. Ultrafine grinding of sugar cane bagasse ash for application as pozzolanic admixture in concrete. Cem. Concr. Res. 2009, 39, 110–115. [Google Scholar] [CrossRef]
  53. Kumar, T.S.; Balaji, K.; Rajasekhar, K. Assessment of Sorptivity and Water Absorption of Concrete with Partial Replacement of Cement by Sugarcane Bagasse Ash (SCBA) and Silica Fume. Int. J. Appl. Eng. Res. 2016, 11, 5747–5752. [Google Scholar]
  54. Amin, N.-U. Use of bagasse ash in concrete and its impact on the strength and chloride resistivity. J. Mater. Civ. Eng. 2011, 23, 717–720. [Google Scholar] [CrossRef]
  55. Hailu, B.; Dinku, A. Application of sugarcane bagasse ash as a partial cement replacement material. Zede J. 2012, 29, 1–12. [Google Scholar]
  56. Mangi, S.A.; Jamaluddin, N.; Ibrahim, M.W.; Abdullah, A.H.; Awal, A.S.M.A.; Sohu, S.; Ali, N. Utilization of sugarcane bagasse ash in concrete as partial replacement of cement. IOP Conf. Ser. Mater. Sci. Eng. 2017, 271, 1–8. [Google Scholar] [CrossRef]
  57. Dhengare, S.W.; Raut, S.P.; Bandwal, N.V.; Khangan, A. Investigation into utilization of sugarcane bagasse ash as supplementary cementitious material in concrete. Int. J. 2015, 3, 109. [Google Scholar]
  58. Hussein, A.A.E.; Shafiq, N.; Nuruddin, M.F.; Memon, F.A. Compressive strength and microstructure of sugar cane bagasse ash concrete. Res. J. Appl. Sci. Eng. Technol. 2014, 7, 2569–2577. [Google Scholar] [CrossRef]
  59. Reddy, M.V.S.; Ashalatha, K.; Madhuri, M.; Sumalatha, P. Utilization of sugarcane bagasse ash (SCBA) in concrete by partial replacement of cement. IOSR J. Mech. Civ. Eng. 2015, 12, 12–16. [Google Scholar]
  60. Ganesan, K.; Rajagopal, K.; Thangavel, K. Evaluation of bagasse ash as corrosion resisting admixture for carbon steel in concrete. Anti-Corros. Methods Mater. 2007, 54, 230–236. [Google Scholar] [CrossRef]
  61. Yashwanth, M.K.; Raghavendra, A.; Kumar, B.N. An experimental study on alternative cementitious materials: Bagasse ash as partial replacement for cement in structural lightweight concrete. Indian Concr. J. 2017, 91, 51–58. [Google Scholar]
  62. Shafiq, N.; Hussein, A.A.E.; Nuruddin, M.F.; Al Mattarneh, H. Effects of sugarcane bagasse ash on the properties of concrete. Proc. Inst. Civ. Eng. -Eng. Sustain. 2016, 171, 123–132. [Google Scholar] [CrossRef]
  63. Priya, K.L.; Ragupathy, R. Effect of sugarcane bagasse ash on strength properties of concrete. Int. J. Res. Eng. Technol. 2016, 5, 159–164. [Google Scholar]
  64. Praveenkumar, S.; Sankarasubramanian, G. Mechanical and durability properties of bagasse ash-blended high-performance concrete. SN Appl. Sci. 2019, 1, 166469. [Google Scholar] [CrossRef] [Green Version]
  65. Xu, Q.; Ji, T.; Gao, S.J.; Yang, Z.; Wu, N. Characteristics and applications of sugar cane bagasse ash waste in cementitious materials. Materials 2019, 12, 39. [Google Scholar] [CrossRef] [Green Version]
  66. Arenas-Piedrahita, J.C.; Montes-García, P.; Mendoza-Rangel, J.M.; Calvo, H.L.; Valdez-Tamez, P.L.; Martínez-Reyes, J. Mechanical and durability properties of mortars prepared with untreated sugarcane bagasse ash and untreated fly ash. Constr. Build. Mater. 2016, 105, 69–81. [Google Scholar] [CrossRef]
  67. Cordeiro, G.C.; Toledo Filho, R.D.; Tavares, L.M.; Fairbairn, E.M.R. Experimental characterization of binary and ternary blended-cement concretes containing ultrafine residual rice husk and sugar cane bagasse ashes. Constr. Build. Mater. 2012, 29, 641–646. [Google Scholar] [CrossRef]
  68. Elwell, D.J.; Fu, G. Compression Testing of Concrete: Cylinders vs. Cubes; New York State Department of Transportation: New York, NY, USA, 1995.
  69. Shah, M.I.; Javed, M.F.; Abunama, T. Proposed formulation of surface water quality and modelling using gene expression, machine learning, and regression techniques. Environ. Sci. Pollut. Res. 2021, 11, 13202–13220. [Google Scholar] [CrossRef]
  70. Raju, K.S.; Murty, M.R.; Rao, M.V.; Satapathy, S.C. Support Vector Machine with k-fold cross validation model for software fault prediction. Int. J. Pure Appl. Math. 2018, 118, 321–334. [Google Scholar]
  71. Kohavi, R. A study of cross-validation and bootstrap for accuracy estimation and model selection. Ijcai 1995, 14, 1137–1145, Montreal, QC, Canada. [Google Scholar]
  72. Azim, I.; Yang, J.; Javed, M.F.; Iqbal, M.F.; Mahmood, Z.; Wang, F.; Liu, Q.F. Prediction model for compressive arch action capacity of RC frame structures under column removal scenario using gene expression programming. Structures 2020, 25, 212–228. [Google Scholar] [CrossRef]
  73. Gandomi, A.H.; Alavi, A.H.; Mirzahosseini, M.R.; Nejad, F.M. Nonlinear genetic-based models for prediction of flow number of asphalt mixtures. J. Mater. Civ. Eng. 2011, 23, 248–263. [Google Scholar] [CrossRef]
  74. Despotovic, M.; Nedic, V.; Despotovic, D.; Cvetanovic, S. Evaluation of empirical models for predicting monthly mean horizontal diffuse solar radiation. Renew. Sustain. Energy Rev. 2016, 56, 246–260. [Google Scholar] [CrossRef]
  75. Akram, T.; Memon, S.A.; Obaid, H. Production of low cost self-compacting concrete using bagasse ash. Constr. Build. Mater. 2009, 2, 703–712. [Google Scholar] [CrossRef]
  76. Jagadesh, P.; Ramachandramurthy, A.; Murugesan, R.; Sarayu, K. Micro-Analytical studies on sugar cane bagasse ash. Sadhana 2015, 40, 1629–1638. [Google Scholar] [CrossRef] [Green Version]
  77. Souza, L.M.S.D.; Fairbairn, E.D.M.R.; Toledo Filho, R.D.; Cordeiro, G.C. Influence of initial CaO/SiO2 ratio on the hydration of rice husk ash-Ca (OH)2 and sugar cane bagasse ash-Ca(OH)2 pastes. Química Nova 2014, 37, 1600–1605. [Google Scholar]
  78. Frank, I.E.; Todeschini, R. The Data Analysis Handbook; Elsevier: Amsterdam, The Netherlands, 1994. [Google Scholar]
  79. Golbraikh, A.; Tropsha, A. Beware of q2! J. Mol. Graph. Model. 2002, 20, 269–276. [Google Scholar] [CrossRef]
  80. Roy, P.P.; Roy, K. On some aspects of variable selection for partial least squares regression models. QSAR Comb. Sci. 2008, 27, 302–313. [Google Scholar] [CrossRef]
Figure 1. Frequency distribution of the modeling inputs (a) w/c, (b) BA%, (c) CC, (d) FA, (e) CA.
Materials 14 05659 g001
Figure 2. Experimentally tested results of (a) compressive strength, (b) tensile strength, (c) flexural strength of bagasse ash concrete (BAC).
Materials 14 05659 g002
Figure 3. Comparison of actual and model predicted compressive strength (a) variation in data (b) scattered plot.
Materials 14 05659 g003
Figure 4. Comparison of actual and model predicted splitting tensile strength (a) variation in data (b) scattered plot.
Materials 14 05659 g004
Figure 5. Comparison of actual and model predicted flexural strength (a) variation in data (b) scattered plot.
Materials 14 05659 g005
Figure 6. Compressive strength ( f c ) model validation by experimental results (a) variation in data (b) scattered plot.
Materials 14 05659 g006
Figure 7. Splitting tensile strength ( f STS ) model validation by experimental results (a) variation in data (b) scattered plot.
Materials 14 05659 g007
Figure 8. Flexural strength ( f FS ) model validation by experimental results (a) variation in data (b) scattered plot.
Materials 14 05659 g008
Figure 9. Deviation of the error between the actual and predicted results of MEP models developed for (a) f c (b) f STS (c) f FS .
Materials 14 05659 g009
Figure 10. Cross-validation result of the developed models based on (a) R and (b) RMSE values.
Materials 14 05659 g010
Table 1. Best parameter setting used in MEP modeling.
Setting ParametersOptimum Value
Subpopulation50
length of code40
Subpopulation size250
Number of generations1000
Mutation probability0.01
Crossover probability0.9
Mathematical operators+, −, ×, ÷
Variables0.5
Tournament size4
Operators0.5
Table 2. Descriptive statistics of the input variables.
ParameterUnitRangeMinMaxMeanSD
W/C-0.30.30.60.470.074
CCKg/m3444112555336.598.5
BA%%5005013.4110.46
FAKg/m3614239853603.5232.1
CAKg/m37724771249884.6392.3
Table 3. Detailed mix design proportions of the control and modified concrete.
MixCement Kg/m3CA
Kg/m3
BA
Kg/m3
W/CFA
Kg/m3
Water
Kg/m3
Density (Kg/m3)
CementCAFABA
NC3661013.500.5742.31833150251016802450
10BA329.41013.536.60.5742.3183
20BA292.81013.573.20.5742.3183
30BA256.21013.5109.80.5742.3183
40BA219.61013.5146.40.5742.3183
Table 4. Inferential statistics for the training, testing, and validation datasets.
ModelsDataRRMSERSENSEMAERRMSEρOF
f c Training0.913.470.160.872.960.040.020
Testing0.942.980.120.892.980.090.0460.036
Validation0.932.870.150.891.670.040.020
f STS Training0.902.430.230.853.670.090.047
Testing0.922.650.260.913.690.120.0620.031
Validation0.923.250.310.903.980.100.052
  f FS Training0.913.920.290.861.870.130.0680.052
Testing0.913.340.280.871.450.150.078
Validation0.933.670.190.862.870.160.079
Table 5. Statistical indicators for verifying the external predictability of proposed MEP models.
S.No.Mathematical ExpressionRequirement   f c ' f S T S f F S Reference
1. R = i = 1 n ( M i M ¯ i ) ( P i P ¯ i ) i = 1 n ( M i M ¯ i ) 2 i = 1 n ( P i P ¯ i ) 2 R > 0.80.920.920.91[78]
2. k = i = 1 n ( M i P i ) M i 2 0.85 < k < 1.151.000.991.01[79]
3. k = i = 1 n ( M i P i ) P i 2 0.85 < k’ < 1.150.980.981.05[79]
4. R m = R 2 × ( 1 | R 2 R 0 2 | Rm > 0.50.670.710.64[80]
R 0 2 = i = 1 n ( P i M i 0 ) 2 i = 1 n ( P i P i 0 ¯ ) 2 ,   M i 0 = k × P i R 0 2 1 0.980.980.97
R 0 2 ´ = i = 1 n ( M i P i 0 ) 2 i = 1 n ( M i M i 0 ¯ ) 2 ,   P i 0 = k × M i R 0 2 ´ 1 0.980.990.98
Publisher’s Note: MDPI stays neutral with regard to jurisdictional claims in published maps and institutional affiliations.

