
Influence of Mineral Additives on the Efflorescence of Ettringite-Rich Systems

Abstract
:1. Introduction
2. Experimental
2.1. Raw Materials
2.2. Mix Proportion
2.3. Methods
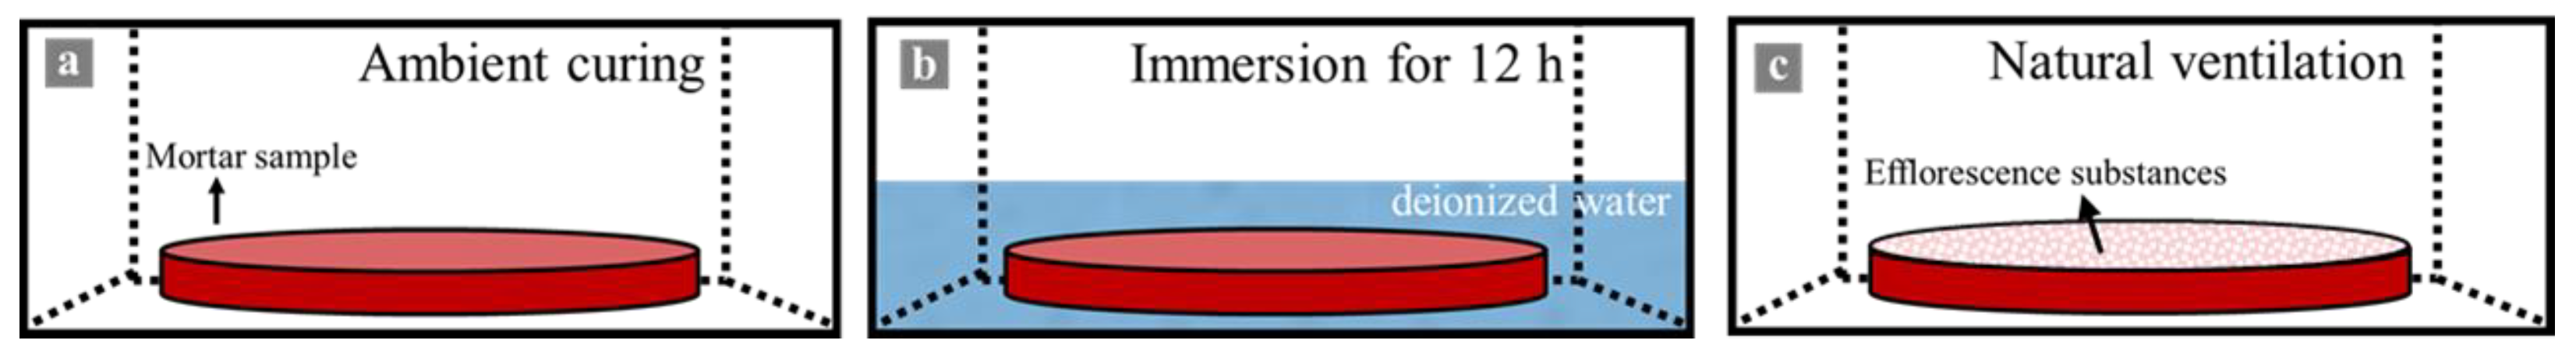
2.3.1. Efflorescence
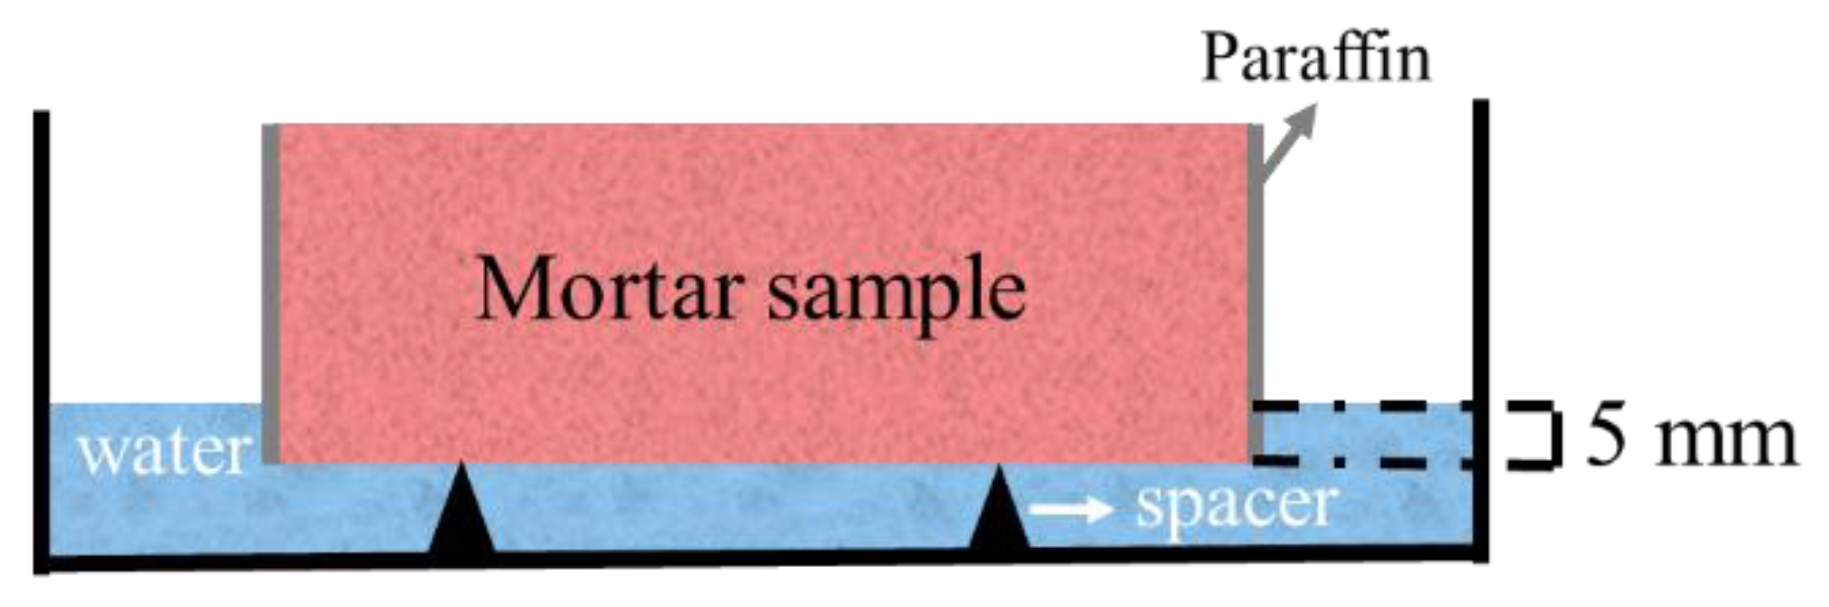
2.3.2. Capillary Absorption Coefficient
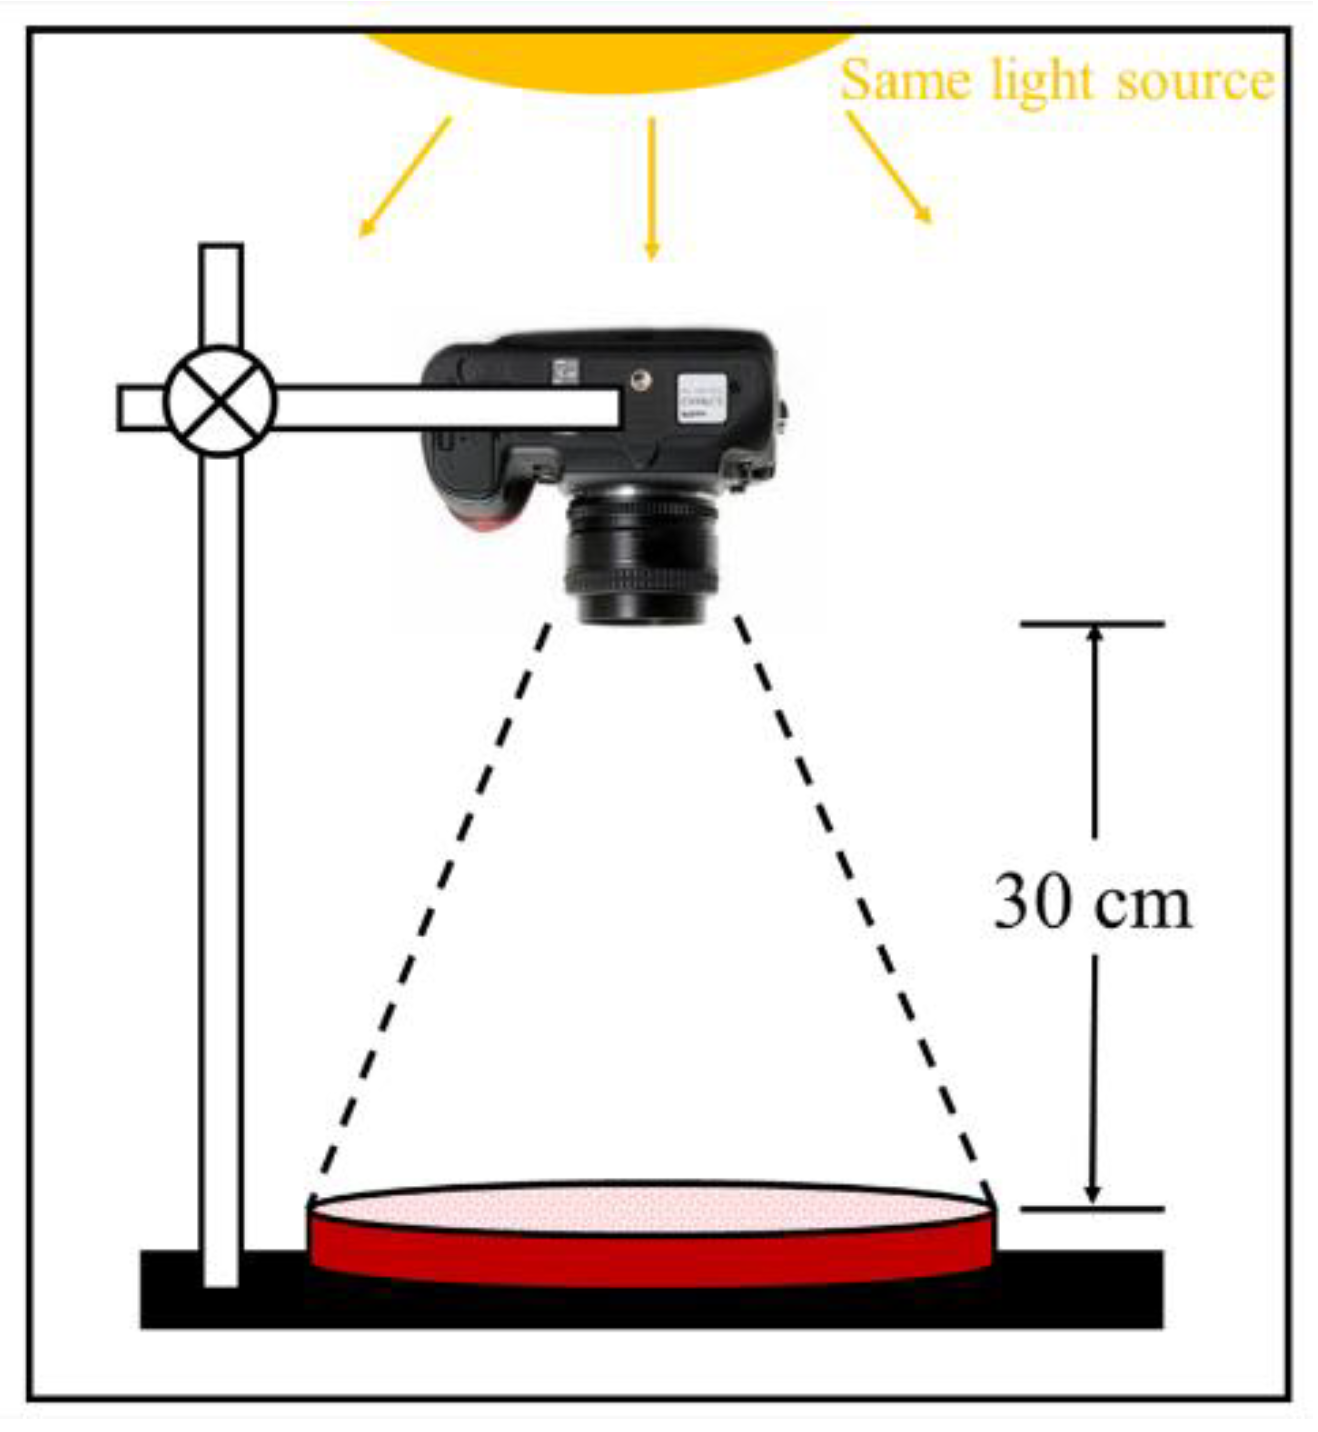
2.3.3. Microstructure Characterization
3. Results and Discussion
3.1. Efflorescence
3.1.1. Visual Observation
3.1.2. Quantitative Analysis
3.2. Phase Assemblage of Efflorescence Substances
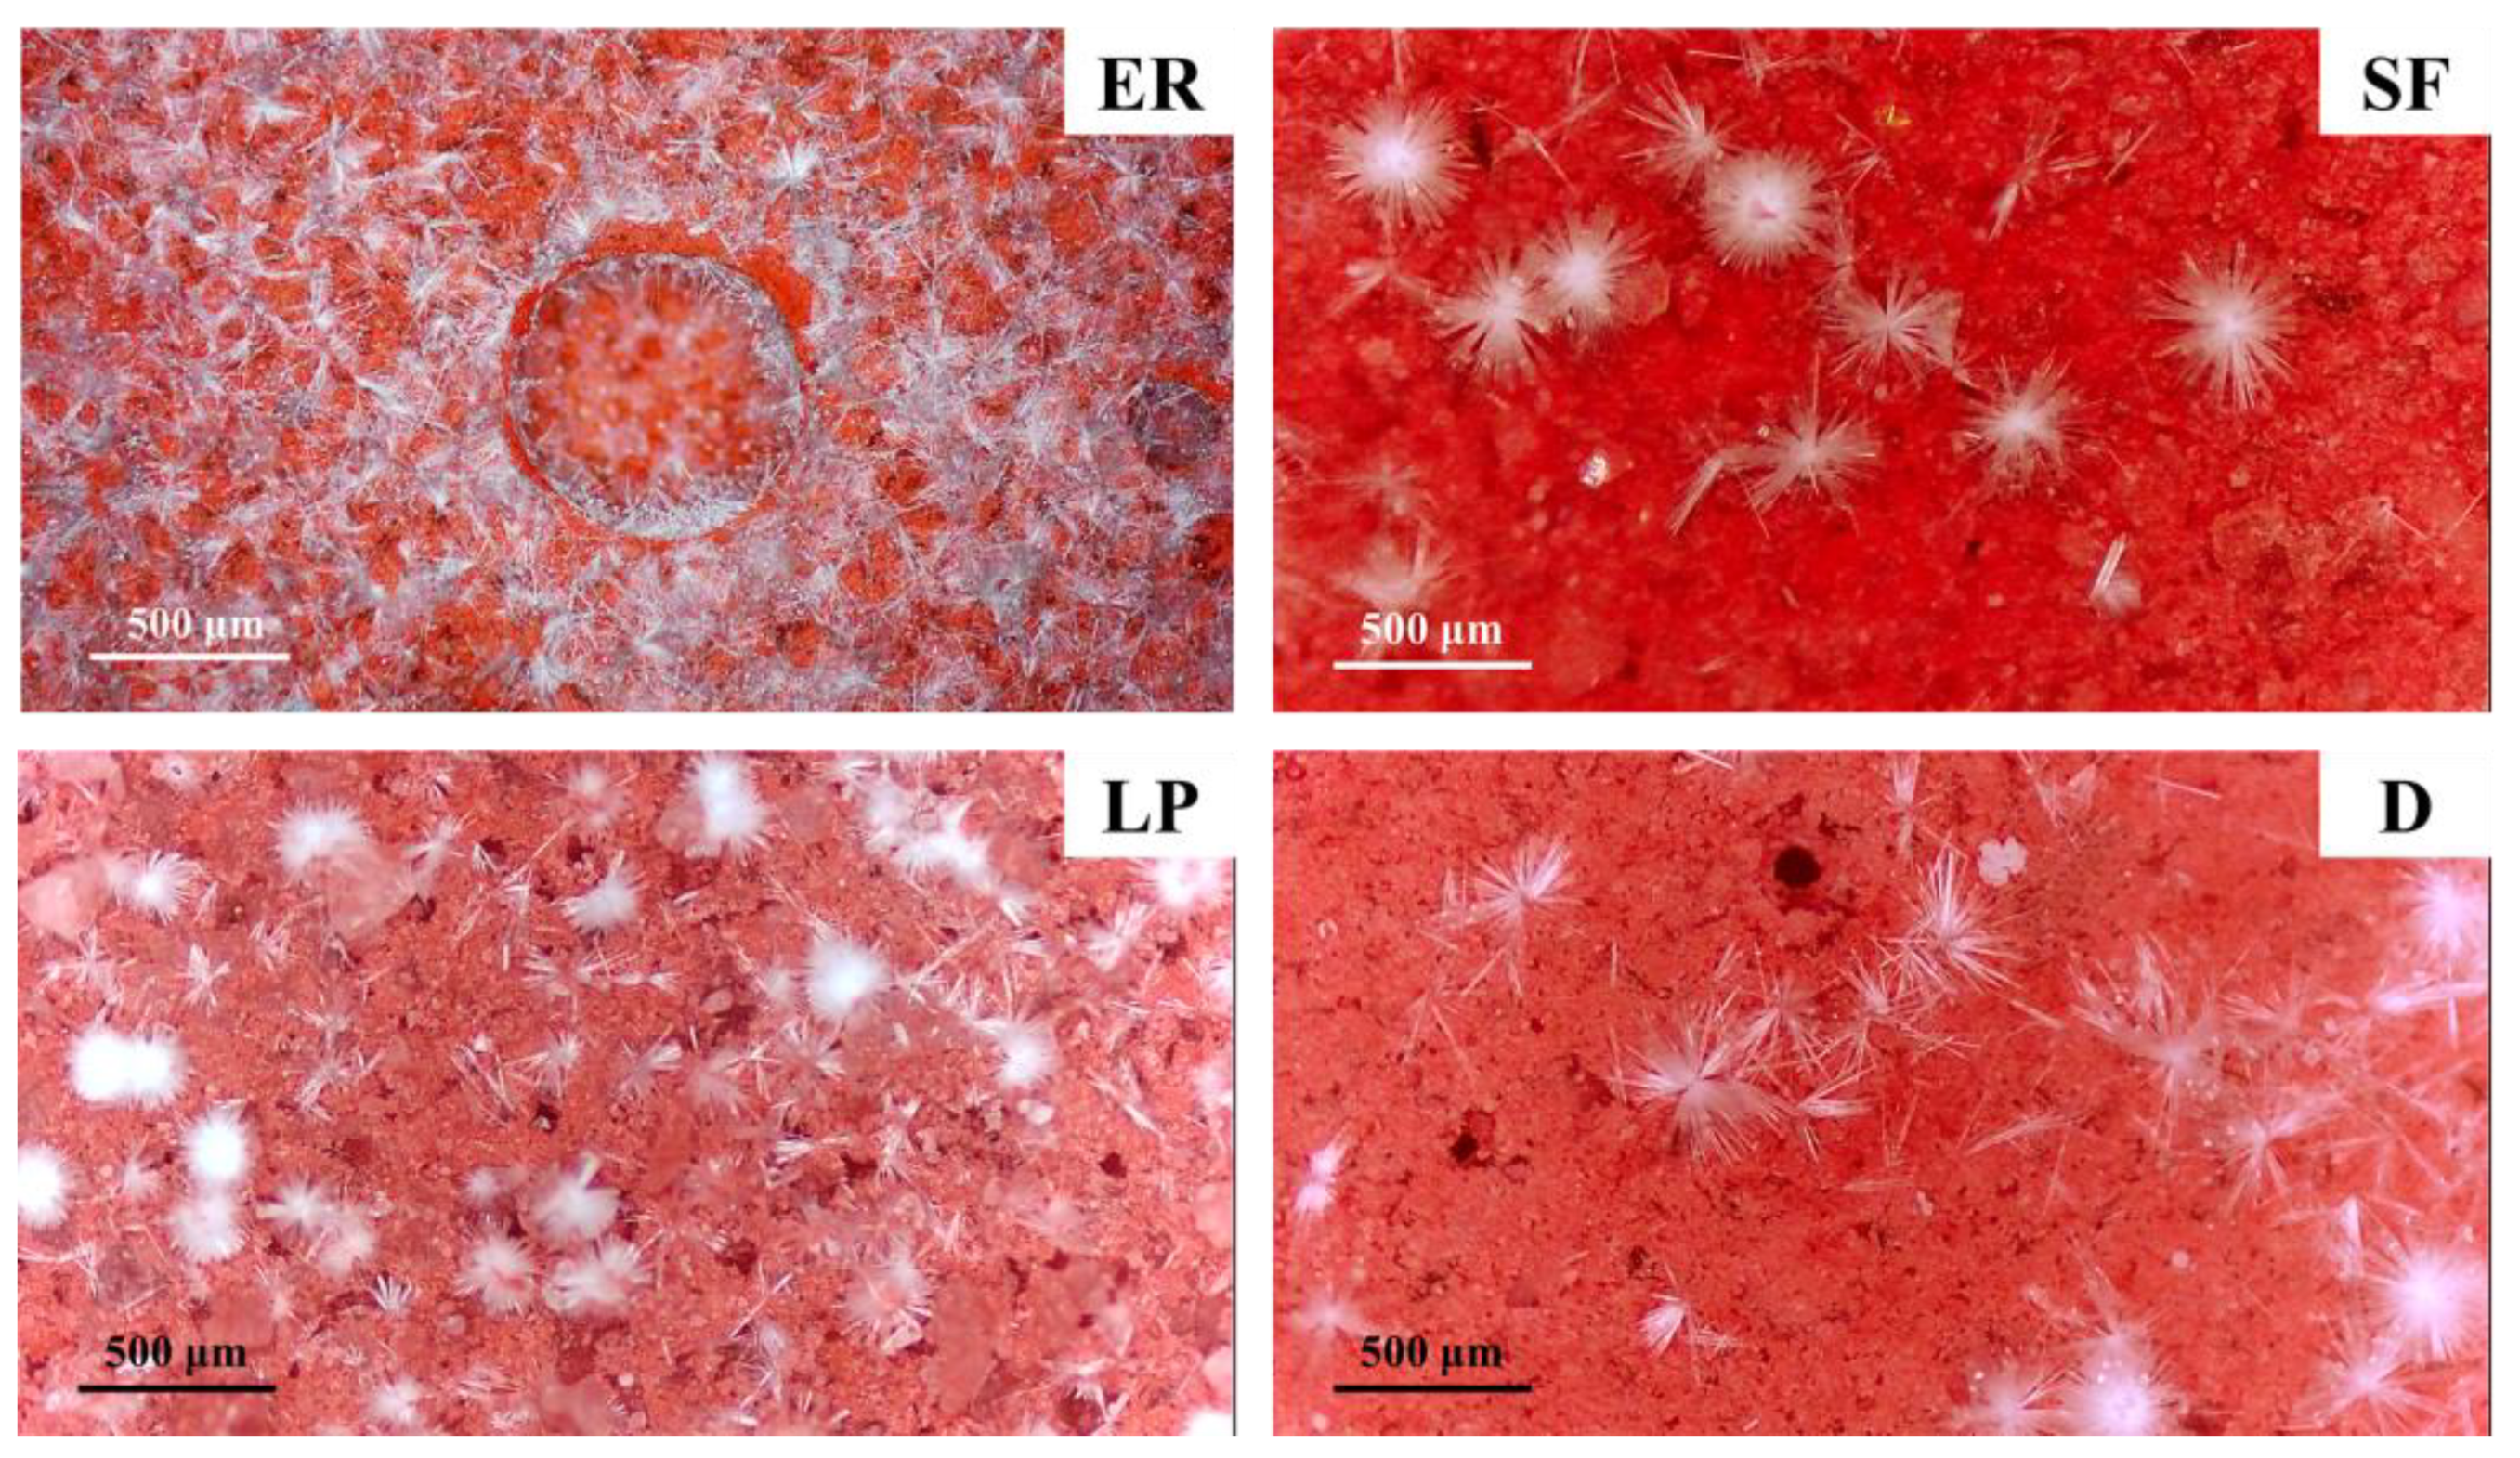
3.2.1. O.M.
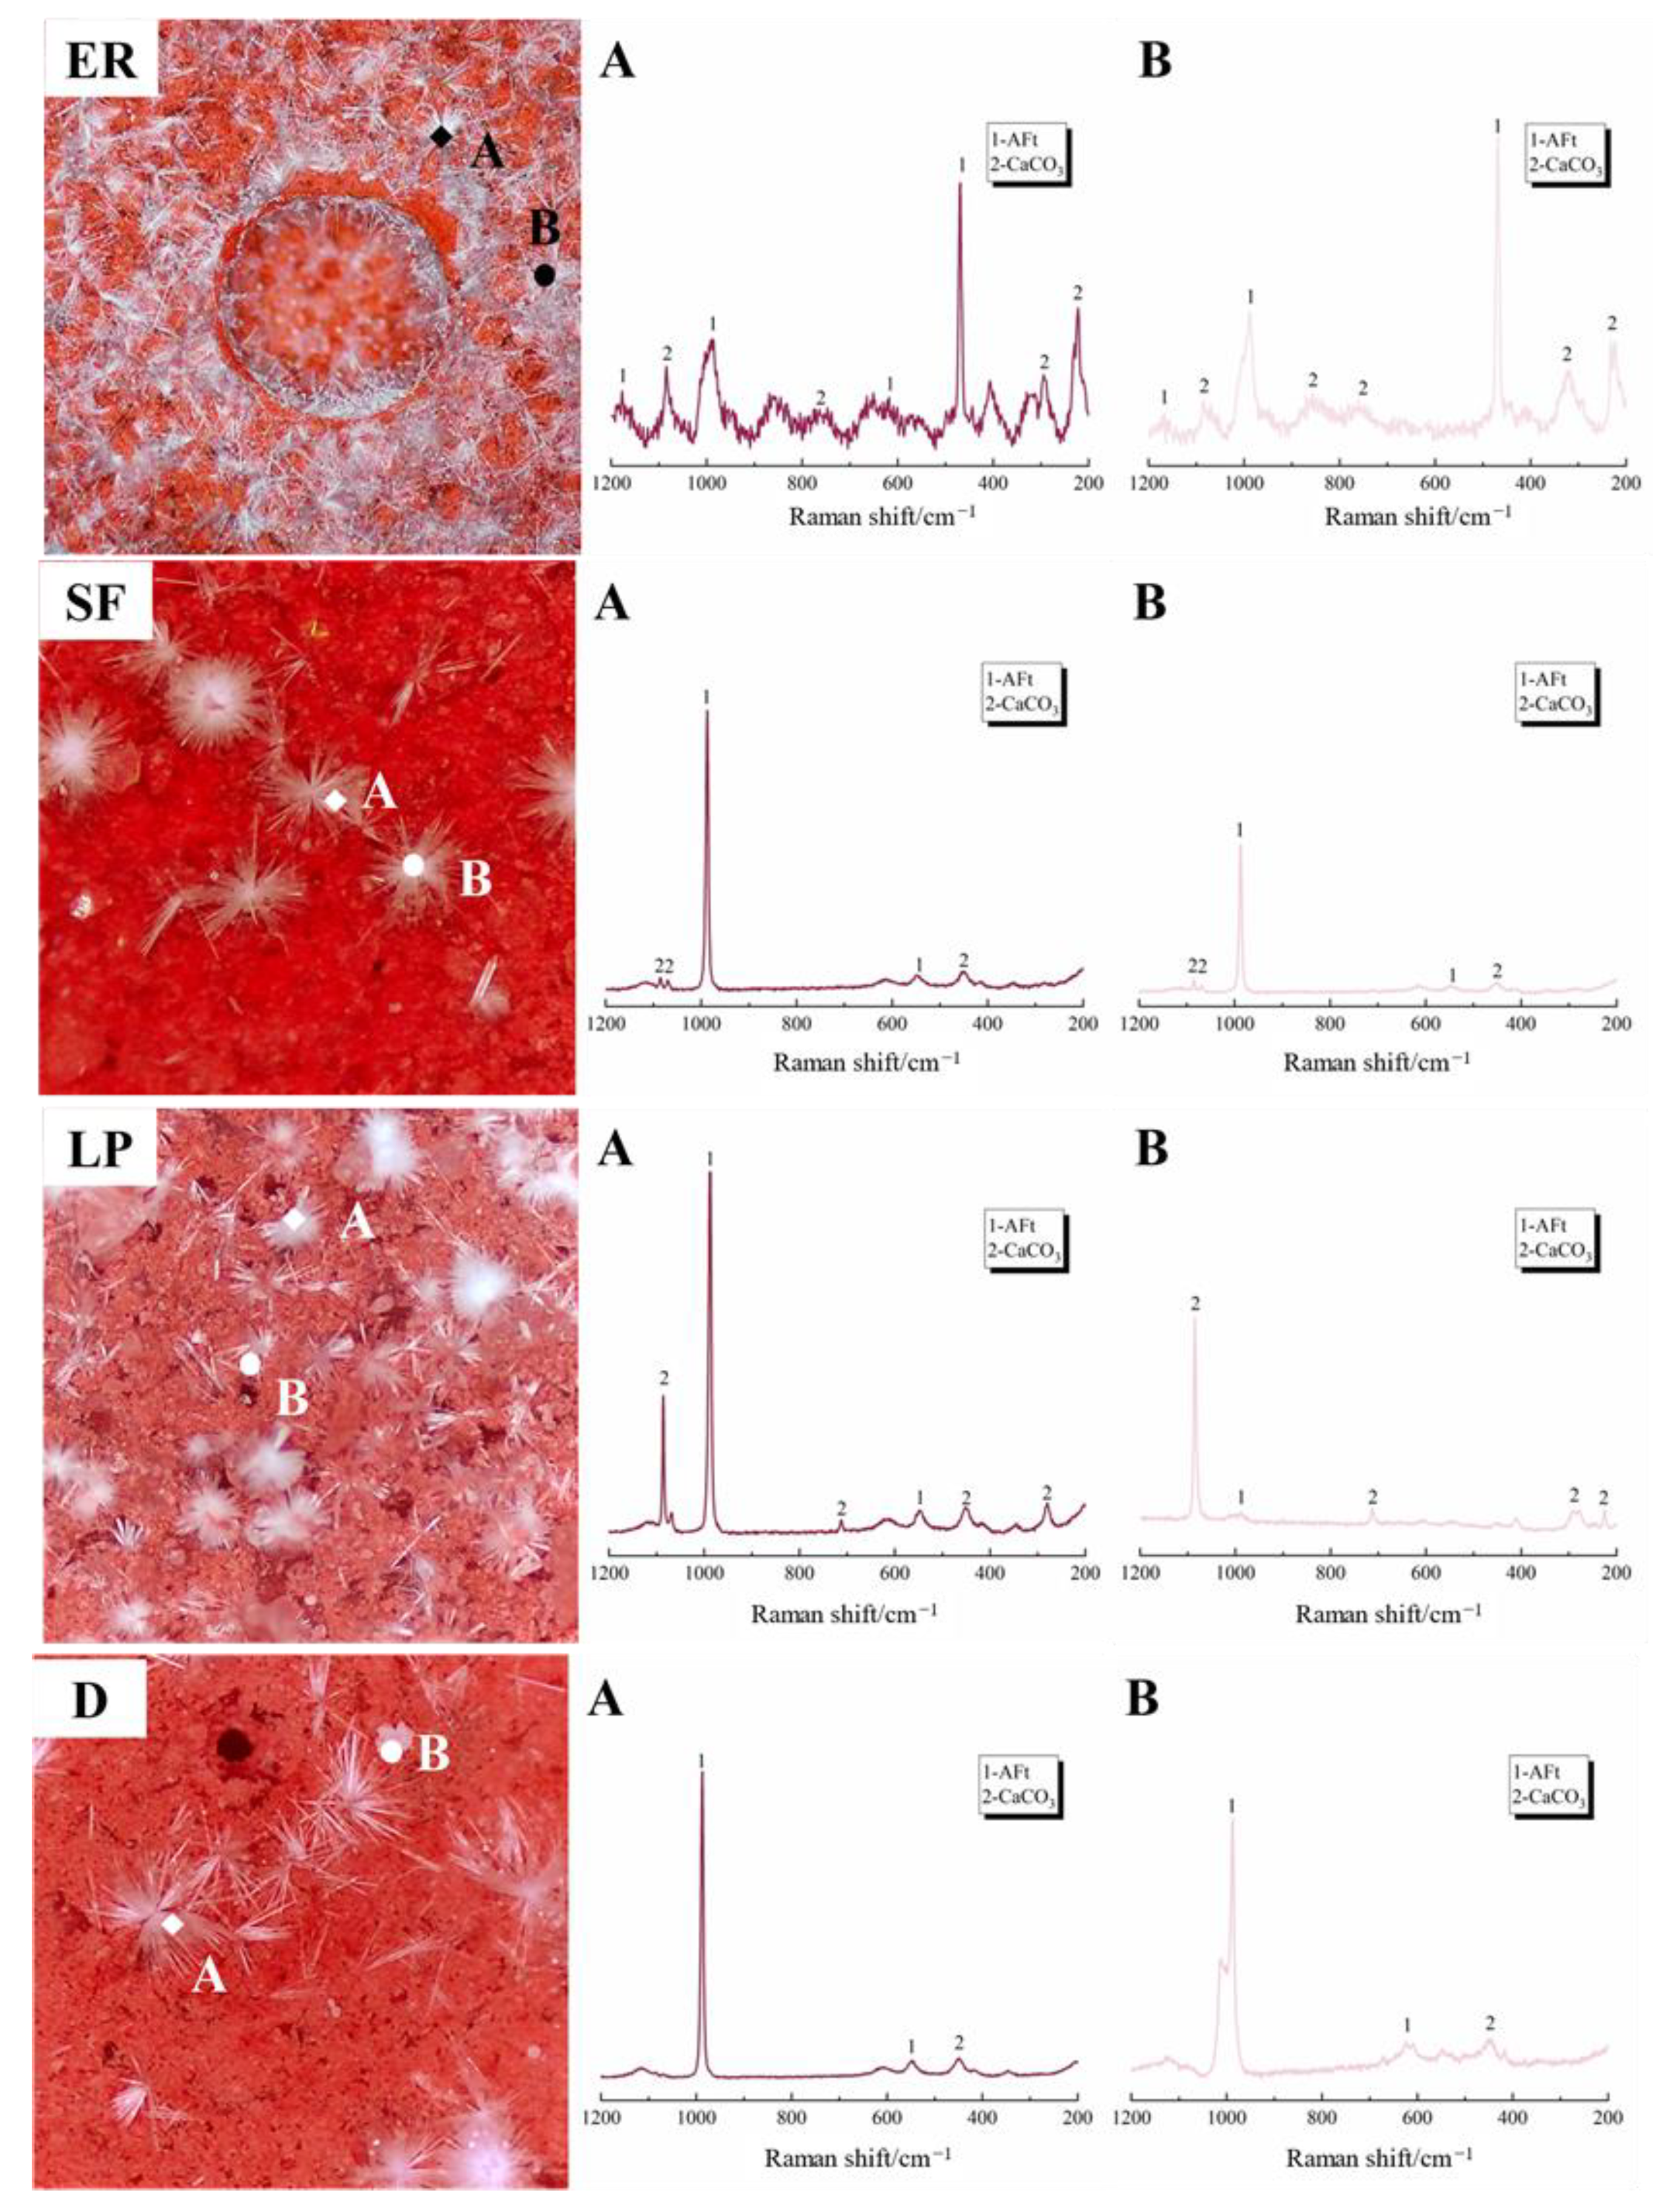
3.2.2. In-Situ Raman
3.2.3. SEM
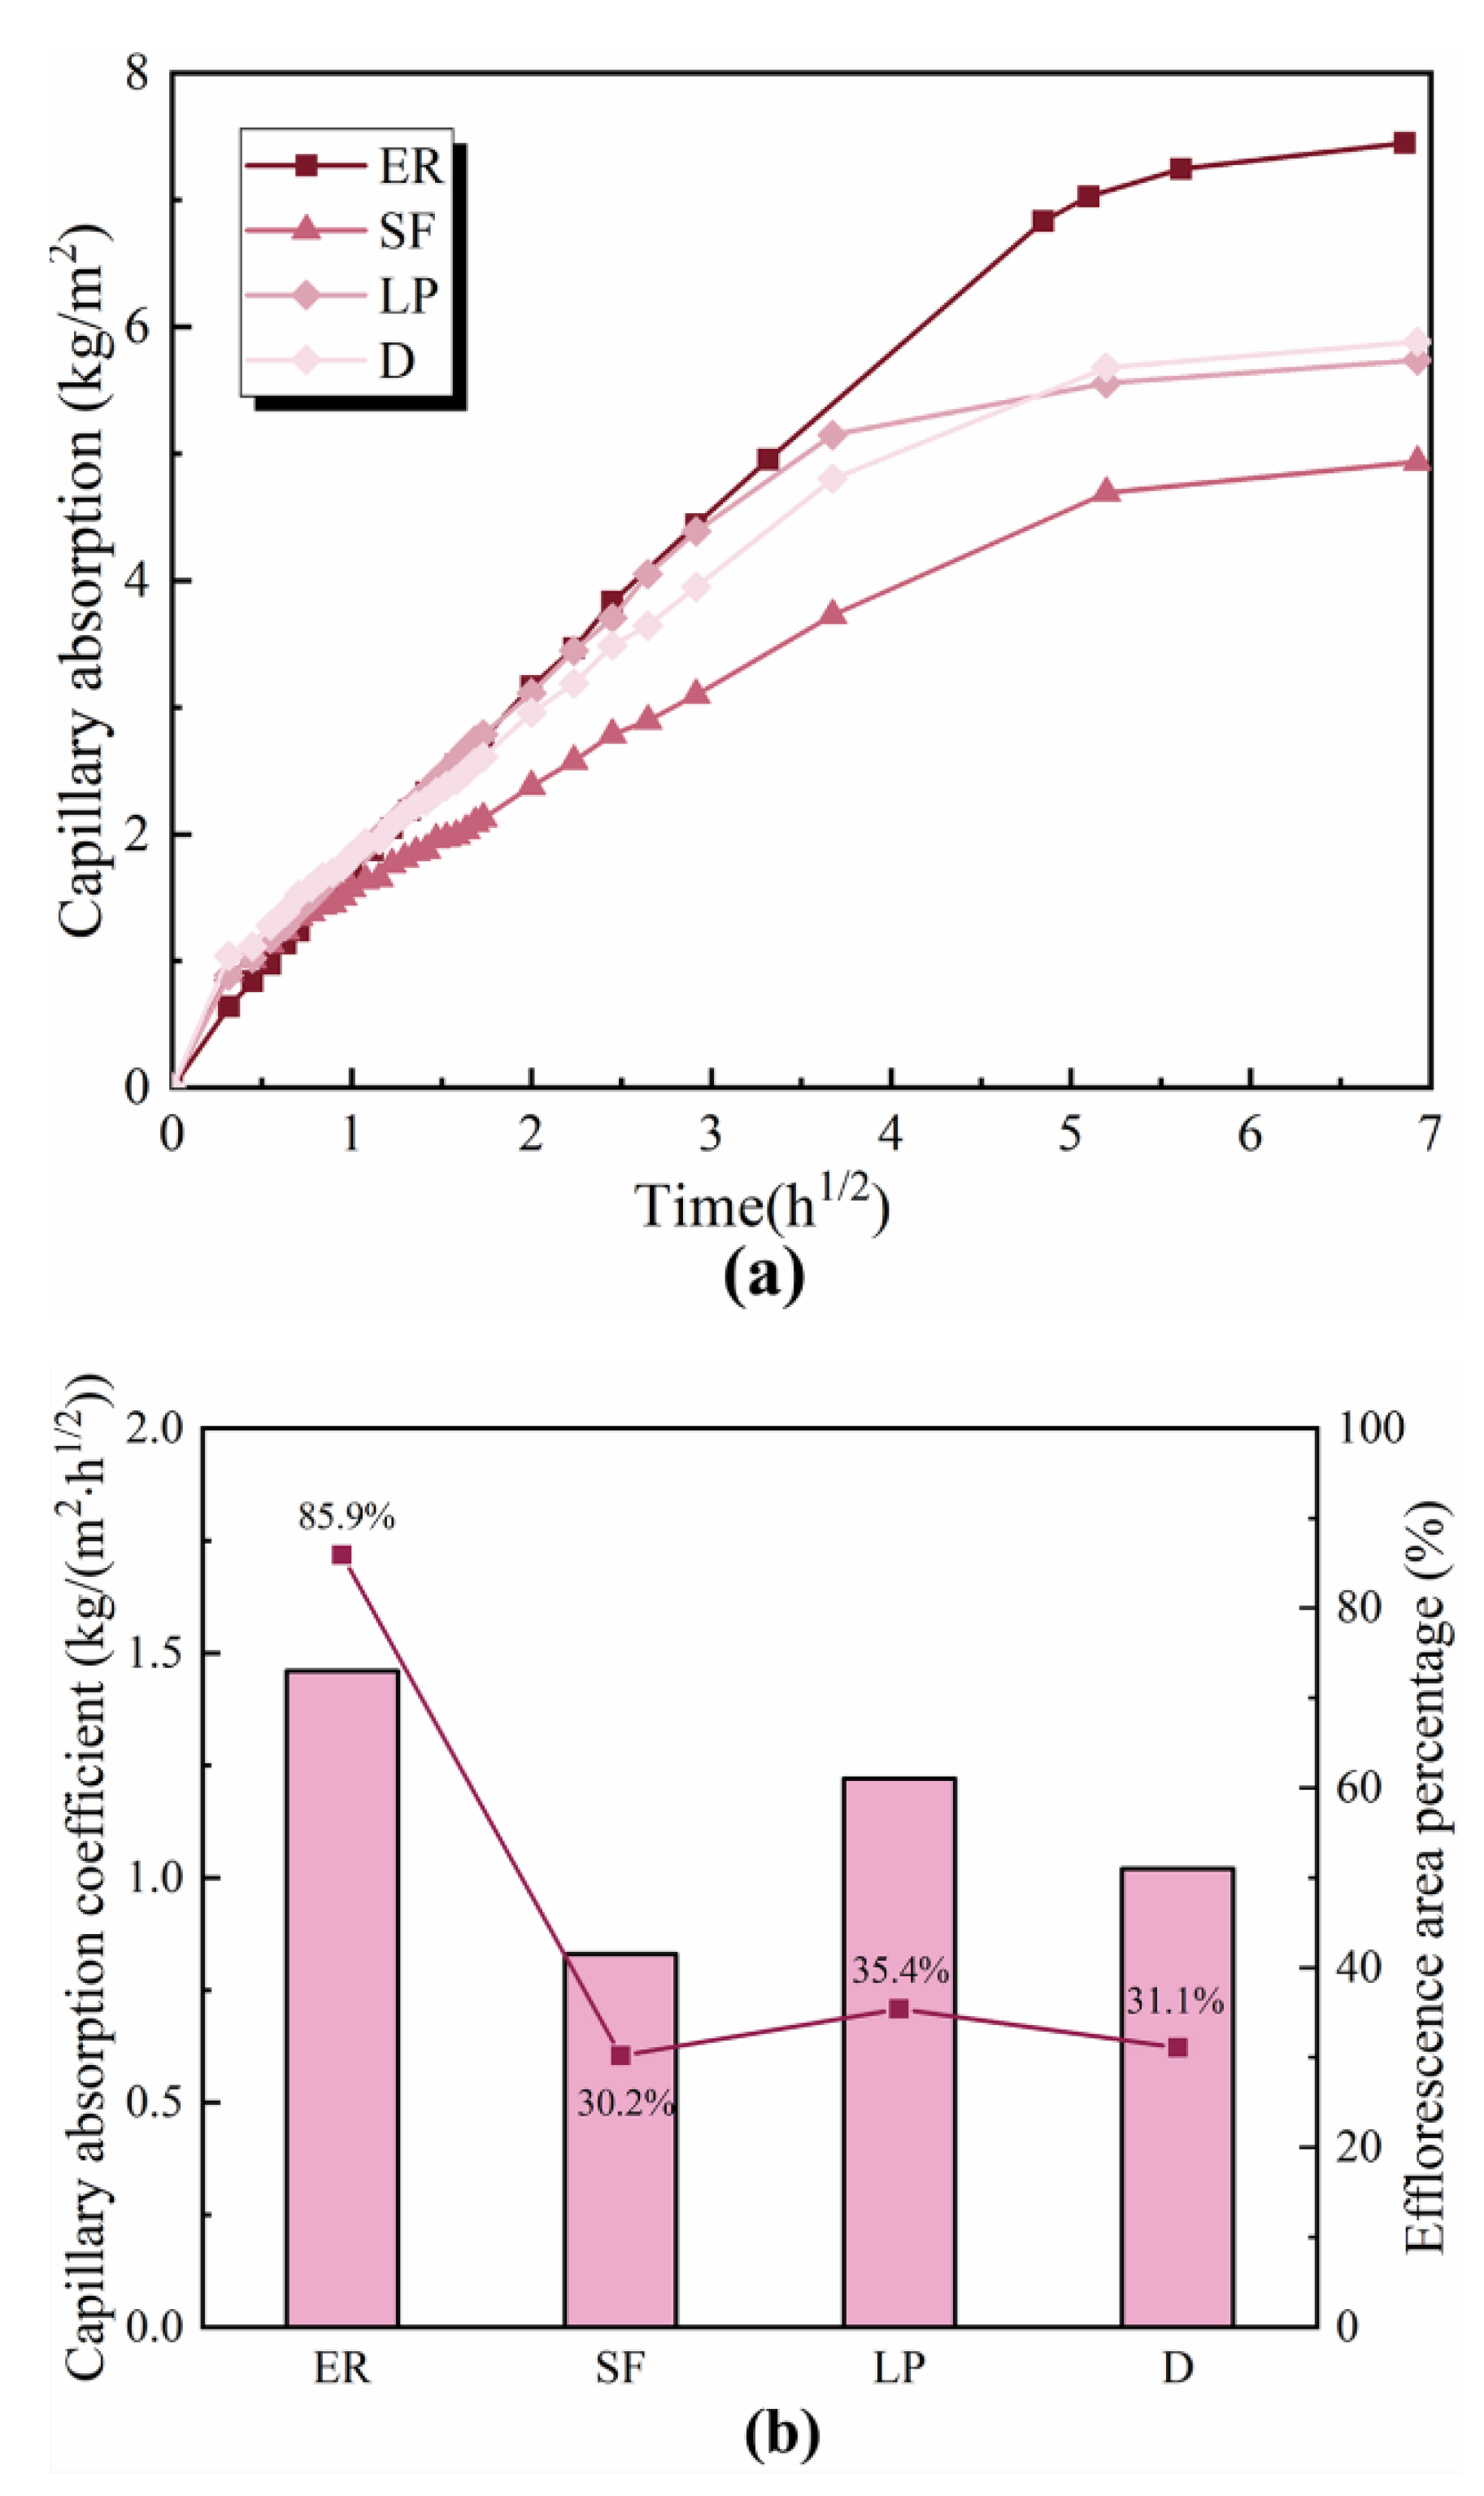
3.3. Capillary Pore Structure
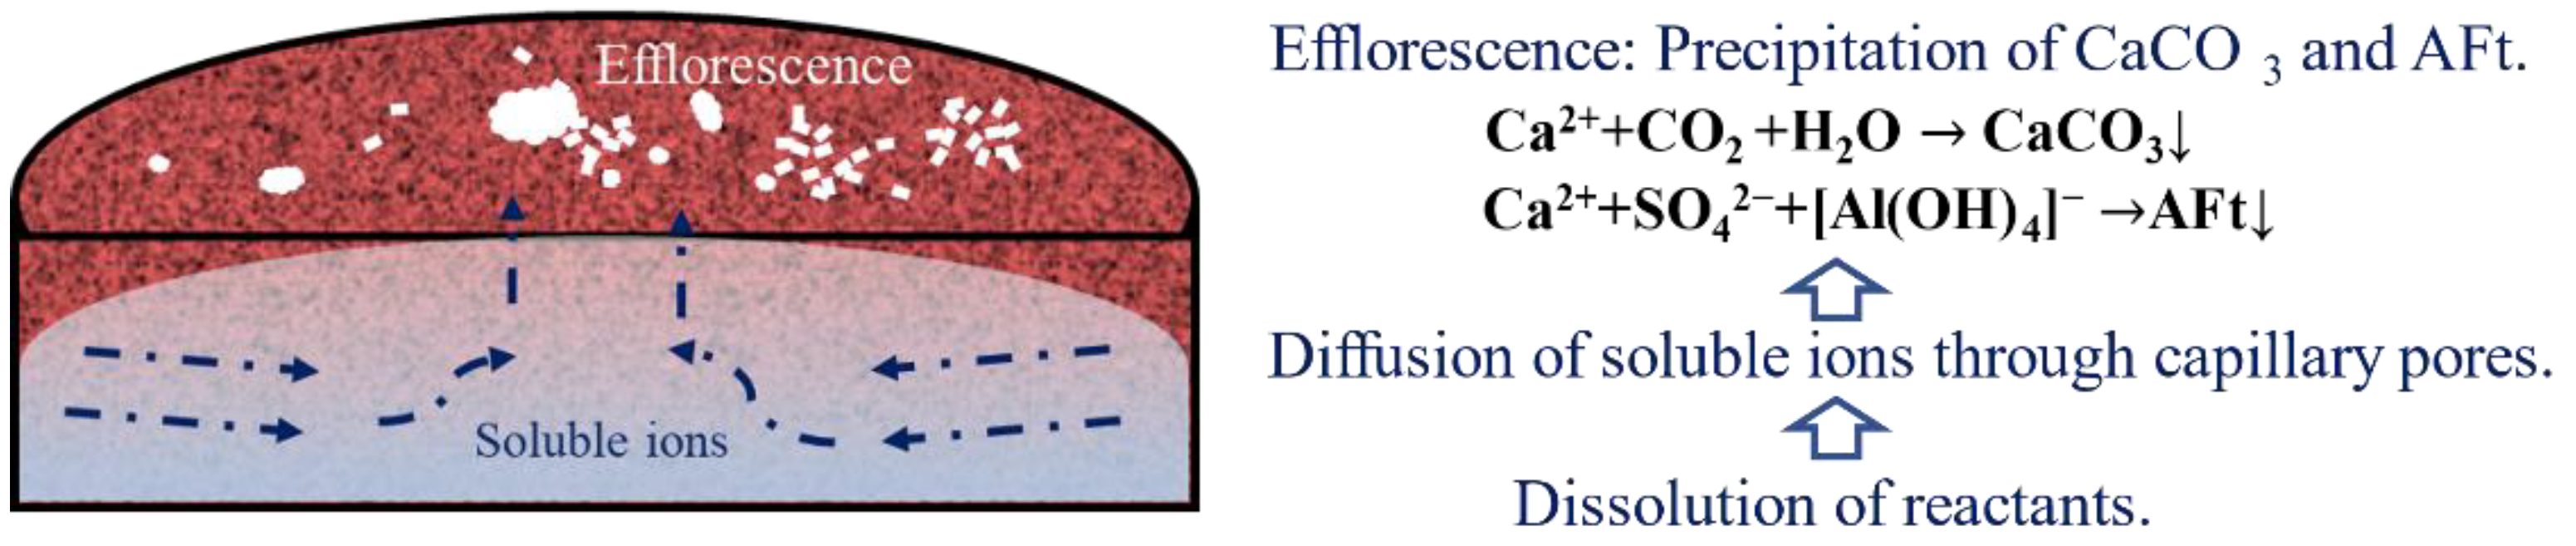
3.4. Discussion
4. Conclusions
- The incorporation of mineral additives significantly reduces the secondary efflorescence. This is attributed to the inhabitation effect of mixing mineral additives, in which silica fume is the most effective choice, followed by diatomite and limestone powder.
- The efflorescence substances of the ettringite-rich system are composed of CaCO3 and ettringite, and ettringite is the dominant phase. The inclusion of mineral additives inhibits the efflorescence without changing the chemical process.
- The efflorescence of ettringite-rich systems results from the ion’s transportation throughout the pores. The capillary absorption results prove that the mineral admixture can optimize the pore structure, and it is directly correlated with efflorescence. By contrast, the capillary absorption of silica fume modified specimen is the lowest, which is totally consistent with the slightest efflorescence.
Author Contributions
Funding
Institutional Review Board Statement
Informed Consent Statement
Data Availability Statement
Conflicts of Interest
References
- Dow, C.; Glasser, F.P. Calcium carbonate efflorescence on Portland cement and building materials. Cem. Concr. Res. 2003, 33, 147–154. [Google Scholar] [CrossRef]
- Zhang, Z.; Provis, J.L.; Ma, X.; Reid, A.; Wang, H. Efflorescence and subflorescence induced microstructural and mechanical evolution in fly ash-based geopolymers. Cem. Concr. Compos. 2018, 92, 165–177. [Google Scholar] [CrossRef]
- Mierzwiński, D.; Korniejenko, K.; Łach, M.; Mikuła, J.; Krzywda, J. Effect of coffee grounds addition on efflorescence in fly ash-based geopolymer. IOP Conf. Ser. Mater. Sci. Eng. 2018, 416, 012035. [Google Scholar] [CrossRef]
- Hyeok-Jung, K.; Kang, S.P.; Choe, G.C. Effect of red mud content on strength and efflorescence in pavement using alkali-activated slag cement. Int. J. Concr. Struct. Mater. 2018, 12, 207–215. [Google Scholar] [CrossRef]
- Zhang, M.; Zhao, M.; Zhang, G.; Mann, D.; Lumsden, K.; Tao, M. Durability of red mud-fly ash based geopolymer and leaching behavior of heavy metals in sulfuric acid solutions and deionized water. Constr. Build. Mater. 2016, 124, 373–382. [Google Scholar] [CrossRef] [Green Version]
- Xiao, X.; Liu, Y.L.; Dai, J.G.; Poon, C.S.; Zhang, W.D.; Zhang, P. Inhibiting efflorescence formation on fly ash–based geopolymer via silane surface modification. Cem. Concr. Compos. 2018, 94, 43–52. [Google Scholar]
- Zhang, D.; Ghouleh, Z.; Shao, Y. Review on carbonation curing of cement-based materials. J. CO2 Util. 2017, 21, 119–131. [Google Scholar] [CrossRef]
- Shi, Z.; Shi, C.; Wan, S.; Zhang, Z. Effects of alkali dosage and silicate modulus on alkali-silica reaction in alkali-activated slag mortars. Cem. Concr. Res. 2018, 111, 104–115. [Google Scholar] [CrossRef]
- Vafaei, M.; Allahverdi, A. High strength geopolymer binder based on waste-glass powder. Adv. Powder Technol. Int. J. Soc. Powder Technol. 2017, 28, 215–222. [Google Scholar] [CrossRef]
- Kani, E.N.; Allahverdi, A.; Provis, J.L. Efflorescence control in geopolymer binders based on natural pozzolan. Cem. Concr. Compos. 2012, 34, 25–33. [Google Scholar] [CrossRef]
- Yao, X.; Yang, T.; Zhang, Z. Fly ash-based geopolymers: Effect of slag addition on efflorescence. J. Wuhan Univ. Technol.(Mater. Sci.). 2016, 31, 689–694. [Google Scholar] [CrossRef]
- Zhang, Z.; Provis, J.L.; Reid, A.; Wang, H. Fly ash-based geopolymers: The relationship between composition, pore structure and efflorescence. Cem. Concr. Res. 2014, 64, 30–41. [Google Scholar] [CrossRef]
- Zheng, H.; Dai, J.G.; Poon, C.S.; Li, W. Influence of calcium ion in concrete pore solution on the passivation of galvanized steel bars. Cem. Concr. Res. 2018, 108, 46–58. [Google Scholar] [CrossRef]
- Wu, K.; Hao, H.; Rößler, C.; Xu, L.; Ludwig, H.M. Rice hush ash as supplementary cementitious material for calcium aluminate cement—Effects on strength and hydration. Constr. Build. Mater. 2021, 302, 124198. [Google Scholar] [CrossRef]
- Wang, D.; Shi, C.; Farzadnia, N.; Shi, Z.G.; Jia, H.F.; Ou, Z.H. A review on use of limestone powder in cement-based materials: Mechanism, hydration and microstructures. Constr. Build. Mater. 2018, 181, 659–672. [Google Scholar] [CrossRef]
- Saludung, A.; Azeyanagi, T.; Ogawa, Y.; Kawai, K. Effect of silica fume on efflorescence formation and alkali leaching of alkali-activated slag. J. Clean. Product. 2021, 315, 128210. [Google Scholar] [CrossRef]
- Zhou, S.; Zhang, J. Relationship between Moisture Transportation, Efflorescence and Structure Degradation in Fly Ash/Slag Geopolymer. Materials 2020, 13, 5550. [Google Scholar] [CrossRef]
- Yang, J.; Zheng, L.; He, X.; Su, Y.; Li, Y.; Tan, H.; Jiang, B.; Zhu, H.; Oh, S.-K. Improving durability of heat-cured high volume fly ash cement mortar by wet-grinding activation. Constr. Build. Mater. 2021, 28, 123157. [Google Scholar] [CrossRef]
- Saha, S.; Rajasekaran, C. Enhancement of the properties of fly ash based geopolymer paste by incorporating ground granulated blast furnace slag. Constr. Build. Mater. 2017, 145, 615–620. [Google Scholar] [CrossRef]
- Kang, S.P.; Kwon, S.J. Effects of red mud and Alkali-Activated Slag Cement on efflorescence in cement mortar. Constr. Build. Mater. 2017, 133, 459–467. [Google Scholar] [CrossRef]
- Nguyen, Q.H.; Lorente, S.; Duhart-Barone, A.; Lamotte, H. Porous arrangement and transport properties of geopolymers. Constr. Build. Mater. 2018, 191, 853–865. [Google Scholar] [CrossRef]
- Allahverdi, A.; Kani, E.N.; Shaverdi, B. Carbonation Versus Efflorescence in Alkali-Activated Blast-Furnace Slag in Relation with Chemical Composition of Activator. Int. J. Civ. Eng. 2015, 15, 565–573. [Google Scholar] [CrossRef]
- Rostami, M.; Behfarnia, K. The effect of silica fume on durability of alkali activated slag concrete. Constr. Build. Mater. 2017, 134, 262–268. [Google Scholar] [CrossRef]
- Ouyang, X.; Wang, L.; Fu, J.; Xu, S.; Ma, Y. Surface properties of clay brick powder and its influence on hydration and strength development of cement paste. Constr. Build. Mater. 2021, 300, 123958. [Google Scholar] [CrossRef]
- Mclellan, B.C.; Williams, R.P.; Lay, J.; van Riessen, A.; Corder, G.D. Costs and carbon emissions for geopolymer pastes in comparison to ordinary portland cement. J. Clean. Prod. 2011, 19, 1080–1090. [Google Scholar] [CrossRef] [Green Version]
- Yao, X.; Yang, T.; Zhang, Z. Compressive strength development and shrinkage of alkali-activated fly ash–slag blends associated with efflorescence. Mater. Struct. 2016, 49, 2907–2918. [Google Scholar] [CrossRef]
- Bolte, G.; Dienemann, W. Efflorescence on concrete products—Causes and strategies for avoidance. ZKG Int. 2004, 9, 78–86. [Google Scholar]


| Component | SiO2 | CaO | Al2O3 | Fe2O3 | MgO | P2O5 | SO3 | K2O | Na2O | LOI |
|---|---|---|---|---|---|---|---|---|---|---|
| CC | 0.25 | 30.52 | 68.40 | 0.16 | 0.20 | - | 0.08 | 0.01 | 0.32 | 0.06 |
| HH | 2.05 | 40.30 | 0.08 | 0.02 | 0.01 | - | 57.30 | - | - | 0.24 |
| S | 96.72 | 0.28 | 0.05 | 0.08 | 0.52 | 0.14 | 0.32 | 1.11 | 0.22 | 0.56 |
| L | 4.47 | 51.24 | 0.85 | 0.47 | 0.87 | - | 0.17 | 0.48 | 0.07 | 41.38 |
| DI | 94.78 | 0.36 | 2.82 | 0.60 | 0.34 | 0.10 | - | 0.39 | 0.19 | 0.42 |
| Specimen Code | CAC | Hemihydrate | Silica Fume | Limestone Powder | Diatomite | Water | Sand | Pigment |
|---|---|---|---|---|---|---|---|---|
| ER | 0.75 | 0.25 | 0 | 0 | 0 | 1 | 4 | 0.03 |
| SF | 0.5 | 0.25 | 0.25 | 0 | 0 | 1 | 4 | 0.03 |
| LP | 0.5 | 0.25 | 0 | 0.25 | 0 | 1 | 4 | 0.03 |
| D | 0.5 | 0.25 | 0 | 0 | 0.25 | 1 | 4 | 0.03 |
| ER | SF | LP | D | |
|---|---|---|---|---|
| Primary Efflorescence |  |  |  | 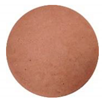 |
| Secondary Efflorescence | 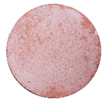 | 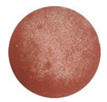 | 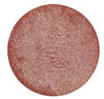 | 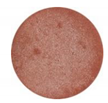 |
| ER | SF | LP | D | |
|---|---|---|---|---|
| Primary Efflorescence |  |  |  |  |
| 0.7% | 2.4% | 2.5% | 3.0% | |
| Secondary Efflorescence | 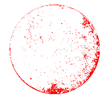 |  |  | 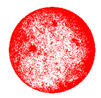 |
| 85.9% | 30.2% | 35.4% | 31.1% |
Publisher’s Note: MDPI stays neutral with regard to jurisdictional claims in published maps and institutional affiliations. |
© 2021 by the authors. Licensee MDPI, Basel, Switzerland. This article is an open access article distributed under the terms and conditions of the Creative Commons Attribution (CC BY) license (https://creativecommons.org/licenses/by/4.0/).
Share and Cite
Xu, L.; Liu, S.; Wang, P.; Yang, Z. Influence of Mineral Additives on the Efflorescence of Ettringite-Rich Systems. Materials 2021, 14, 5464. https://doi.org/10.3390/ma14185464
Xu L, Liu S, Wang P, Yang Z. Influence of Mineral Additives on the Efflorescence of Ettringite-Rich Systems. Materials. 2021; 14(18):5464. https://doi.org/10.3390/ma14185464
Chicago/Turabian StyleXu, Linglin, Siyu Liu, Peiming Wang, and Zhenghong Yang. 2021. "Influence of Mineral Additives on the Efflorescence of Ettringite-Rich Systems" Materials 14, no. 18: 5464. https://doi.org/10.3390/ma14185464
APA StyleXu, L., Liu, S., Wang, P., & Yang, Z. (2021). Influence of Mineral Additives on the Efflorescence of Ettringite-Rich Systems. Materials, 14(18), 5464. https://doi.org/10.3390/ma14185464