
Impact of the Graphite Fillers on the Thermal Processing of Graphite/Poly(lactic acid) Composites

 ,
, 
 , , and
Abstract
:1. Introduction
2. Materials and Methods
2.1. Materials
2.2. Composite Preparation
2.3. Material Characterization
2.3.1. Phase Morphology Analysis
2.3.2. Chemical Structure Analysis
2.3.3. Thermal Behavior and Stability Analysis
3. Results
3.1. Phase Morphology Analysis
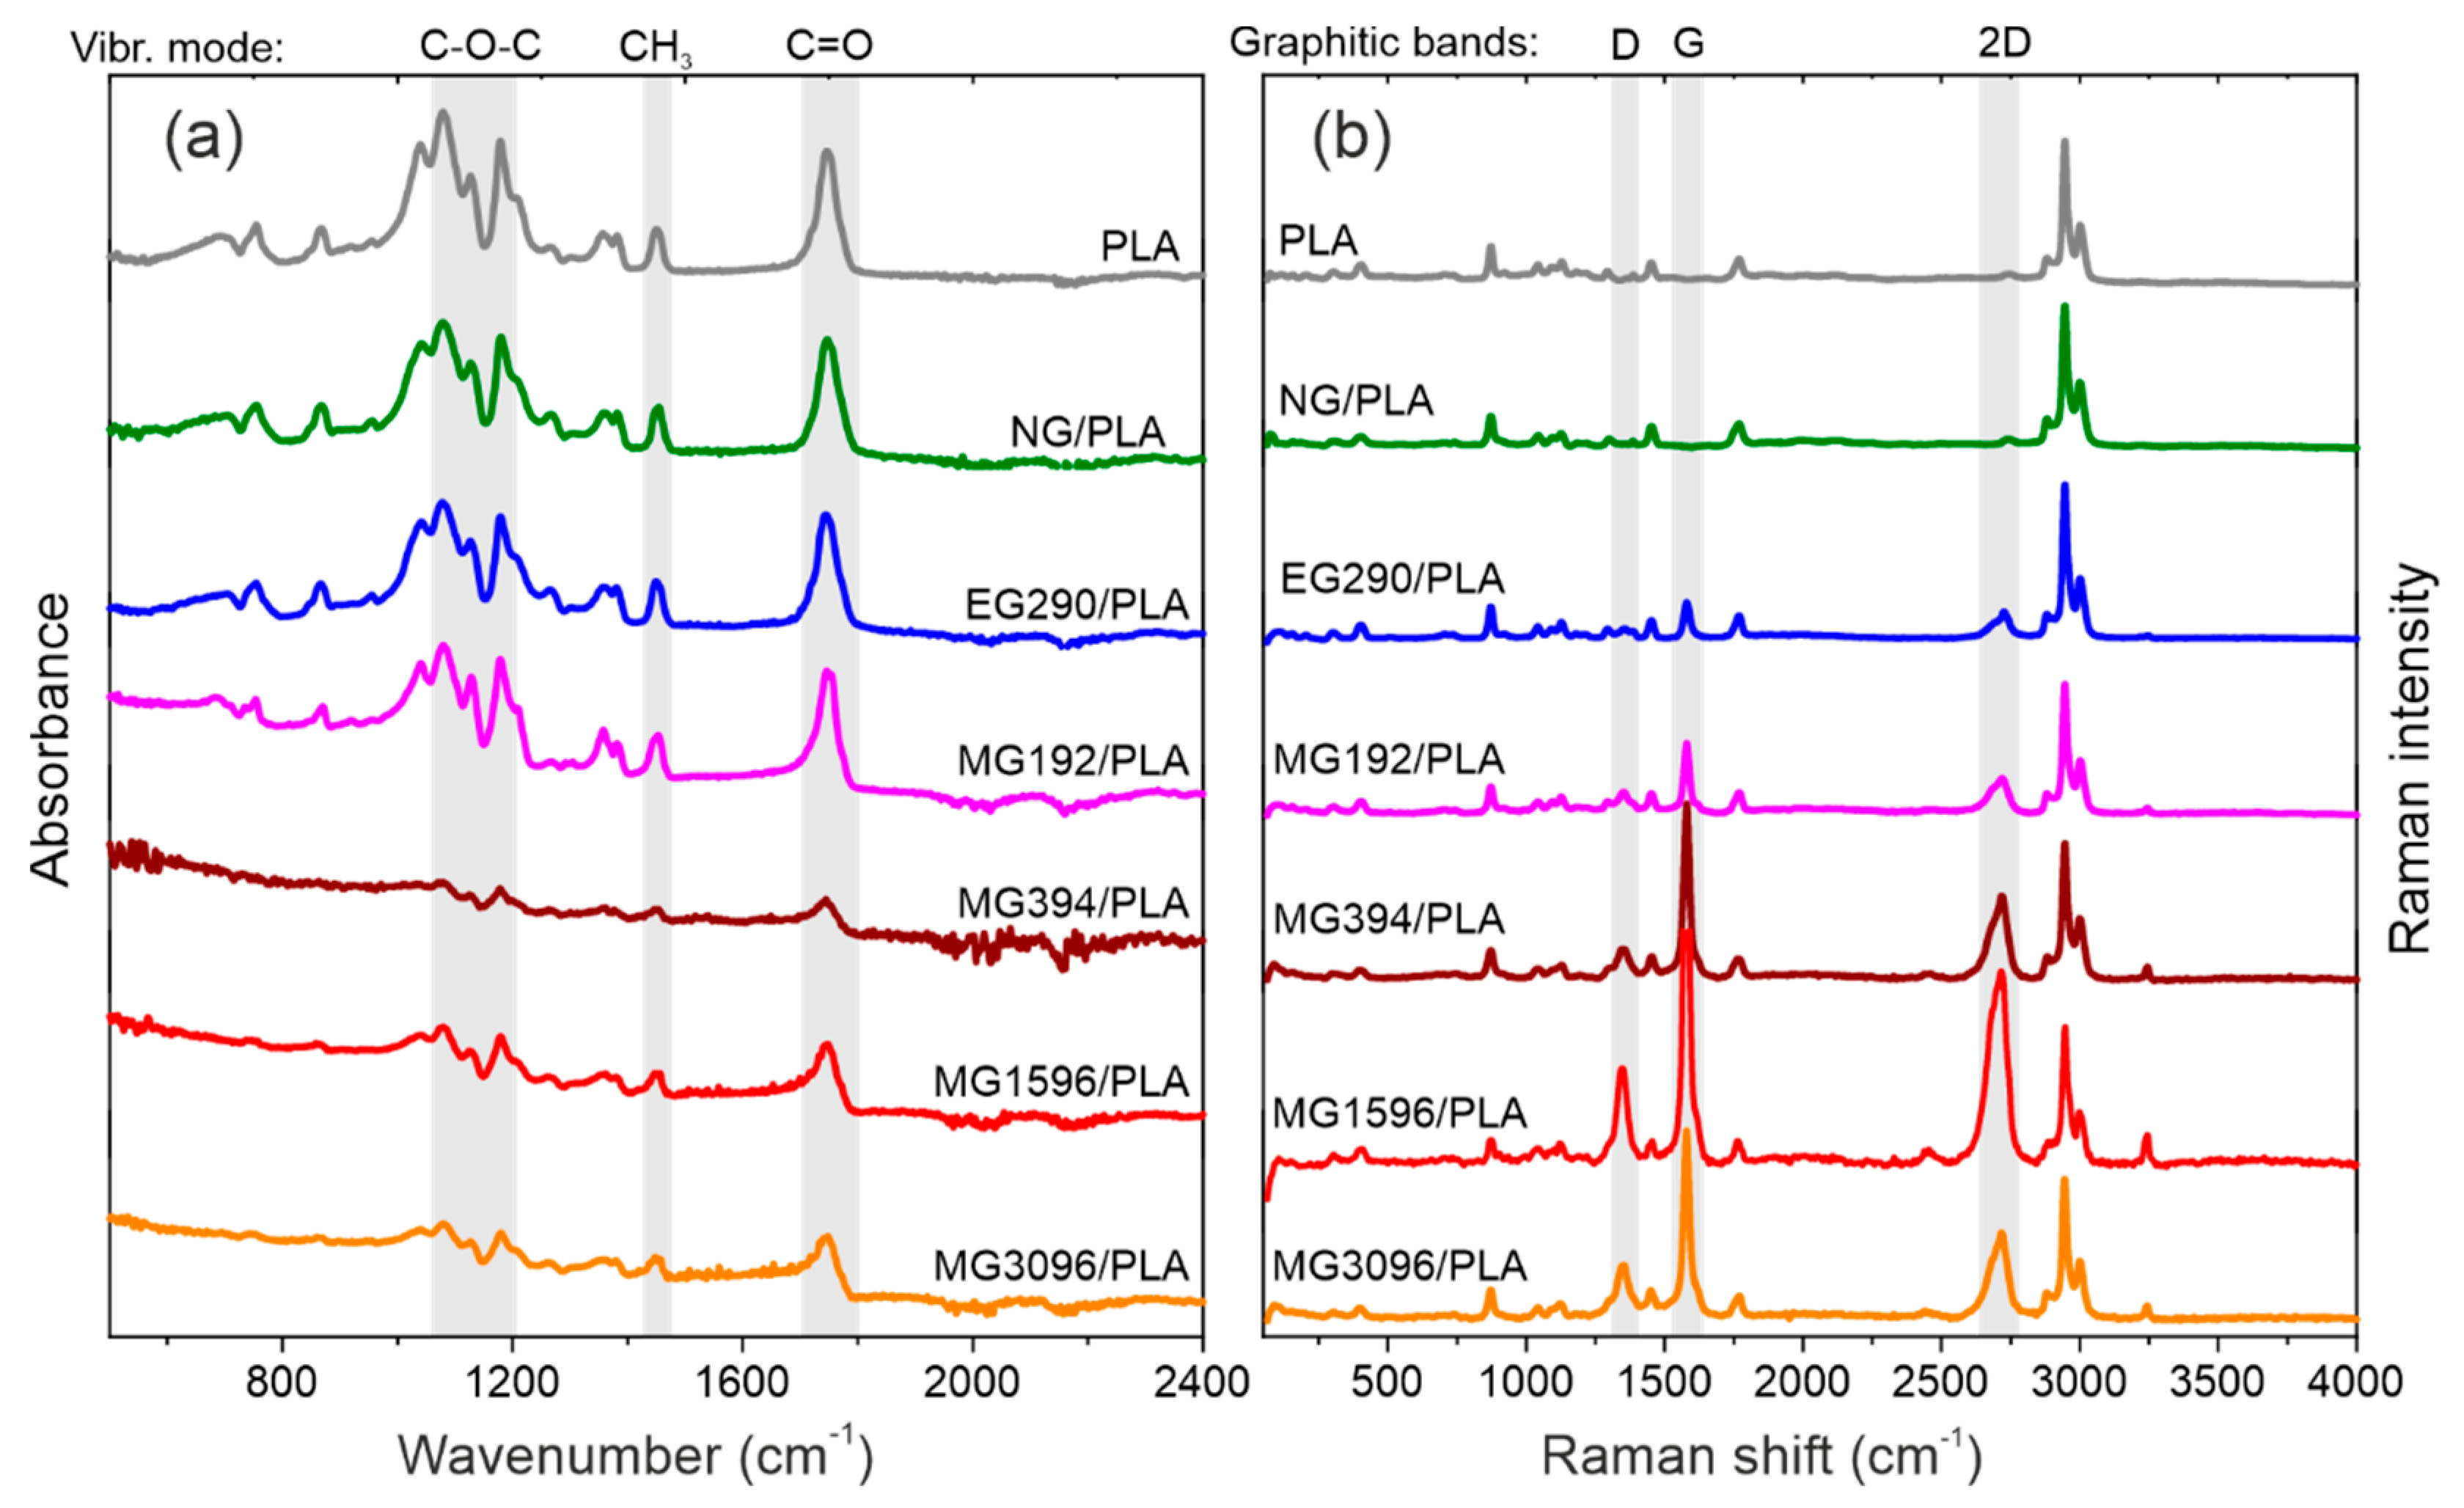
3.2. FTIR and Raman Analyses
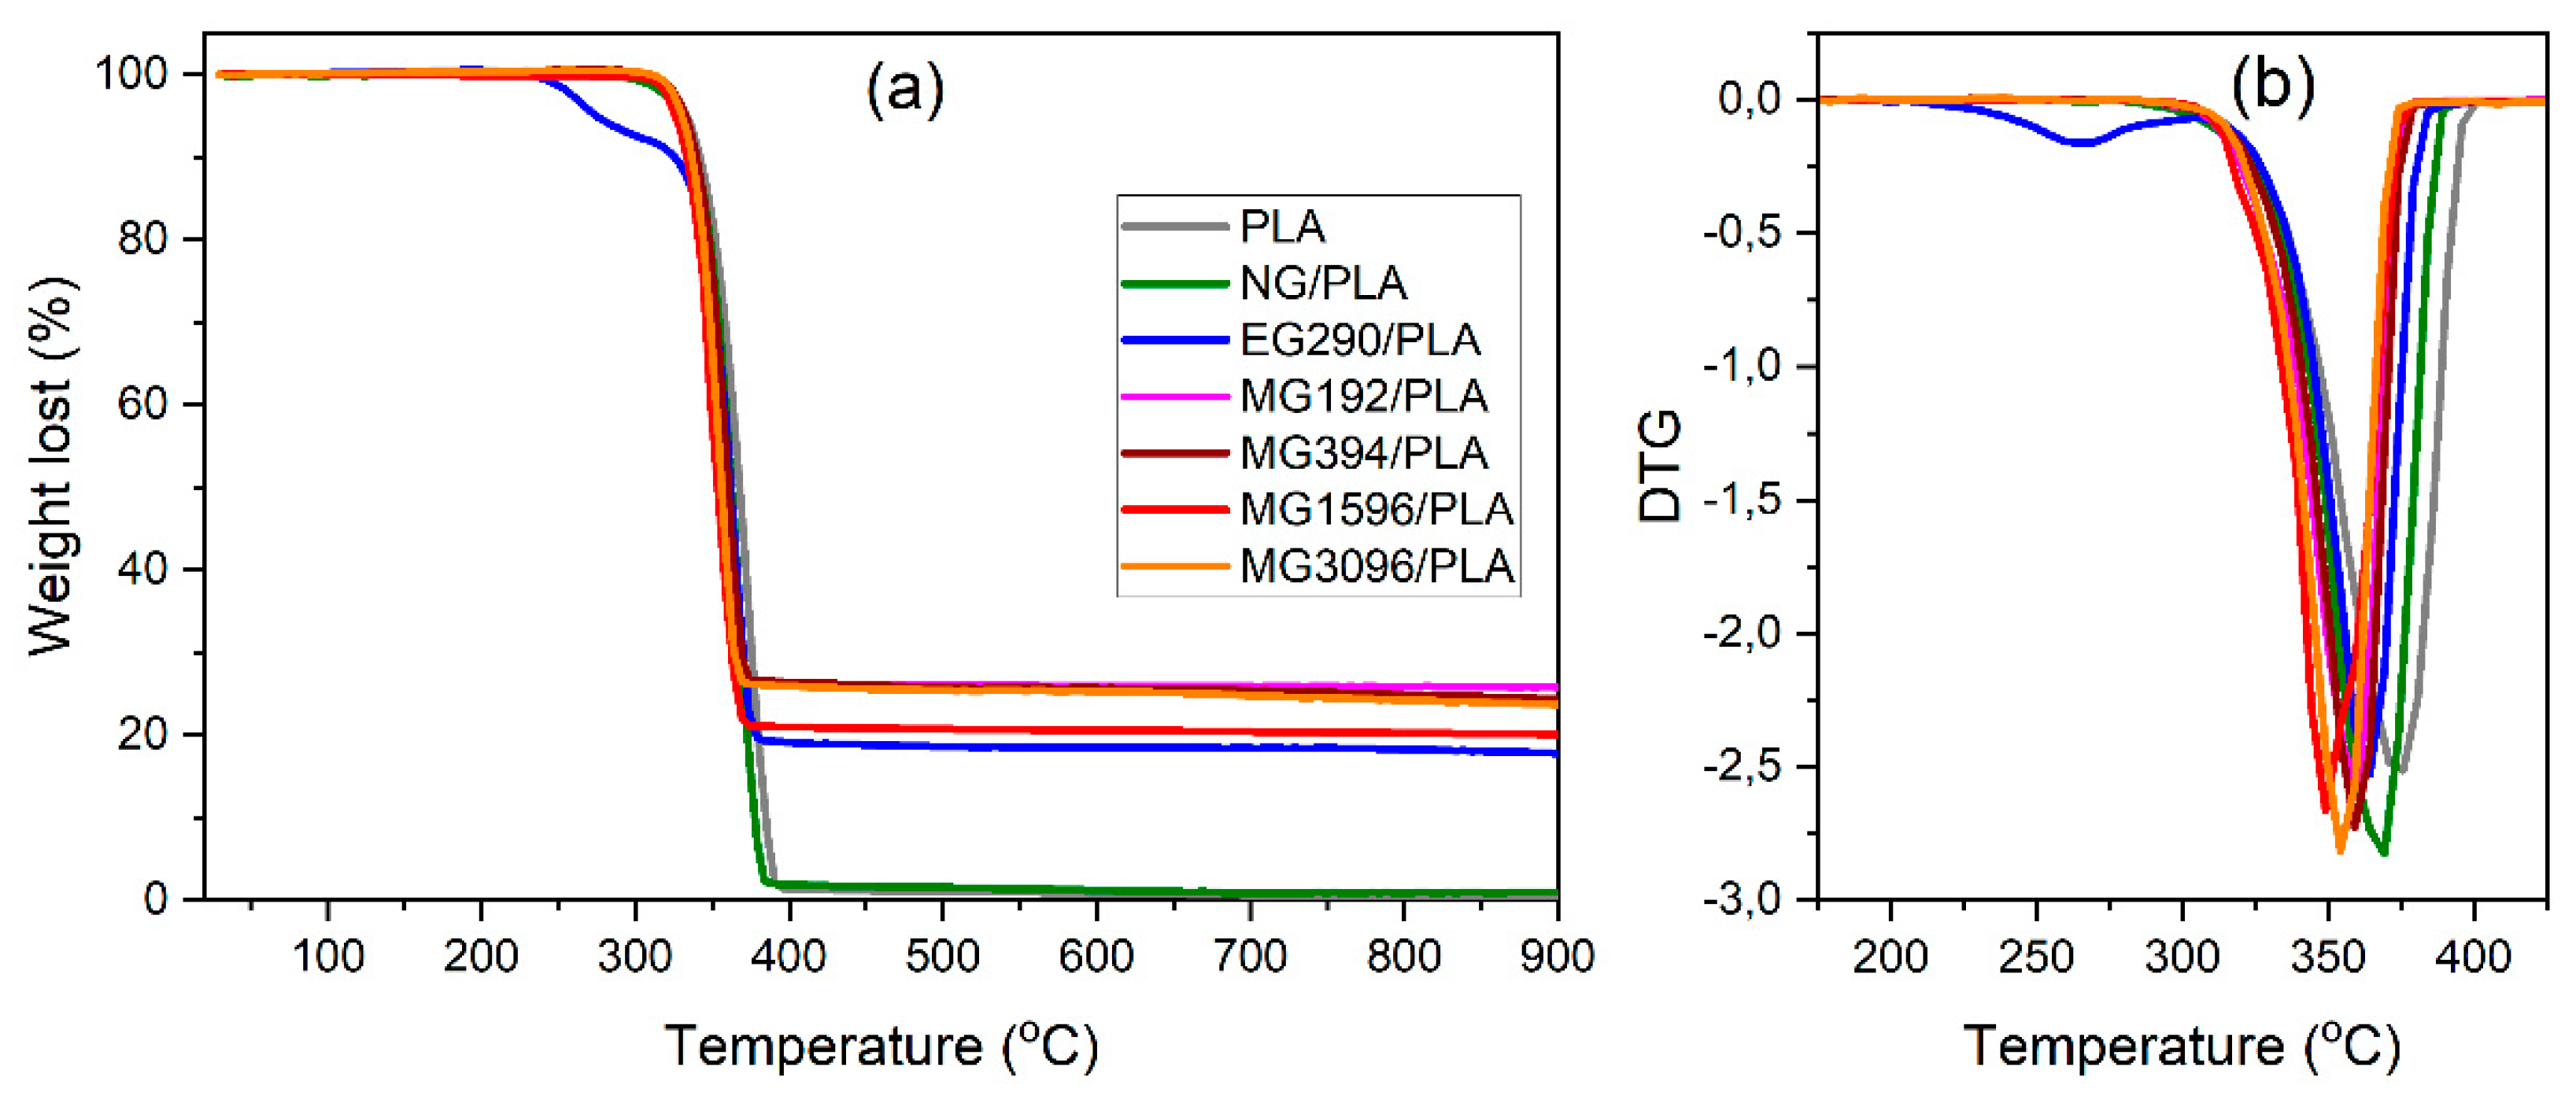
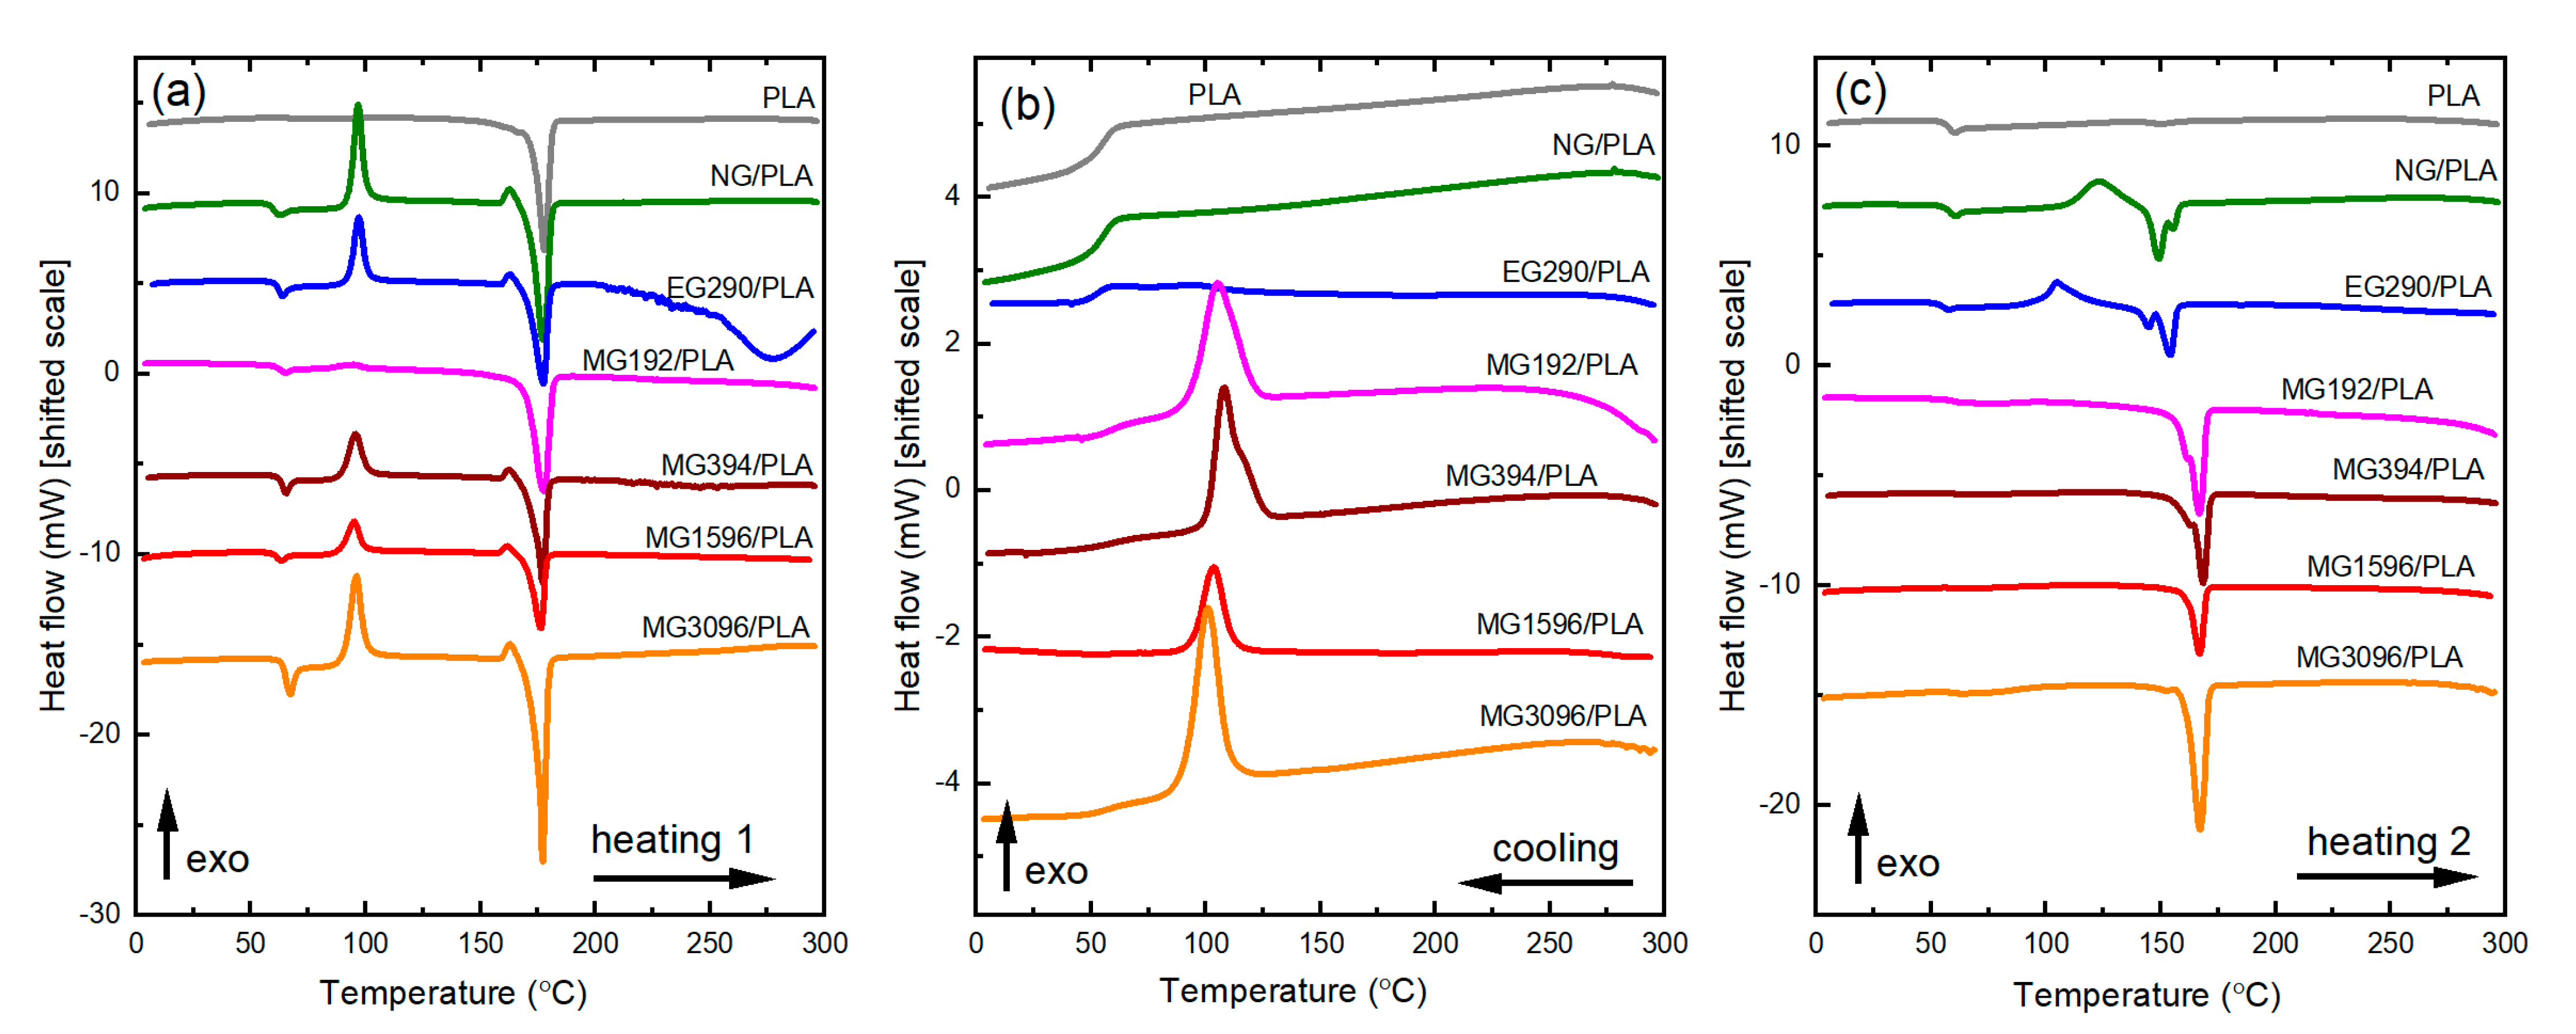
3.3. Thermal Behavior and Stability Analysis
4. Conclusions
Author Contributions
Funding
Institutional Review Board Statement
Informed Consent Statement
Data Availability Statement
Acknowledgments
Conflicts of Interest
References
- Di Lorenzo, M.L.; Androsch, R. Synthesis, Structure and Properties of Poly (lactic acid). In Advances in Polymer Science; Springer: Berlin/Heidelberg, Germany, 2018; Volume 279. [Google Scholar]
- Raquez, J.-M.; Habibi, Y.; Murariu, M.; Dubois, P. Polylactide (PLA)-based nanocomposites. Prog. Polym. Sci. 2013, 38, 1504–1542. [Google Scholar] [CrossRef]
- Gonçalves, C.; Gonçalves, I.C.; Magalhães, F.; Pinto, A.M. Poly(lactic acid) Composites Containing Carbon-Based Nanomaterials: A Review. Polymers 2017, 9, 269. [Google Scholar] [CrossRef] [Green Version]
- Arriagada, P.; Palza, H.; Palma, P.; Flores, M.; Caviedes, P. Poly(lactic acid) composites based on graphene oxide particles with antibacterial behavior enhanced by electrical stimulus and biocompatibility. J. Biomed. Mater. Res. Part A 2017, 106, 1051–1060. [Google Scholar] [CrossRef]
- Kim, M.; Jeong, J.H.; Lee, J.Y.; Capasso, A.; Bonaccorso, F.; Kang, S.H.; Lee, Y.K.; Lee, G.H. Electrically conducting and mechanically strong graphene–polylactic acid composites for 3D printing. ACS Appl. Mater. Interfaces 2019, 11, 11841–11848. [Google Scholar] [CrossRef]
- Tolvanen, J.; Hannu, J.; Hietala, M.; Kordas, K.; Jantunen, H. Biodegradable multiphase poly(lactic acid)/biochar/graphite composites for electromagnetic interference shielding. Compos. Sci. Technol. 2019, 181, 107704. [Google Scholar] [CrossRef]
- Wei, B.; Zhang, L.; Yang, S. Polymer composites with expanded graphite network with superior thermal conductivity and electromagnetic interference shielding performance. Chem. Eng. J. 2020, 404, 126437. [Google Scholar] [CrossRef]
- Kopinke, F.-D.; Remmler, M.; Mackenzie, K. Thermal decomposition of biodegradable polyesters—I: Poly (β-hydroxybutyric acid). Polym. Degrad. Stab. 1996, 52, 25–38. [Google Scholar] [CrossRef]
- Taubner, V.; Shishoo, R. Influence of processing parameters on the degradation of poly(l-lactide) during extrusion. J. Appl. Polym. Sci. 2001, 79, 2128–2135. [Google Scholar] [CrossRef]
- Chen, H.-M.; Zhang, W.-B.; Du, X.-C.; Yang, J.-H.; Zhang, N.; Huang, T.; Wang, Y. Crystallization kinetics and melting behaviors of poly(l-lactide)/graphene oxides composites. Thermochim. Acta 2013, 566, 57–70. [Google Scholar] [CrossRef]
- Quan, H.; Zhang, S.-J.; Qiao, J.-L.; Zhang, L.-Y. The electrical properties and crystallization of stereocomplex poly(lactic acid) filled with carbon nanotubes. Polymer 2012, 53, 4547–4552. [Google Scholar] [CrossRef]
- Liang, Y.-Y.; Xu, J.-Z.; Liu, X.-Y.; Zhong, G.-J.; Li, Z.-M. Role of surface chemical groups on carbon nanotubes in nucleation for polymer crystallization: Interfacial interaction and steric effect. Polymer 2013, 54, 6479–6488. [Google Scholar] [CrossRef]
- Batakliev, T.; Georgiev, V.; Kalupgian, C.; Muñoz, P.A.R.; Ribeiro, H.; Fechine, G.J.M.; Andrade, R.J.E.; Ivanov, E.; Kotsilkova, R. Physico-chemical Characterization of PLA-based Composites Holding Carbon Nanofillers. Appl. Compos. Mater. 2021, 1–18. [Google Scholar] [CrossRef]
- Kister, G.; Cassanas, G.; Vert, M. Effects of morphology, conformation and configuration on the IR and Raman spectra of various poly (lactic acid) s. Polymer 1998, 39, 267–273. [Google Scholar] [CrossRef]
- Yuniarto, K.; Purwanto, Y.A.; Purwanto, S.; Welt, B.A.; Purwadaria, H.K.; Sunarti, T.C. Infrared and Raman studies on polylactide acid and polyethylene glycol-400 blend. In AIP Conference Proceedings; AIP Publishing LLC: Melville, NY, USA, 2016. [Google Scholar]
- Kuzmenko, A.; Van Heumen, E.; Carbone, F.; Van Der Marel, D. Universal Optical Conductance of Graphite. Phys. Rev. Lett. 2008, 100, 117401. [Google Scholar] [CrossRef] [Green Version]
- Papoular, R.J.; Papoular, R. Some optical properties of graphite from IR to millimetric wavelengths. Mon. Not. R. Astron. Soc. 2014, 443, 2974–2982. [Google Scholar] [CrossRef]
- Cançado, L.G.; Jorio, A.; Ferreira, E.; Stavale, F.; Achete, C.A.; Capaz, R.B.; Moutinho, M.; Lombardo, A.; Kulmala, T.S.; Ferrari, A.C. Quantifying Defects in Graphene via Raman Spectroscopy at Different Excitation Energies. Nano Lett. 2011, 11, 3190–3196. [Google Scholar] [CrossRef] [Green Version]
- Fukushima, K.; Murariu, M.; Camino, G.; Dubois, P. Effect of expanded graphite/layered-silicate clay on thermal, mechanical and fire retardant properties of poly (lactic acid). Polym. Degrad. Stab. 2010, 95, 1063–1076. [Google Scholar] [CrossRef]
- Signori, F.; Coltelli, M.-B.; Bronco, S. Thermal degradation of poly(lactic acid) (PLA) and poly(butylene adipate-co-terephthalate) (PBAT) and their blends upon melt processing. Polym. Degrad. Stab. 2009, 94, 74–82. [Google Scholar] [CrossRef]
- Luyt, A.S.; Kelnar, I. Effect of blend ratio and nanofiller localization on the thermal degradation of graphite nanoplatelets-modified PLA/PCL. J. Therm. Anal. Calorim. 2018, 136, 2373–2382. [Google Scholar] [CrossRef]
- Fugallo, G.; Cepellotti, A.; Paulatto, L.; Lazzeri, M.; Marzari, N.; Mauri, F. Thermal Conductivity of Graphene and Graphite: Collective Excitations and Mean Free Paths. Nano Lett. 2014, 14, 6109–6114. [Google Scholar] [CrossRef]
- Lebedev, S.; Gefle, O.; Amitov, E.; Berchuk, D.; Zhuravlev, D. Poly(lactic acid)-based polymer composites with high electric and thermal conductivity and their characterization. Polym. Test. 2017, 58, 241–248. [Google Scholar] [CrossRef]
- Guo, R.; Ren, Z.; Bi, H.; Xu, M.; Cai, L. Electrical and Thermal Conductivity of Polylactic Acid (PLA)-Based Biocomposites by Incorporation of Nano-Graphite Fabricated with Fused Deposition Modeling. Polymers 2019, 11, 549. [Google Scholar] [CrossRef] [PubMed] [Green Version]
- Barkhad, M.; Abu-Jdayil, B.; Mourad, A.; Iqbal, M. Thermal Insulation and Mechanical Properties of Polylactic Acid (PLA) at Different Processing Conditions. Polymers 2020, 12, 2091. [Google Scholar] [CrossRef]
- Harmandaris, V.; Daoulas, K.; Mavrantzas, V.G. Molecular Dynamics Simulation of a Polymer Melt/Solid Interface: Local Dynamics and Chain Mobility in a Thin Film of Polyethylene Melt Adsorbed on Graphite. Macromolecules 2005, 38, 5796–5809. [Google Scholar] [CrossRef]
- Sullivan, E.M.; Oh, Y.J.; Gerhardt, R.; Wang, B.; Kalaitzidou, K. Understanding the effect of polymer crystallinity on the electrical conductivity of exfoliated graphite nanoplatelet/polylactic acid composite films. J. Polym. Res. 2014, 21, 1–9. [Google Scholar] [CrossRef]
- Ahmed, J.; Mulla, M.Z.; Vahora, A.; Bher, A.; Auras, R. Polylactide/graphene nanoplatelets composite films: Impact of high-pressure on topography, barrier, thermal, and mechanical properties. Polym. Compos. 2021, 42, 2898–2909. [Google Scholar] [CrossRef]
- Bartczak, Z.; Galeski, A.; Kowalczuk, M.; Sobota, M.; Malinowski, R. Tough blends of poly (lactide) and amorphous poly ([R, S]-3-hydroxy butyrate)–morphology and properties. Eur. Polym. J. 2013, 49, 3630–3641. [Google Scholar] [CrossRef]
- Margolin, A.; Monakhova, T.; Nedorezova, P.; Klyamkina, A.; Polschikov, S. Effects of graphene on thermal oxidation of isotactic polypropylene. Polym. Degrad. Stab. 2018, 156, 59–65. [Google Scholar] [CrossRef]
- Mysiukiewicz, O.; Barczewski, M.; Skórczewska, K.; Matykiewicz, D. Correlation between Processing Parameters and Degradation of Different Polylactide Grades during Twin-Screw Extrusion. Polymers 2020, 12, 1333. [Google Scholar] [CrossRef] [PubMed]
- Przekop, R.E.; Kujawa, M.; Pawlak, W.; Dobrosielska, M.; Sztorch, B.; Wieleba, W. Graphite Modified Polylactide (PLA) for 3D Printed (FDM/FFF) Sliding Elements. Polymers 2020, 12, 1250. [Google Scholar] [CrossRef] [PubMed]
- Bieliński, M.; Kotewicz, P. Technologiczne aspekty recyklingu tworzyw porowatych. Inżynieria Apar. Chem. 2010, 5, 20–21. [Google Scholar]
- Wang, L.; Hong, J.; Chen, G. Comparison study of graphite nanosheets and carbon black as fillers for high density polyethylene. Polym. Eng. Sci. 2010, 50, 2176–2181. [Google Scholar] [CrossRef]
- Duguay, A.J.; Kiziltas, A.; Nader, J.W.; Gardner, D.J.; Dagher, H.J. Impact properties and rheological behavior of exfoliated graphite nanoplatelet-filled impact modified polypropylene nanocomposites. J. Nanopart. Res. 2014, 16, 1–11. [Google Scholar] [CrossRef]


| Code | PLA (wt%) | Graphite (wt%) | Sample Preparation Method |
|---|---|---|---|
| PLA | PLA3260HP (100) | - | Unprocessed granulate |
| NG/PLA | PLA3260HP (100) | - | Melt mixing |
| EG290/PLA | PLA3260HP (73) | EG290 (27) | Melt mixing |
| MG192/PLA | PLA3260HP 74 | MG192 (26) | Melt mixing |
| MG394/PLA | PLA3260HP (75) | MG394 (25) | Melt mixing |
| MG1596/PLA | PLA3260HP (79) | MG1596 (21) | Melt mixing |
| MG3096/PLA | PLA3260HP (76) | MG3096 (24) | Melt mixing |
| Sample | T5 (°C) | Tmax (°C) | Δm900 (%) |
|---|---|---|---|
| PLA | 333 | 376 | 99.4 |
| NG/PLA | 329 | 369 | 99.0 |
| EG290/PLA * | - | 364 | 82.2 |
| MG192/PLA | 328 | 360 | 74.2 |
| MG394/PLA | 332 | 364 | 75.7 |
| MG1596/PLA | 328 | 352 | 79.9 |
| MG3096/PLA | 327 | 359 | 76.3 |
| Sample | Heating 1 | Cooling | Heating 2 | |||||||||
|---|---|---|---|---|---|---|---|---|---|---|---|---|
| Tm [°C] | ΔHm [J/g] | Tg [°C] | Tcc [°C] | ΔHcc [J/g] | Xc1 [%] | Tc [°C] | ΔHc [J/g] | Tm [°C] | ΔHm [J/g] | Tg [°C] | Xc2 [%] | |
| PLA | 177.78 | 57.22 | - | - | - | 62 | - | - | - | - | 57.56 | 0 |
| NG/PLA | 177.45 | 59.72 | 60.29 | 96.84 | 32.31 | 29 | - | - | 149.20 155.25 | 21.98 | 57.91 | 3 |
| EG290/PLA | 177.58 | 40.54 | 63.97 | 97.13 | 21.74 | 27 | - | - | 144.64 154.09 | 2.48 11.06 | 57.50 | 6 |
| MG192/PLA | 177.92 | 43.10 | 65.11 | 94.28 | 1.82 | 59 | 105.14 | 23.49 | 162.47 166.86 | 32.06 | - | 46 |
| MG394/PLA | 177.35 | 43.66 | 65.45 | 95.56 | 22.18 | 31 | 107.96 | 28.53 | 163.06 168.44 | 35.71 | - | 51 |
| MG1596/PLA | 176.33 | 45.02 | 60.69 | 94.90 | 21.75 | 31 | 103.41 | 22.14 | 166.88 | 31.68 | - | 43 |
| MG3096/PLA | 176.66 | 36.05 | 65.95 | 96.13 | 22.88 | 30 | 105.30 | 26.86 | 162.40 168.07 | 34.09 | - | 49 |
| Sample | OIT [s] |
|---|---|
| PLA | 38 ± 2 |
| NG/PLA | 38 ± 3 |
| EG290/PLA | 32 ± 2 |
| MG192/PLA | 31 ± 1 |
| MG394/PLA | 31 ± 2 |
| MG1596/PLA | 31 ± 1 |
| MG3096/PLA | 33 ± 4 |
| Sample | MFR (g/10 min) |
|---|---|
| PLA | 69.1 ± 3.5 |
| NG/PLA | 64.9 ± 1.6 |
| EG290/PLA | >125 |
| MG192/PLA | 31.3 ± 1.2 |
| MG394/PLA | 23.9 ± 0.9 |
| MG1596/PLA | 25.9 ± 1.7 |
| MG3096/PLA | 31.4 ± 1.2 |
Publisher’s Note: MDPI stays neutral with regard to jurisdictional claims in published maps and institutional affiliations. |
© 2021 by the authors. Licensee MDPI, Basel, Switzerland. This article is an open access article distributed under the terms and conditions of the Creative Commons Attribution (CC BY) license (https://creativecommons.org/licenses/by/4.0/).
Share and Cite
Kaczor, D.; Fiedurek, K.; Bajer, K.; Raszkowska-Kaczor, A.; Domek, G.; Macko, M.; Madajski, P.; Szroeder, P. Impact of the Graphite Fillers on the Thermal Processing of Graphite/Poly(lactic acid) Composites. Materials 2021, 14, 5346. https://doi.org/10.3390/ma14185346
Kaczor D, Fiedurek K, Bajer K, Raszkowska-Kaczor A, Domek G, Macko M, Madajski P, Szroeder P. Impact of the Graphite Fillers on the Thermal Processing of Graphite/Poly(lactic acid) Composites. Materials. 2021; 14(18):5346. https://doi.org/10.3390/ma14185346
Chicago/Turabian StyleKaczor, Daniel, Kacper Fiedurek, Krzysztof Bajer, Aneta Raszkowska-Kaczor, Grzegorz Domek, Marek Macko, Piotr Madajski, and Pawel Szroeder. 2021. "Impact of the Graphite Fillers on the Thermal Processing of Graphite/Poly(lactic acid) Composites" Materials 14, no. 18: 5346. https://doi.org/10.3390/ma14185346
APA StyleKaczor, D., Fiedurek, K., Bajer, K., Raszkowska-Kaczor, A., Domek, G., Macko, M., Madajski, P., & Szroeder, P. (2021). Impact of the Graphite Fillers on the Thermal Processing of Graphite/Poly(lactic acid) Composites. Materials, 14(18), 5346. https://doi.org/10.3390/ma14185346