
Life Cycle Assessment of Two Alternative Plastics for Bottle Production

 ,
,  ,
,  ,
,
Abstract
:1. Introduction
2. Materials and Methods
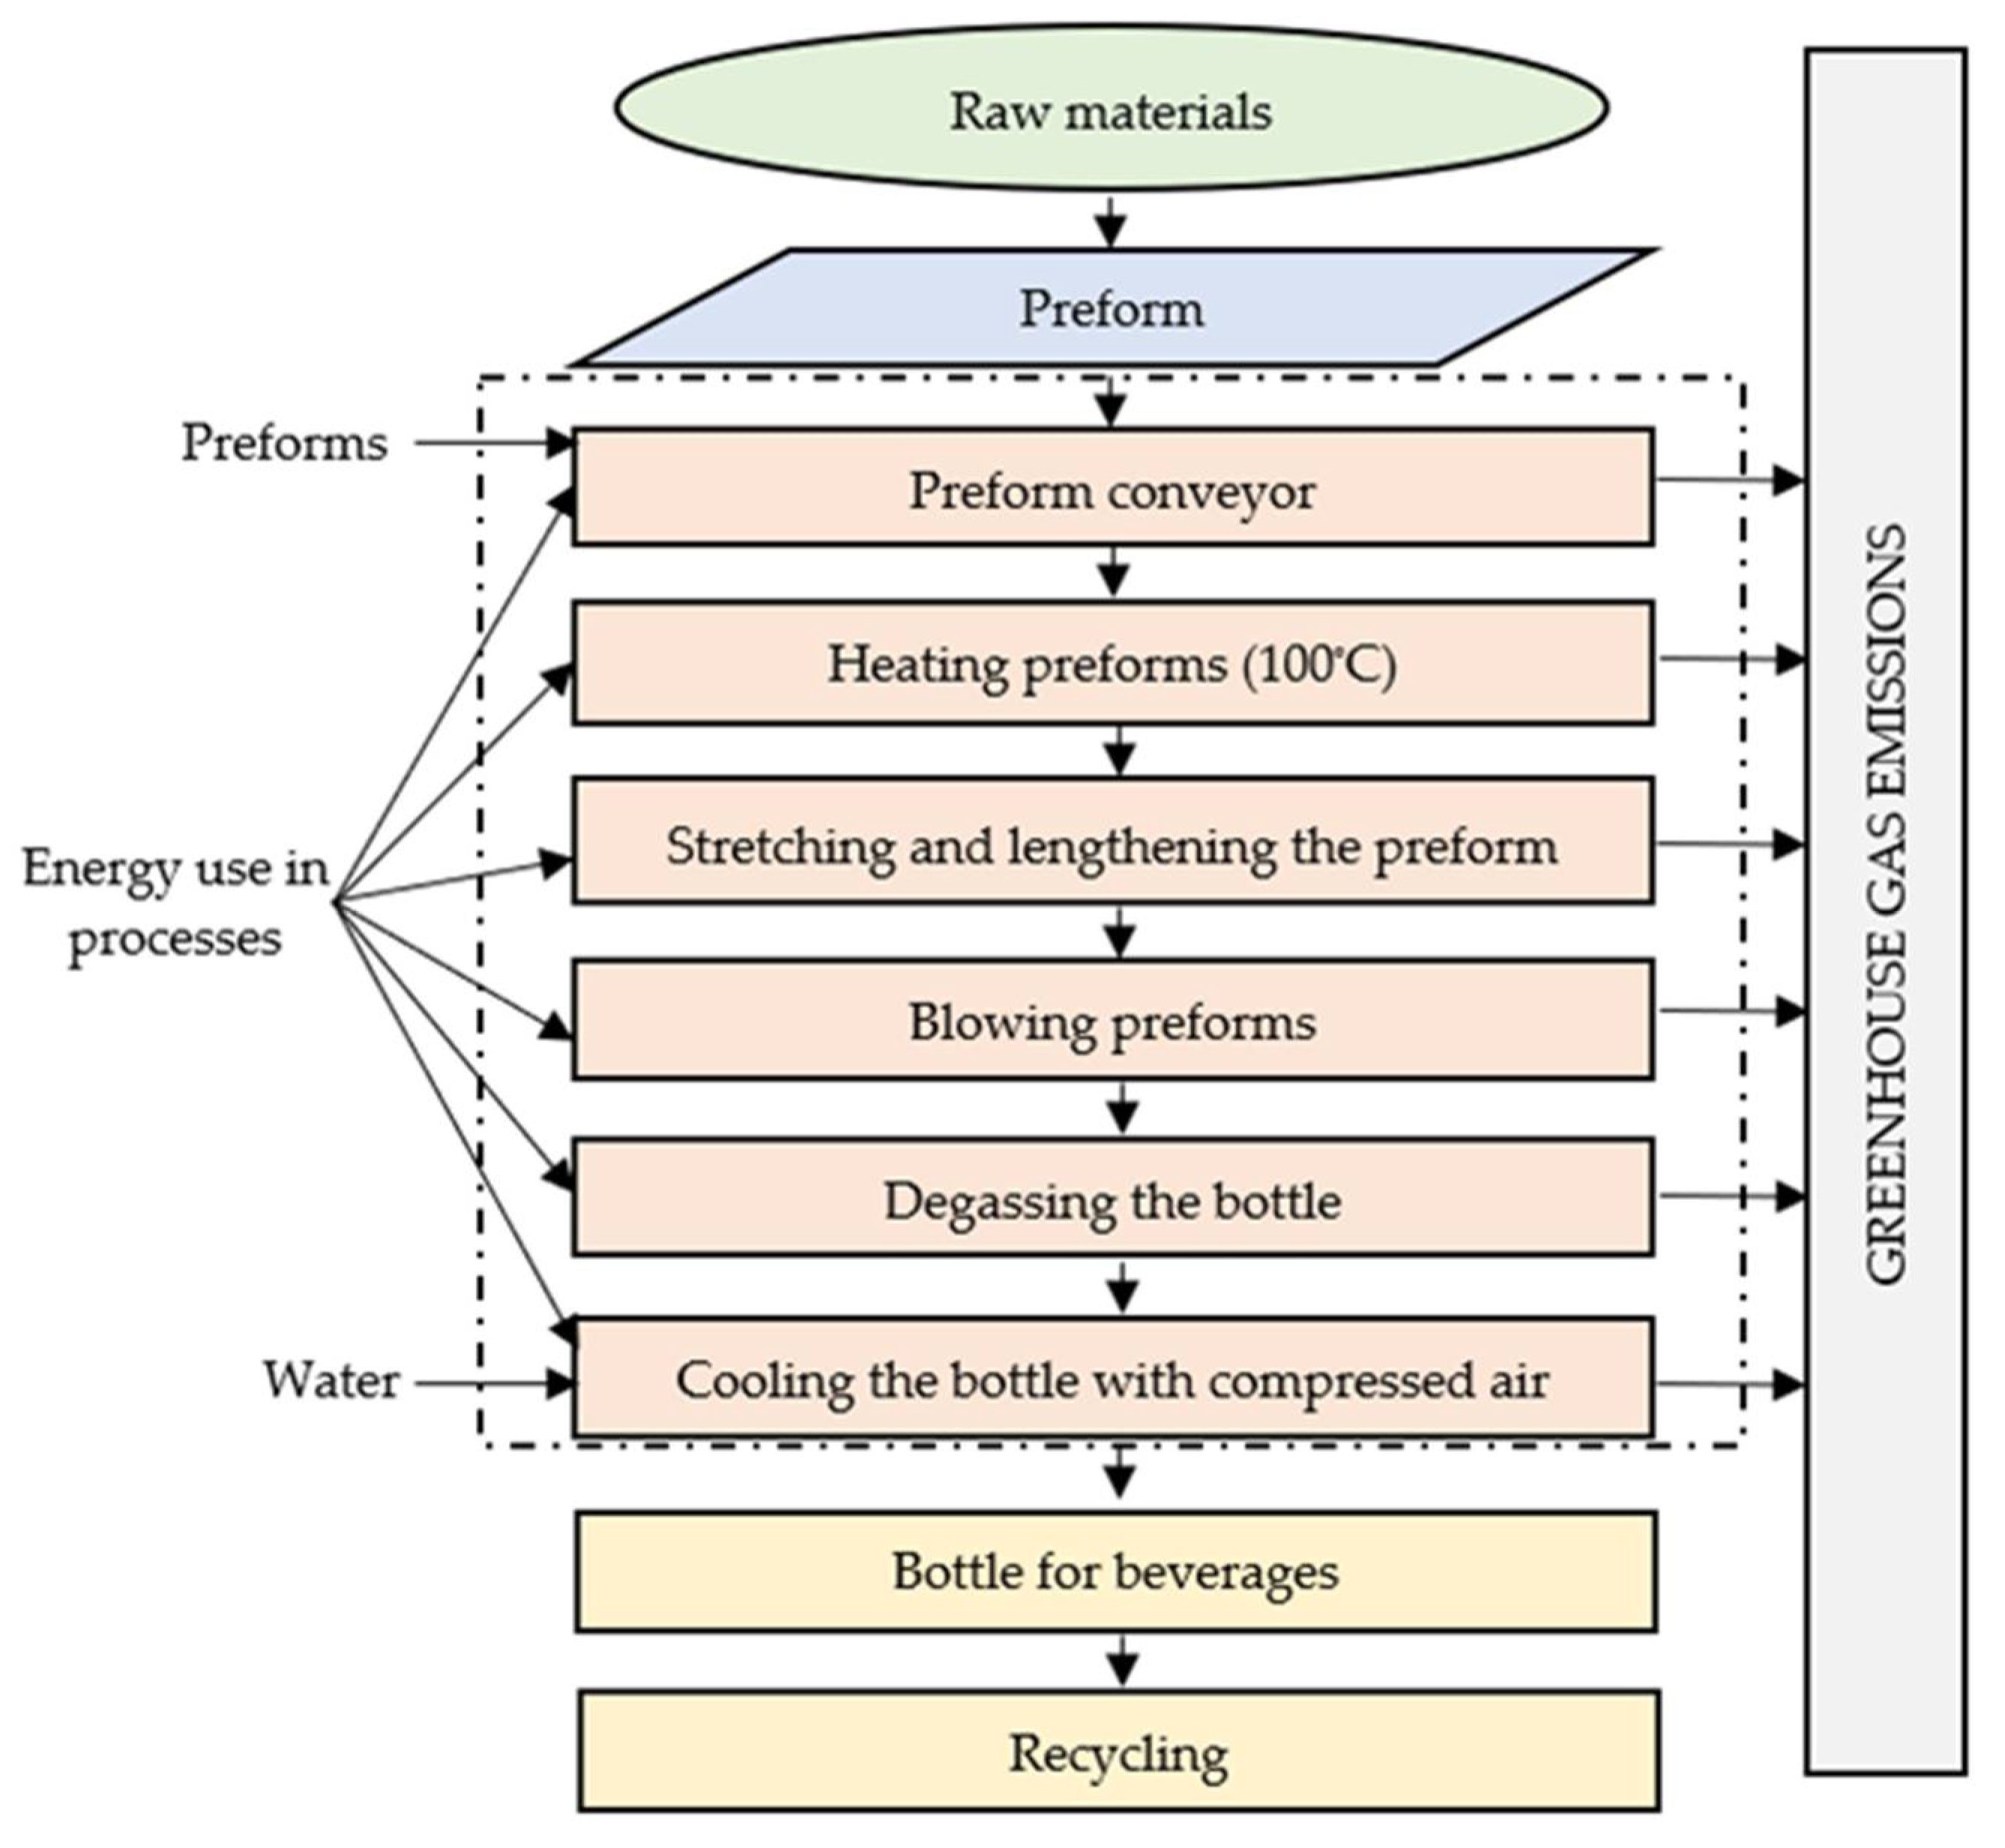
2.1. Characteristics of the Analysis Object
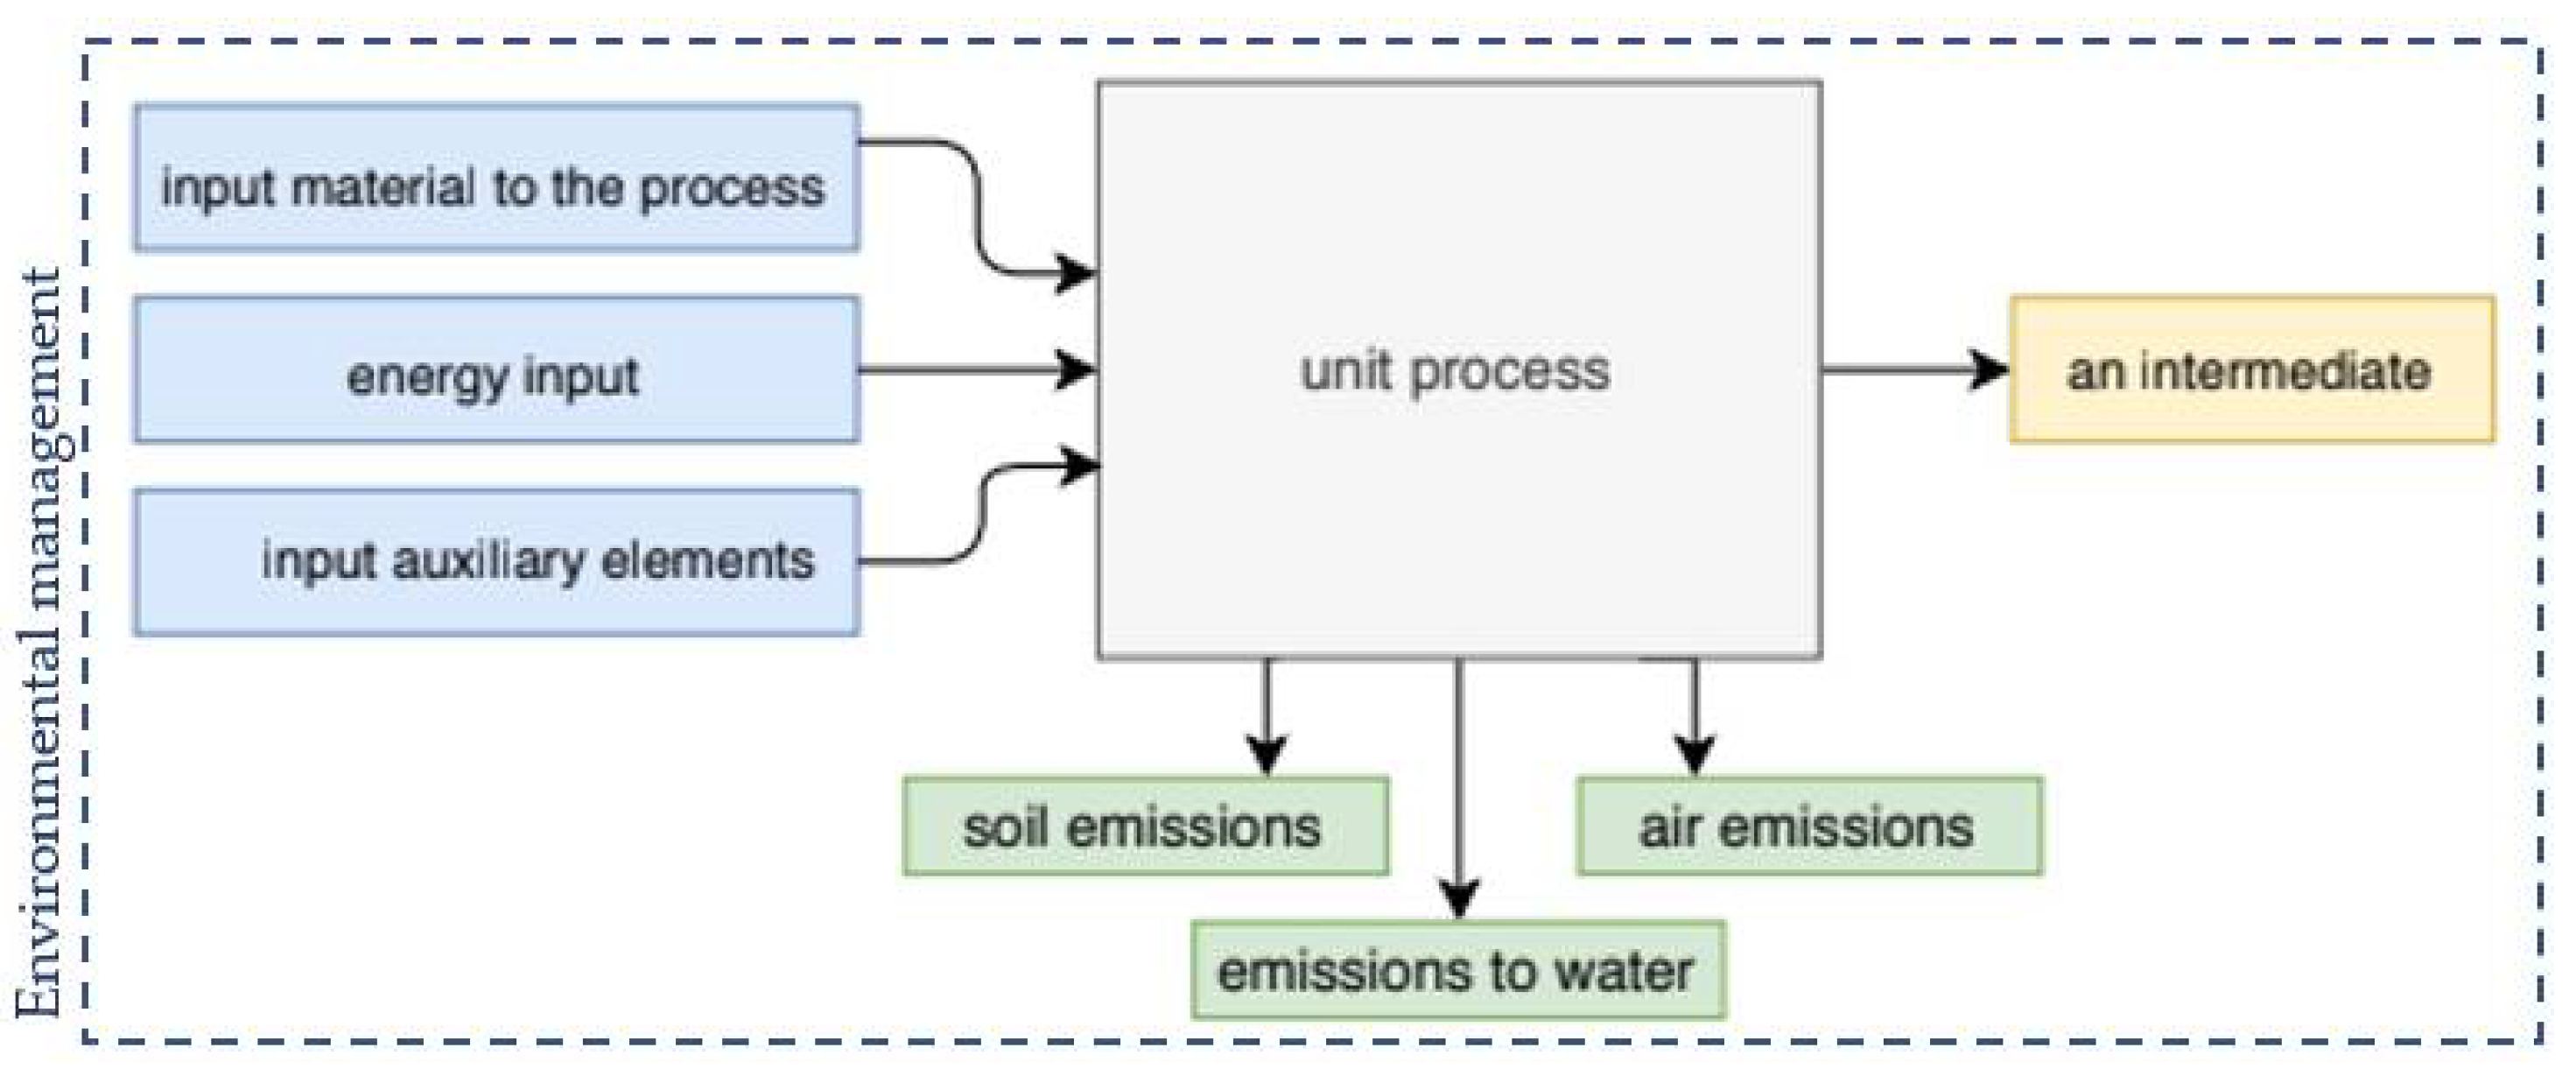
2.2. Determination of Goal and Scope
- collecting cold preforms for the furnace;
- heating preforms in the blow molding furnace;
- stretching and lengthening the hot preform;
- cooling and degassing of ready bottles.
- input data: energy expenditure, raw material expenditure, auxiliary data, and other;
- output data: products, semi-finished products;
- pollutant emissions to air, water, and soil;
- other environmental aspects.
2.3. System Boundary and Functional Unit
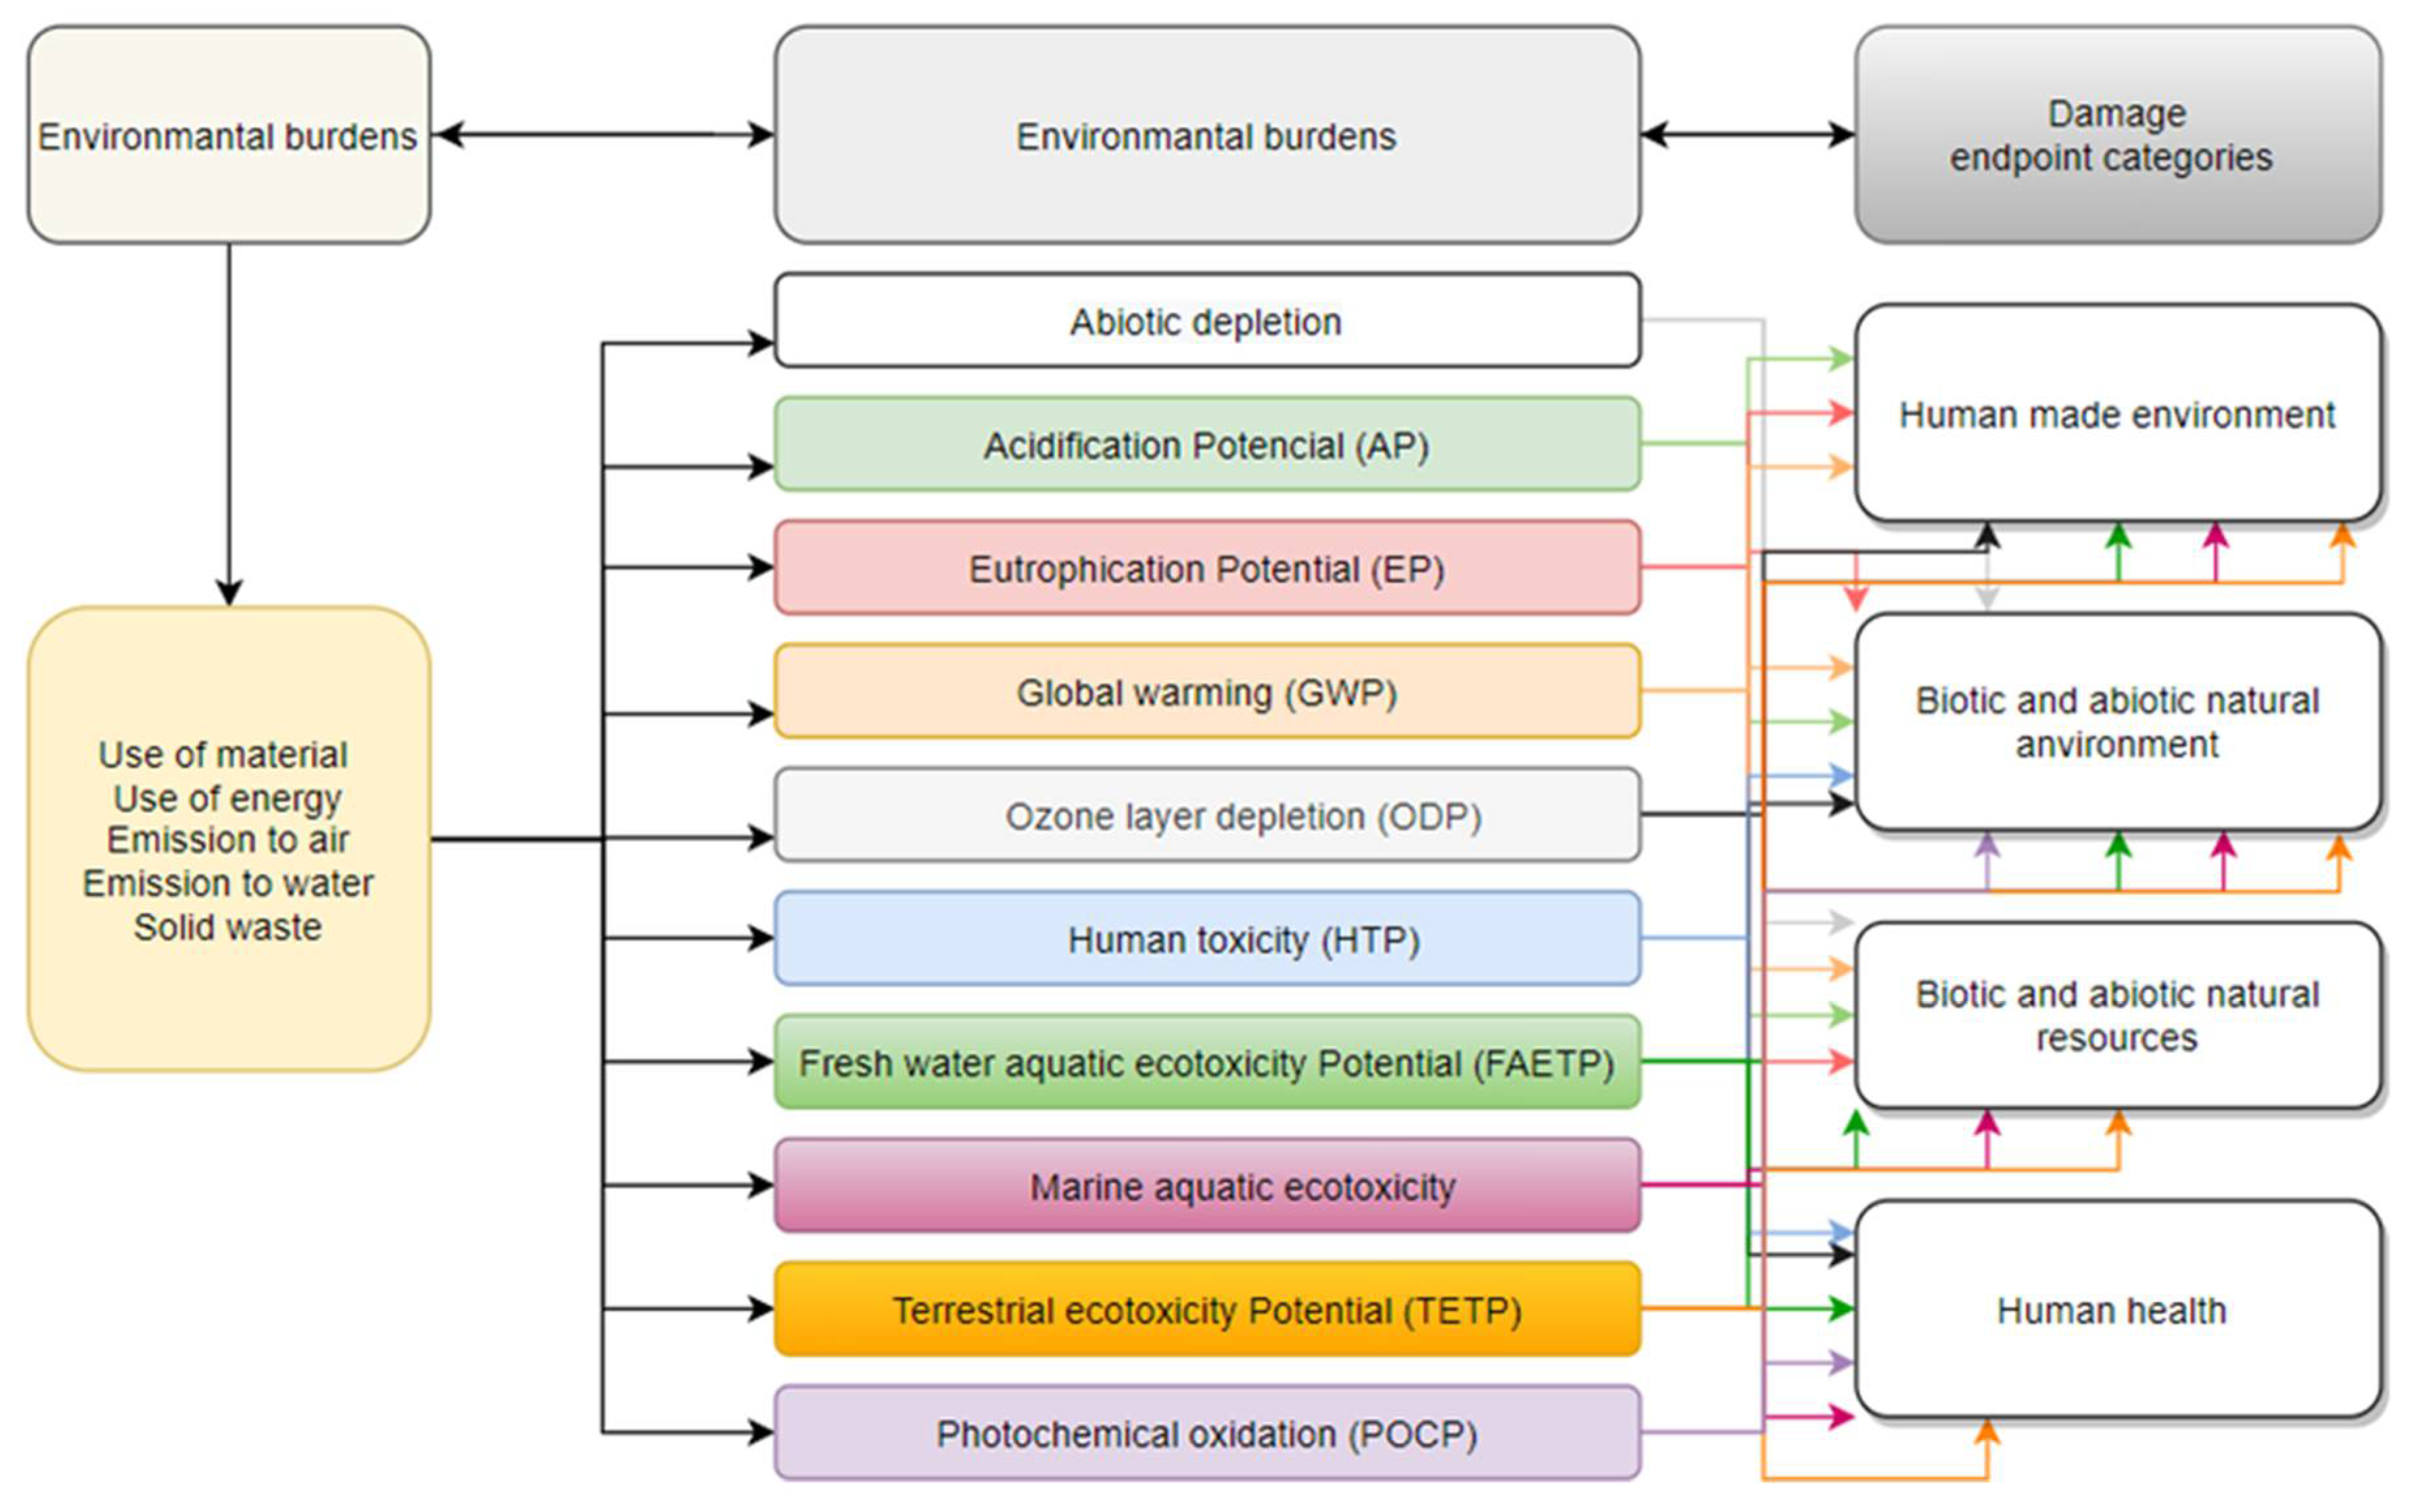
2.4. Life Cycle Impact Assessment (LCIA)
2.4.1. CML 2001 Baseline 2000
- Abiotic depletion;
- Acidification Potential (AP);
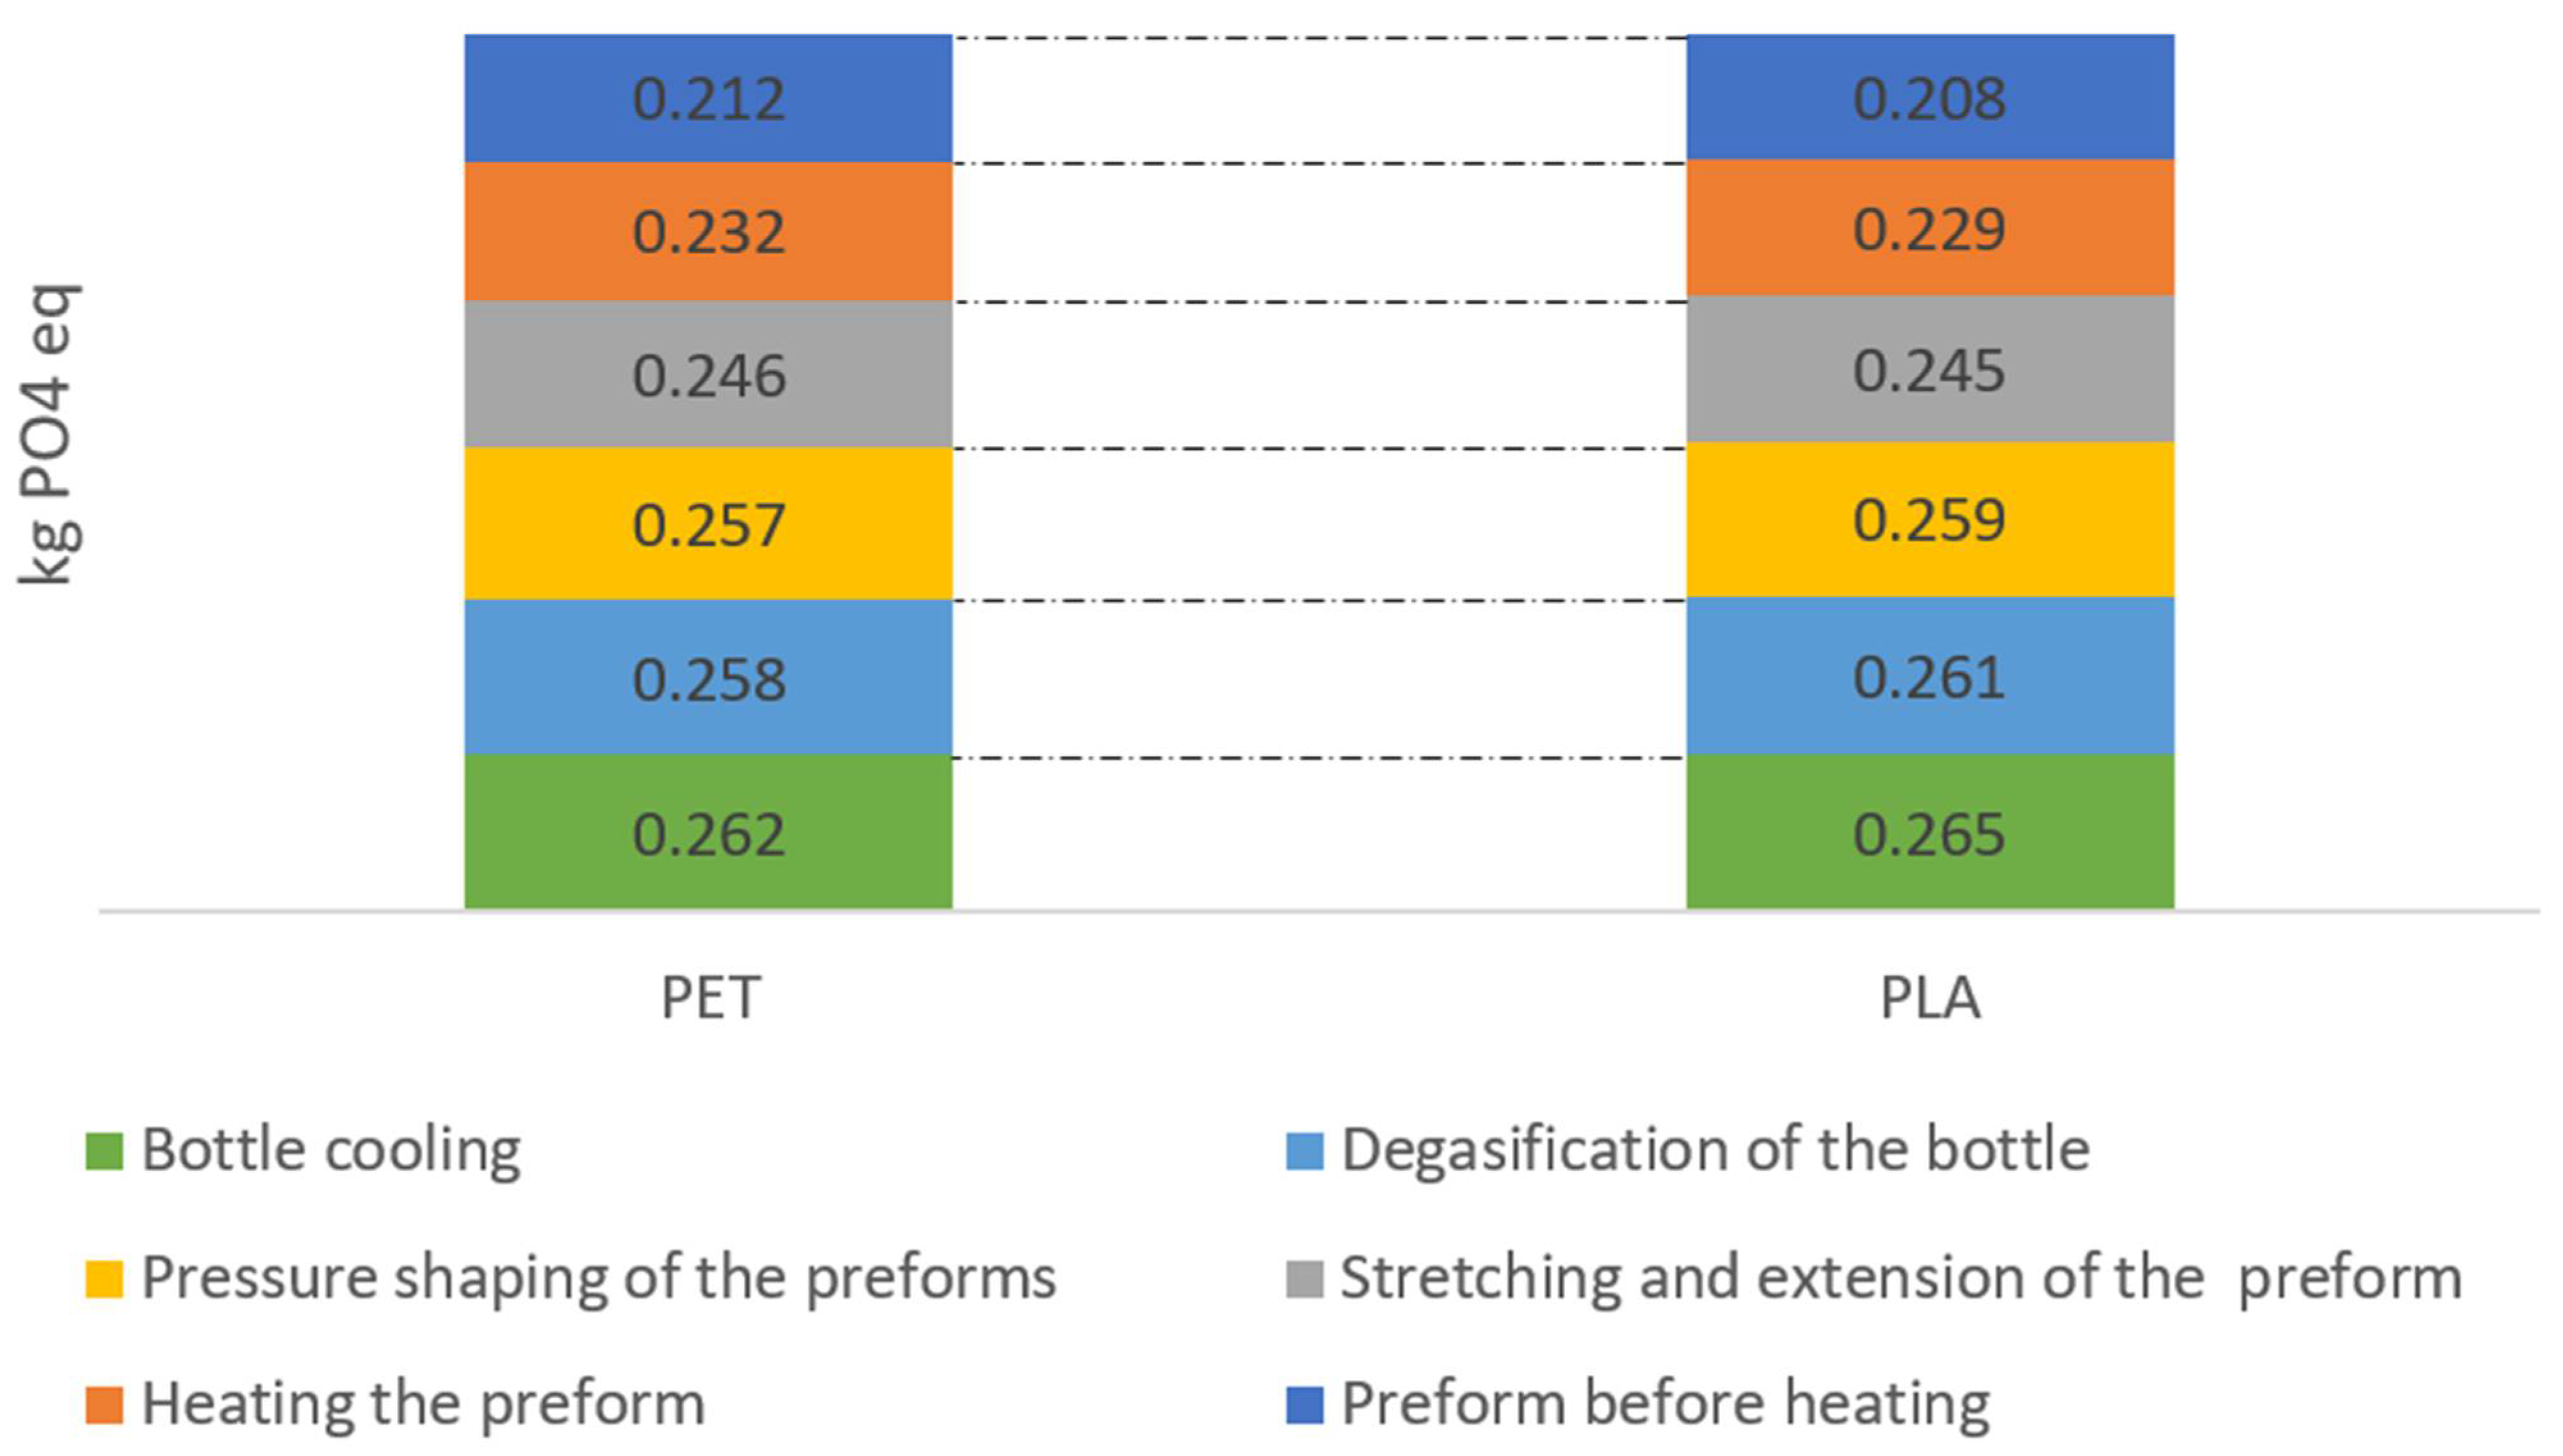
- Eutrophication Potential (EP);
- Global warming (GWP);
- Ozone layer depletion (ODP);
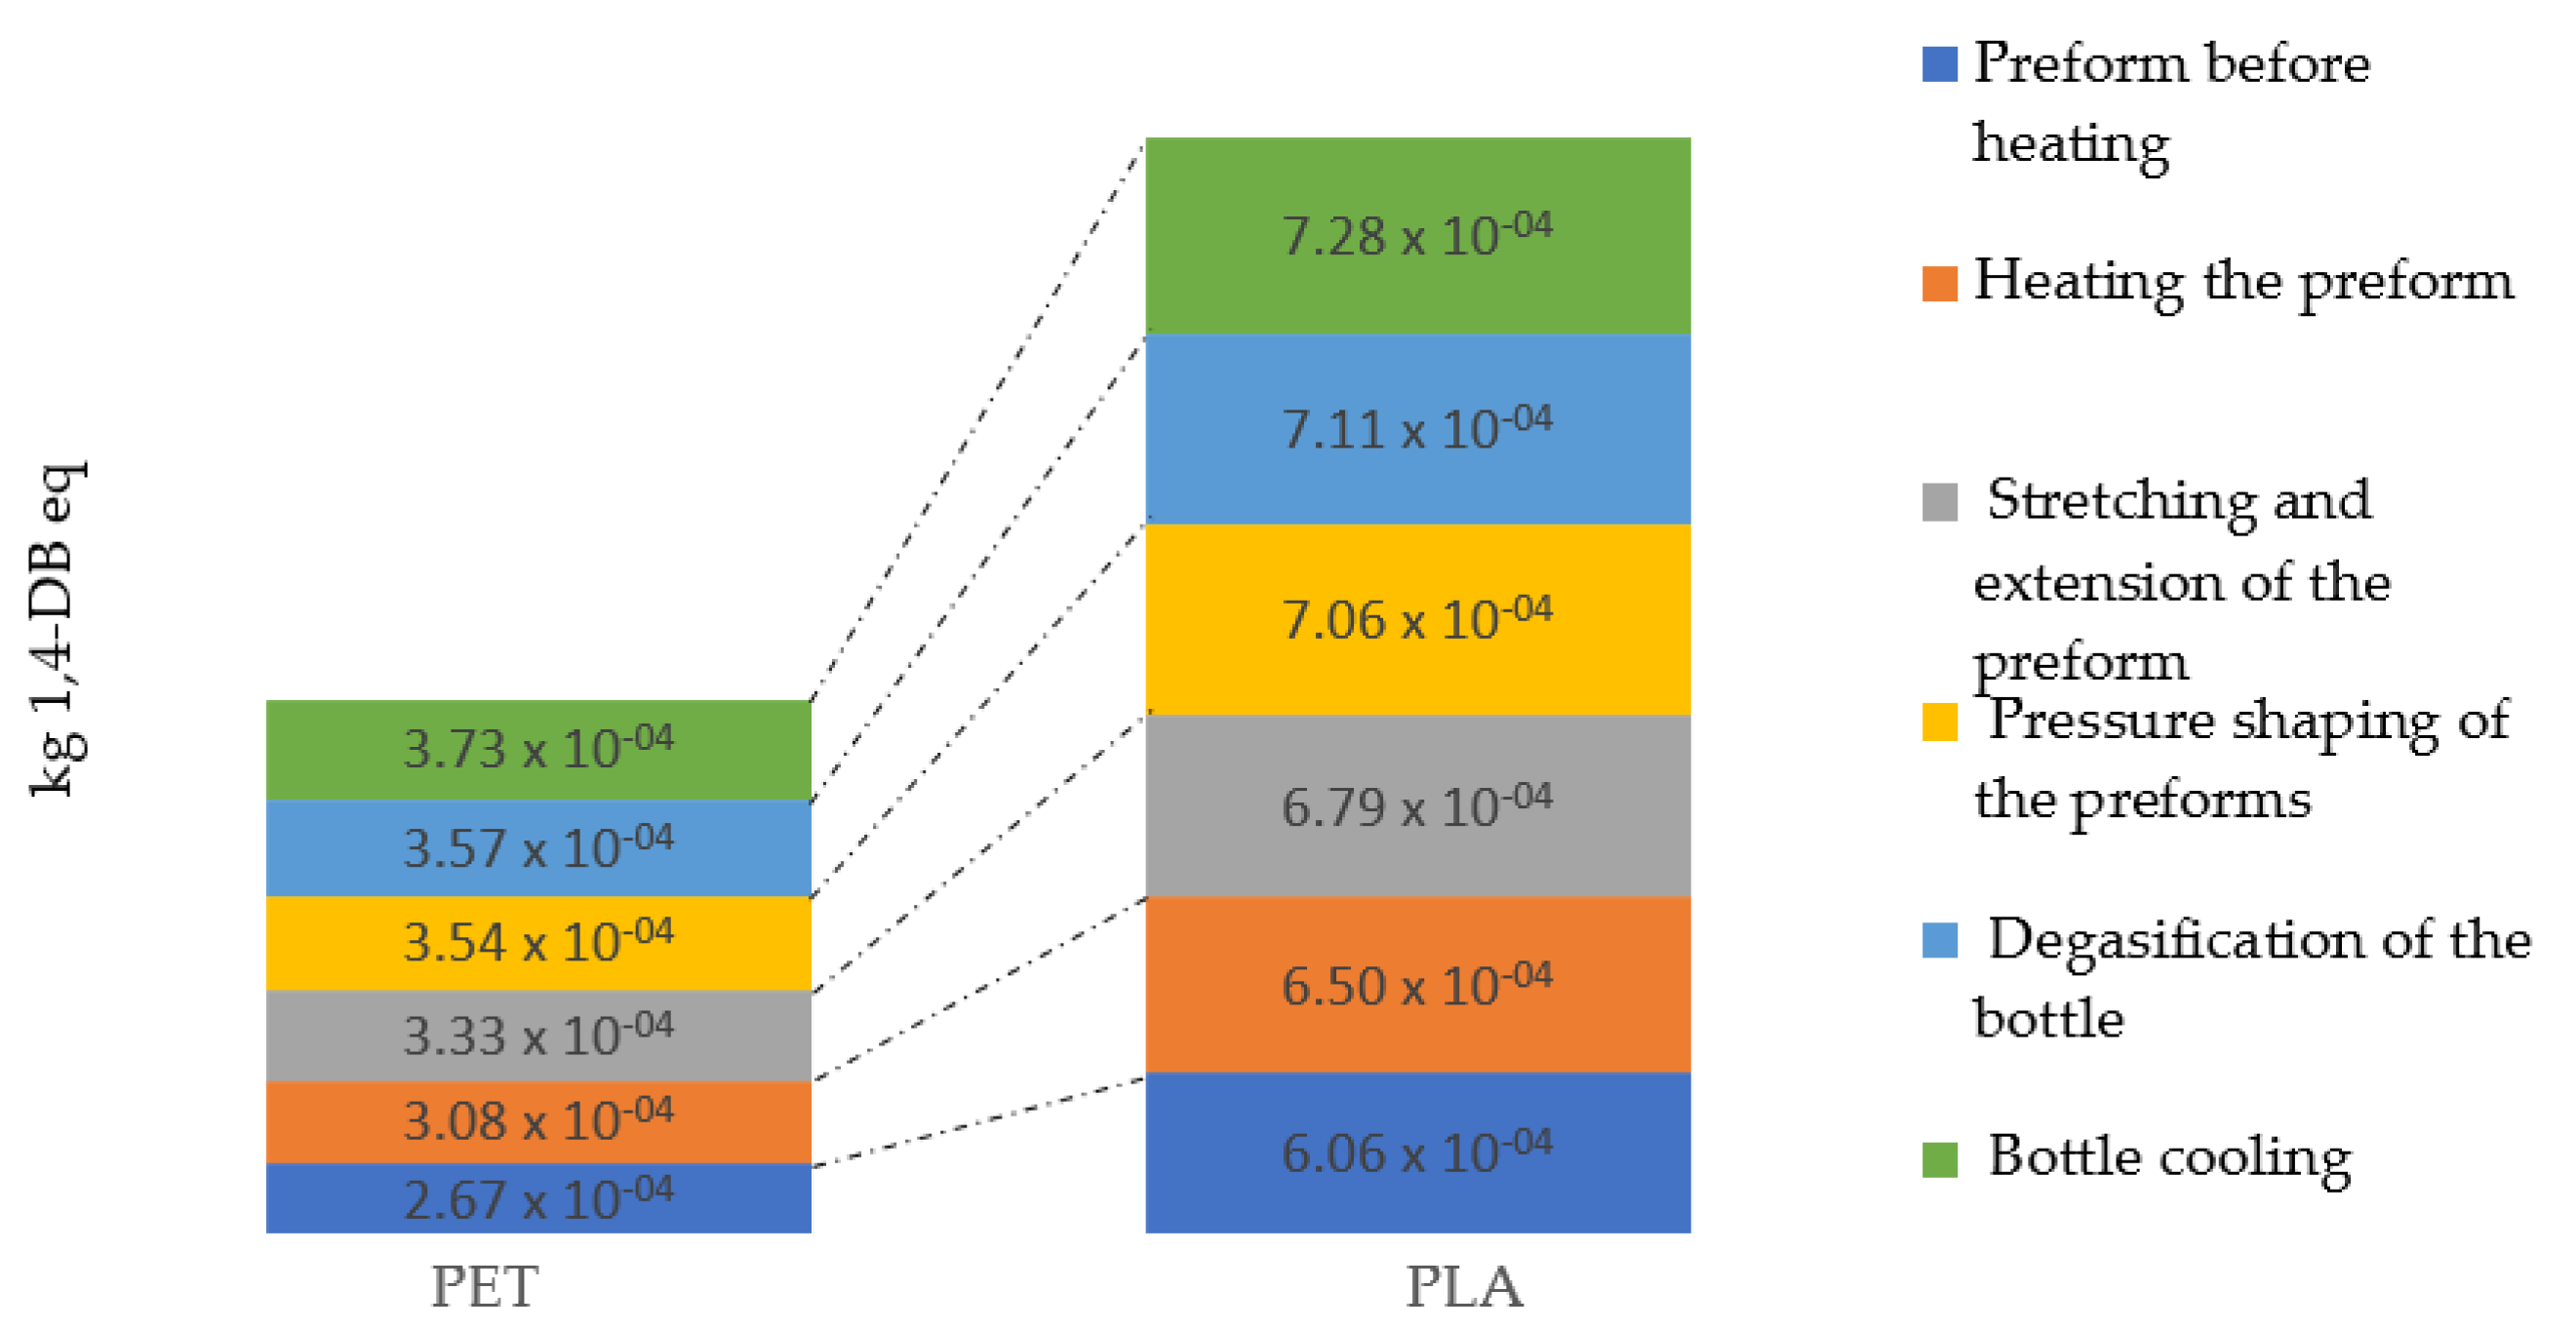
- Human toxicity (HTP);
- Fresh water aquatic ecotoxicity Potential (FAETP);
- Marine aquatic ecotoxicity;
- Terrestrial ecotoxicity Potential (TETP);
- Photochemical oxidation (POCP).
2.4.2. ReCiPe 2016
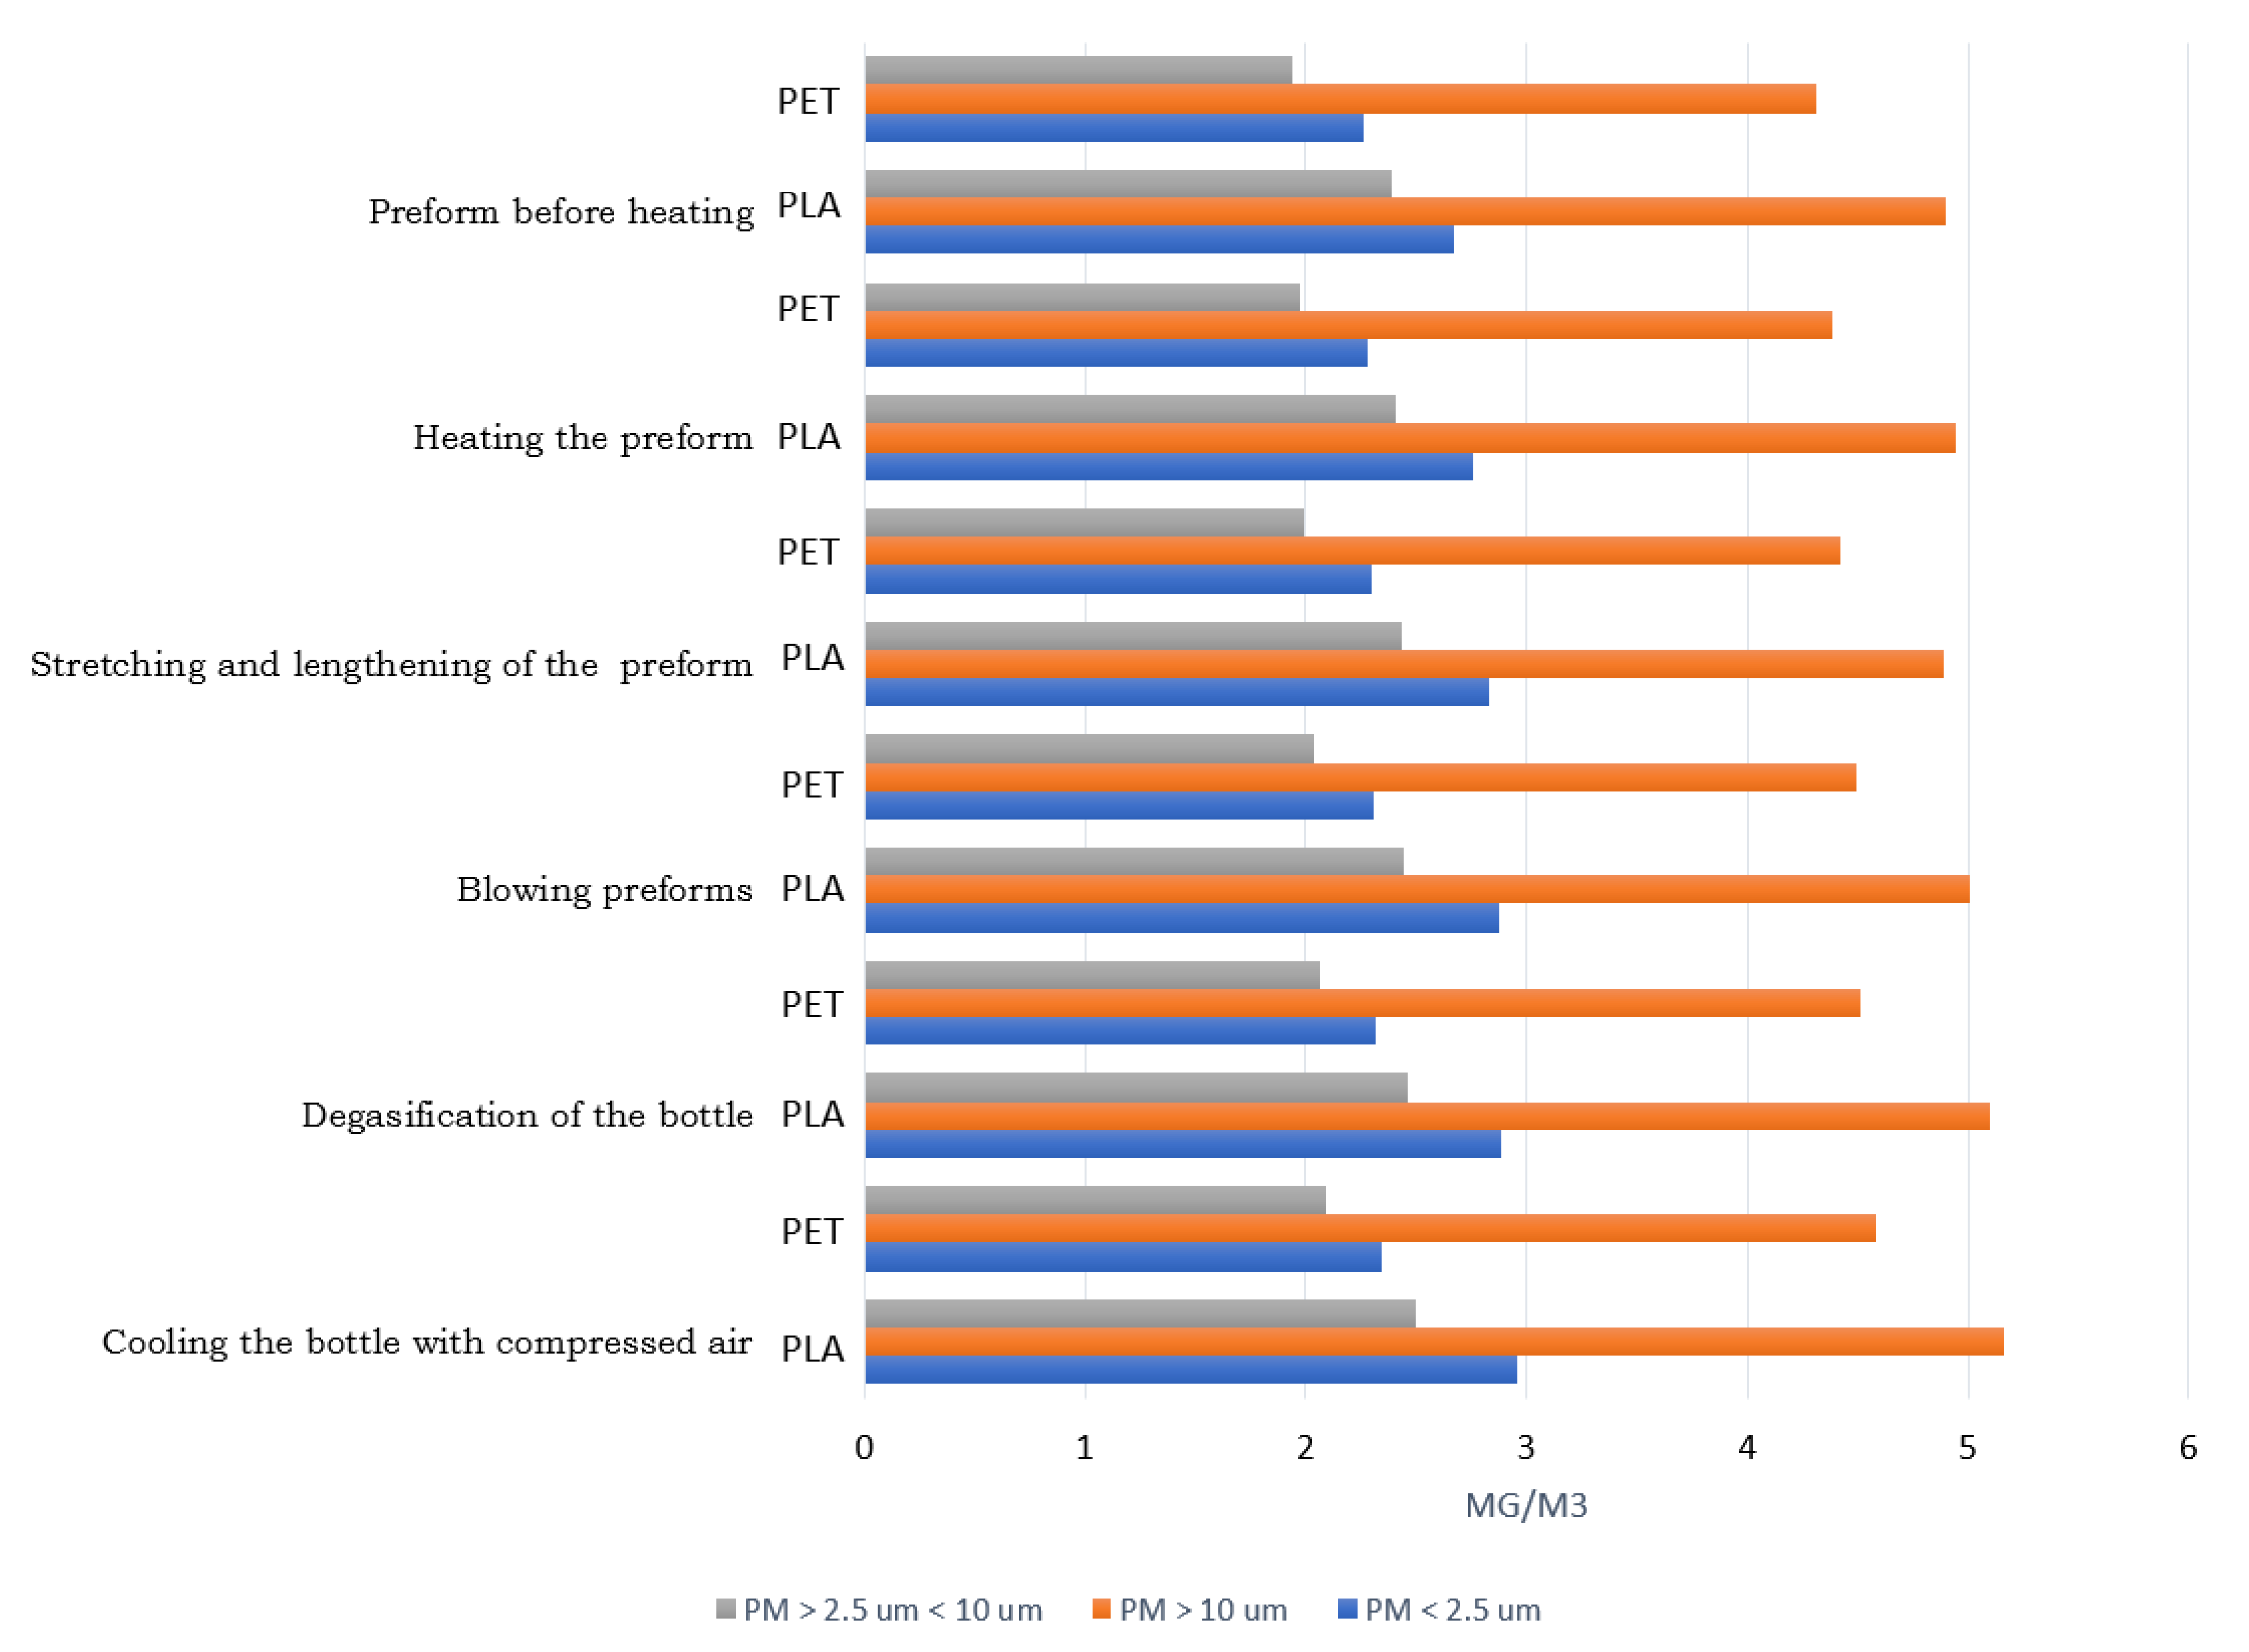
Fine Particulate Matter Formation
Characterization Factors at Midpoint Level
2.5. Interpretation
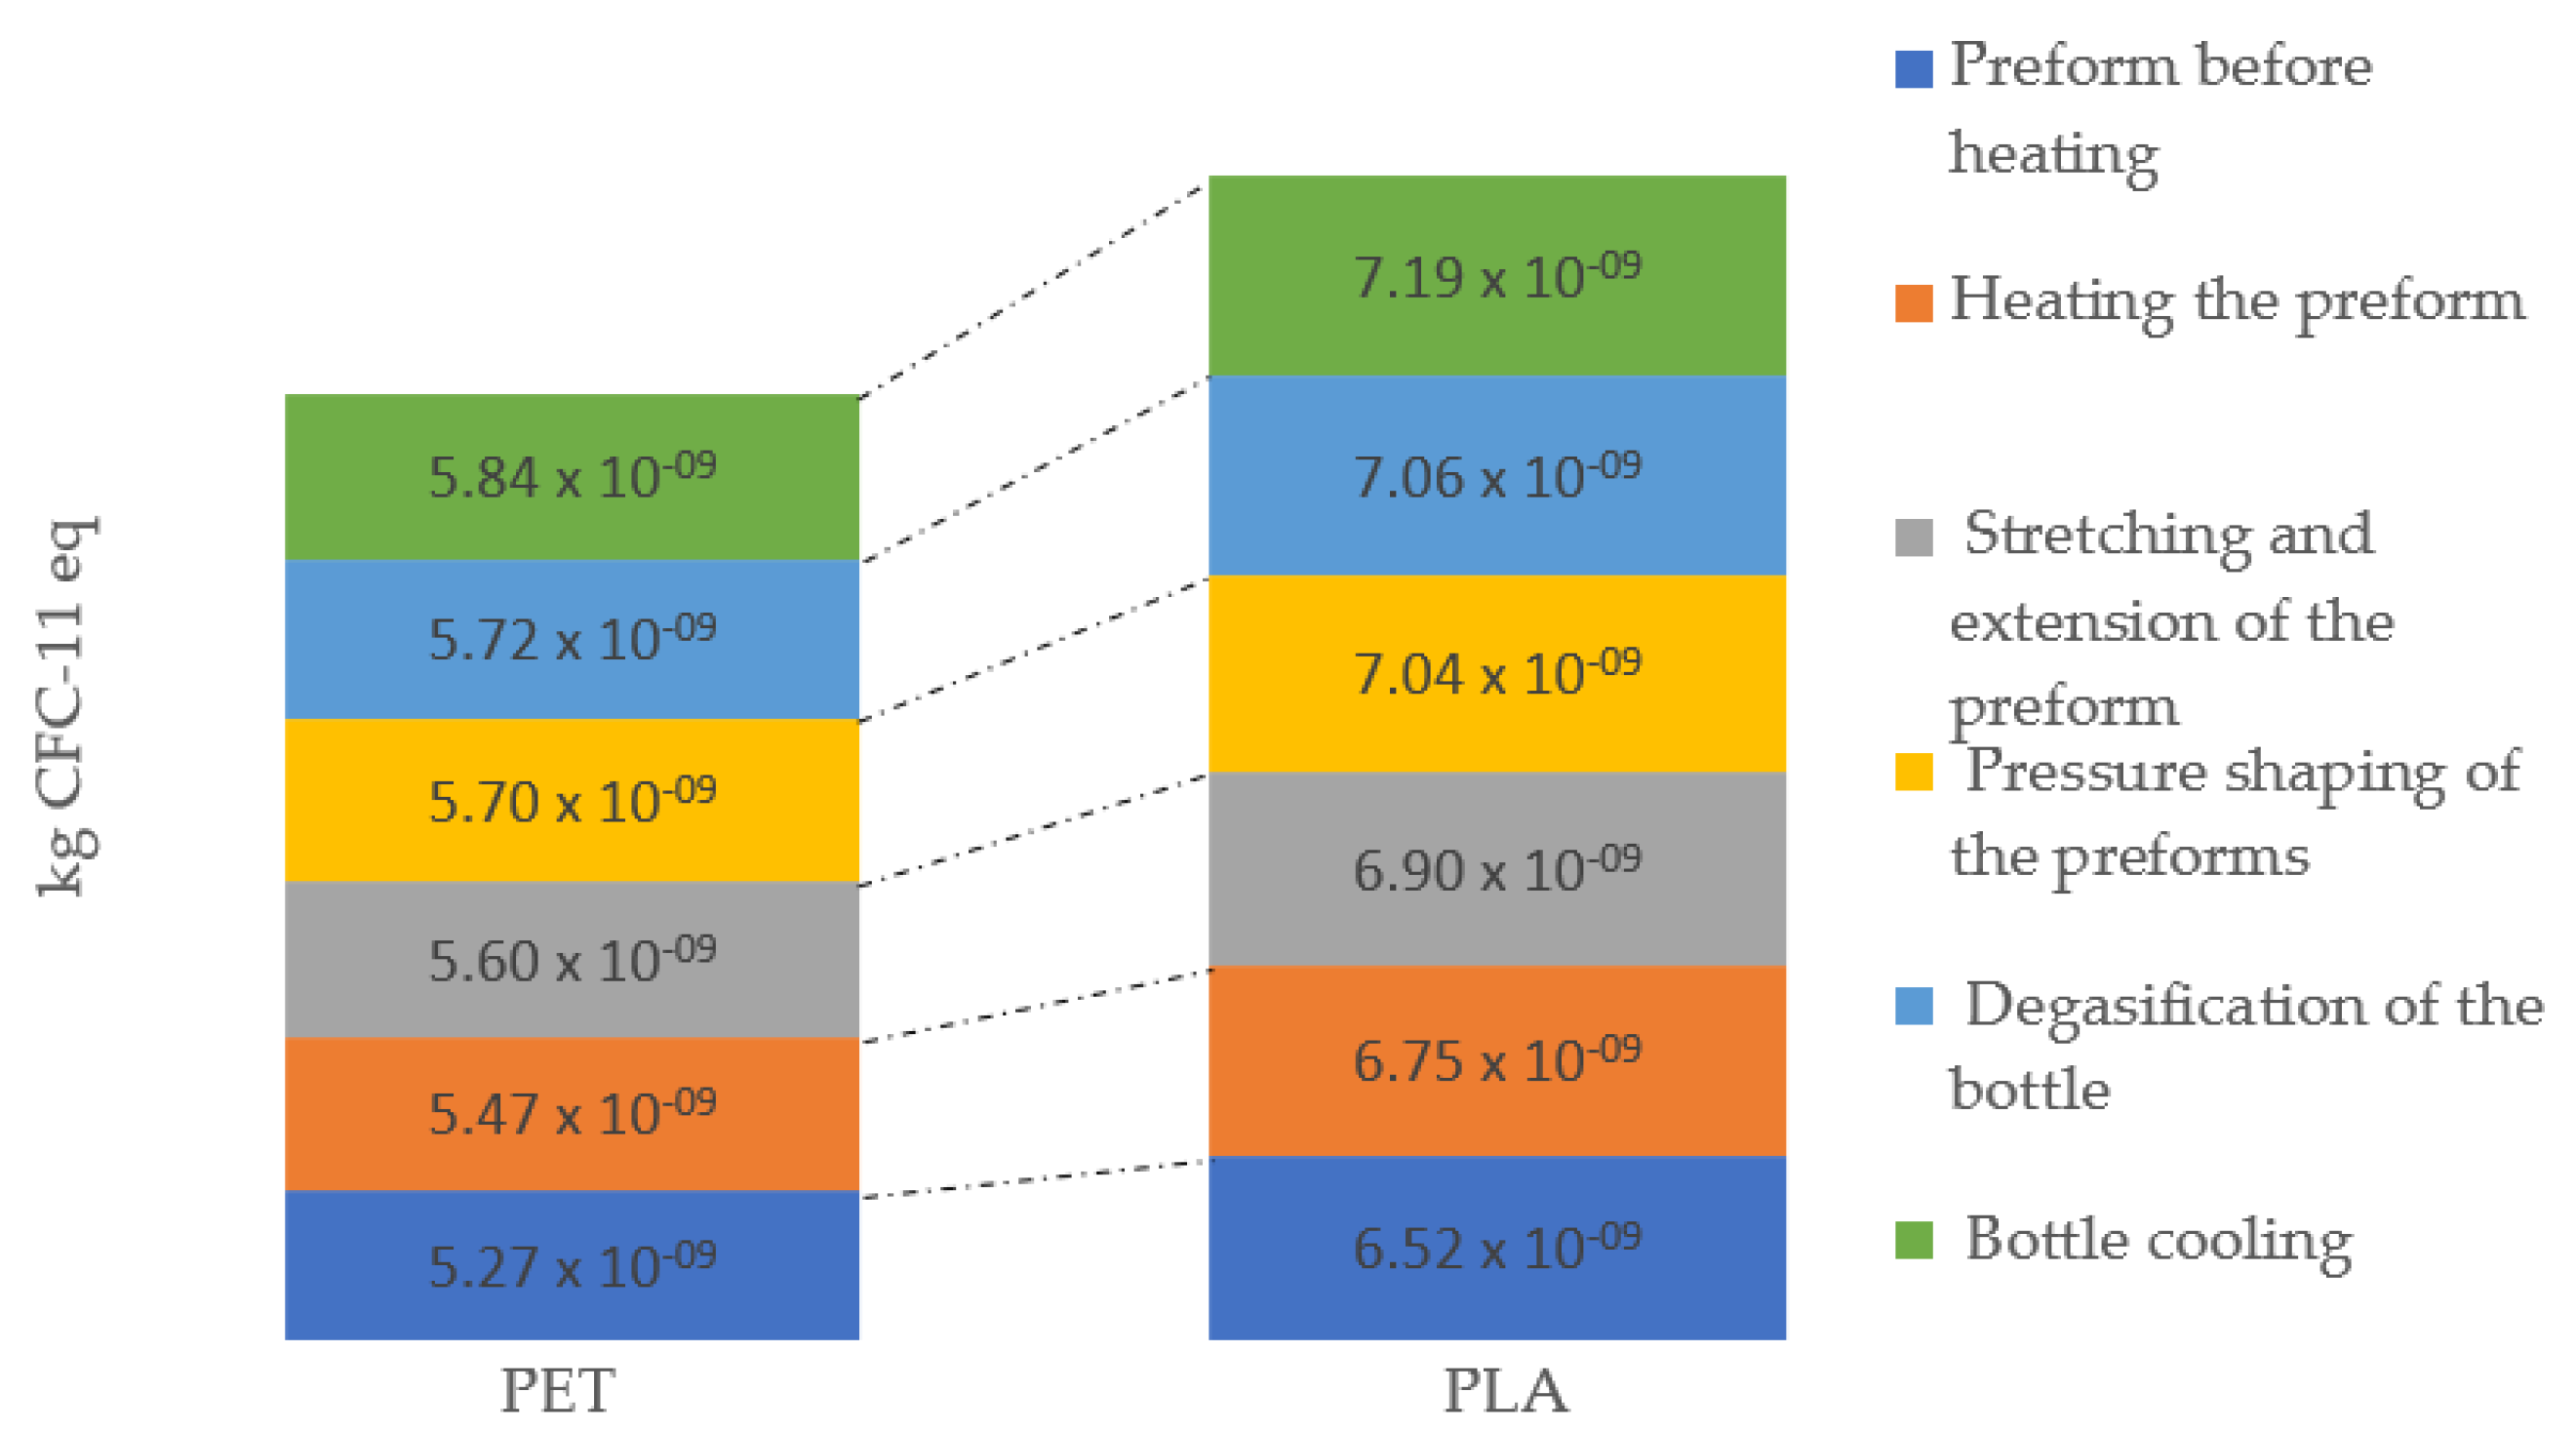
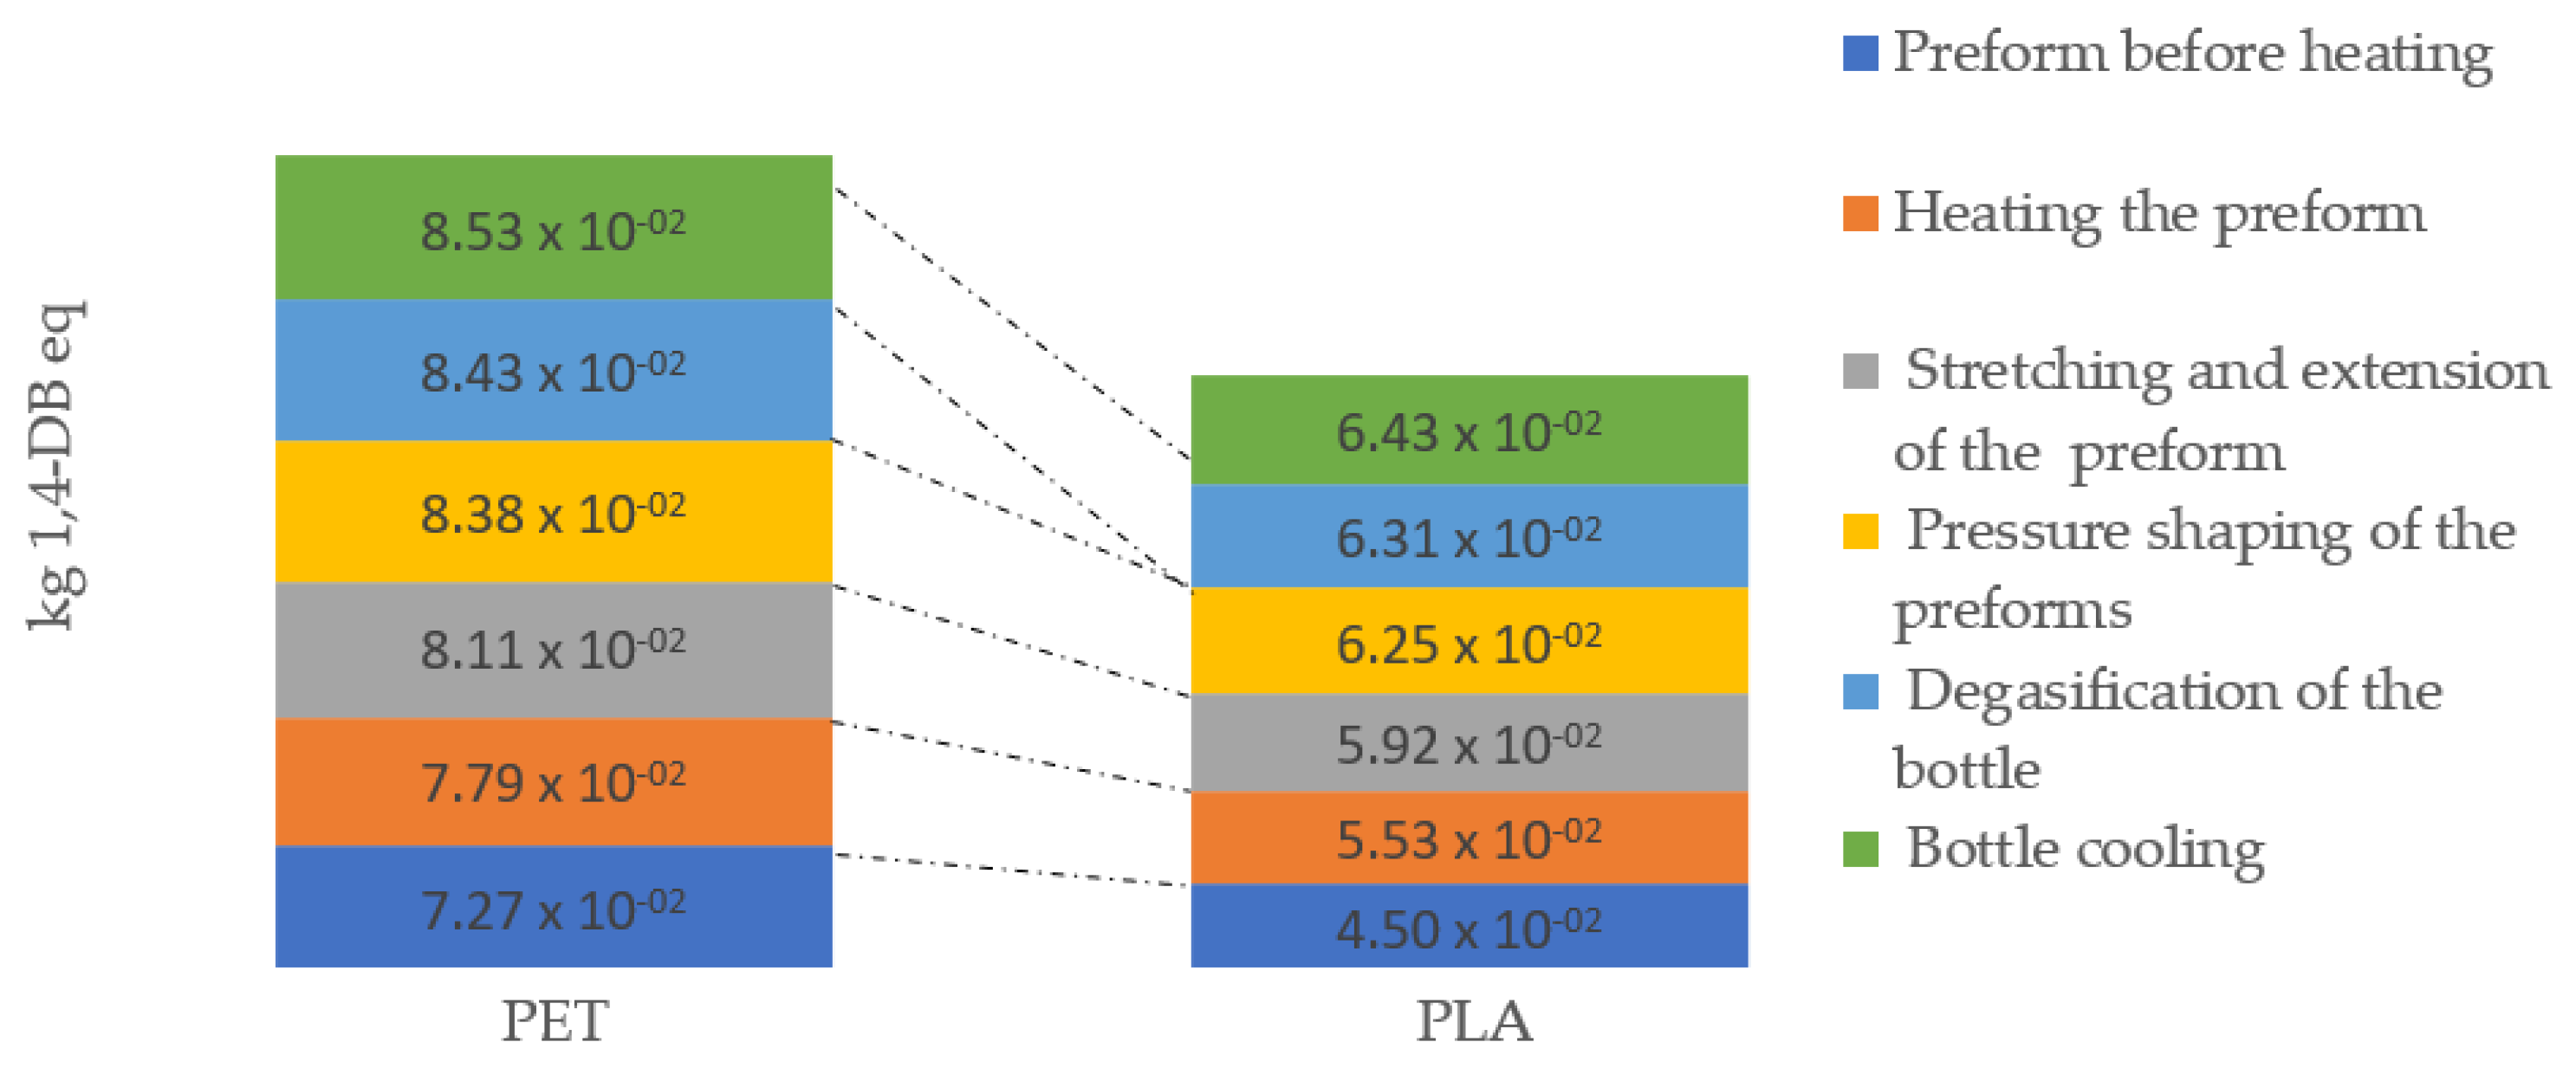
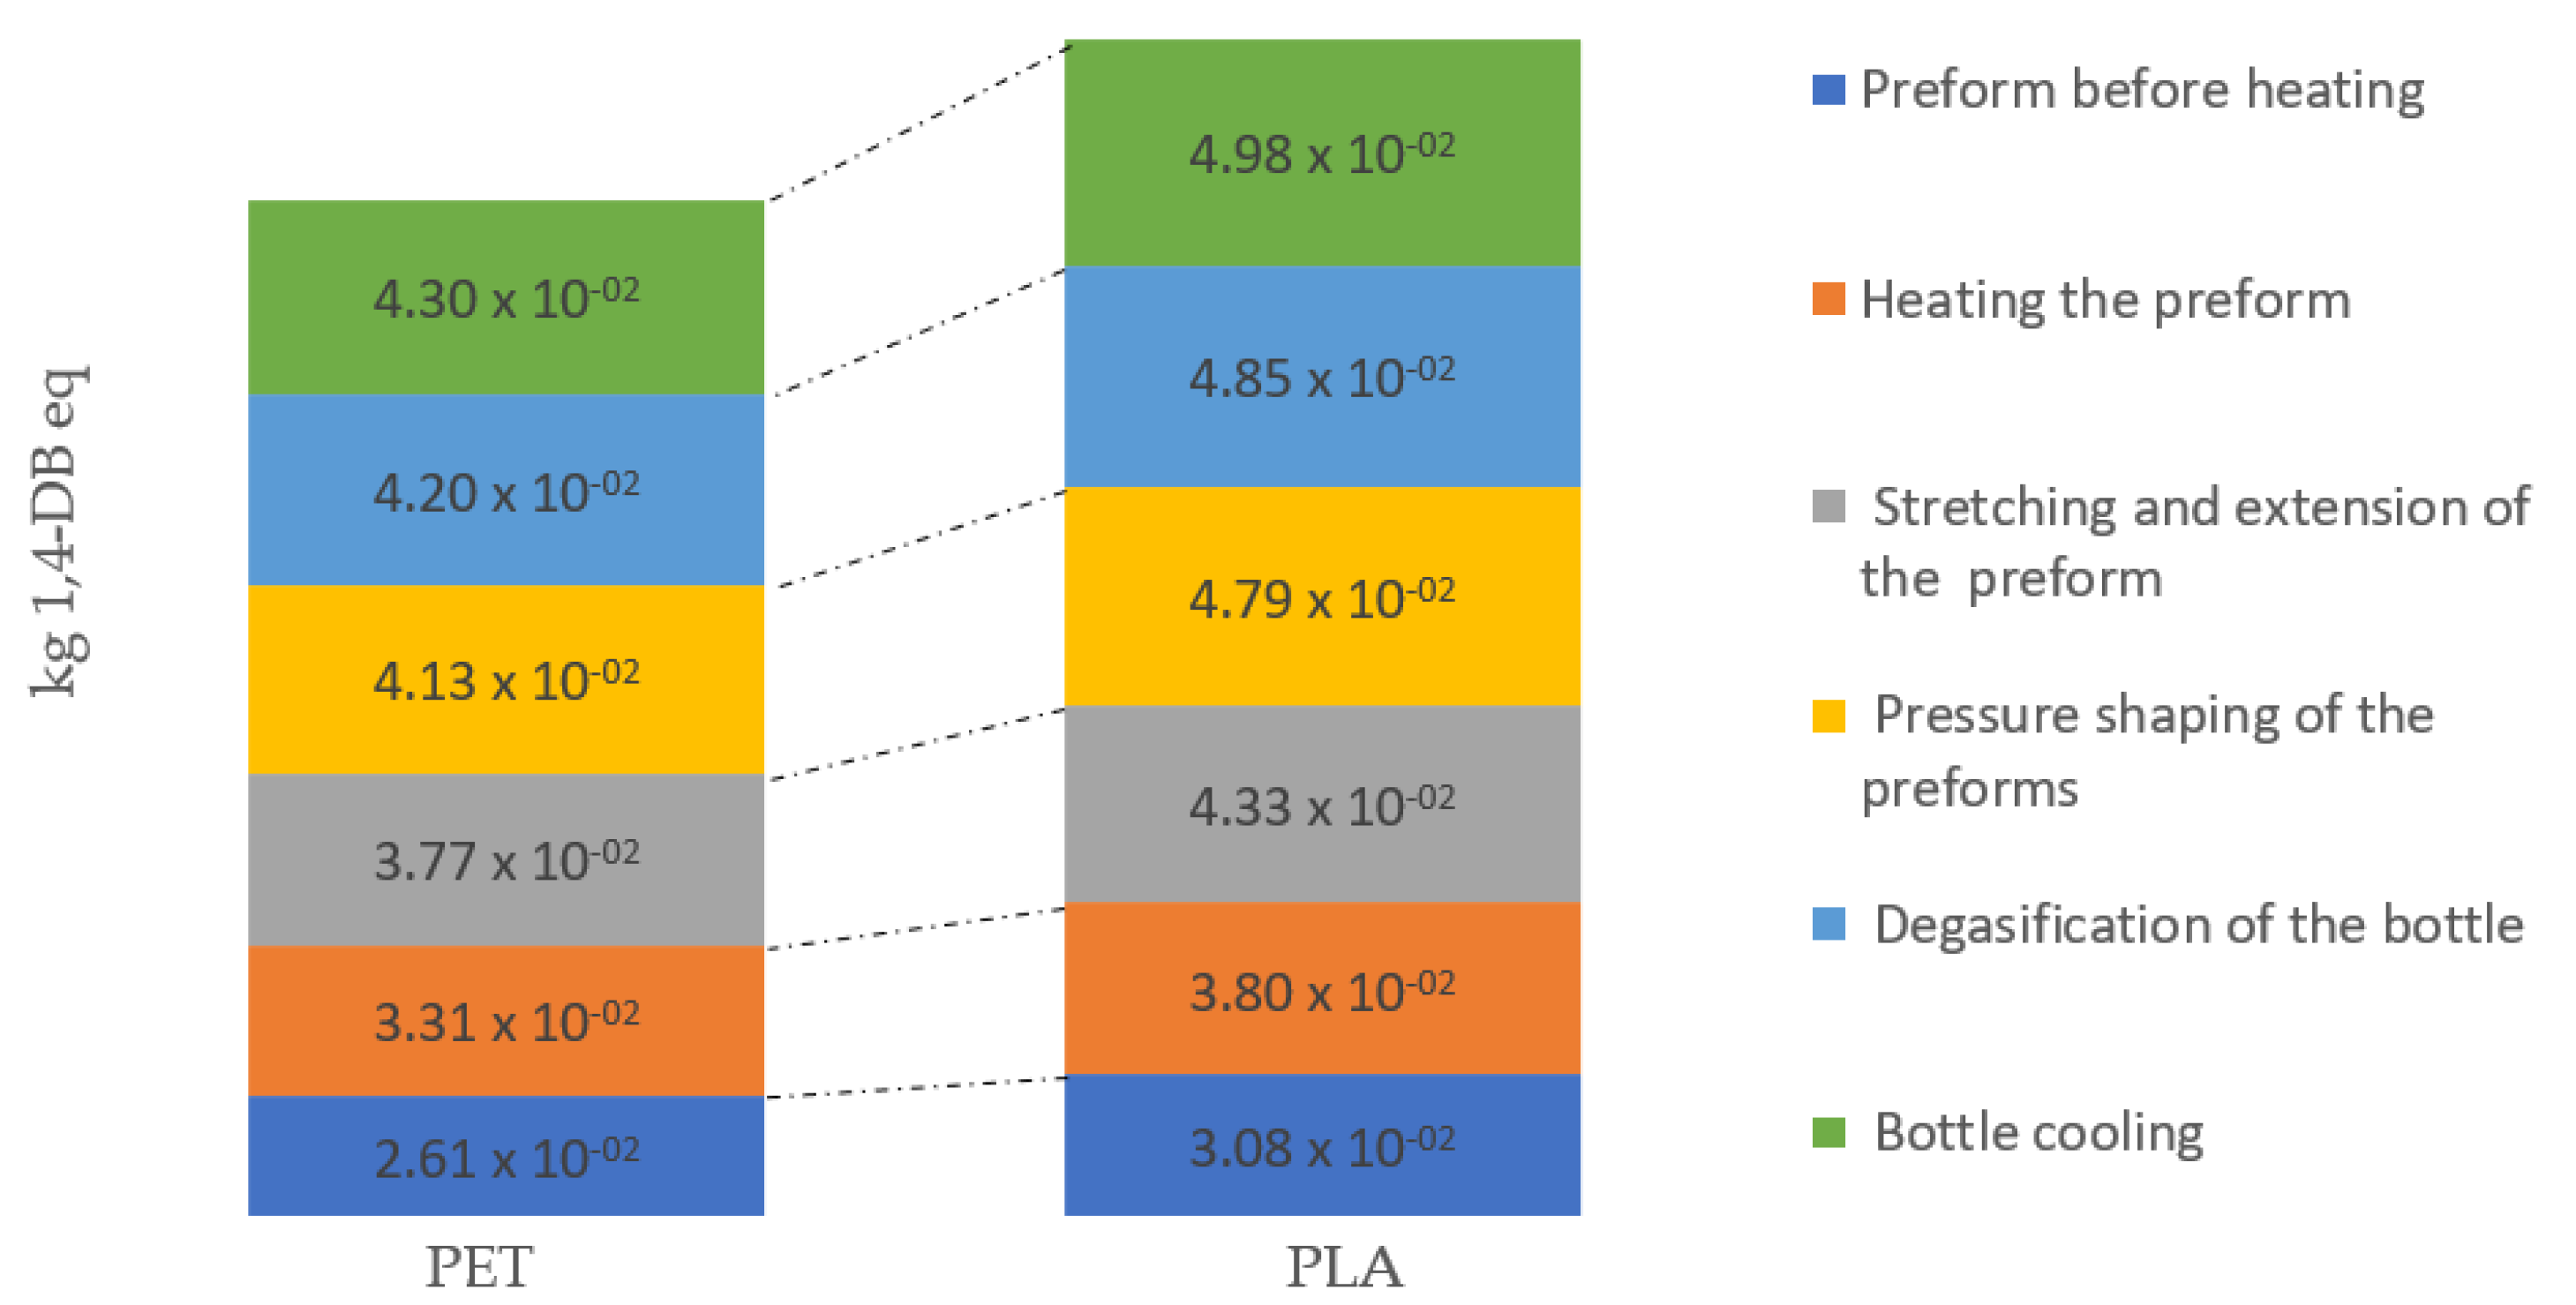
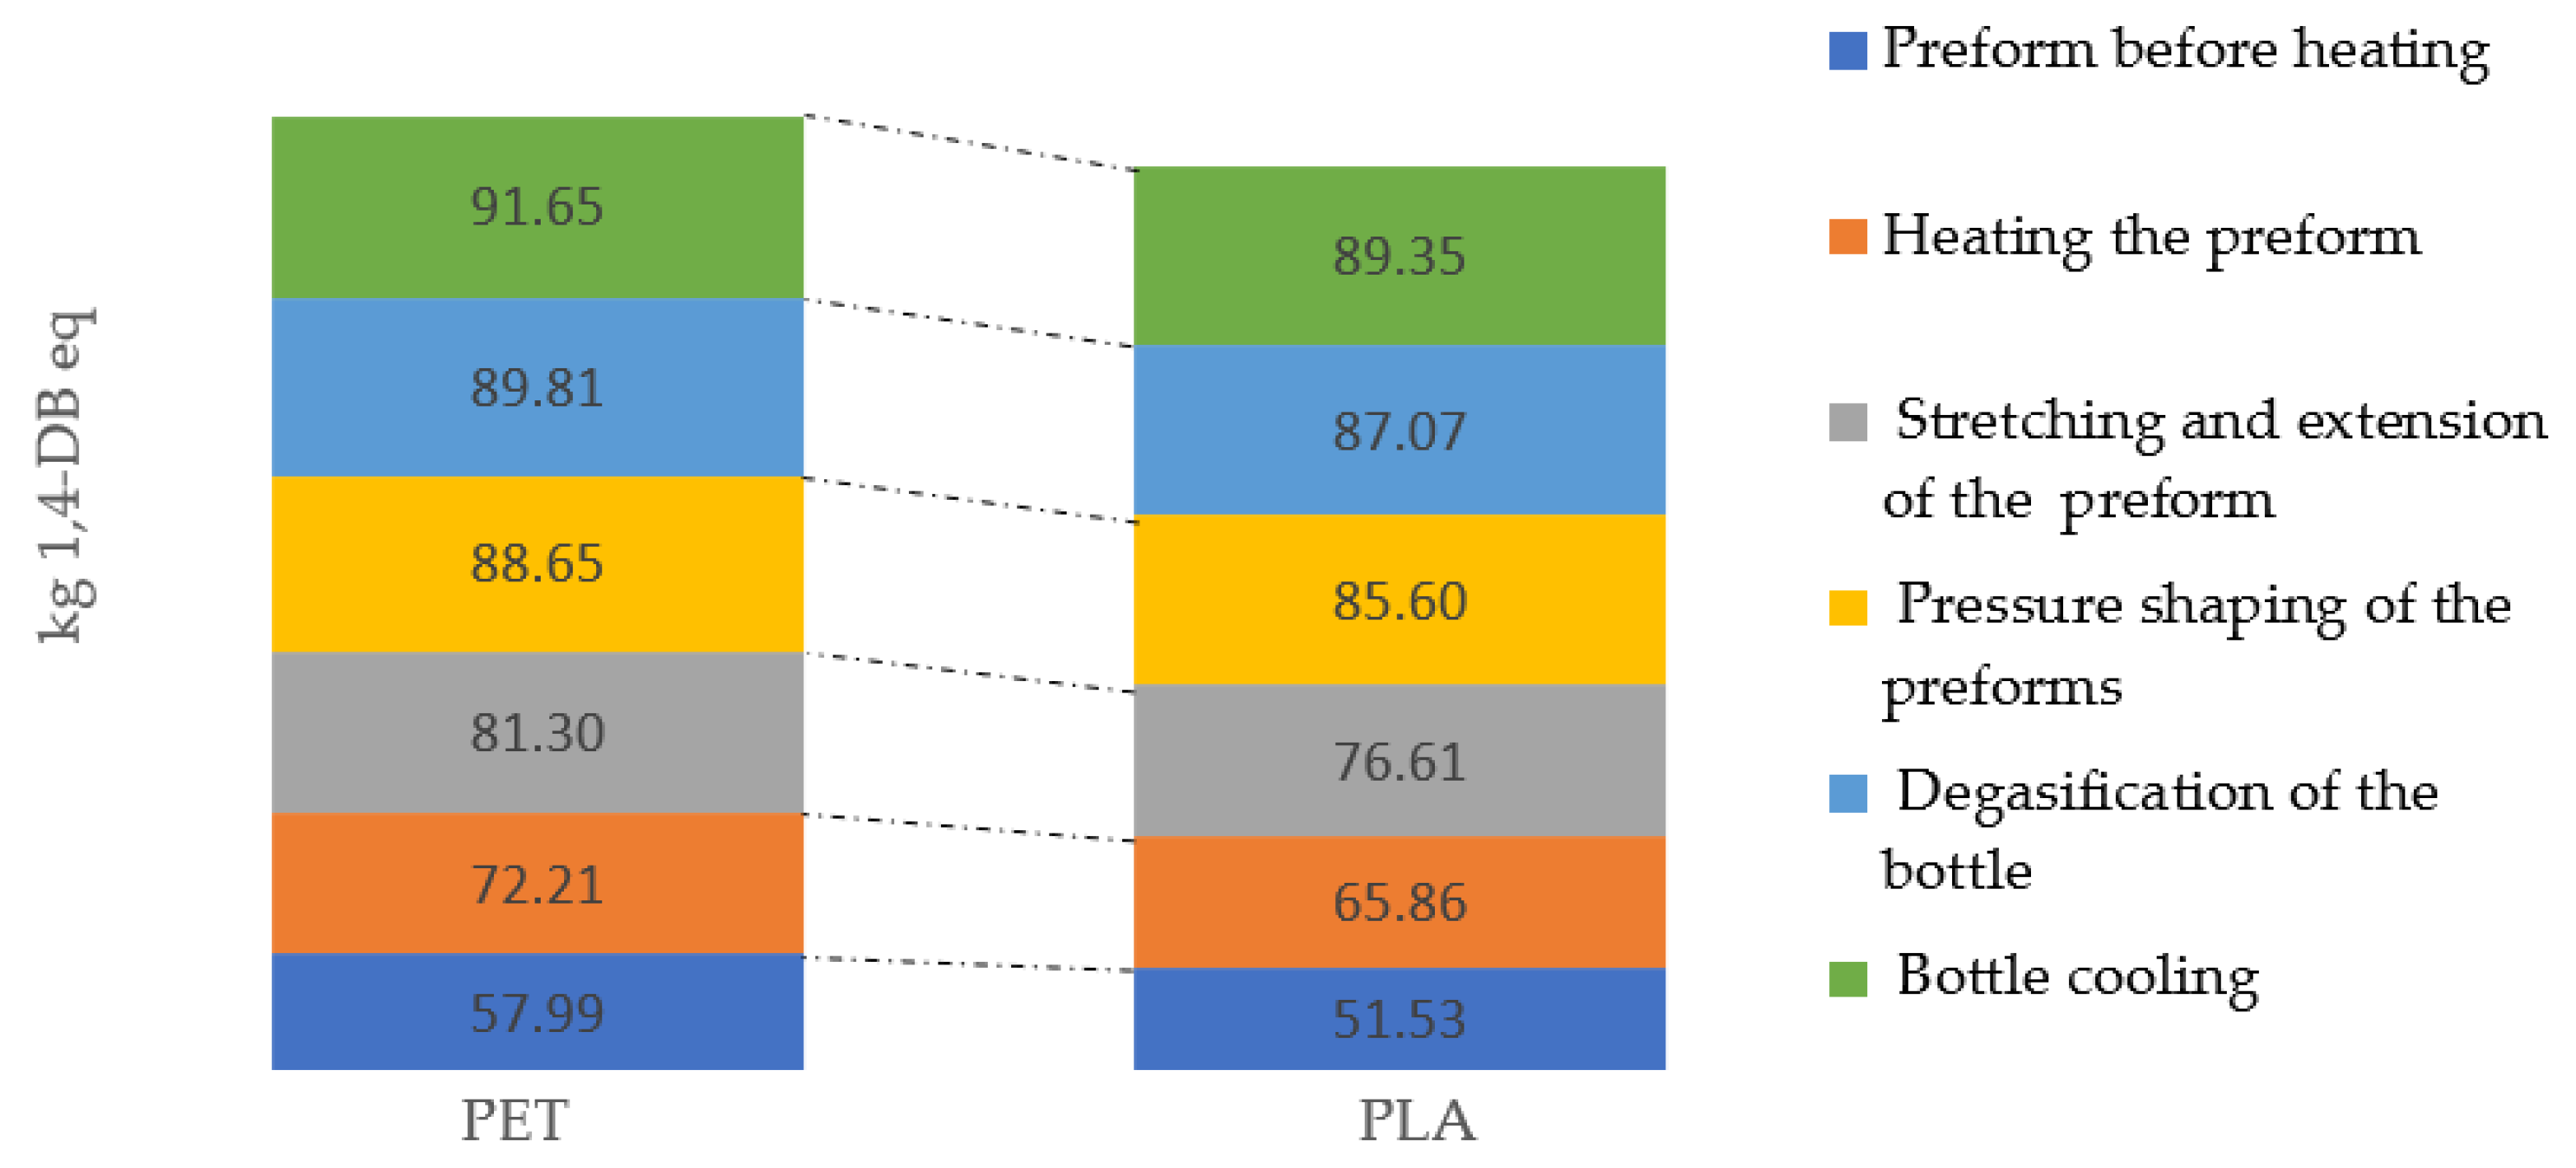
3. Results
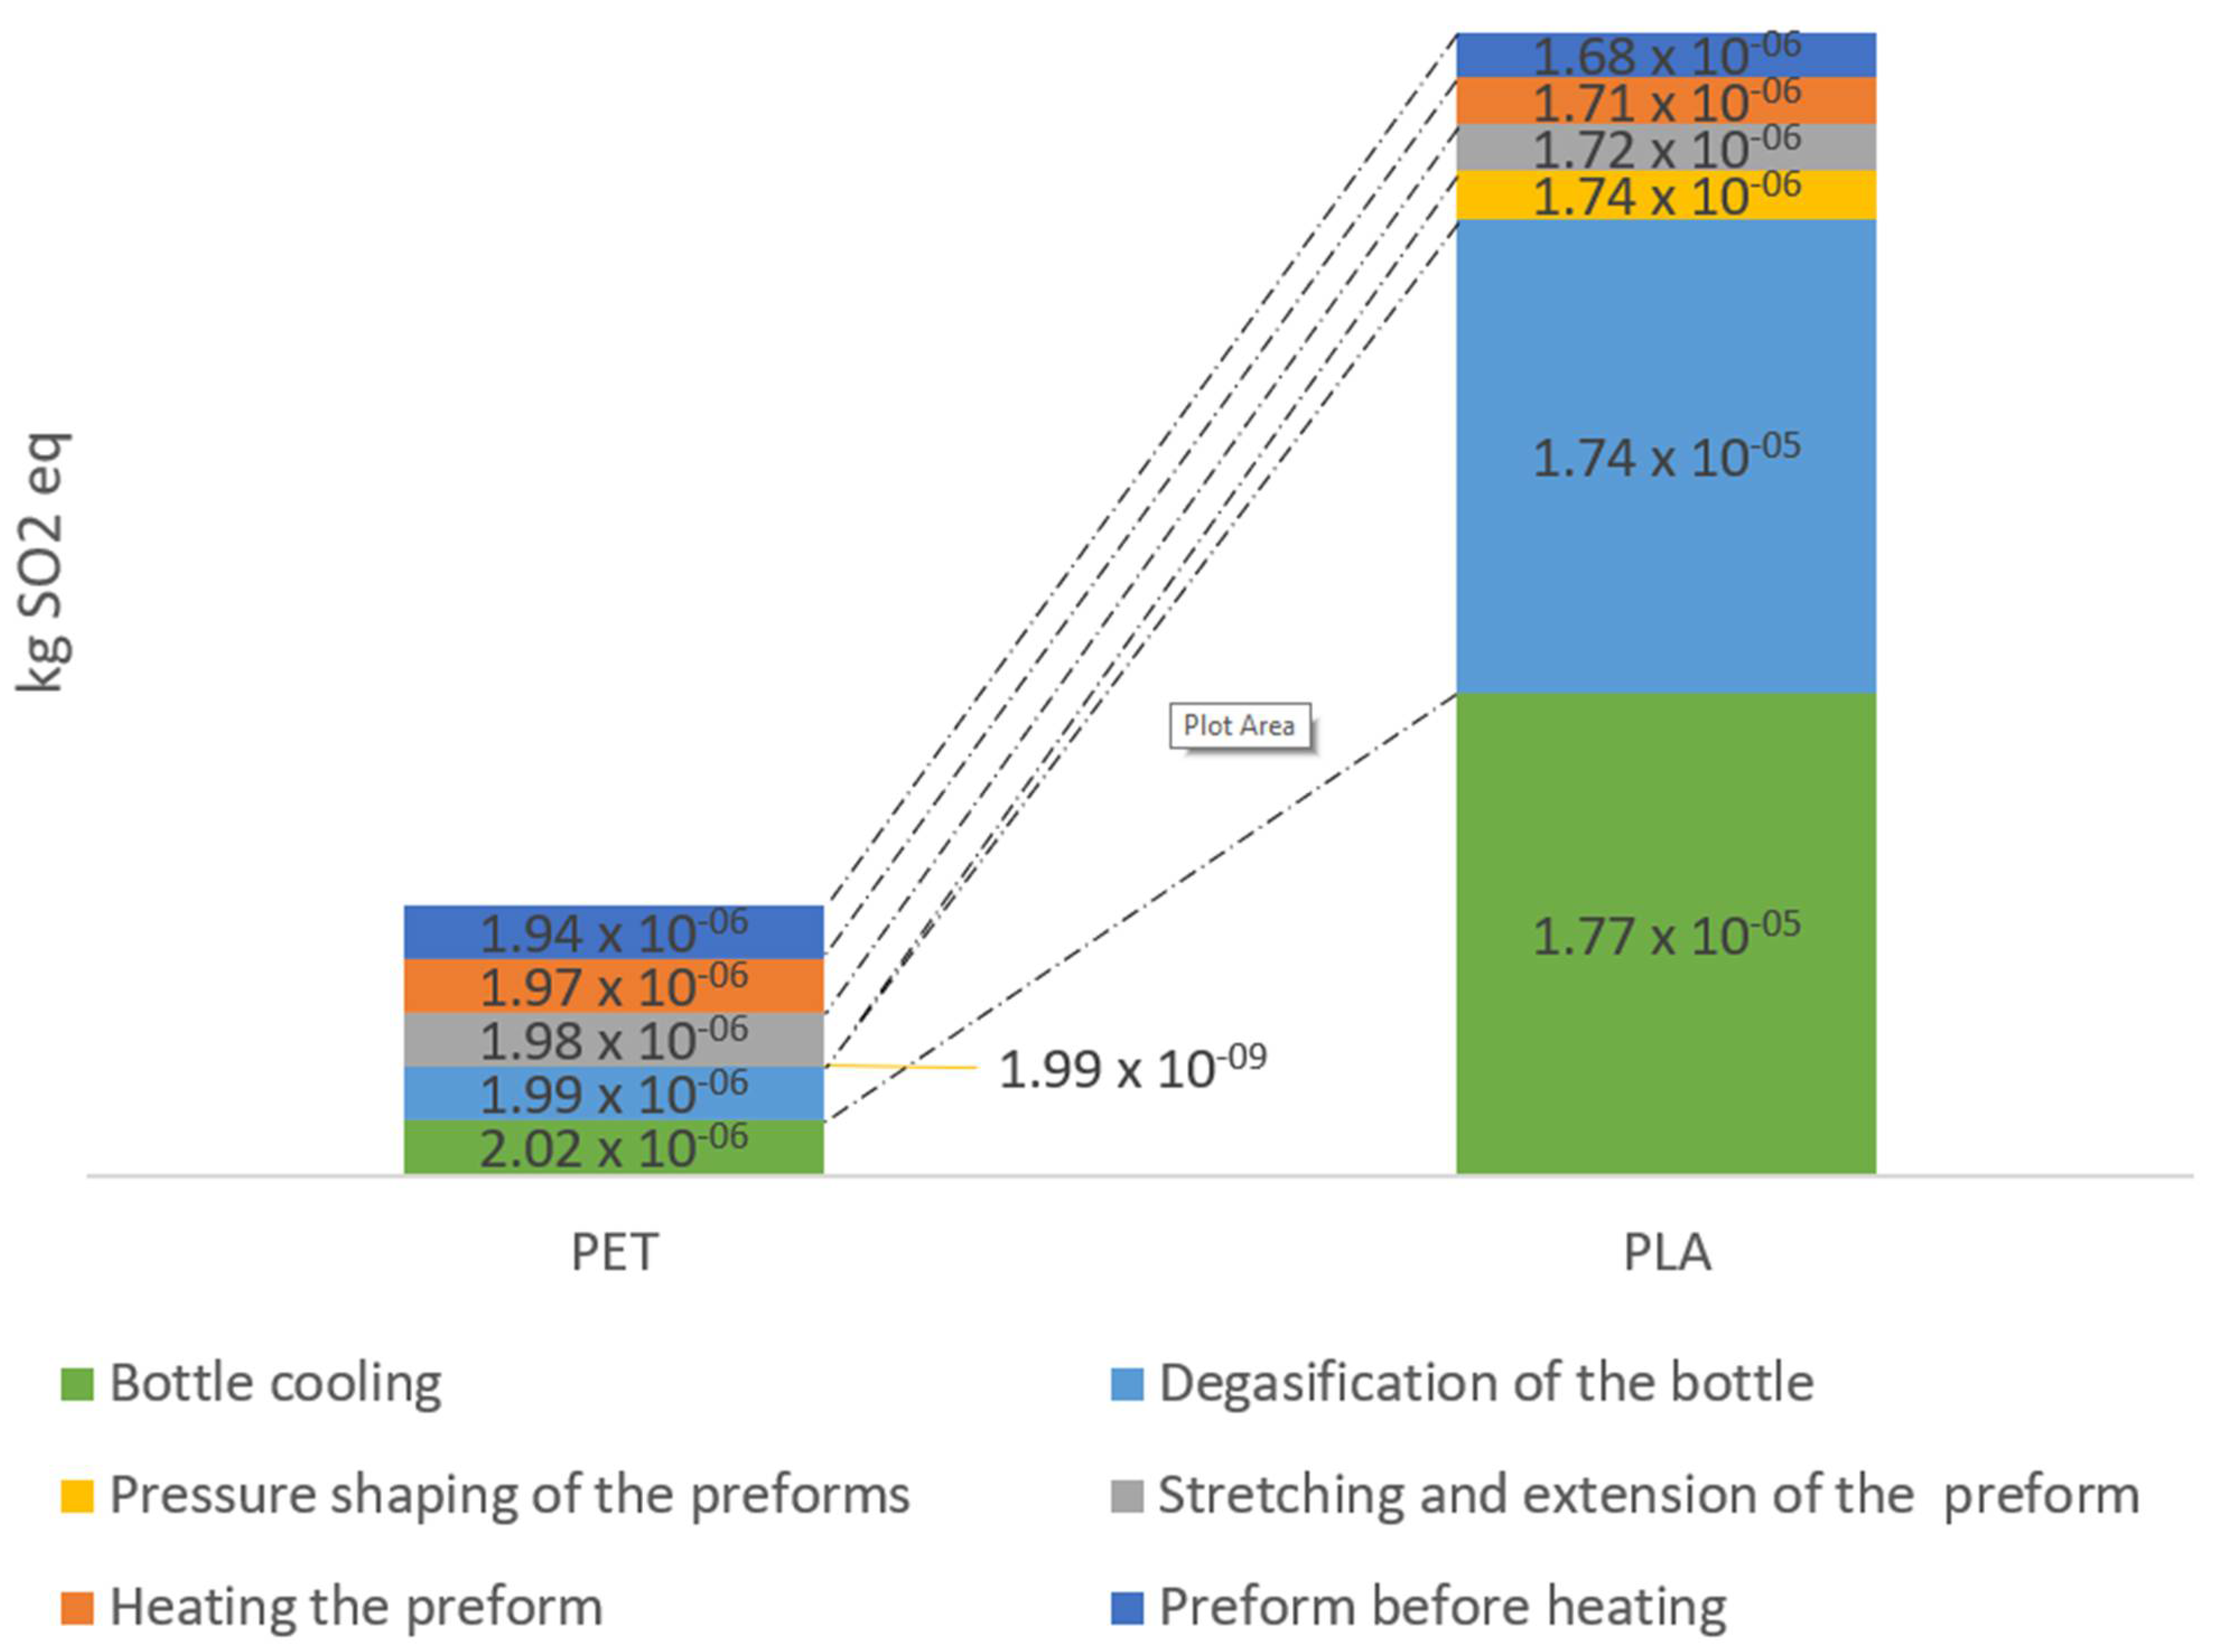
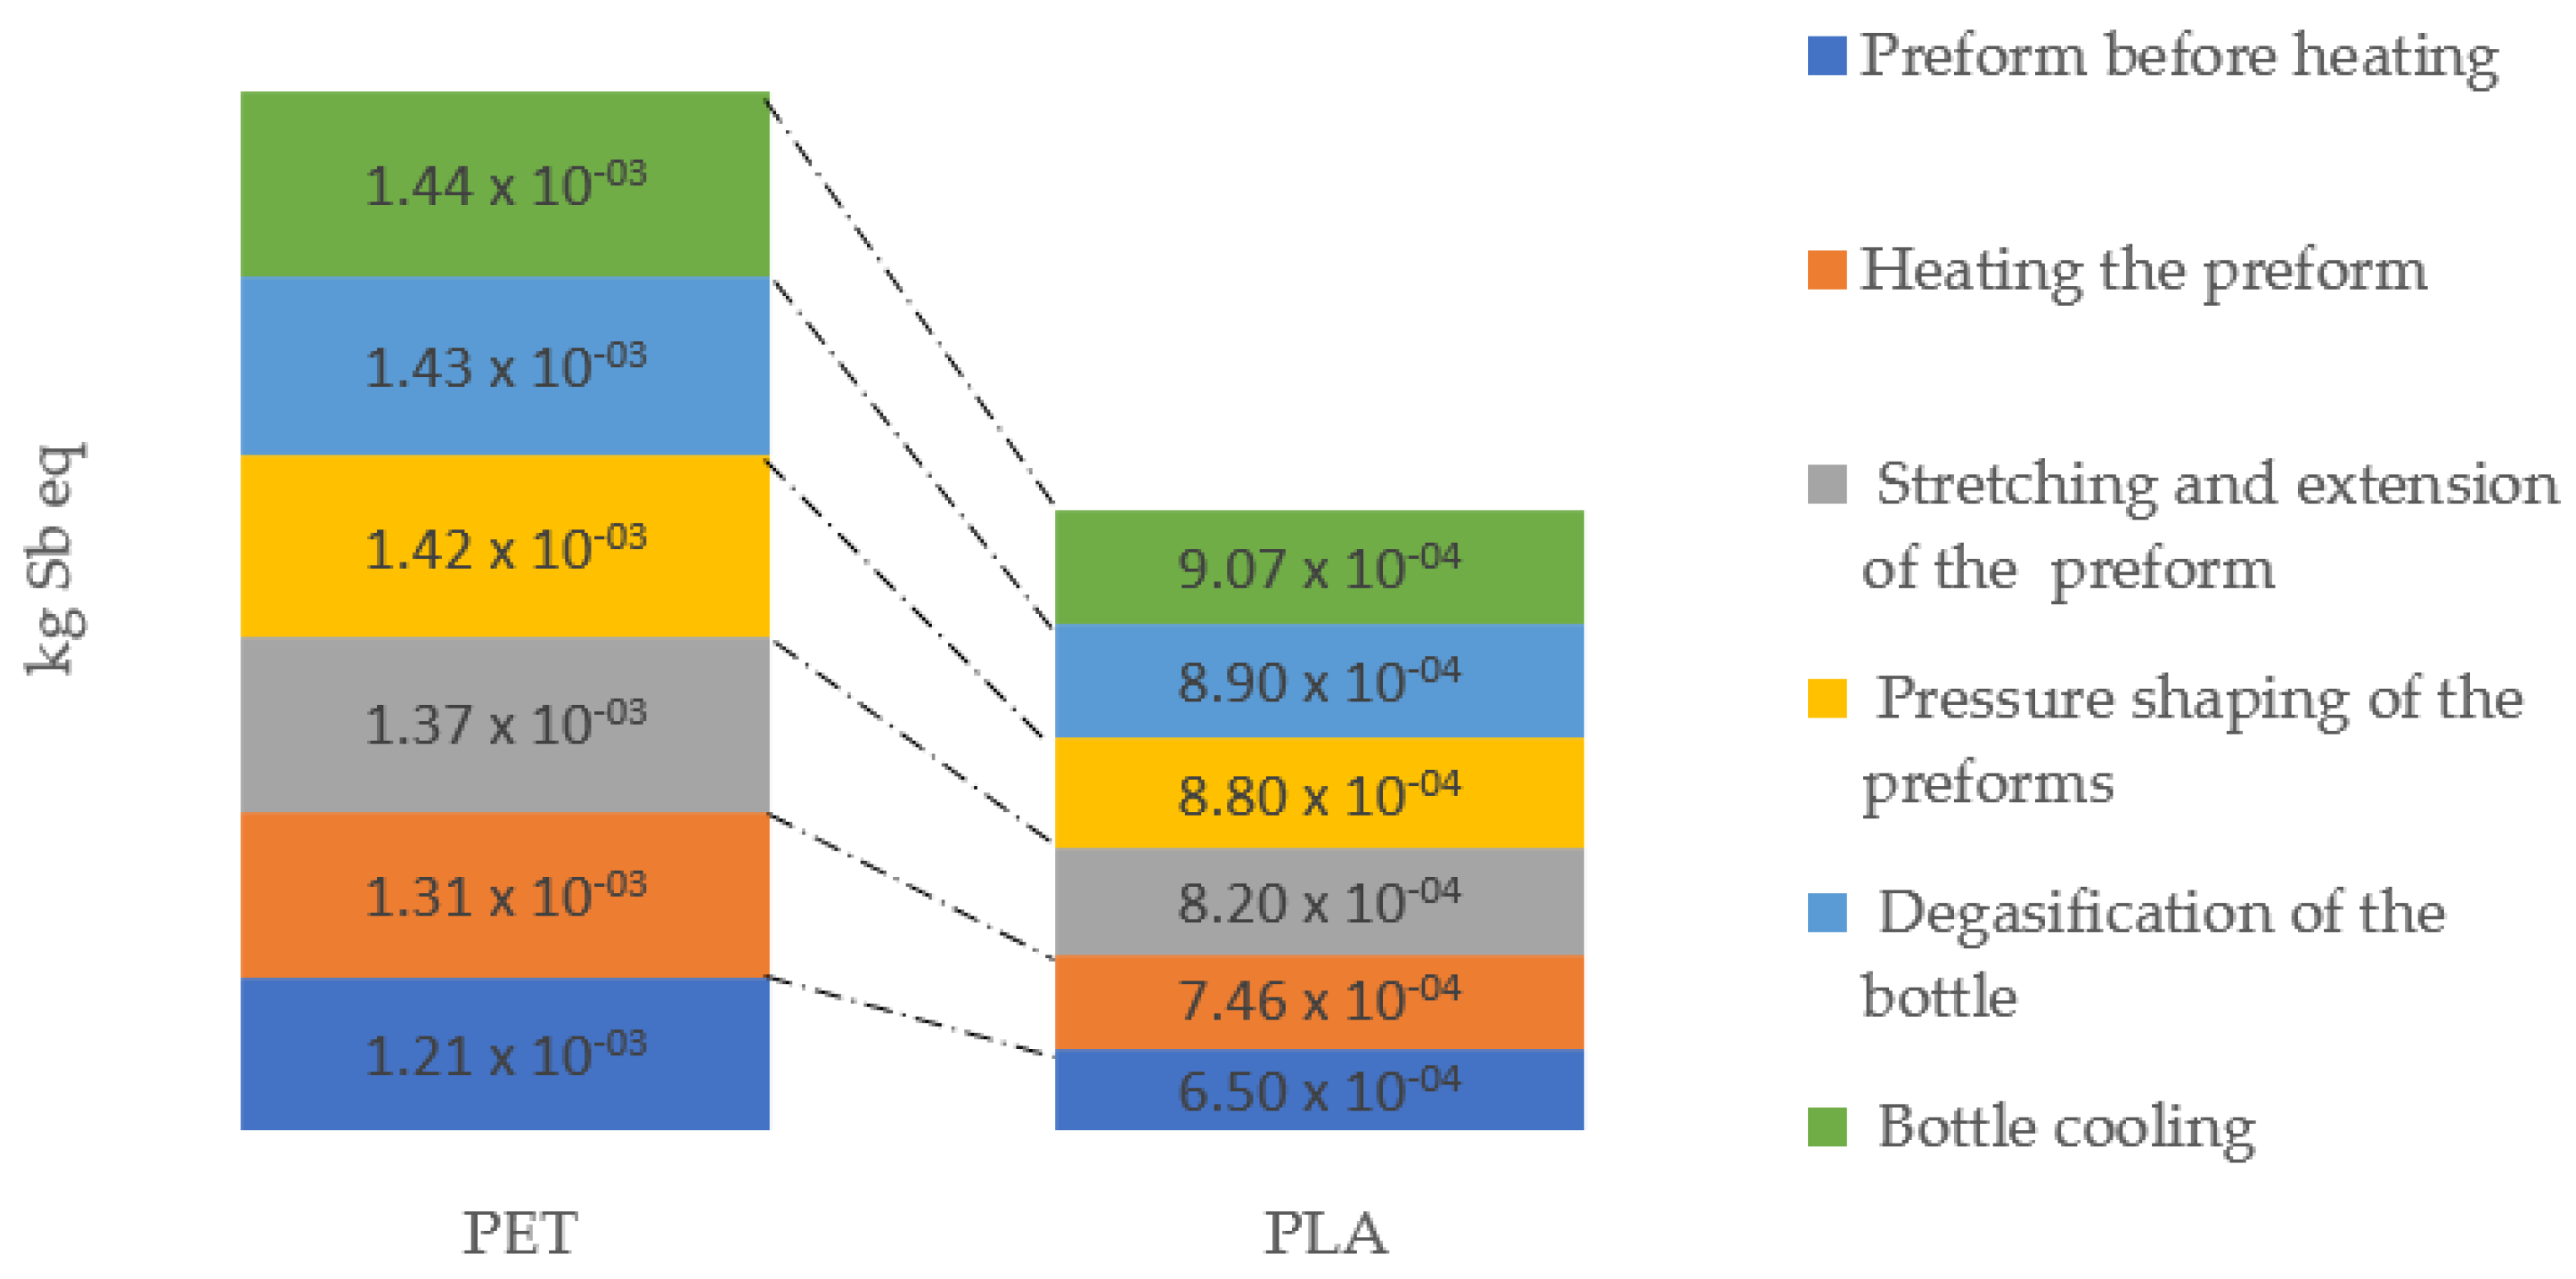
3.1. Characterization Analysis Results
4. Discussion
Author Contributions
Funding
Institutional Review Board Statement
Informed Consent Statement
Data Availability Statement
Conflicts of Interest
References
- Lloyd, S.M.; Ries, R. Characterizing, Propagating, and Analyzing Uncertainty in Life-Cycle Assessment: A Survey of Quantitative Approaches. J. Ind. Ecol. 2007, 11, 161–179. [Google Scholar] [CrossRef]
- Piasecka, I.; Baldowska-Witos, P.; Piotrowska, K.; Tomporowski, A. Eco-Energetical Life Cycle Assessment of Materials and Components of Photovoltaic Power Plant. Energies 2020, 13, 1385. [Google Scholar] [CrossRef] [Green Version]
- Maurice, B.; Frischknecht, R.; Coelho-Schwirtz, V.; Hungerbühler, K. Uncertainty analysis in life cycle inventory. Application to the production of electricity with French coal power plants. J. Clean. Prod. 2000, 8, 95–108. [Google Scholar] [CrossRef]
- Wang, E.; Shen, Z.; Neal, J.; Shi, J.; Berryman, C.; Schwer, A. An AHP-weighted aggregated data quality indicator (AWADQI) approach for estimating embodied energy of building materials. Int. J. Life Cycle Assess 2012, 17, 764–773. [Google Scholar] [CrossRef]
- Act of June 13, 2013 on the management of packaging and packaging waste. J. Laws 2013. item 888. Available online: http://isap.sejm.gov.pl/isap.nsf/DocDetails.xsp?id=WDU20130000888 (accessed on 15 June 2021).
- Frischknecht, R.; Jungbluth, N.; Althaus, H.-J.; Doka, G.; Dones, R.; Heck, T.; Hellweg, S.; Hischier, R.; Nemecek, T.; Rebitzer, G.; et al. The ecoinvent Database: Overview and Methodological Framework (7 pp). Int. J. Life Cycle Assess. 2005, 10, 3–9. [Google Scholar] [CrossRef]
- Weidema, B.P.; Wesnæs, M.S. Data quality management for life cycle inventories—an example of using data quality indicators. J. Clean. Prod. 1996, 4, 167–174. [Google Scholar] [CrossRef]
- Sonnemann, G.W.; Schuhmacher, M.; Castells, F. Uncertainty assessment by a Monte Carlo simulation in a life cycle inventory of electricity produced by a waste incinerator. J. Clean. Prod. 2003, 11, 279–292. [Google Scholar] [CrossRef]
- International Organization for Standarization ISO/TR 14047:2003-Environmental Management—Life Cycle Impact Assessment—Examples of Application of ISO 14042 2003; ISO: Geneva, Switzerland, 2003.
- International Organization for Standarization ISO/TS 14048:2002-Environmental Management—Life Cycle Assessment—Data Documentation Format 2002; ISO: Geneva, Switzerland, 2002.
- International Organization for Standardization ISO 14040:2006-Environmental Management—Life Cycle Assessment—Principles and Framework 2006; ISO: Geneva, Switzerland, 2006.
- International Organization for Standardization ISO-ISO 14044:2006-Environmental Management—Life Cycle Assessment—Requirements and Guidelines 2006; ISO: Geneva, Switzerland, 2006.
- Shen, L.; Worrell, E.; Patel, M.K. Open-loop recycling: A LCA case study of PET bottle-to-fibre recycling. Resour. Conserv. Recycl. 2010, 55, 34–52. [Google Scholar] [CrossRef]
- Bałdowska-Witos, P.; Kruszelnicka, W.; Kasner, R.; Rudnicki, J.; Tomporowski, A.; Flizikowski, J. Impact of the plastic bottle production on the natural environment. Part 1. Application of the ReCiPe 2016 assessment method to identify environmental problems. Przemysl. Chem. 2019, 98, 1662–1667. [Google Scholar]
- Walkerab, S.; Rothmana, R. Life cycle assessment of bio-based and fossil-based plastic: A review. J. Cleaner Prod. 2020, 261, 121–158. [Google Scholar] [CrossRef]
- Horowitz, N.; Frago, J.; Dongyan, M. Life cycle assessment of bottled water: A case study of Green2O products. Waste Manag. 2018, 76, 734–743. [Google Scholar] [CrossRef] [PubMed]
- Chen, L.; Pelton, R.E.O.; Smith, T.M. Comparative life cycle assessment of fossil and bio-based polyethylene terephthalate (PET) bottles. J. Clean. Prod. 2016, 137, 667–676. [Google Scholar] [CrossRef] [Green Version]
- Kowalski, Z.; Kulczycka, J. Ocena cyklu życia LCA jako podstawowy czynnik oceny czystszych produkcji. Odzysk odpadów–technologie i możliwości. In Proceedings of the Materiały Konfrerencji Waste Recycling; Wydawnictwo IGSMiE PAN: Kraków, Poland, 2005; pp. 23–33. [Google Scholar]
- Benetto, E.; Dujet, C.; Rousseaux, P. Integrating fuzzy multicriteria analysis and uncertainty evaluation in life cycle assessment. Environ. Model. Softw. 2008, 23, 1461–1467. [Google Scholar] [CrossRef]
- Egilmez, G.; Gumus, S.; Kucukvar, M.; Tatari, O. A fuzzy data envelopment analysis framework for dealing with uncertainty impacts of input–output life cycle assessment models on eco-efficiency assessment. J. Clean. Prod. 2016, 129, 622–636. [Google Scholar] [CrossRef] [Green Version]
- Lasvaux, S.; Schiopu, N.; Habert, G.; Chevalier, J.; Peuportier, B. Influence of simplification of life cycle inventories on the accuracy of impact assessment: Application to construction products. J. Clean. Prod. 2014, 79, 142–151. [Google Scholar] [CrossRef]
- Chou, J.-S.; Yeh, K.-C. Life cycle carbon dioxide emissions simulation and environmental cost analysis for building construction. J. Clean. Prod. 2015, 101, 137–147. [Google Scholar] [CrossRef]
- Geisler, G.; Hellweg, S.; Hungerbühler, K. Uncertainty Analysis in Life Cycle Assessment (LCA): Case Study on Plant-Protection Products and Implications for Decision Making (9 pp + 3 pp). Int. J. Life Cycle Assess 2005, 10, 184–192. [Google Scholar] [CrossRef]
- Chevalier, J.-L.; Téno, J.-F.L. Life cycle analysis with ill-defined data and its application to building products. Int. J. Life Cycle Assess. 1996, 1, 90–96. [Google Scholar] [CrossRef]
- Gaňa, D.; Liptáková, T.; Markovičová, L. Comparison of the properties of the original and applied LDPE foils in returned bottles. Prod. Eng. Arch. 2019, 25, 39–42. [Google Scholar]
- Bałdowska-Witos, P.; Kruszelnicka, W.; Kasner, R.; Tomporowski, A.; Flizikowski, J.; Kłos, Z.; Piotrowska, K.; Markowska, K. Application of LCA Method for Assessment of Environmental Impacts of a Polylactide (PLA) Bottle Shaping. Polymers 2020, 12, 388. [Google Scholar] [CrossRef] [PubMed] [Green Version]
- Mielczarek, K.; Krynke, M. Plastic production machinery–the evaluation of effectiveness. Prod. Eng. Arch. 2018, 18, 42–45. [Google Scholar] [CrossRef] [Green Version]
- Reap, J.; Roman, F.; Duncan, S.; Bras, B. A survey of unresolved problems in life cycle assessment. Int. J. Life Cycle Assess. 2008, 13, 290. [Google Scholar] [CrossRef]
- Miller, S.A.; Moysey, S.; Sharp, B.; Alfaro, J. A Stochastic Approach to Model Dynamic Systems in Life Cycle Assessment. J. Ind. Ecol. 2013, 17, 352–362. [Google Scholar] [CrossRef]
- Thiel, C.L.; Campion, N.; Landis, A.E.; Jones, A.K.; Schaefer, L.A.; Bilec, M.M. A Materials Life Cycle Assessment of a Net-Zero Energy Building. Energies 2013, 6, 1125–1141. [Google Scholar] [CrossRef] [Green Version]
- Peters, G.P. Efficient algorithms for Life Cycle Assessment, Input-Output Analysis, and Monte-Carlo Analysis. Int. J. Life Cycle Assess. 2006, 12, 373. [Google Scholar] [CrossRef]
- Heijungs, R.; Tan, R.R. Rigorous proof of fuzzy error propagation with matrix-based LCI. Int. J. Life Cycle Assess 2010, 15, 1014–1019. [Google Scholar] [CrossRef] [Green Version]
- Imbeault-Tétreault, H.; Jolliet, O.; Deschênes, L.; Rosenbaum, R.K. Analytical Propagation of Uncertainty in Life Cycle Assessment Using Matrix Formulation. J. Ind. Ecol. 2013, 17, 485–492. [Google Scholar] [CrossRef]
- Ciroth, A.; Fleischer, G.; Steinbach, J. Uncertainty calculation in life cycle assessments. Int. J. Life Cycle Assess. 2004, 9, 216. [Google Scholar] [CrossRef]
- Piotrowska, K.; Kruszelnicka, W.; Bałdowska-Witos, P.; Kasner, R.; Rudnicki, J.; Tomporowski, A.; Flizikowski, J.; Opielak, M. Assessment of the Environmental Impact of a Car Tire throughout Its Lifecycle Using the LCA Method. Materials 2019, 12, 4177. [Google Scholar] [CrossRef] [Green Version]
- Bałdowska-Witos, P.; Kruszelnicka, W.; Kasner, R.; Tomporowski, A.; Flizikowski, J.; Mrozinski, A. Impact of the plastic bottle production on the natural environment. Part 2. Analysis of data uncertainty in the assessment of the life cycle of plastic beverage bottles using the Monte Carlo technique. Przem. Chem. 2019, 98, 1668–1672. [Google Scholar]
- Report European Commission: European Strategy for Plastics in a Circular Economy. 2018. Available online: https://ec.europa.eu/info/research-and-innovation/research-area/environment/circular-economy/plastics-circular-economy_en (accessed on 15 June 2021).
- Edelen, A.; Ingwersen, W. Guidance on Data Quality Assessment for Life Cycle Inventory Data; United States Environmental Protection Agency: Washington, DC, USA, 2016. [Google Scholar]
- Abdeev, B.M.; Azamatkyzy, S.A.; Cyganiuk, J.; Doudkin, M.V.; Idzikowski, A.; Przystupa, F.W.; Pustałka, A.; Sakimov, M.A.; Spangemacher, L. Modeling of Machinery Processes; Publisher Czestochowa University of Technology Faculty of Management: Czestochowa, Poland, 2017; Volume 1, pp. 79–81. [Google Scholar]
- Cyganiuk, J.; Doudkin, M.V.; Frohilich, S.R.; Idzikowski, A.; Kim, A.I.; Kruszelnicka, W.; Sokolski, P.; Schuning, T.; Tomporowski, A.; Vaviolov, A.V. Modeling of Machinery Processes; Publisher Czestochowa University of Technology Faculty of Management: Czestochowa, Poland, 2017; Volume 2, pp. 60–65. [Google Scholar]
- Mannheim, V. Empirical and scale-up modeling in stirred ball mills. Chem. Eng. Res. Des. 2011, 89, 405–409. [Google Scholar] [CrossRef]
- Mannheim, V.; Fehér, Z.; Siménfalvi, Z. Innovative solutions for the building industry to improve sustainability performance with Life Cycle Assessment modelling. In Book Solutions for Sustainable Development, 1st ed.; Tóthné Szita, K., Jármai, K., Voith, K., Eds.; Taylor & Francis Group: Milton Park, UK, 2019. [Google Scholar] [CrossRef]


| Technological Operations | Ecoinvent Activity | Amount PLA Bottle |
|---|---|---|
| Raw material acquisition | ||
| PLA preform mass | Polylactide, granulate {GLO} market for/Alloc Def, S | 18.24 g |
| Electrical energy | Electricity, medium voltage {PL} market for/Alloc Def, S | 0.368 kWh |
| Preform heating | ||
| Electrical energy (infrared lamp 100 kW) | Electricity, medium voltage {PL} market for/Alloc Def, S | 3.2 kWh |
| Electrical energy (infrared lamps 200 kW) | 6.4 kWh | |
| Electrical energy (supply chain) | 0.16 kWh | |
| Preform stretching and extending | ||
| Electrical energy | Electricity, medium voltage {PL} market for/Alloc Def, S | 6.95 kWh |
| Compressed air | Compressed air, 1000 kPa gauge {RER} compressed air production/Alloc Def U | 0.0016 kg/m3 |
| Preform pressure shaping | ||
| Electrical energy | Electricity, medium voltage {PL} market for/Alloc Def, S | 5.66 kWh |
| Bottle degasifying | ||
| Electrical energy | Electricity, medium voltage {PL} market for/Alloc Def, S | 1.01 kWh |
| Bottle cooling | ||
| Electrical energy | Electricity, medium voltage {PL} market for/Alloc Def, S | 0.71 kWh |
| Water in a closed circulation | Tap water {Europe without Switzerland} market for/Alloc Def, S | 2.4 m3 |
| Impact Category | Unit | PET Bottle | PLA Bottle |
|---|---|---|---|
| Abiotic depletion | kg Sb eq | 8.18 | 4.89 |
| Acidification | kg SO2 eq | 9.90 × 10⁻⁶ | 0.00004 |
| Eutrophication | kg PO4 eq | 1.47 | 1.47 |
| Global warming (GWP100) | kg CO2 eq | 6.57 | 38.14 |
| Ozone layer depletion (ODP) | kg CFC-11 eq | 3.36 × 10⁻⁵ | 0.00004 |
| Human toxicity | kg 1,4-DB eq | 485.12 | 354.27 |
| Fresh water aquatic ecotox. | kg 1,4-DB eq | 223.24 | 258.36 |
| Marine aquatic ecotoxicity | kg 1,4-DB eq | 481,609.65 | 456,003.83 |
| Terrestrial ecotoxicity | kg 1,4-DB eq | 1.99 | 4.08 |
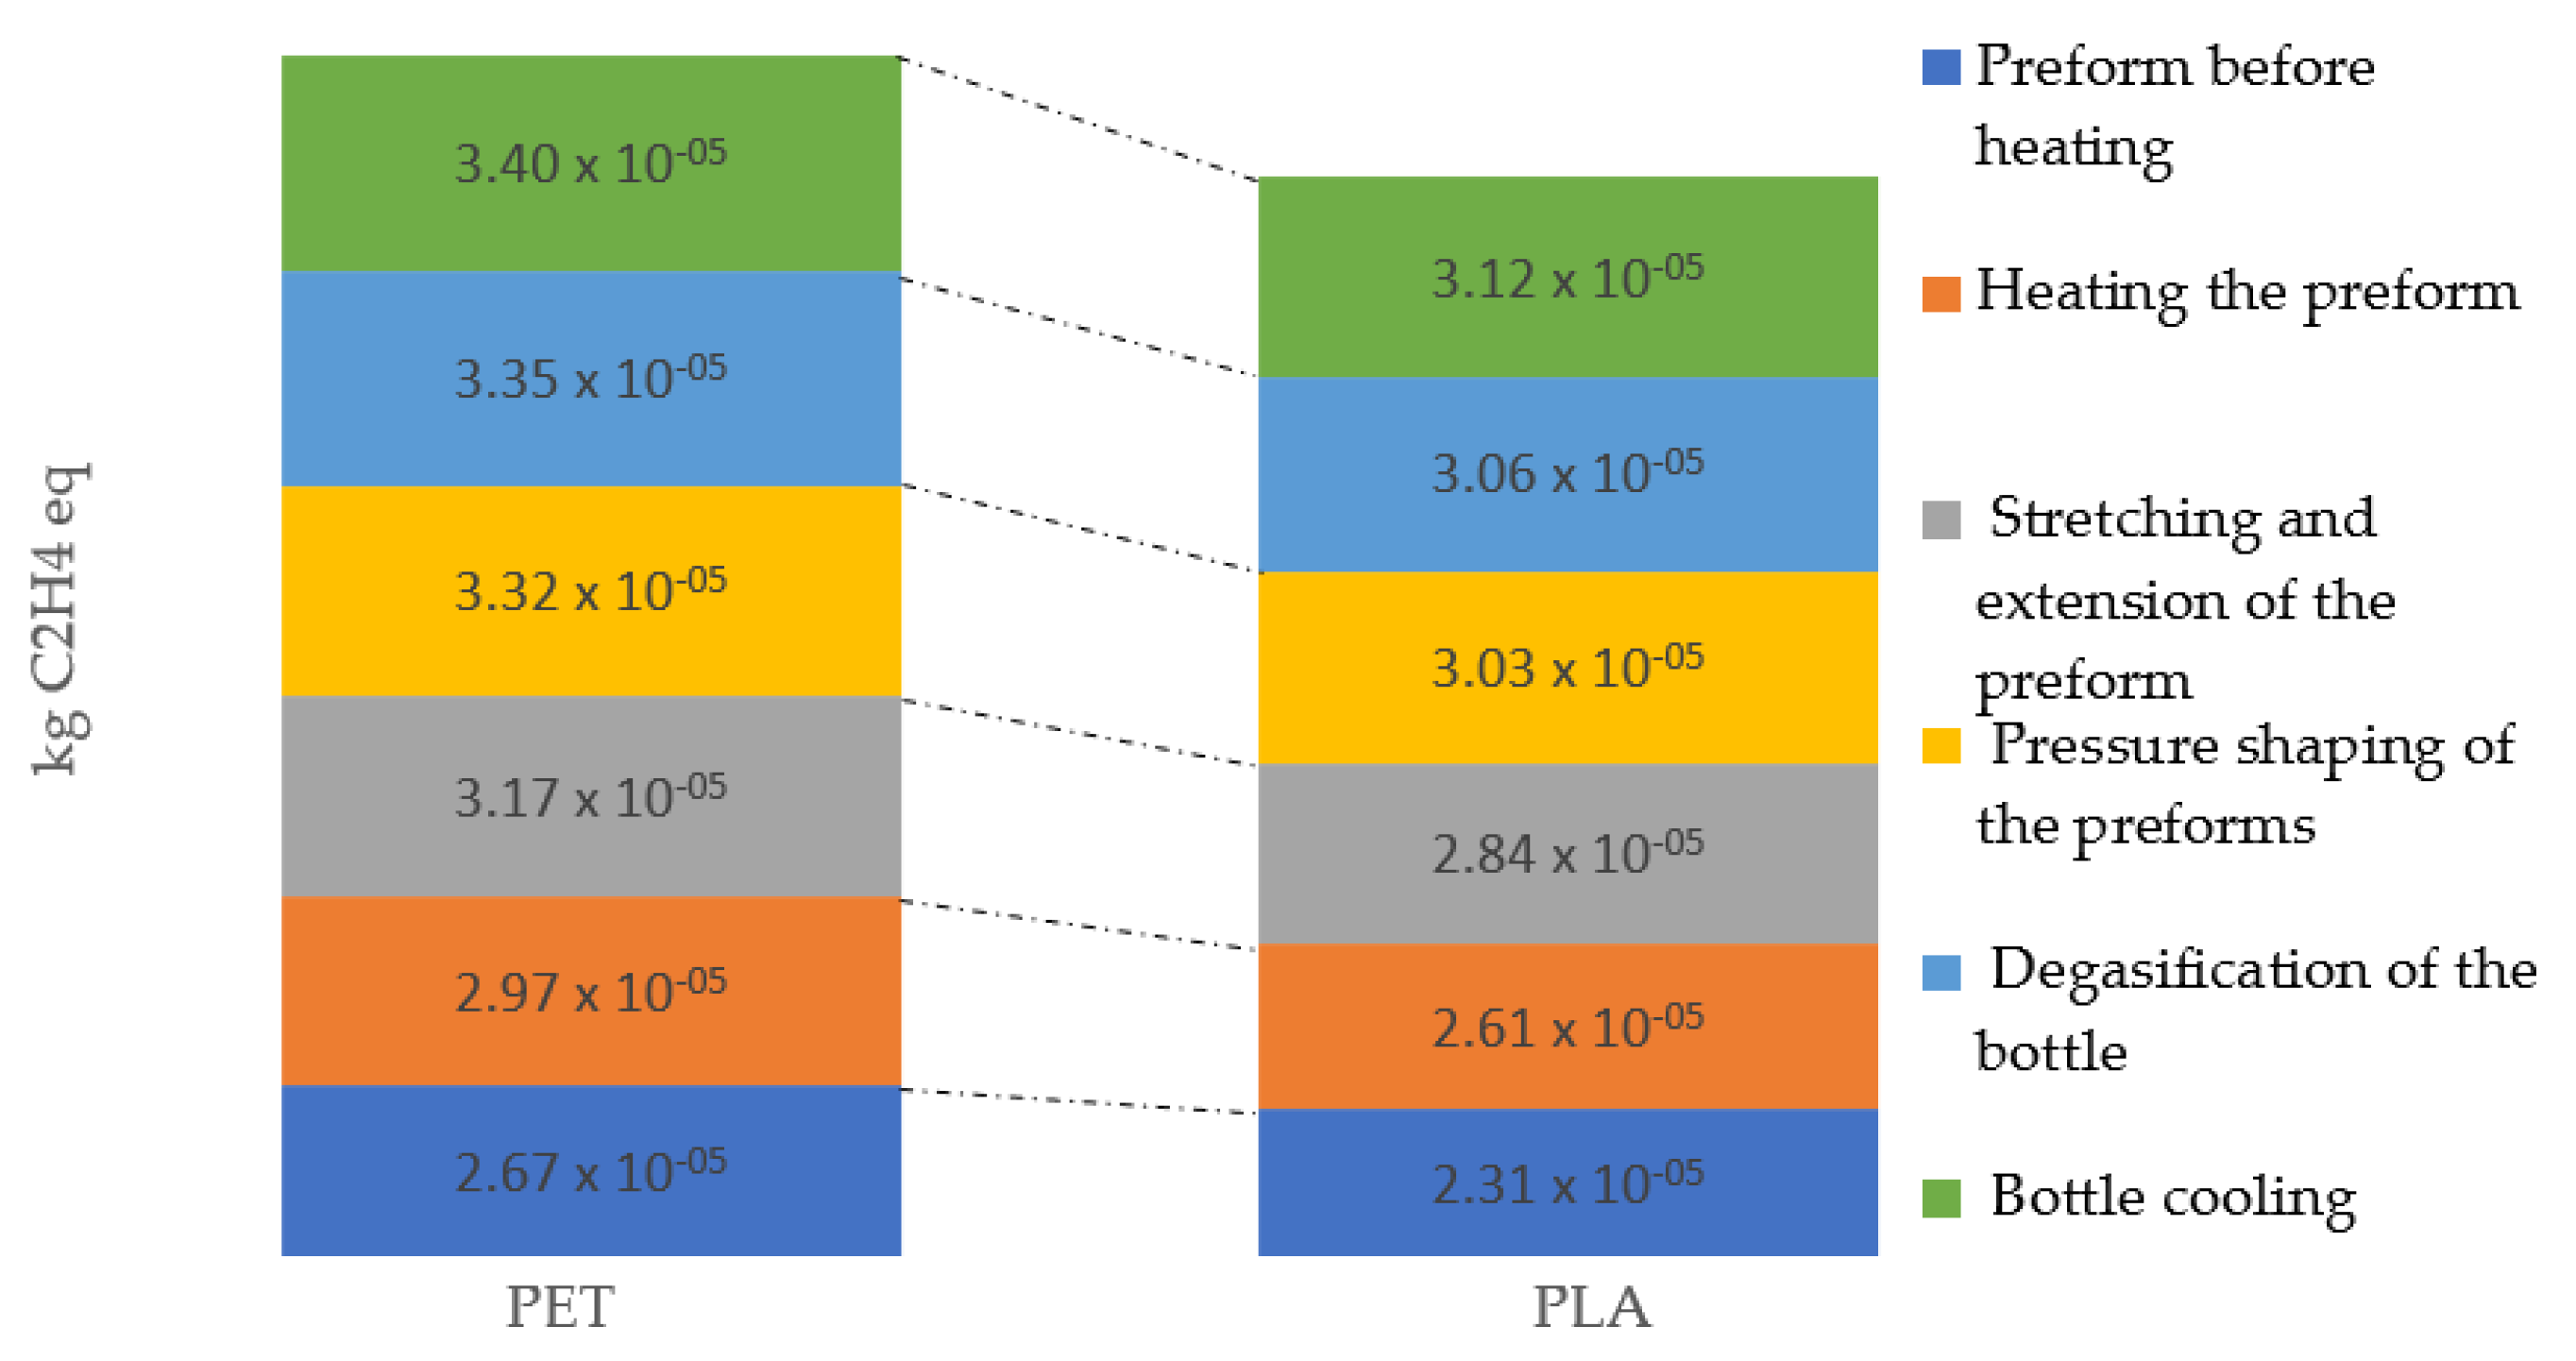
| Photochemical oxidation | kg C2H4 eq | 0.19 | 0.17 |
Publisher’s Note: MDPI stays neutral with regard to jurisdictional claims in published maps and institutional affiliations. |
© 2021 by the authors. Licensee MDPI, Basel, Switzerland. This article is an open access article distributed under the terms and conditions of the Creative Commons Attribution (CC BY) license (https://creativecommons.org/licenses/by/4.0/).
Share and Cite
Bałdowska-Witos, P.; Piasecka, I.; Flizikowski, J.; Tomporowski, A.; Idzikowski, A.; Zawada, M. Life Cycle Assessment of Two Alternative Plastics for Bottle Production. Materials 2021, 14, 4552. https://doi.org/10.3390/ma14164552
Bałdowska-Witos P, Piasecka I, Flizikowski J, Tomporowski A, Idzikowski A, Zawada M. Life Cycle Assessment of Two Alternative Plastics for Bottle Production. Materials. 2021; 14(16):4552. https://doi.org/10.3390/ma14164552
Chicago/Turabian StyleBałdowska-Witos, Patrycja, Izabela Piasecka, Józef Flizikowski, Andrzej Tomporowski, Adam Idzikowski, and Marcin Zawada. 2021. "Life Cycle Assessment of Two Alternative Plastics for Bottle Production" Materials 14, no. 16: 4552. https://doi.org/10.3390/ma14164552
APA StyleBałdowska-Witos, P., Piasecka, I., Flizikowski, J., Tomporowski, A., Idzikowski, A., & Zawada, M. (2021). Life Cycle Assessment of Two Alternative Plastics for Bottle Production. Materials, 14(16), 4552. https://doi.org/10.3390/ma14164552