
Potential Applications of Arthrospira platensis Lipid-Free Biomass in Bioremediation of Organic Dye from Industrial Textile Effluents and Its Influence on Marine Rotifer (Brachionus plicatilis)


 ,
,  , , and
Abstract
:1. Introduction
2. Materials and Methods
2.1. Arthrospira Platensis NIOF17/003
2.1.1. Algal Strain and Oil Extraction
2.1.2. Characterization of ACDB and LFB
2.2. Dye Solution Preparation
2.3. Adsorption Experiments
2.4. Adsorption Isotherm Experiments
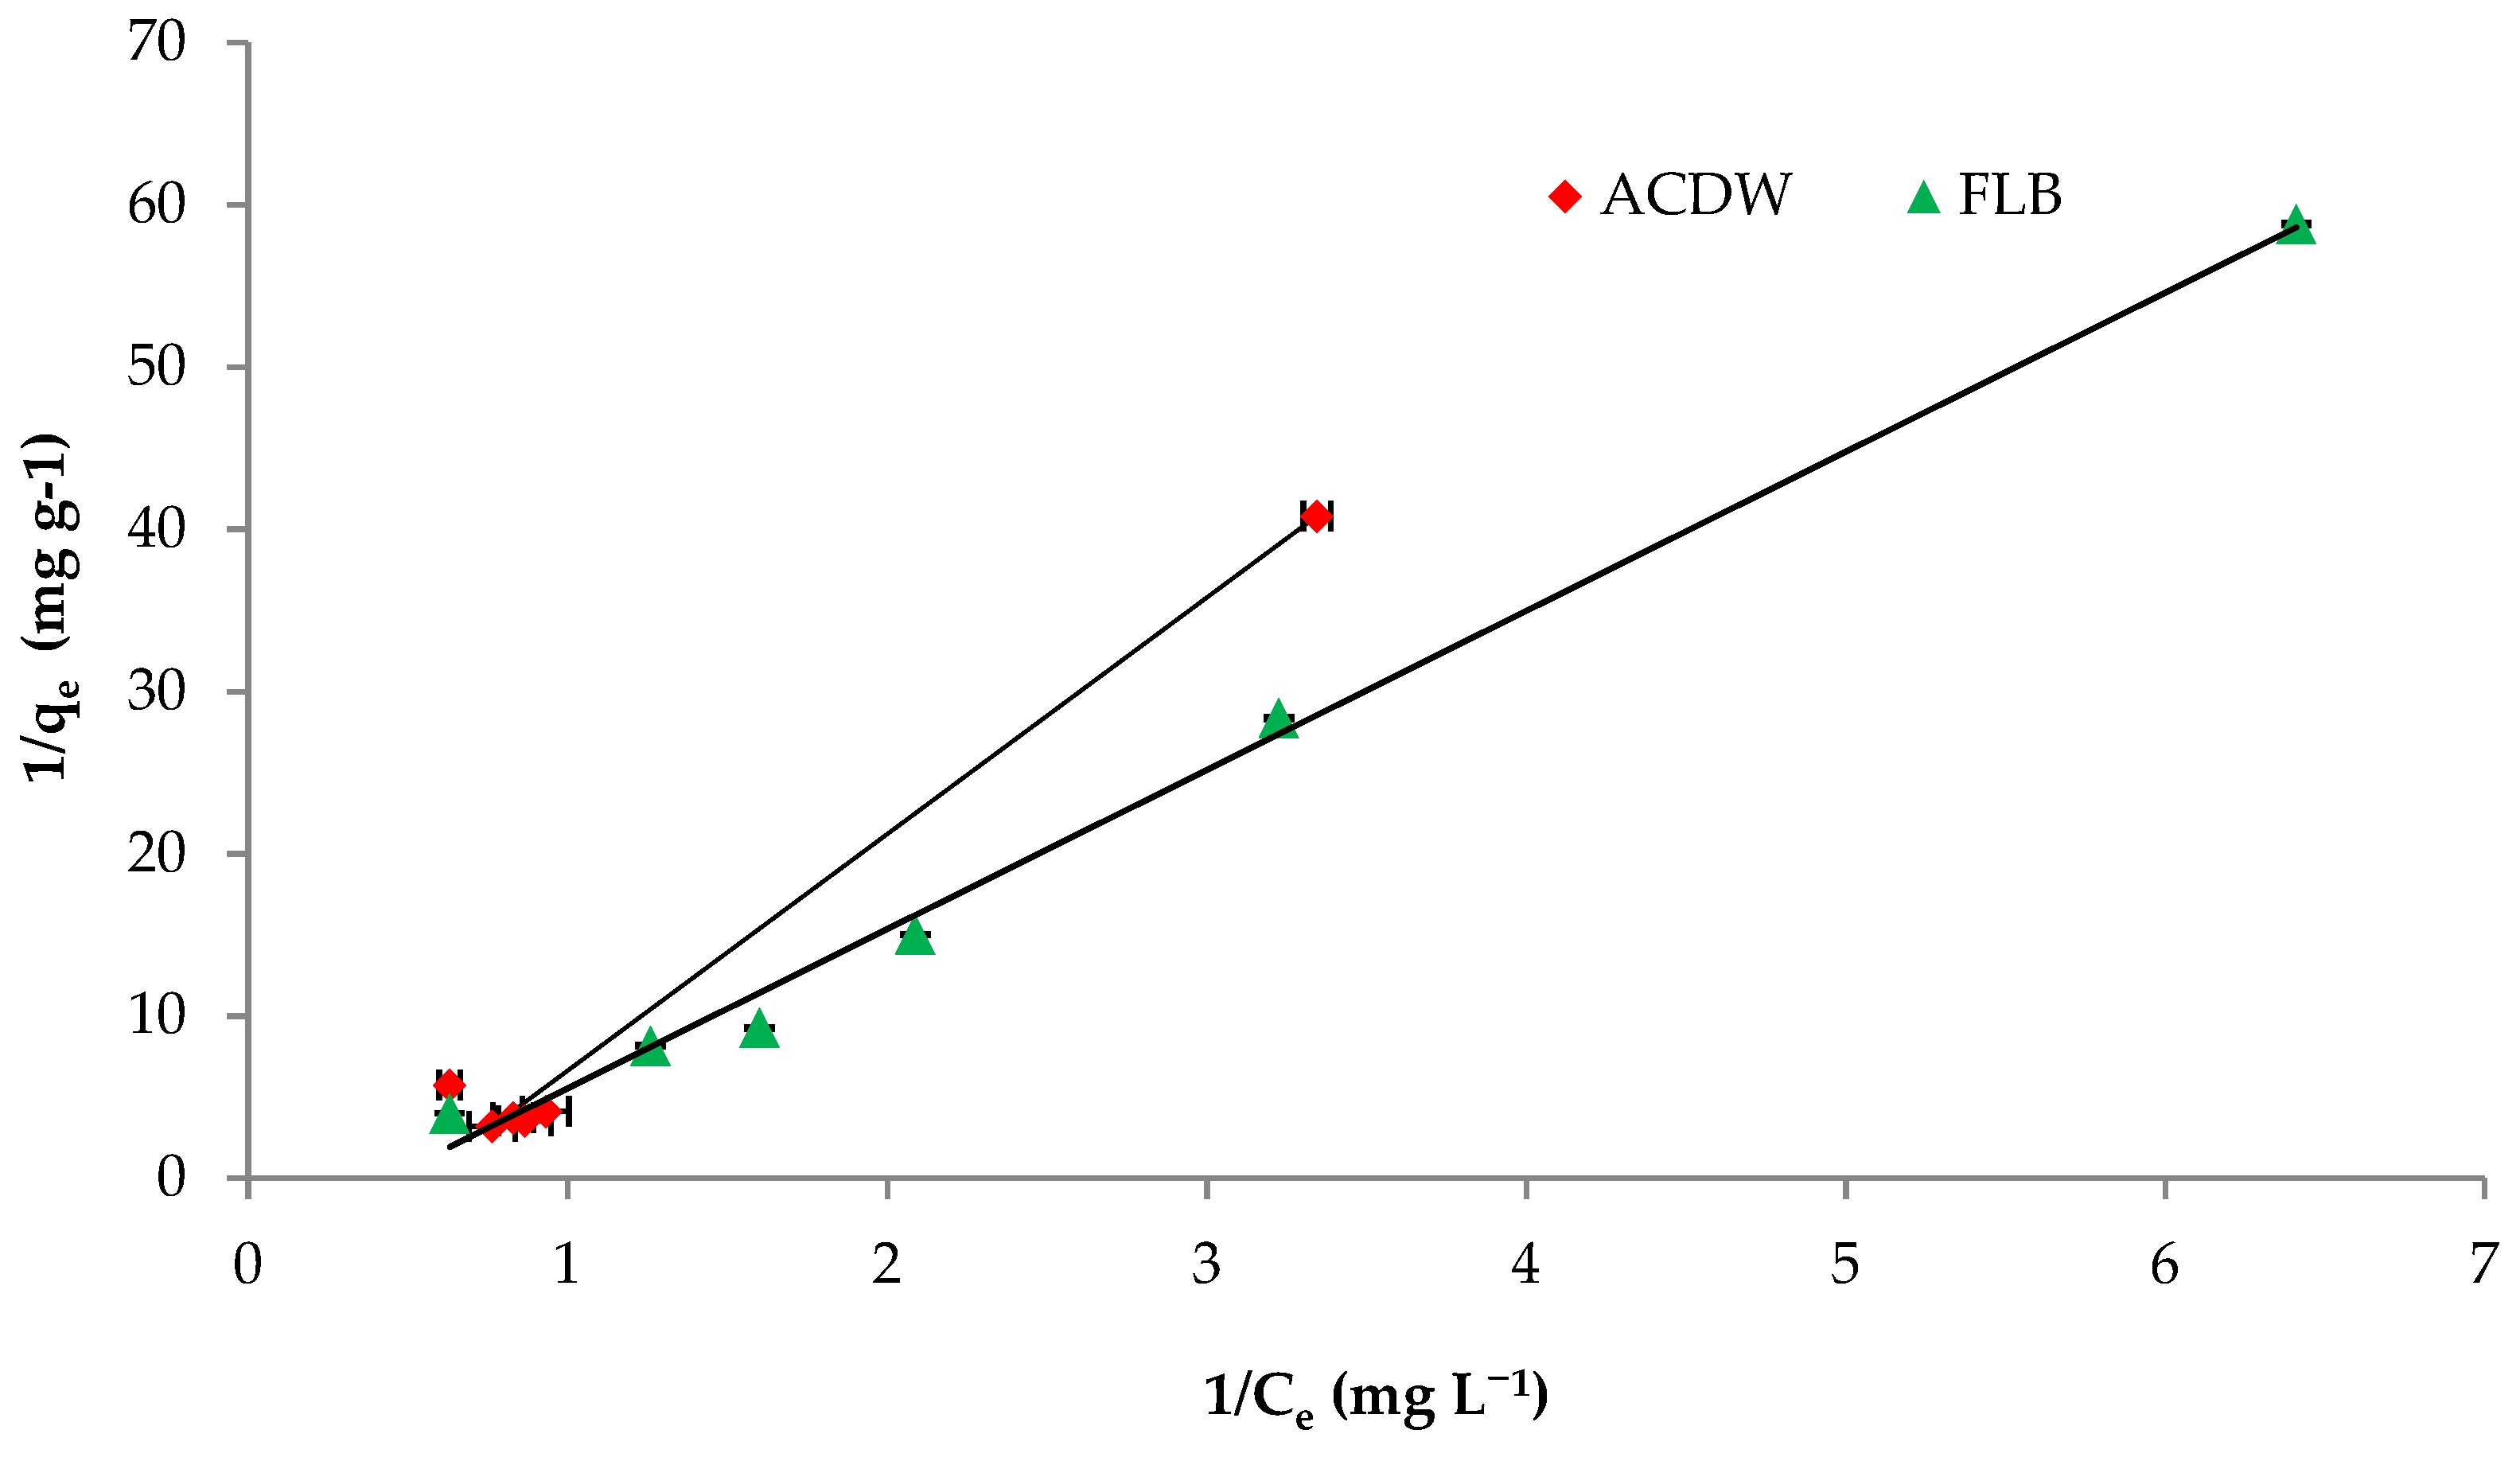
2.4.1. Langmuir Model
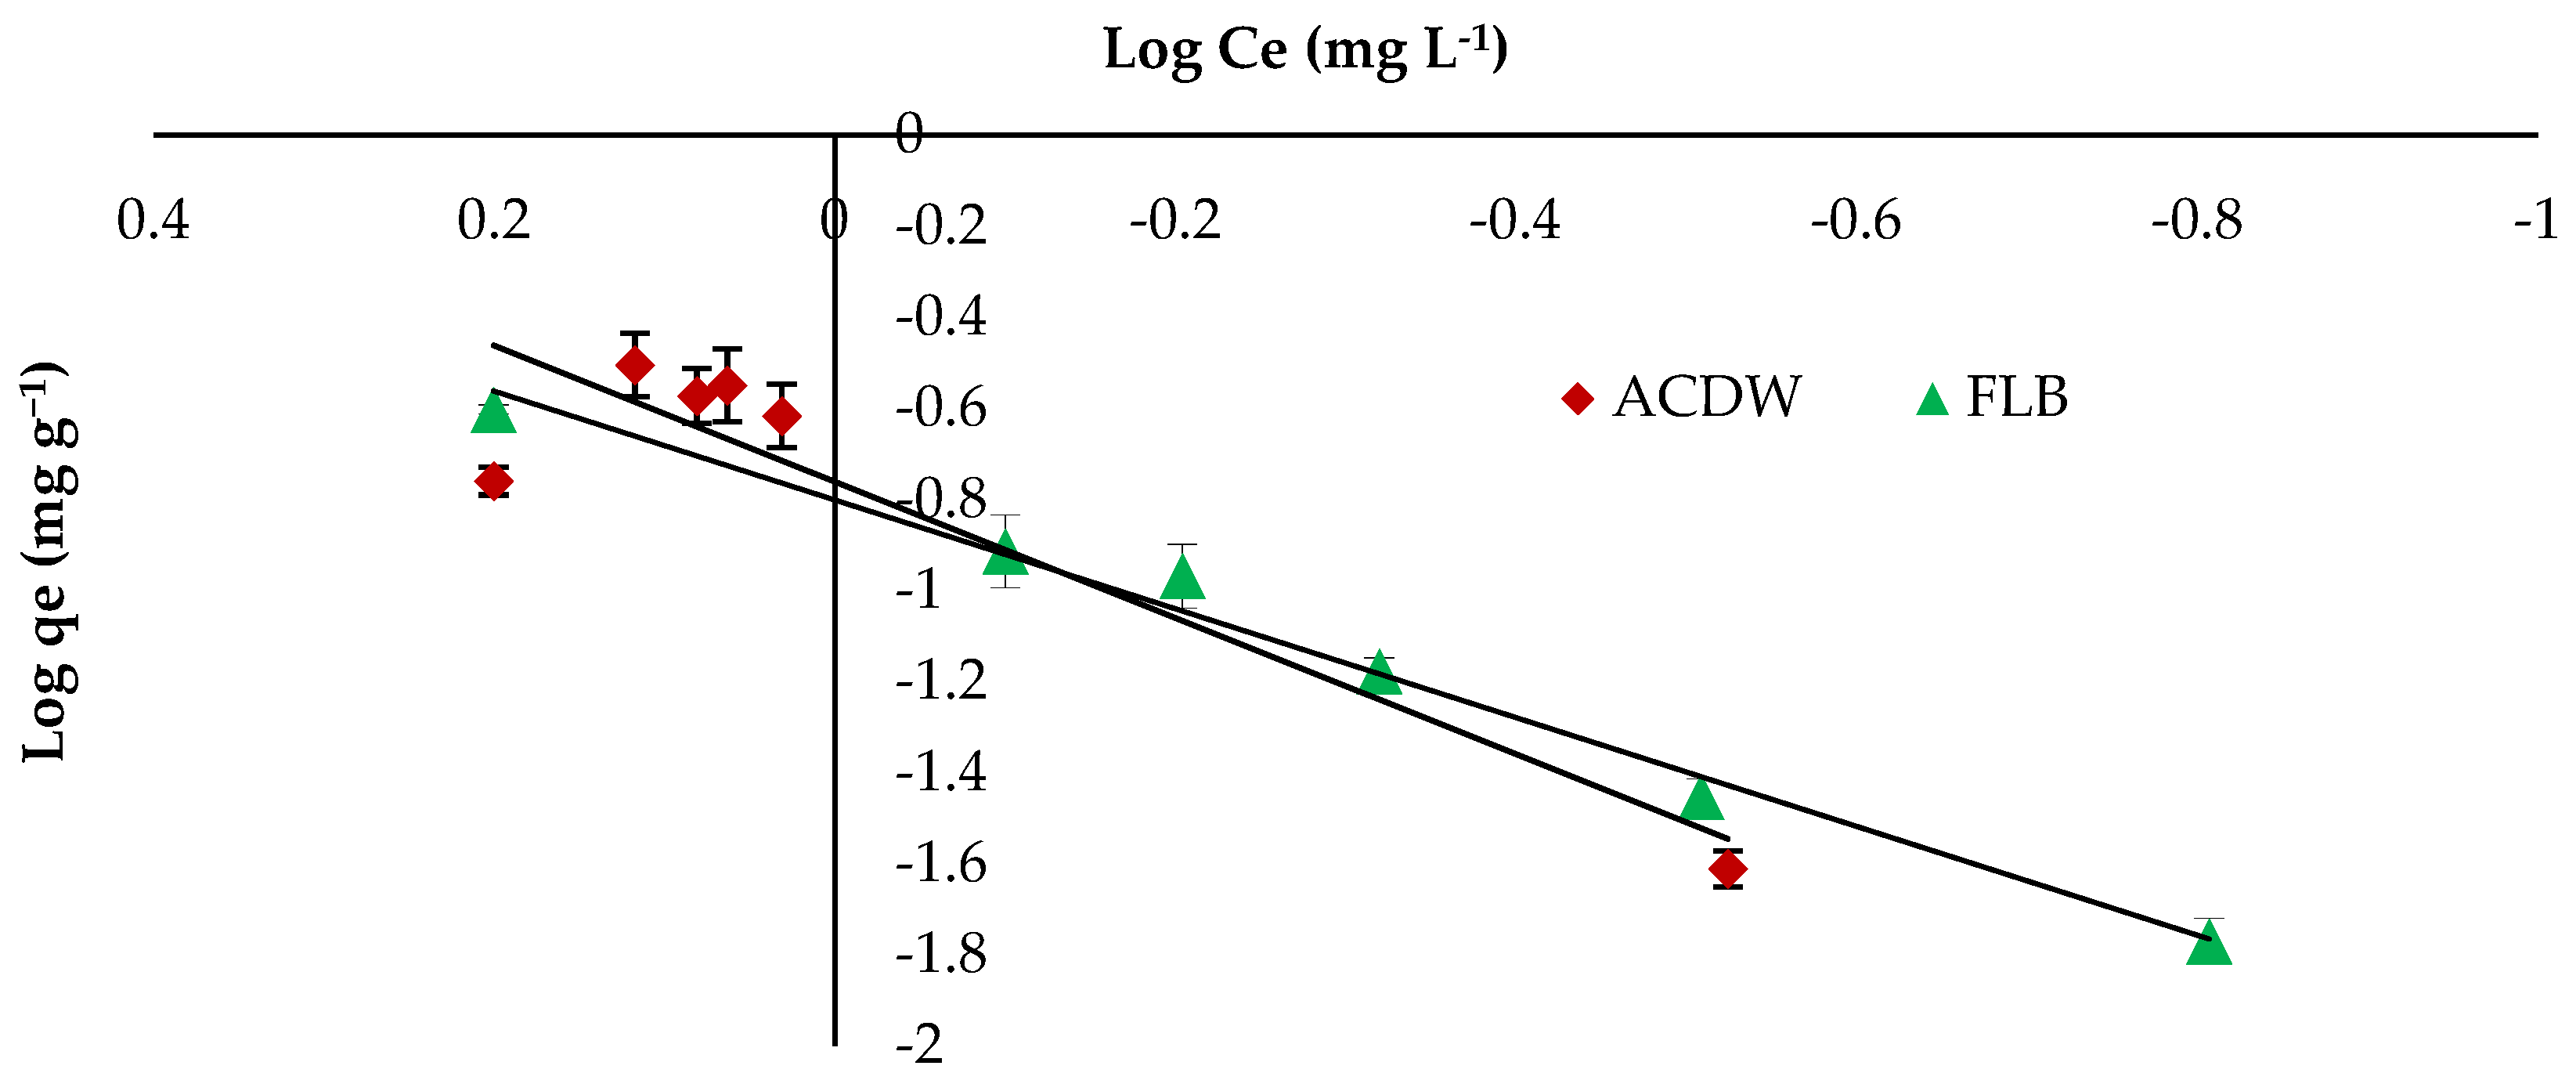
2.4.2. Freundlich Model
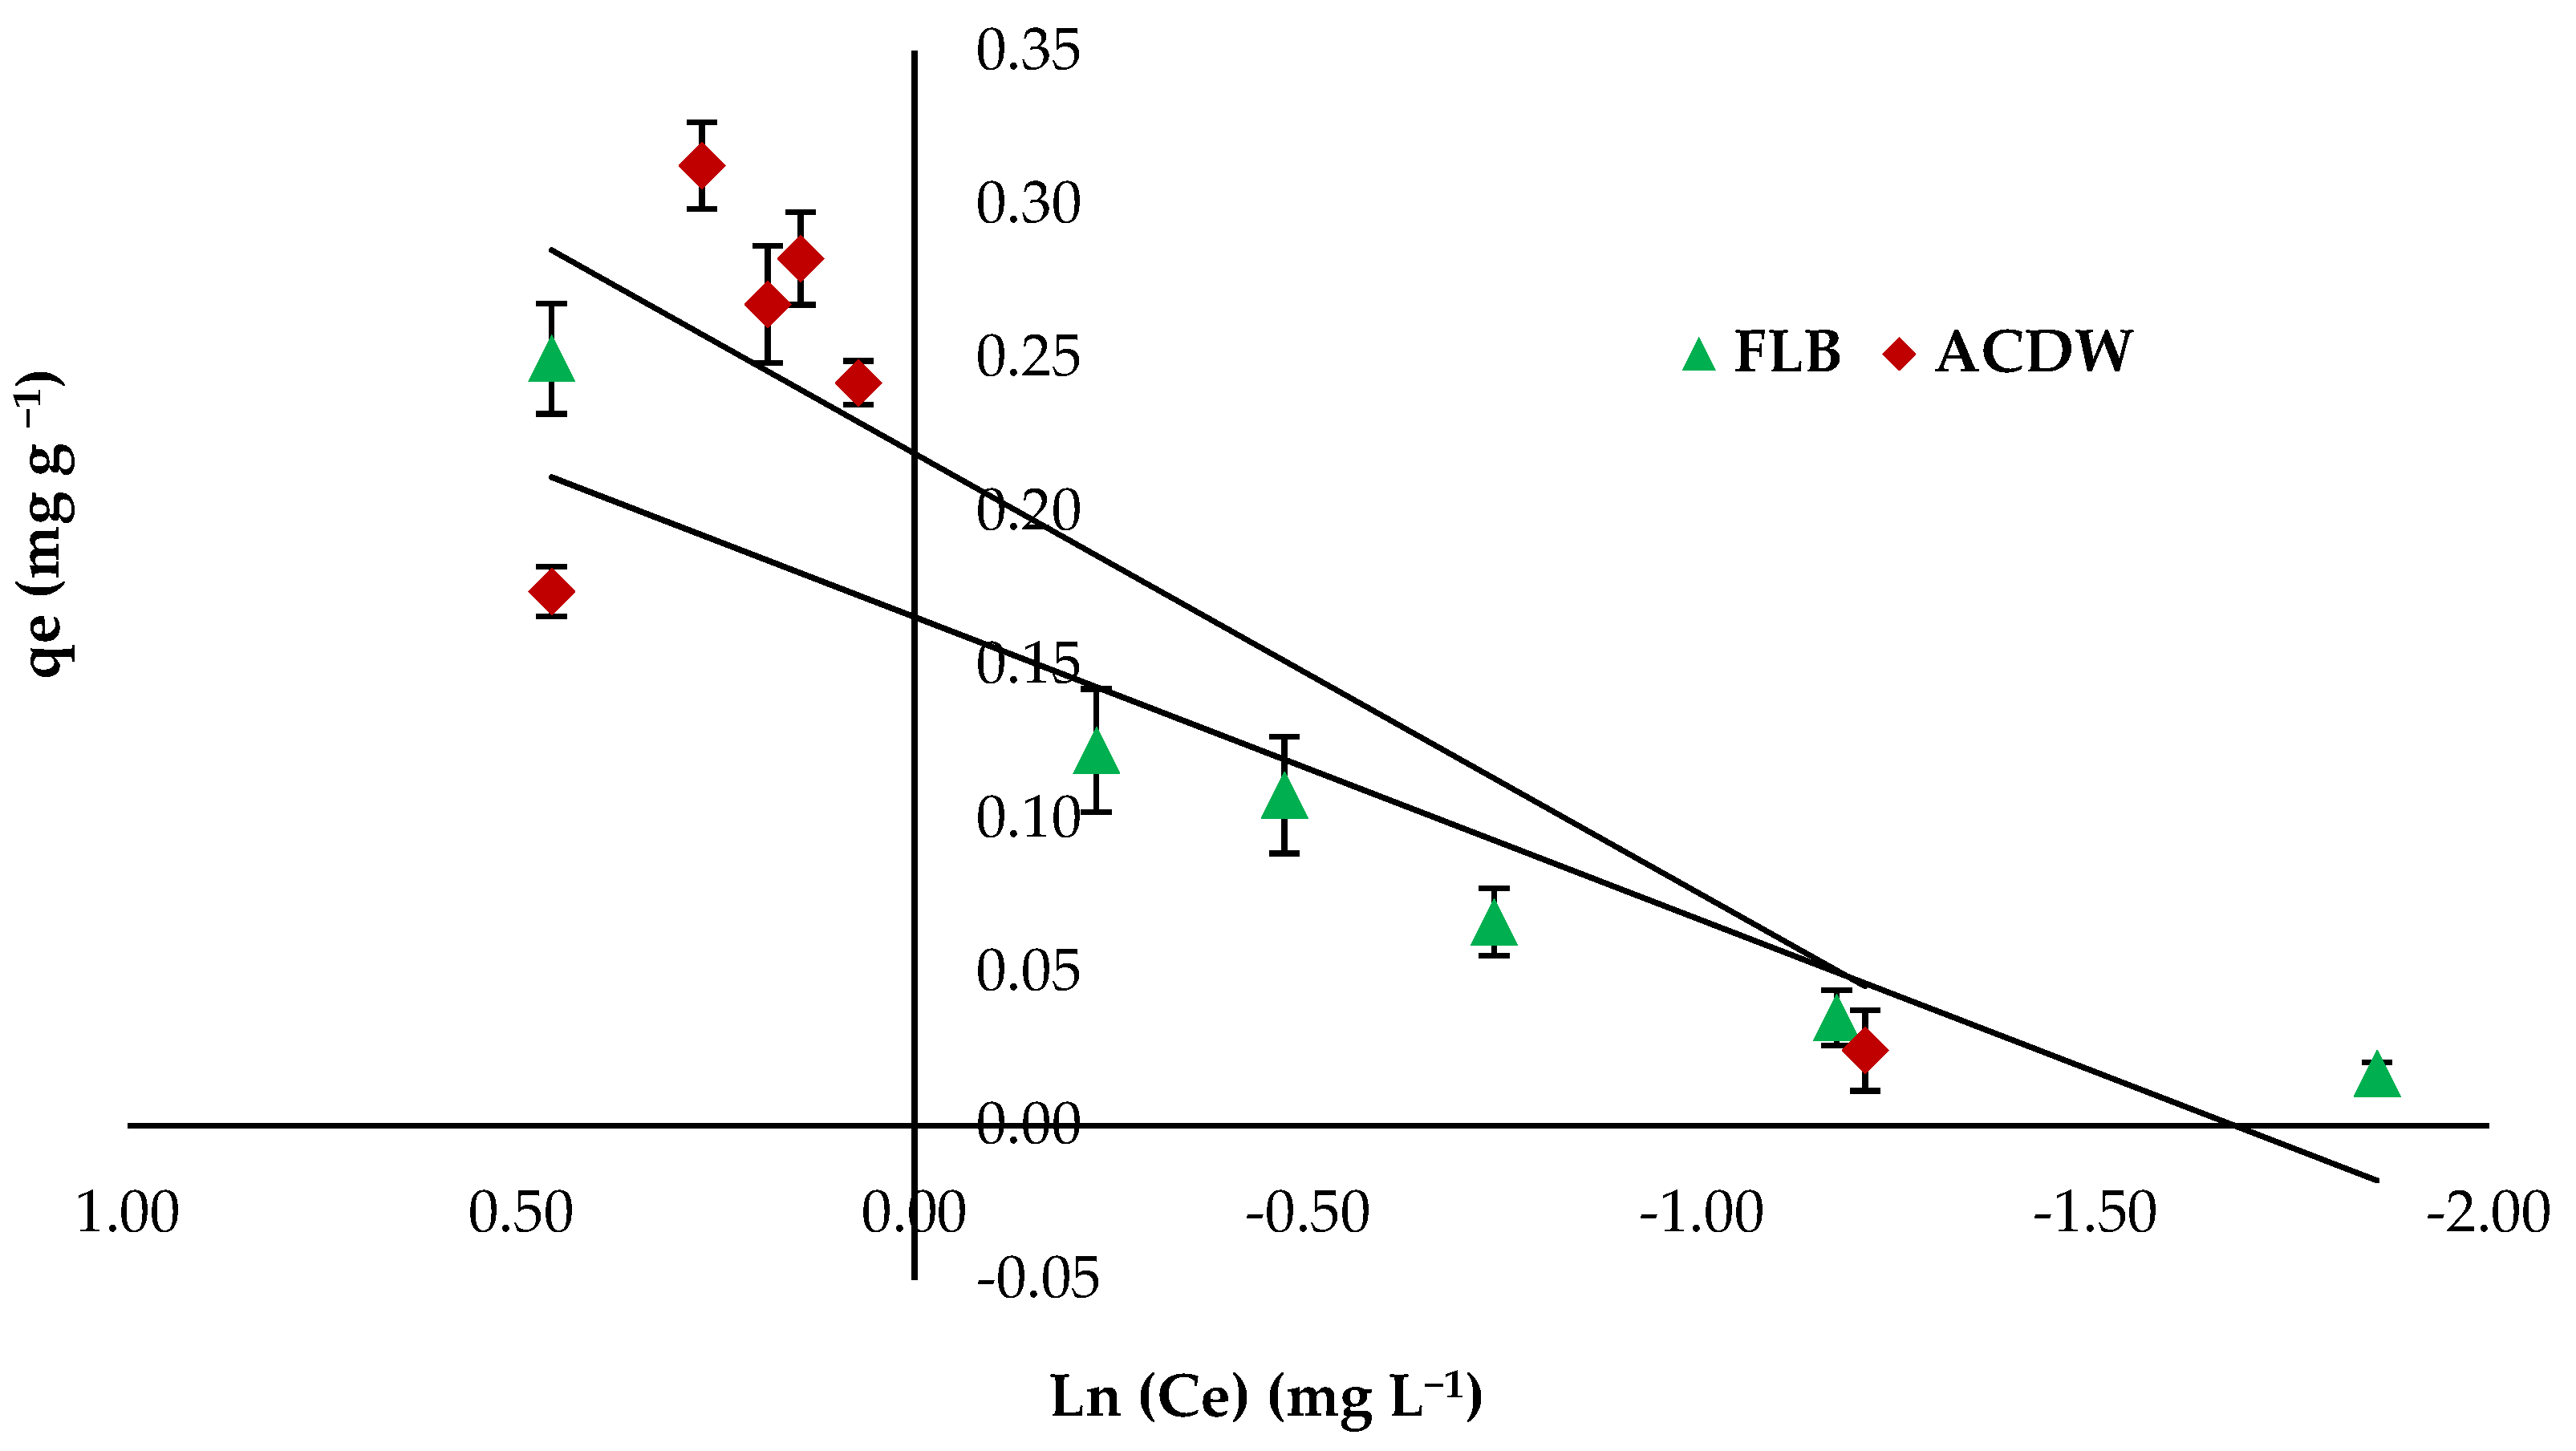
2.4.3. Temkin Model
2.4.4. The Halsey Isotherm Model
2.5. Adsorption Kinetics
2.5.1. Pseudo-First Order Kinetic
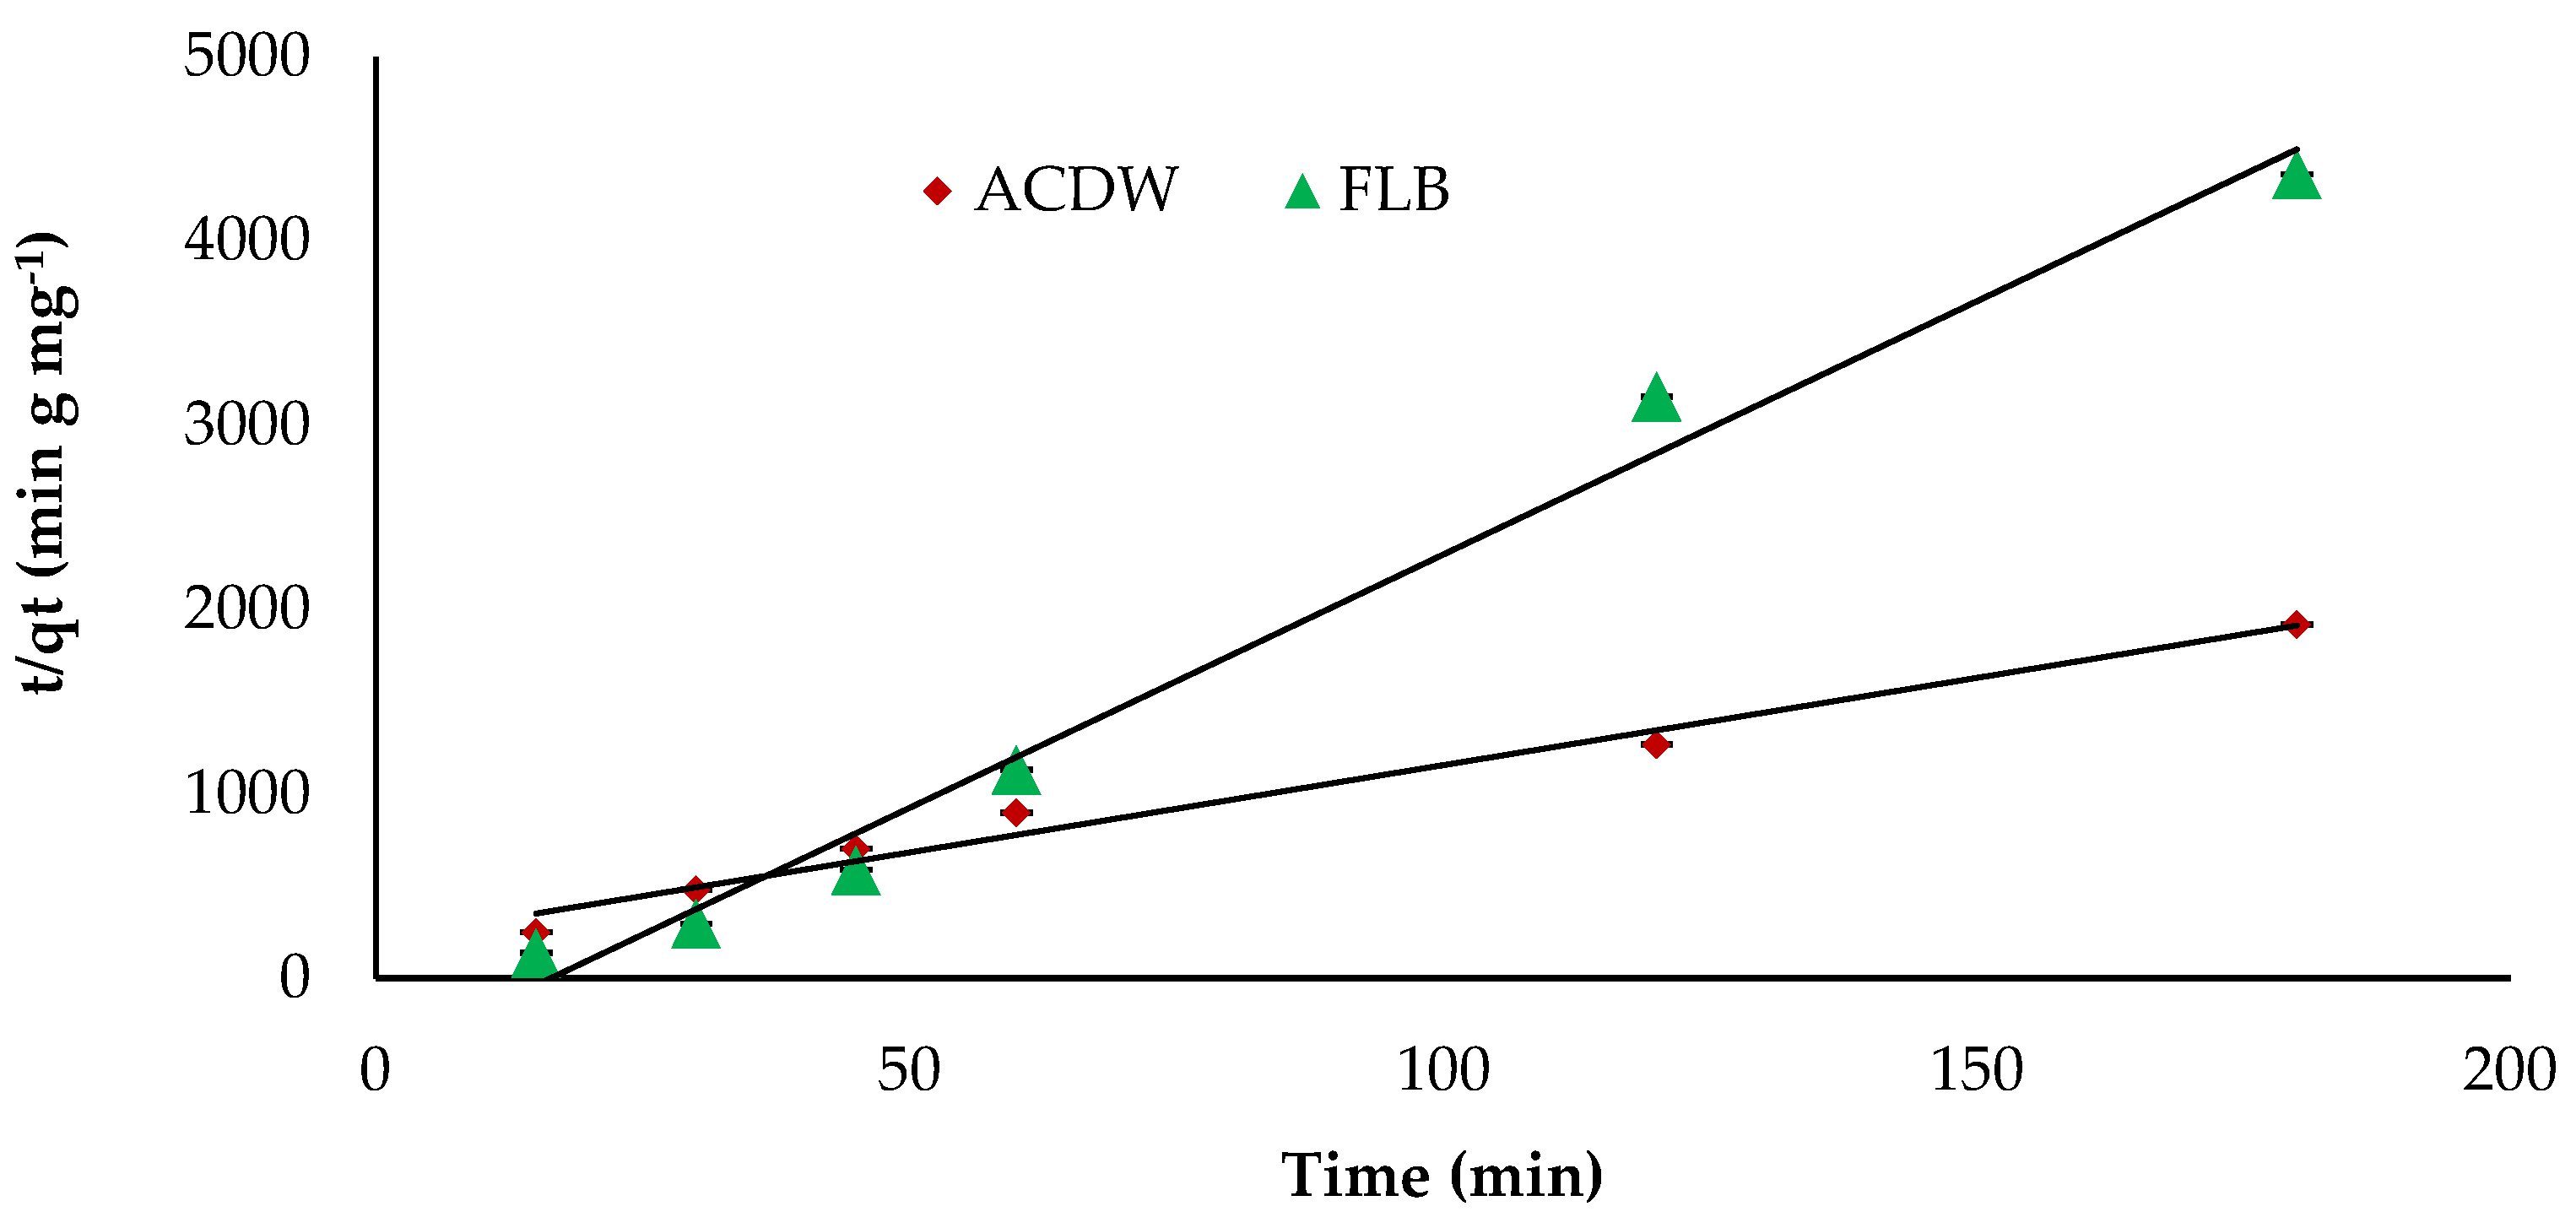
2.5.2. Pseudo-Second Order Kinetic Model
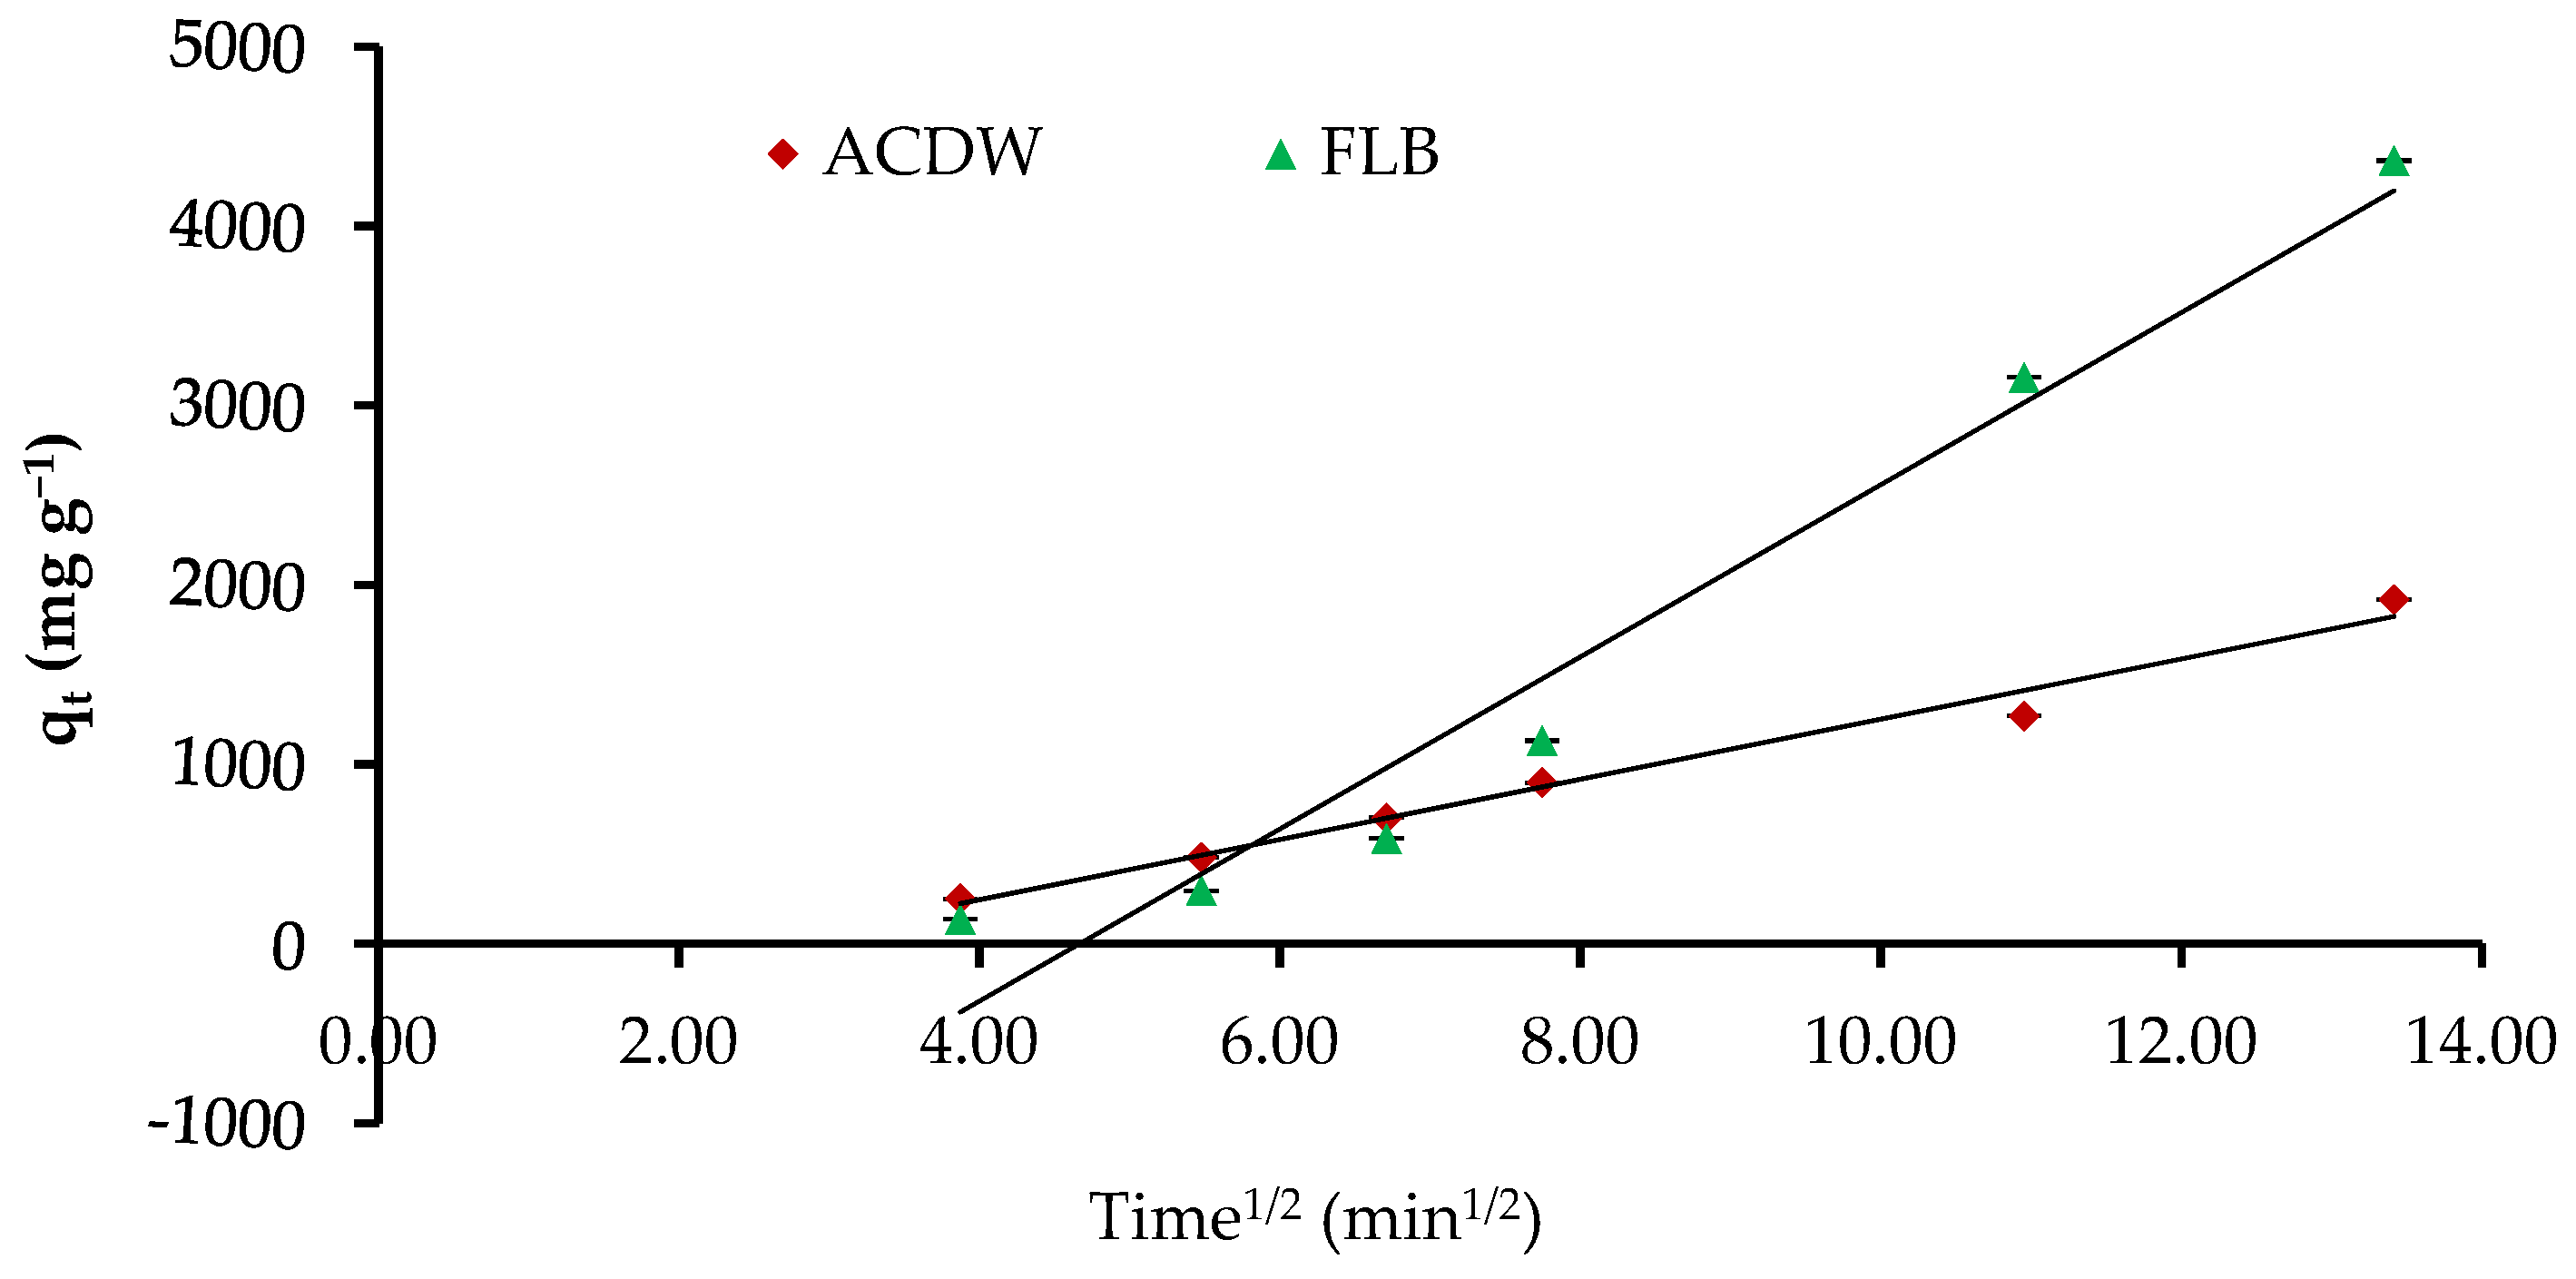
2.5.3. The intraparticle Diffusion Model
2.6. Application of ACDB and LFB on Actual Wastewater
2.7. Bioassay Test
2.8. Statistical Analysis
3. Results and Discussion
3.1. Adsorbents Characterization
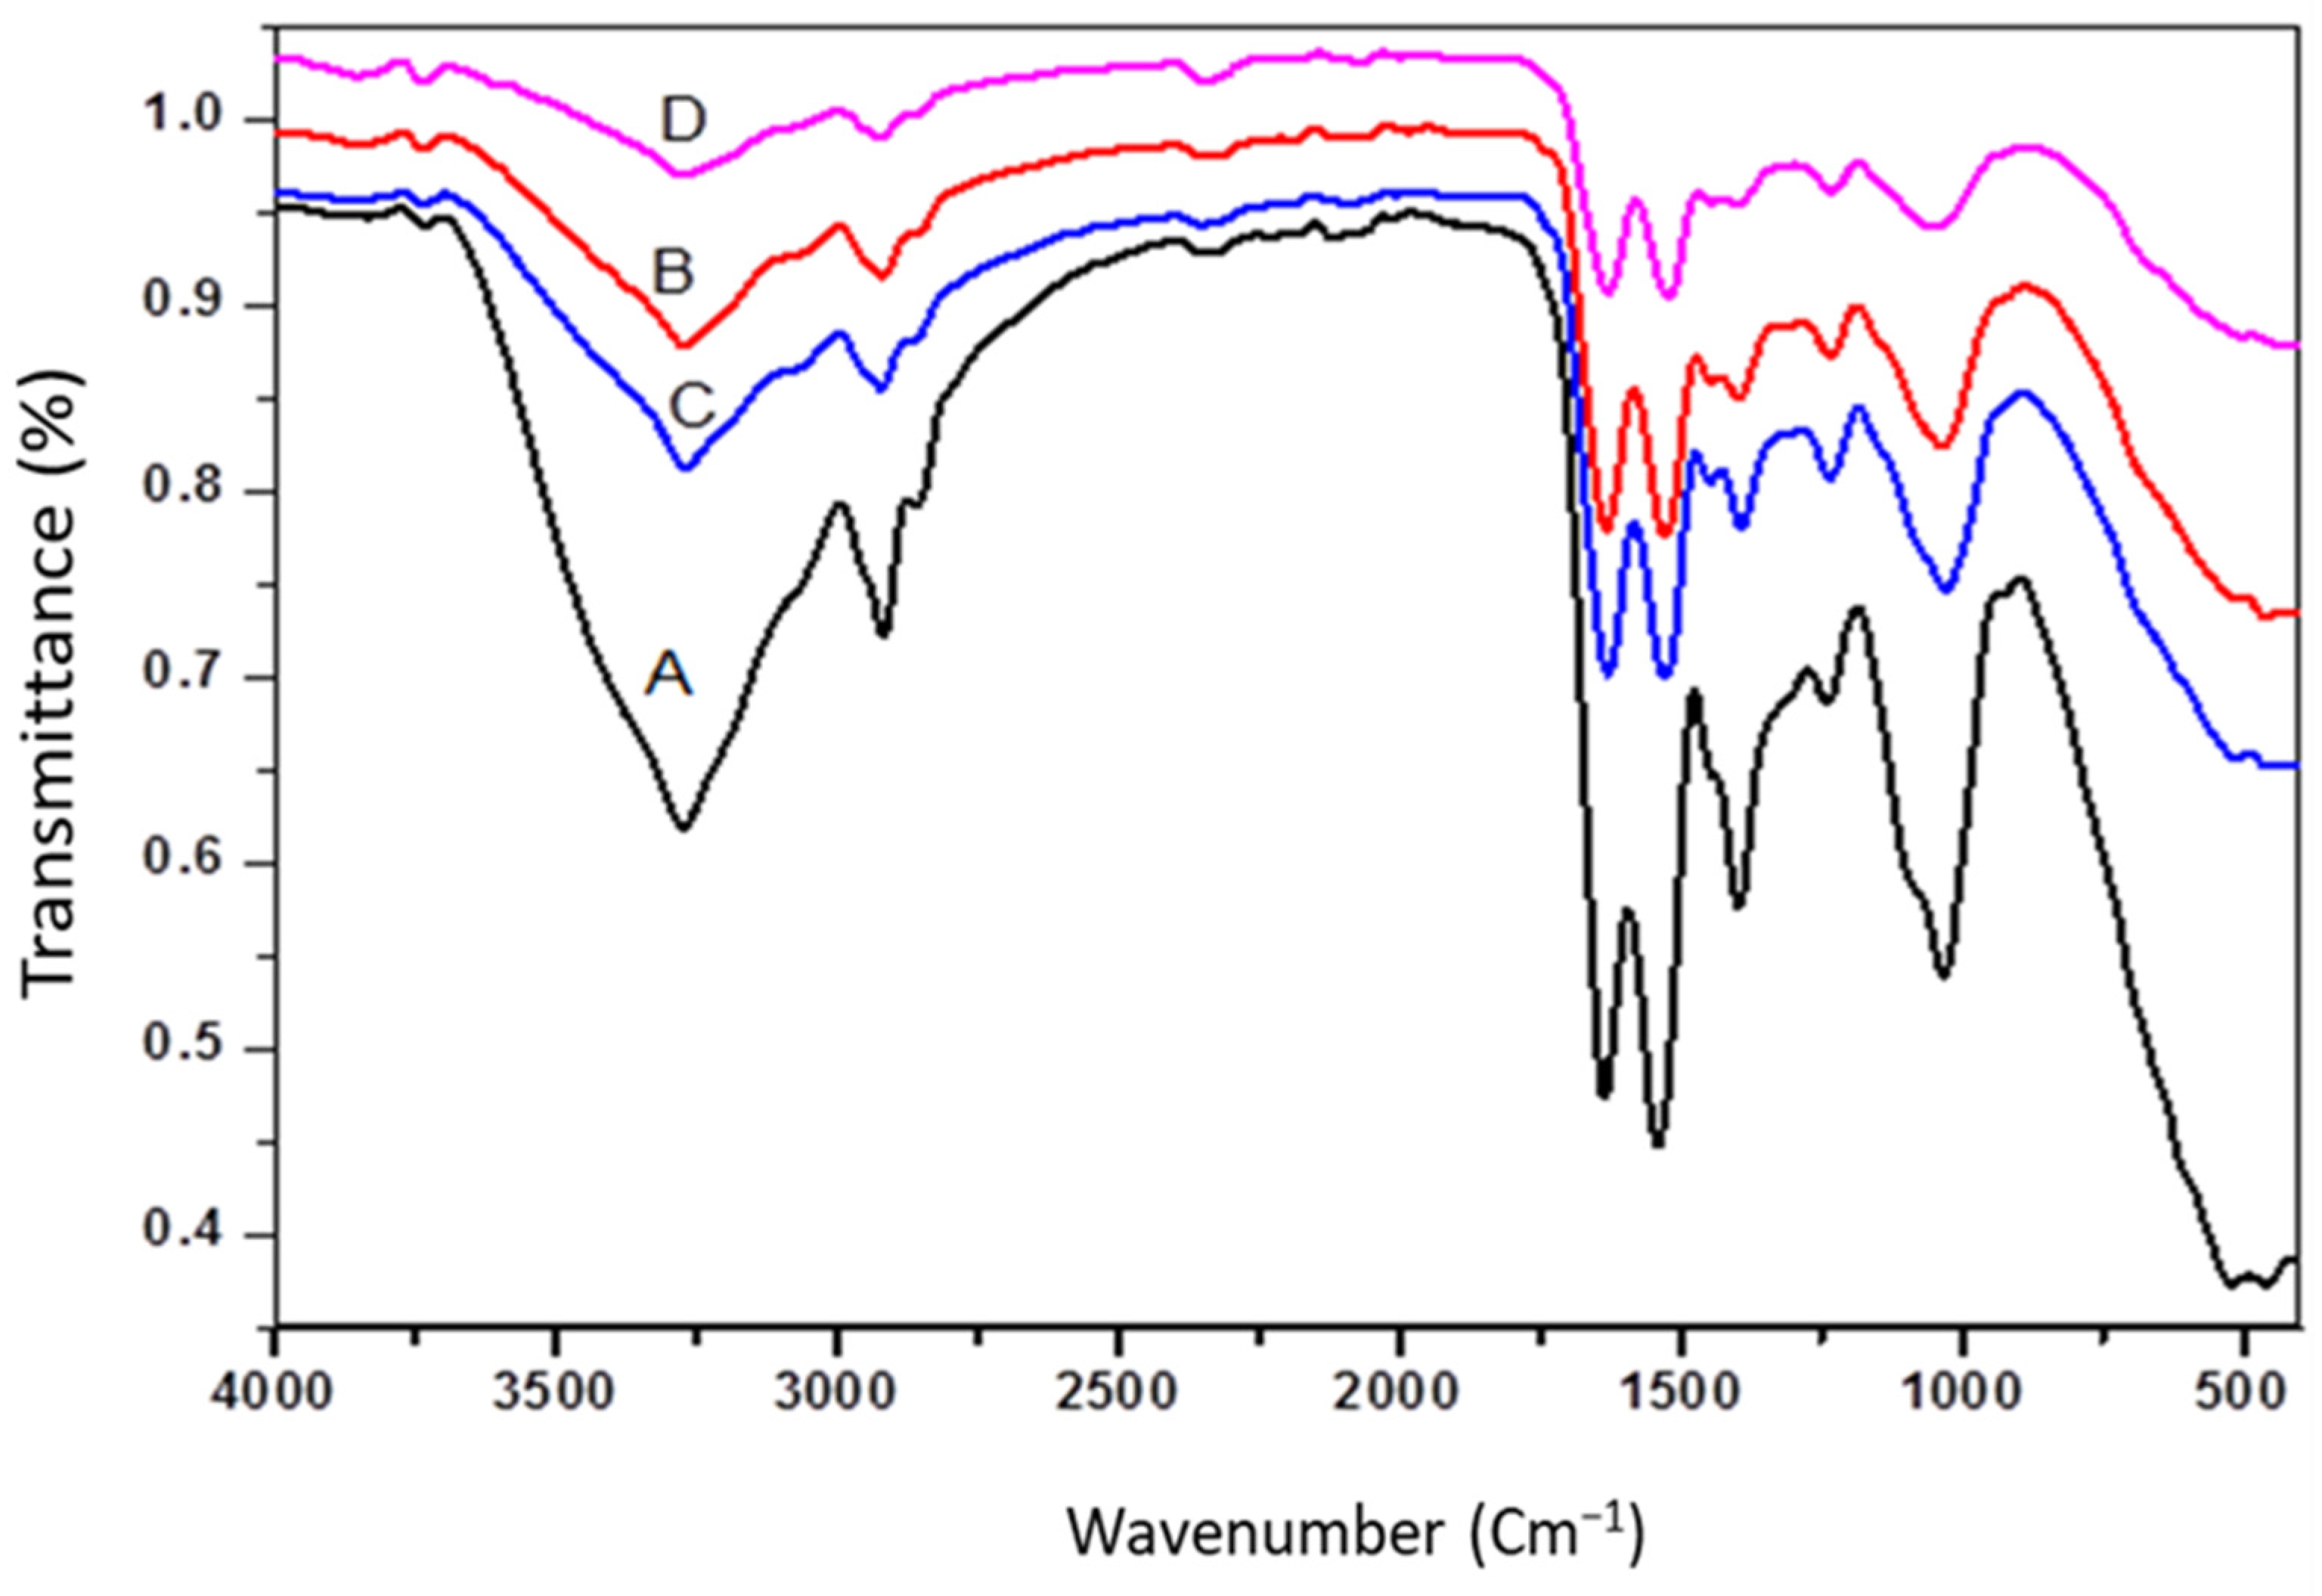
3.1.1. FTIR Analysis
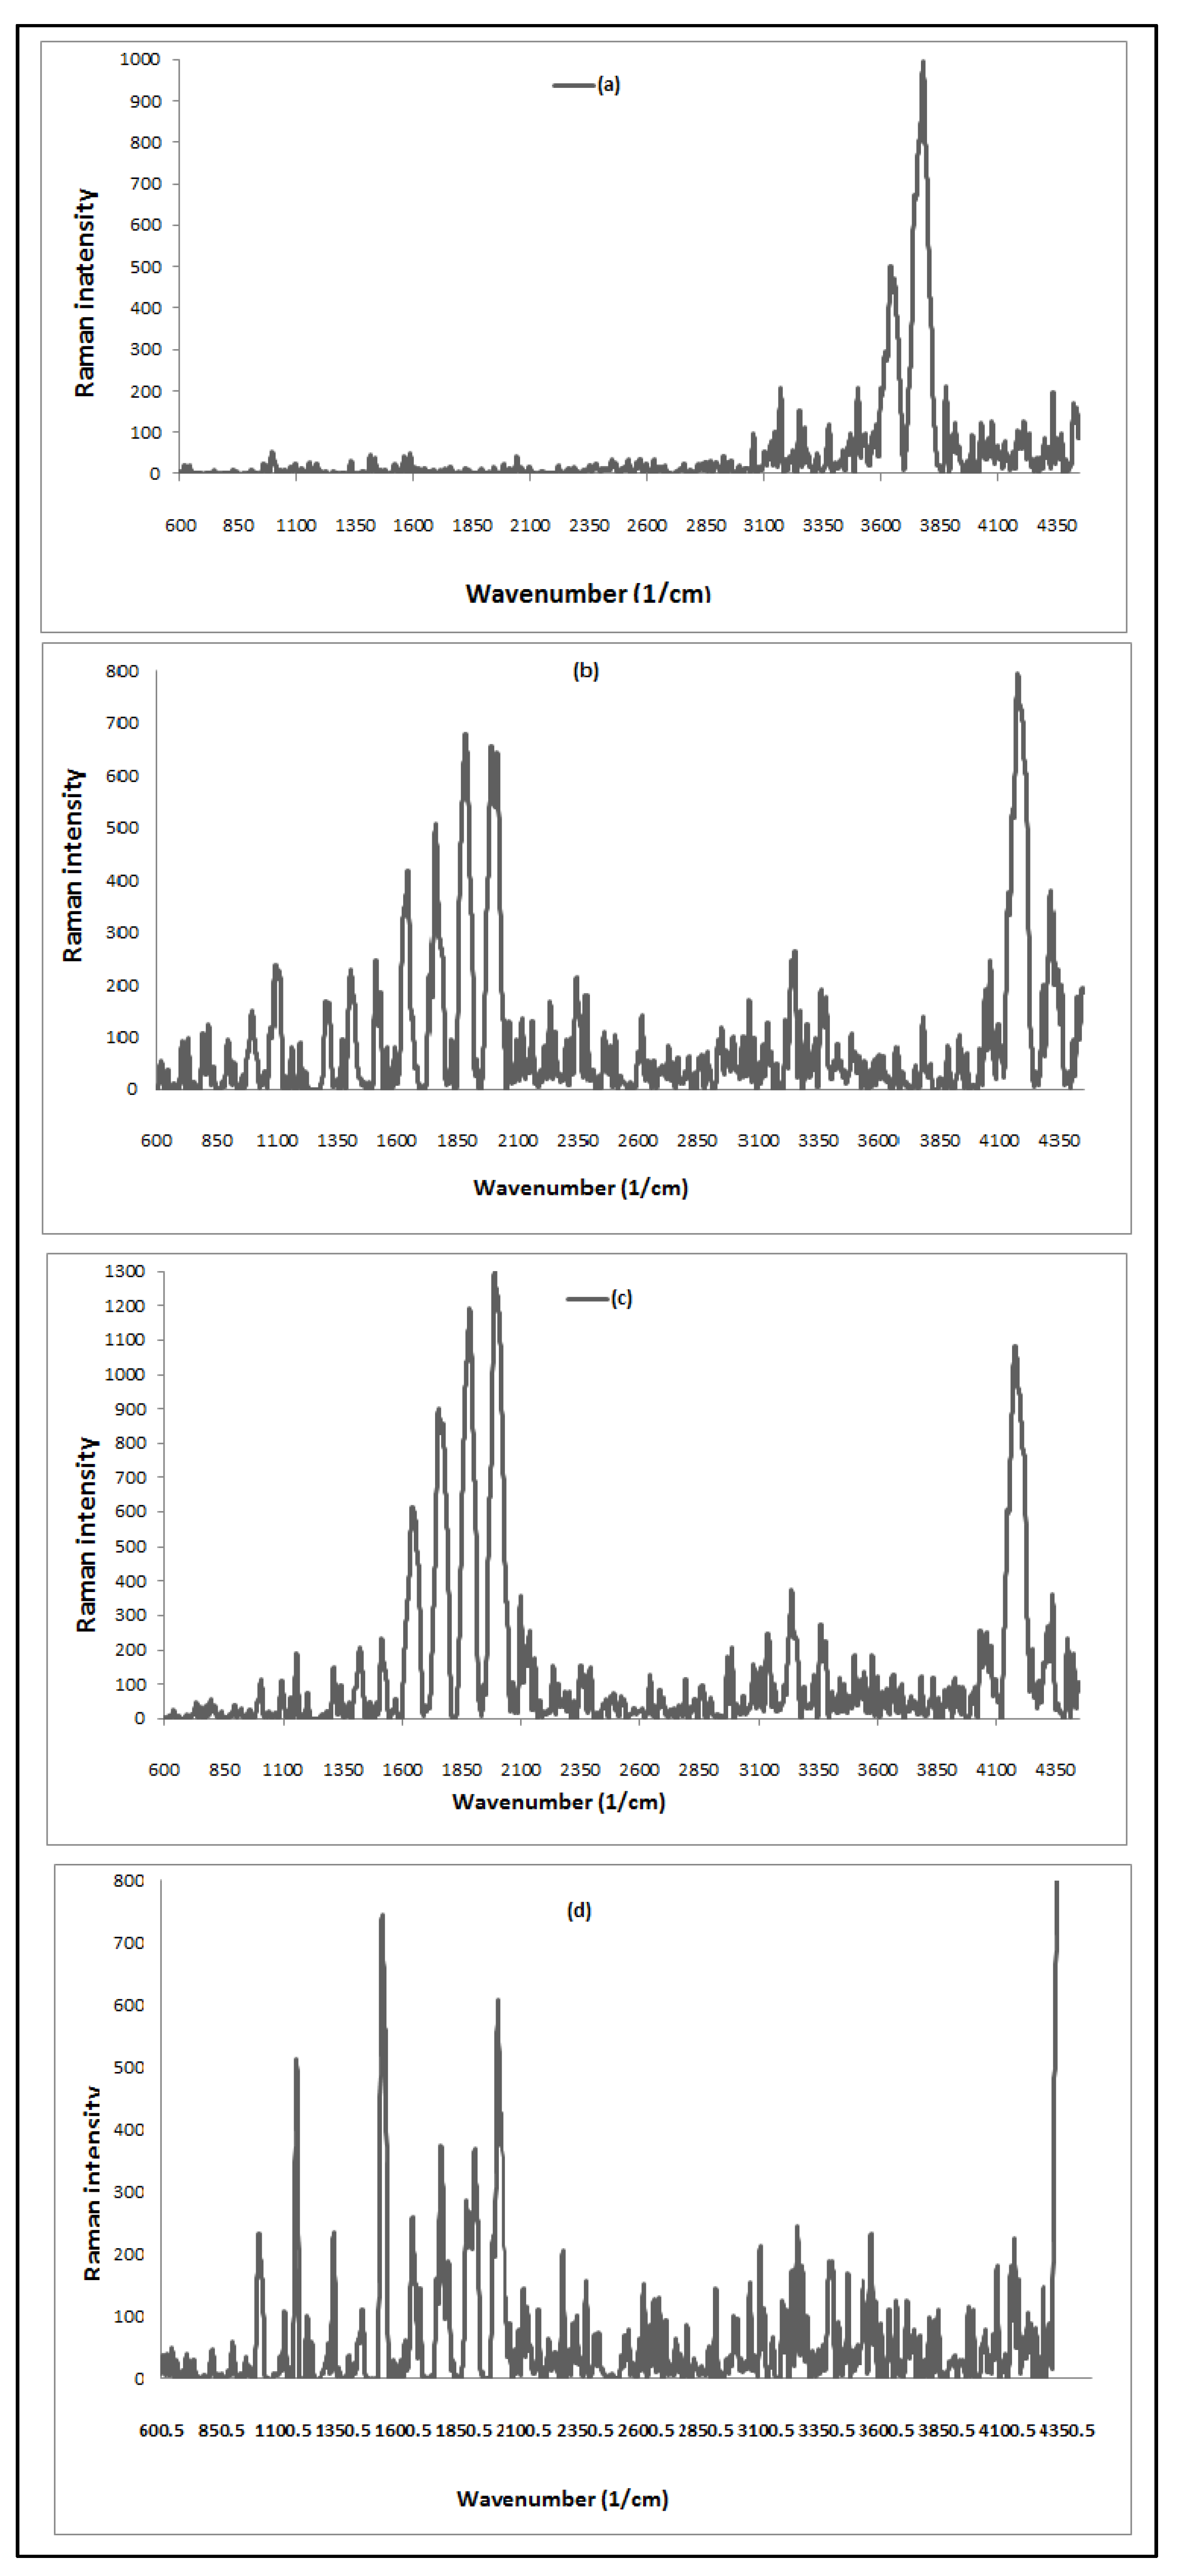
3.1.2. Raman Spectral Analysis
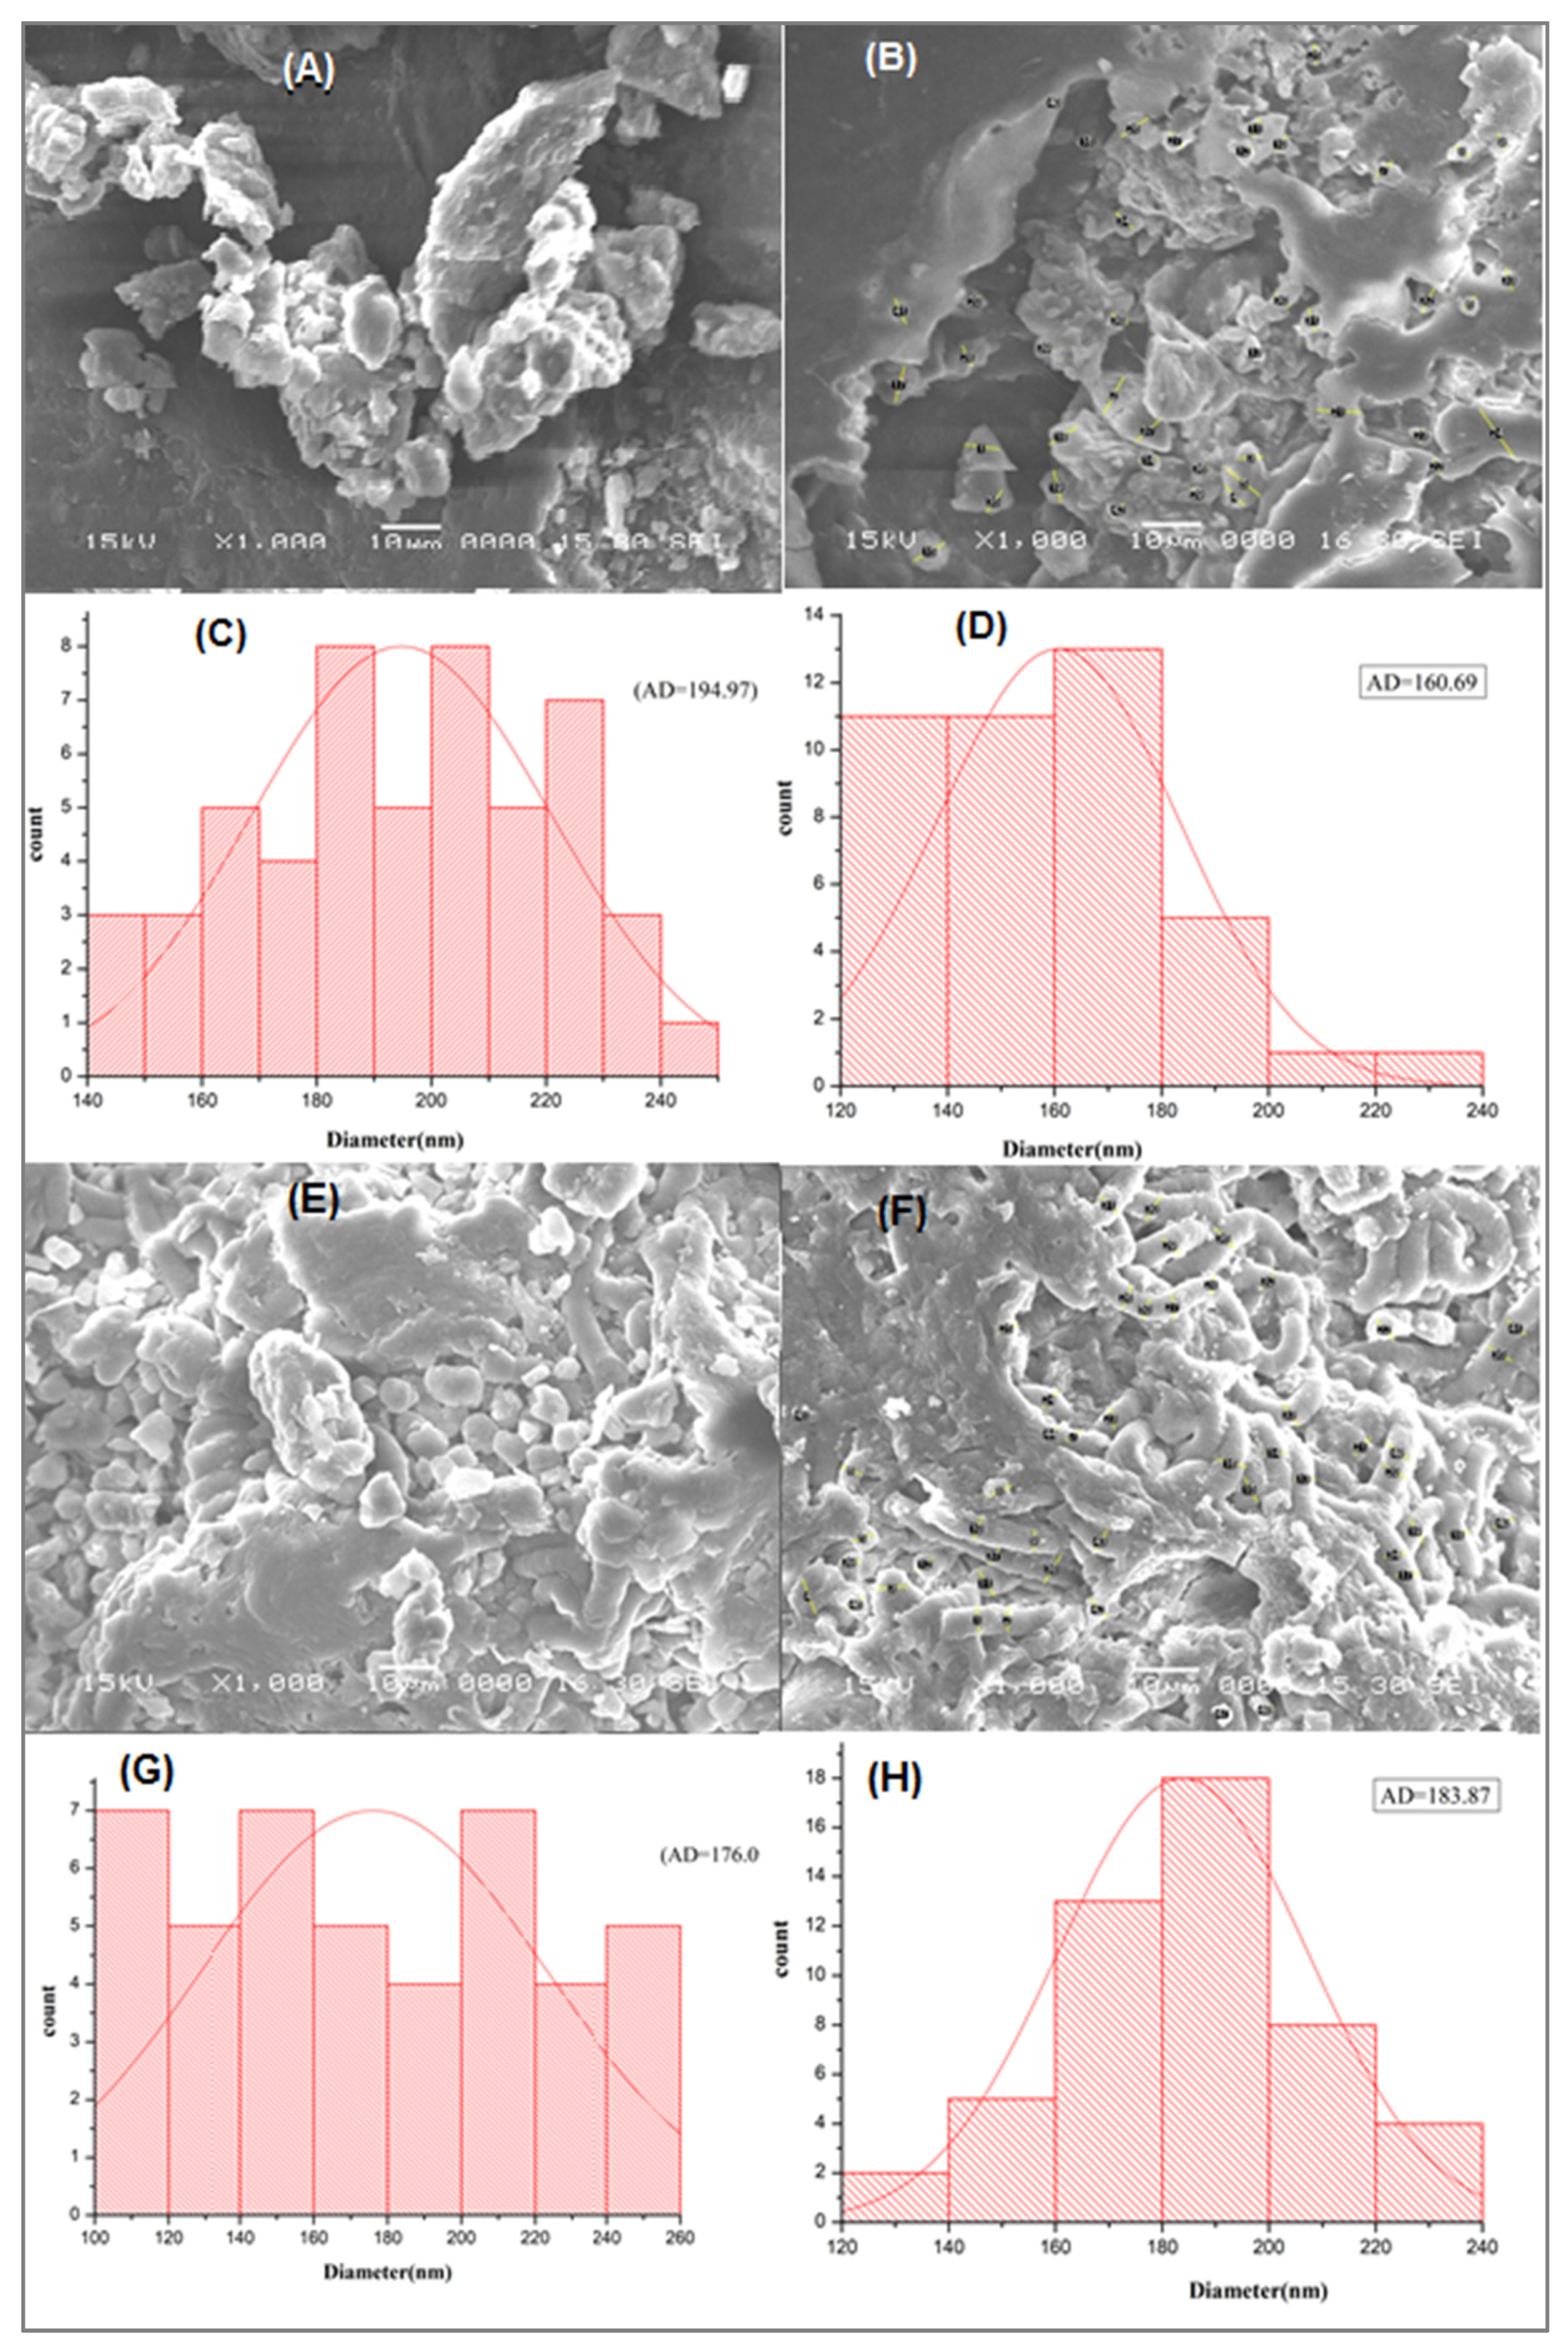
3.1.3. Scanning Electron Microscope
3.2. Influence of Operational Parameters on Adsorption
3.2.1. Adsorbent Dosage
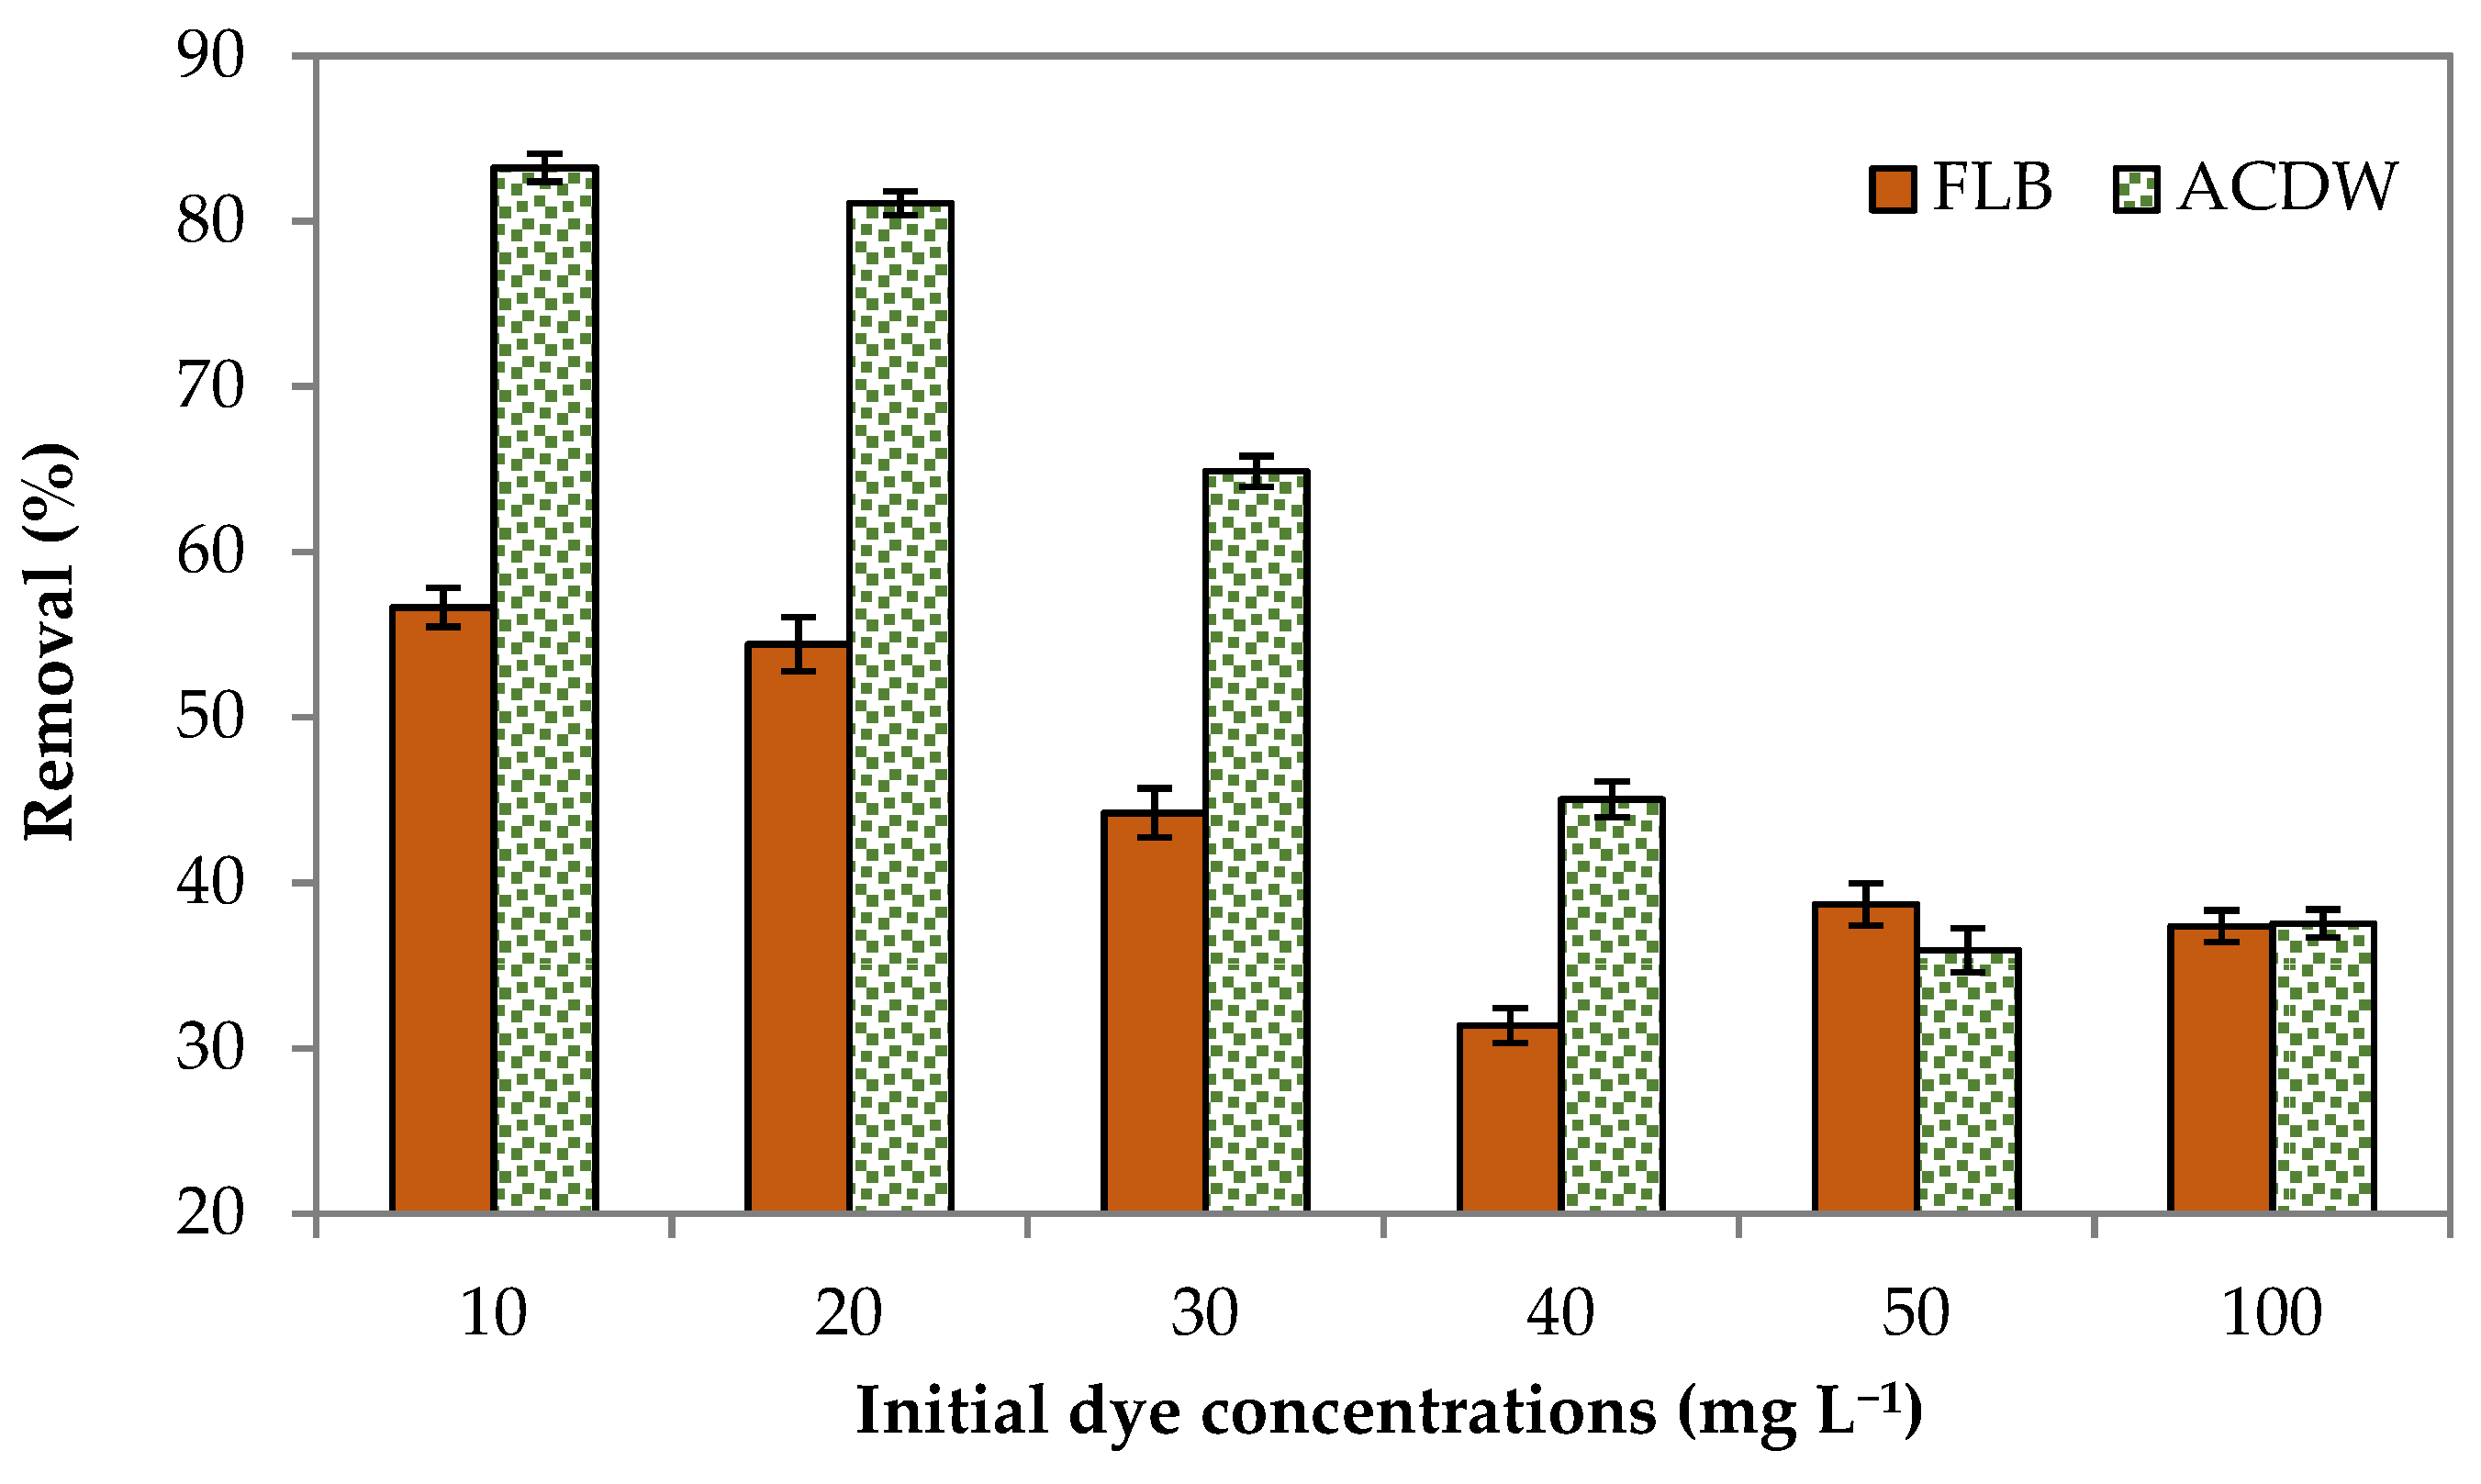
3.2.2. Initial Dye Concentration
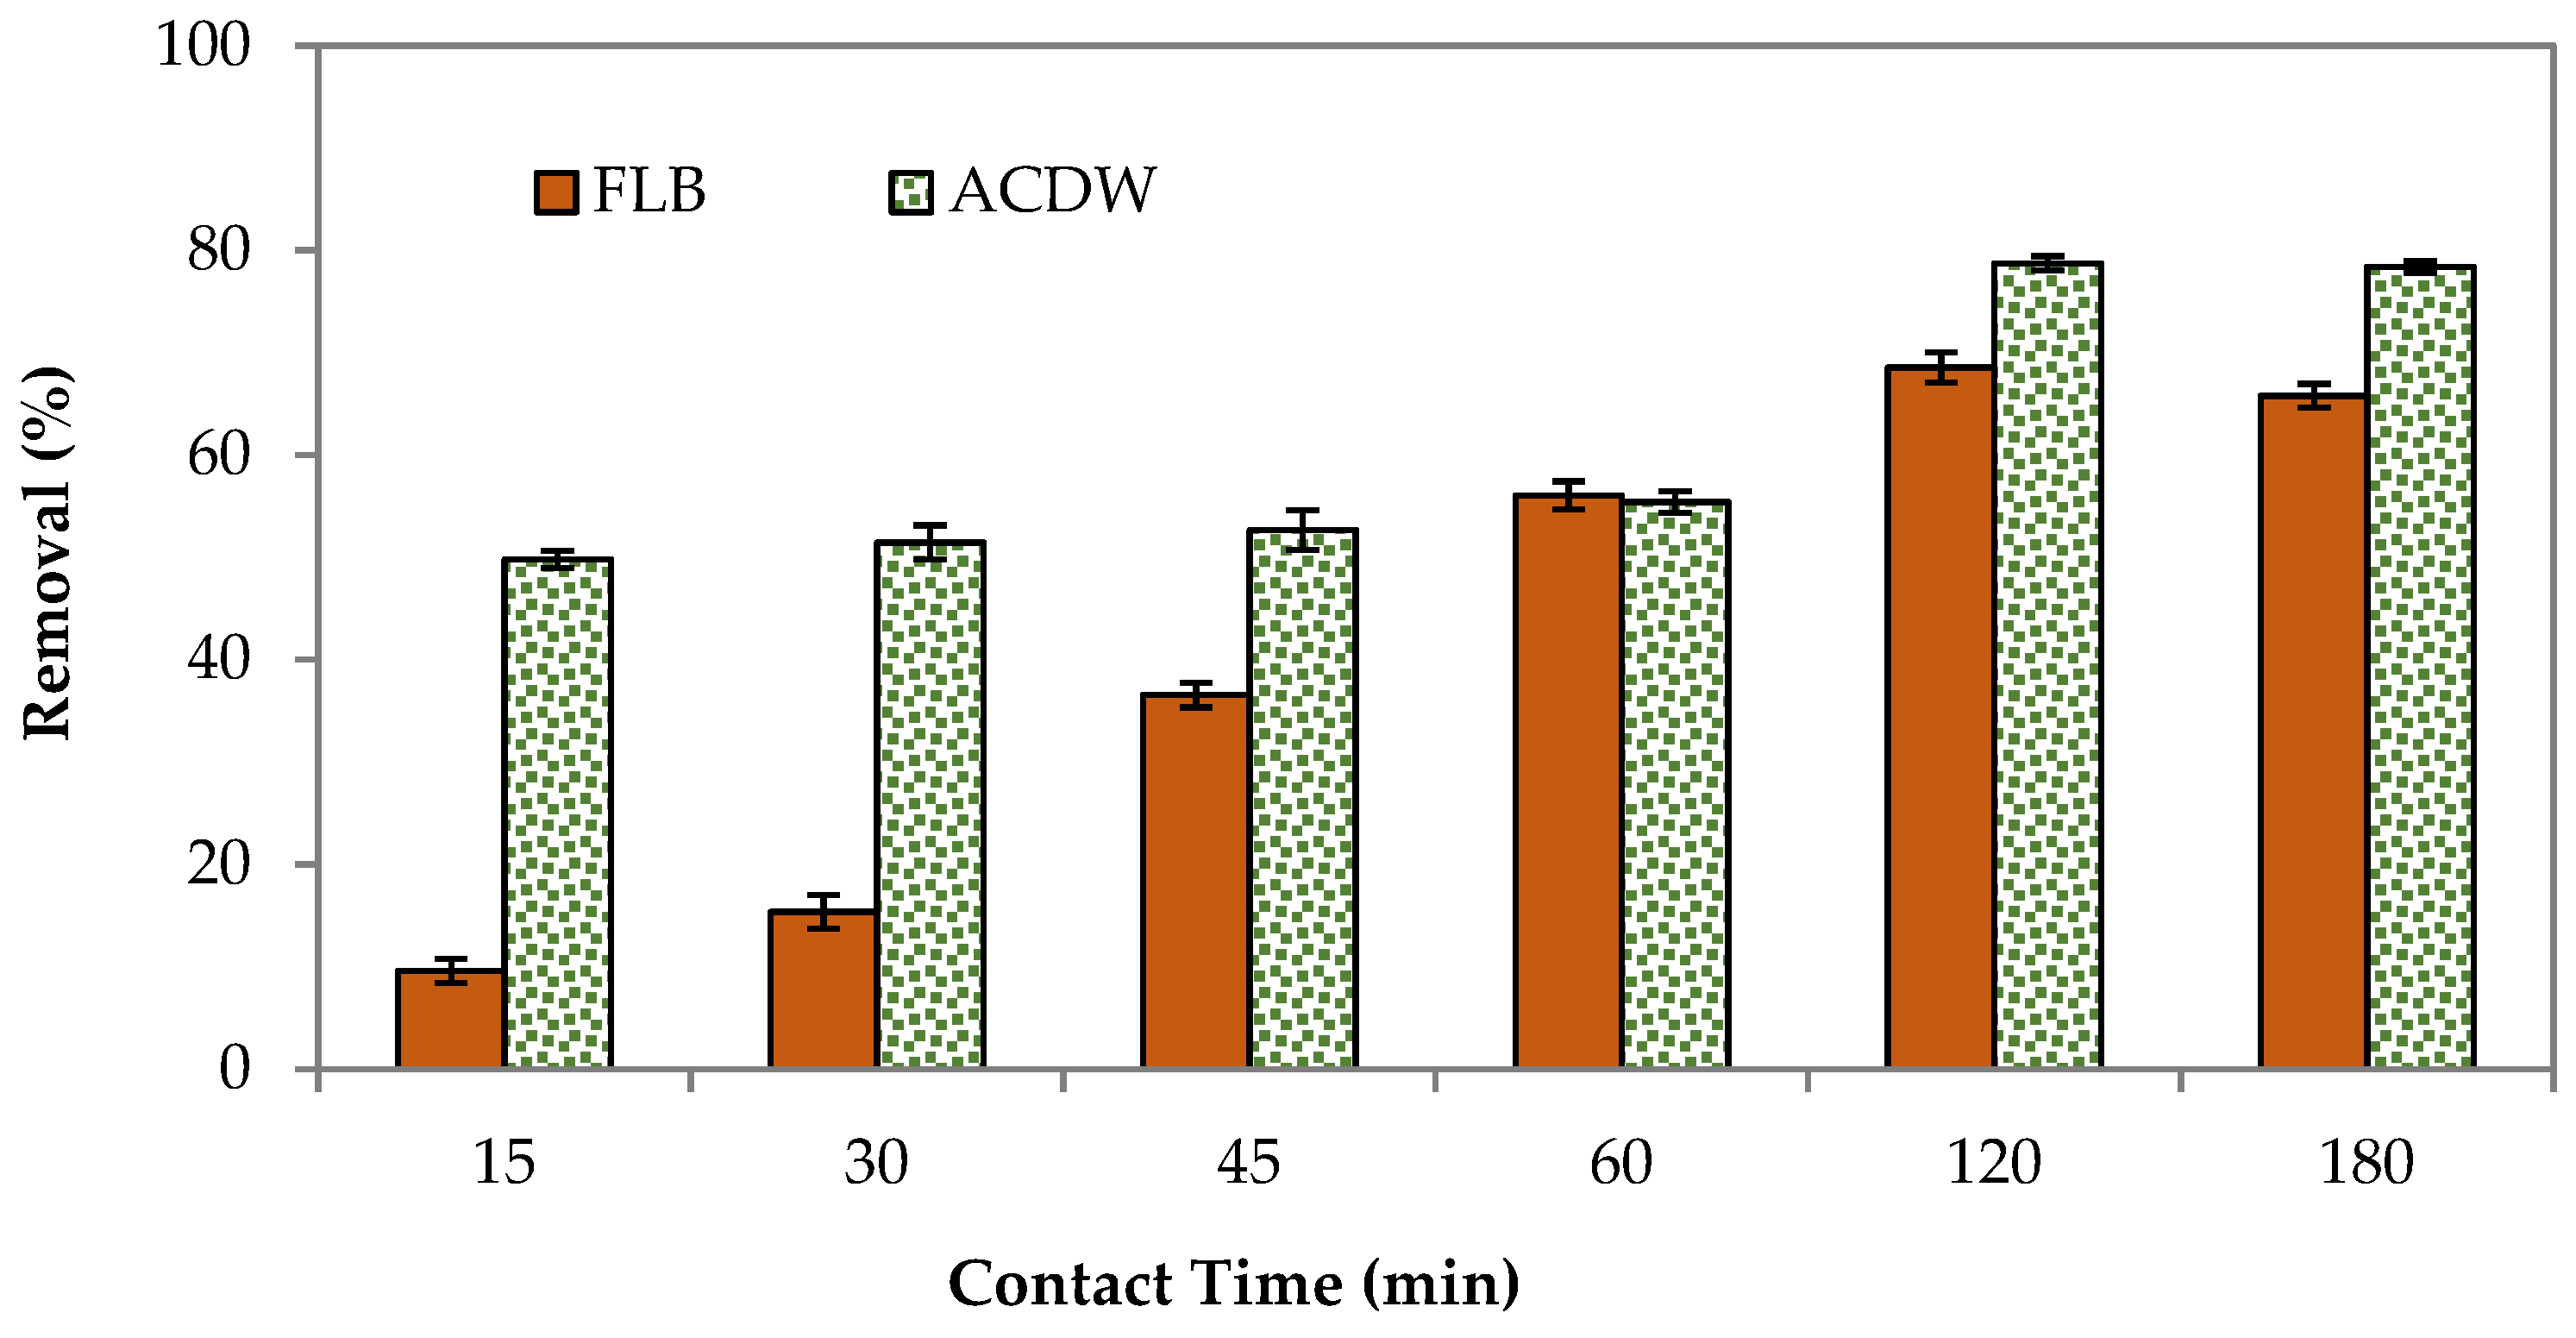
3.2.3. Contact Time mg L−1
3.2.4. pH Value
3.2.5. Adsorption Isotherm
3.2.6. Applicability on Actual Wastewater
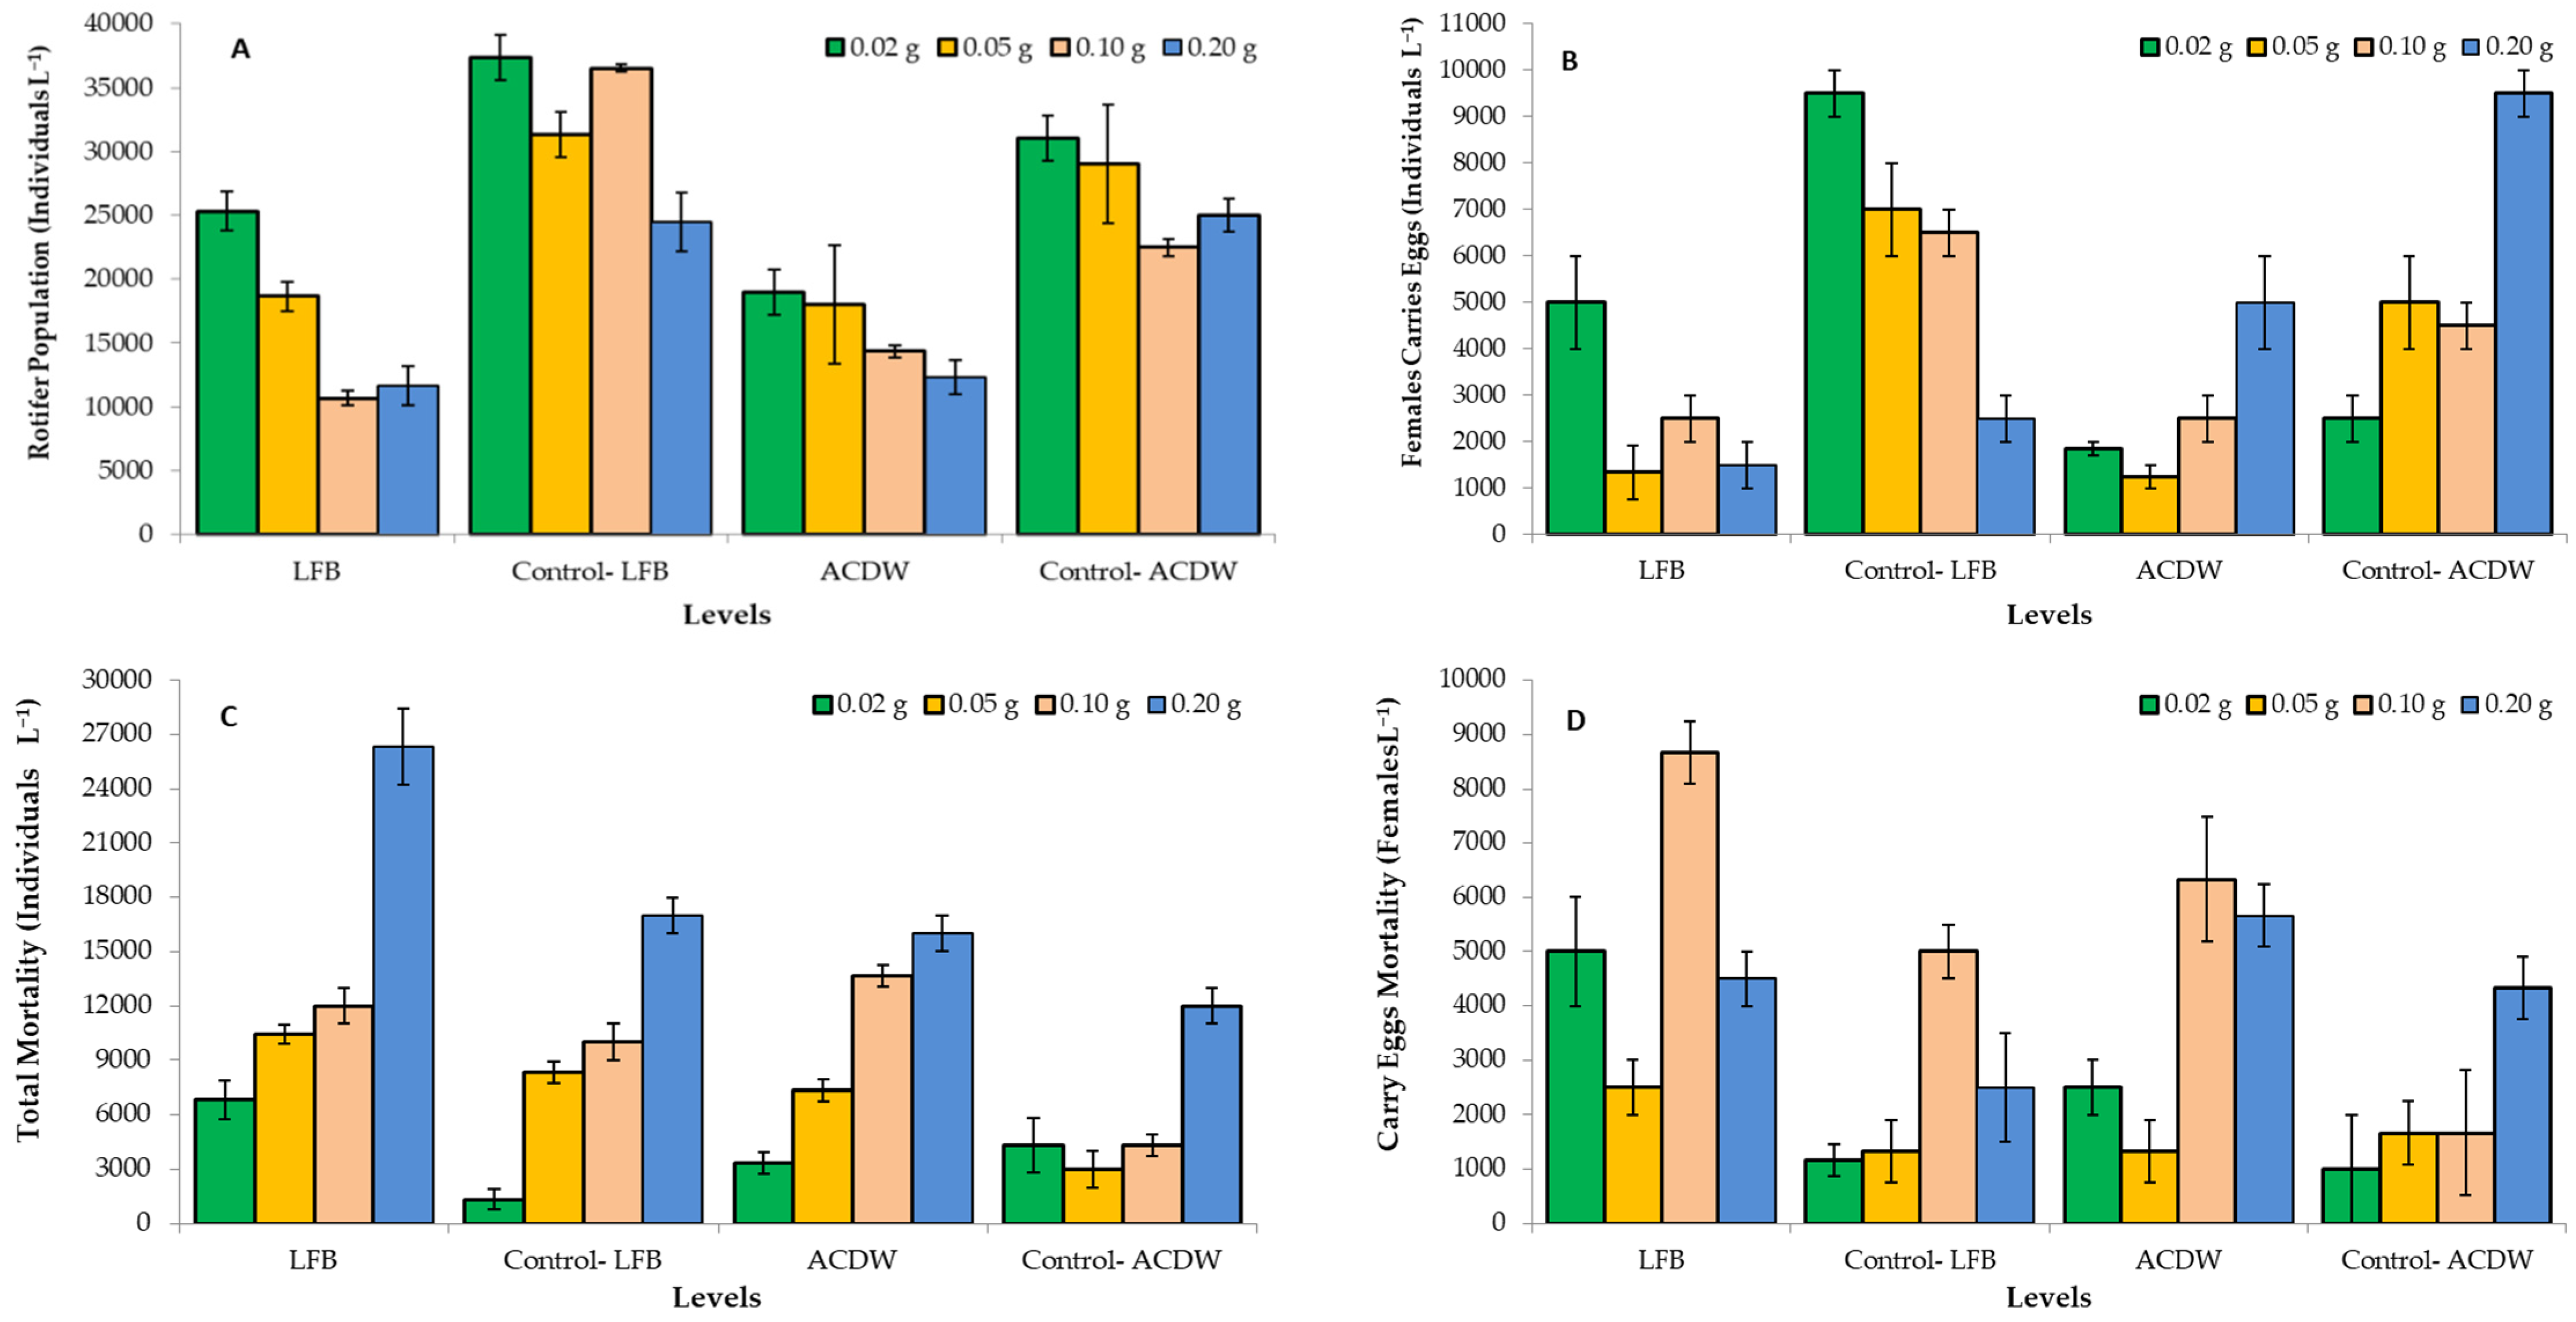
3.3. Rotifer Bioassay
4. Conclusions
Author Contributions
Funding
Institutional Review Board Statement
Informed Consent Statement
Data Availability Statement
Acknowledgments
Conflicts of Interest
References
- Heneash, A.M.; Alprol, A.E.; Abd El-Hamid, H.T.; Khater, M.; El Damhogy, K.A. Assessment of water pollution induced by anthropogenic activities on zooplankton community in Mariout Lake using statistical simulation. Arab. J. Geosci. 2021, 14, 641. [Google Scholar] [CrossRef]
- Calvete, T.; Lima, E.C.; Cardoso, N.F.; Dias, S.L.P.; Pavan, F.A. Application of carbon adsorbents prepared from the Brazilian pine-fruit-shell for the removal of Procion Red MX 3B from aqueous solution—Kinetic, equilibrium, and thermodynamic studies. Chem. Eng. J. 2009, 155, 627–636. [Google Scholar] [CrossRef]
- Cardoso, N.F.; Pinto, R.B.; Lima, E.C.; Calvete, T.; Amavisca, C.V.; Royer, B.; Cunha, M.L.; Fernandes, T.H.M.; Pinto, I.S. Removal of remazol black B textile dye from aqueous solution by adsorption. Desalination 2011, 269, 92–103. [Google Scholar] [CrossRef]
- Mondal, P.; Baksi, S.; Bose, D. Study of Environmental Issues in Textile Industries and Recent Wastewater Treatment Technology. World Sci. News 2017, 61, 98–109. [Google Scholar]
- National Environmental Agency. Allowable Limits for Trade Effluent Discharge to Watercourse or Controlled Watercourse. Available online: https://www.nea.gov.sg/our-services/pollution-control/water-quality/allowable-limits-for-trade-effluent-discharge-to-watercourse-or-controlled-watercourse (accessed on 25 July 2021).
- Kannan, R.R.; Rajasimman, M.; Rajamohan, N.; Sivaprakash, B. Brown marine algae Turbinaria conoides as biosorpent for Malachite green removal: Equilibrium and kinetic modelling. Front. Environ. Sci. Engin. China 2010, 4, 16–122. [Google Scholar]
- Min, S.K.; Kim, W.Y.; Cho, Y.; Kim, K.S. Fast DNA sequencing with a graphene-based nanochannel device. Nat. Nanotechnol. 2011, 6, 162–165. [Google Scholar] [CrossRef]
- Abualnaja, K.M.; Alprol, A.E.; Abu-Saied, M.A.; Mansour, A.T.; Ashour, M. Studying the Adsorptive Behavior of Poly (Acrylonitrile-co-Styrene) and Carbon Nanotubes (Nanocomposites) Impregnated with Adsorbent Materials towards Methyl Orange Dye. Nanomaterials 2021, 11, 1144. [Google Scholar] [CrossRef]
- Dotto, G.L.; Lima, E.C.; Pinto, L.A.A. Biosorption of food dyes onto Spirulina platensis nanoparticles: Equilibrium isotherm and thermodynamic analysis. Bioresour. Technol. 2012, 103, 123–130. [Google Scholar] [CrossRef] [Green Version]
- Sharawy, Z.Z.; Ashour, M.; Abbas, E.; Ashry, O.; Helal, M.; Nazmi, H.; Kelany, M.; Kamel, A.; Hassaan, M.; Rossi, W.; et al. Effects of dietary marine microalgae, Tetraselmis suecica, on production, gene expression, protein markers and bacterial count of Pacific white shrimp Litopenaeus vannamei. Aquac. Res. 2020, 51, 2216–2228. [Google Scholar] [CrossRef]
- Ashour, M.; Mabrouk, M.; Abo-Taleb, H.A.; Sharawy, Z.Z.; Ayoub, H.F.; Van Doan, H.; Davies, S.J.; El-Haroun, E.; Goda, A.A. A liquid seaweed extract (TAM®) improves aqueous rearing environment, diversity of zooplankton community, whilst enhancing growth and immune response of Nile tilapia, Oreochromis niloticus, challenged by Aeromonas hydrophila. Aquaculture 2021, 543, 736915. [Google Scholar] [CrossRef]
- Hassan, S.M.; Ashour, M.; Soliman, A.A.F.; Hassanien, H.A.; Alsanie, W.F.; Gaber, A.; Elshobary, M.E. The Potential of a New Commercial Seaweed Extract in Stimulating Morpho-Agronomic and Bioactive Properties of Eruca vesicaria (L.) Cav. Sustainability 2021, 13, 4485. [Google Scholar] [CrossRef]
- El-Shenody, R.A.; Ashour, M.; Ghobara, M.M.E. Evaluating the chemical composition and antioxidant activity of three Egyptian seaweeds: Dictyota dichotoma, Turbinaria decurrens, and Laurencia obtusa. Braz. J. Food Technol. 2019, 22. [Google Scholar] [CrossRef] [Green Version]
- Shao, W.; Ebaid, R.; El-Sheekh, M.; Abomohra, A.; Eladel, H. Pharmaceutical applications and consequent environmental impacts of Spirulina (Arthrospira): An overview. Grasas Aceites 2019, 70, 292. [Google Scholar] [CrossRef] [Green Version]
- Elshobary, M.E.; El-Shenody, R.A.; Ashour, M.; Zabed, H.M.; Qi, X. Antimicrobial and antioxidant characterization of bioactive components from Chlorococcum minutum. Food Biosci. 2020, 35, 100567. [Google Scholar] [CrossRef]
- Barra, L.; Chandrasekaran, R.; Corato, F.; Brunet, C. The challenge of ecophysiological biodiversity for biotechnological applications of marine microalgae. Mar. Drugs 2014, 12, 1641–1675. [Google Scholar] [CrossRef] [PubMed]
- Han, S.; Jin, W.; Chen, Y.; Tu, R.; Abomohra, A.E.-F. Enhancement of lipid production of Chlorella pyrenoidosa cultivated in municipal wastewater by magnetic treatment. Appl. Biochem. Biotechnol. 2016, 180, 1043–1055. [Google Scholar] [CrossRef] [PubMed]
- Abomohra, A.E.-F.; Eladel, H.; El-Esawi, M.; Wang, S.; Wang, Q.; He, Z.; Feng, Y.; Shang, H.; Hanelt, D. Effect of lipid-free microalgal biomass and waste glycerol on growth and lipid production of Scenedesmus obliquus: Innovative waste recycling for extraordinary lipid production. Bioresour. Technol. 2018, 249, 992–999. [Google Scholar] [CrossRef] [PubMed]
- Ashour, M.; Elshobary, M.E.; El-Shenody, R.; Kamil, A.W.; Abomohra, A.E.F. Evaluation of a native oleaginous marine microalga Nannochloropsis oceanica for dual use in biodiesel production and aquaculture feed. Biomass Bioenergy 2019, 120, 439–447. [Google Scholar] [CrossRef]
- Abomohra, A.E.-F.; Sheikh, H.M.A.; El-Naggar, A.H.; Wang, Q. Microwave vacuum co-pyrolysis of waste plastic and seaweeds for enhanced crude bio-oil recovery: Experimental and feasibility study towards industrialization. Renew. Sustain. Energy Rev. 2021, 149, 111335. [Google Scholar] [CrossRef]
- Abomohra, A.E.-F.; Zheng, X.; Wang, Q.; Huang, J.; Ebaid, R. Enhancement of biodiesel yield and characteristics through in-situ solvo-thermal co-transesterification of wet microalgae with spent coffee grounds. Bioresour. Technol. 2021, 323, 124640. [Google Scholar] [CrossRef] [PubMed]
- Zaki, M.A.; Ashour, M.; Heneash, A.M.M.; Mabrouk, M.M.; Alprol, A.E.; Khairy, H.M.; Nour, A.M.; Mansour, A.T.; Hassanien, H.A.; Gaber, A. Potential Applications of Native Cyanobacterium Isolate (Arthrospira platensis NIOF17/003) for Biodiesel Production and Utilization of Its Byproduct in Marine Rotifer (Brachionus plicatilis) Production. Sustainability 2021, 13, 1769. [Google Scholar] [CrossRef]
- FAO. The State of World Fisheries and Aquaculture 2018—Meeting the Sustainable Development Goals; FAO: Rome, Italy, 2018; pp. 1–277. [Google Scholar]
- Heneash, A.M.M.; Alprol, A.E. Monitoring of Water Quality and Zooplankton Community in Presence of Different Dietary Levels of Commercial Wood Charcoal of Red Tilapia. J. Aqua. Res. Dev. 2020, 11, 592. [Google Scholar] [CrossRef]
- Abomohra, A.E.-F.; El-Sheekh, M.; Hanelt, D. Pilot cultivation of the chlorophyte microalga Scenedesmus obliquus as a promising feedstock for biofuel. Biomass Bioenergy 2014, 64, 237–244. [Google Scholar] [CrossRef]
- Ghoneim, M.M.; El-Desoky, H.S.; El-Moselhy, K.M.; Amer, A.; Abou El-Naga, E.H.; Mohamedein, L.I.; Al-Prol, A.E. Removal of cadmium from aqueous solution using marine green algae, Ulva lactuca. Egypt. J. Aquat. Res. 2014, 40, 235–242. [Google Scholar] [CrossRef] [Green Version]
- Abd El-Mohdy, H.L.; Mostafa, T.B. Synthesis of Polyvinyl Alcohol/Maleic Acid Hydrogels by Electron Beam Irradiation for Dye Uptake. J. Macromol. Sci. 2013, 50, 6–17. [Google Scholar] [CrossRef]
- Abualnaja, K.M.; Alprol, A.E.; Ashour, M.; Mansour, A.T. Influencing Multi-Walled Carbon Nanotubes for the Removal of Ismate Violet 2R Dye from Wastewater: Isotherm, Kinetics, and Thermodynamic Studies. Appl. Sci. 2021, 11, 4786. [Google Scholar] [CrossRef]
- Parvin, M. Adsorption of Dyes on Activated Carbon from Agricultural Wastes; United Arab Emirates University: Anaien, United Arab Emirates, 2015. [Google Scholar]
- Ludwig, G.M.; Perschbacher, P.; Edziyie, R.; No, S. The effect of the dye Aquashade® on water quality, phytoplankton, zooplankton, and sunshine bass, Morone chrysops× M. saxatilis, fingerling production in fertilized culture ponds. J. World Aquac. Soc. 2010, 41, 40–48. [Google Scholar] [CrossRef]
- Ushakumary, E.R. Waste Water Treatment Using Low Cost Natural Adsorbents. Ph.D. Thesis, Cochin University of Science and Technology Kochi, Kerala, India, April 2013. [Google Scholar]
- Langmuir, I. The constitution and fundamental properties of solids and liquids. Part II.-Liquids. J. Am. Chem. Soc. 1917, 39, 1848–1906. [Google Scholar] [CrossRef] [Green Version]
- Freundlich, H. Über die Adsorption in Lösungen. Habilitationsschrift Durch Welche... zu Haltenden Probevorlesung “Kapillarchemie und Physiologie” Einladet Dr. Herbert Freundlich; Wilhelm Engelmann: Leipzig, Germany, 1906. [Google Scholar]
- Dada, A.O.; Olalekan, A.P.; Olatunya, A.M.; DADA, O. Langmuir, Freundlich, Temkin and Dubinin–Radushkevich Isotherms Studies of Equilibrium Sorption of Zn 2+ Unto Phosphoric Acid Modified Rice Husk. IOSR J. Appl. Chem. 2012, 3, 38–45. [Google Scholar] [CrossRef]
- McKay, G.; Blair, H.S.; Gardner, J.R. Adsorption of dyes on chitin. I. Equilibrium studies. J. Appl. Polym. Sci. 1982, 27, 3043–3057. [Google Scholar] [CrossRef]
- Abinandan, S.; Subashchandrabose, S.R.; Pannerselvan, L. Bioresource Technology Potential of acid-tolerant microalgae, Desmodesmus sp. MAS1 and Heterochlorella sp. MAS3, in heavy metal removal and biodiesel production at acidic pH. Bioresour. Technol. 2019, 278, 9–16. [Google Scholar] [CrossRef] [PubMed]
- Özacar, M.; Şengil, I.A. Adsorption of reactive dyes on calcined alunite from aqueous solutions. J. Hazard. Mater. 2003, 98, 211–224. [Google Scholar] [CrossRef]
- Chandía, N.P.; Matsuhiro, B. Characterization of a fucoidan from Lessonia vadosa (Phaeophyta) and its anticoagulant and elicitor properties. Int. J. Biol. Macromol. 2008, 42, 235–240. [Google Scholar] [CrossRef] [PubMed]
- Swaminathan, S.; Muthumanickkam, A.; Imayathamizhan, N.M. An effective removal of methylene blue dye using polyacrylonitrile yarn waste/graphene oxide nanofibrous composite. Int. J. Environ. Sci. Technol. 2015, 12, 3499–3508. [Google Scholar] [CrossRef] [Green Version]
- Abualnaja, K.M.; Alprol, A.E.; Ashour, M. Removing of Anionic Dye from Aqueous Solutions by Adsorption Using of Multiwalled Carbon Nanotubes and Poly (Acrylonitrile-styrene) Impregnated with Activated Carbon. Sustainability 2021, 13, 7077. [Google Scholar] [CrossRef]
- Jebapriya, G.R.; Gnanadoss, J.J. Bioremediation of textile dye using white rot fungi: A Review. Int. J. Curr. Res. Rev. 2013, 5, 1–12. [Google Scholar]
- Kareem, A.; Alrazak, N.A.; Aljebori, K.H.; Aljeboree, A.M.; Algboory, H.L.; Alkaim, A.F. Removal of methylene blue dye from aqueous solutions by using activated carbon/ureaformaldehyde composite resin as an adsorbent. Int. J. Chem. Sci. 2016, 14, 635–648. [Google Scholar]
- Ali, D. Single and Binary Adsorption of Reactive Blue and Red Dyes Onto Activated Carbon. Int. J. Eng. Innov. Res. 2014, 3, 642–649. [Google Scholar]
- Prol, A.; Azzem, M.; Amer, A.; El-Metwally, M.; El-Hamid, H.; El–Moselhy, K. Adsorption of Cadmium (II) Ions (II) from Aqueous Solution onto Mango Leaves. Asian J. Phys. Chem. Sci. 2017, 2, 1–11. [Google Scholar] [CrossRef]
- Aksu, Z.; Tezer, S. Biosorption of reactive dyes on the green alga Chlorella vulgaris. Process. Biochem. 2005, 40, 1347–1361. [Google Scholar] [CrossRef]
- Abomohra, A.E.-F.; El-Hefnawy, M.E.; Wang, Q.; Huang, J.; Li, L.; Tang, J.; Mohammed, S. Sequential bioethanol and biogas production coupled with heavy metal removal using dry seaweeds: Towards enhanced economic feasibility. J. Clean. Prod. 2021, 316, 128341. [Google Scholar] [CrossRef]
- Ashour, M.; El-Shafei, A.A.; Khairy, H.M.; Abd-Elkader, D.Y.; Mattar, M.A.; Alataway, A.; Hassan, S.M. Effect of Pterocladia capillacea Seaweed Extracts on Growth Parameters and Biochemical Constituents of Jew’s Mallow. Agronomy 2020, 10, 420. [Google Scholar] [CrossRef] [Green Version]
- Ashour, M.; Mabrouk, M.M.; Ayoub, H.F.; El-Feky, M.M.; Zaki, S.Z.; Hoseinifar, S.H.; Rossi, W.; Van Doan, H.; El-Haroun, E.; Goda, A.M.S. Effect of dietary seaweed extract supplementation on growth, feed utilization, hematological indices, and non-specific immunity of Nile Tilapia, Oreochromis niloticus challenged with Aeromonas hydrophila. J. Appl. Phycol. 2020, 32, 3467–3479. [Google Scholar] [CrossRef]
- Calvete, T.; Lima, E.C.; Cardoso, N.F.; Vaghetti, J.C.P.; Dias, S.L.P.; Pavan, F.A. Application of carbon adsorbents prepared from Brazilian-pine fruit shell for the removal of reactive orange 16 from aqueous solution: Kinetic, equilibrium, and thermodynamic studies. J. Environ. Manag. 2010, 91, 1695–1706. [Google Scholar] [CrossRef]
- Royer, B.; Cardoso, N.F.; Lima, E.C.; Macedo, T.R.; Airoldi, C. A useful organofunctionalized layered silicate for textile dye removal. J. Hazard. Mater. 2010, 181, 366–374. [Google Scholar] [CrossRef]
- Aksu, Z.; Tezer, S. Equilibrium and kinetic modelling of biosorption of Remazol black B by Rhizopus arrhizus in a batch system: Effect of temperature. Process. Biochem. 2000, 36, 431–439. [Google Scholar] [CrossRef]
- Aksu, Z.; Isoglu, I.A. Use of dried sugar beet pulp for binary biosorption of Gemazol Turquoise Blue-G reactive dye and copper(II) ions: Equilibrium modeling. Chem. Eng. J. 2007, 127, 177–188. [Google Scholar] [CrossRef]
- Dogar, Ç.; Gürses, A.; Açıkyıldız, M.; Özkan, E. Thermodynamics and kinetic studies of biosorption of a basic dye from aqueous solution using green algae Ulothrix sp. Colloids Surf. 2010, 76, 279–285. [Google Scholar] [CrossRef]
- Celekli, A.; İlgün, G.; Bozkurt, H. Sorption equilibrium, kinetic, thermodynamic, and desorption studies of Reactive Red 120 on Chara contraria. Chem. Eng. J. 2012, 191, 228–235. [Google Scholar] [CrossRef]
- Ergene, A.; Ada, K.; Tan, S.; Katırcıoğlu, H. Removal of Remazol Brilliant Blue R dye from aqueous solutions by adsorption onto immobilized Scenedesmus quadricauda: Equilibrium and kinetic modeling studies. Desalination 2009, 249, 1308–1314. [Google Scholar] [CrossRef]
- Celekli, A.; Tanrıverdi, B.; Bozkurt, H. Predictive modeling of removal of Lanaset Red G on Chara contraria; kinetic, equilibrium, and thermodynamic studies. Chem. Eng. J. 2011, 169, 166–172. [Google Scholar] [CrossRef]
- Mahmoud, A.S.; Ghaly, A.E.; Brooks, S.L. Influence of temperature and pH on the stability and colorimetric measurement of textile dyes. Am. J. Biochem. Biotechnol. 2007, 3, 33–41. [Google Scholar] [CrossRef] [Green Version]
- Carneiro, P.A.; Osugi, M.E.; Fugivara, C.S.; Boralle, N.; Furlan, M.; Zanoni, M.V.B. Evaluation of different electrochemical methods on the oxidation and degradation of Reactive Blue 4 in aqueous solution. Chemosphere 2005, 59, 431–439. [Google Scholar] [CrossRef] [PubMed]
- Nagendrappa, G. An epitome of K Venkataraman’s chemistry. Resonance 2004, 9, 45–51. [Google Scholar] [CrossRef] [Green Version]
- Al-Ghouti, M.A.; Khraisheh, M.A.M.; Allen, S.J.; Ahmed, M.N. The removal of dyes from textile wastewater: A study of physical characteristics and adsorption mechanisms of diatomaceous earth. J. Environ. Manag. 2003, 69, 230–237. [Google Scholar] [CrossRef] [PubMed]
- Al Prol, A.E. Study of Environmental Concerns of Dyes and Recent Textile Effluents Treatment Technology: A Review. Asian, J. Fish. Aquat. Res. 2019, 3, 1–18. [Google Scholar] [CrossRef]
- Halsey, G. Physical adsorption on non-uniform surfaces. J. Chem. Phys. 1948, 16, 931–937. [Google Scholar] [CrossRef]
- Gupta, V.K.; Rastogi, A. Biosorption of hexavalent chromium by raw and acid-treated green alga Oedogonium hatei from aqueous solutions. J. Hazard. Mater. 2009, 163, 396–402. [Google Scholar] [CrossRef]
- Suski, J.G.; Swan, C.M.; Salice, C.J.; Wahl, C.F. Effects of pond management on biodiversity patterns and community structure of zooplankton in urban environments Science of the Total Environment Effects of pond management on biodiversity patterns and community structure of zooplankton in urban environme. Sci. Total Environ. 2018, 619–620, 1441–1450. [Google Scholar] [CrossRef] [PubMed]
- Verma, A.K.; Choudhary, A. Effect of heavy metal toxicity on Zooplankton population based on dyes and printing industries in Jodhpur (Rajasthan). Biolife 2017, 5, 69–73. [Google Scholar] [CrossRef]


| Characteristics | Value |
|---|---|
| Dye name (a common name) | Ismate violet 2R |
| Wavelength (λ max) | 550 nm |
| Mol. wt. | 700 |
| Molecular formula | C22H14N4O11S3CuCl |
| Color Index name | IV2R |
| Molecular structure | 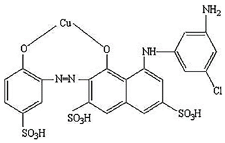 |
| ACDB | LFB | ||
|---|---|---|---|
| Before Adsorption (cm−1) | After Adsorption (cm−1) | Before Adsorption (cm−1) | After Adsorption (cm−1) |
| 457.77 | 1034.97 | 448.73 | 1047.13 |
| 1032.15 | 1233.58 | 1029.56 | 1230.93 |
| 1239.13 | 1396.38 | 1233.22 | 1397.83 |
| 1396.98 | 1443.85 | 1391.72 | 1444.55 |
| 1540.10 | 1526.94 | 1446.89 | 1521.77 |
| 1635.36 | 1632.08 | 1527.21 | 1628.89 |
| 2917.13 | 2329.33 | 1628.75 | 2067.80 |
| 3273.47 | 2929.06 | 2921.64 | 2349.79 |
| 3730.69 | 3270.67 | 3269.13 | 2922 |
| - | 3734.47 | 3732.82 | 3271.80 |
| - | 3847.56 | - | 3735.70 |
| - | 3856.80 | ||
| Isotherm Model | Isotherm Parameter | Values | |
|---|---|---|---|
| ACDB | LFB | ||
| Freundlich | n | 0.668 | 0.837 |
| KF | 5.766 | 6.3 | |
| R2 | 0.856 | 0.988 | |
| Langmuir | qmax (mg g−1) | 14.70 | 9.90 |
| b | 0.129 | 0.023 | |
| R2 | 0.979 | 0.994 | |
| RL | 0.856 | 0.988 | |
| Tempkin | AT | 11.42 | 5.36 |
| BT | 0.143 | 0.098 | |
| bT | 0.195 | 0.284 | |
| R2 | 0.67 | 0.881 | |
| Halsey | 1/n | 1.49 | 1.19 |
| K | 1.75 | 1.84 | |
| R2 | 0.856 | 0.989 | |
| Model | 1st-Order Kinetic Model | 2nd-Order Kinetic Model | Intraparticle Diffusion Model | ||||||
|---|---|---|---|---|---|---|---|---|---|
| Parameters | qe (calc.) (mg g−1) | k1 (1 min−1) | R2 | qe (calc.) (mg g−1) | k2 (mg g−1 min−1) | R2 | Kdif (mg g in−0.5) | C | R2 |
| ACDB | 13.18 | 0.012 | 0.11 | 0.105 | 0.426 | 0.980 | 0.0078 | 0.123 | 0.825 |
| LFB | 1.018 | 9.21 × 10⁻⁴ | 0.716 | 0.036 | 1.688 | 0.987 | 0.0043 | 0.039 | 0.891 |
| Types of Water | IV2R Removal (%) | |
|---|---|---|
| ACDB | LFB | |
| Industrial wastewater | 75.79 | 61.11 |
| Distilled water | 83.33 | 56.41 |
Publisher’s Note: MDPI stays neutral with regard to jurisdictional claims in published maps and institutional affiliations. |
© 2021 by the authors. Licensee MDPI, Basel, Switzerland. This article is an open access article distributed under the terms and conditions of the Creative Commons Attribution (CC BY) license (https://creativecommons.org/licenses/by/4.0/).
Share and Cite
Alprol, A.E.; Heneash, A.M.M.; Ashour, M.; Abualnaja, K.M.; Alhashmialameer, D.; Mansour, A.T.; Sharawy, Z.Z.; Abu-Saied, M.A.; Abomohra, A.E.-F. Potential Applications of Arthrospira platensis Lipid-Free Biomass in Bioremediation of Organic Dye from Industrial Textile Effluents and Its Influence on Marine Rotifer (Brachionus plicatilis). Materials 2021, 14, 4446. https://doi.org/10.3390/ma14164446
Alprol AE, Heneash AMM, Ashour M, Abualnaja KM, Alhashmialameer D, Mansour AT, Sharawy ZZ, Abu-Saied MA, Abomohra AE-F. Potential Applications of Arthrospira platensis Lipid-Free Biomass in Bioremediation of Organic Dye from Industrial Textile Effluents and Its Influence on Marine Rotifer (Brachionus plicatilis). Materials. 2021; 14(16):4446. https://doi.org/10.3390/ma14164446
Chicago/Turabian StyleAlprol, Ahmed E., Ahmed M. M. Heneash, Mohamed Ashour, Khamael M. Abualnaja, Dalal Alhashmialameer, Abdallah Tageldein Mansour, Zaki Z. Sharawy, Mouhamed A. Abu-Saied, and Abd El-Fatah Abomohra. 2021. "Potential Applications of Arthrospira platensis Lipid-Free Biomass in Bioremediation of Organic Dye from Industrial Textile Effluents and Its Influence on Marine Rotifer (Brachionus plicatilis)" Materials 14, no. 16: 4446. https://doi.org/10.3390/ma14164446
APA StyleAlprol, A. E., Heneash, A. M. M., Ashour, M., Abualnaja, K. M., Alhashmialameer, D., Mansour, A. T., Sharawy, Z. Z., Abu-Saied, M. A., & Abomohra, A. E.-F. (2021). Potential Applications of Arthrospira platensis Lipid-Free Biomass in Bioremediation of Organic Dye from Industrial Textile Effluents and Its Influence on Marine Rotifer (Brachionus plicatilis). Materials, 14(16), 4446. https://doi.org/10.3390/ma14164446