
Effect of Structural Differences on the Mechanical Properties of 3D Integrated Woven Spacer Sandwich Composites

Abstract
:1. Introduction
2. Materials and Methods
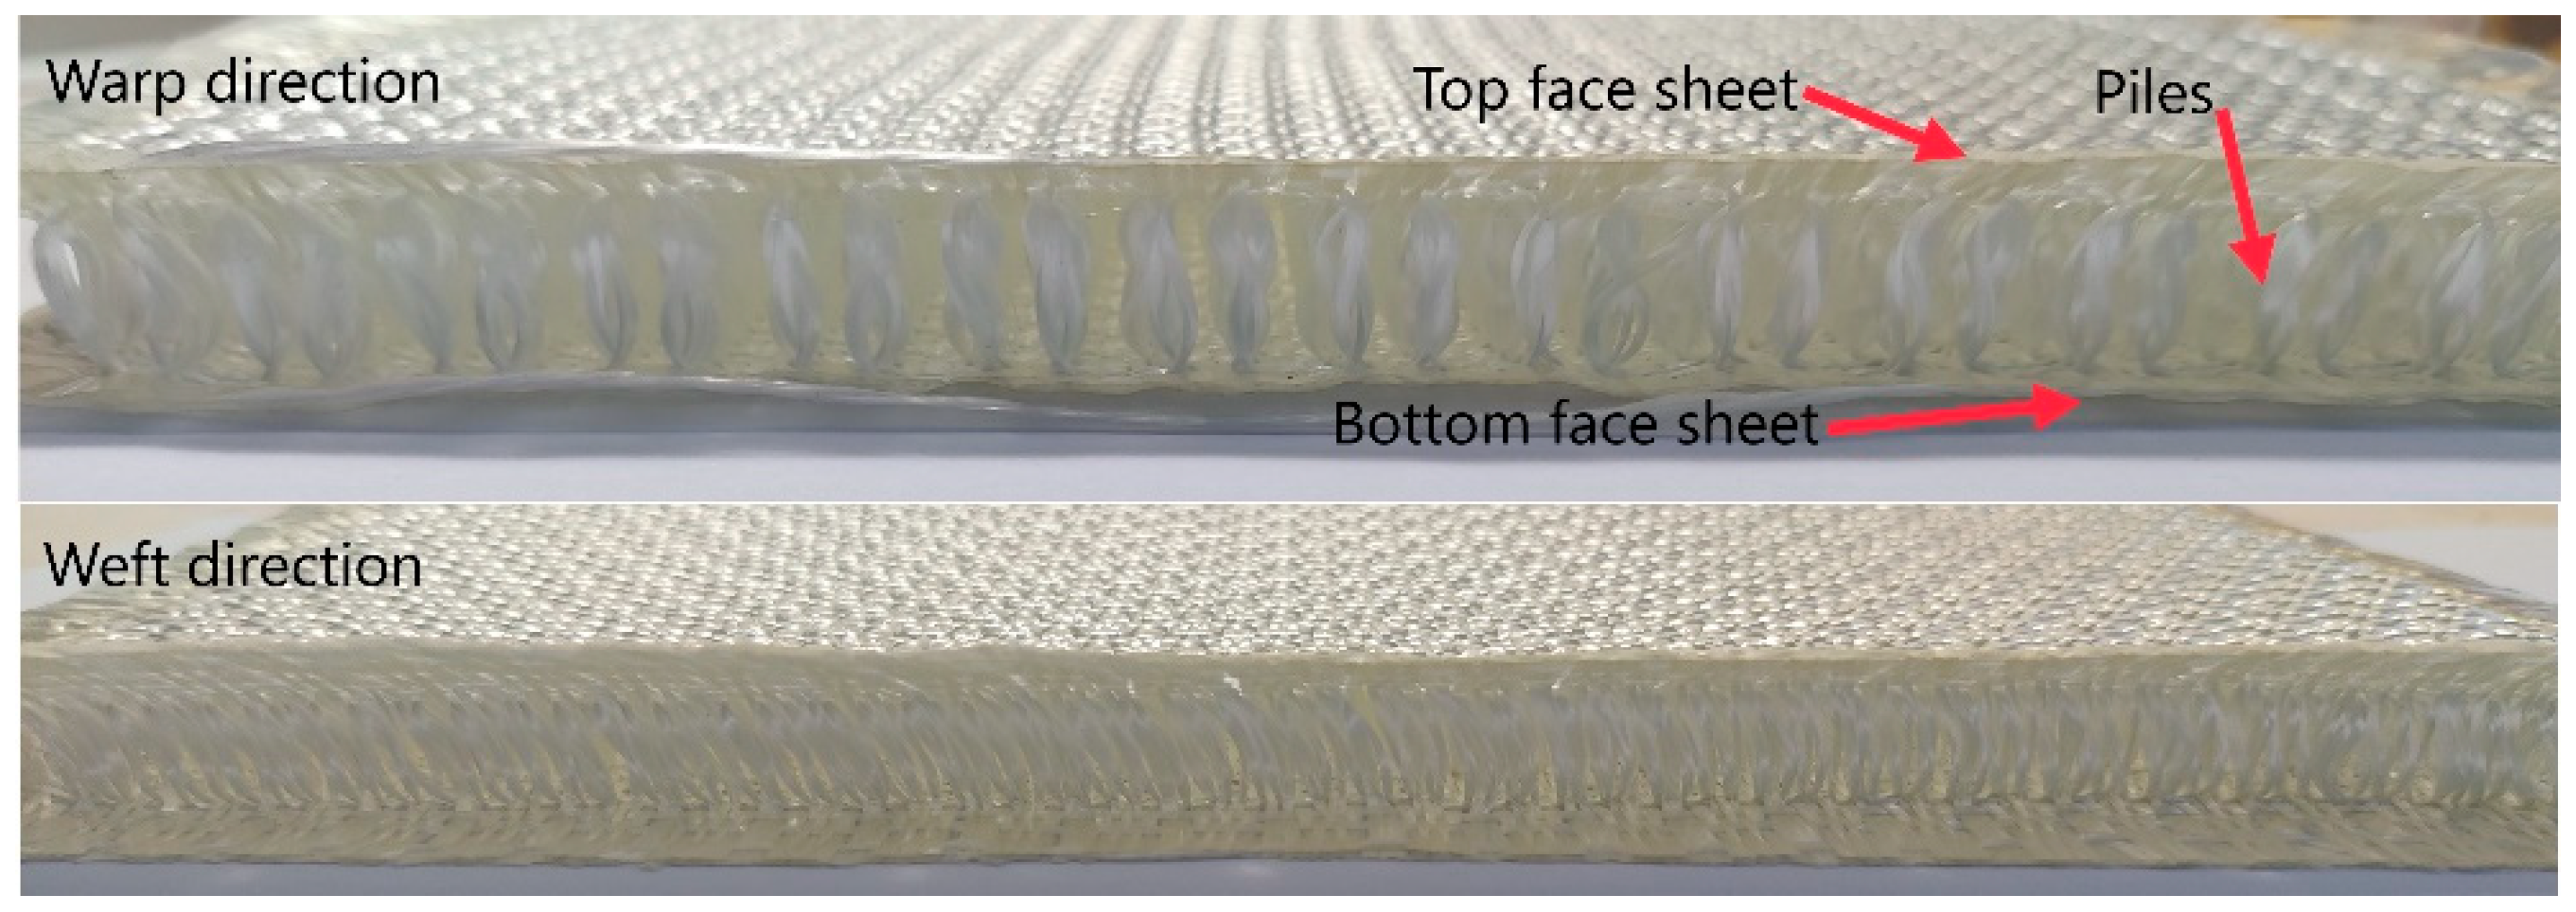
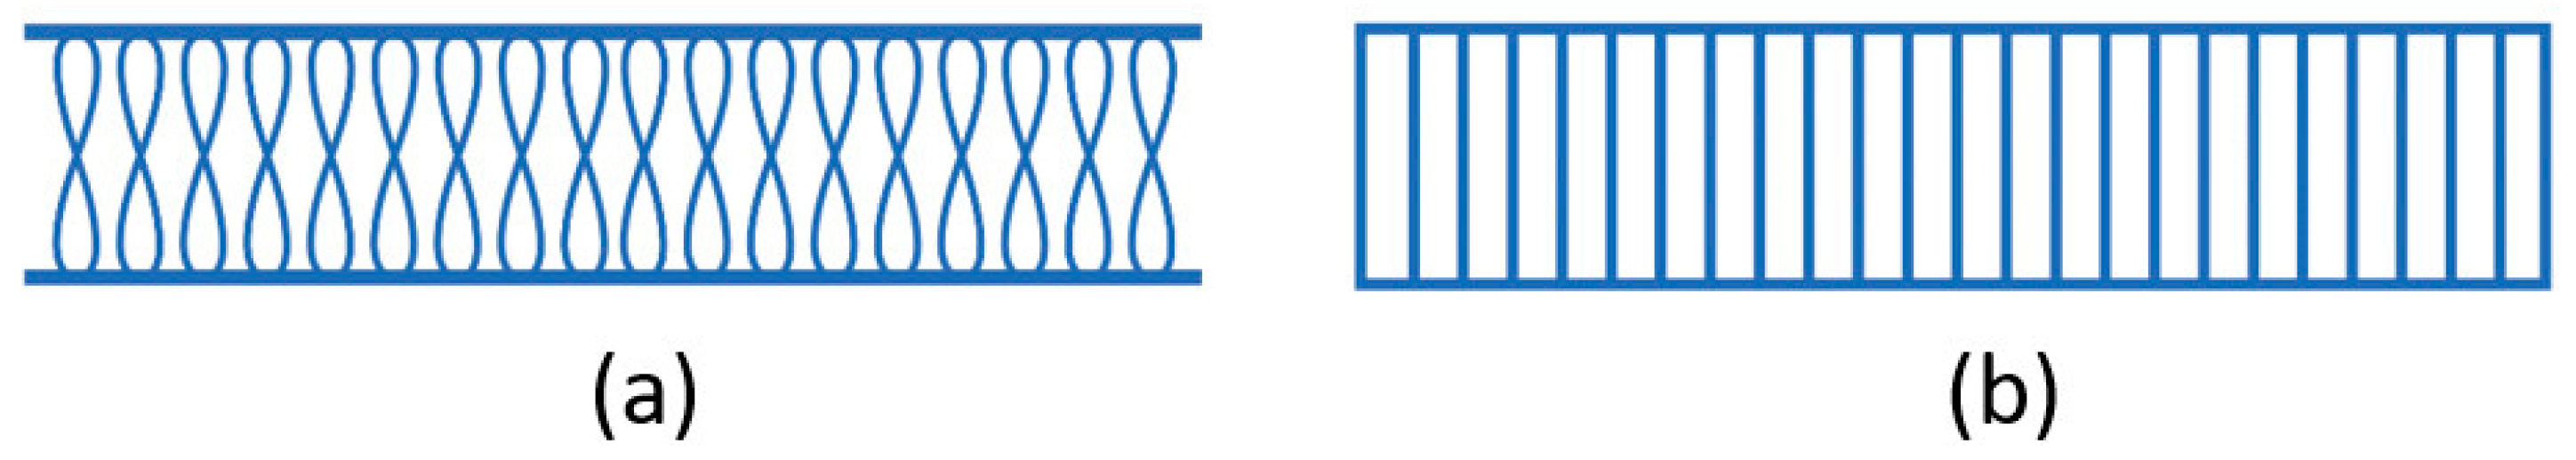
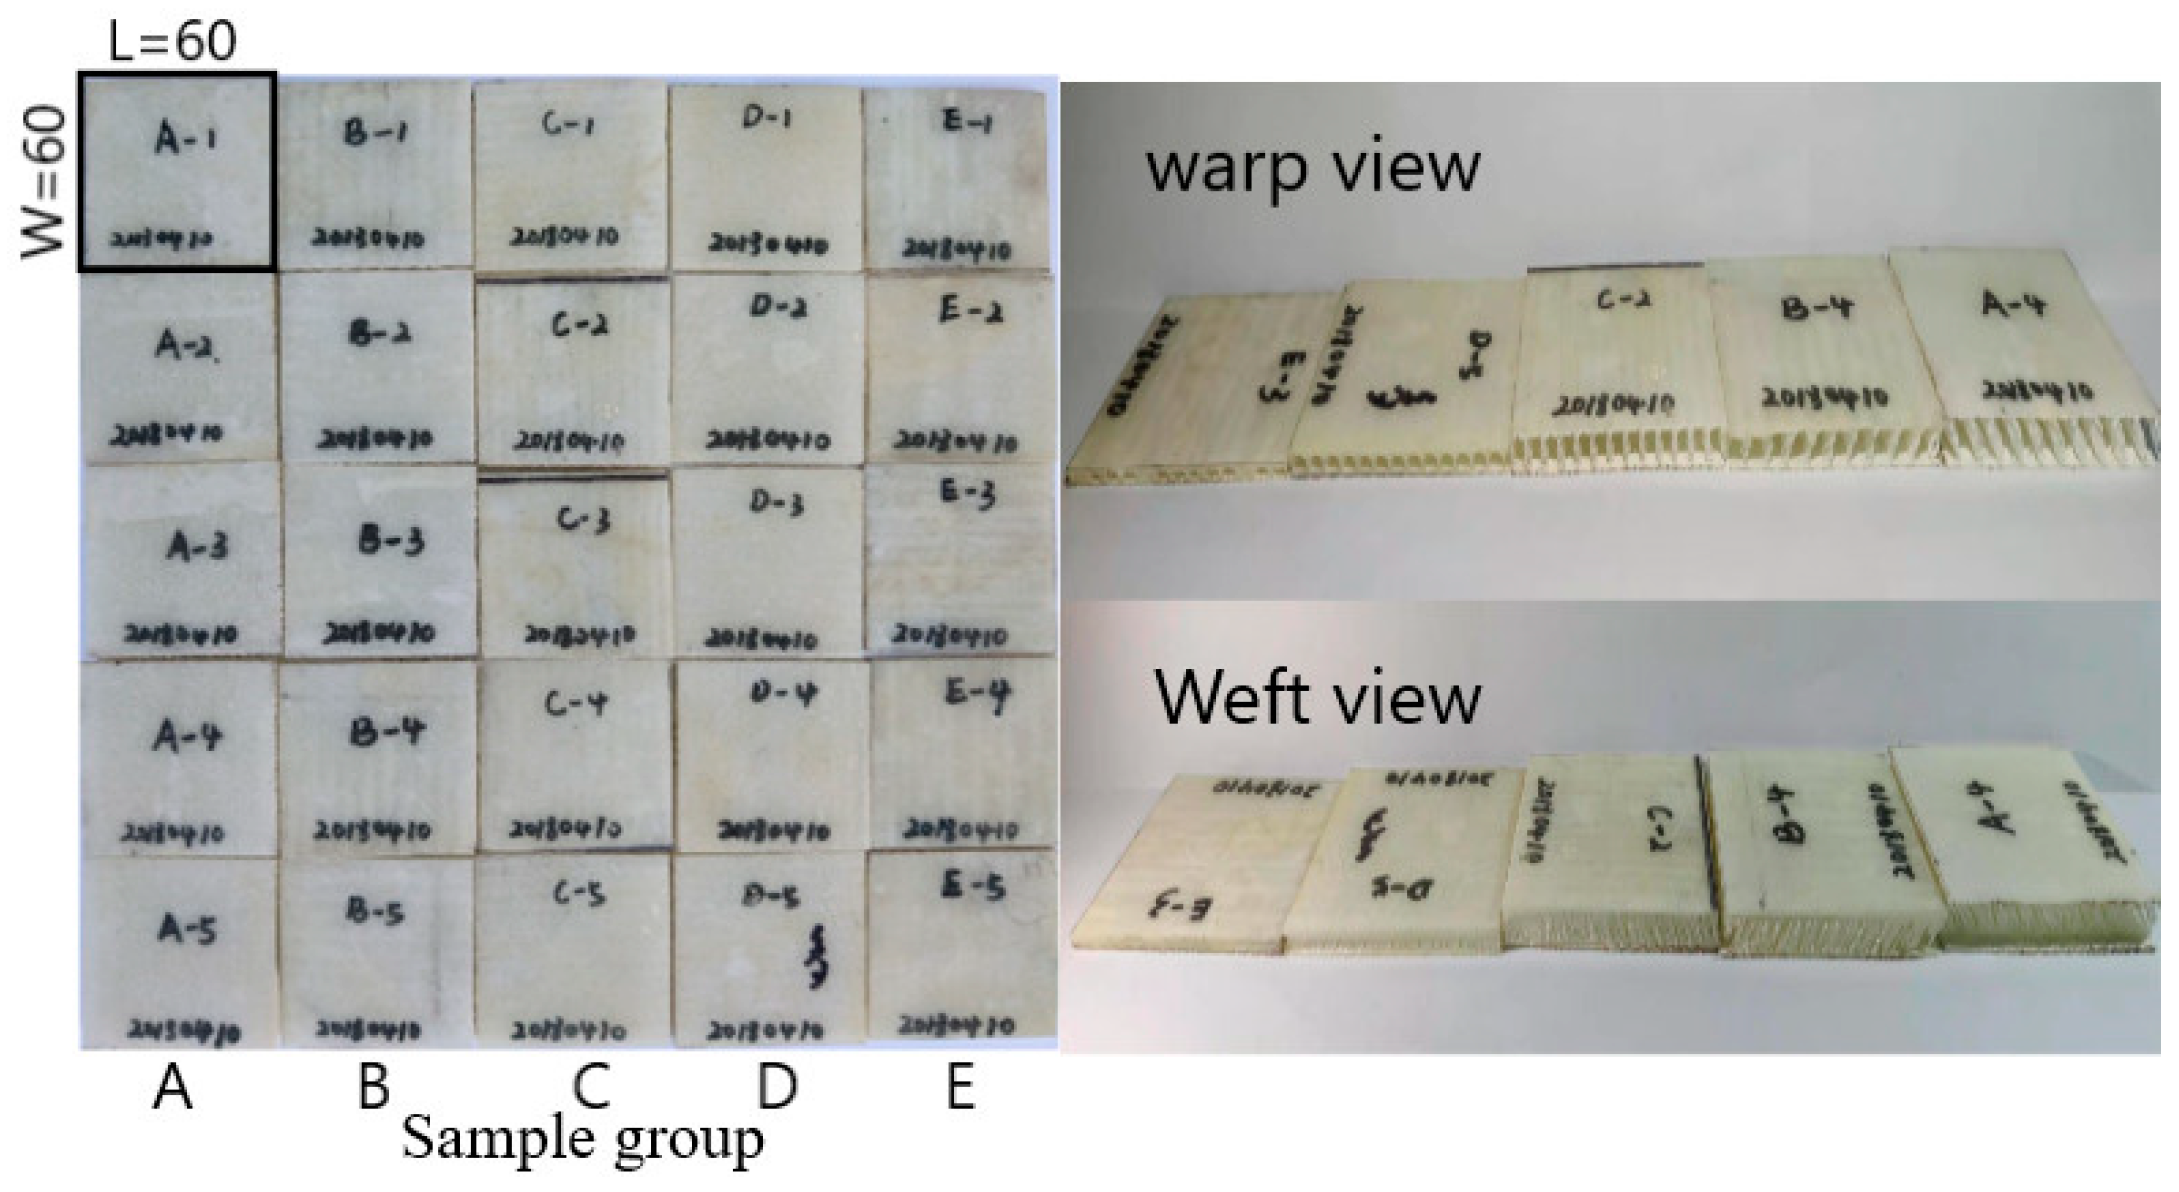
2.1. Materials
Composite Material Molding Process
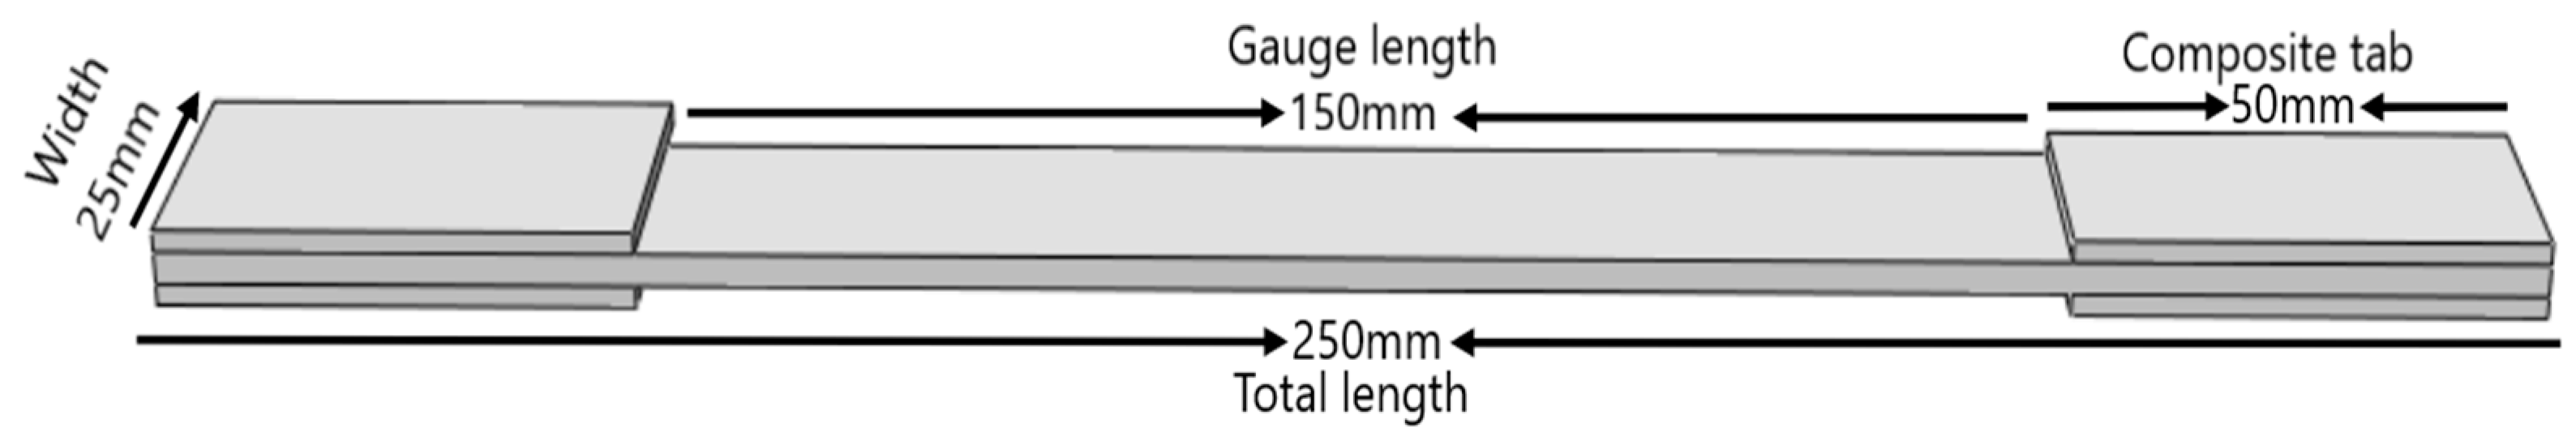
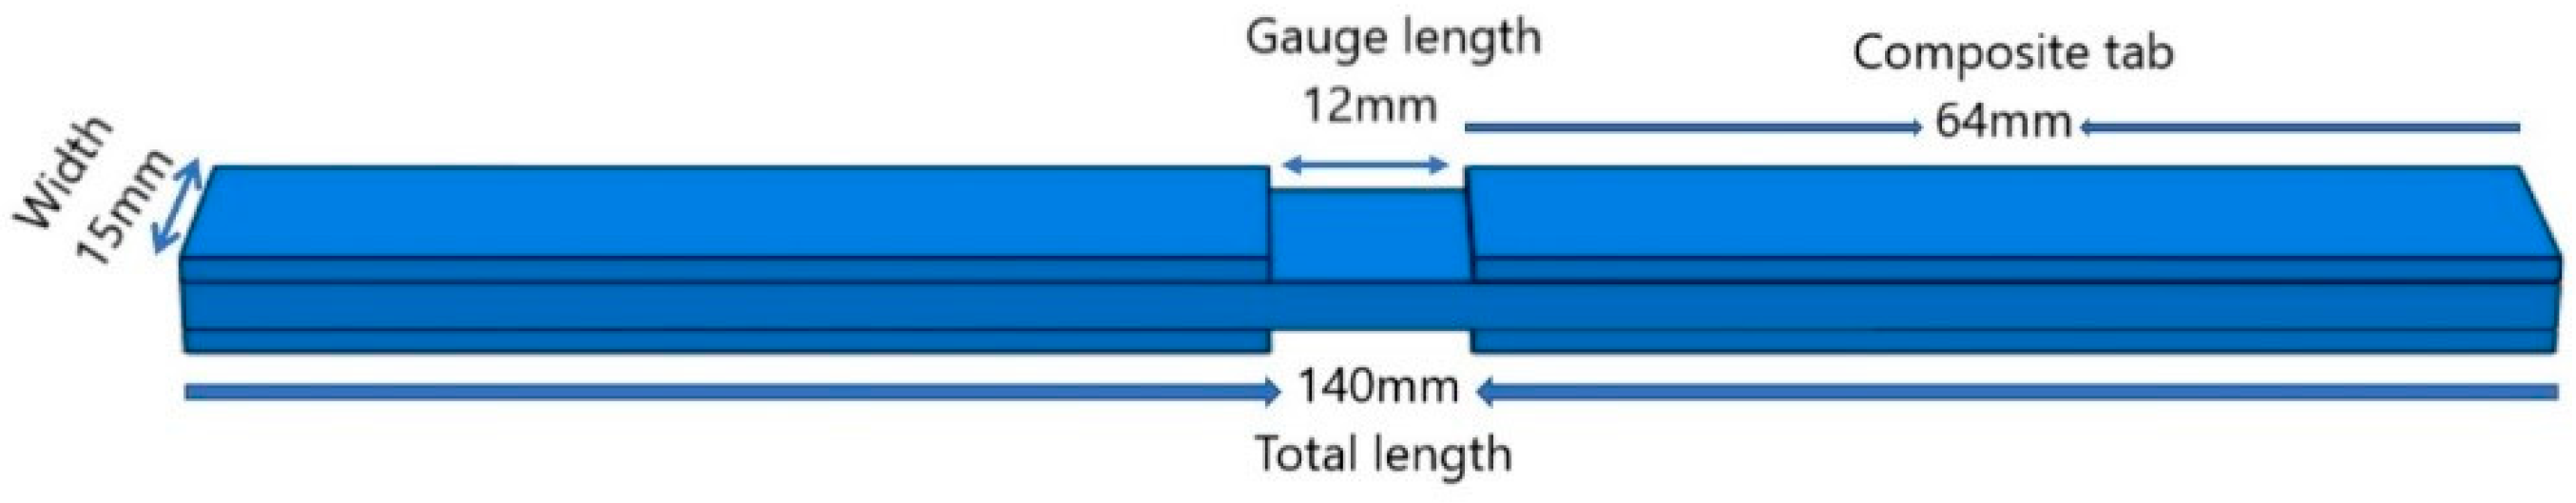
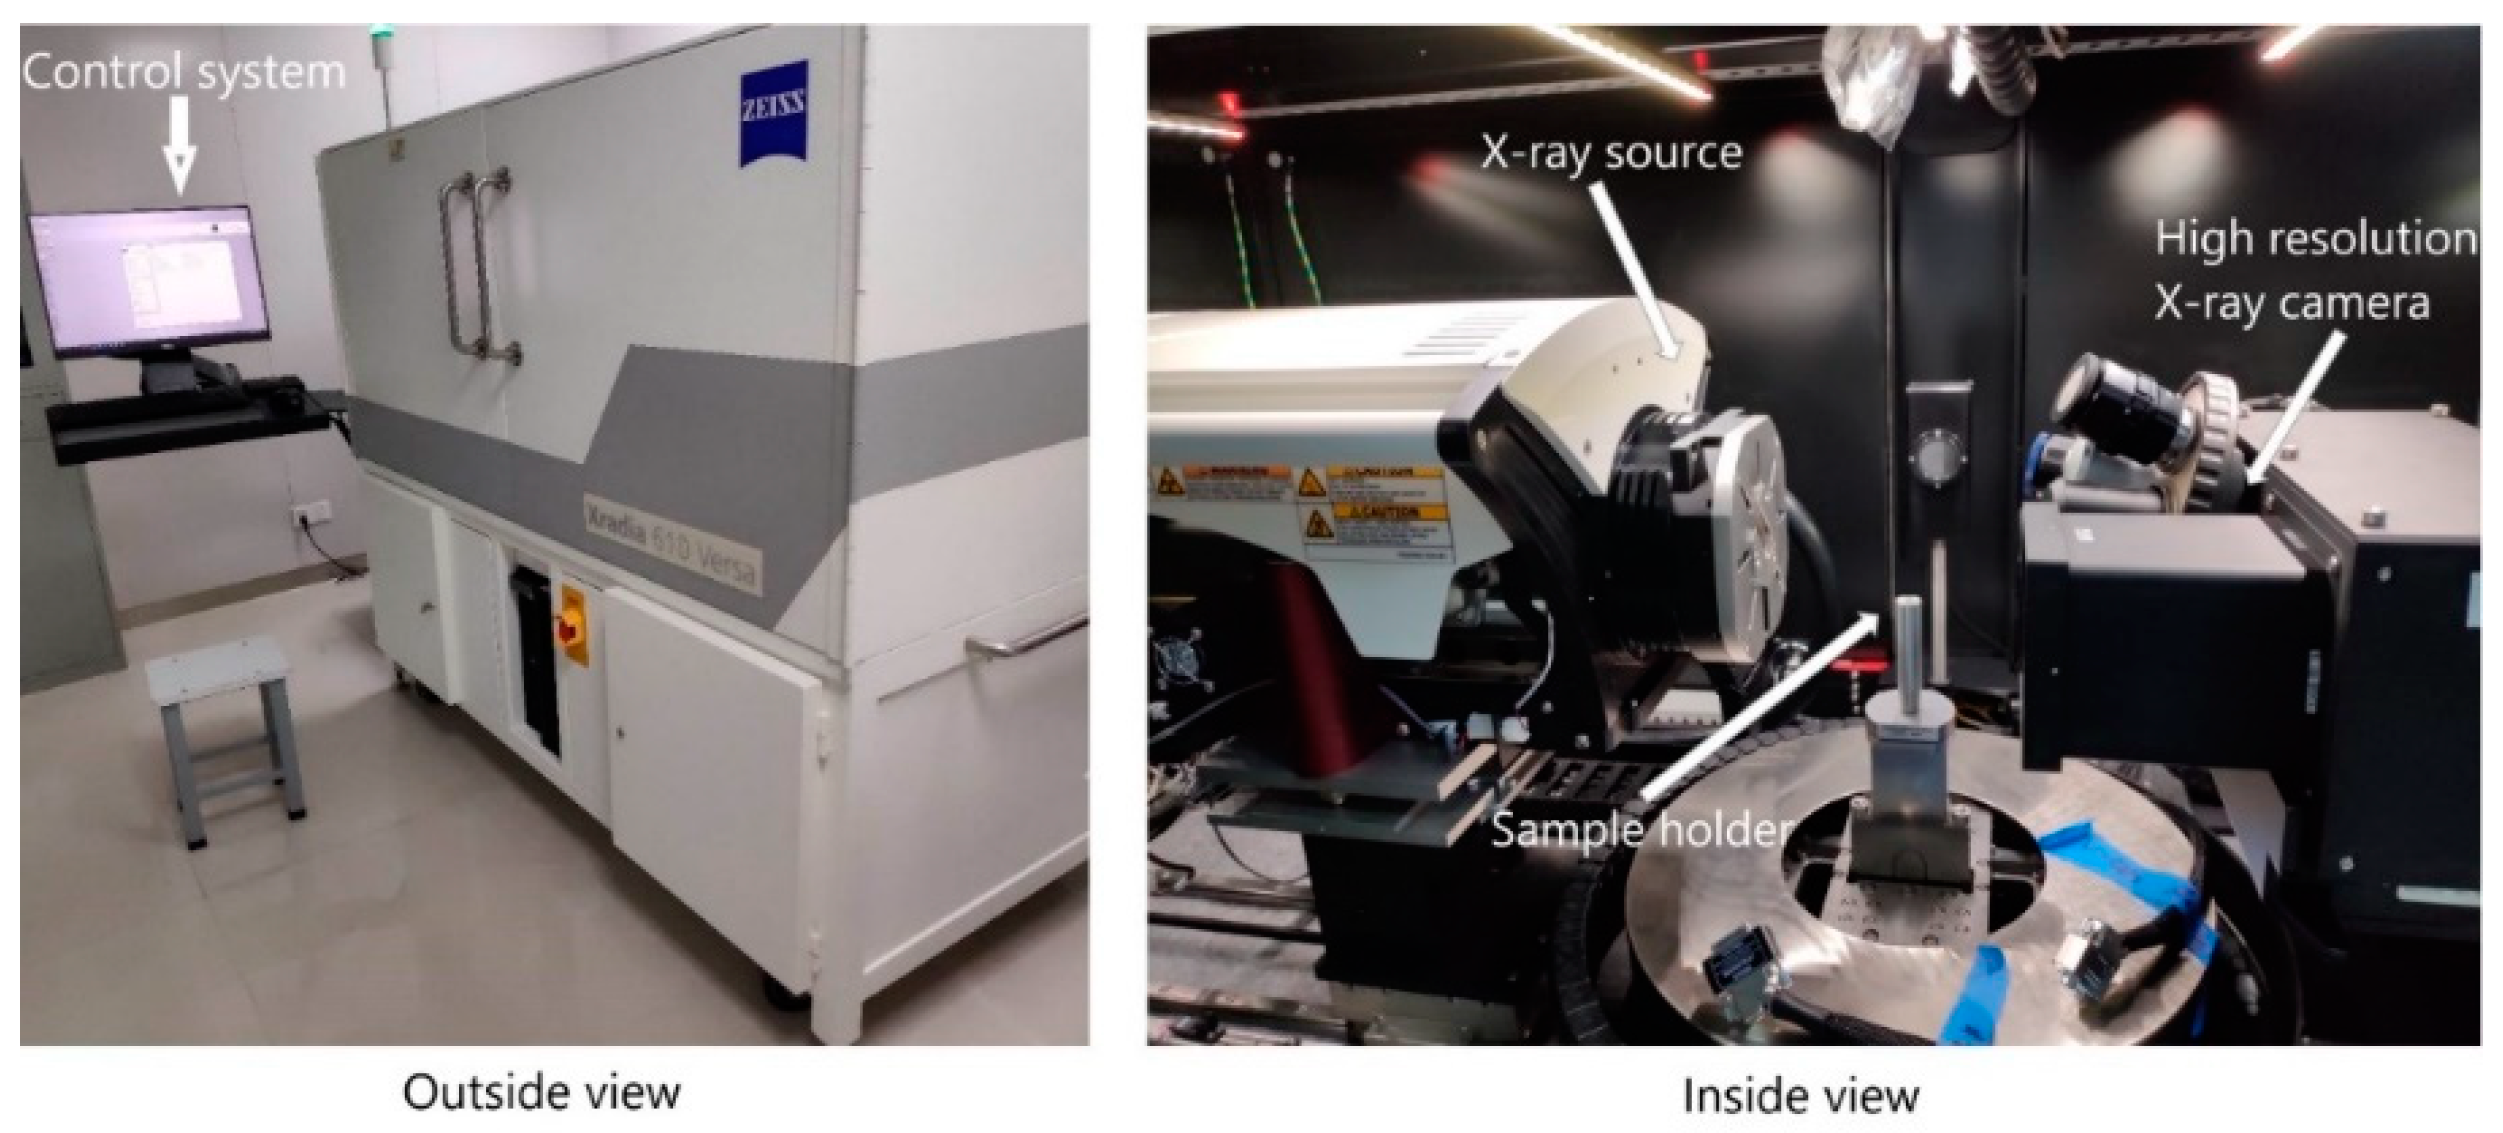
2.2. Mechanical Test
3. Results and Discussion
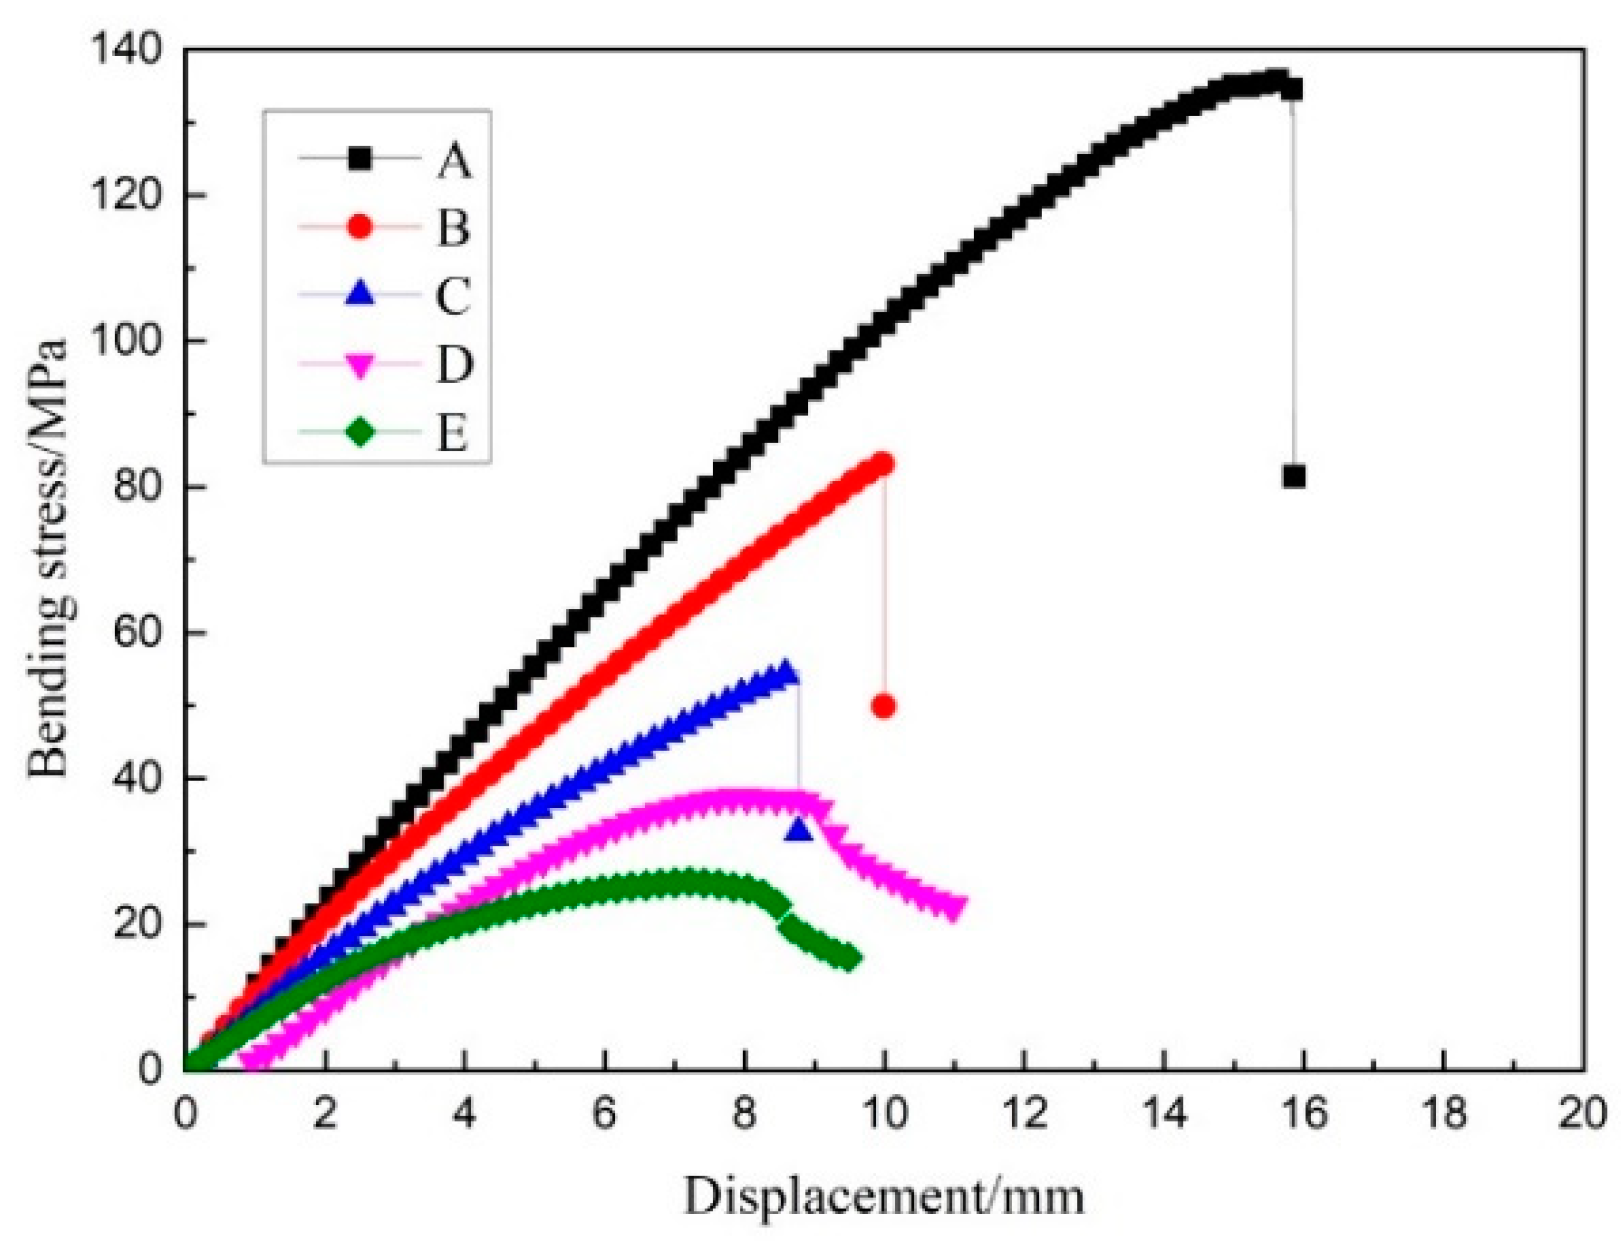
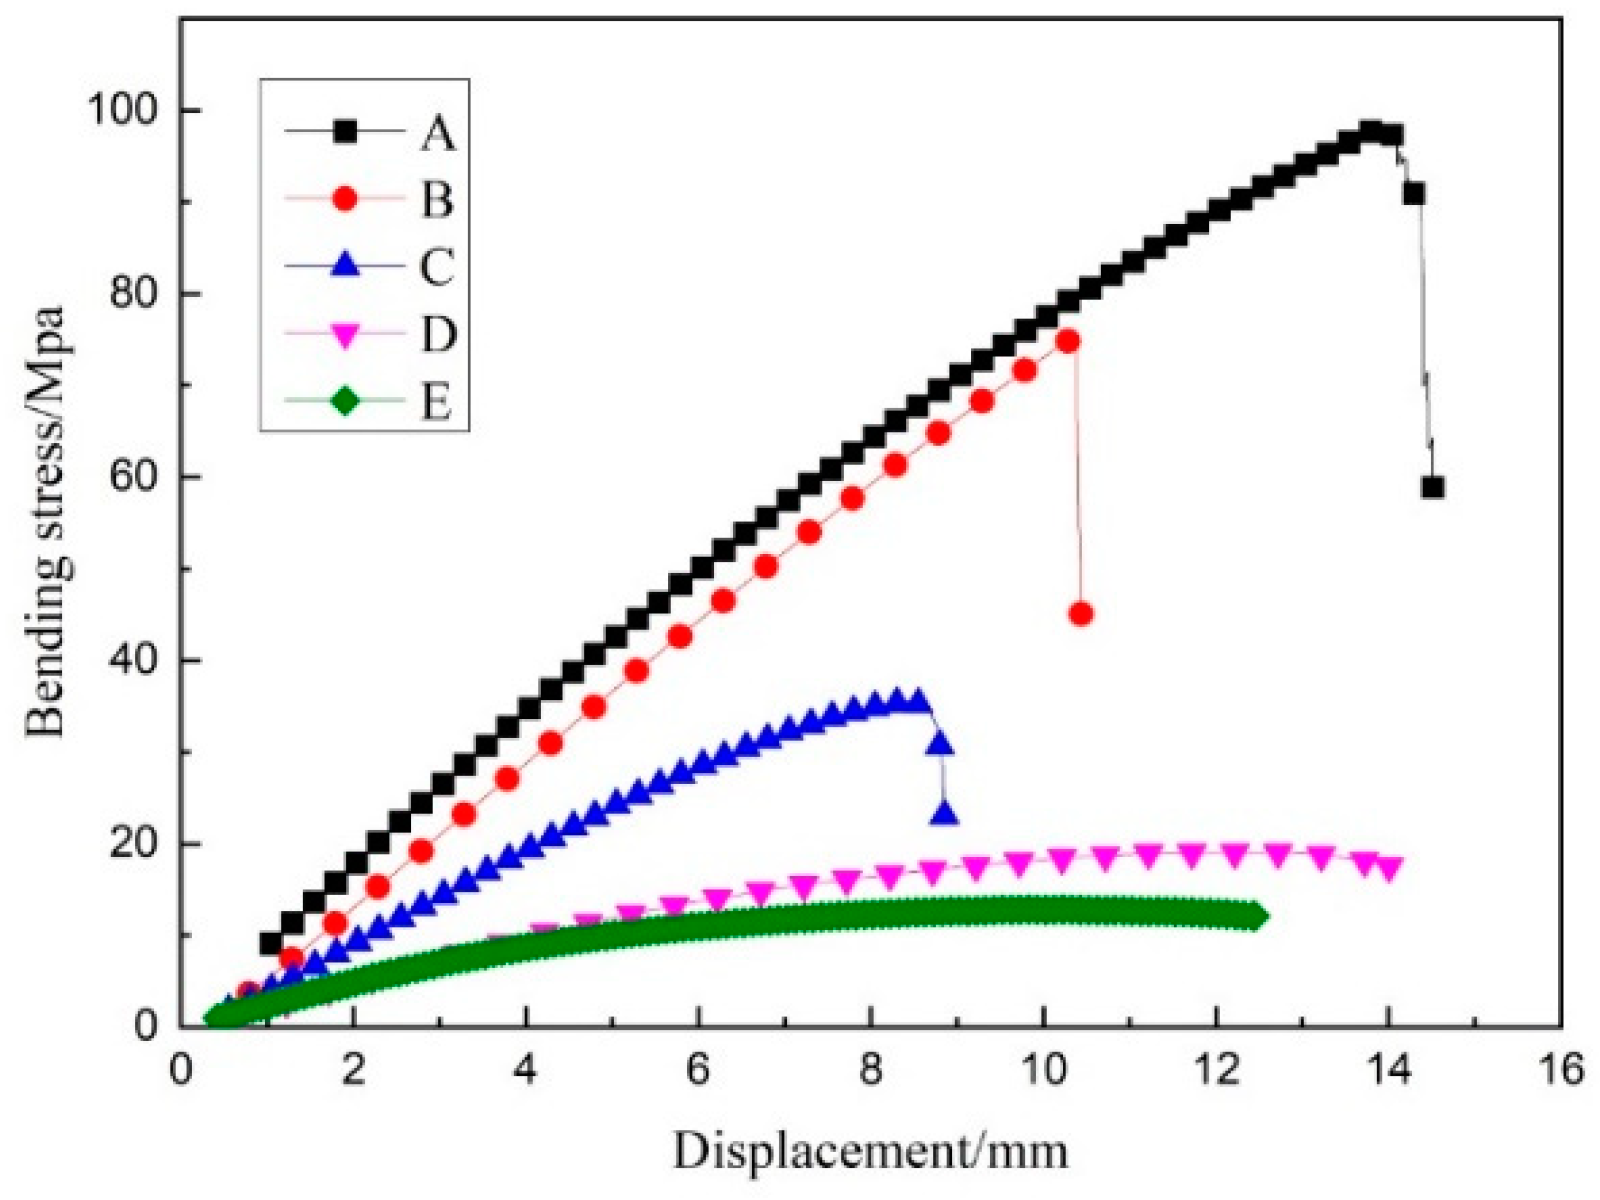
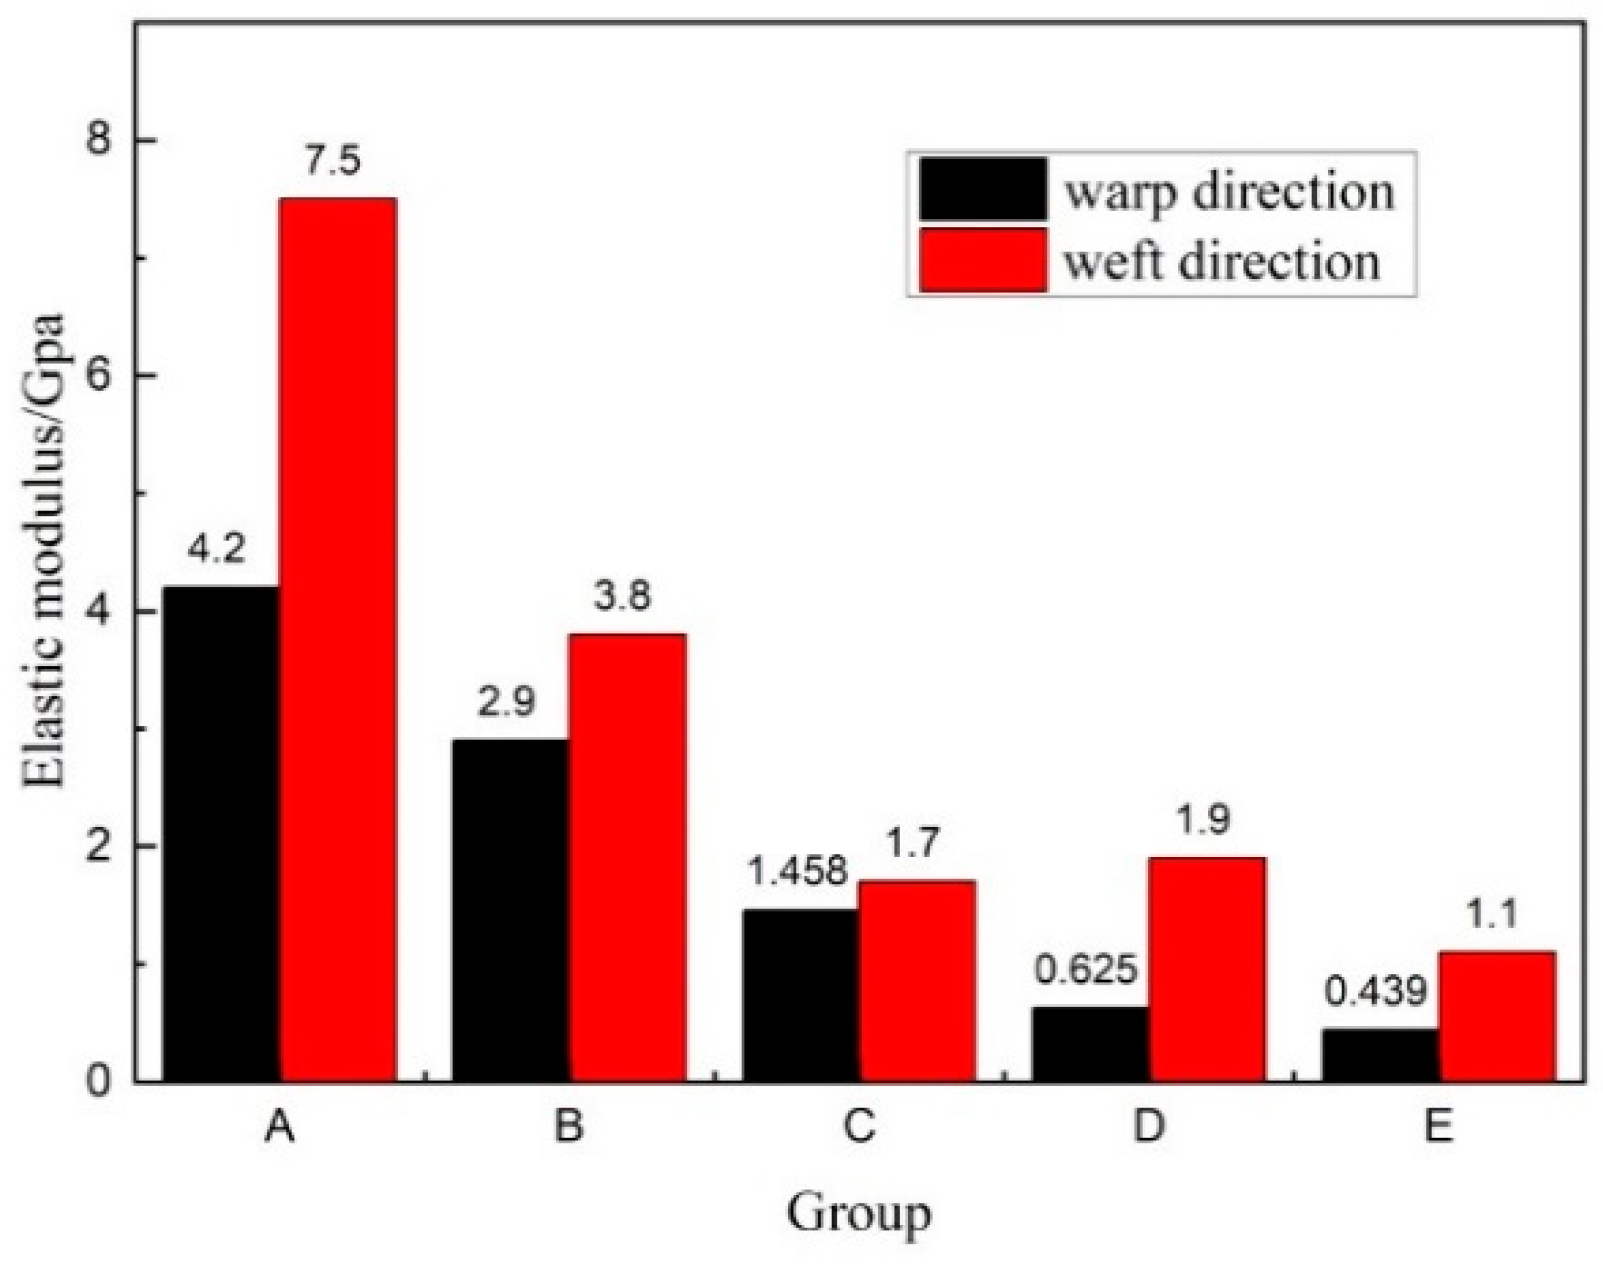
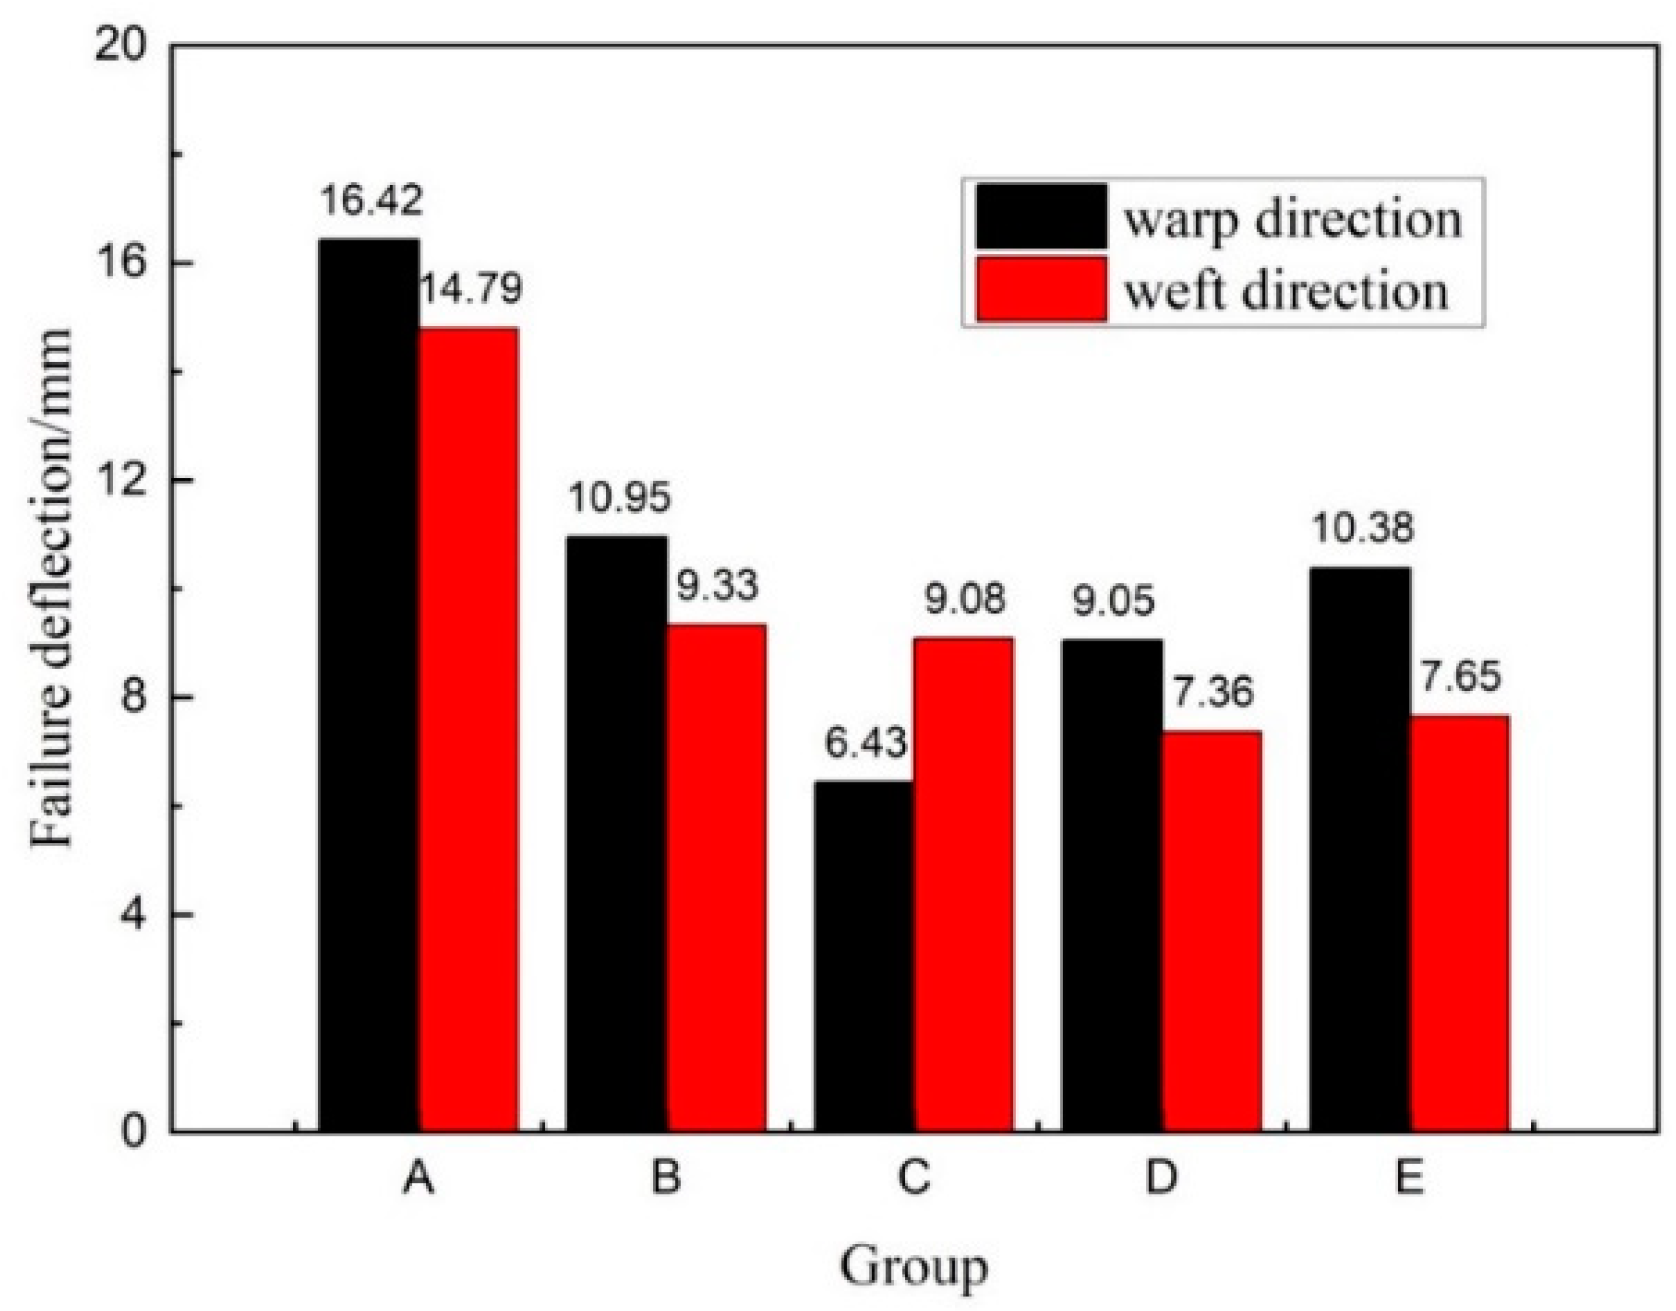
3.1. Bending Performance
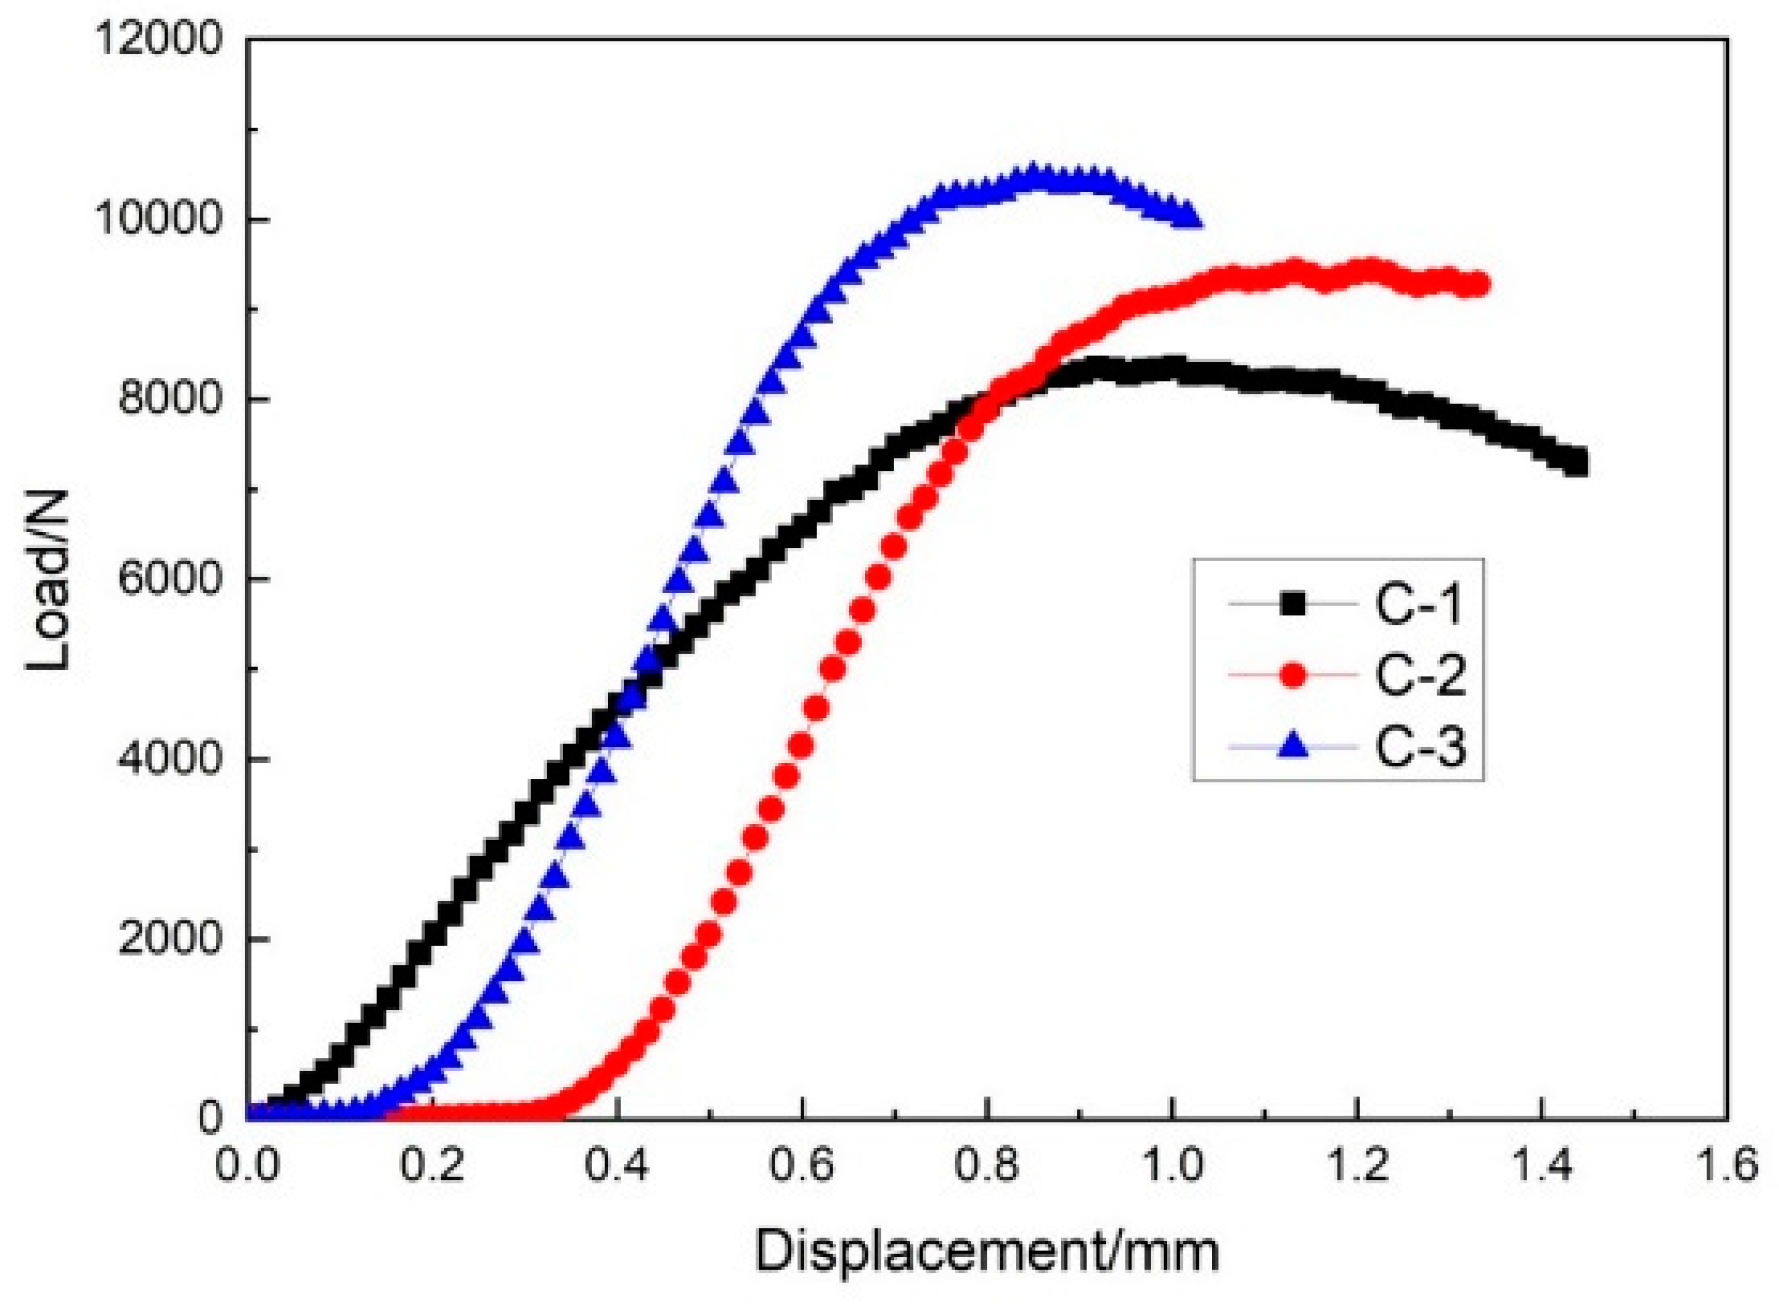
3.2. Flat Compression Performance
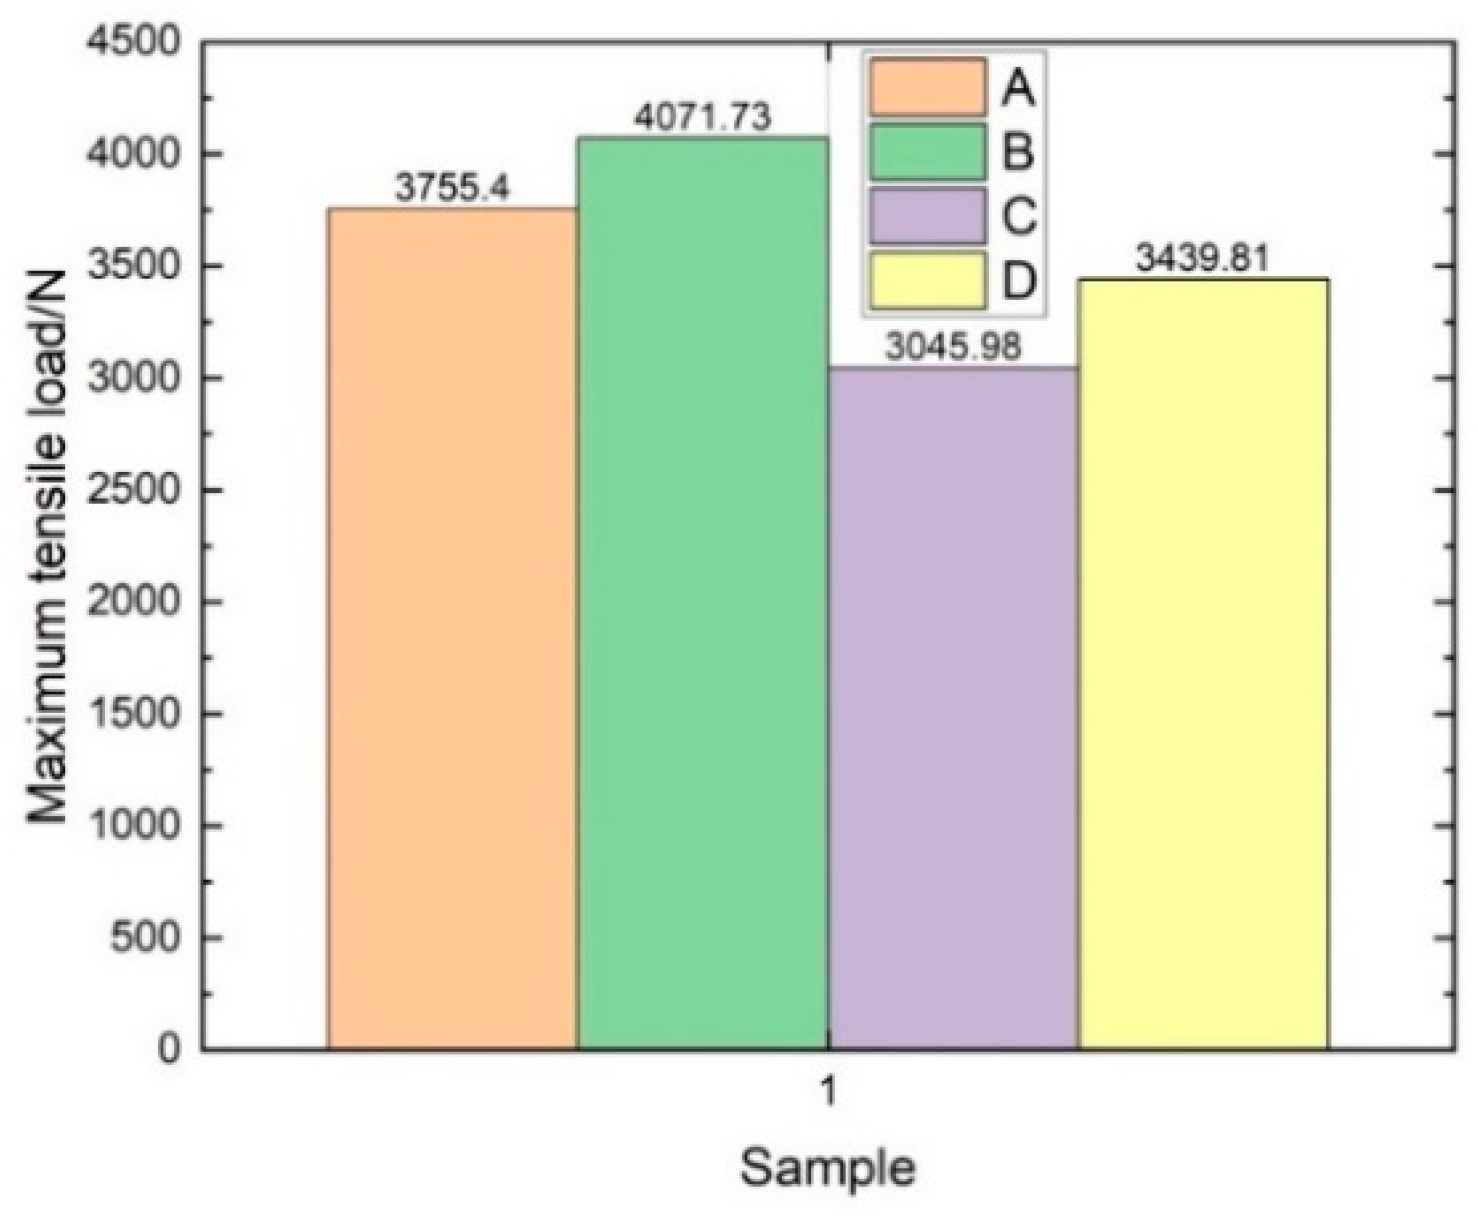
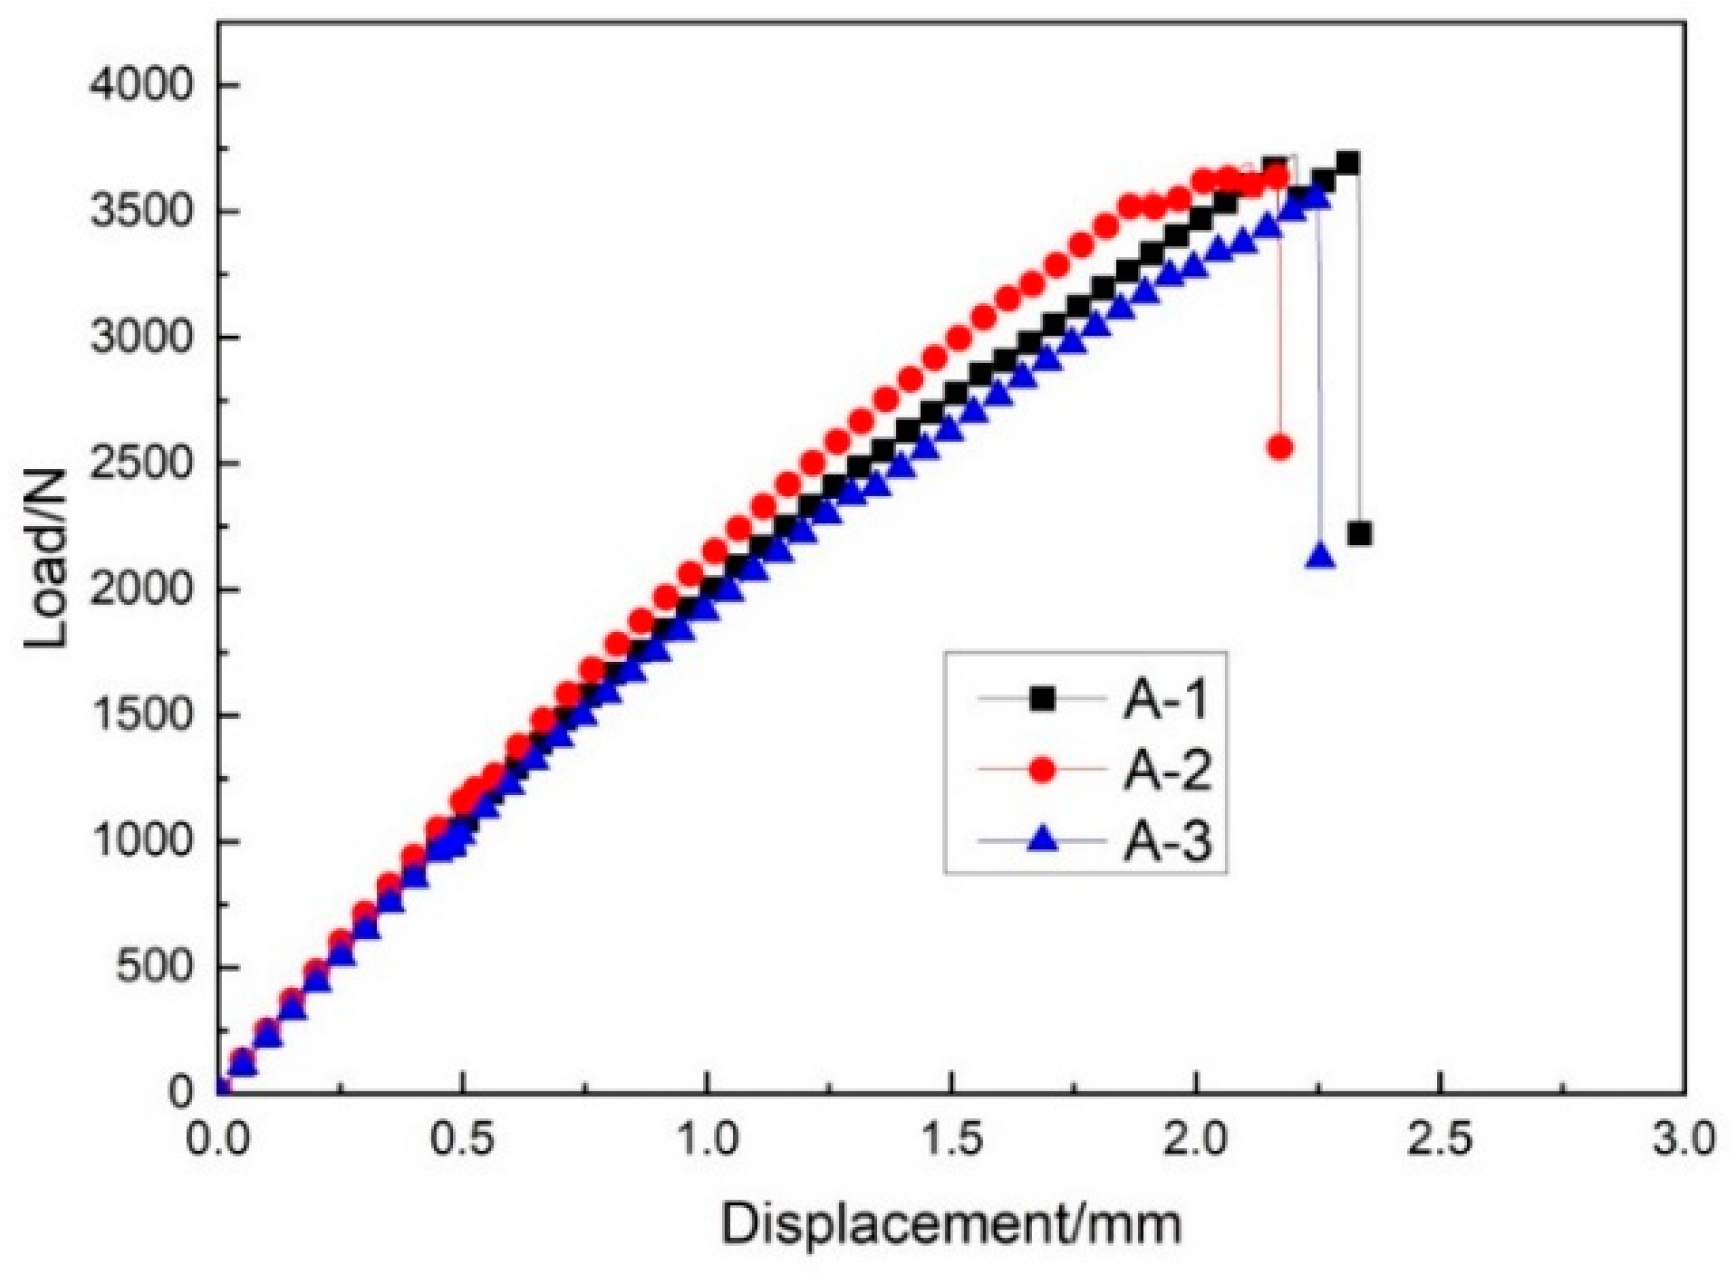
3.3. Tensile Performance
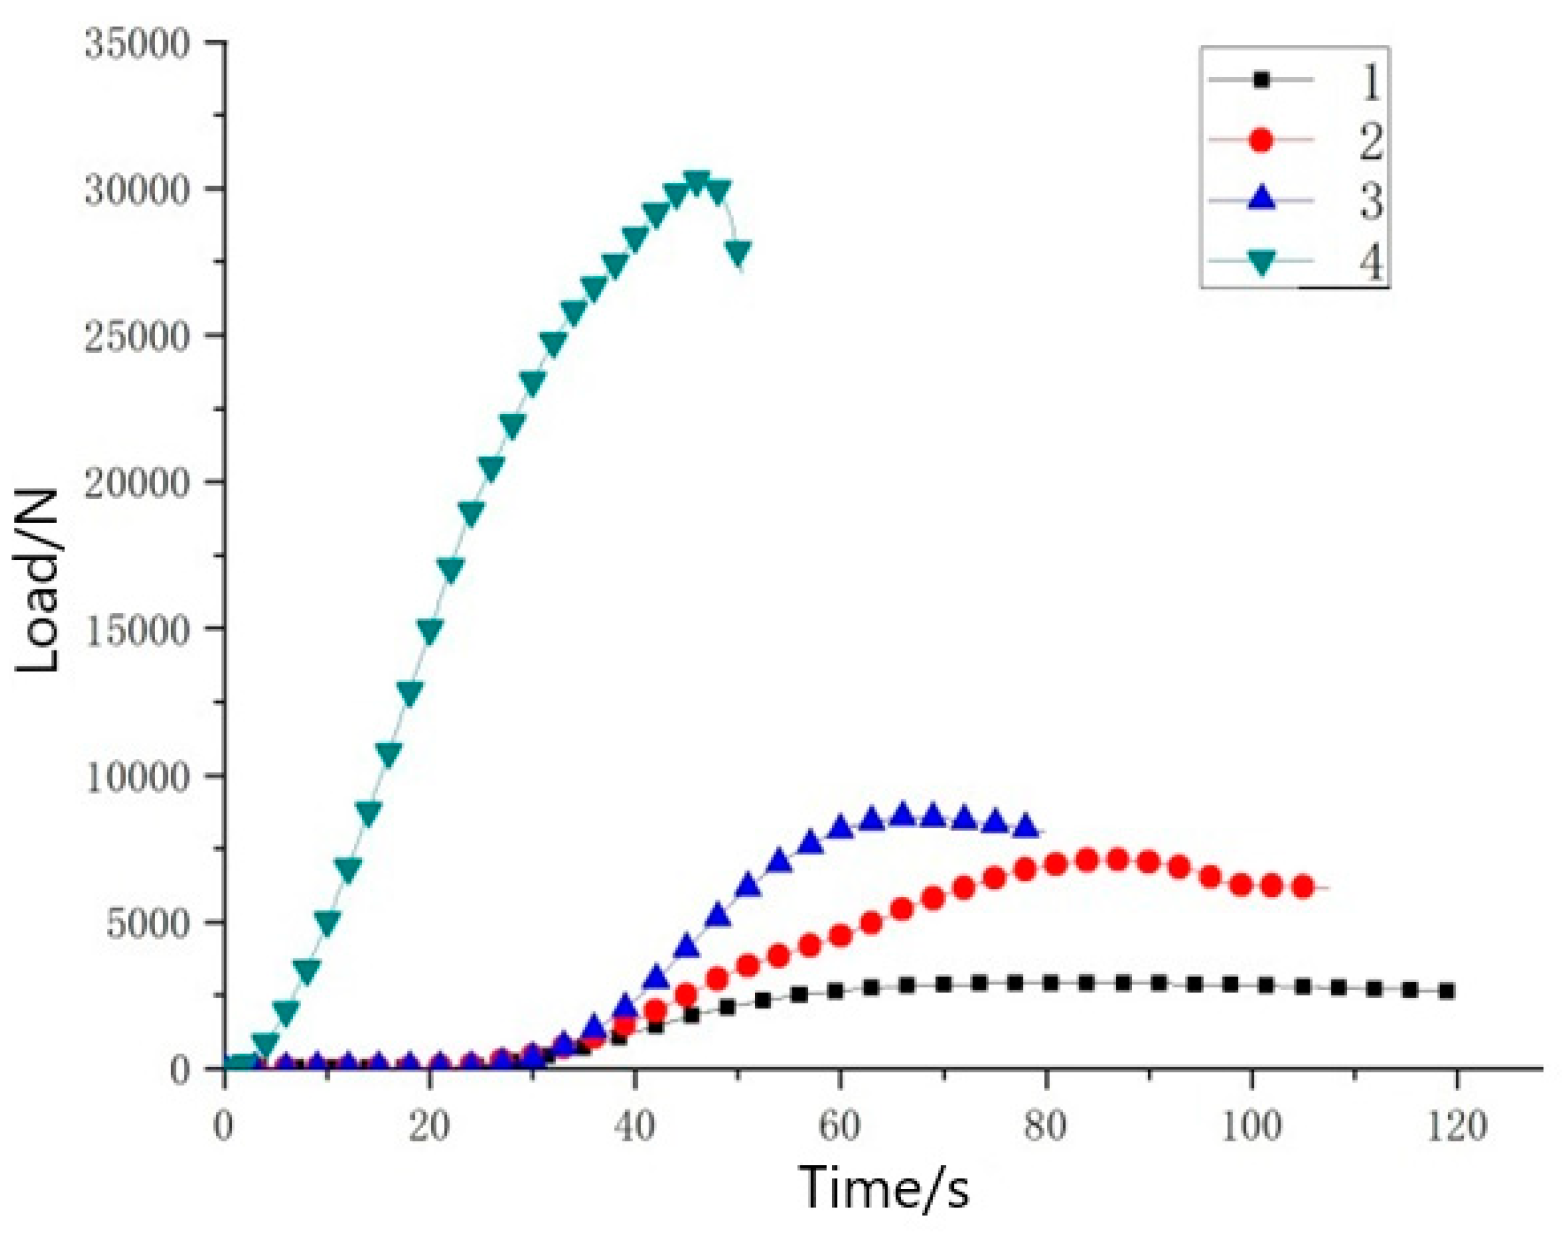
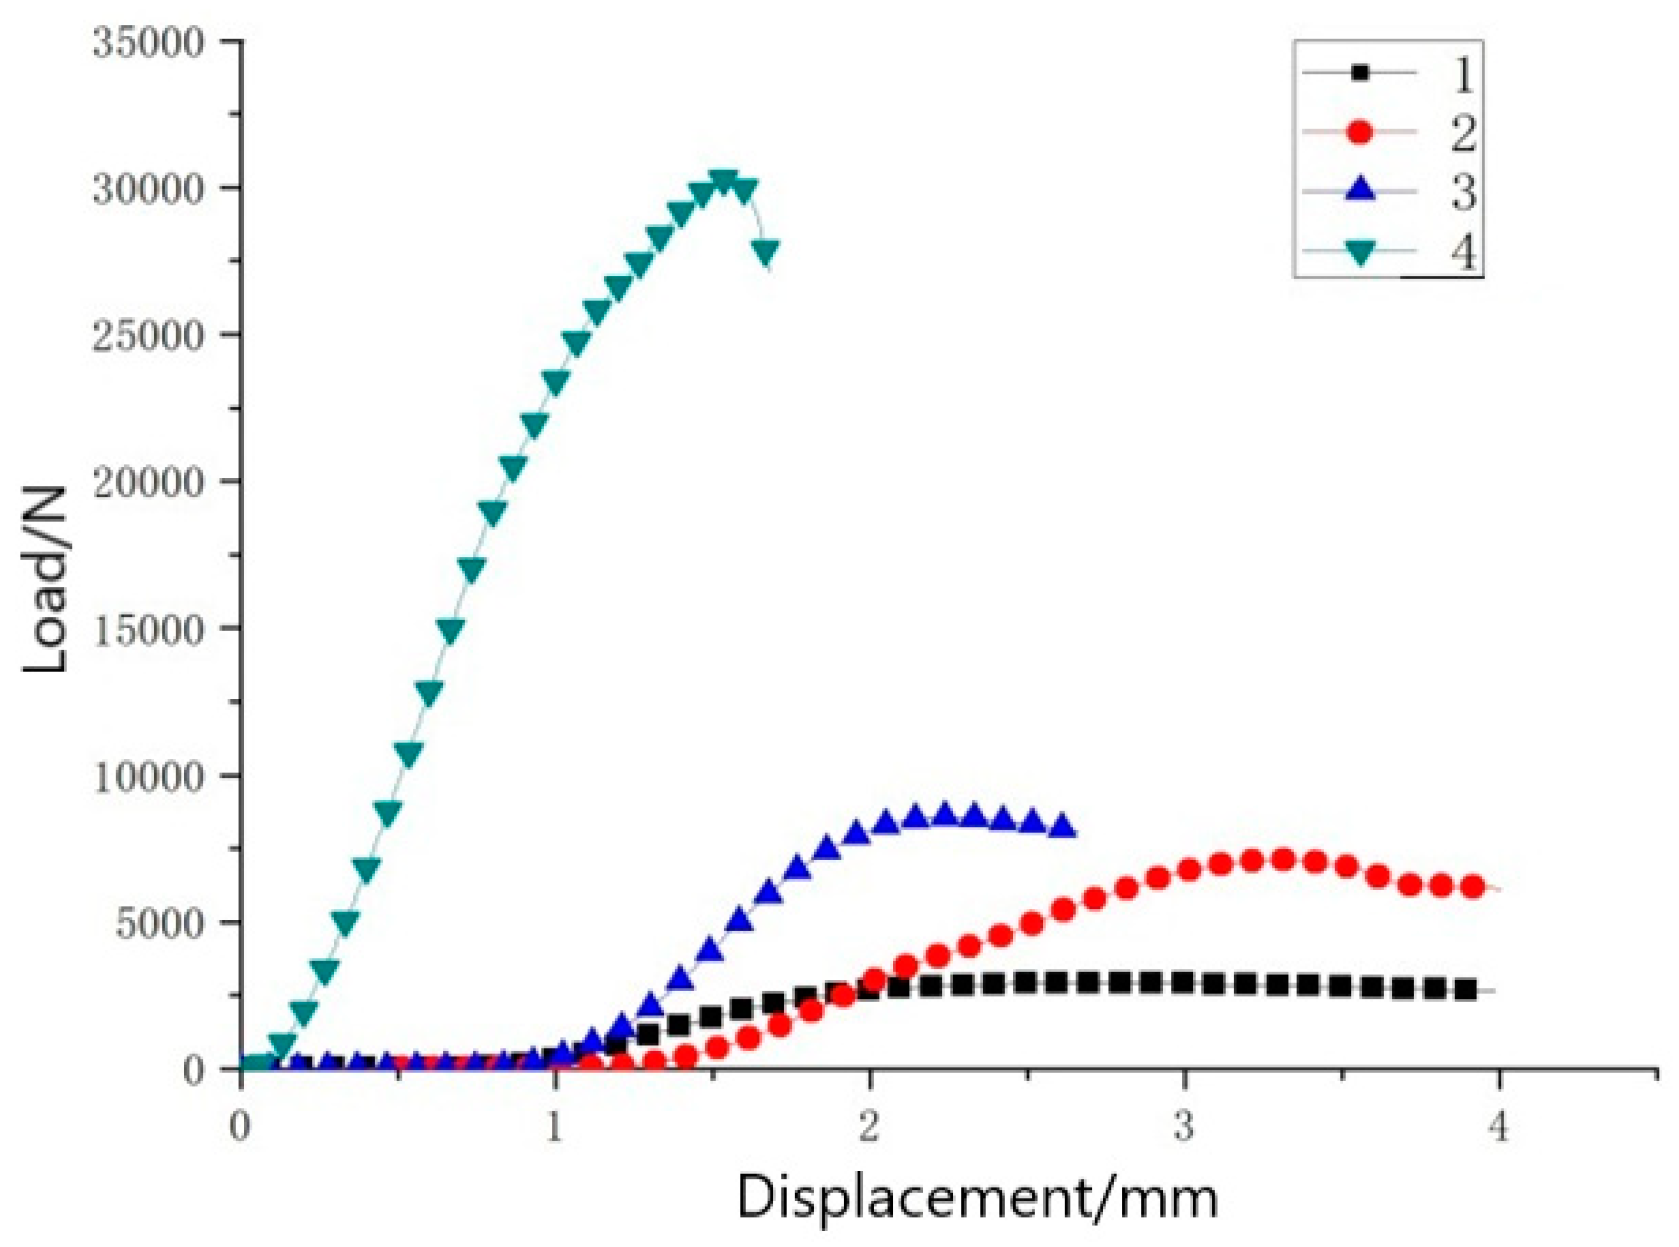
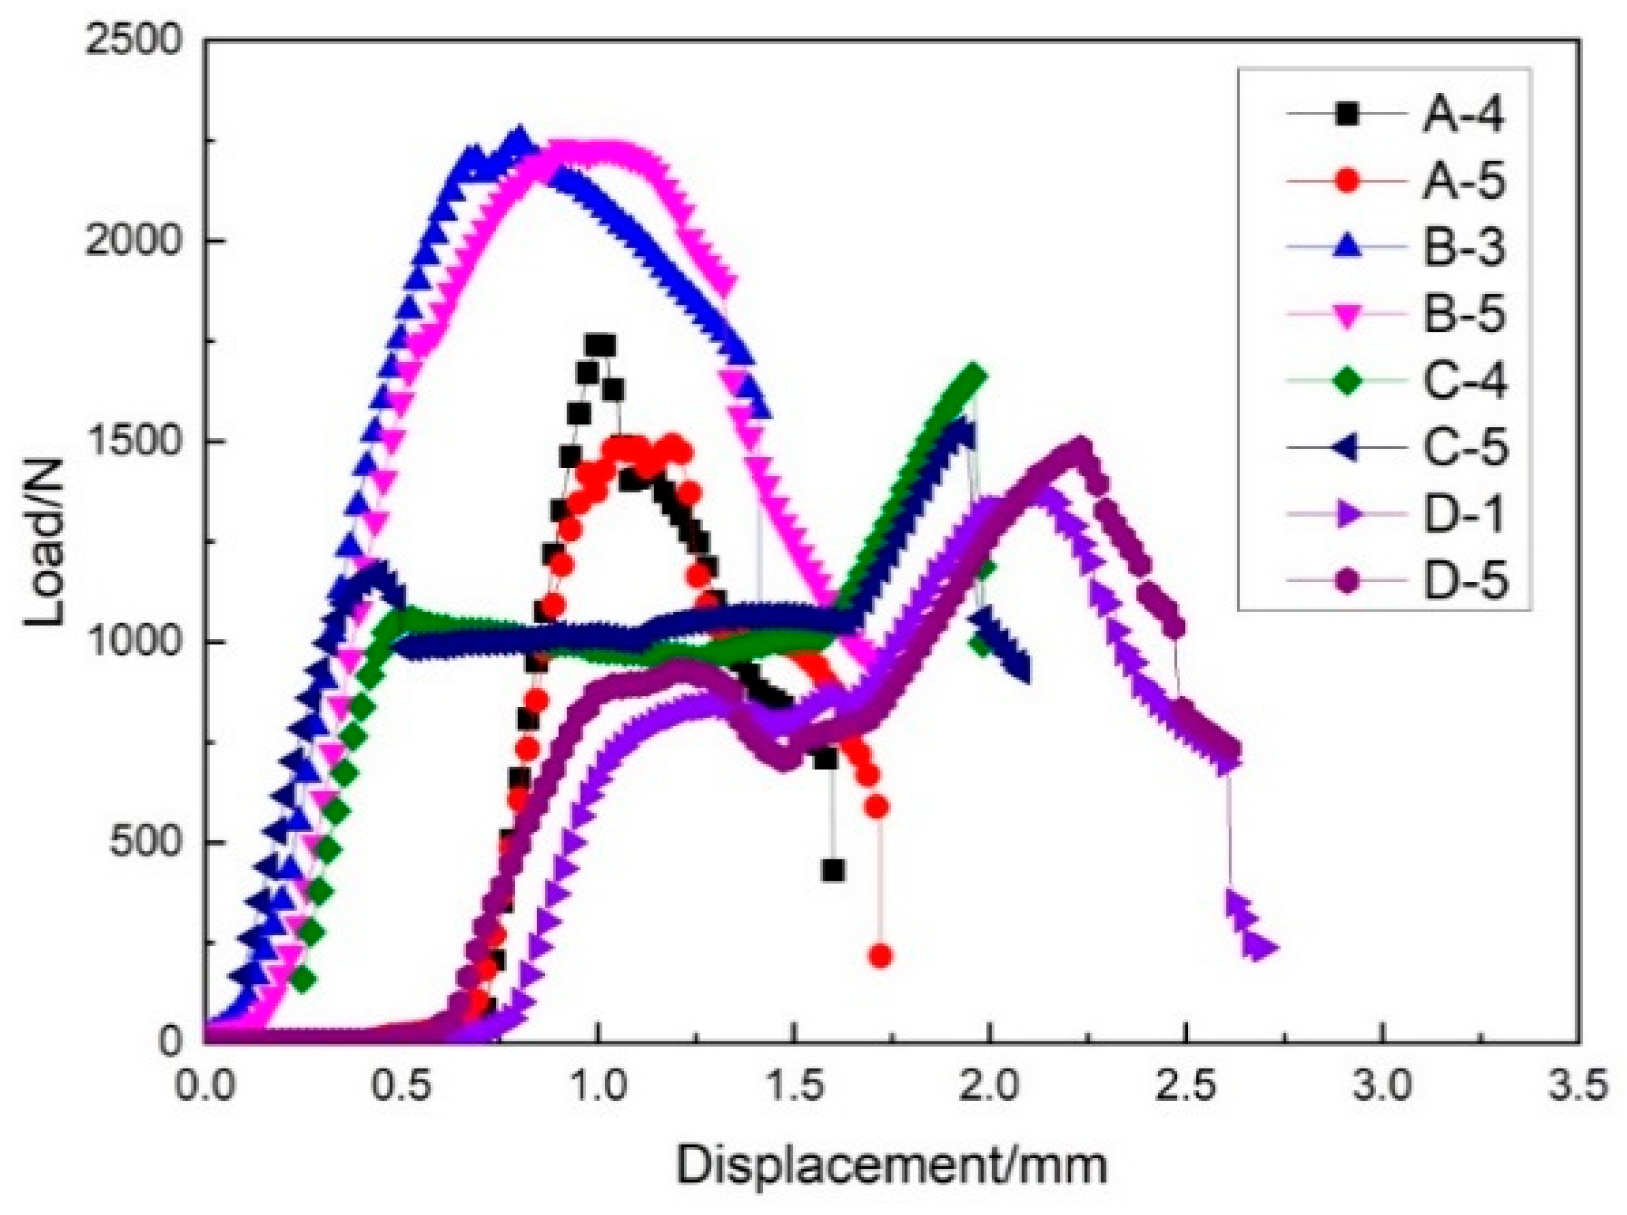
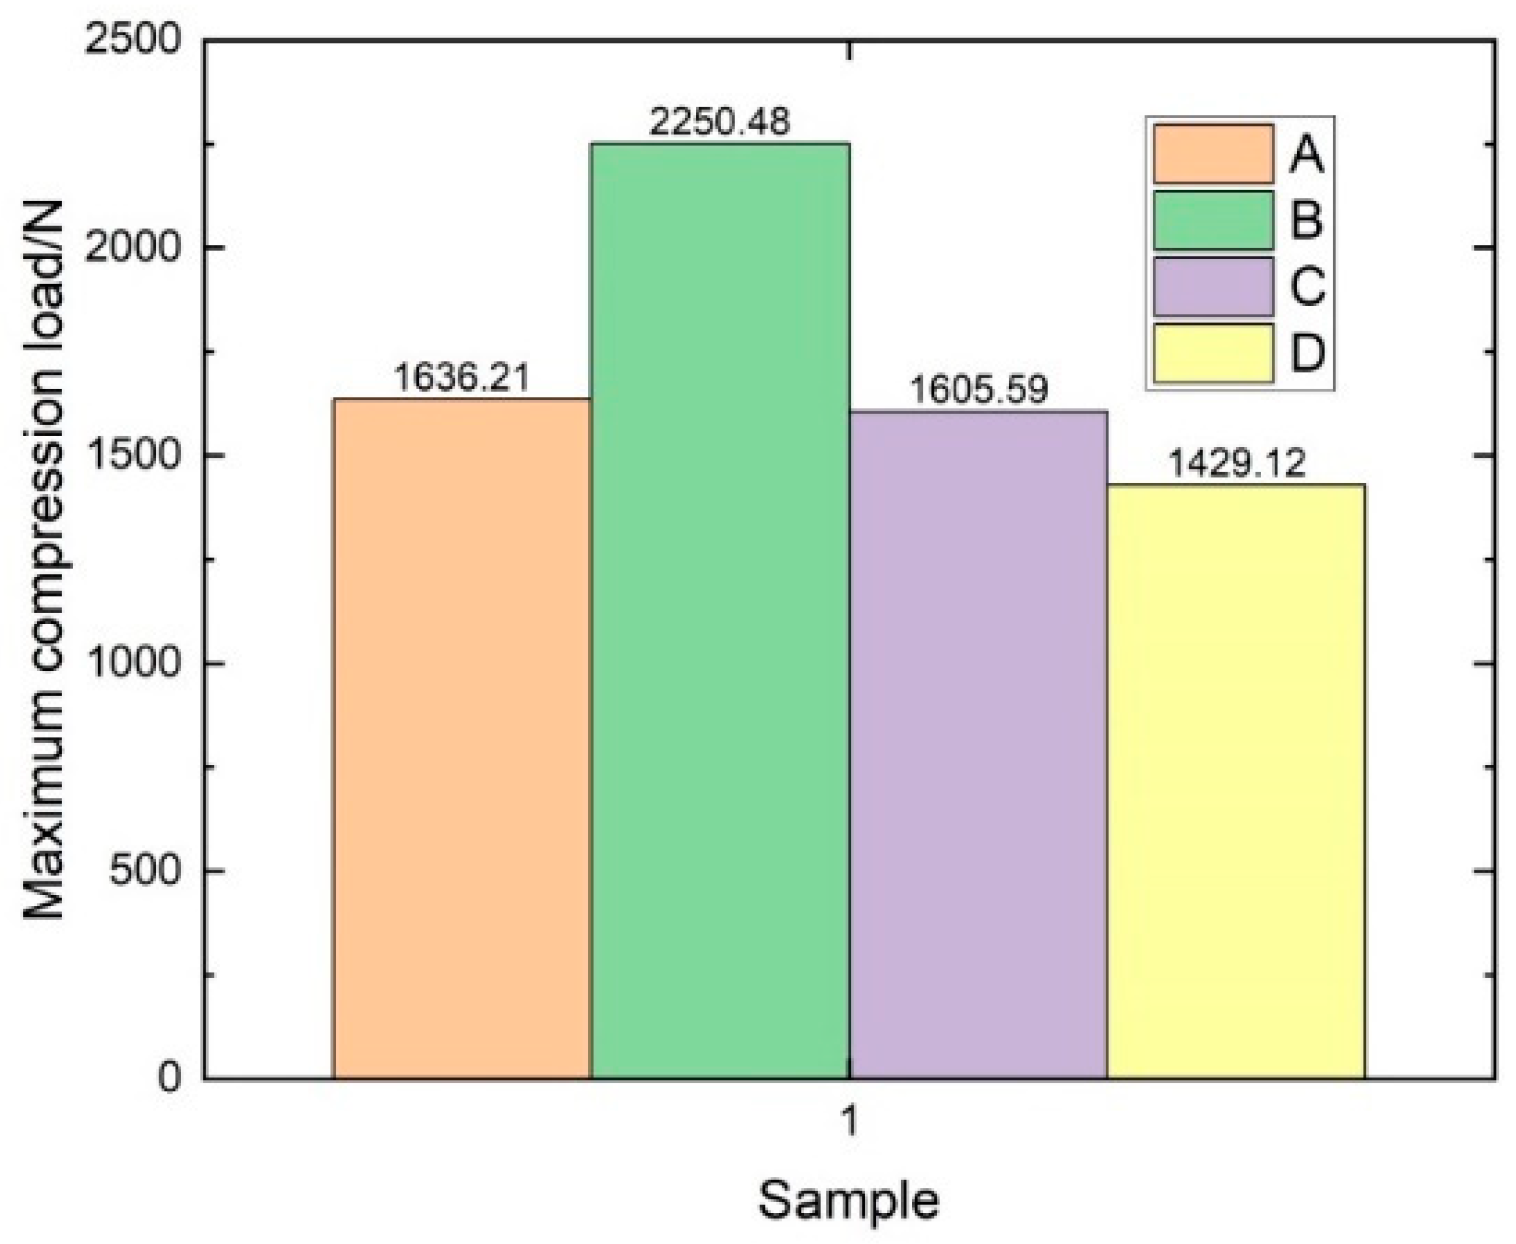
3.4. Edgewise Compression Performance
4. Conclusions
Author Contributions
Funding
Institutional Review Board Statement
Informed Consent Statement
Data Availability Statement
Conflicts of Interest
References
- Velosa, J.C.; Rana, S.; Fangueiro, R.; Van Hattum, F.W.J.; Soutinho, F.; Marques, S. Mechanical behavior of novel sandwich composite panels based on 3D-knitted spacer fabrics. J. Reinf. Plast. Compos. 2012, 31, 95–105. [Google Scholar] [CrossRef]
- Khosravani, M.R. Composite materials manufacturing processes. In Applied Mechanics and Materials; Trans Tech Publications: Kapellweg, Switzerland, 2012; pp. 1361–1367. [Google Scholar]
- Sugun, B.S.; Sundaram, R. 3D Composites: Opportunities & Challenges. J. Indian Inst. Sci. 2015, 95, 221–232. [Google Scholar]
- Jia, L.X.; Wang, R.; Liu, J.M. Design and Property Analysis of Woven Spacer Fabric Sandwich Panels. Adv. Mater. Res. 2011, 332–334, 747–751. [Google Scholar] [CrossRef]
- Li, M.; Wang, S.; Zhang, Z.; Wu, B. Effect of Structure on the Mechanical Behaviors of Three-Dimensional Spacer Fabric Composites. Appl. Compos. Mater. 2009, 16, 1–14. [Google Scholar] [CrossRef]
- Sadighi, M.; Hosseini, S.A. Finite element simulation and experimental study on mechanical behavior of 3D woven glass fiber composite sandwich panels. Compos. Part B Eng. 2013, 55, 158–166. [Google Scholar] [CrossRef]
- Wang, S.K.; Li, M.; Gu, Y.Z.; Zhang, Z.G.; Wu, B.M. Mechanical Reinforcement of Three-Dimensional Spacer Fabric Composites. Mater. Sci. Forum 2010, 654–656, 2604–2607. [Google Scholar] [CrossRef]
- Zhu, L.; Lyu, L.; Zhang, X.; Wang, Y.; Guo, J.; Xiong, X. Bending Properties of Zigzag-Shaped 3D Woven Spacer Composites: Experiment and FEM Simulation. Materials 2019, 12, 1075. [Google Scholar] [CrossRef] [PubMed] [Green Version]
- Zhang, M.; Wang, X.; Liu, S.; Li, F.; Wu, G. Effects of Face Sheet Structure on Mechanical Properties of 3D Integrated Woven Spacer Composites. Fibers Polym. 2020, 21, 1594–1604. [Google Scholar] [CrossRef]
- Wang, S.; Li, M.; Zhang, Z.; Wu, B. Properties of Facesheet-reinforced 3-D Spacer Fabric Composites and the Integral Multi-facesheet Structures. J. Reinf. Plast. Compos. 2010, 29, 793–806. [Google Scholar] [CrossRef]
- Neje, G.; Behera, B.K. Investigation of mechanical performance of 3D woven spacer sandwich composites with different cell geometries. Compos. Part B Eng. 2019, 160, 306–314. [Google Scholar] [CrossRef]
- Neje, G.; Behera, B.K. Influence of cell geometrical parameters on the mechanical properties of 3D integrally woven spacer sandwich composites. Compos. Part B Eng. 2020, 182, 107659. [Google Scholar] [CrossRef]
- Wang, M.; Cao, H.; Qian, K. Mechanical Properties of Three-Dimensional Fabric Sandwich Composites. J. Eng. Fibers Fabr. 2014, 9, 155892501400900. [Google Scholar] [CrossRef]
- Behera, B.K.; Dash, B.P. Mechanical behavior of 3D woven composites. Mater. Des. 2015, 67, 261–271. [Google Scholar] [CrossRef]
- Rajak, D.K.; Pagar, D.D.; Kumar, R.; Pruncu, C.I. Recent progress of reinforcement materials: A comprehensive overview of composite materials. J. Mater. Res. Technol. 2019, 8, 6354–6374. [Google Scholar] [CrossRef]
- Li, C.; Zhang, R.; Wang, G.; Shi, Y. The mechanical properties of epoxy resin composites modified by compound modification. AIP Adv. 2018, 8, 105325. [Google Scholar] [CrossRef] [Green Version]
- Hu, Y.; Li, W.; Fan, H.; Sun, F.; Ouyang, J.; Qu, Z.; Kuang, N. Experimental investigations on the failures of woven textile sandwich panels. J. Thermoplast. Compos. Mater. 2017, 30, 196–224. [Google Scholar] [CrossRef]
- Stig, F.; Hallström, S. Assessment of the mechanical properties of a new 3D woven fibre composite material. Compos. Sci. Technol. 2009, 69, 1686–1692. [Google Scholar] [CrossRef] [Green Version]
- Karaduman, N.S.; Karaduman, Y.; Ozdemir, H.; Ozdemir, G. Textile Reinforced Structural Composites for Advanced Applications. In Textiles for Advanced Applications; Kumar, B., Thakur, S., Eds.; InTech: London, UK, 2017; Available online: http://www.intechopen.com/books/textiles-for-advanced-applications/textile-reinforced-structural-composites-for-advanced-applications (accessed on 16 July 2021).
- Orsi, I.A.; Soares, R.G.; Villabona, C.A.; Panzeri, H. Evaluation of the flexural strength and elastic modulus of resins used for temporary restorations reinforced with particulate glass fibre: Flexural strength and elastic modulus of resin. Gerodontology 2012, 29, e63–e68. [Google Scholar] [CrossRef]
- Umair, M.; Hamdani, S.T.A.; Nawab, Y.; Asghar, M.A.; Hussain, T.; Saouab, A. Effect of Pile Height on the Mechanical Properties of 3D Woven Spacer Composites. Fibers Polym. 2019, 20, 1258–1265. [Google Scholar] [CrossRef]
- Umair, M.; Hamdani, S.T.A.; Nawab, Y.; Asghar, M.A.; Hussain, T. Compression and recovery behavior of three-dimensional woven spacer composites. J. Ind. Text. 2021, 51, 93–109. [Google Scholar] [CrossRef]
- Li, D.; Zhao, C.; Jiang, L.; Jiang, N. Experimental study on the bending properties and failure mechanism of 3D integrated woven spacer composites at room and cryogenic temperature. Compos. Struct. 2014, 111, 56–65. [Google Scholar] [CrossRef]
- Li, D.; Zhao, C.; Jiang, N.; Jiang, L. Fabrication, properties and failure of 3D integrated woven spacer composites with thickened face sheets. Mater. Lett. 2015, 148, 103–105. [Google Scholar] [CrossRef]
- Hassanzadeh, S.; Hasani, H.; Zarrebini, M. Compression load-carrying capacity of 3D-integrated weft-knitted spacer composites. J. Sandw. Struct. Mater. 2019, 21, 1379–1405. [Google Scholar] [CrossRef]
- Chen, S.; Long, H.; Liu, Y.; Hu, F. Mechanical Properties Of 3D-Structure Composites Based On Warp-Knitted Spacer Fabrics. Autex Res. J. 2015, 15, 127–137. [Google Scholar] [CrossRef] [Green Version]
- Xu, F.; Sun, L.; Zhu, L.; Yang, S.; Hui, D.; Qiu, Y. X-ray 3D microscopy analysis of fracture mechanisms for 3D orthogonal woven E-glass/epoxy composites with drilled and moulded-in holes. Compos. Part B Eng. 2018, 133, 193–202. [Google Scholar] [CrossRef]
- Hornberger, B.; Bale, H.; Merkle, A.; Feser, M.; Harris, W.; Etchin, S.; Leibowitz, M.; Qiu, W.; Tkachuk, A.; Gu, A.; et al. X-ray microscopy for in situ characterization of 3D nanostructural evolution in the laboratory. In Proceedings Volume 9592: X-Ray Nanoimaging: Instruments and Methods II, San Diego, CA, USA, 9–13 August 2015; Lai, B., Ed.; SPIE: San Diego, CA, USA, 2015; p. 95920Q. Available online: http://proceedings.spiedigitallibrary.org/proceeding.aspx?doi=10.1117/12.2188728 (accessed on 16 July 2021).
- Kersani, M.; Lomov, S.; Van Vuure, A.; Bouabdallah, A.; Verpoest, I. Microstructural analysis using X-ray computed tomography (CT) in flax/epoxy composites. IOP Conf. Ser. Mater. Sci. Eng. 2016, 139, 012026. [Google Scholar] [CrossRef] [Green Version]
- Zhao, C.-Q.; Li, D.-S.; Ge, T.-Q.; Jiang, L.; Jiang, N. Experimental study on the compression properties and failure mechanism of 3D integrated woven spacer composites. Mater. Des. (1980–2015) 2014, 56, 50–59. [Google Scholar] [CrossRef]
- Nosraty, H.; Mirdehghan, A.; Barikani, M.; Akhbari, M. Edgewise Compression Behavior of Three-Dimensional Integrated Woven Sandwich Composite Panels. J. Text. Polym. 2020, 8, 12. [Google Scholar]


| Specifications | A | B | C | D | E |
|---|---|---|---|---|---|
| Core height (mm) | 3.0 | 5.0 | 8.0 | 10.0 | 12.0 |
| Face sheet thickness (mm) | 0.36 | 0.36 | 0.36 | 0.58 | 0.58 |
| Fabric weight (g/m2) | 720 | 810 | 920 | 1440 | 1440 |
| Specifications (Average) | A | B | C | D | E |
|---|---|---|---|---|---|
| Total height (mm) | 3.40 | 5.42 | 8.69 | 10.60 | 12.62 |
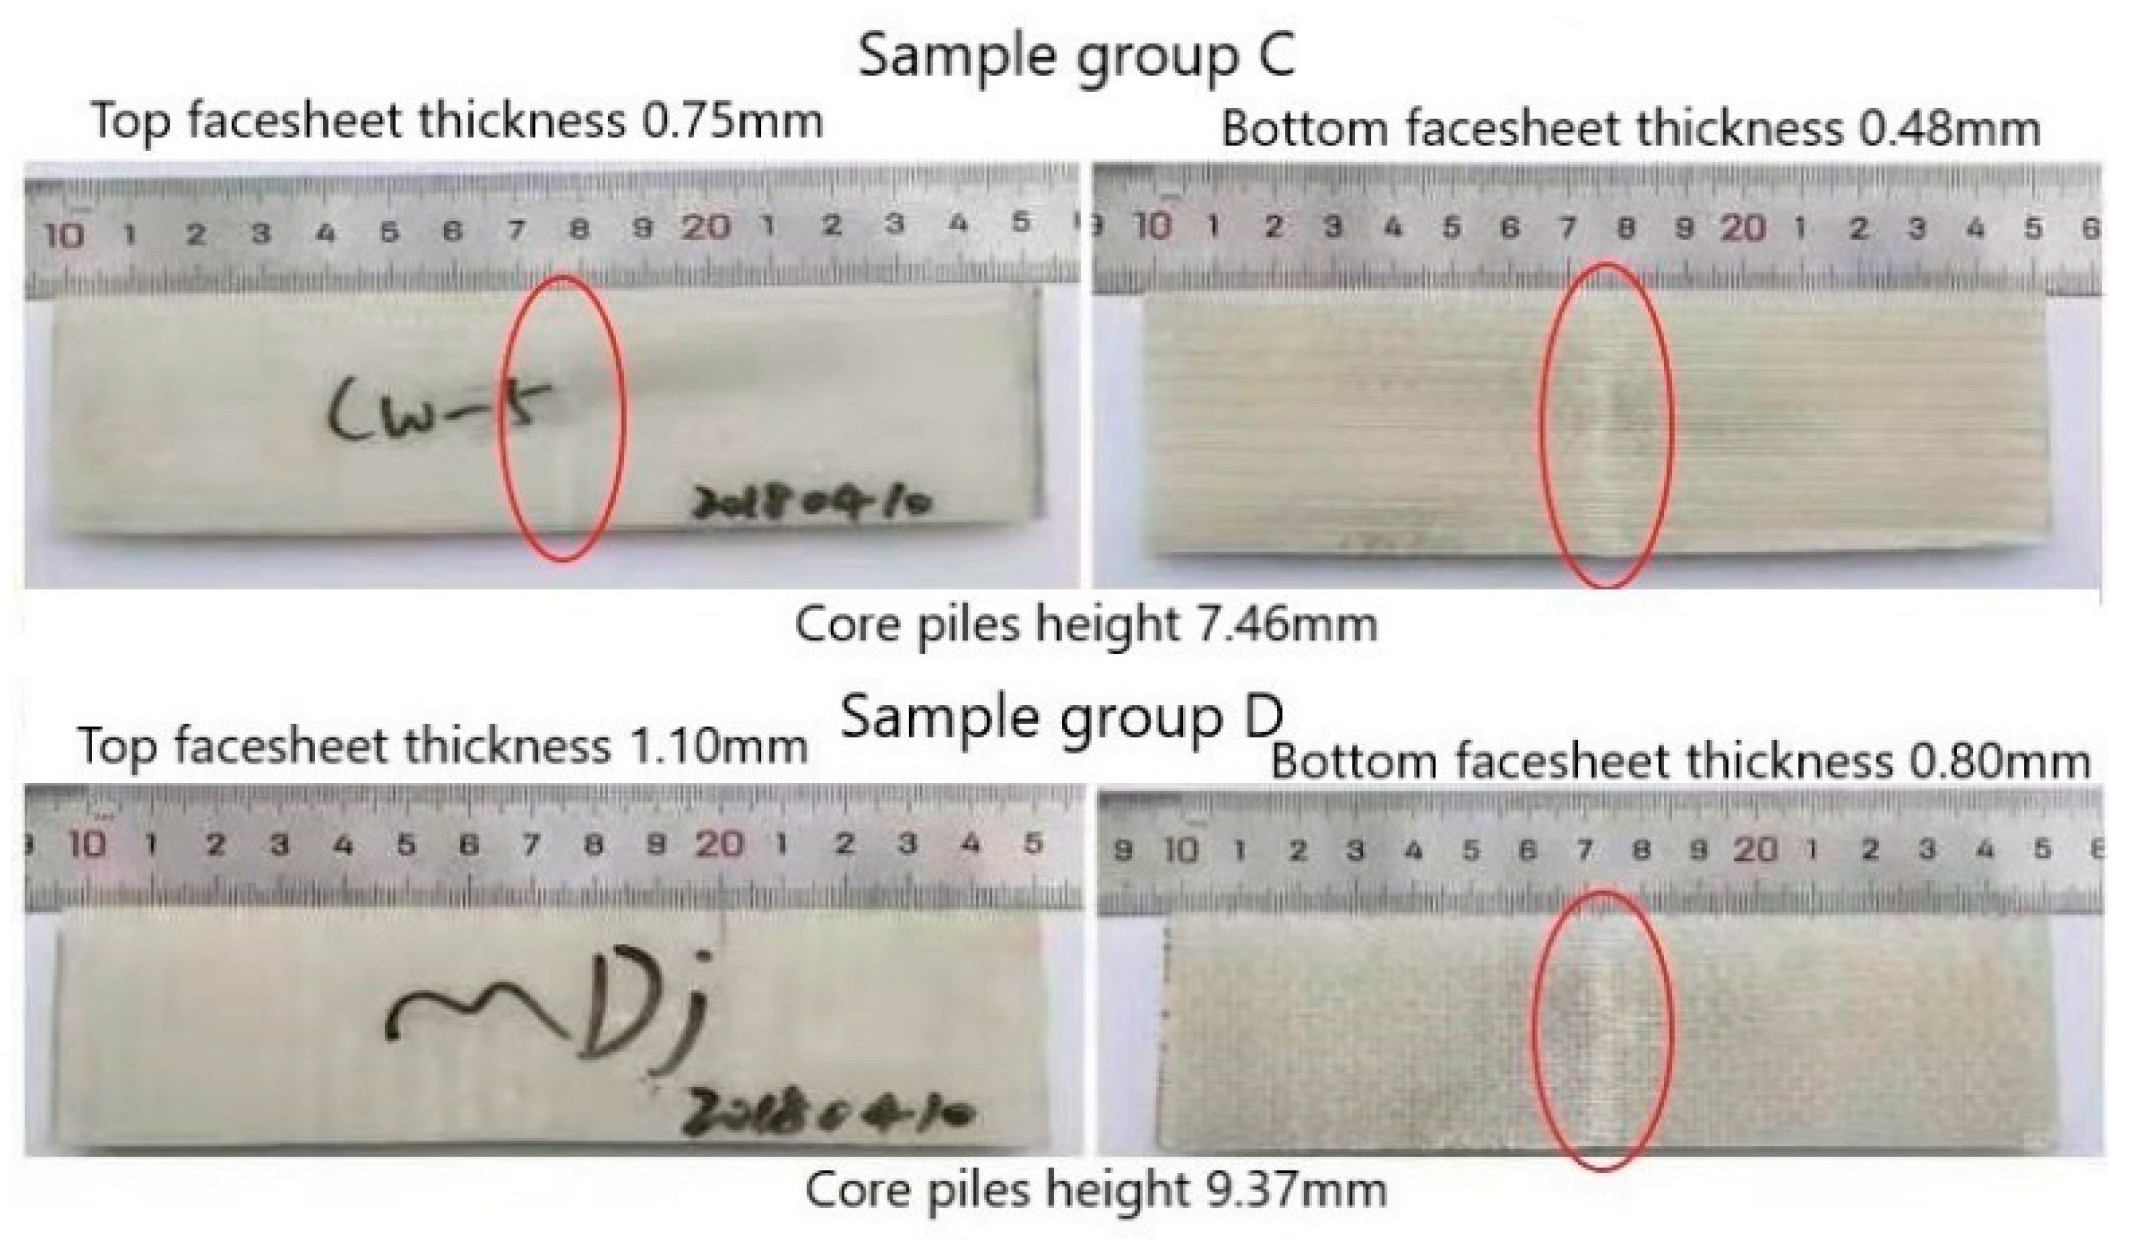
| Core height (mm) | 2.17 | 4.19 | 7.46 | 9.37 | 11.39 |
| Top face sheet thickness (mm) | 0.75 | 0.75 | 0.75 | 1.10 | 1.10 |
| Bottom face sheet thickness (mm) | 0.48 | 0.48 | 0.48 | 0.80 | 0.80 |
| Composite weight (g/m2) | 1510 | 1680 | 1900 | 2930 | 3060 |
| Group One | Top Face Sheet Thickness (mm) | Bottom Face Sheet Thickness (mm) | Core Material Height (mm) | Group Two | Top Face Sheet Thickness (mm) | Bottom Face Sheet Thickness (mm) | Core Material Height (mm) |
|---|---|---|---|---|---|---|---|
| Sample group A | 1.10 | 0.80 | 11.39 | Sample group C | 0.75 | 0.48 | 7.46 |
| Sample group B | 1.10 | 0.80 | 9.37 | Sample group D | 0.75 | 0.48 | 4.19 |
| - | - | - | - | Sample group E | 0.75 | 0.48 | 2.17 |
| Group | Average Bending Strength in Warp Direction (MPa) | Average Bending Strength in Weft Direction (MPa) |
|---|---|---|
| A | 94 | 144 |
| B | 80 | 78 |
| C | 32 | 45 |
| D | 20 | 50 |
| E | 14 | 27 |
| Length (mm) | Width (mm) | Yield Load (N) | Compressive Stress at Yield (MPa) | |
|---|---|---|---|---|
| 1 | 61.28 | 59.96 | 2839 | 0.72 |
| 2 | 60.98 | 60.58 | 2769 | 0.75 |
| 3 | 60.60 | 60.59 | 3320 | 0.91 |
| 4 | 60.56 | 60.30 | 2773 | 0.76 |
| 5 | 60.02 | 59.88 | 2968 | 0.83 |
| Average value | 60.68 | 60.26 | 2934 | 0.80 |
| Standard deviation | 0.48 | 0.33 | 230.44 | 0.07 |
| Coefficient of Variation | 0.78 | 0.55 | 7.85 | 8.28 |
| Length (mm) | Width (mm) | Yield Load (N) | Compressive Stress at Yield (MPa) | |
|---|---|---|---|---|
| 1 | 60.12 | 60.00 | 29046 | 8.07 |
| 2 | 61.26 | 60.34 | 33472 | 9.06 |
| 3 | 60.82 | 60.40 | 27999 | 7.62 |
| 4 | 60.68 | 60.62 | 30266 | 8.23 |
| 5 | 60.78 | 60.54 | 28597 | 7.77 |
| Average value | 60.72 | 60.38 | 29876 | 8.15 |
| Standard deviation | 0.45 | 0.24 | 2175 | 0.56 |
| Coefficient of Variation | 0.75 | 0.40 | 7.2 | 6.87 |
| Sample Group | Maximum Load (n) | Cross-Sectional Area (mm2) | Ultimate Tensile Strength (MPa) |
|---|---|---|---|
| A | 3755.4 | 85 | 44.18 |
| B | 4071.73 | 135.5 | 30.05 |
| C | 3045.98 | 217.25 | 14.02 |
| D | 3439.81 | 265 | 12.98 |
| Sample Group | Maximum Load (N) | Cross-Sectional Area (mm2) | Compression Strength (MPa) |
|---|---|---|---|
| A | 1636.21 | 51 | 32.08 |
| B | 2250.48 | 81.3 | 27.68 |
| C | 1605.59 | 130.35 | 12.32 |
| D | 1429.12 | 159 | 8.99 |
Publisher’s Note: MDPI stays neutral with regard to jurisdictional claims in published maps and institutional affiliations. |
© 2021 by the authors. Licensee MDPI, Basel, Switzerland. This article is an open access article distributed under the terms and conditions of the Creative Commons Attribution (CC BY) license (https://creativecommons.org/licenses/by/4.0/).
Share and Cite
Zhu, L.; Rahman, M.B.; Wang, Z. Effect of Structural Differences on the Mechanical Properties of 3D Integrated Woven Spacer Sandwich Composites. Materials 2021, 14, 4284. https://doi.org/10.3390/ma14154284
Zhu L, Rahman MB, Wang Z. Effect of Structural Differences on the Mechanical Properties of 3D Integrated Woven Spacer Sandwich Composites. Materials. 2021; 14(15):4284. https://doi.org/10.3390/ma14154284
Chicago/Turabian StyleZhu, Lvtao, Mahfuz Bin Rahman, and Zhenxing Wang. 2021. "Effect of Structural Differences on the Mechanical Properties of 3D Integrated Woven Spacer Sandwich Composites" Materials 14, no. 15: 4284. https://doi.org/10.3390/ma14154284
APA StyleZhu, L., Rahman, M. B., & Wang, Z. (2021). Effect of Structural Differences on the Mechanical Properties of 3D Integrated Woven Spacer Sandwich Composites. Materials, 14(15), 4284. https://doi.org/10.3390/ma14154284