3.1. Effects inside VIC-T
The VIC-T 3D polymer gel dosimeter was previously tested [
16] with a static light scattering apparatus (SLS) at two temperatures: 23 and 43 °C, at the right angle of the goniometer. The configuration of the instrument allowed for the registration of the scattered light quanta from the VIC-T during the experiment. Similar results were obtained at both temperatures (see Figure 10a,c in [
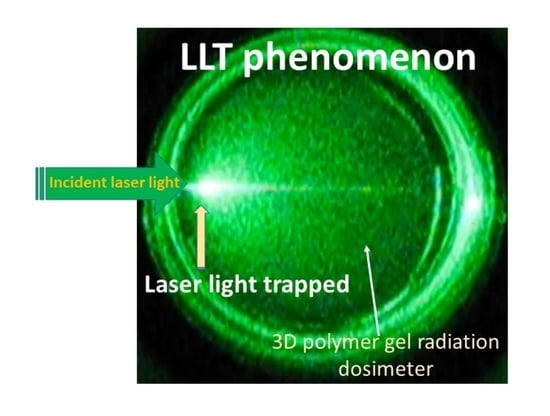
16]). The main surprising observation was that after about 4 min from the start of the experiment, the intensity of the scattered light increased sharply, followed by a sharp drop to very low values, below the values recorded at the beginning of the experiment. The instrument recorded these low values of the scattered light intensity, regardless of the measurement temperature, for a period of 15 and 5 min, respectively, at a lower and higher temperature. The laser light seemed to be trapped, and the SLS detector at right angle to the incident laser beam did not register much light scattering. This observation was called the laser light trapping (LLT) phenomenon in the 3D polymer gel dosimeter.
In the present work we undertook to repeat such measurements at 23 °C for the VIC-T. The results were as in the previous study [
16]. In addition, we tried to answer the following questions: (i) which VIC-T components are necessary for the occurrence of the LLT phenomenon and (ii) what is actually behind it. Thus, SLS measurements were carried out for VIC-T without HQ and VIC-T without THPC in the composition, because in the previous work the VIC-T was examined without gelatine and without gelatine and THPC (see Figure 10a,c in [
16]). For the latter two, the LLT was not noticed.
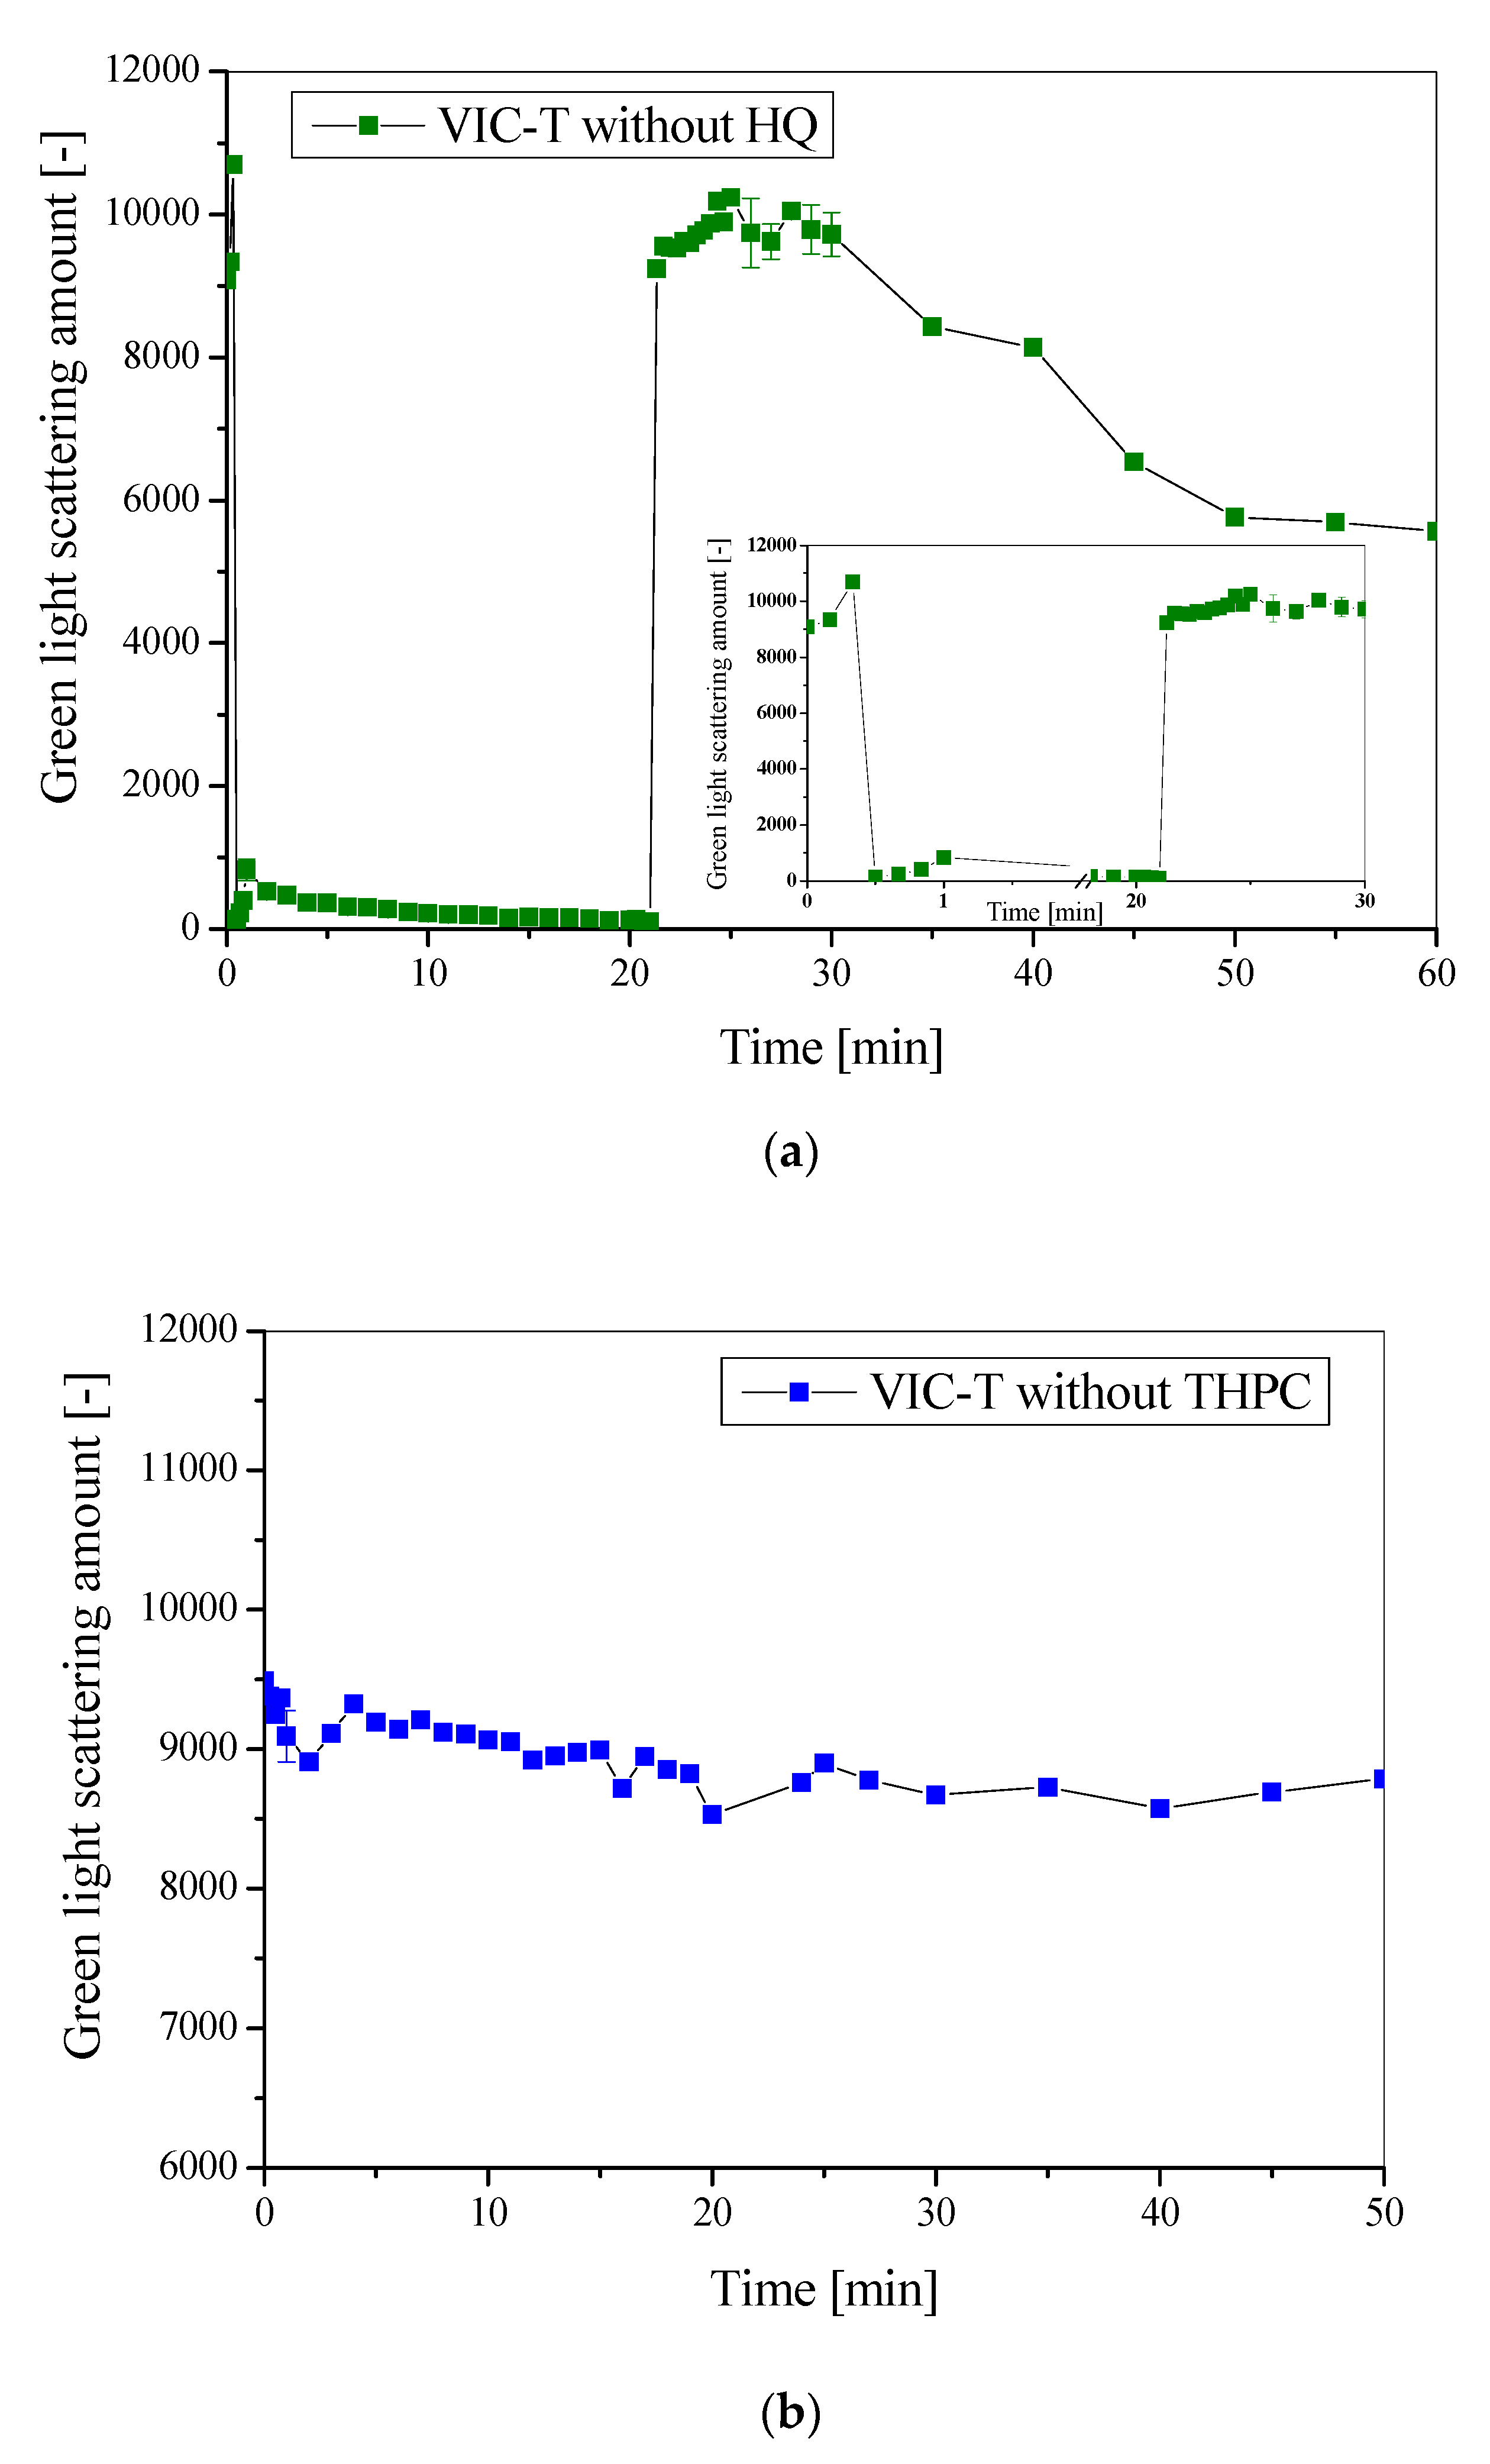
Figure 2 shows the actual results for VIC-T without HQ and VIC-T without THPC.
Figure 2a shows that HQ does not play a role in the LLT phenomenon as the phenomenon does not occur regardless of its presence or absence in the dosimeter composition. However,
Figure 2b shows that THPC is important for the occurrence of LLT; without this, no LLT was observed. Therefore, by combining the experimental results of the previous work with the results of the present work, it is concluded that both gelatine and THPC should be present in a dosimeter composition for the LLT initiation. It also means that without THPC the VIC-T is stable under the influence of green laser light. Consequently, THPC itself or THPC covalently linked to gelatine [
16] is susceptible to laser irradiation. At this point, it was realized that the exact mechanism behind this photochemically induced process required separate studies.
After the SLS measurements described above, the question posed above remained: what is behind the observed LLT phenomenon. It occurred that one important effect in VIC-T following exposure to green laser light was overlooked in former study [
16]. Without realizing it, the VIC-T was disposed. On the other hand, in the present work, the dosimeter after laser irradiation was visually analyzed, which ended with noticing a very thin, barely visible white line passing through the gel substance exactly along the path of the green laser light (
Figure 3). It has become apparent that exposure to this green laser light of certain 3D polymer gel dosimeters containing gelatine and THPC (VIC-T in our case) cause polymerization and cross-linking of the vinyl monomers in the dosimeter composition. However, this observation did not fully answer the question about the LLT phenomenon.
The following experiment was designed to observe the white line formation process in the VIC-T in real time. To this end, a camera was attached above the VIC-T cuvette in the SLS instrument vat (
Figure 1) to record a film during the exposure of the VIC-T to green laser light. The results in the form of a video are attached to this work as a
supplementary material (Supplementary Material 1). Snapshots from the film were taken to illustrate the critical moments of polymerization and cross-linking and the LLT process in the VIC-T (
Figure 4a–f). The laser beam passing through the VIC-T can be easily seen as a green glowing line in each picture. In
Figure 4a, this line is quasi-uniform along the path of the laser beam. For the initial irradiation period up to about 3 min, the line looks like in
Figure 4a. During this time, the SLS instrument shows a stable signal with about the same scattering amount of the green laser light. In a longer time, brighter spots appear along the laser beam (
Figure 4b–d) and the SLS instrument shows a sharp exponential increase in the scattering amount (see Figure 10a in [
16] for VIC-T; the figure is analogous to
Figure 2a in this work for VIC-T without HQ). After this huge increase in the amount of scattered light registered by the SLS instrument, the scattering intensity dropped sharply to very low values, as can be seen in
Figure 4e,f. In these photos it is easy to see that the intensity of the scattered light is currently highest near the entrance of the incident green laser light into the VIC-T cuvette. There was a large spot that shines very intensively. The light scattered by this large spot at the entrance of the laser beam illuminates almost the entire VIC-T in the cuvette. This will affect the VIC-T gel in areas where the beam has not passed through-discussed in the next section. The SLS instrument collects the quanta of scattered light at right angle relative to the center of the sample. Careful observation with the naked eye shows that the white line does not shine as brightly at this point at such a long time in comparison to the line visible in
Figure 4a. A further conclusion is that the laser beam is trapped by scattering by large macromolecules growing along the beam path, and the longer the time is, this effect of growing macromolecules is transferred towards the entrance of the beam into the cuvette. This answers the question related to the nature of the LLT phenomenon.
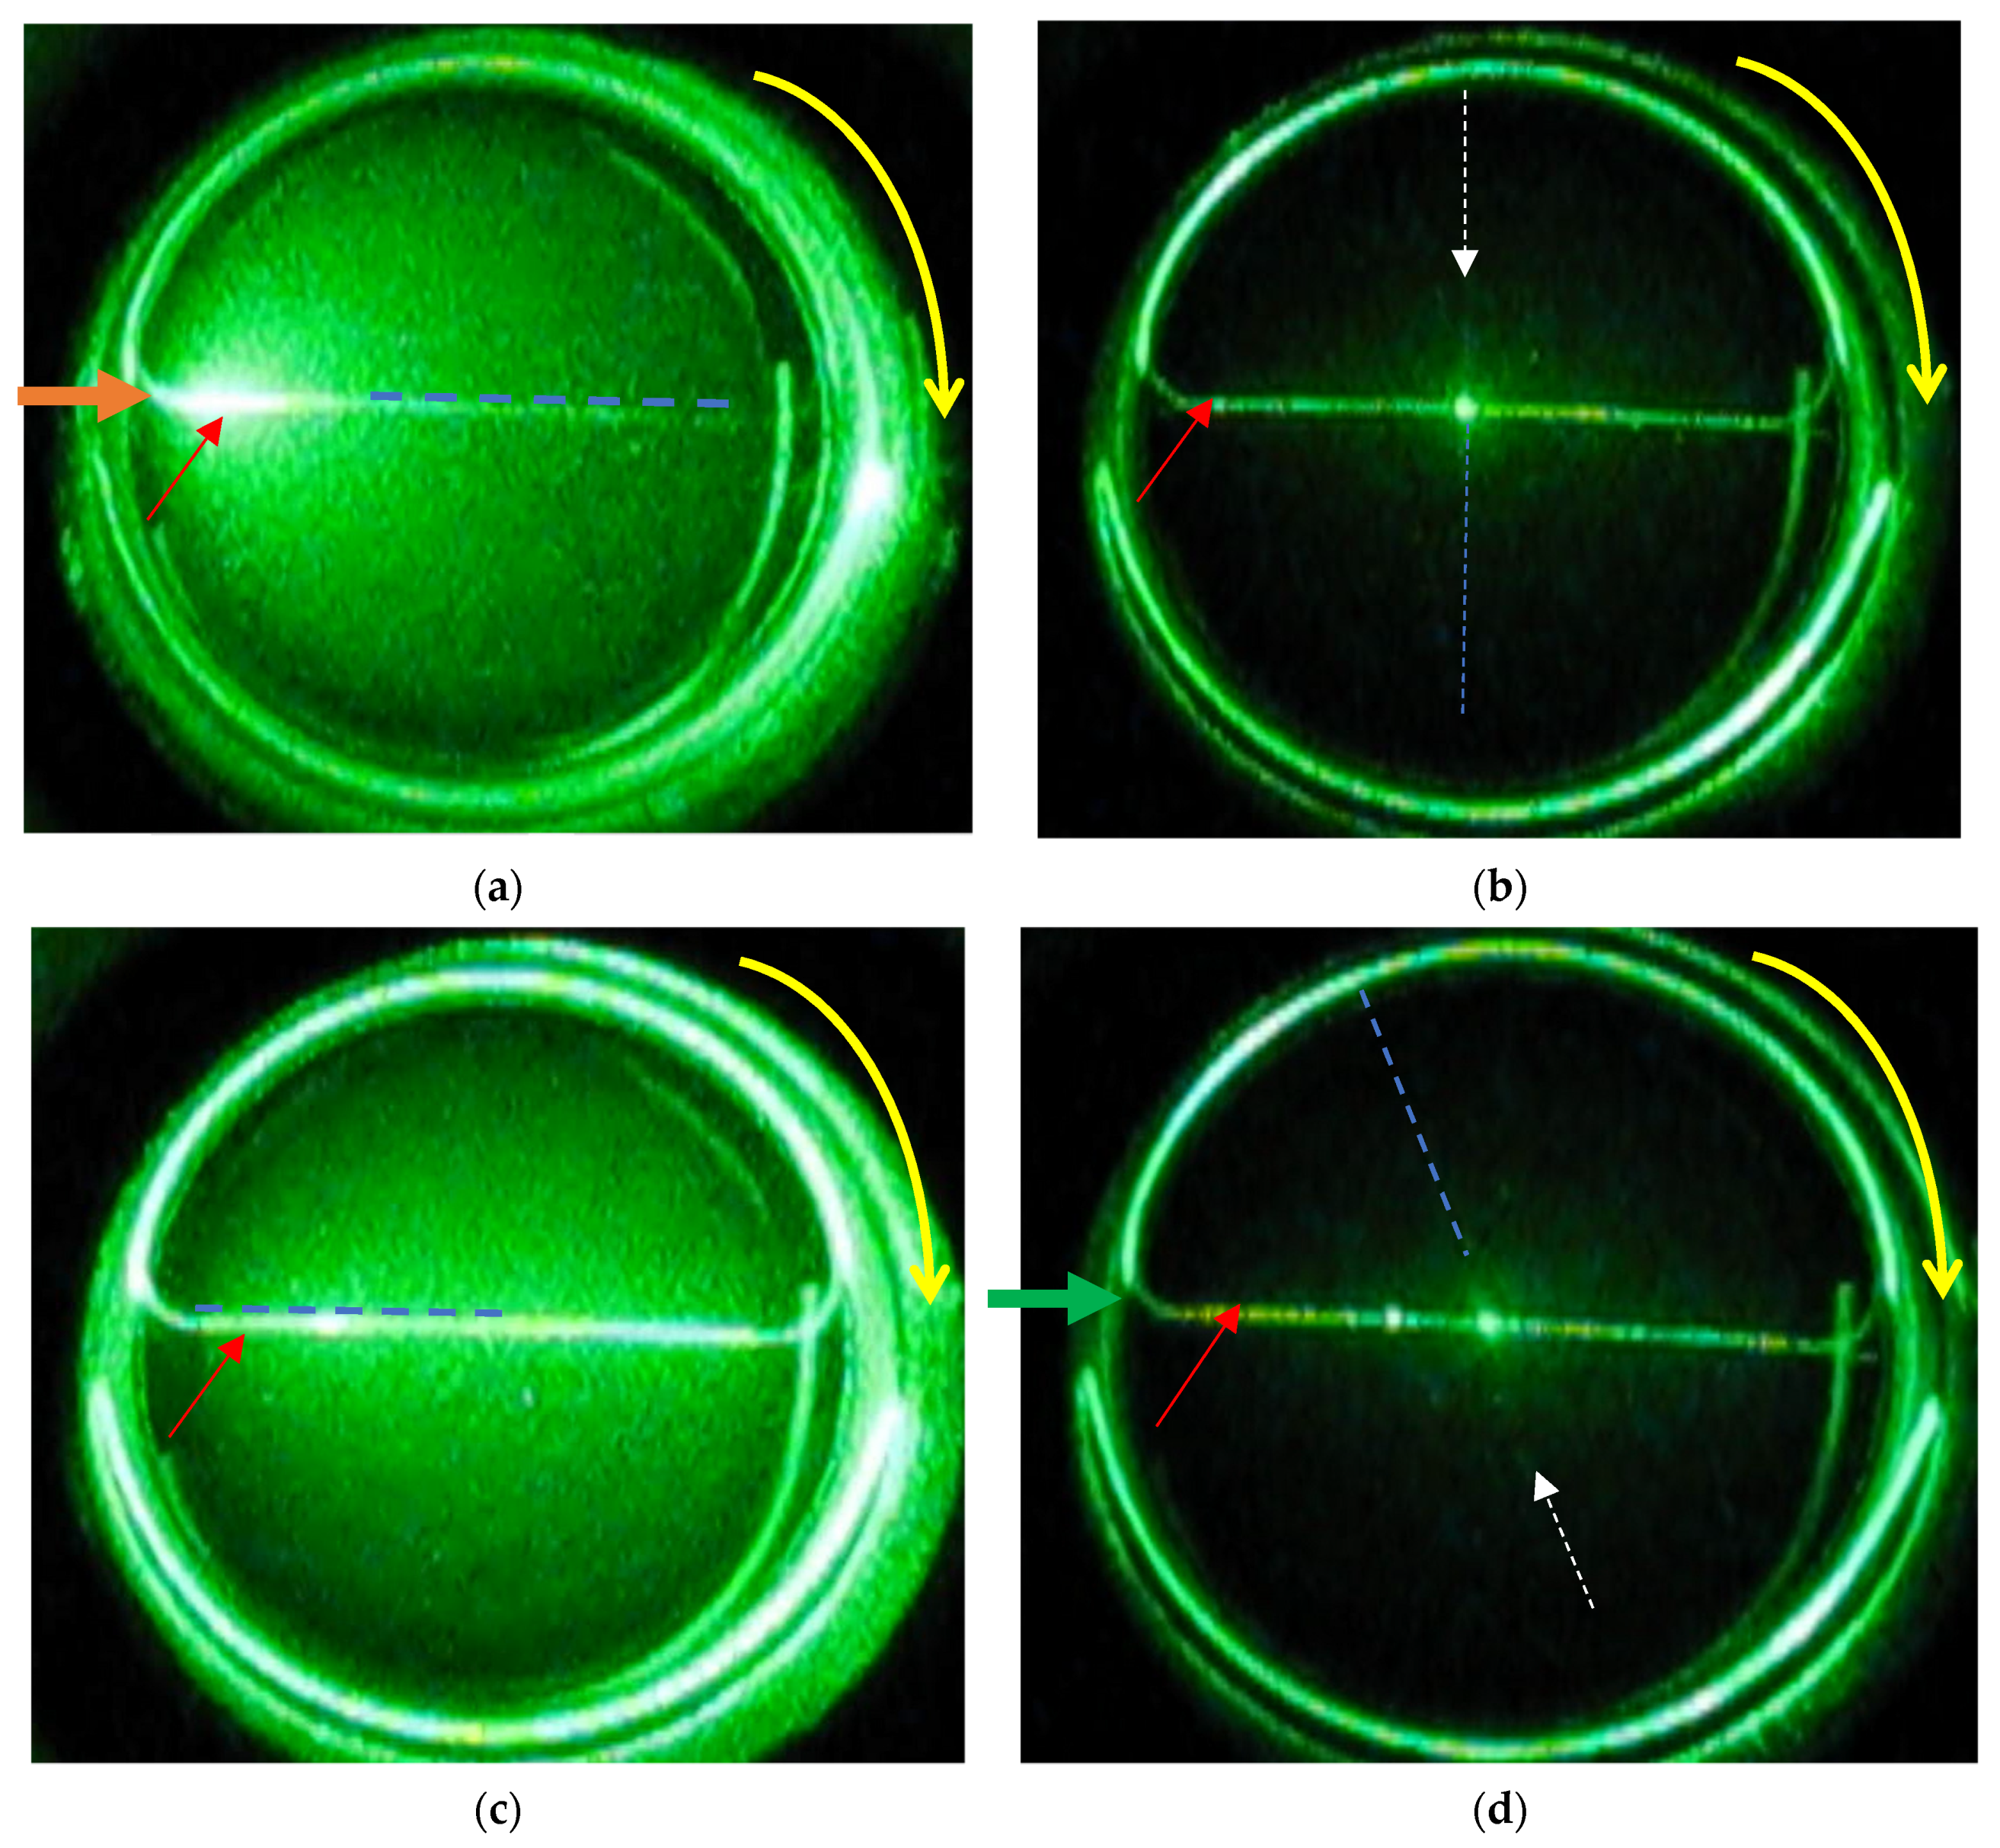
We were curious if the polymerization and cross-linking of the monomers in the VIC-T along the path of the laser beam is really inhomogeneous and if it is shifted towards the entrance of the laser beam into the cuvette after a longer exposure time. For this reason, the VIC-T cuvette was turned clockwise after approximately 60 min of exposure and a film was recorded (
Supplementary Material 2). Then, several snapshots were taken, which are shown in
Figure 5. In these snapshots, the dashed blue line and the white dashed arrow indicate the position of the white line corresponding to polymerized VIC-T monomers. Red and orange arrows indicate the path of the laser beam. By turning the cuvette, the position of the white line changed. In
Figure 5a, the white line runs along the beam path exactly at the end of irradiation; strong illumination is visible at the entrance of the laser beam to the cuvette. In
Figure 5b, this line is at the right angle to the incident laser beam. The illumination of the entire substance of the gel dosimeter is significantly reduced and only in the center of the sample is a bright spot visible as a result of the crossing of the laser beam with the white line. In
Figure 5c the white line is at an angle of 180° to the incident laser beam. The entire gel dosimeter is illuminated by quanta of scattered light. Note that in this position the dosimeter illumination is more homogeneous than in the position in
Figure 5a. This position shows that the degree of polymerization and cross-linking of the monomers is not the same further away from the entrance of the laser beam into the VIC-T cuvette. If it was the same, a bright spot should be visible near the entrance of the laser beam into the cuvette. In
Figure 5d the white line is at an angle of 250° to the laser beam, so it interferes with the laser beam only in the center of the sample-a bright luminous point. In conclusion, only the white line, and thus the polymerized VIC-T monomers, contribute to the intense scattering of the incident laser light. The line is not homogeneous along its entire length.
3.2. Raman Spectroscopy Analysis
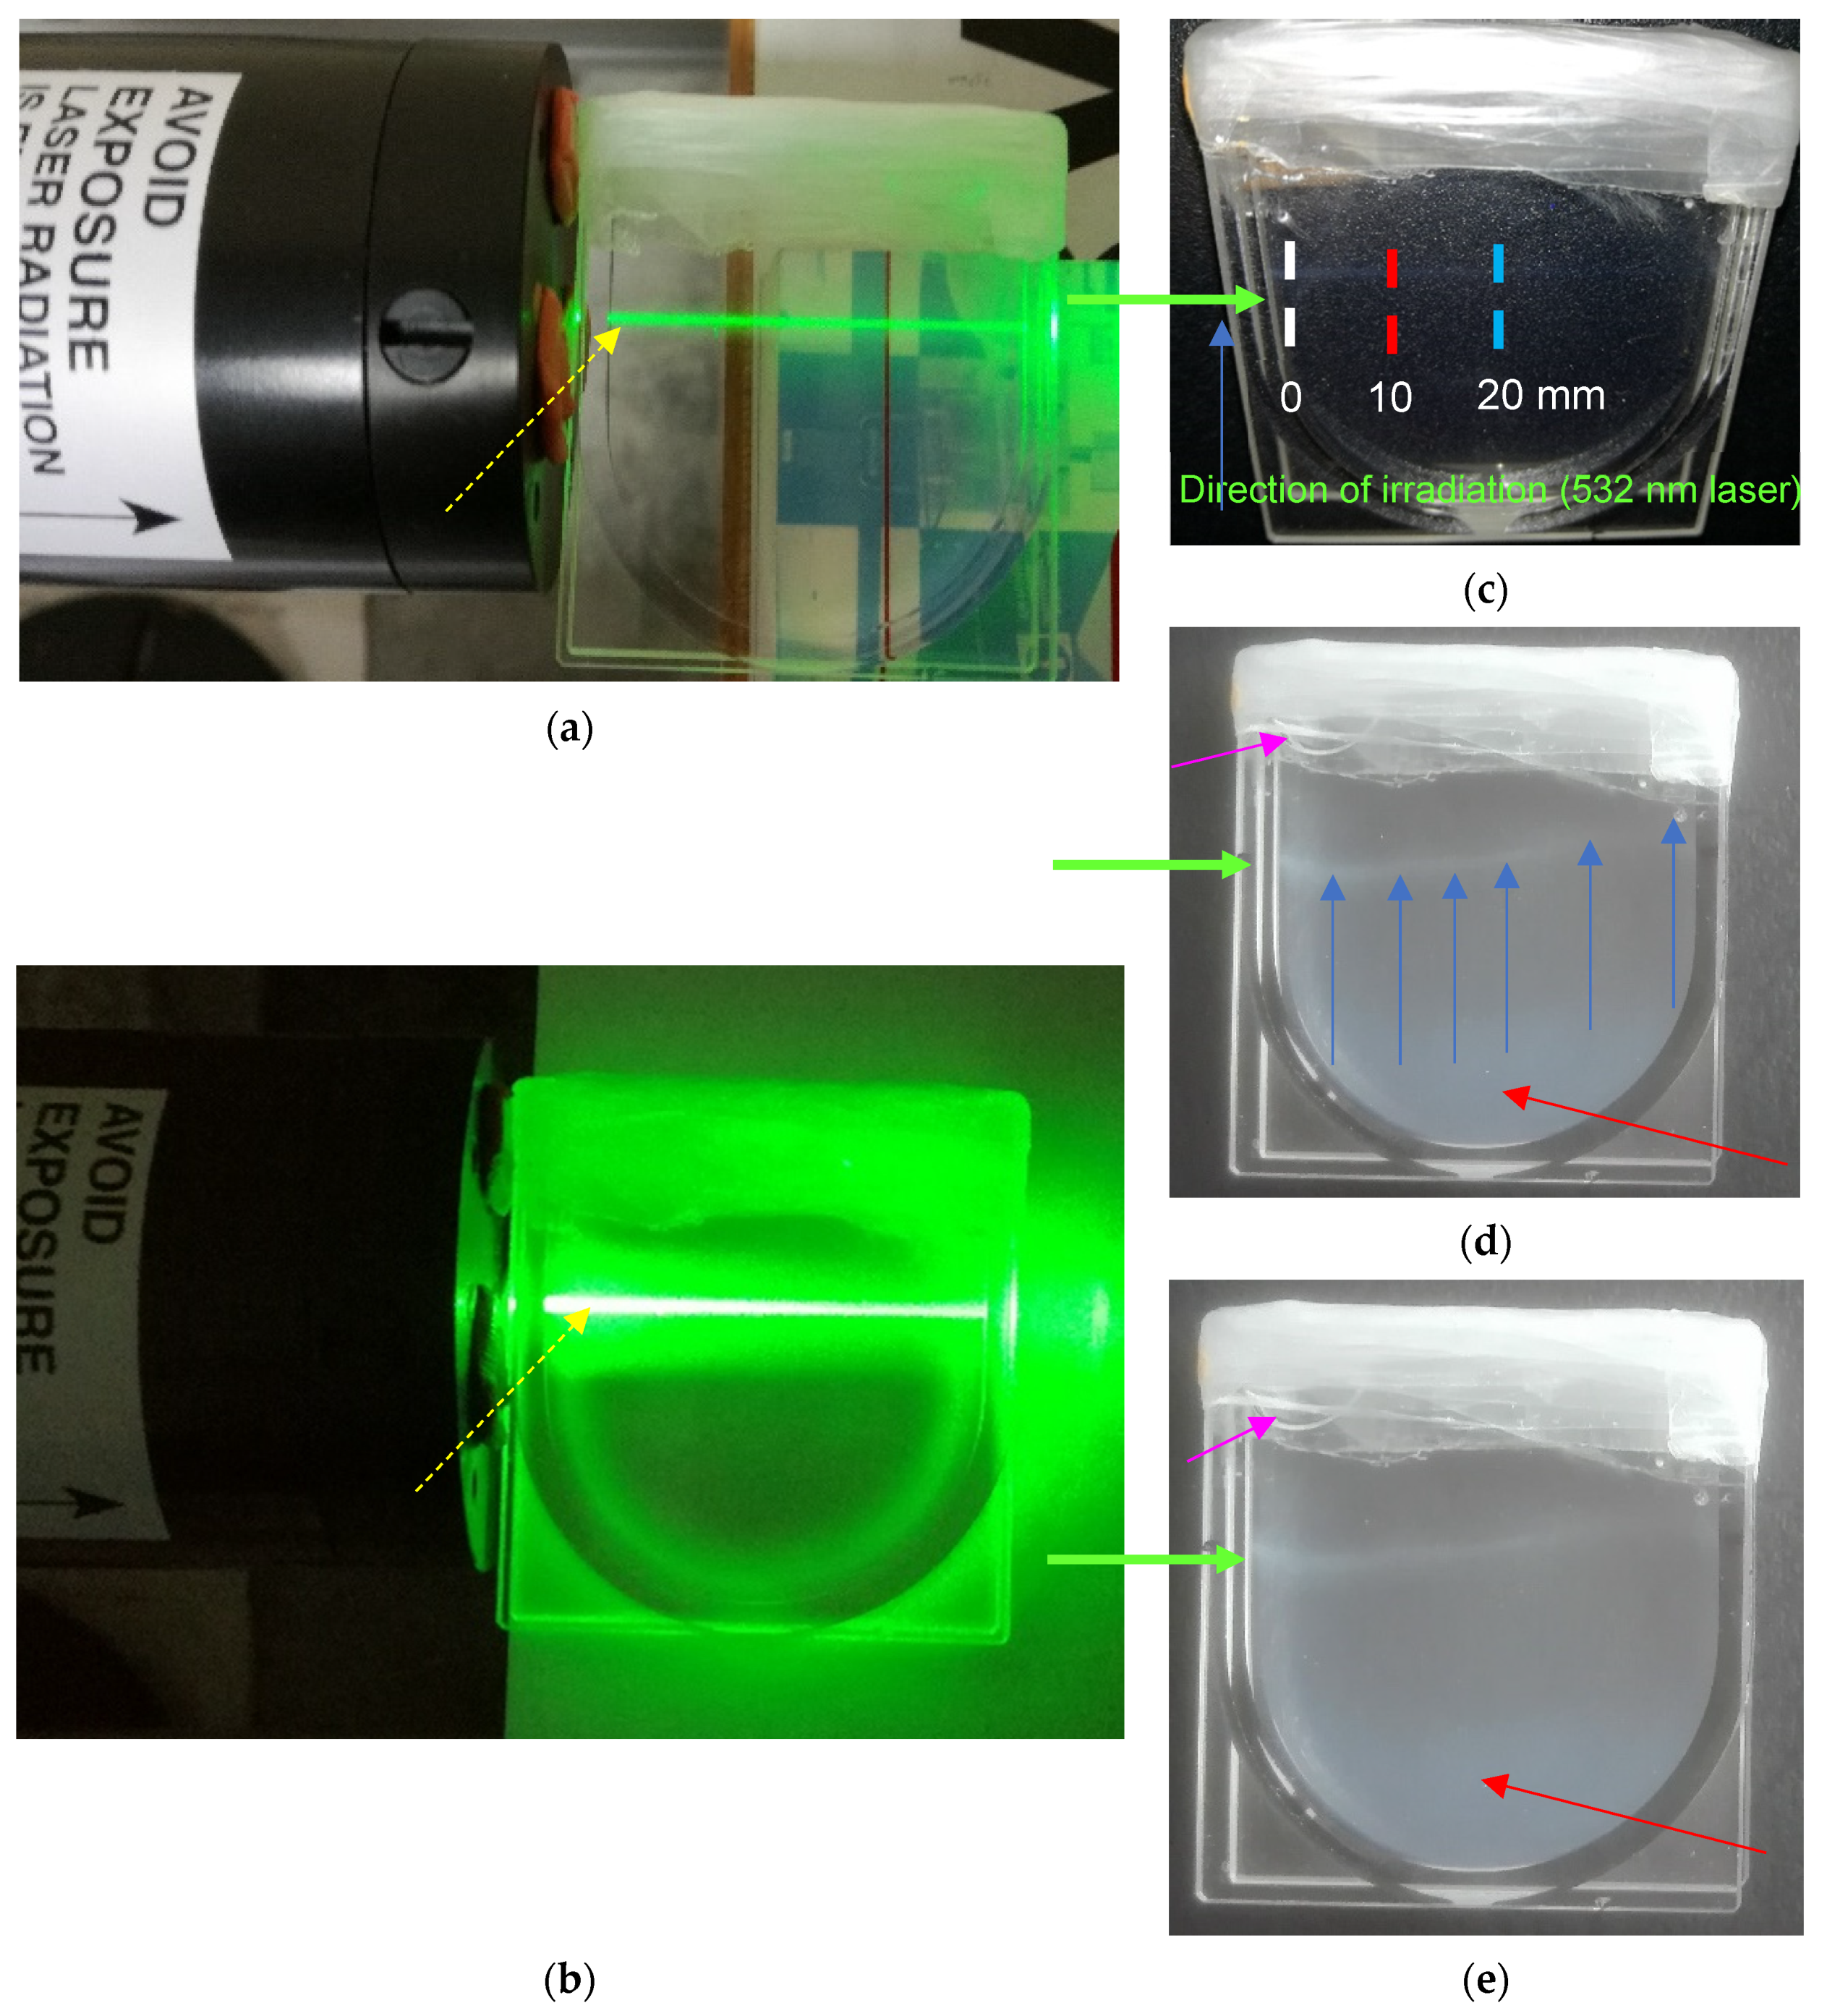
In order to track the photochemically induced reactions in VIC-T, an experiment was designed in which the VIC-T dosimeter was placed in a flat cuvette adapted to the measuring cavity of Raman spectroscopy instrument (
Figure 6). The dosimeter in the cuvette was placed close to the green light output of the laser used (
Figure 6a,b) so that the light beam passed through the dosimeter close to the upper wall of the cuvette. Approximately 4–5 min of initial illumination did not visually change the gel in the cuvette (
Figure 6a). The beam was passing though the gel dosimeter such that the intensity of the green light along the laser beam was the same (visual inspection). After a long time, the green laser beam inside the gel dosimeter began to glow more intensely along its path. After 60 min of laser irradiation, the entire gel dosimeter and the beam in its path glowed with intense green light; the beam itself glowed even white–green in the center along the path through the cuvette (
Figure 6b). It was assumed that polymerization and cross-linking of VIC-T monomers took place along the laser path, and the resulting large macromolecules scattered the laser light so that the entire dosimeter glowed green. All the same, the entire gel dosimeter in the cuvette was exposed to quanta of scattered green laser light. The naked eye examination also showed that the illumination along the laser path was more intense near the light entry into the cuvette (
Figure 6b). This was analogous to the results presented in the previous section.
Immediately after irradiation, the gel dosimeter was crystal clear and transparent, and only a thin white line was visible in the part through which the laser beam was passed (
Figure 6c). We will continue to refer to that white line in this section. The line ran exactly along the path of the laser beam. This white line corresponded to the polymerized monomer components of VIC-T. However, as the storage time passed, we noticed that the gel dosimeter changed from transparent to opaque, with the white line deviating from the initial linearity (
Figure 6d,e). The opacity of the volume of the gel dosimeter seems to be a consequence of absorption of laser scattered quanta by monomers in the VIC-T, which must have triggered the polymerization process. It should be mentioned that our previous studies have shown that VIC-T is stable for at least 10 days after preparation with no visible change in transparency; measured R
2,0 NMR (nuclear magnetic resonance, NMR, spin-spin relaxation rate; R
2 = 1/T
2, T
2 denotes spin-spin relaxation time) was stable over the period mentioned (see Figure 3a,c in [
16]).
The thin white line in the gel dosimeter bends downward at the beginning and upwards at a higher distance from where the laser beam has entered the cuvette (
Figure 6d,e). There can be many reasons for this behavior. First of all, it should be emphasized that the cuvette was completely filled with the VIC-T dosimetric solution and tightly covered with a thick layer of Parafilm
® foil. As a result, fresh air hardly penetrates the gel during storage. The bending of the lines could be caused by polymer macromolecules forming in the entire volume of the dosimeter, which could shrink and thus distort the white line. Another reason may be the concavity of the gel on top due to the shrinkage of the polymer or/and the presence of a small bubble that has expanded during storage due to the contraction of the gel.
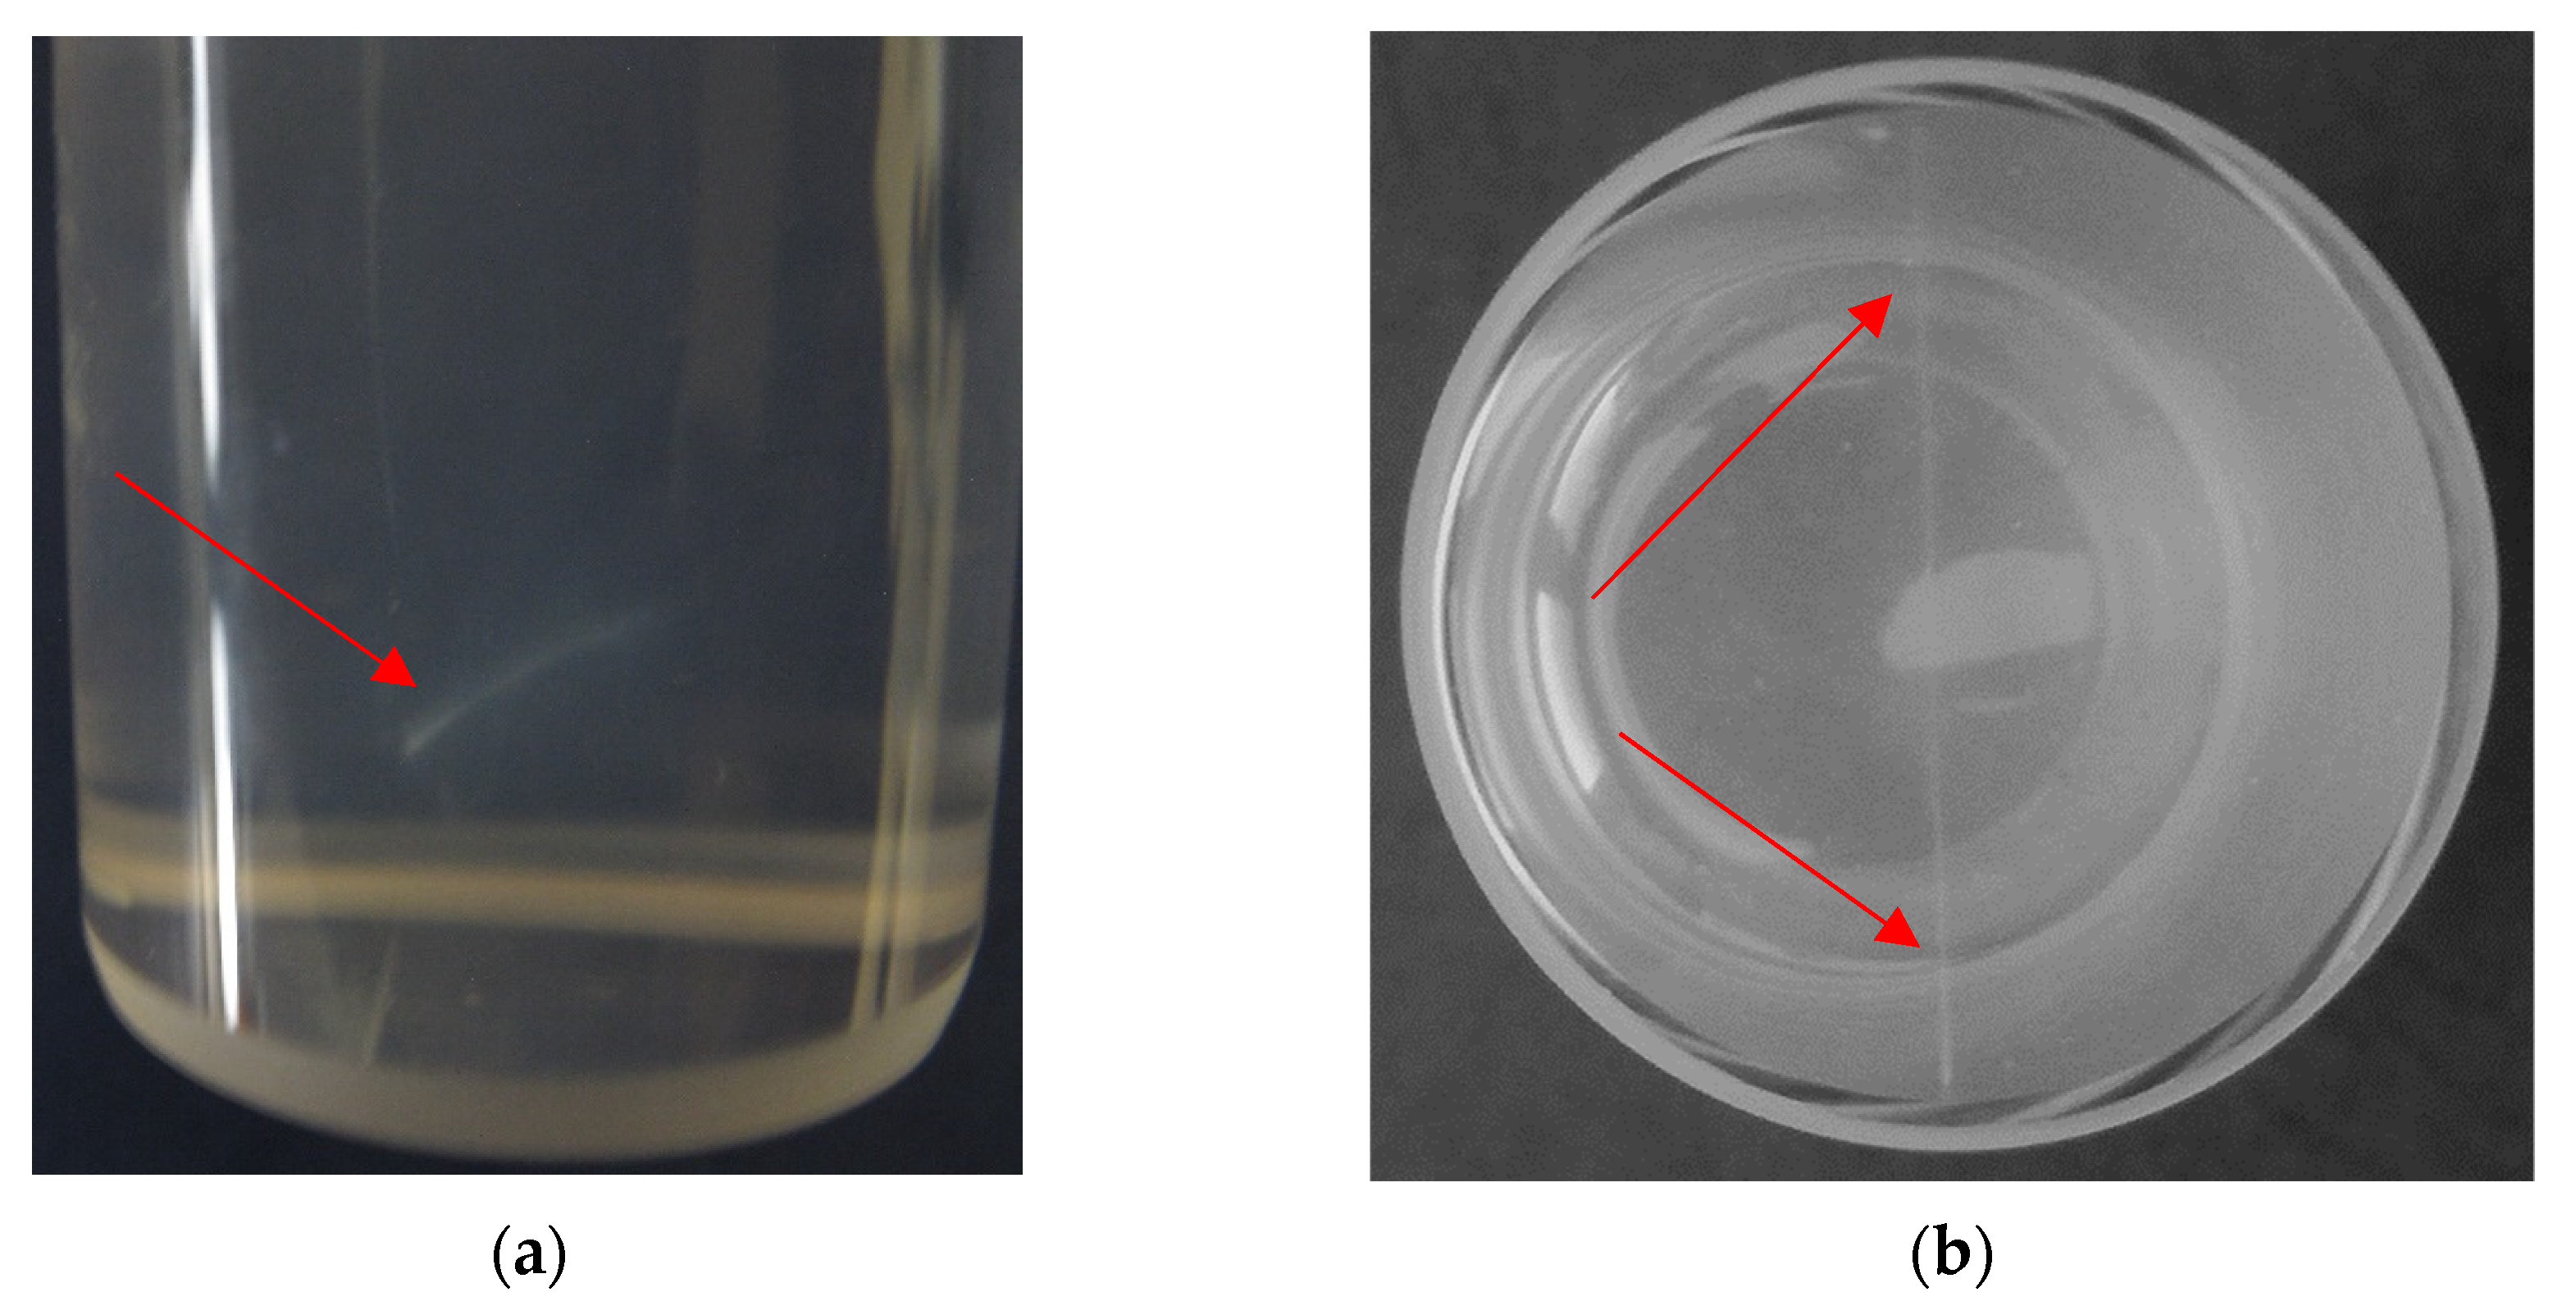
To look at changes in the gel dosimeter over time, several images of the VIC-T cuvette were taken after irradiation. The photographs were analyzed in ImageJ and the results obtained are shown in
Figure 7. We could see that the bending of the white line corresponding to the polymerized VIC-T monomers at a distance of about 8 mm may be related to the concavity of the gel dosimeter at the top of the cuvette. This concavity at about 8 mm progressed with storage, while the other at about 25 mm disappeared with prolonged storage. The progress of the former is consistent with the bending of the white line at a short distance. The concavity of the gel dosimeter may result from the fact that the thick layer of Parafilm
® film is stiff, as is the cuvette used, which is a rigid container, and the contraction of the gel dosimeter forces such observed deformations (concavities). We saw a similar behavior of a 3D gel dosimeter (VIP) containing NVP in a large rigid container (left photo in
Figure 7c) in another study. In the event that such a container is not equipped with an internal pressure equalizing valve, a number of empty cavities (indicated by blue arrows in
Figure 7c) will be created. However, if the container is equipped with an internal pressure equalizing valve (indicated by the yellow arrow in the photo on the right), no cavities are present (
Figure 7c).
The results obtained in this experiment led to the following conclusions related to the measurements of some 3D polymer gel dosimeters with optical computed tomography instruments equipped with green laser light: (i) scanning laser light can induce polymerization and crosslinking of monomer components for dosimetric systems containing gelatine and THPC; (ii) photochemically induced polymerization occurs not only along the path of the laser beam after a certain period of exposure of the dosimeter to laser light; large molecules formed along the path of a laser beam scatter laser light so intensely that the light quanta can be absorbed by the monomer molecules in the whole dosimeter, leading to polymerization in the dosimeter volume over an extended period of time; (iii) there is a maximal period for which a gel dosimeter with gelatine and THPC can be measured or scanned by optical techniques using a green laser without inducing polymerization of monomers; this period is related to the measurement temperature–at lower temperature it is longer, at higher temperature it is shorter and usually amounts to a few minutes (see Figure 10 in [
16]); (iv) a construction of containers for 3D dosimeters impacts on a gel dosimeter substance; rigid containers promote the formation of empty cavities or concave places as a result of shrinkage of the gel dosimeter after irradiation, while containers with a pressure equalizing valve prevent such deformations of the gel dosimeters; they should promote the quality of the scanned images.
The area of the VIC-T dosimeter affected by green laser irradiation (532 nm, 2 mW) was analyzed by Raman spectroscopy.
Figure 8 shows the Raman spectra for the non-irradiated and irradiated area of the dosimeter. As reported in our previous study [
16], irradiation with ionizing radiation (30 Gy) reduces the intensity of the bands (in particular, the 1632 and 1647 cm
−1 bands corresponding to C=C of
N,
N′-methylenebisacrylamide and
N-vinylpyrrolidone, respectively) as a result of polymerization and cross-linking of monomeric VIC-T components. The same changes in the Raman spectra were observed by exposing the VIC-T to the green light of a 532 nm laser (
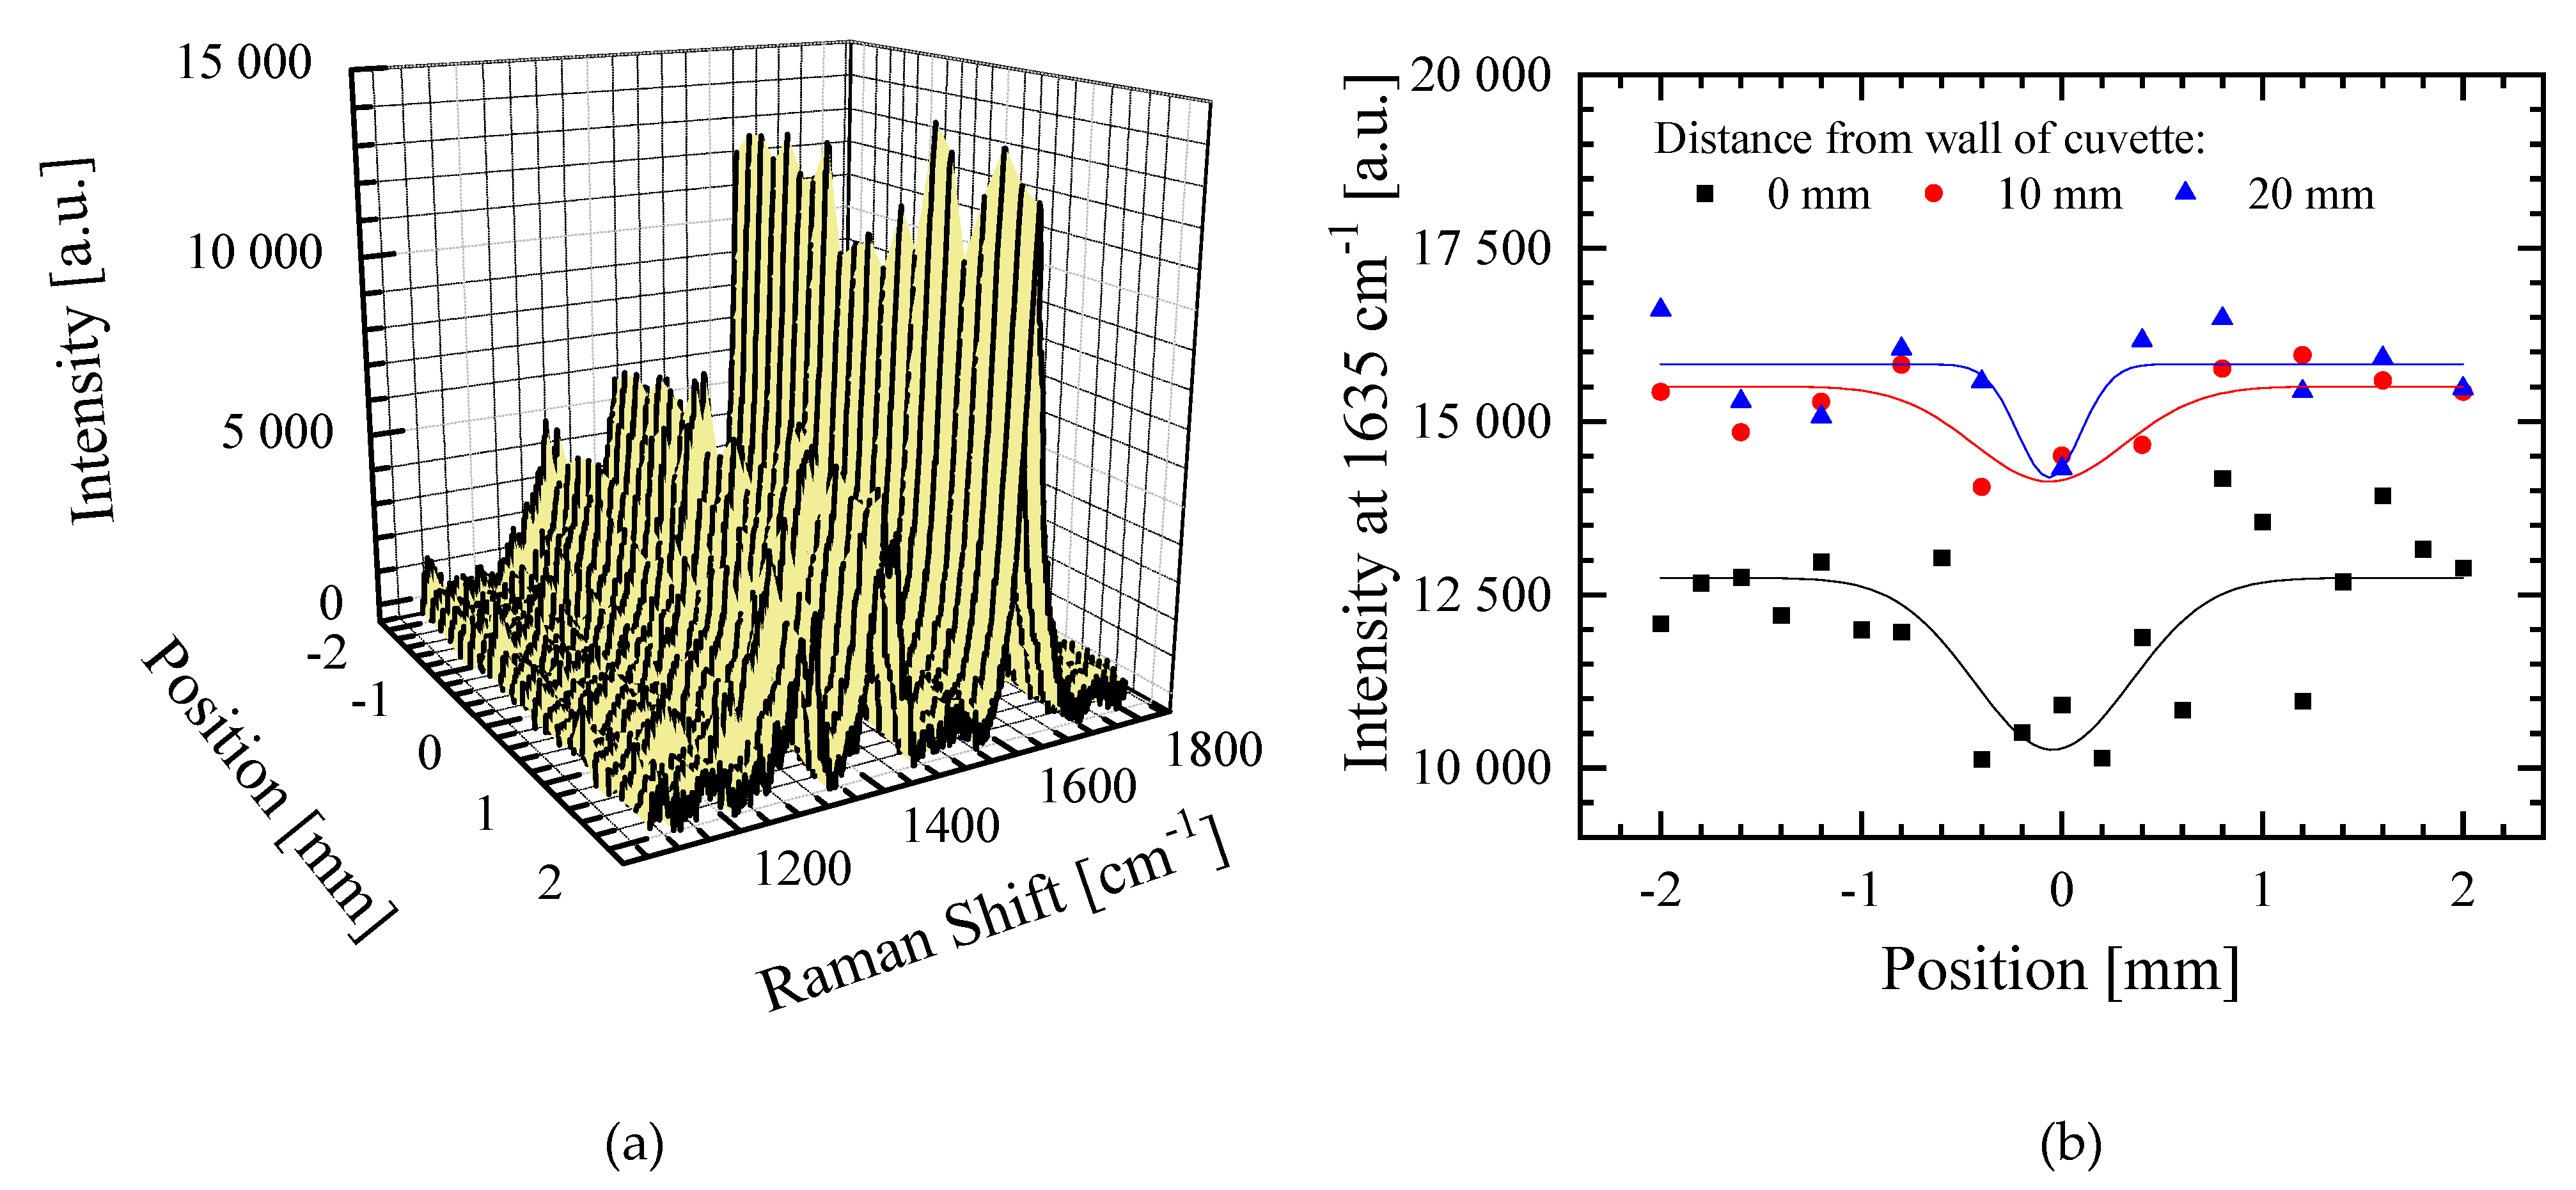
Figure 8). A series of Raman spectra were registered from the non-irradiated part of the dosimeter through the irradiated (the white line) and towards the non-irradiated to a distance of 4 mm (
Figure 9a). This three-dimensional graph illustrates the intensity variation of some bands for the area of laser irradiation for a distance of approximately ±1 mm. In
Figure 6c dashed lines represent three positions perpendicular to the white line corresponding to the polymerized monomers induced by green laser light (60 min irradiation) for which profiles derived from Raman spectra were prepared (
Figure 9b). The profiles correspond to the vinyl group C=C and R-NH-CO group of MBA (1635 cm
−1).
The profiles clearly show the area of conversion of monomers into polymer under the influence of irradiation with green laser light–the white line. The profiles obtained were deconvoluted using the Gauss function (
Figure 9b). Full width at half maximum (FWHM) was calculated for the profiles to be 0.92, 0.84 and 0.39 mm at the following distances: 0 (near the incident laser beam input), at 10 and 20 mm, respectively. This means that the polymerized area along the white line is the widest near the entrance of the laser beam into the cuvette and narrows at greater distances. This corresponds well to the images showing the high intensity glowing of the VIC-T at shorter distances, which falls at greater distances from the beam entry into the cuvette (
Figure 4e,f,
Figure 5a and
Figure 6b). The reason for this observation is the accumulation of the dose from the laser beam absorbed by the VIC-T at the beam entry into the cuvette due to the continued formation of large macromolecules in the path of the laser light. Growing macromolecules scatter the laser light that is trapped at the beginning of its path in the VIC-T (LLT phenomenon). This boosts the dose from the incident light and scattered light at the beginning of the laser light path, increasing the conversion of VIC-T monomers (widening of the profiles in
Figure 9b) and formation of high molecular weight macromolecules that scatter even more laser light. Note that for distances greater than ±~1.1 mm (0 mm profile), ±~0.9 mm (10 mm profile) and ±~0.5 mm (20 mm profile), the intensity of 1635 cm
−1 band increases, which corresponds to a higher concentration of C=C MBA bonds (all the same NVP C=C bonds) and thus a lower conversion to polymer of the vinyl groups outside the green laser light path. In summary, Raman spectroscopy measurements confirmed the LLT phenomenon occurring in the VIC-T dosimeter irradiated with green laser light. Basically, this involves the conversion of VIC-T monomers into high molecular weight polymer macromolecules that scatter the laser light, prevent the laser beam from penetrating the dosimeter, and accumulate the dose of laser radiation near the beam entering the VIC-T dosimeter. It should be noted that Raman analysis showed that the polymerization reaction induced by green laser light was similar to that induced by ionizing radiation [
16]. The exact mechanism of polymerization and cross-linking of vinyl monomers specific to 3D gel dosimeters has been studied previously [
10,
25,
26].


