Article

Optical Transitions and Excited State Absorption Cross Sections of SrLaGaO4 Doped with Ho3+ Ions

Institute of Microelectronics and Optoelectronics, Warsaw University of Technology, Koszykowa 75, 00-662 Warsaw, Poland
*
Author to whom correspondence should be addressed.
Materials 2021, 14(14), 3831; https://doi.org/10.3390/ma14143831
Submission received: 25 May 2021 / Revised: 13 June 2021 / Accepted: 30 June 2021 / Published: 8 July 2021
(This article belongs to the Special Issue Trends in Electronic and Optoelectronic Materials)

Abstract

:
The spectroscopic properties of SrLaGaO4 (SLO) crystal doped with Ho3+ ions were studied in this work. Absorption, emission spectra and decay dynamics of excited states have been measured and discussed using the Judd–Ofelt model. Photoluminescence emissions were attributed to transitions from the excited 3D3, 5S2, 5F5, 5I6 and 5I7 multiplet manifolds. The experimental lifetimes for five excited states have been compared to the theoretical values, calculated using Judd–Ofelt theory, allowing for the determination of the multiphonon relaxation rates (WnR) of the respective states. The experimental data were approximately on a line expressed by WnR = W0 exp(−αΔE) with W0 = 0.5 × 10⁷ s−1 and α = 2.6 × 10⁻³ cm. To discuss the excited state absorption (ESA) pathways, that originated from several excited levels, we used the Judd–Ofelt formalism allowing determination of the integrated cross section for ESA transitions.

1. Introduction

The strontium lanthanum gallate SrLaGaO4 (SLO) and its solid solutions have been extensively investigated since they were considered as a promising substrate for high temperature superconducting (HTSc) films [1]. SLO doped with transition metal (TM) or rare earth (RE) ions was also considered as laser active media [2]. Recently, SLO has been investigated as a host lattice for phosphors, which exhibit unusual and interesting properties when activated by RE or TM ions [3,4]. In particular, when Tb3+ is introduced into SrLaGaO4, long persistent green emission has been reported [3]. The duration of green afterglow was observed even after more than 3.5 h. A novel, far-red emitting SrLaGaO4:Mn4+ phosphor with high brightness and excellent luminescent properties has been synthesized by the simple solid-state reaction and investigated in [5]. In addition, the luminescence spectra of SLO activated by Cr3+ were reported in [4]. It was shown that Cr3+ ions occupy more than four different sites in the SLO lattice, which is related to the random distribution of Sr2+ and La3+ ions.
The interest in studying RE3+ doped SLO strongly results both from its structural disorder, and the resulting inhomogeneous broadening of the optical transitions [6], as well as from the ability of this matrix to accept high concentrations of activator [1,2]. Such a broadening helps the generation of ultrashort pulses by mode locking. Thus, due to its good thermal properties and broad gain spectrum, Yb3+-doped strontium lanthanum aluminate crystal was reported as a promising material for power-scalable, broadly tunable CW and sub-100 fs mode-locked lasers at ~1 μm [7].
Holmium ion activated solids have been the subject of extensive investigations for the development of laser materials, phosphors and color displays [8,9,10]. The use of Ho3+ as a potential candidate for temperature sensing has been confirmed, and thermal-coupled levels of Ho3+ ions, 5F4 and 5S2, 5S2 and 5F5, have been investigated in temperature measurement applications [11].
In particular, much attention has been dedicated to the studies of up-conversion processes in Ho3+ doped low-energy phonon crystals, optical glasses [12] and glass ceramics [13]. Up-conversion materials have wide applications, such as for bio-imaging, photo-therapies, photo-catalysis, solar conversion, temperature sensing, etc. Generally, energy transfer up-conversion (ETU), excited state absorption (ESA), and photon avalanche (PA) are the three main channels for up-conversion fluorescence. The Ho3+ ion is very suitable for use in up-conversion processes because it has many long-lived intermediate metastable levels, from which ESA can take place resulting in a strong, green anti-Stokes luminescence from 5S2 level which has been demonstrated in a number of Ho3+ doped materials after red and infrared excitation [14]. It was also demonstrated that ESA has an important influence on the performance of Ho-doped fiber lasers [15]. Thus, for the modeling of these up-conversion excitation processes the ESA cross sections have to be known.
Although the optical properties of Nd3+, Pr3+, Eu3+, Yb3+ and Tm3+ doped SLO crystals have been reported [3,6,7,16], the spectroscopic data on Ho3+ doped SLO have not, to our knowledge, been presented in detail. In [17] we reported on the nature of strong spectral lines broadening in Ho3+ doped SrLaGa3O7 and SrLaGaO4 crystals which have been investigated by using the non-resonant fluorescence line narrowing (FLN) technique. Also, up-conversion ultraviolet emission from 3D3 level in these compounds was observed in [18]. The partial energy diagram of Ho3+ ions in the SLO host, together with the strongest observed emission transitions, is illustrated in Figure 1.
Recently, we studied ESA processes that involve the 5I6 and 5I7 energy levels of Ho3+ in singly Ho3+-doped ZrF4–BaF2–LaF3–AlF3–NaF (ZBLAN) glass [12] and also YAlO3 (YAP), Y3Al5O12 (YAG), LiYF4 (YLF) and SrLaGa3O7 (SLG) crystals [14]. In the present investigation, we extend this work by identifying and quantifying a range of pump excited state absorption ESA processes in SLO that may affect the functioning of Ho3+-doped SLO green phosphor or laser.

2. Materials and Experiment

A SrLaGaO4:Ho3+ crystal with activator concentrations of 0.3 at % was grown using the Czochralski technique at ITME Laboratory in Warsaw. The samples used were monocrystalline of good optical quality which, after orientation, were cut into 10 × 5 × 2 mm3 plates and polished carefully in order to meet the requirements for spectroscopic measurements. Polarized absorption spectra were measured in the 200–2900 nm range of wavelength at room temperature on a Cary-50 UV–Vis-NIR spectrophotometer (Varian, Inc., Palo Alto, CA, USA) equipped with Glan–Taylor polarizers.
Luminescence from the sample was excited using both pulsed and CW laser sources. For the pulsed measurements an optical parametric oscillator Surelite OPO (Continuum, Santa Clara, CA, USA) with YAG:Nd laser (Surelite II, Continuum Santa Clara, CA, USA) as a pumping source was used. CW excitation was performed with tunable Ti-sapphire laser (Coherent 899 Ring Laser, (Santa Clara, CA, USA)) pumped by argon laser (Coherent Innova 300, (Santa Clara, CA, USA). Optical signal from the sample was analyzed using DK480 monochromator (CVI Laser Corporation, Albuquerque, NM, USA) and detected by cooled photomultiplier tubes (EMI C1034-02 GaAs (EMI Electronics Ltd., London, England) or Hamamatsu 7102 (Hamamatsu Photonics K.K., Hamamatsu, Japan)) and PbS detector for visible and infrared range, respectively. Stanford SR 400 photon-counting system (Stanford Research Systems Sunnyvale, CA, USA) controlled by PC was used to perform data acquisition. Measurements of luminescence decays were recorded using Stanford SR 430 multichannel analyzer (Stanford Research Systems Sunnyvale, California, USA). Low temperatures of the samples were obtained with a Displex Model CSW-202 cryostat (Apd Cryogenics Inc., Allentown, PA, USA).
SrLaGaO4 belongs to a large family of compounds of general chemical formula ABCO4 where A = Ca, Sr, Ba; B = Y, La-Gd; C = Al, Ga. SLO crystallizes in a perovskite-like, tetragonal structure, space group I4/mmm with unit cell parameters of a = b = 0.38437(3) nm and c = 1.26880(15) nm, the volume of the unit-cell V = 178.27(1) Å3 and the number of structural units Z = 2 [19,20]. The crystal structure is built from CO6 (GaO6) layers formed in the ab plane. The Sr2+ and La3+ cations are distributed randomly between the layers, taking positions in nine coordinated sites with distorted C4v symmetry. The C cations have a coordination of six and are in a slightly distorted octahedral environment, while Sr and La ions are surrounded by nine oxygens. The elementary cell of SrLaGaO4 is shown in Figure 2 with the crystal built along the c-axis.
Since the radius of the Ho3+ ion (0.172 Å) is comparable to those of the La3+ (0.126 Å) and Sr2+ (0.131 Å), it can be assumed that both La3+ and Sr2+ sites can be occupied by Ho3+ in SrLaGaO4. It has been shown that the random distribution of the A and B cations over different lattice positions leads to a disordered structure of these crystals resulting in the strong inhomogeneous broadening of the spectral lines.

3. Results and Discussion

3.1. Absorption Spectra and Optical Transition Intensity Analysis

The structure makes SrLaGaO4 uniaxially anisotropic where the strength of the absorption lines is dependent on the direction of the incident light. Bearing in mind that the optical axis is parallel to the crystallographic c-axis, two orthogonal light polarizations, π (E || c) and σ (E ⊥ c), should be taken into account. Thus, in our spectroscopic study, we have measured the absorption characteristics for two principal light polarizations for a-cut 0.3 at% Ho3+ doped SrLaGaO4 crystal. The measured spectra in the 300–2200 nm range are presented in Figure 3.
Once the polarized absorption spectra had been measured, integrated absorbances Γ were calculated according to Equation (1) [21]:
Γ ¯ = b a n d α ¯ ( λ ) d ( λ ) = 1 L b a n d ln [ 1 3 exp ( α π ( λ ) L ) + 2 3 exp ( α σ ( λ ) L ) ] d ( λ )
where L is the distance the light has traveled inside the sample, απ(λ) and ασ(λ) are the absorption coefficients for π and σ polarizations and λ is wavelength. Integrated absorbances determined in this way were used to obtain the experimental line strengths needed to perform the Judd–Ofelt [22,23] intensity analysis. Because the drawbacks and precision of the Judd–Ofelt theory have been analyzed in detail elsewhere [24], only the essential results have been included in this article. The main point of this approach is that the oscillator strength fcalc of the electric dipole transition between multiplets of lanthanide ion (JJ’) is described as:
f c a l c = 8 π 2 m c 3 h ( 2 J + 1 ) 1 λ χ ¯ t = 2 , 4 , 6 | U J J © ( t ) | 2 Ω t
where h is Planck’s constant, J is the angular momentum of the initial level, χ ¯ = 1 3 ( χ π + 2 χ σ ) is an average local field correction factor, where for electric dipole transition χ π , σ = ( n π , σ 2 + 2 ) 2 9 n π , σ , U(t) are the doubly reduced matrix elements and Ωt are empirically determined parameters. The value of oscillator strength can be also obtained from experimentally measured absorption or emission spectra. For the absorption line, the experimental oscillator strength fexp, can be defined as
f e x p = m c 2 ε 0 π e 2 N Γ ¯
where e and m are the electron charge and mass respectively, Γ ¯ is the integrated absorbance obtained from Equation (1) and c represents the light velocity.
From the least-square fit of calculated (fcalc) and measured (fexp) oscillator strengths the three Ωt intensity parameters were obtained. The reduced matrix elements needed for this calculation were taken from [25]. The values of calculated and measured oscillator strengths together with the average wavelengths for all measured absorption lines are presented in Table 1. The Judd–Ofelt intensity parameters were evaluated to be Ω2 = 1.25 × 10⁻²⁰ cm−1, Ω4 = 0.42 × 10⁻²⁰ cm−1, Ω6 = 1.80 × 10⁻²⁰ cm−1 with RMS deviation between the calculated and measured oscillator strength values of 5.3 × 10⁻⁶. The obtained measure of the quality of the fit is closed to values found by applying the Judd–Ofeld approach to other materials doped with holmium ions [26].
Comparison of Judd–Ofelt parameters between Ho3+:SLO and other Ho3+—doped hosts is shown in Table 2.
From the calculated set of Ωt intensity parameters the electric dipole transition probabilities AJJ’ for emissions between J and J’ manifolds of Ho3+ were calculated using the equation:
A J J = 64 π 4 e 2 3 h ( 2 J + 1 ) 1 λ 3 χ ¯ t = 2 , 4 , 6 | U J J n ( t ) | 2 Ω t
Evaluated probabilities AJJ’ of the radiative transitions from the excited states, the branching ratios βcalc and resulting radiative lifetimes are presented in Table 3. The values of radiative lifetimes of the 3D3, 5F3, 5S2, 5F5, 5I4, 5I5, 5I6 and 5I7 were calculated to be: 477 μs, 217 μs, 211 μs, 372 μs, 5.34 ms, 3.37 ms, 2.83 ms and 8.02 ms, respectively.
The emission characteristic of the crystal was measured at room temperature in the 250 nm–2.5 μm spectral range after CW excitation. All experimentally observed emission lines corresponding to transitions from the 3D3, 5F3, 5S2, 5F5, 5I6 and 5I7 excited states of SrLaGaO4:Ho3+ are presented in Figure 4. The emission spectrum is dominated by 5S25I8 transition, resulting in the strongest luminescence line at about 550 nm.

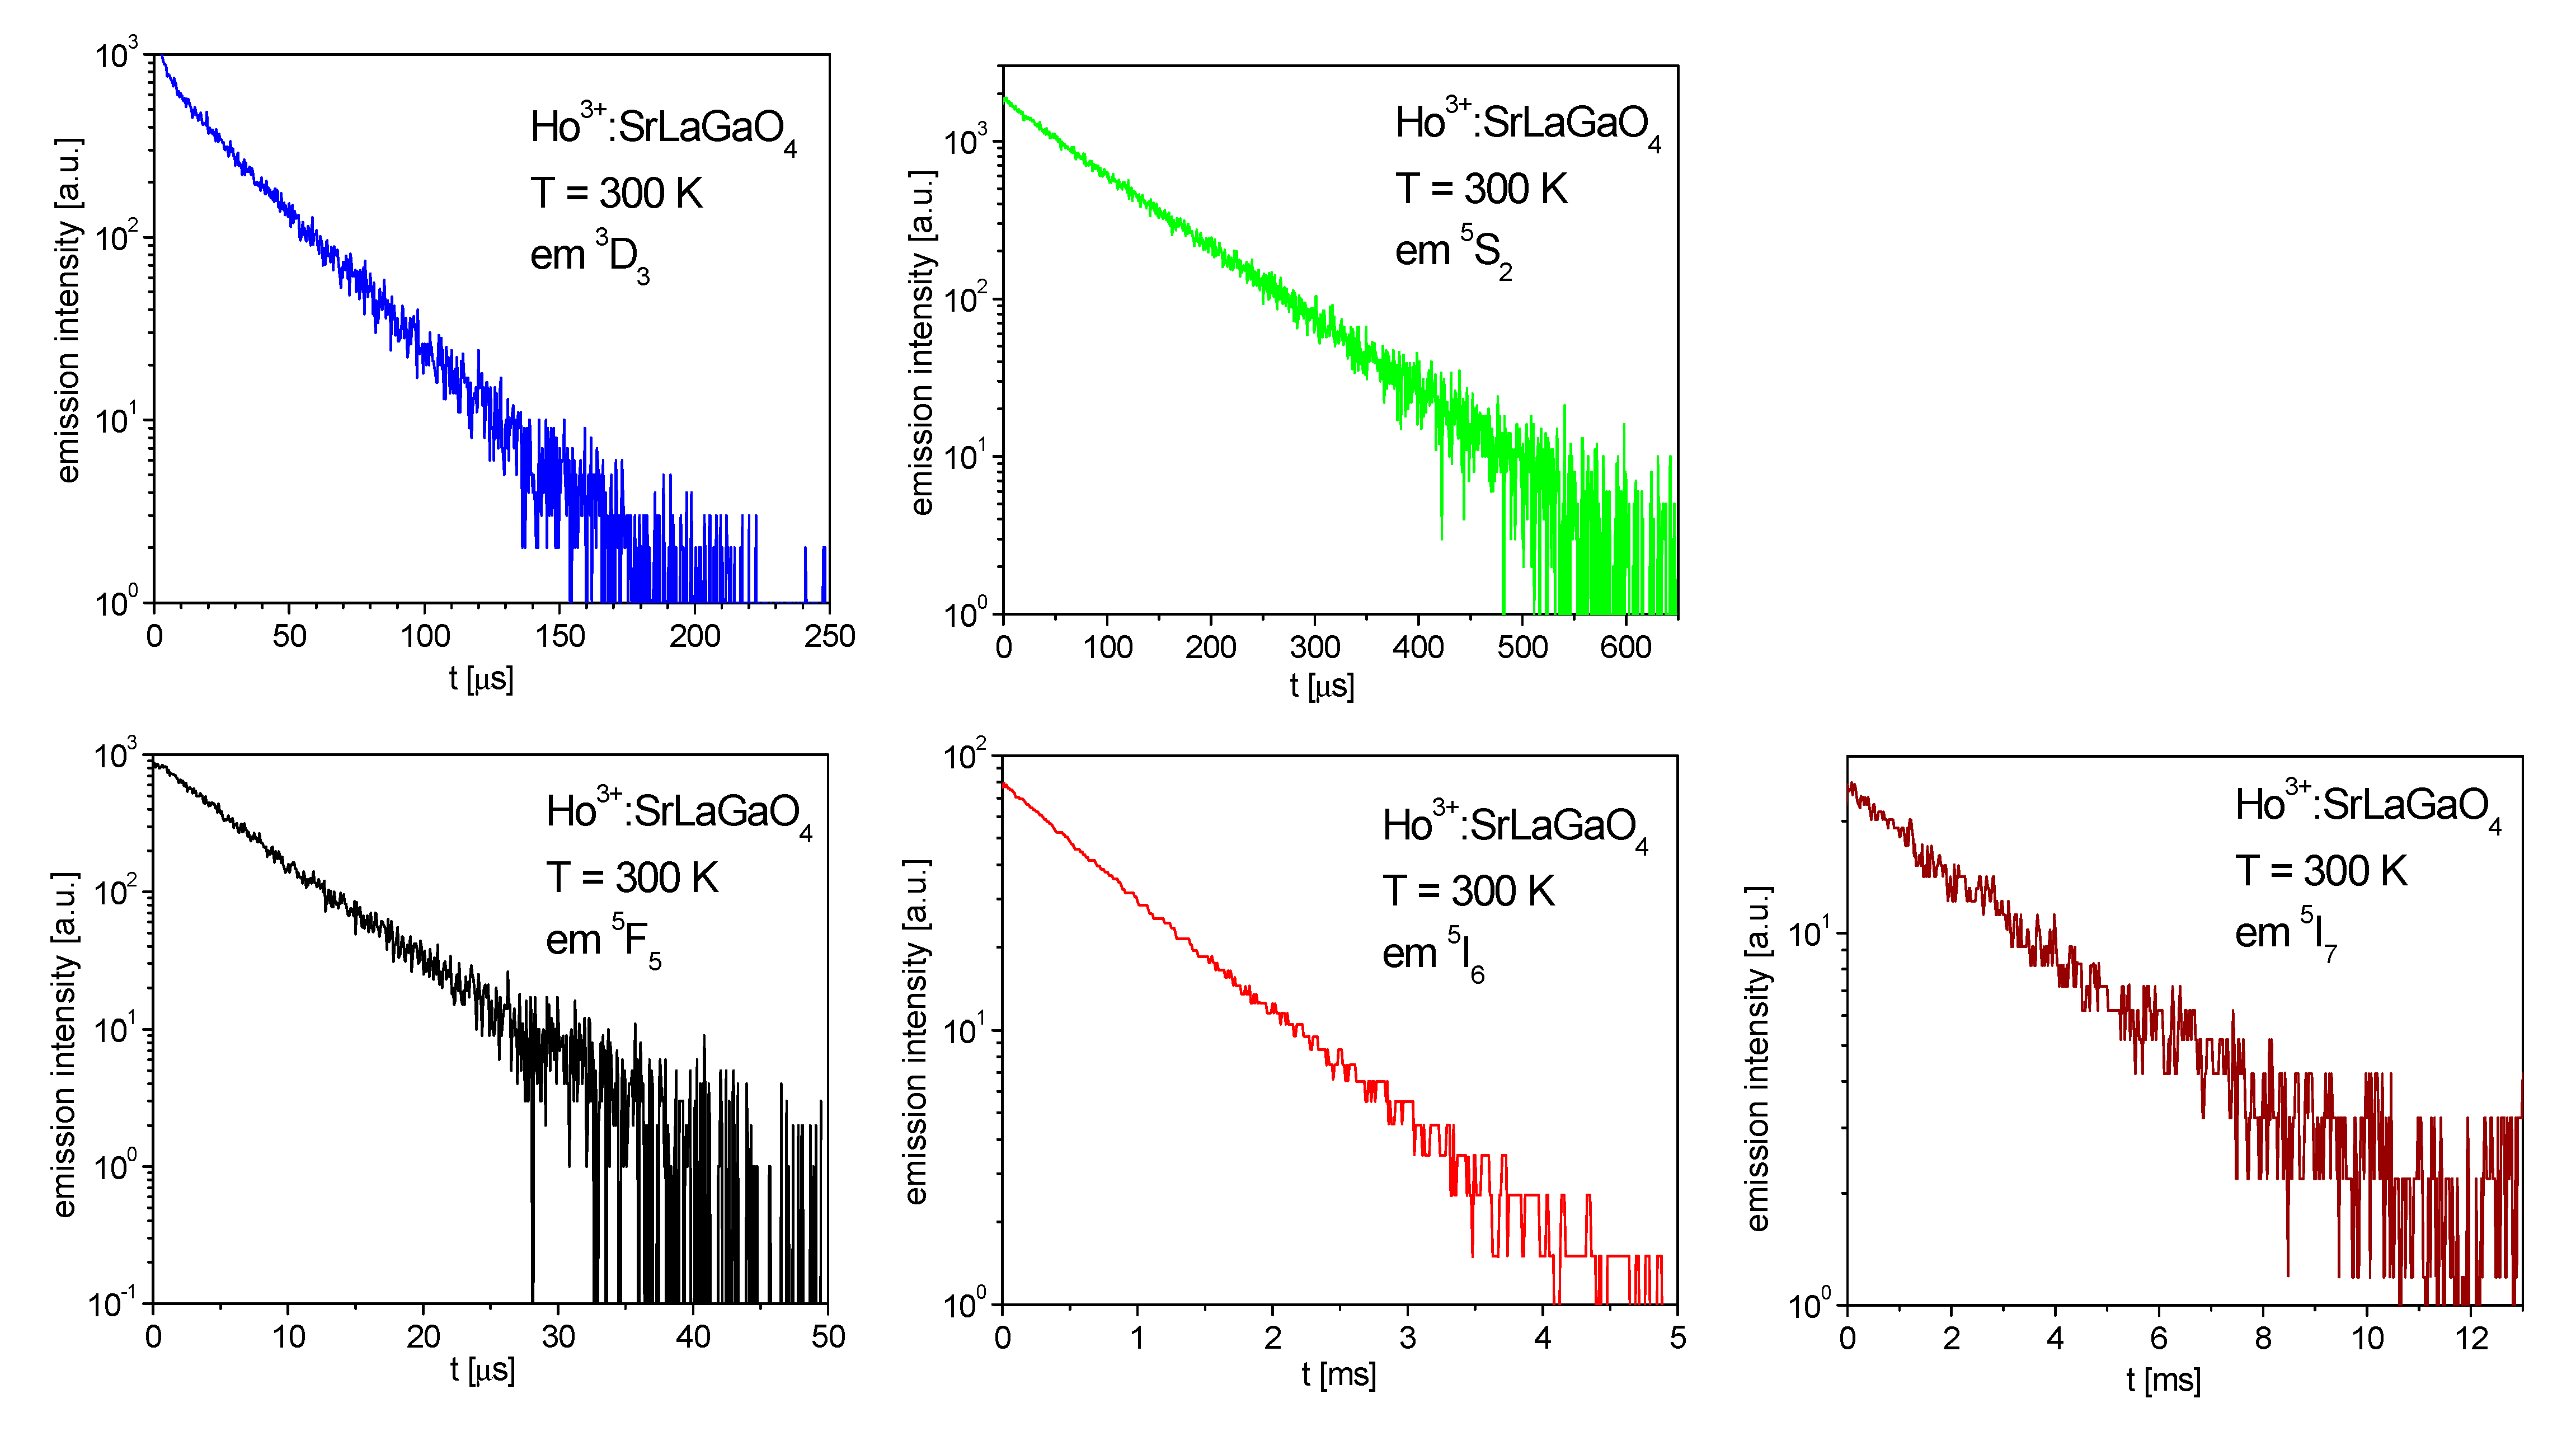
3.2. Luminescence Dynamics

Fluorescence decay curves were registered after wavelength selective pulsed excitation. Figure 5 shows decay profiles of the 3D3, 5S2, 5F5, 5I6 and 5I7 emissions in 0.3% Ho3+ doped SrLaGaO4 measured at 300 K. The fluorescence lifetimes of 3D3, 5S2, 5F5, 5I6 and 5I7 manifolds were determined with estimated relative errors of 1% to be of 35 μs, 98 μs, 6 μs, 1 ms and 4 ms, respectively. Due to the large energy gap to the next lying lower level of about 4000 cm−1 the 5I6 and 5I7 decays could be considered as being predominantly radiative which was confirmed by its temperature independence.
Knowing values of radiative and measured lifetimes, the rates of multiphonon relaxations can be simply calculated using the equation:
W n r = 1 τ o b s 1 τ R
Calculated radiative lifetimes, measured at low temperature lifetimes, the energy gaps to the next lower level and the multiphonon transition rate for excited states of Ho3+ in SrLaGaO4 are shown in Table 4.
Dependence of the multiphonon transition probability Wnr on the energy gap to the next lower level ΔE can be described as an exponential function [30]:
Wnr = W0 × exp(−αΔE)
The WnrE) dependence, together with the data for low phonon ZBLAN glass [31], is shown in Figure 6. The values of W0 and α in Equation (6) were calculated as 0.5 × 10⁷ s−1 and 2.6 × 10⁻³ cm, respectively.
As can be observed from Figure 6 the nonradiative decay rates in SLO are about one order of magnitude higher than in ZBLAN. The difference in results from higher in the case of SLO of the the phonon frequency distribution function, which is approximately hωmax = 707 cm−1 [32], than in ZBLAN matrix, which is 580 cm−1 [3].

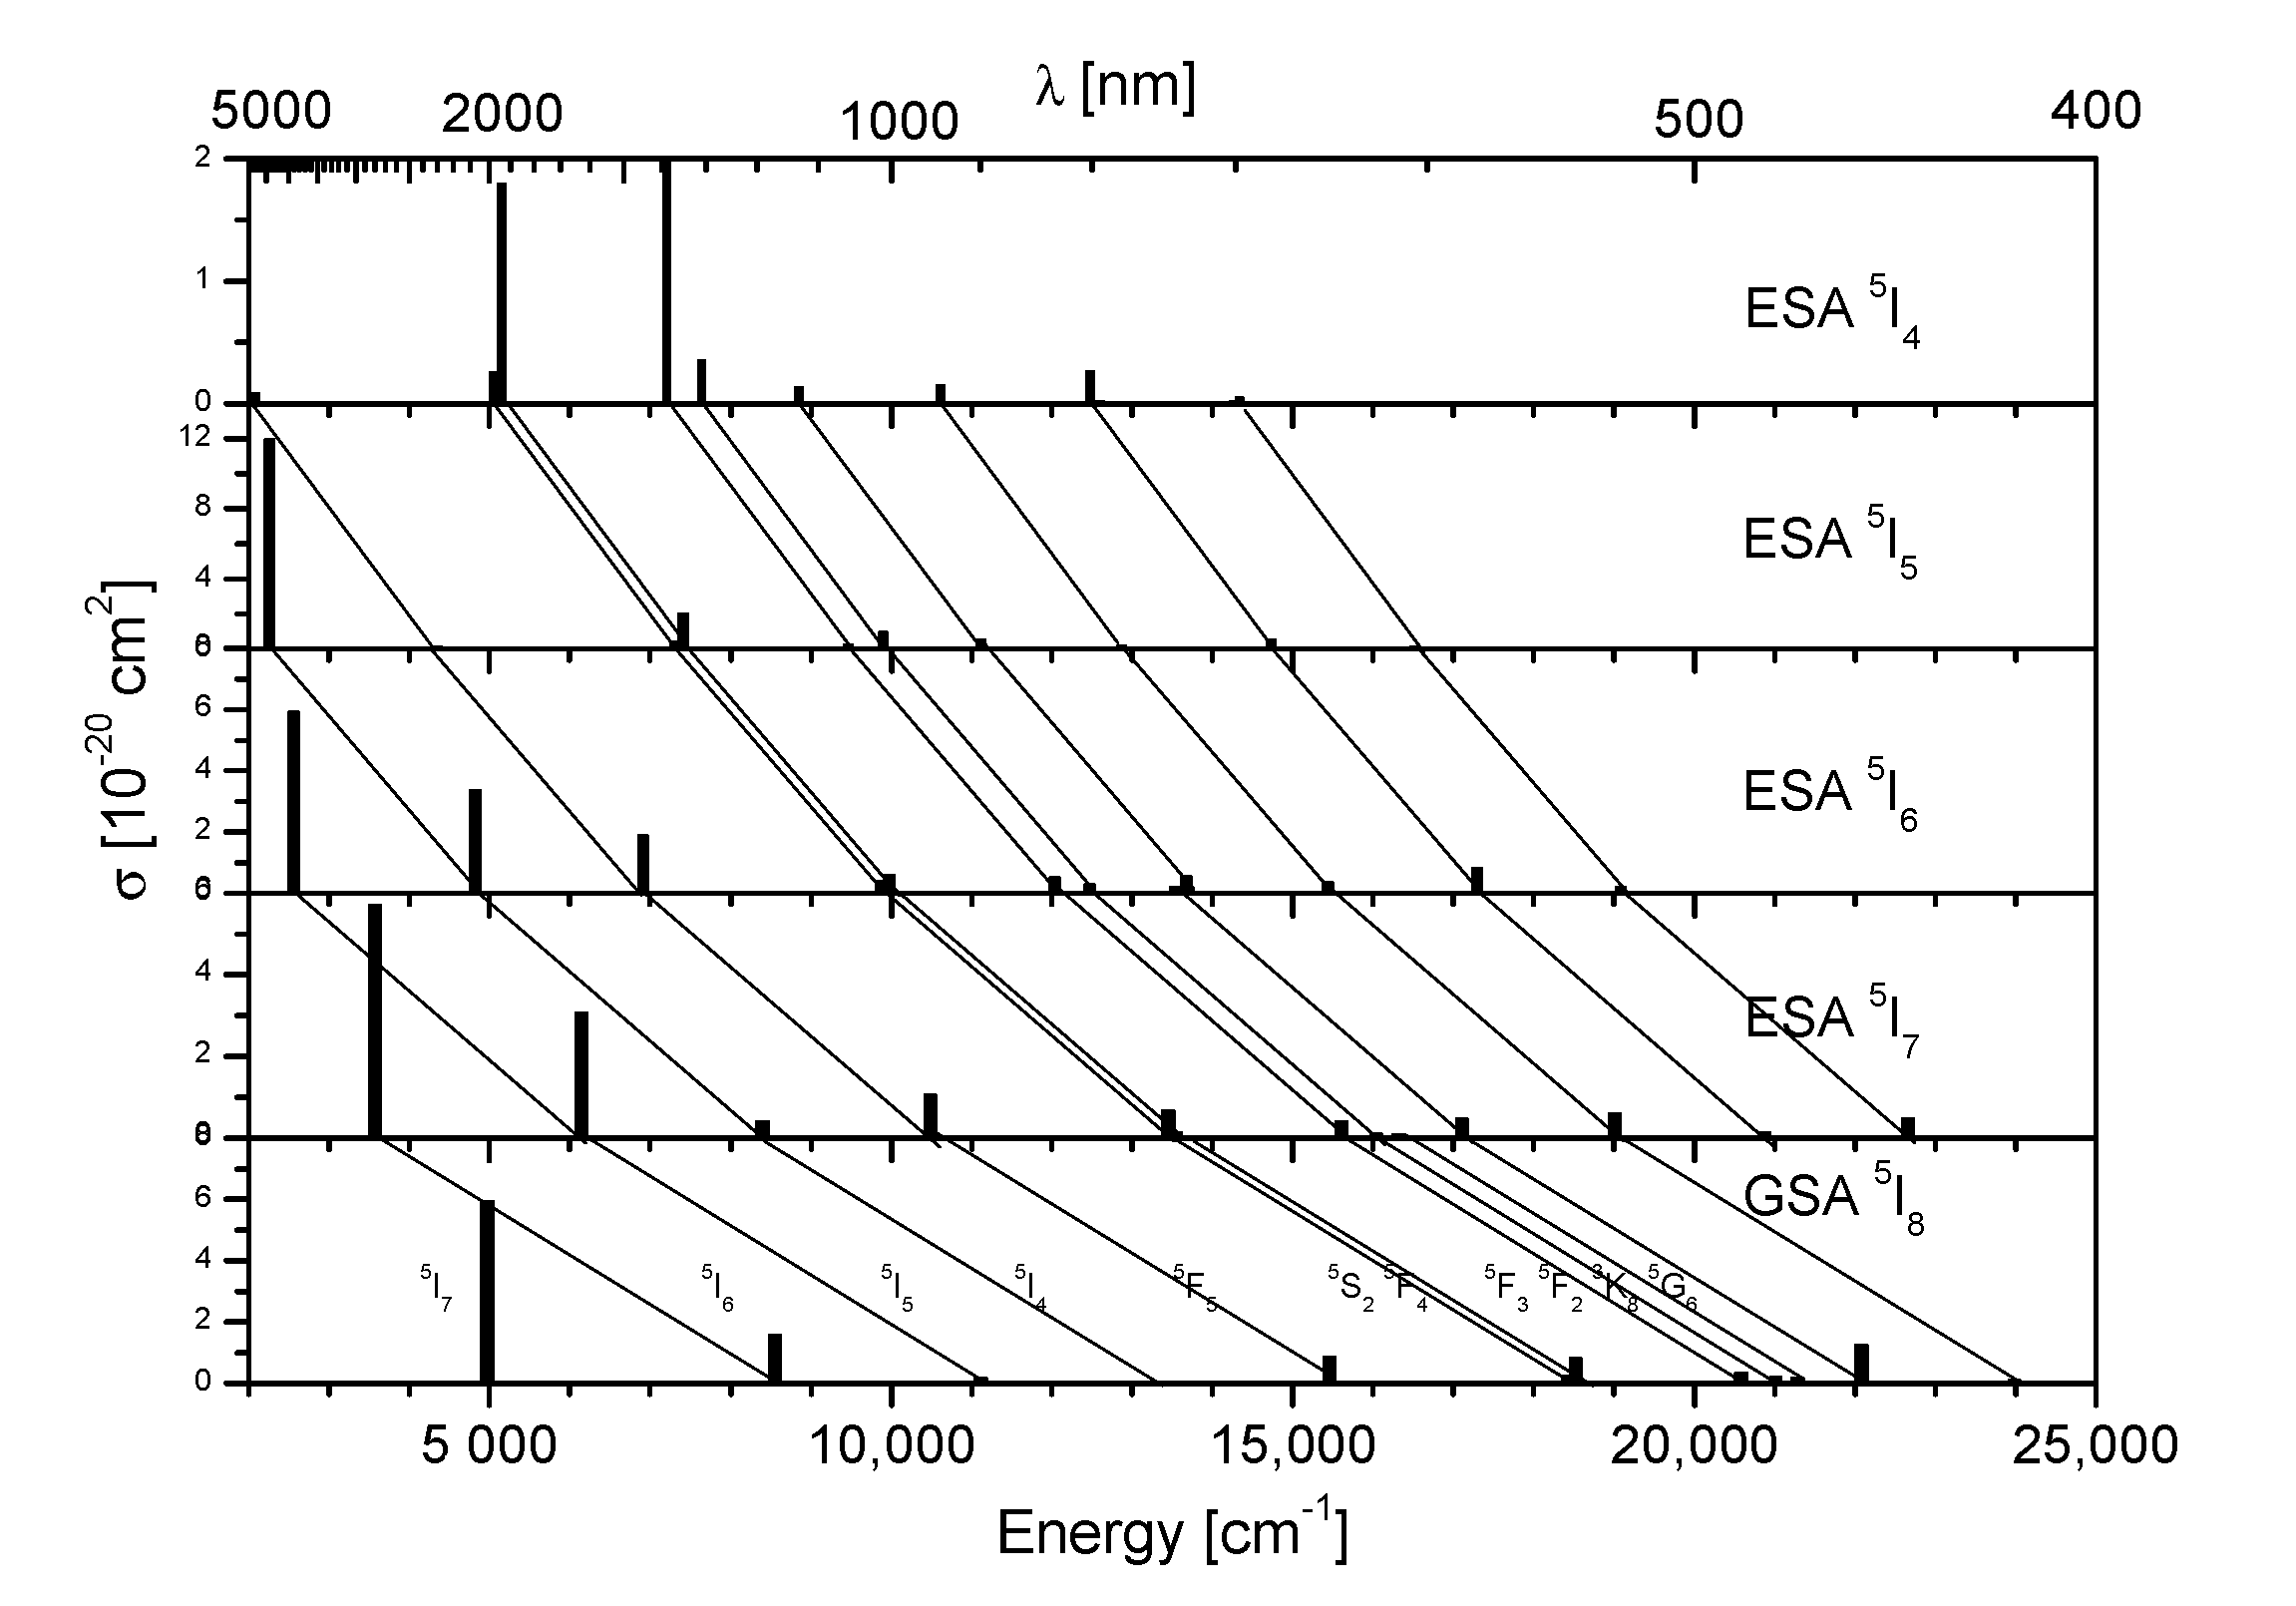
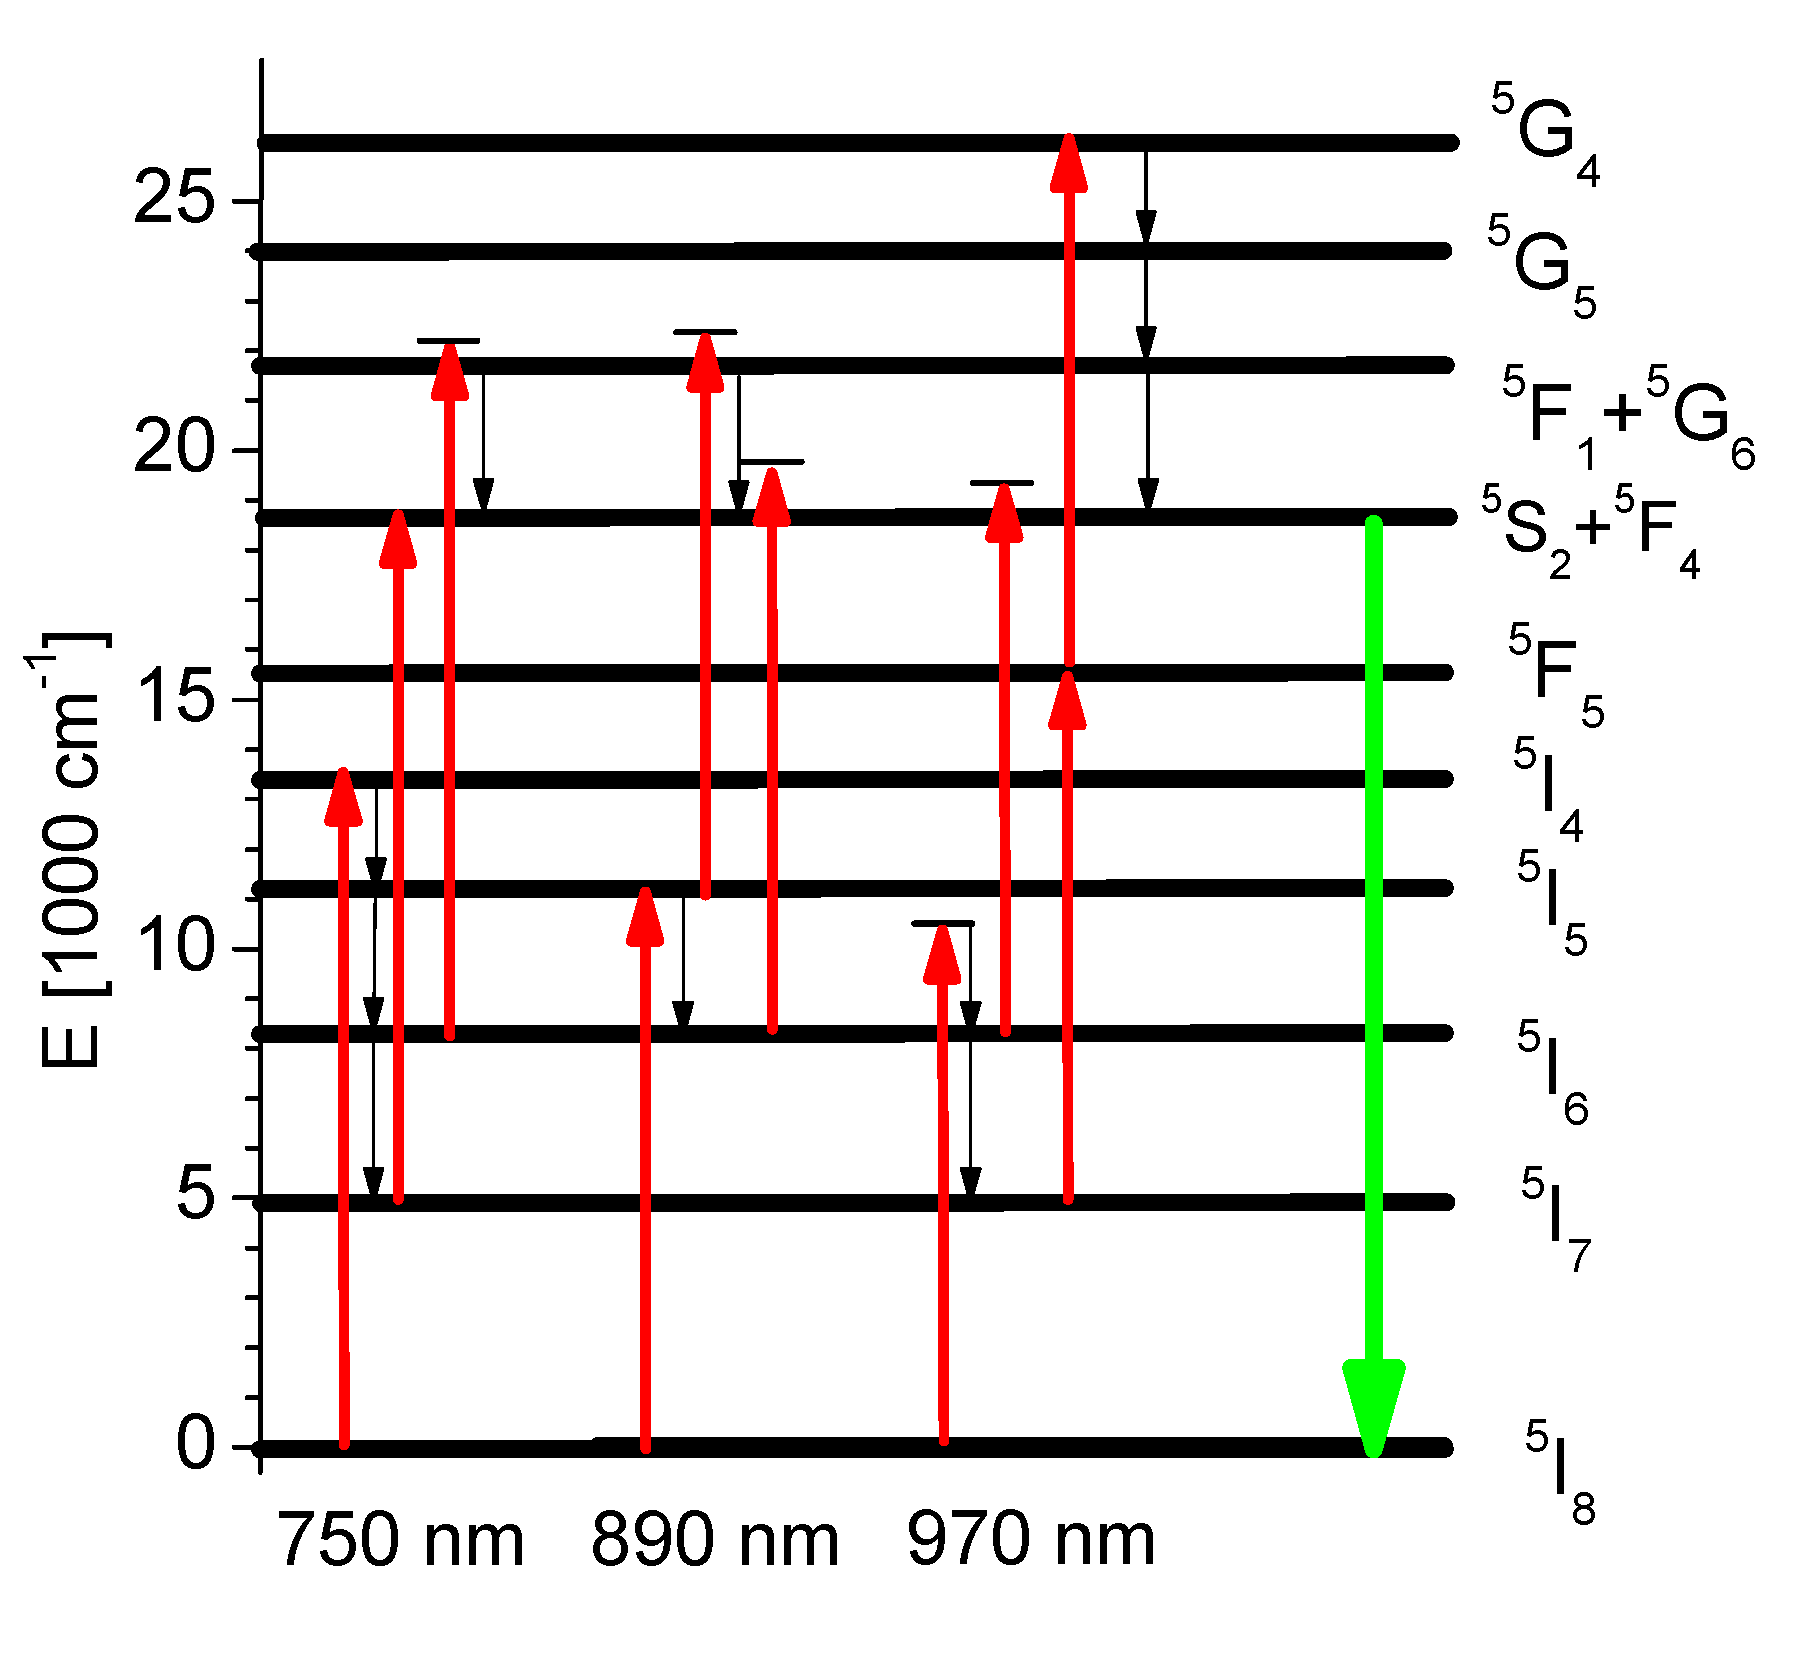
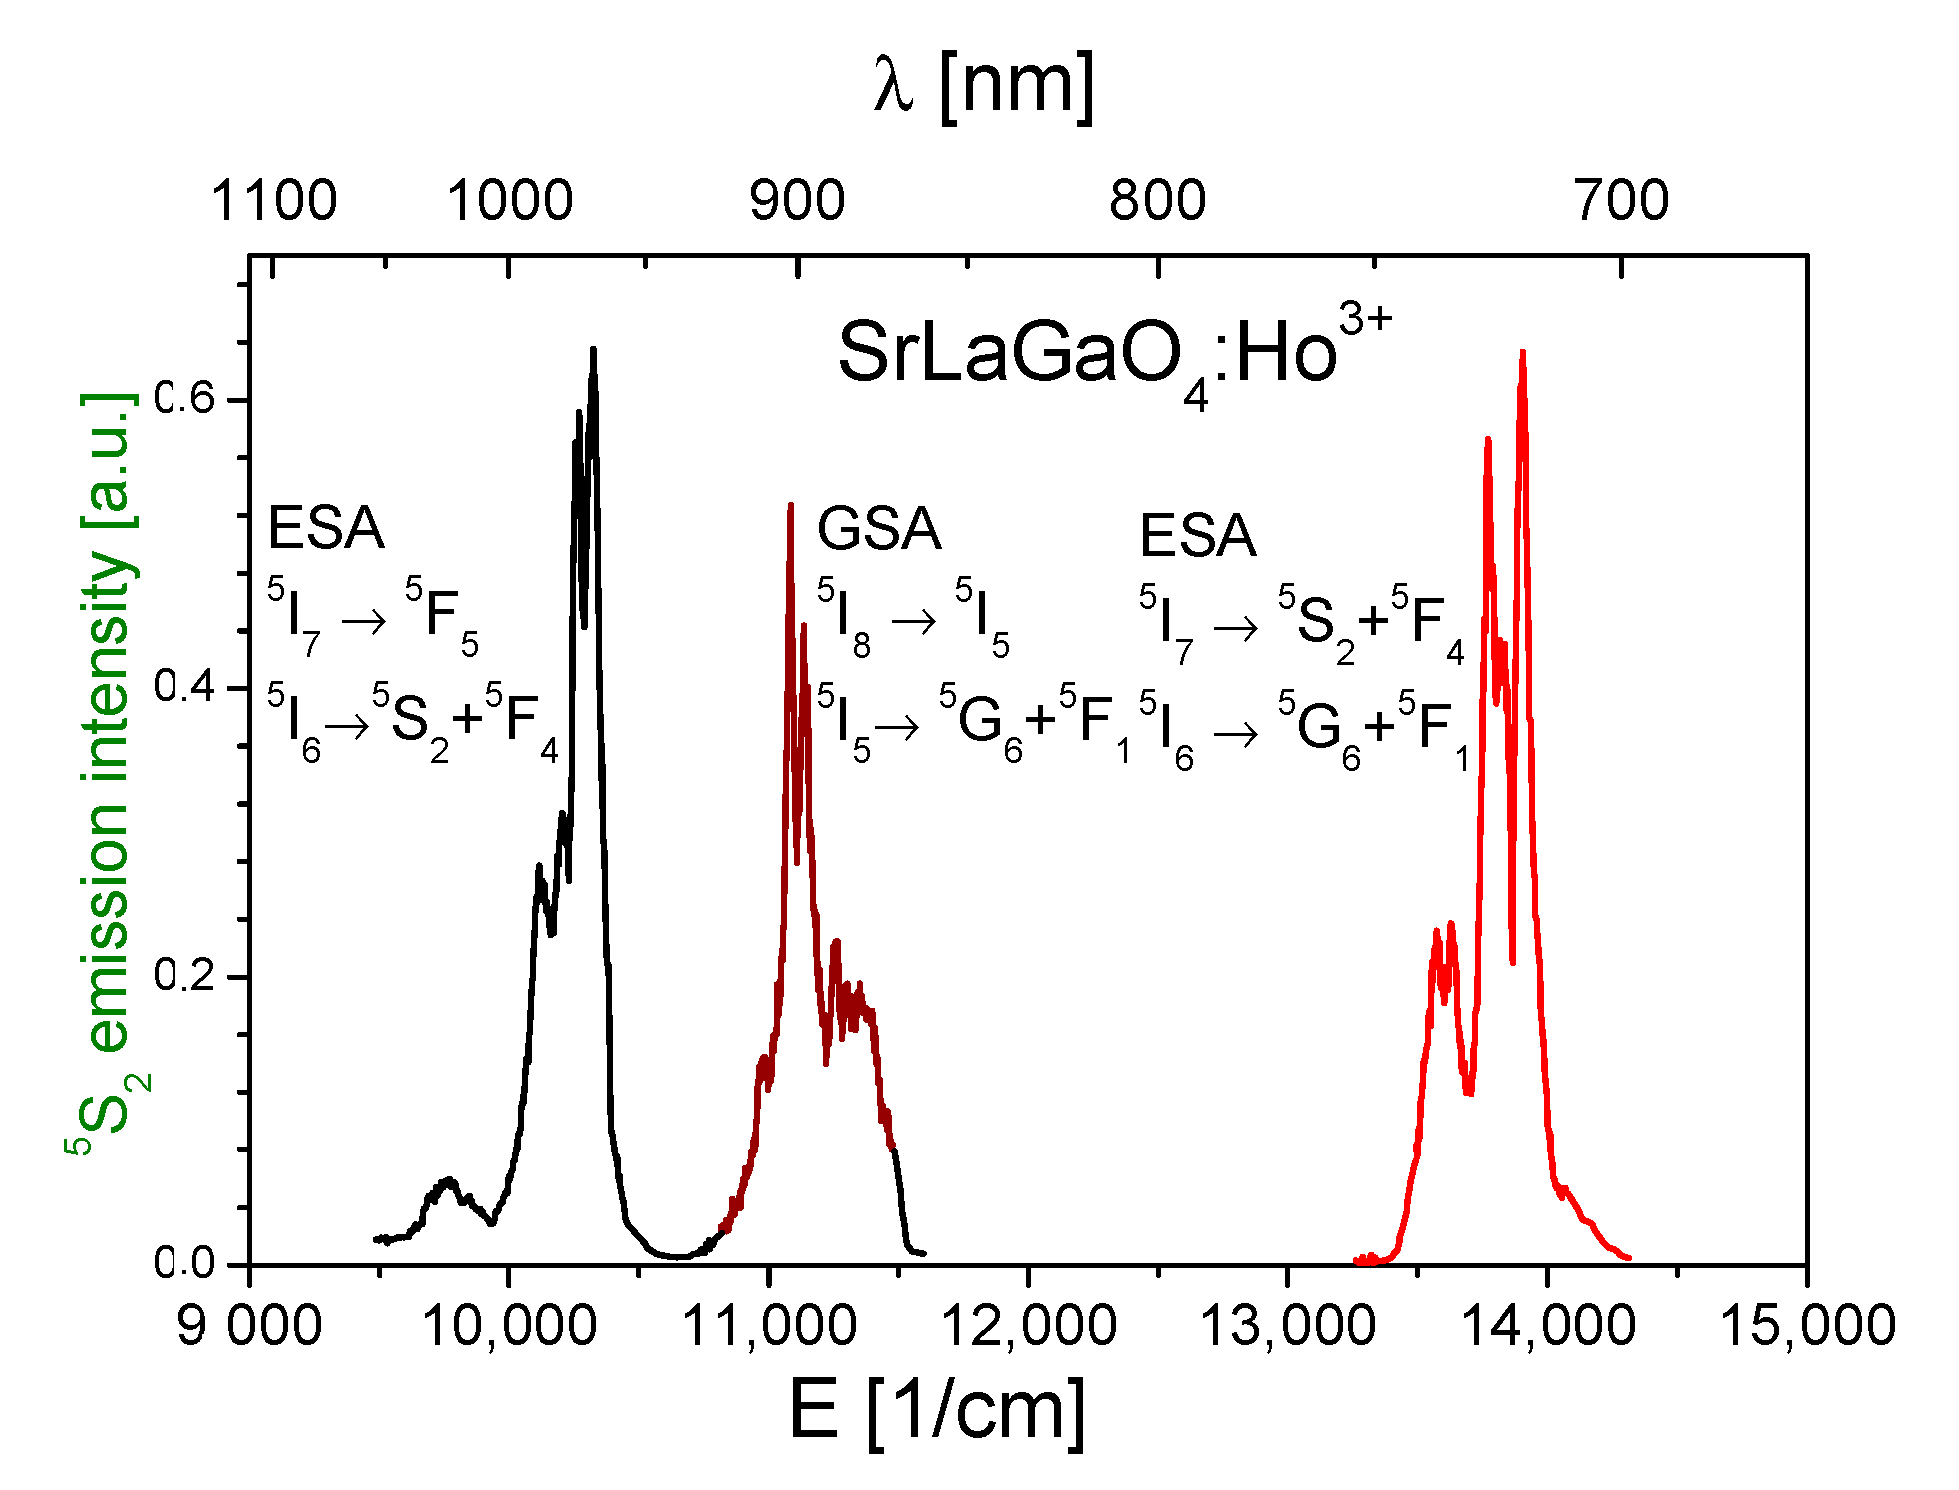
3.3. Excited State Absorption Transitions

The high number of long-lived multiplets present in Ho3+ acting as good population reservoirs leads to the possibility of ESA transitions into higher lying energy levels. The intermediate levels for ESA are therefore 5IJ states (J = 5, 6, 7). Using the Judd–Ofelt formalism it is possible to estimate the ESA integrated cross sections by means of the following expression:
σ i n t = λ 1 λ 2 σ ( λ ) d λ = 8 π 3 e 2 3 h c   ( 2 J + 1 ) χ t = 2 , 4 , 6 | U J J ( t ) | 2 Ω t
where λ is the mean wavelength corresponding to the ESA transition.
With this method, the ESA transition cross sections in the spectral range between 400 and 5000 nm in Ho3+-doped SLO were calculated and are presented in Figure 7, together with the GSA cross sections.
Figure 7 also illustrates that several infrared excitation wavelengths could lead to population of the 5S2 state from which green anti-Stokes emission results. These processes for excitation in the 720–750, 870–920 and 960–1000 nm spectral ranges are interpreted in Figure 8 and are confirmed by the excitation spectrum of up-converted 5S2 green emission presented in Figure 9. Similar spectra were also reported for other Ho3+ activated systems [14].
On the other hand, the energy level diagram in Figure 8 illustrates that in the up-conversion excitation of 5S2 emission several near-resonant transitions, with participation of low energy phonons, are involved. It can also be observed that energies of GSA and ESA transitions are in close proximity, so it is difficult to indicate one responsible process. We have focused our attention on the 750 nm excitation band, as it was reported to be responsible for the efficient photon avalanche process that occurs in Ho3+ activated solids [33].
As results from Figure 8, after 750 nm excitation, the first step is the weak quasi-resonant GSA 5I85I4 absorption, followed by non-radiative de-excitation to the 5I6 and 5I7 metastable levels which act as intermediate levels. The next steps are: a strong resonant ESA 5I75S2, 5F4 and non-resonant ESA 5I65G6, 5F1 transitions followed by non-radiative de-excitation to the 5S2, 5F4 levels from which an intense green emission is obtained.
Calculated GSA and ESA absorption cross section values for transitions involved in the 750 nm excitation process for SrLaGaO4 and several other Ho3+ activated materials are summarized in Table 5. The cross-sections of the non-resonant transitions from 5I7 and 5I6 to the multi-phonon side bands were calculated in the framework of formalism developed by Auzel [34] who showed that the probability for Stokes excitation with respect to an energy gap ΔE to the electronic level is given by:
WS = WS(0) exp(−αS ΔE)
where αS is related to the multi-phonon nonradiative decay parameter αNR by
αNR = αS − () − 1/N ln(N/S0)
where N = E/hω is the average order of the multi-phonon process, S0 is the Huang–Rhys electron–phonon coupling parameter at 0 K and is the highest phonon frequency of the host.
The values of the integrated cross sections calculated according to Equation (7) are proportional to the line strength of the electric-dipole transition S e d ( J J ) t = 2 , 4 , 6 | U J J ( t ) | 2 Ω t . Considering the 750 nm excitation conversion to 5S2 green emission following values of squared matrix elements, |Uλ|2 should be considered. In Figure 10 the Sed values’ dependence on Ωt is presented.
It thus results that in the considered 750 nm excitation, the ESA (5I75S2 + 5F4) is the most important process and that for its cross-section to be large, materials with a high value of the Ω6 parameter should be chosen. Thus, according to the Judd–Ofelt parameters presented in Table 2, the highest (5I75S2 + 5F4) ESA cross-sections could be expected for Ho3+:LiYF4 crystal. This is confirmed by the data reported by Kuck et al. [35]. From Table 6 and Figure 10 it can also be seen that the 5I85I4 GSA is only Ω6 dependent.
The ratio between the GSA and ESA cross sections (β = GSA/ESA) is an important parameter for establishing the photon avalanche process. It was proposed in [36] that a β value lower than 10−4 is necessary to expect avalanche up-conversion. Above this limit, the up-conversion emission does not exhibit any pump threshold. Evaluated here β = GSA/ESA is about 4 × 10⁻³ and is beyond the limit for photon avalanche up-conversion to occur.

4. Conclusions

The spectroscopy and the fluorescence dynamics of SrLaGaO4 crystal doped with Ho3+ ions have been studied in detail and analyzed. Based on polarized absorption spectra, the Judd–Ofelt intensity parameters were determined and radiative transition probabilities for several Ho3+ excited states were calculated. This, together with the measured fluorescence lifetimes, allowed evaluation of the multiphonon relaxation parameters for SLO matrix.
Several ESA mechanisms which generate the green emission from the 5S2 level in SLO under 750, 900 and 980 nm band excitations have been proposed. The Judd–Ofelt analysis, which is usually performed for transitions from the ground-state manifold, was used to determine the integrated cross-sections of the ESA transitions and to predict the possibility of photon avalanche up-conversion occuring under 750 nm pumping.

Author Contributions

Conceptualization, M.M. and M.K.; methodology M.M. and M.K.; formal analysis, M.M. and M.K.; investigation, M.M. and M.K.; writing—original draft preparation, M.M.; writing—review and editing, M.K. All authors have read and agreed to the published version of the manuscript.

Funding

This research received no external funding.

Institutional Review Board Statement

Not applicable.

Informed Consent Statement

Not applicable.

Data Availability Statement

The data presented in this study are available on reasonable request from the corresponding author.

Conflicts of Interest

The authors declare no conflict of interest.

References

  1. Uecker, R.; Reiche, P.; Ganschow, S.; Uecker, D.-C.; Schultze, D. Investigation of crystal growth of SrΡrGaO4 and SrLaGaO4. Acta Phys. Pol. A 1997, 92, 23–34. [Google Scholar] [CrossRef]
  2. Drozdowski, M.; Kasprowicz, D.; Paja̧czkowska, A. Characterization of the elastic and elasto-optic properties of SrLaAlO4 and SrLaGaO4 crystals using the Brillouin scattering method. J. Mol. Struct. 2000, 555, 119–129. [Google Scholar] [CrossRef]
  3. Fu, X.; Zheng, S.; Shi, J.; Li, Y.; Zhang, H. Long persistent luminescence property of a novel green emitting SrLaGaO4: Tb3+ phosphor. J. Lumin. 2017, 184, 199–204. [Google Scholar] [CrossRef]
  4. Grinberg, M.; Barzowska, J.; Shen, Y.; Pajączkowska, A. Spectral properties of Cr3+ in SrLaGaO4 under high hydrostatic pressure. Photonics Lett. Pol. 2011, 3, 104–106. [Google Scholar] [CrossRef] [Green Version]
  5. Jiang, C.; Zhang, X.; Wang, J.; Zhao, Q.; Wong, K.-L.; Peng, M. Synthesis and photoluminescence properties of a novel red phosphor SrLaGaO4:Mn4+. J. Am. Ceram. Soc. 2018, 102, 1269–1276. [Google Scholar] [CrossRef]
  6. Karbowiak, M.; Rudowicz, C. Crystal-field analysis for RE3+ ions in laser materials: I. Absorption spectra and energy levels calculations for Nd3+ and Pr3+ ions in ABCO4 crystals. Chem. Phys. 2011, 383, 68–82. [Google Scholar] [CrossRef]
  7. Pan, Z.; Dai, X.; Lei, Y.; Cai, H.; Serres, J.M.; Aguiló, M.; Díaz, F.; Ma, J.; Tang, D.; Vilejshikova, E.; et al. Crystal growth and properties of the disordered crystal Yb:SrLaAlO4: A promising candidate for high-power ultrashort pulse lasers. CrystEngComm 2018, 20, 3388–3395. [Google Scholar] [CrossRef]
  8. Weber, M.J. Handbook of Optical Materials; CRC Press: Boca Raton, FL, USA; London, UK; New York, NY, USA; Washington, DC, USA, 2003. [Google Scholar]
  9. Singh, V.; Rai, V.K.; Voss, B.; Haase, M.; Chakradhar, R.P.S.; Naidu, D.S.; Kim, S.H. Photoluminescence study of nanocrystalline Y2O3:Ho3+ phosphor. Spectrochim. Acta Part A Mol. Biomol. Spectrosc. 2013, 109, 206–212. [Google Scholar] [CrossRef]
  10. Mariselvam, K.; Liu, J. Green emission and laser properties of Ho3+ doped titano lead borate (TLB) glasses for colour display applications. J. Solid State Chem. 2021, 293, 121793. [Google Scholar] [CrossRef]
  11. An, N.; Zhou, H.; Zhu, K.; Ye, L.; Qiu, J.; Wang, L.-G. Improved temperature sensing performance of YAG: Ho3+/Yb3+ by doping Ce3+ ions based on up-conversion luminescence. J. Alloys Compd. 2020, 843, 156057. [Google Scholar] [CrossRef]
  12. Piatkowski, D.; Wisniewski, K.; Rozanski, M.; Koepke, C.; Kaczkan, M.; Klimczak, M.; Piramidowicz, R.; Malinowski, M. Excited state absorption spectroscopy of ZBLAN:Ho3+ glass—Experiment and simulation. J. Phys. Condens. Matter 2008, 20, 155201. [Google Scholar] [CrossRef]
  13. Kshetria, Y.K.; Joshib, B.; Leeb, S.W. Intense visible upconversion emission in transparent (Ho3+, Er3+)-α-Sialon ceramics under 980 nm laser excitation. J. Eur. Ceram. Soc. 2016, 36, 4215–4224. [Google Scholar] [CrossRef]
  14. Wnuk, A.; Kaczkan, M.; Frukacz, Z.; Pracka, I.; Chadeyron, G.; Joubert, M.-F.; Malinowski, M. Upconversion processes in holmium activated laser crystals. J. Alloys Compd. 2002, 341, 353–357. [Google Scholar] [CrossRef]
  15. Wang, J.; Bae, N.; Lee, S.B.; Lee, K. Effects of ion clustering and excited state absorption on the performance of Ho-doped fiber lasers. Opt. Express 2019, 27, 14283–14297. [Google Scholar] [CrossRef]
  16. Ryba-Romanowski, W.; Gołąb, S.; Pisarski, W.A.; Dominiak-Dzik, G.; Berkowski, M.; Pajączkowska, A. Investigation of Eu3+ sites in SrLaGa3O7, SrLaGaO4 and SrLaAlO4 crystals. J. Phys. Chem. Solids 1997, 58, 639–645. [Google Scholar] [CrossRef]
  17. Kaczkan, M.; Malinowski, M. Inhomogeneity of Ho3+ activated SrLaGa3O7 and SrLaGaO4 crystals studied by fluorescence line narrowing technique. Opt. Mater. 2006, 28, 119–122. [Google Scholar] [CrossRef]
  18. Kaczkan, M.; Malinowski, M. Upconversion-induced ultraviolet emission in Ho3+ doped SrLaGa3O7 and SrLaGaO4 crystals. J. Alloys Compd. 2004, 380, 201–204. [Google Scholar] [CrossRef]
  19. Pajaczkowska, A.; Novosselov, A.V.; Zimina, G.V. On the dissociation and growth of SrLaGaO4 and SrLaAlO4 single crystals. J. Cryst. Growth 2001, 223, 169–174. [Google Scholar] [CrossRef]
  20. Shannon, R.; Oswald, R.; Parise, J.; Chai, B.; Byszewski, P.; Pajaczkowska, A.; Sobolewski, R. Dielectric constants and crystal structures of CaYAlO4, CaNdAlO4, and SrLaAlO4, and deviations from the oxide additivity rule. J. Solid State Chem. 1992, 98, 90–98. [Google Scholar] [CrossRef]
  21. Lomheim, T.S.; DeShazer, L.G. Optical-absorption intensities of trivalent neodymium in the uniaxial crystal yttrium orthovanadate. J. Appl. Phys. 1978, 49, 5517–5522. [Google Scholar] [CrossRef]
  22. Judd, B.R. Optical Absorption Intensities of Rare-Earth Ions. Phys. Rev. 1962, 127, 750–761. [Google Scholar] [CrossRef]
  23. Ofelt, G.S. Intensities of Crystal Spectra of Rare-Earth Ions. J. Chem. Phys. 1962, 37, 511–520. [Google Scholar] [CrossRef]
  24. Walsh, B. Judd-Ofelt Theory: Principles and Practices; Di Bartolo, B., Forte, O., Eds.; Advances in Spectroscopy for Lasers and Sensing; Springer: Dordrecht, The Netherlands, 2006; pp. 403–433. [Google Scholar]
  25. Carnall, W.T.; Crosswhite, H.; Crosswhite, H.M. Energy Level Structure and Transition Probabilities of the Trivalent Lanthanides in LaF3; Argonne National Laboratory: Argonne, IL, USA, 1975. [Google Scholar]
  26. Kaminskii, A.A. Crystalline Lasers; CRC Press: Boca Raton, FL, USA, 1996. [Google Scholar]
  27. Kaczkan, M.; Pracka, I.; Malinowski, M. Optical transitions of Ho3+ in SrLaGa3O7. Opt. Mater. 2004, 25, 345–352. [Google Scholar] [CrossRef]
  28. Walsh, B.M.; Grew, G.W.; Barnes, N.P. Energy levels and intensity parameters of Ho3+ ions in Y3Al5O12 and Lu3Al5O12. J. Phys. Chem. Solids 2006, 67, 1567–1582. [Google Scholar] [CrossRef]
  29. Walsh, B.M.; Grew, G.W.; Barnes, N.P. Energy levels and intensity parameters of Ho3+ ions in GdLiF4, YLiF4 and LuLiF4. J. Phys. Condens. Matter 2005, 17, 7643–7665. [Google Scholar] [CrossRef]
  30. Riseberg, A.; Moos, H.W. Multiphonon Orbit-Lattice Relaxation of Excited States of Rare-Earth Ions in Crystals. Phys. Rev. 1968, 157, 429–438. [Google Scholar] [CrossRef]
  31. Mobini, E.; Peysokhan, M.; Abaie, B.; Hehlen, M.P.; Mafi, A. Spectroscopic Investigation of Yb -Doped Silica Glass for Solid-State Optical Refrigeration. Phys. Rev. Appl. 2019, 11, 014066. [Google Scholar] [CrossRef] [Green Version]
  32. Kamba, S.; Buixaderas, E.; Pajaczkowska, A. Polarized IR Spectra of SrLaAlO4 and SrLaGaO4 Single Crystals. Phys. Stat. Sol. 1998, 168, 317–324. [Google Scholar] [CrossRef]
  33. Liu, C.; Heo, J. Up-conversion and photon avalanche in oxy-fluoride nano-structured glasses doped with Ho3+. J. Non-Cryst. Solids 2006, 352, 5325–5330. [Google Scholar] [CrossRef]
  34. Auzel, F. Multiphonon-assisted anti-Stokes and Stokes fluorescence of triply ionized rare-earth ions. Phys. Rev. B 1976, 13, 2809–2817. [Google Scholar] [CrossRef]
  35. Kück, S.; Osiac, E.; Sokólska, I. Determination of excited state absorption cross sections for spectrally overlapping transitions via phase sensitive detection. In Proceedings of the CLEO/Europe. 2005 Conference on Lasers and Electro-Optics Europe, Munich, Germany, 12–17 June 2005; p. 47. [Google Scholar]
  36. Goldner, P.; Pelle, F. Photon avalanche fluorescence and lasers. Opt. Mater. 1996, 5, 239–249. [Google Scholar] [CrossRef]
Figure 1. The partial energy diagram of Ho3+ ions in SrLaGO4 crystal. Arrows indicate the emission transitions.
Materials 14 03831 g001
Figure 2. Schematic crystal structure of SrLaGaO4.
Materials 14 03831 g002
Figure 3. (a) Visible and (b) Infrared part of the polarized absorption spectrum of SrLaGaO4:Ho3+ crystal recorded at room temperature.
Materials 14 03831 g003
Figure 4. (a) UV-Vis and (b) IR part of polarized emission spectrum of SrLaGaO4: Ho3+ recorded at room temperature.
Materials 14 03831 g004
Figure 5. Decay profiles of the 3D3, 5S2, 5F5, 5I6 and 5I7 emission in Ho3+ doped SrLaGaO4 crystal measured at 300 K.
Materials 14 03831 g005
Figure 6. The multiphonon relaxation rate Wnr as a function of energy gap ΔE for the excited states of Ho3+ ion in SrLaGaO4—red line. Open circles denote experimental points. For comparison the data for ZBLAN glass are also presented—blue solid line.
Materials 14 03831 g006
Figure 7. Spectrum of calculated ground state absorption (GSA) and excited state absorption (ESA) integrated cross sections σ in SrLaGaO4:Ho3+ crystal.
Materials 14 03831 g007
Figure 8. Energy level diagram of Ho3+ presenting different paths of populating the 5S2 state of Ho3+ involving GSA and ESA processes.
Materials 14 03831 g008
Figure 9. Excitation spectra of SrLaGaO4:Ho3+ crystal when monitoring the strongest 5S25I8 emission transition at 550 nm, T = 300 K.
Materials 14 03831 g009
Figure 10. Sed values’ dependence on Ωt parameters for transitions involved in 750 nm up-conversion excitation.
Materials 14 03831 g010
Table 1. Oscillator strengths (fexp—measured, ftheor—calculated) of absorption transitions for Ho3+ ion in SrLaGaO4 crystal.
Transition
5I8
Wavelength
λ [nm]
Oscillator Strengths
f ¯ e x p [10−6] f ¯ t h e o r [10−6]
5I720112.191.73
5I611691.131.34
5I59020.330.24
5I47480.030.02
5F56473.372.29
5S2 + 5F45413.864.04
5F34880.921.58
5F24760.100.92
3K84700.290.84
5G6 + 5F145420.76.68
RMS = 5.3 × 10⁻⁶
Table 2. Calculated Judd–Ofelt intensity parameters for SrLaGaO4:Ho3+ compared with several Ho3+ ion activated solids.
MaterialΩ2
[10−20 cm2]
Ω4
[10−20 cm2]
Ω6
[10−20 cm2]
Ref.
SrLaGaO4 (SLO)1.250.421.80This work
SrLaGa3O7 (SLG)2.230.851.81[27]
ZBLAN glass2.462.021.71[12]
Y3Al5O12 (YAG)0.102.091.72[28]
LiYF4 (YLF)1.162.242.09[29]
Table 3. Probabilities of radiative transitions, branching ratios and radiative lifetimes of excited states of Ho3+ in SrLaGaO4 crystal.
TransitionSrLaGaO4:Ho3+
A
[1/s]
βτR
3D33G5220.011
5G5700.034
3K7320.015
5G6200.009
3K88210.374
5F3250.011
5F4350.016
5F5110.005
5I4500.023
5I61060.141
5I77940.361
5I8870.039
∑A = 20971477 μs
5F35F400.000
5S200.000
5F510.000
5I41120.024
5I5500.011
5I62650.057
5I77610.165
5I834270.742
∑A = 46151217 μs
5S25F500.000
5I4640.013
5I5640.014
5I62560.054
5I718350.388
5I825110.531
∑A = 47311211 μs
5F55I400.000
5I5110.004
5I61400.052
5I74710.175
5I820680.769
∑A = 26901372 μs
5I45I590.050
5I6700.371
5I7900.478
5I8190.100
∑A = 18715.34 ms
5I55I690.031
5I71730.583
5I81150.386
∑A = 29713.37 ms
5I65I7300.084
5I83240.916
∑A = 35312.83 ms
5I75I812518.02 ms
Table 4. Calculated radiative lifetimes τR, lifetimes observed at T = 10 K τobs, energy gaps ΔE, and obtained multiphonon transition rates Wnr for excited states of Ho3+ in SrLaGaO4 crystal.
ManifoldSrLaGaO4:Ho3+
τR
[µs]
τobs
[µs]
ΔEi(i−1)
[cm−1]
Wnr
[s−1]
3D347735210026,500
5S221115127941883
5F53727~1950140,169
5I6283312003426480
5I7801540004225125
Table 5. Calculated GSA and ESA absorption cross section values for transitions involved in the 750 nm excitation process for SrLaGaO4 and several other Ho3+ activated materials.
Material5I85I45I75S2 + 5F45I65G6 + 5F1Ref.
σ (GSA)
[10−20 cm2]
σ (ESA)
[10−20 cm2]
σ (ESA)
[10−20 cm2]
SLO0.00531.2420.903This work
SLG0.00371.3180.116[27]
ZBLAN0.00251.2200.942[12]
YAG0.00361.3091.202[28]
YLF0.00371.4051.080[29]
Table 6. Doubly reduced matrix elements for selected transitions in Ho3+ ions.
|Ut|25I85I45I75F45I75S25I75S2 + 5F45I65G65I65F15I65G6 + 5F1
|U2|200000.009300.0093
|U4|200.196500.19650.083700.0837
|U6|20.00820.03490.41950.45440.10940.23830.3477
Publisher’s Note: MDPI stays neutral with regard to jurisdictional claims in published maps and institutional affiliations.

