Abstract
Simultaneous high-pressure Brillouin spectroscopy and powder X-ray diffraction of cerium dioxide powders are presented at room temperature to a pressure of 45 GPa. Micro- and nanocrystalline powders are studied and the density, acoustic velocities and elastic moduli determined. In contrast to recent reports of anomalous compressibility and strength in nanocrystalline cerium dioxide, the acoustic velocities are found to be insensitive to grain size and enhanced strength is not observed in nanocrystalline CeO. Discrepancies in the bulk moduli derived from Brillouin and powder X-ray diffraction studies suggest that the properties of CeO are sensitive to the hydrostaticity of its environment. Our Brillouin data give the shear modulus, = 63 (3) GPa, and adiabatic bulk modulus, = 142 (9) GPa, which is considerably lower than the isothermal bulk modulus, 230 GPa, determined by high-pressure X-ray diffraction experiments.
1. Introduction
Brillouin spectroscopy allows for the direct determination of acoustic velocities and elastic moduli of materials, and is ideally suited for measuring these at high-pressures in diamond anvil cells [1]. It is well complemented by X-ray diffraction which allows a direct measurement of the density of the compressed material. Both techniques may be applied to either single- or poly-crystalline samples. While direction dependent elastic moduli may be determined from a single crystal, polycrystalline samples are of interest in the study of bulk properties and material response arising from both crystalline cores and grain boundaries. Powder samples also avoid the difficulty of maintaining single crystals to high pressure.
Cerium dioxide, CeO, has a number of uses including catalysis [2], sensors [3], and an emerging application as an oxygen ion conductor in solid oxide fuel cells [4]. It is also widely used as a non-hazardous analogue for the development of ceramic nuclear fuels, where its physical properties mimic those of oxide nuclear fuels [5,6,7]. This allows testing of designs without the hazards associated with radioactive compounds. Procedures for end of life disposal of spent fuel are vital for future nuclear energy. Most proposed methods to deal with spent nuclear fuel involve its long-term entombment in the Earth [8]. Understanding its polycrystalline high-pressure behavior is vital where deep storage systems may collapse or be subject to seismic activity.
At ambient conditions cerium dioxide adopts a cubic fluorite structure with space group . This persists to 31.5 GPa where it transforms to an -PbCl type structure with the space group [9,10]. This transition is kinetically slow with the low-pressure phase co-existing substantially above the transition pressure. Hysteresis is also observed on decompression with the high-pressure -PbCl-type structure persisting considerably below the nominal 31.5 GPa transition pressure [9,11,12]. The bulk modulus of the low-pressure fluorite phase of cerium dioxide is the subject of considerable disagreement in the literature. A number of studies report the compression of powdered cerium dioxide in diamond anvil cells and find bulk moduli of 230 [9], 235 [13], and 220 GPa [14]. The studies reporting higher values did not utilize pressure transmitting media (PTM) and so will shows the effect of non-hydrostatic strain. Liu et al. [13] attempted to correct for this using a combination of line-shift and line-width analysis, and report non-hydrostaticity increases from 1 to 2 GPa between measured pressures of 2 and 25 GPa. Other studies have also investigated the extraction of equations of state by applying corrections to data collected from non-hydrostatically compressed samples [15,16]. Gerward et al. [14] compressed to 20 GPa with a 16:3:1 methanol:ethanol:water PTM which is hydrostatic below 10 GPa, though quite stiff above this [17], and find a lower bulk modulus of 220 GPa.
Recently, it has been reported that the compressibility of cerium dioxide depends on the grain size of the powder, with nanoparticles exhibiting different behavior from microcrystalline samples. Below 10 GPa the bulk modulus of nanocrystalline cerium dioxide measured by high pressure diffraction varies considerably with reported values ranging between 248 and 328 GPa [18,19,20]. These values are higher than the value for bulk cerium dioxide. A summary of literature values for the bulk modulus of cerium dioxide is presented in Table 1.

Table 1.
Bulk moduli of cerium dioxide measured using X-ray diffraction in diamond anvil cells. All studies use ruby fluorescence to determine pressure, except Wang 2004 which uses the equation of state of Pt, and Wang 2014 which uses both ruby and the equation of state of Au. ‘BM’ refers to the Birch-Murnaghan equation of state.
Above 15 GPa a dramatic decrease in the compressibility of cerium dioxide nanopowder is reported, attributed to a ‘core-shell’ model [18]. A plateau is reported in the compressibility curve of cerium dioxide between 15 and 25 GPa, the exact nature of which depends on the PTM. For silicone oil a negative bulk modulus is reported in this region, which violates the stability criteria for crystals [22]. It is also worth noting that above 15 GPa a silicone oil PTM is known to become substantially non-hydrostatic [17].
The uncertainty in the literature is compounded when previous acoustic measurements are considered. To date, this is the only Brillouin study performed on cerium dioxide at high pressure, but ambient pressure measurements have been reported [23]. From these the elastic constants and adiabatic bulk modulus can be calculated. The bulk modulus is found to be 204 GPa, anomalously lower than the values for the isothermal bulk modulus reported by high pressure powder X-ray diffraction. It should be noted that thermodynamically the adiabatic bulk modulus must be greater than or equal to the isothermal bulk modulus [24,25].
The elasticity of cerium dioxide has also been explored by density functional theory [14,26,27,28,29,30]. The bulk moduli thence obtained vary depending on the details of the simulation, and have been reported between 177 [14] and 236 GPa [26], with results based on the local density approximation (LDA) generally higher, in the region of 210 GPa, than those obtained via the generalized gradient approximation (GGA), yielding values around 180 GPa. In general, theoretical results lie closer to the bulk modulus measured via Brillouin spectroscopy [23] than those reported from high-pressure powder X-ray diffraction [9,13,14]. These results are summarized in Table 2.
Table 2.
Bulk moduli of cerium dioxide as determined by theory.
Despite the large body of literature on the compressibility of cerium dioxide, few clear trends are present. The choice of pressure transmitting media, the crystallite size, nanoparticle shape and degree of crystallinity influence elasticity and measured compressibility [31,32]. In addition to X-ray diffraction cerium dioxide has also been studied via high-pressure Raman spectroscopy [11,12,33,34,35] and under shock conditions [36,37]. Here, we investigate micro- and nanocrystalline cerium dioxide using simultaneous powder X-ray diffraction and Brillouin spectroscopy to determine the high pressure elastic moduli. The density, sound velocities and elastic moduli are measured to 45 GPa without a pressure transmitting medium.
2. Materials and Methods
Cerium dioxide powders of nano- and micro-scale grain size were loaded without a PTM into diamond anvil cells equipped with wide angle Bohler—Almax anvils with 300 m diameter culets. The nanopowder (Sigma-Adrich, St. Louis, MO, USA) had grain size <25 nm, while the micropowder (Sigma-Aldrich, 99.9% trace metals basis) had a typical grain size of 5 m. Rhenium gaskets were indented to 50 m thickness and sample holes drilled using a laser cutting apparatus [38]. Pressure was determined using ruby fluorescence [39] and/or the equation of state of a small flake of gold [40] included in the loading.
Brillouin spectroscopy and powder X-ray diffraction were performed at GSECARS 13-BM-D at the Advanced Photon Source. Both techniques probed the same location on the sample. Angle dispersive powder X-ray diffraction was performed using 0.3344 Å radiation focussed to a 6 × 12 mm spot. Diffraction patterns were collected on a PerkinElmer amorphous silicon flat panel X-ray detector. Patterns were integrated using the Dioptas software package [41] and LeBail fits performed using Jana [42].
Brillouin spectra were collected using a 532 nm frequency doubled Nd:YVO excitation laser with a six pass Fabry–Pérot interferometer [43]. Equal angle geometry ( = 50 ) was used to obviate the need to know the refractive index under pressure [43]. The intensity of the Brillouin modes observed was very low, requiring 2 to 3 h collection times to achieve clear peaks. Even with such collections the longitudinal mode could not always be observed above background.
Compression was performed without a PTM to optimize the Brillouin signal. Compression to 2 GPa results in greater transparency compared to pre-pressed samples embedded in a PTM. The reduced transparency when compressing with a PTM, presence of multiple reflections from PTM-CeO interfaces, and additional Brillouin features from the PTM, makes the use of a PTM impractical in this case.
3. Results
The Brillouin spectrum of cerium dioxide at 3.6 GPa (Figure 1) shows a weak longitudinal mode compared to the transverse mode. Figure 2 shows a representative powder X-ray diffraction pattern of the cerium dioxide at 17.9 GPa which was used to calculate the in situ density.
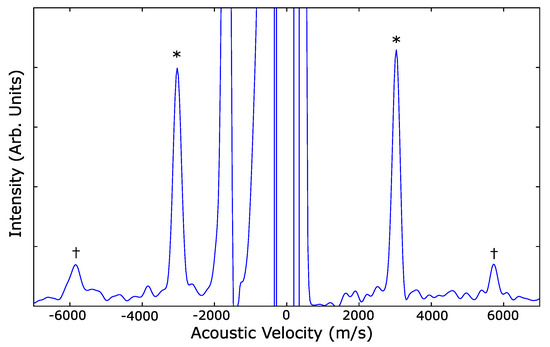
Figure 1.
Brillouin spectrum of cerium dioxide nanopowder at 3.6 GPa. Transverse modes are marked with asterisks, longitudinal modes occur at higher shift and are marked with daggers.
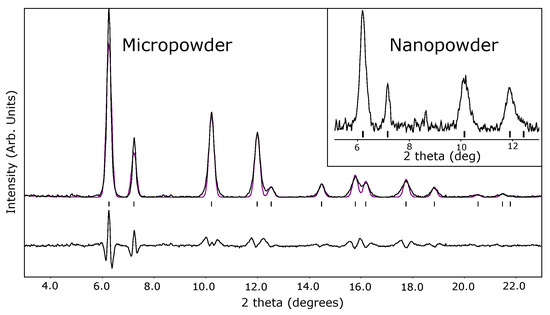
Figure 2.
Powder X-ray diffraction pattern of cerium dioxide micropowder at 17.9 GPa collected using Å radiation. Integrated data in black with LeBail fit in red and residual below. Tics show angles of allowed reflections of low-pressure phase. Inset: Integrated pattern from nanopowder at 12.0 GPa, the peaks are broadened due to size effects. Additional diffraction patterns are shown in the supplemental materials.
The experimentally determined unit cell volumes of the low-pressure phase of cerium dioxide micro- and nanopowders are shown in Figure 3 along with the equation of state fitted by Liu et al. [13] without line width corrections. This non-hydrostatic equation of state agrees well with the values observed here. The scatter in the unit cell volumes vs pressure in Figure 3 arises from differing non-hydrostatic strain which varied between samples, with pressure, and on compression and decompression.
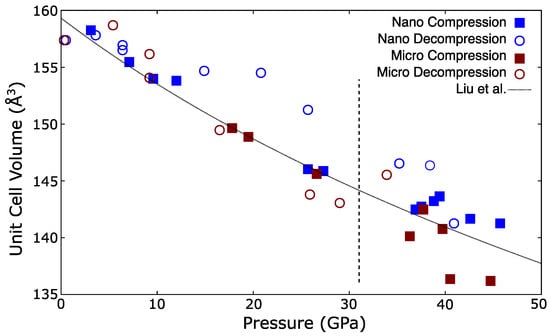
Figure 3.
Unit cell volume vs. pressure for cerium dioxide micro- and nanopowders on compression and decompression. Vertical dashed line indicates nominal transition pressure from the phase to , note that the phase persists above this. Uncertainties from LeBail fits are typically around 0.1 Å, and smaller than plotting points.
On decompression the unit cell volume of the nanopowder was anomalously large, particularly between 15 and 25 GPa. This could arise from mechanisms involving differing behavior between the core and shell of the nanoparticles as has been proposed in previous compression studies of cerium dioxide nanoparticles [18,19]. However, on compression the unit cell volume of the nanopowder agreed with that of the micropowder, which would not be expected were it actually stiffer. Therefore non-hydrostaticity could not be ruled out as the cause of this discrepancy.
A plot of the sound velocities of the micro- and nanopowders as a function of pressure is shown in Figure 4. Both sets of data lay on similar trends suggesting that the sound velocity was insensitive to grain size.
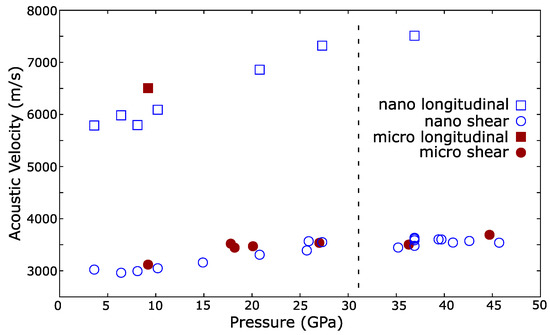
Figure 4.
The evolution of the sound velocities of cerium dioxide micro- and nanopowders with pressure. Open symbols are nanopowders, closed symbols are micropowders. Squares are longitudinal mode velocities, circles are transverse. Acoustic velocity is not significantly affected by particle size. Vertical dashed line indicates the nominal transition pressure from the phase to . Uncertainties are of similar size to plotting points: 40 ms for shear and 60 ms for longitudinal sound velocities.
Using the longitudinal sound velocity, , and transverse sound velocity, , measured by Brillouin spectroscopy and the mass density, , measured in situ by powder X-ray diffraction, it is possible to calculate the elastic moduli of the material via:
where and G are the adiabatic bulk modulus and shear modulus respectively. The pressure dependences of and G for micro- and nanopowders are shown in Figure 5. The shear modulus was insensitive to particle size and increases with pressure. Increasing G with pressure is normal and observed in other materials [1,44]. As noted, the longitudinal mode was extremely weak and was only detected at one pressure from the micropowder. However, this lay on the established trend observed in the nanopowder suggesting that the adiabatic bulk modulus was similarly insensitive to grain size, in agreement with the densities determined via X-ray diffraction, see Figure 3.
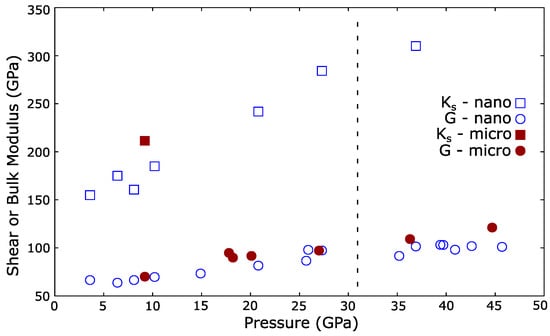
Figure 5.
Adiabatic bulk moduli (, squares) and shear moduli (G, circles) of cerium dioxide nano- and micropowders (open and closed symbols respectively) as a function of pressure. Vertical dashed line indicates the nominal transition pressure from the phase to .
Above 31.5 GPa cerium dioxide is known to undergo a phase transition from the low-pressure cubic fluorite structure to a high-pressure Pnam -PbCl-type structure [9,10]. The results here on the micropowder agree with the literature. While some transformation to the high pressure phase occurred by 36 GPa, some of the low pressure fluorite structure persisted to the highest pressure reached. A similar effect was observed on decompression with traces of the phase observable to 5 GPa. Other studies also report a significant pressure range of coexistence [9,10]. Only a small quantity of the phase formed in the nanopowder at 38 GPa on decompression with traces persisting to 6 GPa. The density of the high pressure phase was about 8% greater than the low pressure one, within the range of values reported previously [9,10].
4. Discussion
Various recent studies have observed anomalous compressibility in cerium dioxide nanoparticles [18,19,45]. The effect is strongly dependent on the PTM used, nanoparticle size and the influence of the PTM on the nano-grain boundaries. Cerium dioxide nanoparticles are reported to show an anomalously low compressibility at low pressure, with the bulk modulus reported to exceed the bulk value by 25 to 40% [18,19]. Our observation that the sound velocities are similar between micro- and nanopowders, Figure 4 and Figure 5, is incompatible with this and suggests that the strengths of the materials are similar under pressure. The reported anomalous behavior is dependent on the PTM used. Coupled with our results, this suggests that the observations may be due to changes in the non-hydrostatic strain on the sample as PTMs harden at high pressure [17], or from more complex interactions between the nanoparticles and PTM, and are not representative of cerium dioxide alone under hydrostatic strain.
The adiabatic bulk moduli measured under pressure, see Figure 5, are rather lower than the isothermal bulk moduli reported from powder X-ray diffraction which fit the zero pressure bulk modulus between 220 and 235 GPa [13,14]. However, the elastic moduli reported from Brillouin scattering at ambient pressure more closely agree with those observed here [23]. The literature zero-pressure shear modulus is reported to be 60 GPa, in agreement with = 63 (3) GPa extrapolated to zero-pressure from our data. The reported zero-pressure adiabatic bulk modulus is 204 GPa. This value is higher than that observed here under non-hydrostatic conditions, which extrapolates to = 142 (9) GPa. Both values are considerably lower than the isothermal bulk modulus fitted from high pressure powder X-ray diffraction experiments. It should be noted that the data here are from cerium dioxide compressed without a pressure transmitting medium so there will be a few GPa of non-hydrostaticity [13]. Lowering of the acoustic velocities by non-hydrostatic stress has been observed in magnesium oxide [31], and may explain the low adiabatic bulk modulus obtained in our Brillouin measurements.
This highlights a substantial discrepancy in the literature as the adiabatic bulk modulus is strictly greater than the isothermal bulk modulus. [25]. The origin of the disagreement between the isothermal zero-pressure bulk modulus of cerium dioxide measured using powder X-ray diffraction and the adiabatic bulk modulus measured using Brillouin scattering is like attributable to non-hydrostaticity at high-pressure. The X-ray powder diffraction studies which report the highest bulk moduli, around 235 GPa, [9,13] compressed without a pressure transmitting medium which results in large non-hydrostaticity. This causes difficulties in fitting equations of state to obtain a zero-pressure value for . A study utilizing a PTM reports a lower bulk modulus of 220 GPa [14] but their data run to 20 GPa which is significantly in excess of the hydrostatic limit of their PTM [17]. Along with the insensitivity of the elastic moduli to grain size measured using Brillouin spectroscopy, this suggests caution must be taken when considering compressibility of nanoparticles at pressures where there are changes in the hardness of the pressure transmitting media used.
5. Conclusions
In conclusion, we have compared the acoustic velocities of micro- and nano-crystalline cerium dioxide under pressure and do not observe any significant difference between them despite reports of anomalous compressibility in cerium dioxide nanoparticles. The adiabatic and shear moduli derived from the acoustic velocities are reported as a function of pressure. The shear modulus agrees well with the value measured at zero pressure while the adiabatic bulk modulus is lower than the isothermal bulk modulus reported from high-pressure powder X-ray diffraction experiment. The disparity between elastic moduli measured using Brillouin scattering and high-pressure powder X-ray diffraction arises from non-hydrostaticity suggesting that extreme care must be taken in selection of pressure transmitting media when considering the compressibility of cerium dioxide nanoparticles.
Supplementary Materials
The following are available online at https://www.mdpi.com/article/10.3390/ma14133683/s1, Supplemental Figure S1: Integrated powder X-ray diffraction patternsof cerium dioxideon compression pastthe Fm-3m to Pnam transition nominally at 31 GPa. Only a little conversion occurs up to 37.7 GPa with someof thelow-pressurephase persistingup to the highest pressures.
Author Contributions
Conceptualization, M.F. and A.E.G.; methodology, M.F., A.E.G. and V.B.P.; formal analysis, M.F.; investigation, M.F., J.D.L., A.L.L., P.S., S.N.T. and H.Y.; resources, V.B.P.; writing—original draft preparation, M.F.; writing—review and editing, A.E.G.; supervision, S.H.G. and A.E.G.; funding acquisition, S.H.G. All authors have read and agreed to the published version of the manuscript.
Funding
This research was funded by US Department of Energy Office of Fusion Energy Sciences grant number FWP100182. A.E.G. acknowledges support from LANL Reines LDRD.
Institutional Review Board Statement
Not applicable.
Informed Consent Statement
Not applicable.
Data Availability Statement
Data are available on reasonable request.
Acknowledgments
This work was performed at GeoSoilEnviroCARS (Sector 13), Advanced Photon Source (APS), Argonne National Laboratory. GeoSoilEnviroCARS is supported by the National Science Foundation—Earth Sciences (EAR-1128799) and Department of Energy—Geosciences (DE-FG02-94ER14466). Use of the Advanced Photon Source was supported by the U. S. Department of Energy, Office of Science, Office of Basic Energy Sciences, under Contract No. DE-AC02-06CH11357.
Conflicts of Interest
The authors declare no conflict of interest.
Abbreviation
| PTM | Pressure Transmitting Medium |
References
- Whitfield, C.H.; Brody, E.M.; Bassett, W.A. Elastic moduli of NaCl by Brillouin scattering at high pressure in a diamond anvil cell. Rev. Sci. Instrum. 1976, 47, 942–947. [Google Scholar] [CrossRef]
- Montini, T.; Melchionna, M.; Monai, M.; Fornasiero, P. Fundamentals and catalytic applications of CeO2-based materials. Chem. Rev. 2016, 116, 5987–6041. [Google Scholar] [CrossRef]
- Jasinski, P.; Suzuki, T.; Anderson, H.U. Nanocrystalline undoped ceria oxygen sensor. Sens. Actuators B Chem. 2003, 95, 73–77. [Google Scholar] [CrossRef]
- Kharton, V.; Figueiredo, F.; Navarro, L.; Naumovich, E.; Kovalevsky, A.; Yaremchenko, A.; Viskup, A.; Carneiro, A.; Marques, F.; Frade, J. Ceria-based materials for solid oxide fuel cells. J. Mater. Sci. 2001, 36, 1105–1117. [Google Scholar] [CrossRef]
- Stennett, M.C.; Corkhill, C.L.; Marshall, L.A.; Hyatt, N.C. Preparation, characterisation and dissolution of a CeO2 analogue for UO2 nuclear fuel. J. Nucl. Mater. 2013, 432, 182–188. [Google Scholar] [CrossRef]
- Watkinson, E.J.; Ambrosi, R.M.; Kramer, D.; Williams, H.R.; Reece, M.; Chen, K.; Sarsfield, M.; Barklay, C.; Fenwick, H.; Weston, D.P.; et al. Sintering trials of analogues of americium oxides for radioisotope power systems. J. Nucl. Mater. 2017, 491, 18–30. [Google Scholar] [CrossRef]
- Corkhill, C.L.; Bailey, D.J.; Tocino, F.Y.; Stennett, M.C.; Miller, J.A.; Provis, J.L.; Travis, K.P.; Hyatt, N.C. Role of microstructure and surface defects on the dissolution kinetics of CeO2, a UO2 fuel analogue. ACS Appl. Mater. Interfaces 2016, 8, 10562–10571. [Google Scholar] [CrossRef] [PubMed]
- Chapman, N.A.; McKinley, I.G.; Hill, M.D. The Geological Disposal of Nuclear Waste; John Wiley and Sons: Hoboken, NJ, USA, 1987. [Google Scholar]
- Duclos, S.J.; Vohra, Y.K.; Ruoff, A.L.; Jayaraman, A.; Espinosa, G. High-pressure x-ray diffraction study of CeO2 to 70 GPa and pressure-induced phase transformation from the fluorite structure. Phys. Rev. B 1988, 38, 7755. [Google Scholar] [CrossRef]
- Gerward, L.; Olsen, J.S. Powder diffraction analysis of cerium dioxide at high pressure. Powder Diffr. 1993, 8, 127–129. [Google Scholar] [CrossRef]
- Kourouklis, G.; Jayaraman, A.; Espinosa, G. High-pressure Raman study of CeO2 to 35 GPa and pressure-induced phase transformation from the fluorite structure. Phys. Rev. B 1988, 37, 4250. [Google Scholar] [CrossRef]
- Rekhi, S.; Saxena, S.; Lazor, P. High-pressure Raman study on nanocrystalline CeO2. J. Appl. Phys. 2001, 89, 2968–2971. [Google Scholar] [CrossRef]
- Liu, L.; Song, H.X.; Wang, Z.; Geng, H.Y.; Jing, Q.; Zhang, Y.; Liu, S.; Xiang, S.; Bi, Y.; Xu, J.; et al. Strength and equation of state of fluorite phase CeO2 under high pressure. J. Appl. Phys. 2012, 112, 013532. [Google Scholar] [CrossRef]
- Gerward, L.; Olsen, J.S.; Petit, L.; Vaitheeswaran, G.; Kanchana, V.; Svane, A. Bulk modulus of CeO2 and PrO2: An experimental and theoretical study. J. Alloys Compd. 2005, 400, 56–61. [Google Scholar] [CrossRef]
- Singh, A.K. The lattice strains in a specimen (cubic system) compressed nonhydrostatically in an opposed anvil device. J. Appl. Phys. 1993, 73, 4278–4286. [Google Scholar] [CrossRef]
- Jeanloz, R.; Godwal, B. Deriving equations of state from non-hydrostatic data. J. Phys. Conf. Ser. IOP Publ. 2012, 377, 012032. [Google Scholar] [CrossRef]
- Klotz, S.; Chervin, J.; Munsch, P.; Le Marchand, G. Hydrostatic limits of 11 pressure transmitting media. J. Phys. D Appl. Phys. 2009, 42, 075413. [Google Scholar] [CrossRef]
- Wang, Q.; He, D.; Peng, F.; Lei, L.; Liu, P.; Yin, S.; Wang, P.; Xu, C.; Liu, J. Unusual compression behavior of nanocrystalline CeO2. Sci. Rep. 2014, 4, 4441. [Google Scholar] [CrossRef] [PubMed]
- Wang, Z.; Zhao, Y.; Schiferl, D.; Zha, C.; Downs, R.T. Pressure induced increase of particle size and resulting weakening of elastic stiffness of CeO2 nanocrystals. Appl. Phys. Lett. 2004, 85, 124–126. [Google Scholar] [CrossRef]
- Ge, M.; Fang, Y.; Wang, H.; Chen, W.; He, Y.; Liu, E.; Su, N.; Stahl, K.; Feng, Y.; Tse, J.; et al. Anomalous compressive behavior in CeO2 nanocubes under high pressure. New J. Phys. 2008, 10, 123016. [Google Scholar] [CrossRef]
- Liu, B.; Yao, M.; Liu, B.; Li, Z.; Liu, R.; Li, Q.; Li, D.; Zou, B.; Cui, T.; Zou, G.; et al. High-pressure studies on CeO2 nano-octahedrons with a (111)-terminated surface. J. Phys. Chem. C 2011, 115, 4546–4551. [Google Scholar] [CrossRef]
- Born, M. On the stability of crystal lattices. I. In Mathematical Proceedings of the Cambridge Philosophical Society; Cambridge University Press: Cambridge, UK, 1940; Volume 36, pp. 160–172. [Google Scholar]
- Nakajima, A.; Yoshihara, A.; Ishigame, M. Defect-induced Raman spectra in doped CeO2. Phys. Rev. B 1994, 50, 13297. [Google Scholar] [CrossRef] [PubMed]
- Dekker, A.J. The Specific Heat of Solids and Lattice Vibrations. In Solid State Physics; Macmillan Education UK: London, UK, 1981; pp. 32–59. [Google Scholar] [CrossRef]
- Gaskell, D.R.; Laughlin, D.E. Introduction to the Thermodynamics of Materials; CRC Press: Boca Raton, FL, USA, 2017. [Google Scholar]
- Mehrotra, S.; Sharma, P.; Rajagopalan, M.; Bandyopadhyay, A. High pressure phase transition and band structures of different phases in CeO2. Solid State Commun. 2006, 140, 313–317. [Google Scholar] [CrossRef]
- Skorodumova, N.; Ahuja, R.; Simak, S.; Abrikosov, I.; Johansson, B.; Lundqvist, B. Electronic, bonding, and optical properties of CeO2 and Ce2O3 from first principles. Phys. Rev. B 2001, 64, 115108. [Google Scholar] [CrossRef]
- Kanchana, V.; Vaitheeswaran, G.; Svane, A.; Delin, A. First-principles study of elastic properties of CeO2, ThO2 and PoO2. J. Phys. Condens. Matter 2006, 18, 9615. [Google Scholar] [CrossRef]
- Fabris, S.; de Gironcoli, S.; Baroni, S.; Vicario, G.; Balducci, G. Taming multiple valency with density functionals: A case study of defective ceria. Phys. Rev. B 2005, 71, 041102. [Google Scholar] [CrossRef]
- Gürel, T.; Eryiğit, R. Ab initio pressure-dependent vibrational and dielectric properties of CeO2. Phys. Rev. B 2006, 74, 014302. [Google Scholar] [CrossRef]
- Gleason, A.; Marquardt, H.; Chen, B.; Speziale, S.; Wu, J.; Jeanloz, R. Anomalous sound velocities in polycrystalline MgO under non-hydrostatic compression. Geophys. Res. Lett. 2011, 38. [Google Scholar] [CrossRef]
- Marquardt, H.; Speziale, S.; Marquardt, K.; Reichmann, H.; Konôpková, Z.; Morgenroth, W.; Liermann, H.P. The effect of crystallite size and stress condition on the equation of state of nanocrystalline MgO. J. Appl. Phys. 2011, 110, 113512. [Google Scholar] [CrossRef]
- Jimlim, P.; Bovornratanaraks, T.; Chaimayo, W.; Pratontep, S. Effect of Nano Particle Sizes on High Pressure Raman Scattering in Nanocrystalline Cerium Dioxide. Mod. Phys. Lett. B 2011, 25, 2399–2405. [Google Scholar] [CrossRef]
- Dogra, S.; Sharma, N.D.; Singh, J.; Poswal, H.K.; Sharma, S.M.; Bandyopadhyay, A.K. High pressure behavior of nano-crystalline CeO2 up to 35 GPa: A Raman investigation. High Press. Res. 2011, 31, 292–303. [Google Scholar] [CrossRef]
- Li, H.; Zhang, P.; Li, G.; Lu, J.; Wu, Q.; Gu, Y. Stress measurement for nonstoichiometric ceria films based on Raman spectroscopy. J. Alloys Compd. 2016, 682, 132–137. [Google Scholar] [CrossRef]
- Weck, P.F.; Cochrane, K.R.; Root, S.; Lane, J.M.D.; Shulenburger, L.; Carpenter, J.H.; Sjostrom, T.; Mattsson, T.R.; Vogler, T.J. Shock compression of strongly correlated oxides: A liquid-regime equation of state for cerium(IV) oxide. Phys. Rev. B 2018, 97, 125106. [Google Scholar] [CrossRef]
- Lang, J.M., Jr.; Voorhees, T.J.; Steiner, J.W.; Goodbody, A.B.; Bartram, B.D. Elastic limits of near-solid CeO2 to 25 GPa. AIP Conf. Proc. 2020, 2272, 100017. [Google Scholar]
- Frost, M.; Curry, C.; Glenzer, S. Laser cutting apparatus for high energy density and diamond anvil cell science. J. Instrum. 2020, 15, P05004. [Google Scholar] [CrossRef]
- Dewaele, A.; Torrent, M.; Loubeyre, P.; Mezouar, M. Compression curves of transition metals in the Mbar range: Experiments and projector augmented-wave calculations. Phys. Rev. B 2008, 78, 104102. [Google Scholar] [CrossRef]
- Dewaele, A.; Loubeyre, P.; Mezouar, M. Equations of state of six metals above 94 GPa. Phys. Rev. B 2004, 70, 094112. [Google Scholar] [CrossRef]
- Prescher, C.; Prakapenka, V.B. DIOPTAS: A program for reduction of two-dimensional X-ray diffraction data and data exploration. High Press. Res. 2015, 35, 223–230. [Google Scholar] [CrossRef]
- Petříček, V.; Dušek, M.; Palatinus, L. Crystallographic computing system JANA2006: General features. Z. Für-Krist. Cryst. Mater. 2014, 229, 345–352. [Google Scholar] [CrossRef]
- Sinogeikin, S.; Bass, J.; Prakapenka, V.; Lakshtanov, D.; Shen, G.; Sanchez-Valle, C.; Rivers, M. Brillouin spectrometer interfaced with synchrotron radiation for simultaneous X-ray density and acoustic velocity measurements. Rev. Sci. Instrum. 2006, 77, 103905. [Google Scholar] [CrossRef]
- Chen, B.; Gleason, A.; Yan, J.; Koski, K.; Clark, S.; Jeanloz, R. Elasticity, strength, and refractive index of argon at high pressures. Phys. Rev. B 2010, 81, 144110. [Google Scholar] [CrossRef]
- Rodenbough, P.P.; Song, J.; Walker, D.; Clark, S.M.; Kalkan, B.; Chan, S.W. Size dependent compressibility of nano-ceria: Minimum near 33 nm. Appl. Phys. Lett. 2015, 106, 163101. [Google Scholar] [CrossRef]


Publisher’s Note: MDPI stays neutral with regard to jurisdictional claims in published maps and institutional affiliations. |
© 2021 by the authors. Licensee MDPI, Basel, Switzerland. This article is an open access article distributed under the terms and conditions of the Creative Commons Attribution (CC BY) license (https://creativecommons.org/licenses/by/4.0/).