
Application of Principal Component Analysis Approach to Predict Shear Strength of Reinforced Concrete Beams with Stirrups


Abstract
:1. Introduction
2. Shear Strength in Design Codes
2.1. ACI 318-19
- (a)
- A diagonal crack occurs in the concrete principal compressive stress direction.
- (b)
- A diagonal crack occurs at 45 degrees and is uniformly distributed in the web of concrete.
- (c)
- The tensile strength of concrete on the cracked surface can be neglected. The dowel and interlock actions are also not directly considered.
- (d)
- The stress developed in the transverse reinforcement is equal to its yield stress, and the longitudinal reinforcement does not yield and remains in the elastic range.
2.2. EC2-04
2.3. Lee and Kim
3. Development of ANN Model
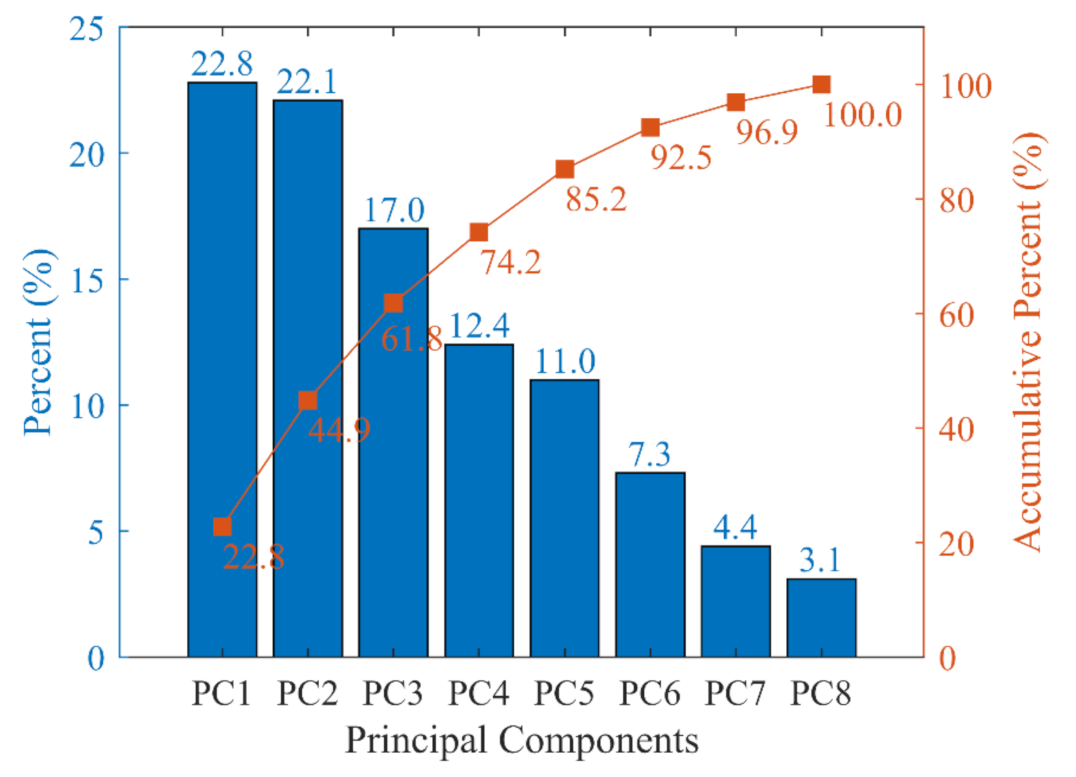
3.1. Principal Component Analysis
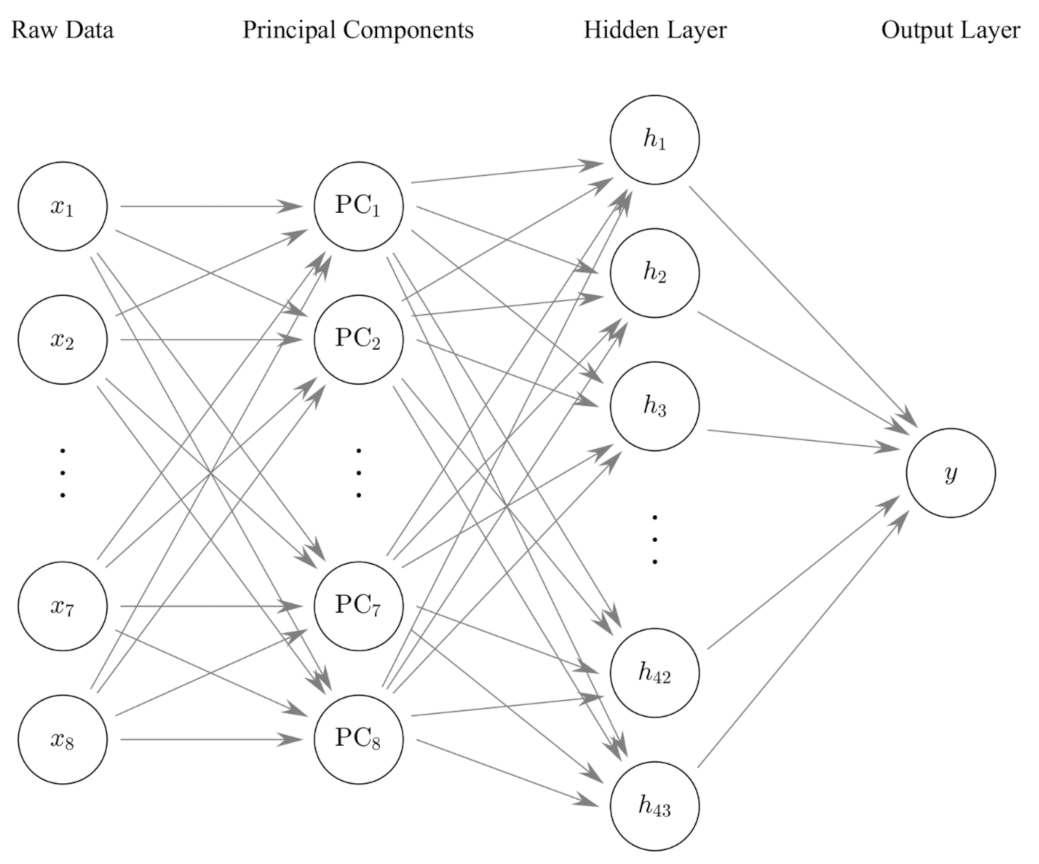
3.2. ANN Model
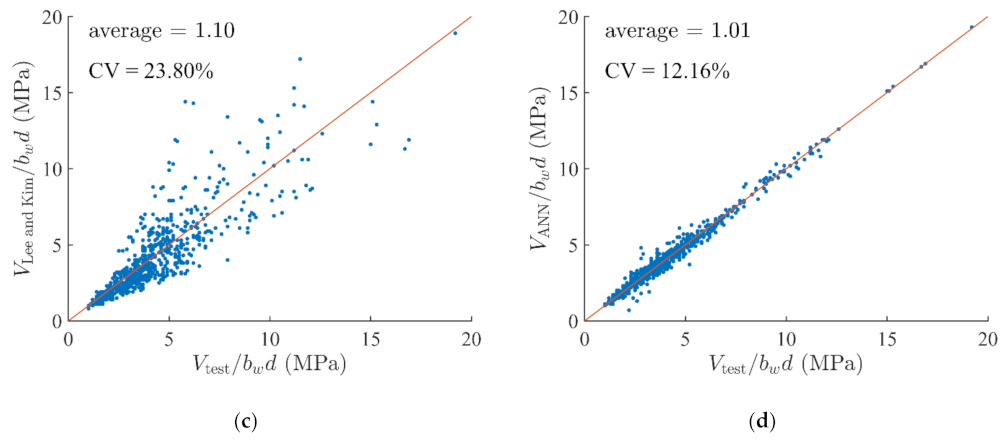
4. Model Validation
4.1. Validation Set
4.2. Parametric Study
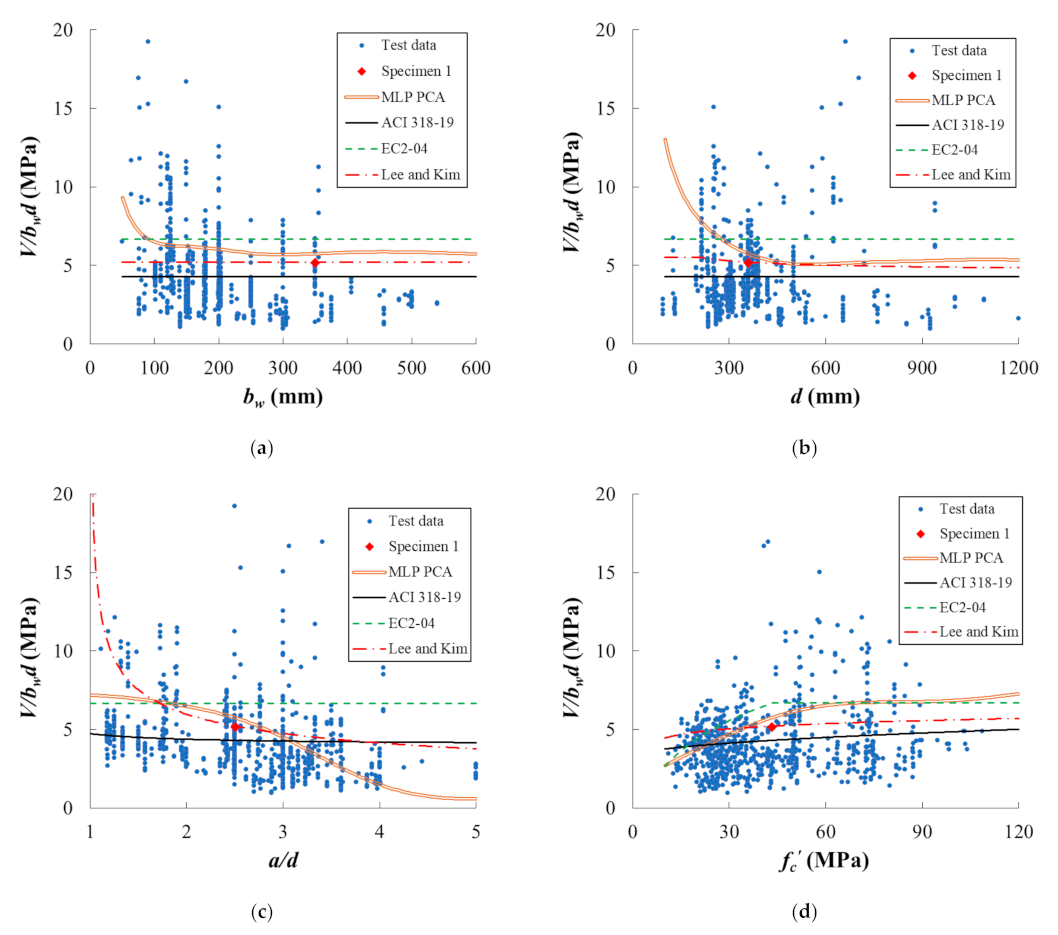
4.2.1. Beam width and Effective Depth
4.2.2. Shear Span Ratio
4.2.3. Concrete Compressive Strength
4.2.4. Strength of Longitudinal Reinforcement
4.2.5. Longitudinal Reinforcement Ratio
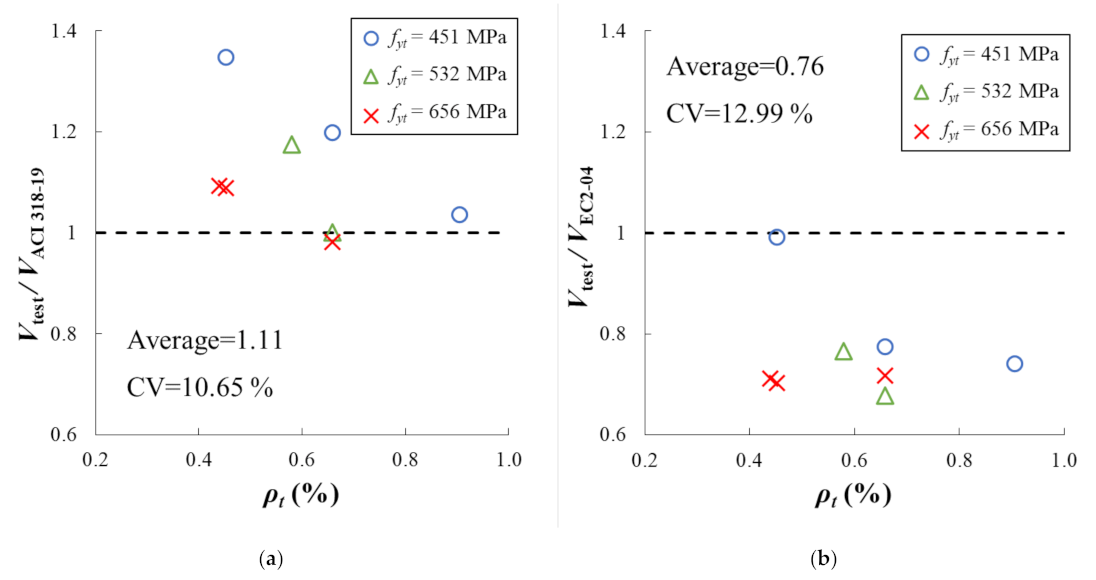
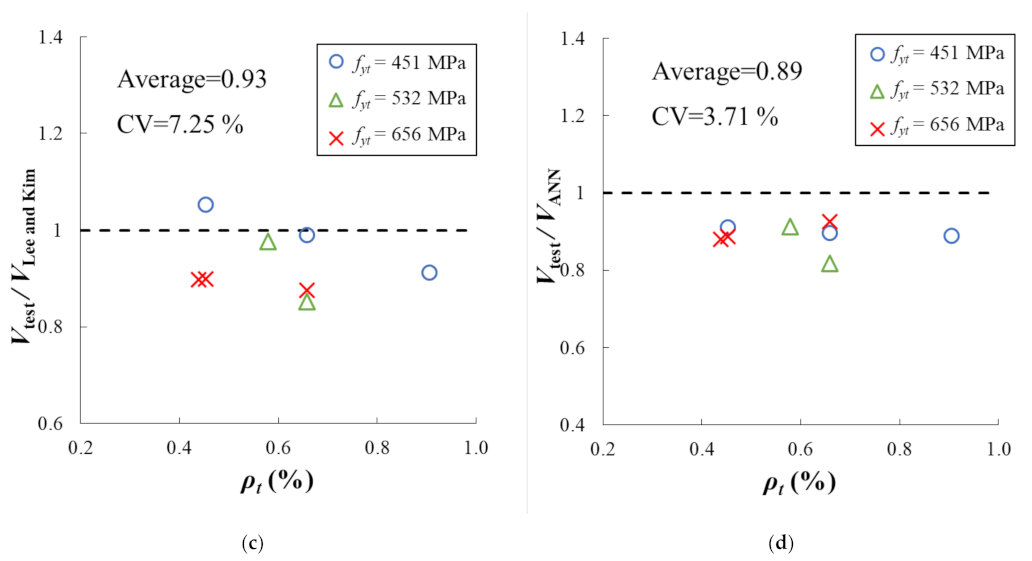
4.2.6. Strength of Transverse Reinforcement
4.2.7. Transverse Reinforcement Ratio
5. Discussions and Limitations
6. Conclusions
Author Contributions
Funding
Institutional Review Board Statement
Informed Consent Statement
Data Availability Statement
Conflicts of Interest
Appendix A

| Section Properties | Concrete | Longitudinal Bars | Transverse Bars | ||||||||||||
|---|---|---|---|---|---|---|---|---|---|---|---|---|---|---|---|
| bw (mm) | d (mm) | a/d | fc’ (MPa) | fyl (MPa) | ρl (%) | fyt (MPa) | ρt (%) | ||||||||
| Min. | Max. | Min. | Max. | Min. | Max. | Min. | Max. | Min. | Max. | Min. | Max. | Min. | Max. | Min. | Max. |
| 290 | 290 | 278 | 278 | 2.88 | 2.88 | 49 | 51 | 536 | 536 | 1.950 | 1.950 | 460 | 460 | 0.110 | 0.280 |
| 127 | 127 | 198 | 203 | 2.92 | 3.92 | 39 | 103 | 421 | 421 | 3.191 | 4.531 | 324 | 324 | 0.491 | 0.785 |
| 127 | 127 | 198 | 216 | 3.00 | 4.00 | 45 | 88 | 421 | 421 | 2.070 | 4.540 | 324 | 324 | 0.490 | 0.780 |
| 406 | 406 | 345 | 345 | 2.65 | 2.65 | 29 | 34 | 434 | 434 | 2.310 | 2.310 | 544 | 549 | 0.390 | 0.390 |
| 300 | 300 | 925 | 925 | 2.70 | 2.88 | 21 | 80 | 550 | 550 | 0.505 | 1.010 | 508 | 508 | 0.079 | 0.079 |
| 75 | 150 | 704 | 1369 | 3.06 | 3.41 | 41 | 42 | 500 | 520 | 9.400 | 14.470 | 500 | 582 | 1.676 | 1.774 |
| 240 | 240 | 300 | 1200 | 2.70 | 2.88 | 23 | 25 | 426 | 426 | 1.257 | 1.257 | 442 | 442 | 0.147 | 0.147 |
| 155 | 307 | 464 | 466 | 3.76 | 3.78 | 22 | 27 | 555 | 555 | 1.795 | 1.800 | 326 | 326 | 0.098 | 0.195 |
| 152 | 305 | 457 | 462 | 3.95 | 4.01 | 23 | 27 | 400 | 400 | 1.670 | 2.340 | 340 | 350 | 0.100 | 0.200 |
| 139 | 139 | 234 | 234 | 2.56 | 2.56 | 28 | 28 | 819 | 819 | 1.043 | 1.043 | 437 | 437 | 0.407 | 0.407 |
| 125 | 125 | 215 | 215 | 1.40 | 2.40 | 52 | 73 | 417 | 417 | 3.795 | 3.795 | 388 | 388 | 0.200 | 1.800 |
| 200 | 200 | 351 | 353 | 2.95 | 3.08 | 50 | 87 | 500 | 500 | 2.278 | 2.990 | 530 | 540 | 0.109 | 1.291 |
| 152 | 203 | 314 | 389 | 1.17 | 2.43 | 14 | 48 | 321 | 335 | 1.630 | 3.420 | 331 | 331 | 0.340 | 1.220 |
| 169 | 300 | 459 | 925 | 2.50 | 2.92 | 47 | 75 | 400 | 550 | 0.750 | 1.360 | 500 | 508 | 0.079 | 0.160 |
| 120 | 120 | 260 | 260 | 2.11 | 2.88 | 20 | 31 | 396 | 452 | 1.920 | 2.890 | 314 | 387 | 0.200 | 0.421 |
| 152 | 152 | 254 | 272 | 3.36 | 7.20 | 13 | 37 | 618 | 618 | 1.460 | 4.160 | 269 | 279 | 0.140 | 0.830 |
| 178 | 178 | 267 | 267 | 3.62 | 3.62 | 20 | 63 | 434 | 434 | 2.500 | 3.300 | 379 | 379 | 0.170 | 0.170 |
| 150 | 150 | 285 | 285 | 1.73 | 1.73 | 51 | 74 | 953 | 953 | 3.060 | 3.060 | 297 | 902 | 0.498 | 1.710 |
| 200 | 200 | 303 | 303 | 3.30 | 3.30 | 42 | 42 | 0 | 0 | 2.990 | 2.990 | 0 | 0 | 0.630 | 1.150 |
| 120 | 130 | 500 | 624 | 1.25 | 2.00 | 24 | 80 | 413 | 440 | 1.290 | 2.417 | 413 | 590 | 0.120 | 1.514 |
| 180 | 180 | 360 | 360 | 1.18 | 2.35 | 28 | 32 | 343 | 368 | 3.210 | 3.210 | 250 | 1392 | 0.190 | 1.130 |
| 195 | 201 | 302 | 312 | 3.21 | 3.31 | 38 | 45 | 621 | 621 | 2.860 | 2.990 | 571 | 571 | 0.110 | 0.210 |
| 80 | 80 | 380 | 380 | 3.95 | 3.95 | 32 | 32 | 491 | 491 | 3.348 | 3.348 | 491 | 491 | 0.707 | 0.707 |
| 178 | 178 | 299 | 310 | 2.95 | 3.06 | 14 | 38 | 576 | 602 | 1.410 | 4.531 | 341 | 529 | 0.243 | 1.603 |
| 178 | 178 | 381 | 381 | 2.50 | 4.25 | 13 | 32 | 515 | 515 | 3.810 | 3.810 | 343 | 454 | 0.187 | 1.260 |
| 120 | 120 | 350 | 350 | 3.46 | 3.46 | 17 | 29 | 400 | 655 | 2.992 | 2.992 | 320 | 480 | 0.377 | 0.670 |
| 180 | 180 | 450 | 450 | 3.33 | 3.33 | 68 | 68 | 532 | 532 | 3.636 | 3.636 | 514 | 514 | 0.559 | 0.559 |
| 80 | 80 | 470 | 470 | 3.09 | 3.19 | 27 | 27 | 500 | 500 | 9.525 | 9.525 | 550 | 550 | 0.707 | 0.707 |
| 152 | 305 | 419 | 419 | 2.76 | 2.76 | 43 | 43 | 445 | 445 | 1.820 | 1.820 | 283 | 303 | 0.212 | 0.341 |
| 305 | 305 | 539 | 539 | 3.10 | 3.10 | 36 | 72 | 525 | 525 | 2.490 | 2.490 | 479 | 479 | 0.079 | 0.159 |
| 200 | 200 | 360 | 360 | 2.42 | 2.42 | 37 | 37 | 216 | 886 | 3.150 | 3.150 | 931 | 931 | 0.410 | 0.410 |
| 155 | 155 | 719 | 719 | 2.68 | 2.68 | 28 | 29 | 468 | 468 | 2.866 | 2.866 | 605 | 605 | 0.324 | 0.432 |
| 220 | 220 | 244 | 264 | 2.00 | 4.00 | 42 | 42 | 402 | 436 | 2.670 | 3.600 | 358 | 358 | 0.215 | 0.323 |
| 180 | 180 | 360 | 360 | 1.76 | 1.76 | 21 | 56 | 798 | 798 | 3.160 | 3.160 | 1333 | 1431 | 0.150 | 1.000 |
| 250 | 250 | 198 | 542 | 1.75 | 3.30 | 64 | 89 | 433 | 452 | 1.659 | 4.468 | 569 | 632 | 0.101 | 0.262 |
| 254 | 254 | 456 | 456 | 3.87 | 3.87 | 13 | 40 | 271 | 406 | 2.228 | 2.228 | 237 | 372 | 0.109 | 0.244 |
| 360 | 360 | 345 | 345 | 2.18 | 2.62 | 29 | 78 | 396 | 433 | 2.010 | 2.010 | 600 | 600 | 0.094 | 0.189 |
| 200 | 540 | 252 | 1383 | 2.50 | 4.00 | 25 | 85 | 525 | 1068 | 1.440 | 6.920 | 334 | 750 | 0.150 | 3.017 |
| 50 | 160 | 300 | 375 | 3.00 | 3.50 | 14 | 24 | 390 | 420 | 2.793 | 8.378 | 314 | 441 | 0.313 | 1.251 |
| 120 | 120 | 940 | 940 | 4.04 | 4.04 | 23 | 58 | 450 | 500 | 8.021 | 12.533 | 480 | 480 | 0.838 | 1.257 |
| 120 | 120 | 540 | 540 | 2.78 | 2.78 | 23 | 24 | 616 | 623 | 3.879 | 3.879 | 647 | 674 | 0.524 | 0.524 |
| 86 | 86 | 398 | 398 | 2.89 | 2.89 | 38 | 38 | 400 | 400 | 1.036 | 1.036 | 645 | 645 | 0.230 | 0.230 |
| 200 | 200 | 336 | 336 | 1.79 | 1.79 | 23 | 66 | 683 | 1028 | 2.880 | 2.880 | 679 | 1028 | 0.190 | 1.180 |
| 150 | 150 | 315 | 315 | 2.00 | 3.00 | 29 | 34 | 361 | 387 | 2.080 | 2.610 | 355 | 355 | 0.235 | 0.471 |
| 76 | 102 | 216 | 305 | 1.18 | 1.50 | 16 | 23 | 280 | 431 | 1.730 | 1.940 | 280 | 437 | 0.180 | 2.450 |
| 140 | 203 | 235 | 419 | 2.77 | 3.60 | 21 | 57 | 400 | 400 | 0.680 | 3.030 | 243 | 426 | 0.040 | 0.340 |
| 150 | 150 | 279 | 279 | 3.50 | 3.50 | 38 | 38 | 641 | 641 | 1.891 | 1.891 | 310 | 310 | 0.212 | 0.212 |
| 140 | 140 | 464 | 495 | 1.64 | 1.75 | 23 | 33 | 329 | 329 | 3.990 | 3.990 | 316 | 378 | 0.274 | 0.274 |
| 150 | 150 | 298 | 298 | 3.16 | 3.16 | 22 | 83 | 448 | 448 | 3.360 | 3.360 | 266 | 303 | 0.124 | 0.380 |
| 85 | 85 | 126 | 130 | 2.50 | 3.10 | 31 | 50 | 530 | 530 | 2.000 | 5.720 | 600 | 600 | 0.170 | 1.188 |
| 200 | 200 | 360 | 360 | 2.42 | 2.42 | 20 | 33 | 854 | 854 | 2.880 | 2.880 | 801 | 870 | 0.400 | 0.890 |
| 150 | 150 | 310 | 310 | 3.00 | 5.00 | 58 | 82 | 425 | 450 | 2.590 | 4.432 | 255 | 255 | 0.139 | 0.279 |
| 110 | 110 | 298 | 298 | 3.52 | 3.52 | 28 | 31 | 442 | 447 | 3.834 | 3.834 | 273 | 273 | 0.609 | 0.609 |
| 280 | 280 | 273 | 273 | 3.11 | 3.11 | 29 | 33 | 478 | 478 | 2.700 | 2.700 | 456 | 587 | 0.051 | 0.287 |
| 120 | 175 | 278 | 322 | 3.24 | 3.57 | 36 | 41 | 977 | 990 | 1.070 | 3.014 | 323 | 366 | 0.215 | 0.838 |
| 152 | 152 | 254 | 272 | 3.36 | 5.05 | 26 | 34 | 618 | 618 | 1.460 | 4.160 | 269 | 279 | 0.140 | 0.830 |
| 64 | 152 | 254 | 267 | 3.33 | 7.10 | 11 | 50 | 630 | 630 | 4.166 | 9.413 | 270 | 704 | 0.402 | 2.153 |
| 250 | 450 | 430 | 548 | 3.00 | 3.00 | 20 | 22 | 469 | 746 | 1.361 | 3.951 | 557 | 560 | 0.336 | 0.760 |
| 77 | 77 | 589 | 590 | 4.27 | 4.27 | 58 | 58 | 514 | 515 | 13.554 | 15.613 | 515 | 549 | 1.195 | 1.678 |
| 152 | 152 | 305 | 305 | 2.46 | 3.92 | 19 | 29 | 318 | 414 | 1.600 | 2.660 | 318 | 354 | 0.384 | 1.132 |
| 457 | 457 | 762 | 762 | 2.91 | 2.91 | 70 | 123 | 431 | 472 | 1.877 | 2.892 | 445 | 445 | 0.158 | 0.234 |
| 356 | 457 | 559 | 762 | 2.50 | 3.00 | 72 | 125 | 431 | 483 | 1.649 | 6.971 | 407 | 458 | 0.082 | 1.771 |
| 200 | 200 | 260 | 260 | 3.37 | 3.37 | 46 | 48 | 550 | 550 | 3.552 | 3.552 | 550 | 680 | 0.140 | 0.559 |
| 180 | 180 | 232 | 235 | 2.50 | 4.00 | 39 | 80 | 495 | 543 | 2.229 | 3.505 | 820 | 820 | 0.093 | 0.186 |
| 125 | 125 | 215 | 215 | 2.45 | 2.45 | 50 | 71 | 410 | 410 | 3.771 | 3.771 | 366 | 366 | 0.589 | 0.589 |
| 150 | 150 | 260 | 260 | 1.73 | 1.73 | 56 | 64 | 974 | 974 | 3.060 | 3.060 | 233 | 929 | 0.310 | 0.840 |
| 110 | 110 | 298 | 298 | 3.52 | 3.52 | 23 | 32 | 420 | 457 | 3.834 | 3.834 | 349 | 397 | 0.305 | 0.343 |
| 90 | 90 | 647 | 662 | 2.50 | 2.56 | 85 | 87 | 560 | 600 | 6.136 | 11.686 | 600 | 630 | 0.677 | 3.867 |
| 76 | 76 | 95 | 132 | 3.00 | 5.00 | 26 | 29 | 400 | 400 | 1.970 | 3.950 | 179 | 283 | 0.060 | 0.600 |
| 200 | 200 | 360 | 360 | 2.42 | 2.42 | 32 | 36 | 931 | 931 | 3.090 | 3.090 | 285 | 1235 | 0.193 | 1.208 |
| 102 | 200 | 305 | 535 | 1.12 | 2.38 | 16 | 72 | 431 | 538 | 0.884 | 5.800 | 353 | 570 | 0.150 | 0.770 |
| 110 | 110 | 398 | 463 | 2.70 | 3.14 | 43 | 74 | 499 | 538 | 1.230 | 5.800 | 353 | 385 | 0.476 | 0.476 |
| 300 | 300 | 400 | 400 | 2.50 | 2.50 | 18 | 18 | 750 | 750 | 2.202 | 2.202 | 388 | 388 | 0.524 | 0.524 |
| 114 | 114 | 257 | 257 | 3.56 | 4.44 | 17 | 17 | 441 | 441 | 3.367 | 3.367 | 290 | 438 | 0.326 | 0.616 |
| 229 | 457 | 425 | 851 | 3.00 | 3.00 | 36 | 43 | 482 | 551 | 0.995 | 1.048 | 482 | 482 | 0.084 | 0.334 |
| 127 | 127 | 198 | 203 | 2.74 | 3.00 | 41 | 109 | 421 | 421 | 3.200 | 4.540 | 324 | 324 | 0.490 | 0.813 |
| 120 | 120 | 255 | 255 | 1.90 | 1.90 | 139 | 139 | 960 | 960 | 3.900 | 3.900 | 1451 | 1451 | 0.327 | 1.230 |
| 375 | 375 | 655 | 655 | 3.23 | 3.23 | 34 | 85 | 400 | 400 | 2.859 | 5.360 | 430 | 430 | 0.116 | 0.443 |
| 375 | 375 | 655 | 655 | 3.23 | 3.23 | 36 | 87 | 400 | 400 | 2.800 | 2.800 | 430 | 430 | 0.081 | 0.116 |
| j | i | Output | ||||||||
|---|---|---|---|---|---|---|---|---|---|---|
| 1 | 2 | 3 | 4 | 5 | 6 | 7 | 8 | bias | ||
| 1 | 0.883 | 0.914 | 0.313 | 1.607 | 0.178 | 0.621 | −0.073 | 0.522 | 3.997 | −1.822 |
| 2 | 0.531 | −1.326 | 0.500 | 0.394 | 0.179 | 0.705 | −0.655 | −0.470 | −0.309 | 1.415 |
| 3 | 0.014 | −0.012 | −0.002 | −0.008 | 0.005 | −0.002 | −0.005 | −0.009 | 0.238 | 0.000 |
| 4 | 0.251 | −0.418 | 0.445 | −0.053 | 0.173 | −0.355 | −0.339 | −0.763 | 0.613 | 0.662 |
| 5 | 1.265 | 0.510 | −0.813 | −0.408 | −0.618 | −0.256 | −0.879 | −0.123 | 2.491 | 1.316 |
| 6 | 0.704 | −0.883 | −0.408 | 0.040 | 0.202 | 0.255 | −0.739 | 0.534 | 0.483 | 1.164 |
| 7 | −0.461 | 1.209 | −0.478 | 0.264 | −0.343 | −0.285 | −0.390 | −0.002 | −0.078 | −1.125 |
| 8 | −0.521 | 0.286 | −0.237 | −0.446 | −0.107 | 0.154 | 1.806 | −0.376 | −0.861 | −1.547 |
| 9 | 0.290 | −0.800 | 0.317 | −0.210 | −0.593 | −0.330 | −0.608 | 1.051 | 1.486 | −1.464 |
| 10 | 0.037 | −0.031 | 0.000 | −0.019 | 0.013 | −0.014 | −0.020 | −0.030 | −0.132 | −0.045 |
| 11 | −0.422 | −0.388 | −0.758 | −0.339 | 0.423 | −0.701 | 0.867 | 0.019 | −1.216 | 1.199 |
| 12 | 0.619 | 1.115 | 0.956 | 0.684 | 0.250 | −0.512 | −0.578 | 0.929 | 1.423 | −1.528 |
| 13 | −0.202 | 1.907 | 0.154 | −0.286 | 0.580 | 0.062 | −0.141 | 0.918 | 2.382 | 1.526 |
| 14 | 0.547 | −0.307 | −0.184 | −0.928 | −0.124 | 0.953 | −0.150 | 0.715 | −0.090 | −1.305 |
| 15 | 0.038 | −0.032 | −0.003 | −0.022 | 0.015 | −0.013 | −0.020 | −0.031 | 0.019 | −0.046 |
| 16 | −0.758 | −0.485 | 0.404 | 0.649 | 0.383 | −0.904 | 0.663 | 0.137 | 1.521 | −1.076 |
| 17 | 0.975 | −0.333 | 0.976 | 0.367 | −0.296 | 1.242 | −0.266 | −1.200 | −2.243 | −1.790 |
| 18 | −1.311 | −0.589 | 0.204 | 0.083 | −0.066 | 1.398 | 0.034 | −1.143 | 0.949 | 1.428 |
| 19 | 0.884 | 1.140 | −0.917 | 0.854 | 0.394 | 0.278 | −0.255 | −0.645 | 5.764 | −1.979 |
| 20 | −0.752 | −0.504 | 1.024 | −0.774 | 0.146 | 0.603 | 0.803 | −0.432 | 0.888 | −1.613 |
| 21 | −0.918 | 0.293 | 0.283 | −1.272 | 0.054 | −0.223 | 1.097 | −0.855 | −0.904 | 1.456 |
| 22 | 1.136 | −1.124 | 1.079 | 0.652 | 0.472 | 0.173 | −0.425 | 0.846 | 3.122 | 1.633 |
| 23 | 0.096 | 0.363 | −0.064 | −0.951 | 0.438 | 1.017 | 0.966 | 0.365 | 0.032 | 1.416 |
| 24 | −0.025 | 0.029 | −0.007 | 0.022 | −0.014 | 0.010 | 0.030 | 0.034 | 0.019 | 0.078 |
| 25 | −0.002 | 0.003 | −0.001 | 0.001 | −0.002 | 0.004 | 0.005 | 0.004 | 0.132 | 0.026 |
| 26 | −0.566 | −0.087 | −0.370 | −0.607 | −0.318 | −0.934 | −0.039 | 0.801 | −0.768 | 1.212 |
| 27 | 0.781 | −0.652 | −0.024 | −0.626 | 1.108 | −0.166 | −0.839 | −0.085 | −0.078 | −1.271 |
| 28 | 0.834 | 0.768 | 0.418 | −0.501 | −0.780 | −1.140 | −0.006 | −0.105 | 0.299 | 0.989 |
| 29 | 0.021 | −0.018 | −0.001 | −0.011 | 0.008 | −0.007 | −0.011 | −0.016 | −0.082 | −0.018 |
| 30 | 0.198 | 0.430 | −0.105 | 0.456 | 0.008 | −0.089 | −0.335 | 0.319 | 1.603 | −0.615 |
| 31 | 1.160 | 1.592 | 0.005 | 0.368 | −0.360 | 0.211 | −0.107 | 0.439 | 1.745 | −1.415 |
| 32 | −0.019 | 0.012 | 0.003 | 0.004 | −0.011 | 0.008 | 0.008 | 0.014 | −0.876 | 0.041 |
| 33 | −0.177 | −0.783 | −0.363 | −0.949 | 1.007 | −0.008 | −0.300 | −0.531 | 0.311 | 1.032 |
| 34 | 0.158 | −0.330 | −0.183 | −0.571 | −0.671 | −0.172 | 0.860 | −0.750 | 0.733 | 0.862 |
| 35 | 0.137 | −0.318 | −0.680 | −0.447 | −0.280 | 0.219 | −0.940 | 1.172 | −0.011 | −1.274 |
| 36 | 0.030 | −0.026 | −0.003 | −0.017 | 0.019 | −0.004 | −0.016 | −0.027 | 0.158 | −0.032 |
| 37 | −1.383 | −0.991 | 0.008 | −0.030 | 0.633 | −0.188 | 0.742 | −1.473 | −1.733 | −1.543 |
| 38 | −0.295 | 0.057 | 0.607 | 1.244 | −0.767 | 0.176 | −0.155 | 0.481 | 0.404 | 1.442 |
| 39 | −0.889 | 0.882 | 0.698 | 0.329 | −0.137 | −0.317 | −0.028 | 0.065 | 2.247 | 1.291 |
| 40 | −1.493 | −0.451 | 1.451 | 0.272 | −0.602 | 0.491 | 0.682 | −0.587 | −1.118 | 1.507 |
| 41 | −0.002 | 0.004 | −0.002 | 0.001 | −0.002 | 0.005 | 0.005 | 0.005 | 0.444 | 0.030 |
| 42 | 0.776 | −0.199 | −0.120 | 0.437 | −0.147 | −0.646 | 0.331 | −1.160 | 0.096 | −1.042 |
| 43 | 1.282 | −0.381 | 0.017 | −0.577 | 0.037 | −0.592 | −0.578 | 1.538 | −0.151 | 1.532 |
References
- Sanad, A.; Saka, M.P. Prediction of Ultimate Shear Strength of Reinforced-Concrete Deep Beams Using Neural Networks. J. Struct. Eng. 2001, 127, 818–828. [Google Scholar] [CrossRef]
- Adhikary, B.B.; Mutsuyoshi, H. Artificial neural networks for the prediction of shear capacity of steel plate strengthened RC beams. Constr. Build. Mater. 2004, 18, 409–417. [Google Scholar] [CrossRef]
- Sucharda, O.; Mateckova, P.; Bilek, V. Non-Linear Analysis of an RC Beam Without Shear Reinforcement with a Sensitivity Study of the Material Properties of Concrete. Slovak J. Civ. Eng. 2020, 28, 33–43. [Google Scholar] [CrossRef]
- Cladera, A.; Marí, A.R. Shear design procedure for reinforced normal and high-strength concrete beams using artificial neural networks. Part II: Beams with stirrups. Eng. Struct. 2004, 26, 927–936. [Google Scholar] [CrossRef]
- Cladera, A.; Marí, A.R. Shear design procedure for reinforced normal and high-strength concrete beams using artificial neural networks. Part I: Beams without stirrups. Eng. Struct. 2004, 26, 917–926. [Google Scholar] [CrossRef]
- Mansour, M.Y.; Dicleli, M.; Lee, J.Y.; Zhang, J. Predicting the shear strength of reinforced concrete beams using artificial neural networks. Eng. Struct. 2004, 26, 781–799. [Google Scholar] [CrossRef]
- Oreta, A.W.C. Simulating size effect on shear strength of RC beams without stirrups using neural networks. Eng. Struct. 2004, 26, 681–691. [Google Scholar] [CrossRef]
- Lehmann, M.; Głodkowska, W. Shear Capacity and Behaviour of Bending Reinforced Concrete Beams Made of Steel Fibre-Reinforced Waste Sand Concrete. Materials 2021, 14, 2996. [Google Scholar] [CrossRef]
- Wang, H.; Xian, G. Shear Capacity of RC Beams Strengthened with Flax Fiber Sheets Grafted with Nano-TiO2. Materials 2020, 13, 1430. [Google Scholar] [CrossRef] [Green Version]
- Adhikary, B.B.; Mutsuyoshi, H. Prediction of shear strength of steel fiber RC beams using neural networks. Constr. Build. Mater. 2006, 20, 801–811. [Google Scholar] [CrossRef]
- Abdalla, J.A.; Elsanosi, A.; Abdelwahab, A. Modeling and simulation of shear resistance of R/C beams using artificial neural network. J. Frankl. Inst. 2007, 344, 741–756. [Google Scholar] [CrossRef]
- Yang, K.H.; Ashour, A.F.; Song, J.K. Shear capacity of reinforced concrete beams using neural network. KCI Concr. J. 2007, 1, 63–73. [Google Scholar]
- Perera, R.; Barchín, M.; Arteaga, A.; de Diego, A. Prediction of the ultimate strength of reinforced concrete beams FRP-strengthened in shear using neural networks. Compos. Part B Eng. 2010, 41, 287–298. [Google Scholar] [CrossRef]
- Tanarslan, H.M.; Secer, M.; Kumanlioglu, A. An approach for estimating the capacity of RC beams strengthened in shear with FRP reinforcements using artificial neural networks. Constr. Build. Mater. 2012, 30, 556–568. [Google Scholar] [CrossRef]
- Lynberg, B.S. Ultimate shear resistance of partially prestressed reinforced concrete I-beams. Int. J. Rock Mech. Min. Sci. Geomech. Abstr. 1976, 13, A112. [Google Scholar] [CrossRef]
- Johnson, M.K.; Ramirez, J.A. Minimum shear reinforcement in beams with higher strength concrete. Struct. J. 1989, 86, 376–382. [Google Scholar]
- Roller, J.J.; Russel, H.G. Shear strength of high-strength concrete beams with web reinforcement. Struct. J. 1990, 87, 191–198. [Google Scholar]
- Sarsam, K.F.; Al-Musawi, J.M. Shear design of high-and normal strength concrete beams with web reinforcement. Struct. J. 1992, 89, 658–664. [Google Scholar]
- Ahamad, S.H.; Xie, Y.; Yu, T. Shear strength of reinforced lightweight concrete beams of normal and high strength concrete. Mag. Concr. Res. 1994, 46, 57–66. [Google Scholar] [CrossRef]
- Adebar, P.; Collins, M.P. Shear strength of members without transverse reinforcement. Can. J. Civ. Eng. 1996, 23, 30–41. [Google Scholar] [CrossRef]
- Yoon, Y.S.; Cook, W.D.; Mitchell, D. Minimum shear reinforcement in normal, medium, and high-strength concrete beams. ACI Struct. J. 1996, 93, 576–584. [Google Scholar]
- Tan, K.H.; Teng, S.; Kong, F.K.; Lu, H.Y. Main tension steel in high strength concrete deep and short beams. Struct. J. 1997, 94, 752–768. [Google Scholar]
- Kong, P.Y. Shear Strength of High Performance Concrete Beams. Ph.D. Thesis, Curtin University, Bently, Australia, 1996. [Google Scholar]
- Angelakos, D. The Influence of Concrete Strength and Longitudinal Reinforcement Ratio on the Shear Strength of Large-Size Reinforced Concrete Beams with, and without, Transverse Reinforcement. Ph.D. Thesis, University of Toronto, Toronto, ON, Canada, 1999. [Google Scholar]
- Ozcebe, G.; Ersoy, U.; Tankut, T. Evaluation of minimum shear reinforcement requirements for higher strength concrete. Struct. J. 1999, 96, 361–368. [Google Scholar]
- Collins, M.P.; Kuchma, D. How safe are our large, lightly reinforced concrete beams, slabs, and footings? Struct. J. 1999, 96, 482–490. [Google Scholar]
- Fonteboa, B.G. Hormigones con áRidos Reciclados Procedentes de Demoliciones: Dosificaciones, Propiedades Mecánicas y Comportamiento Estructural a Cortante, 1st ed.; Universidade da Coruña: Coruña, Spain, 2002. [Google Scholar]
- Bohigas, A.C. Shear Design of Reinforced High-Strength Concrete Beams; Universitat Politècnica de Catalunya: Barcelona, Spain, 2003. [Google Scholar]
- Yang, K.-H.; Ashour, A.F. Code modelling of reinforced-concrete deep beams. Mag. Concr. Res. 2008, 60, 441–454. [Google Scholar] [CrossRef]
- Lee, J.-Y. Evaluation of Maximum Shear Reinforcement Ratio of Reinforced Concrete Beams based on Truss Model. J. Korea Concr. Inst. 2018, 30, 217–227. [Google Scholar] [CrossRef]
- ACI Committee. Building Code Requirements for Structural Concrete (ACI 318-19) And Commentary (ACI 318r-19); American Concrete Institute: Farmington Hills, MI, USA, 2019. [Google Scholar]
- EC2. Eurocode 2: Design of Concrete Structures: Part 1-1: General Rules and Rules for Buildings; British Standards Institution: London, UK, 2004. [Google Scholar]
- Lee, J.-Y.; Kim, J. Simplified Equation Based on Compatibility-Aided Truss Model for Shear Strength of Reinforced Concrete Beams. ACI Struct. J. 2016, 113, 6. [Google Scholar] [CrossRef]
- Balas, C.E.; Koç, M.L.; Tur, R. Artificial neural networks based on principal component analysis, fuzzy systems and fuzzy neural networks for preliminary design of rubble mound breakwaters. Appl. Ocean Res. 2010, 32, 425–433. [Google Scholar] [CrossRef]
- Bishop, C.M. Neural networks and their applications. Rev. Sci. Instrum. 1994, 65, 1803–1832. [Google Scholar] [CrossRef] [Green Version]
- Boukhatem, B.; Kenai, S.; Hamou, A.; Ziou, D.; Ghrici, M. Predicting concrete properties using neural networks (NN) with principal component analysis (PCA) technique. Comput. Concr. 2012, 10, 557–573. [Google Scholar] [CrossRef] [Green Version]


| Features | PC1 | PC2 | PC3 | PC4 | PC5 | PC6 | PC7 | PC8 |
|---|---|---|---|---|---|---|---|---|
| (mm) | −0.097 | −0.634 | 0.216 | −0.019 | 0.097 | 0.264 | 0.648 | −0.207 |
| (mm) | −0.019 | −0.493 | 0.270 | 0.485 | 0.380 | −0.156 | −0.506 | 0.152 |
| 0.037 | 0.031 | 0.656 | −0.591 | 0.077 | −0.141 | −0.015 | 0.438 | |
| (MPa) | 0.272 | −0.277 | 0.184 | 0.113 | −0.855 | 0.161 | −0.204 | 0.068 |
| (MPa) | 0.446 | −0.248 | −0.232 | −0.501 | 0.247 | 0.371 | −0.393 | −0.286 |
| (%) | 0.540 | 0.195 | 0.376 | 0.148 | 0.055 | −0.414 | 0.132 | −0.561 |
| (MPa) | 0.328 | −0.357 | −0.470 | −0.139 | −0.038 | −0.607 | 0.211 | 0.333 |
| (%) | 0.563 | 0.223 | 0.010 | 0.333 | 0.211 | 0.428 | 0.256 | 0.479 |
| Error Measures | ACI 318-19 | EC2-04 | Lee and Kim | ANN without PCA | ANN with PCA |
|---|---|---|---|---|---|
| Correlation Coefficient | 0.9324 | 0.9039 | 0.9388 | 0.9675 | 0.9977 |
| Root Mean Square Error | 120.1279 | 138.9059 | 108.9430 | 76.8855 | 20.6553 |
| Relative Absolute Error | 41.7351 | 46.5203 | 34.1850 | 16.9734 | 7.4831 |
| Root Relative Square Error | 39.6231 | 45.8169 | 35.9339 | 25.3216 | 6.8130 |
| Specimen | Section | Concrete | Longitudinal Bar | Transverse Bar | Test | ||||
|---|---|---|---|---|---|---|---|---|---|
| a/d | |||||||||
| (mm) | (mm) | - | (MPa) | (MPa) | (%) | (MPa) | (%) | (kN) | |
| 1 | 350 | 359 | 2.5 | 43 | 687 | 4.03 | 451 | 0.66 | 649 |
| 2 | 350 | 359 | 2.5 | 43 | 687 | 4.03 | 656 | 0.66 | 698 |
| 3 | 350 | 359 | 2.5 | 43 | 687 | 4.03 | 656 | 0.44 | 579 |
| 4 | 350 | 359 | 2.5 | 43 | 687 | 4.03 | 451 | 0.91 | 705 |
| 5 | 350 | 359 | 2.5 | 43 | 687 | 4.03 | 451 | 0.45 | 572 |
| 6 | 350 | 359 | 2.5 | 43 | 687 | 4.03 | 656 | 0.45 | 589 |
| 7 | 350 | 359 | 2.5 | 43 | 687 | 4.03 | 532 | 0.66 | 609 |
| 8 | 350 | 359 | 2.5 | 43 | 687 | 4.03 | 532 | 0.58 | 652 |
Publisher’s Note: MDPI stays neutral with regard to jurisdictional claims in published maps and institutional affiliations. |
© 2021 by the authors. Licensee MDPI, Basel, Switzerland. This article is an open access article distributed under the terms and conditions of the Creative Commons Attribution (CC BY) license (https://creativecommons.org/licenses/by/4.0/).
Share and Cite
Koo, S.; Shin, D.; Kim, C. Application of Principal Component Analysis Approach to Predict Shear Strength of Reinforced Concrete Beams with Stirrups. Materials 2021, 14, 3471. https://doi.org/10.3390/ma14133471
Koo S, Shin D, Kim C. Application of Principal Component Analysis Approach to Predict Shear Strength of Reinforced Concrete Beams with Stirrups. Materials. 2021; 14(13):3471. https://doi.org/10.3390/ma14133471
Chicago/Turabian StyleKoo, Seungbum, Dongik Shin, and Changhyuk Kim. 2021. "Application of Principal Component Analysis Approach to Predict Shear Strength of Reinforced Concrete Beams with Stirrups" Materials 14, no. 13: 3471. https://doi.org/10.3390/ma14133471
APA StyleKoo, S., Shin, D., & Kim, C. (2021). Application of Principal Component Analysis Approach to Predict Shear Strength of Reinforced Concrete Beams with Stirrups. Materials, 14(13), 3471. https://doi.org/10.3390/ma14133471