
Investigation into the Effect of RFSSW Parameters on Tensile Shear Fracture Load of 7075-T6 Alclad Aluminium Alloy Joints

 ,
,  ,
,  and
and
Abstract
:1. Introduction
2. Materials and Methods
2.1. Material
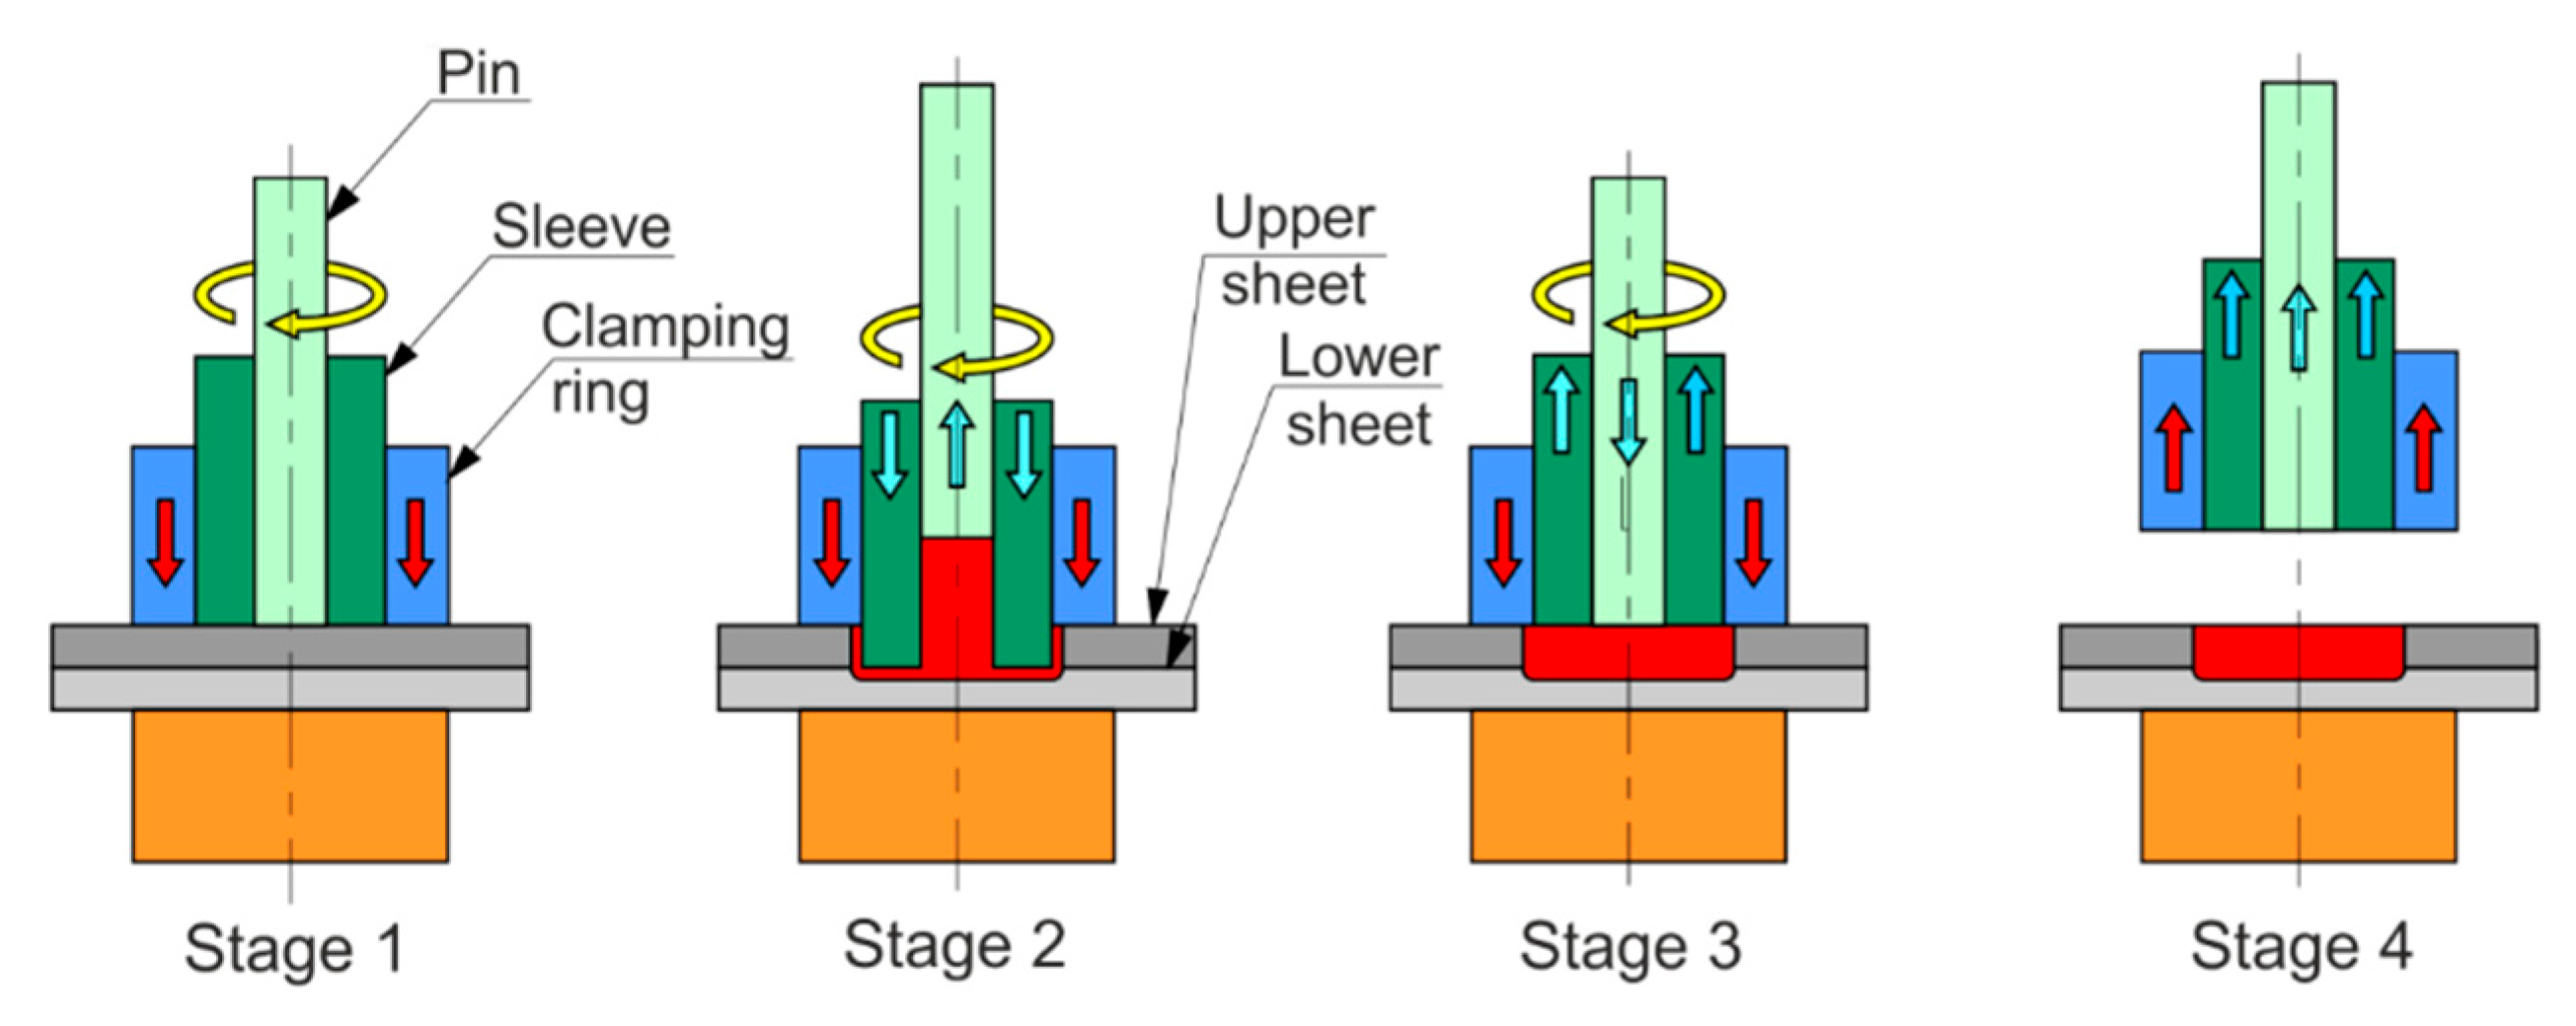
2.2. Refill Friction Stir Spot Welding
- Both the sleeve and the pin start to rotate and rub on the sheet for a while to heat the material;
- The sleeve and pin move downward and upward, respectively, and therefore the plasticised material displaced by the sleeve is squeezed into the cylindrical cavity created by the upward movement of the pin;
- Both the sleeve’s and the pin’s directions of movement begin to reverse, and the plasticised material in the cylindrical cavity is squeezed back by the sleeve;
- The welding head is retracted from the working area.
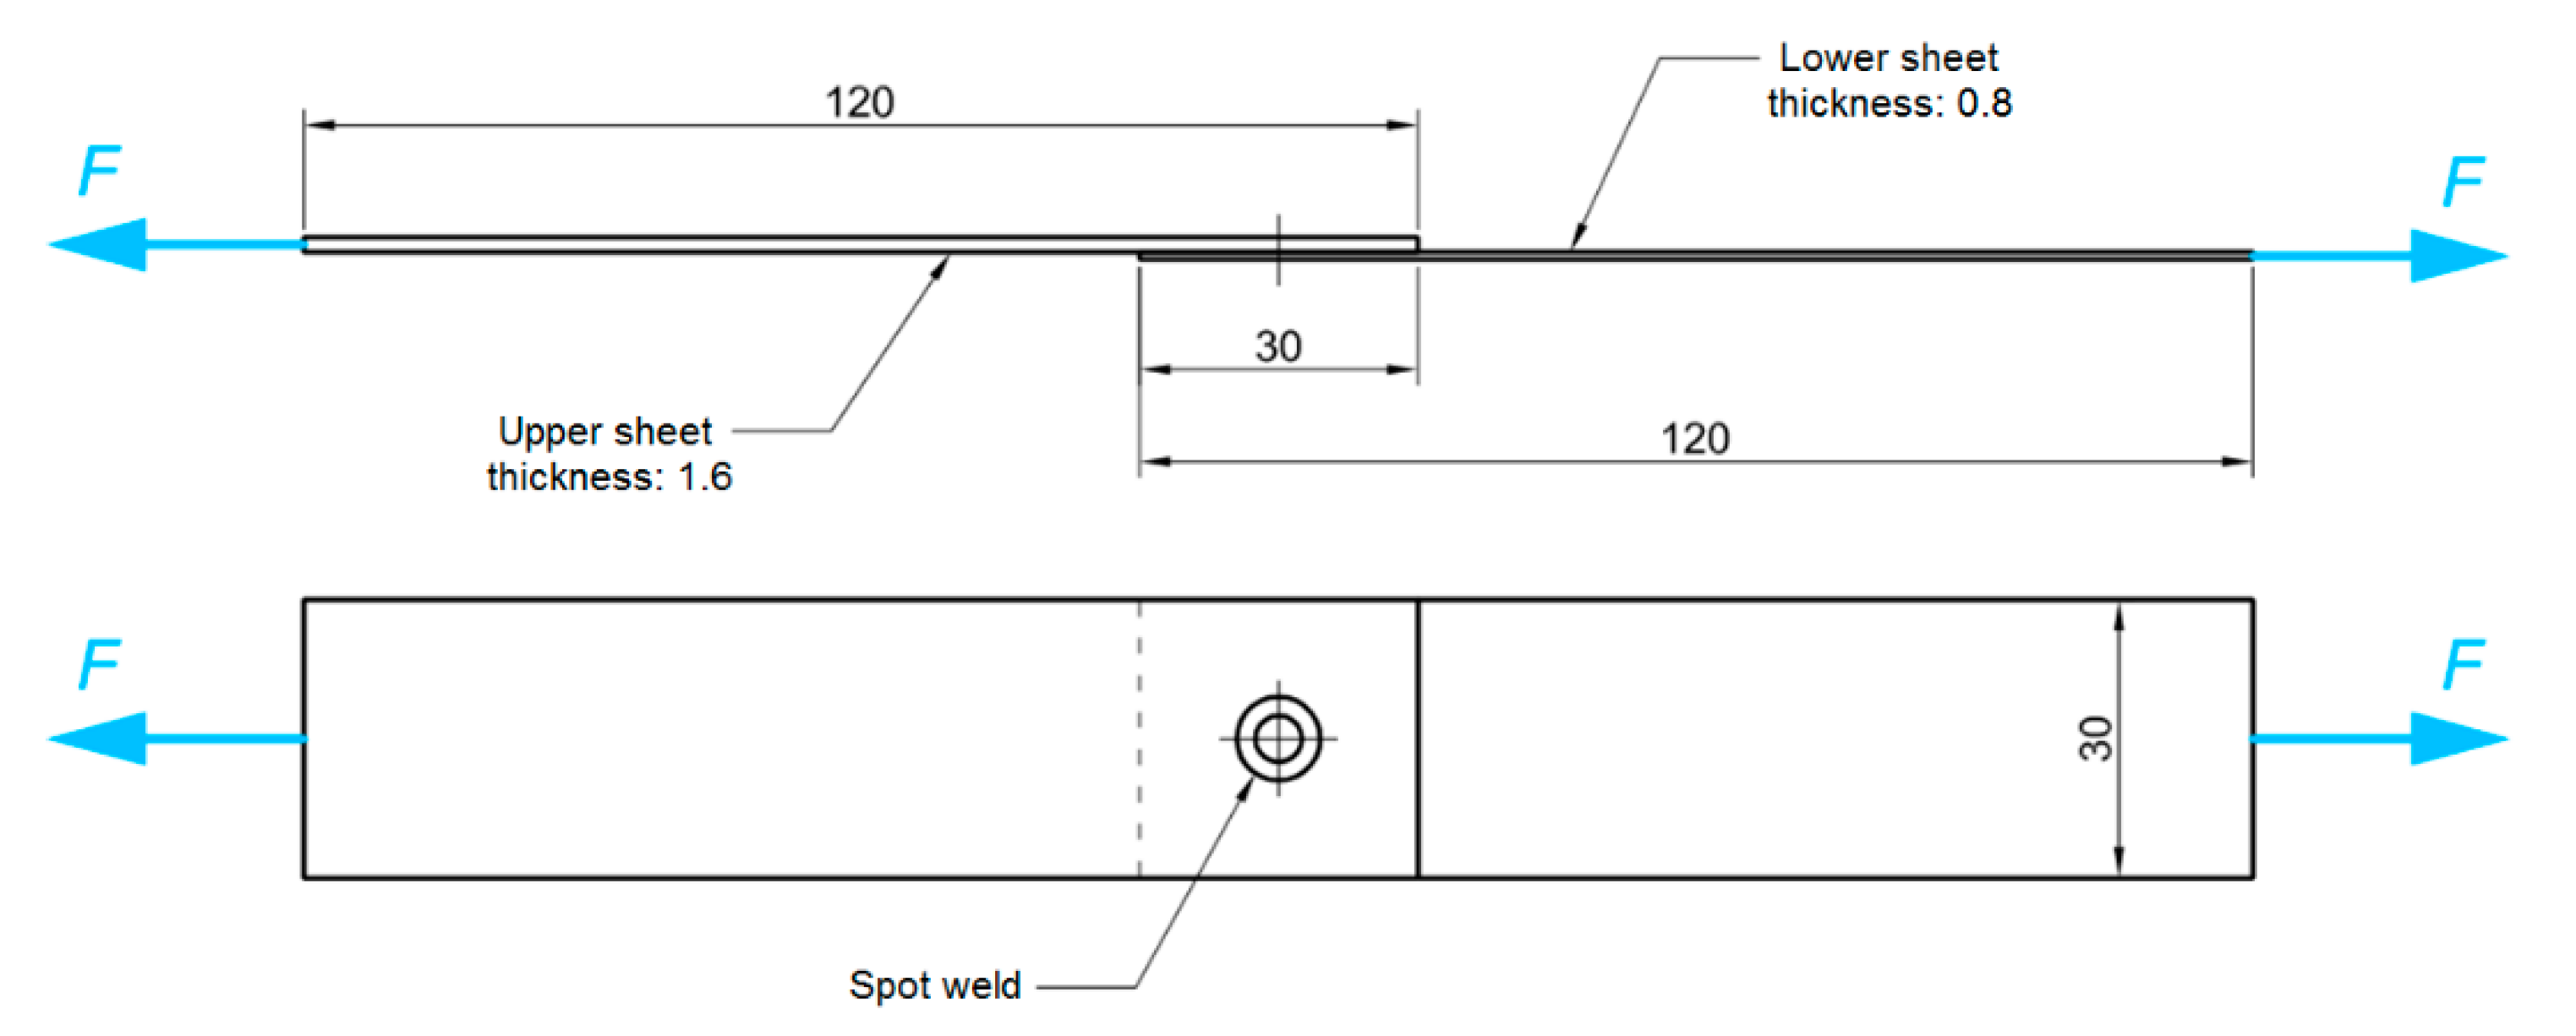
2.3. Tensile Shear Test
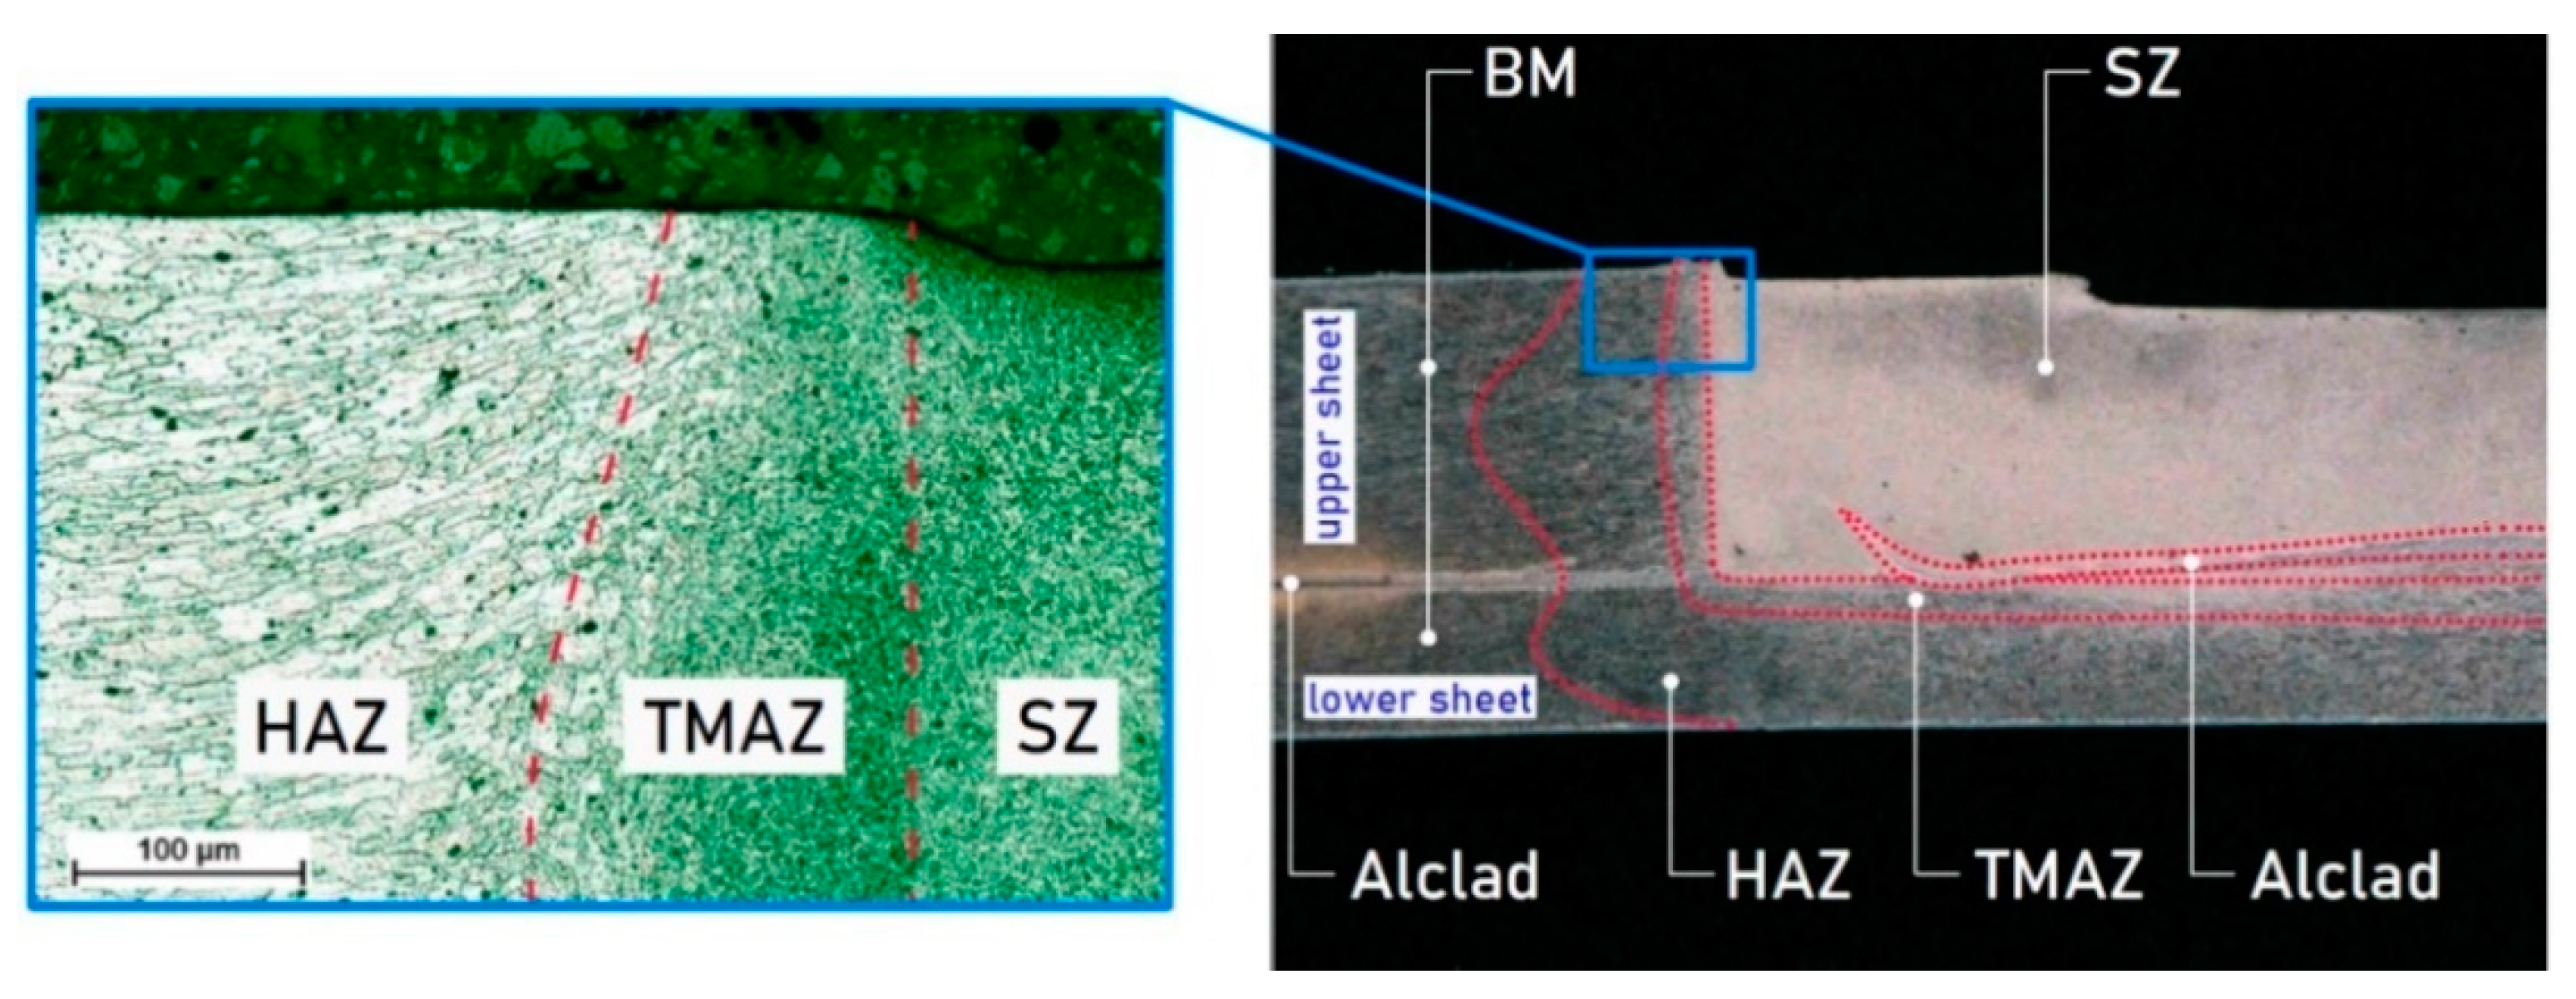
2.4. Microstructural Analysis
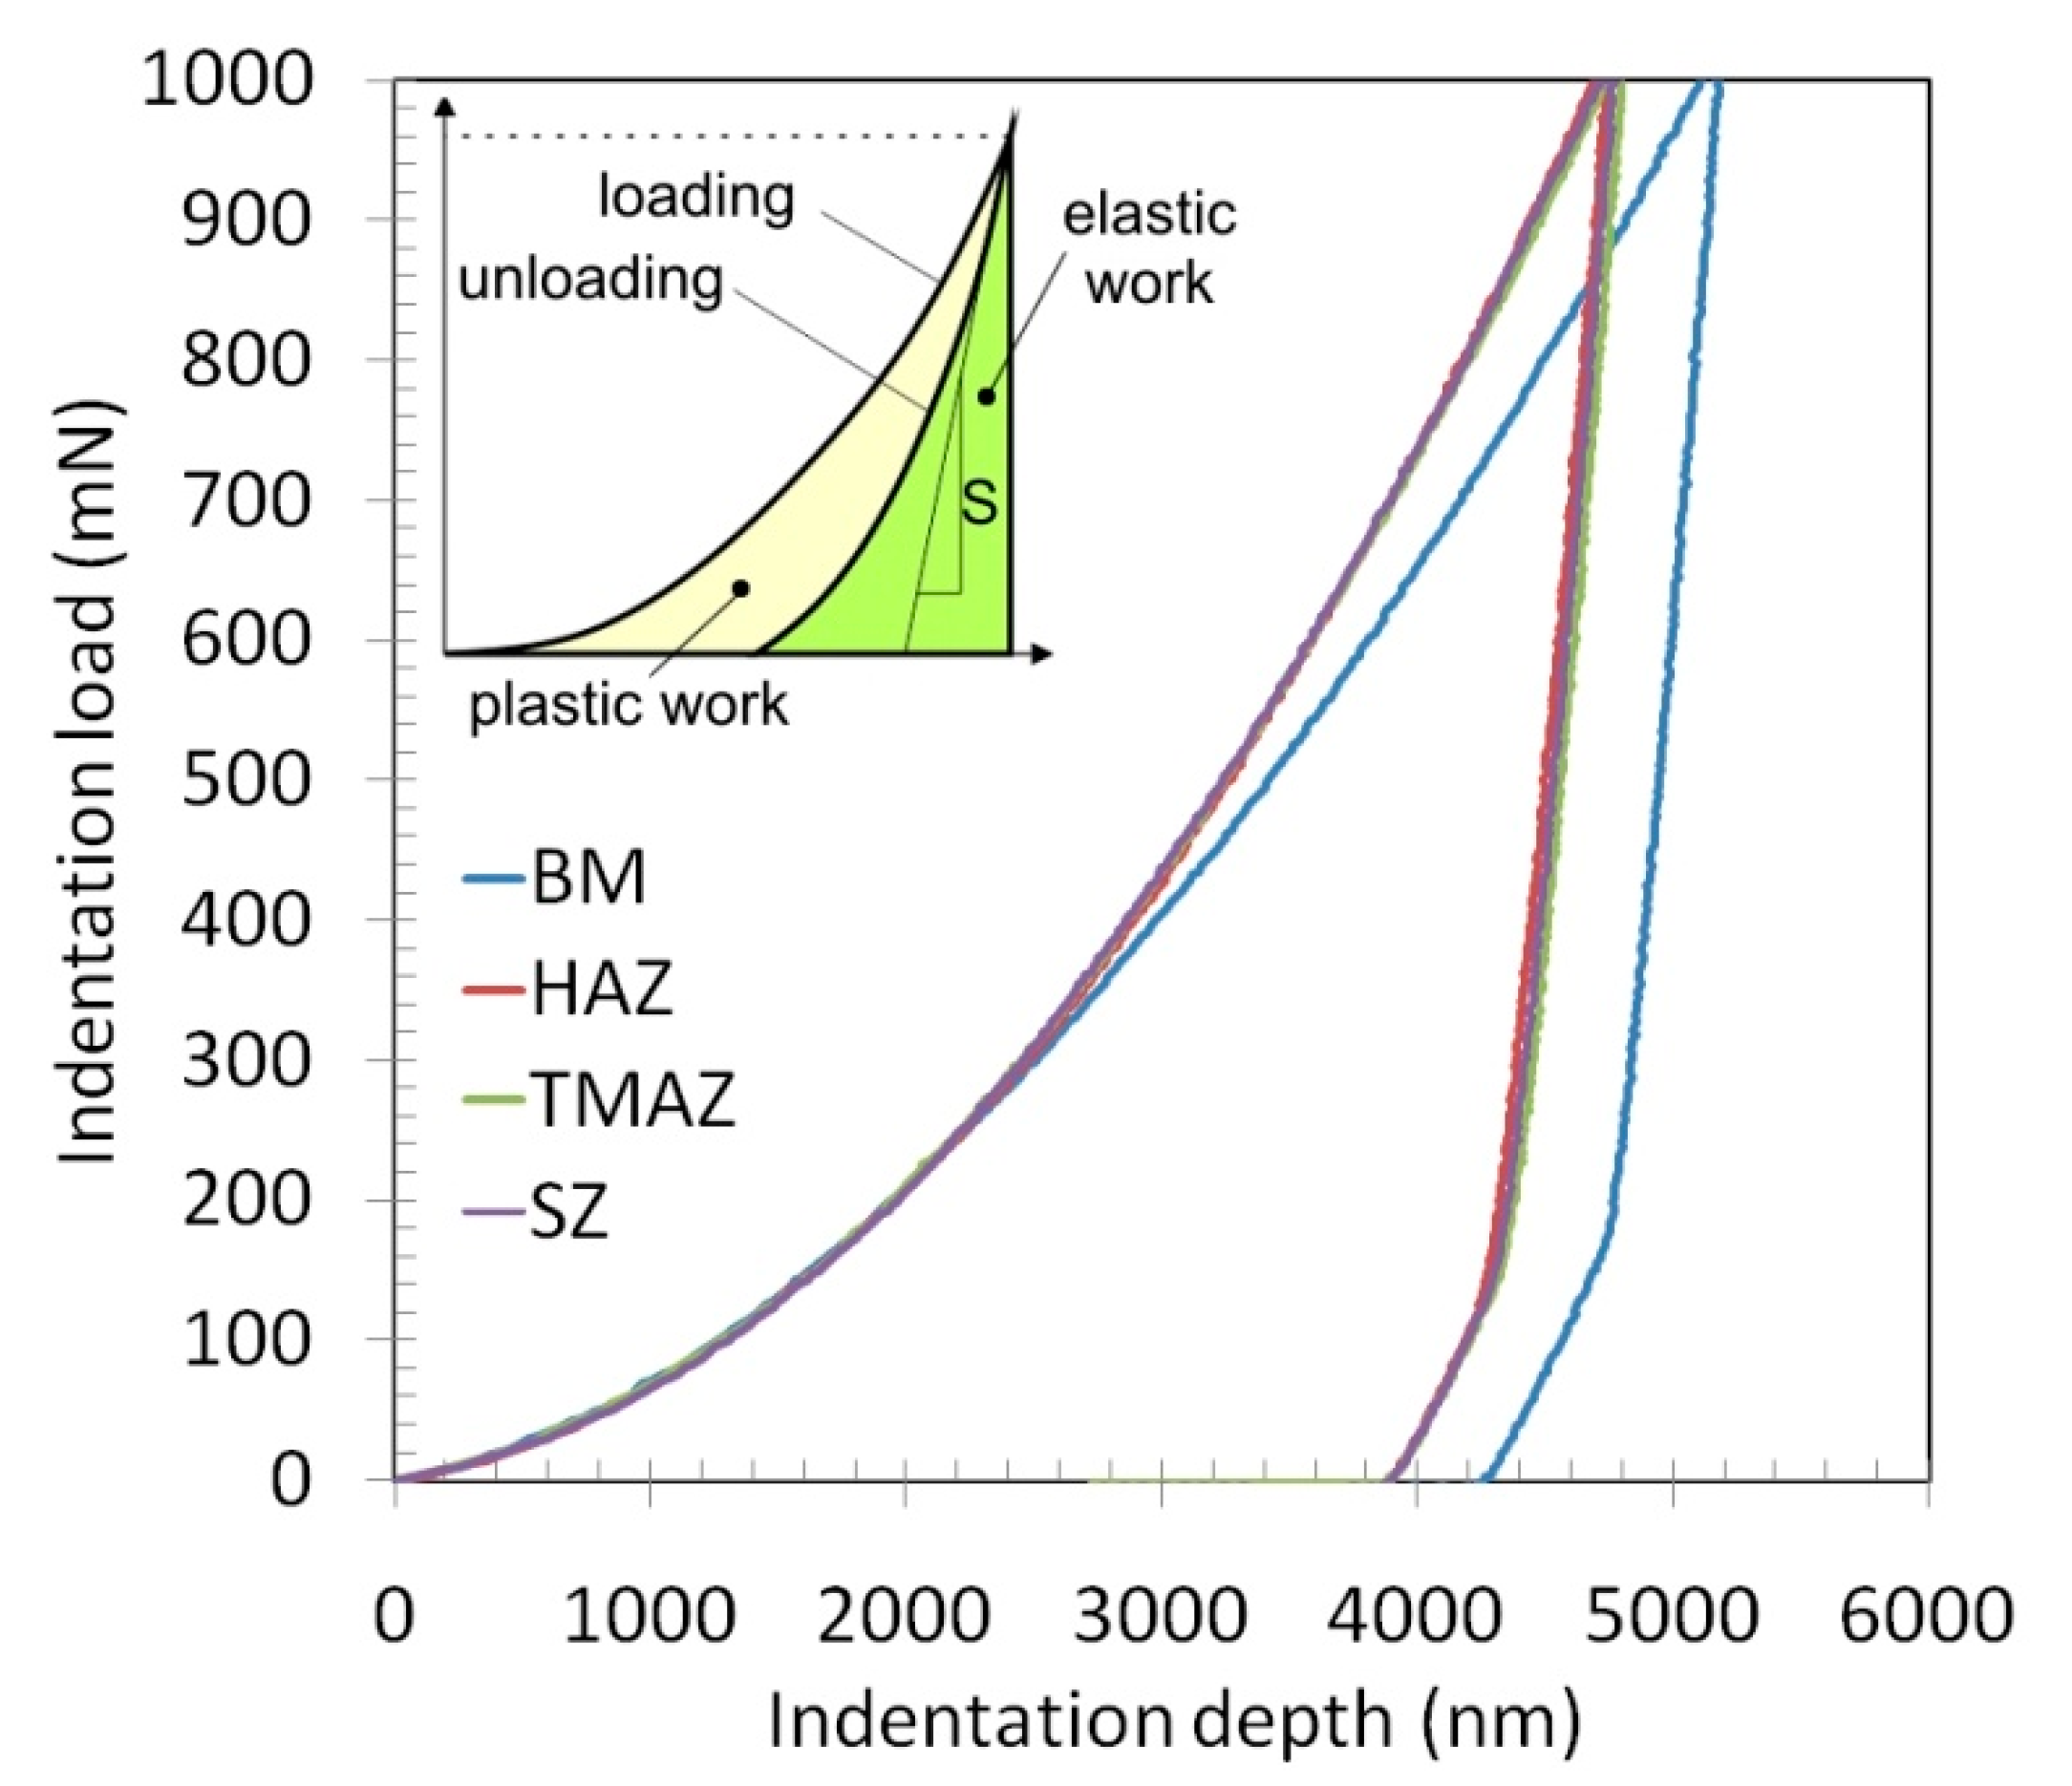
2.5. Microhardness Testing
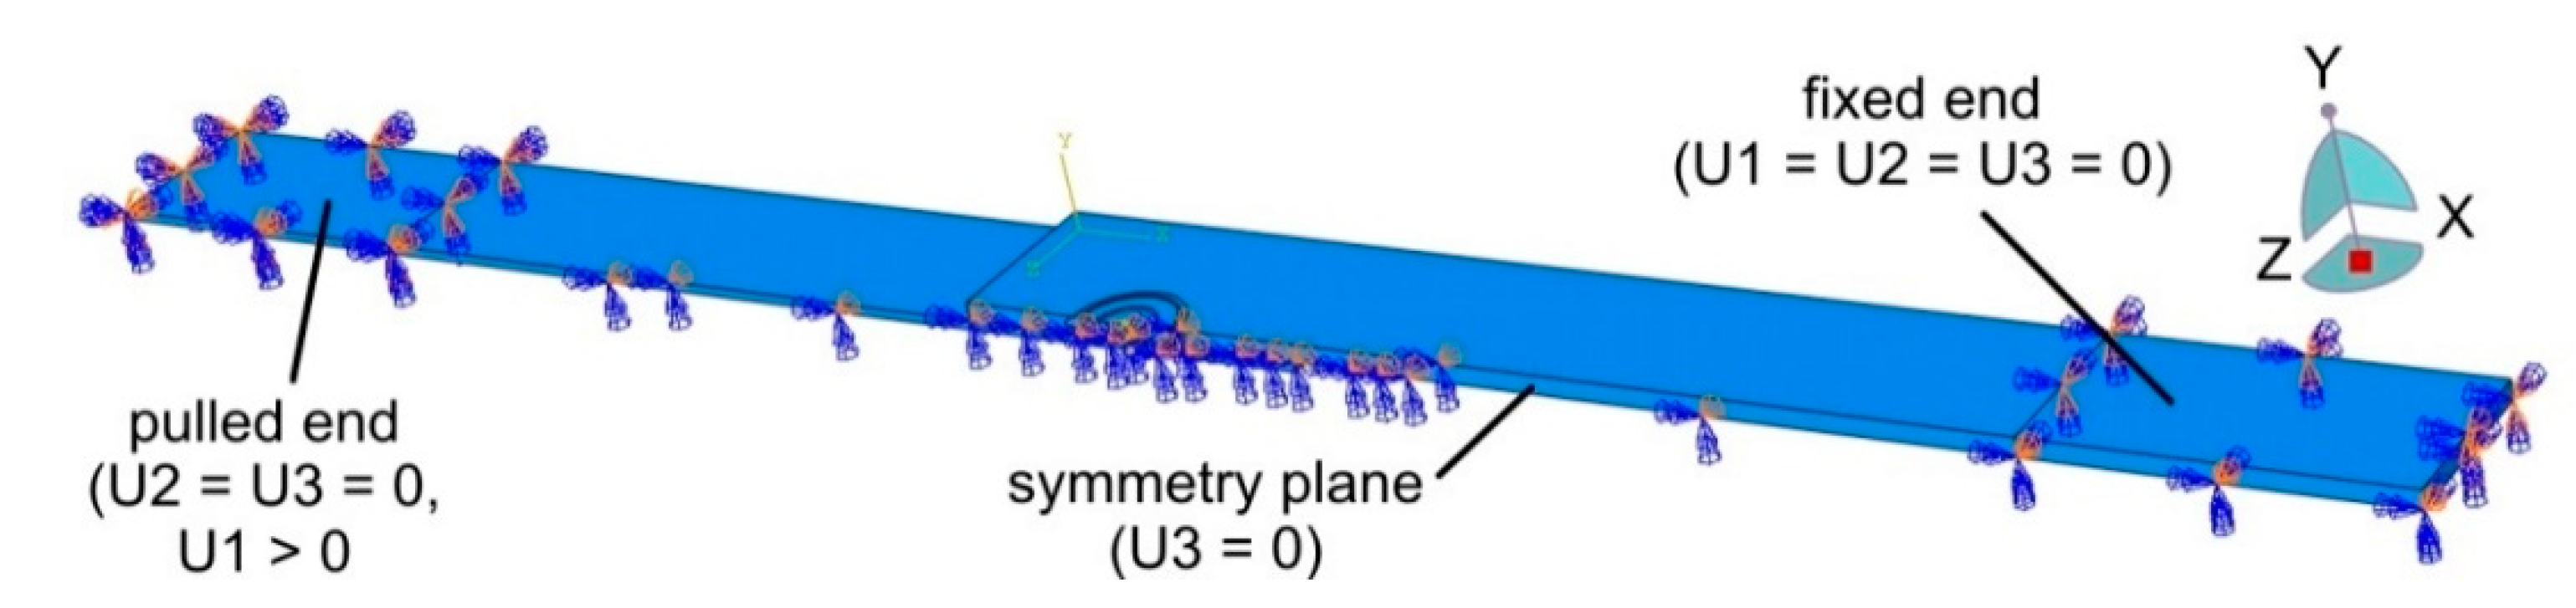
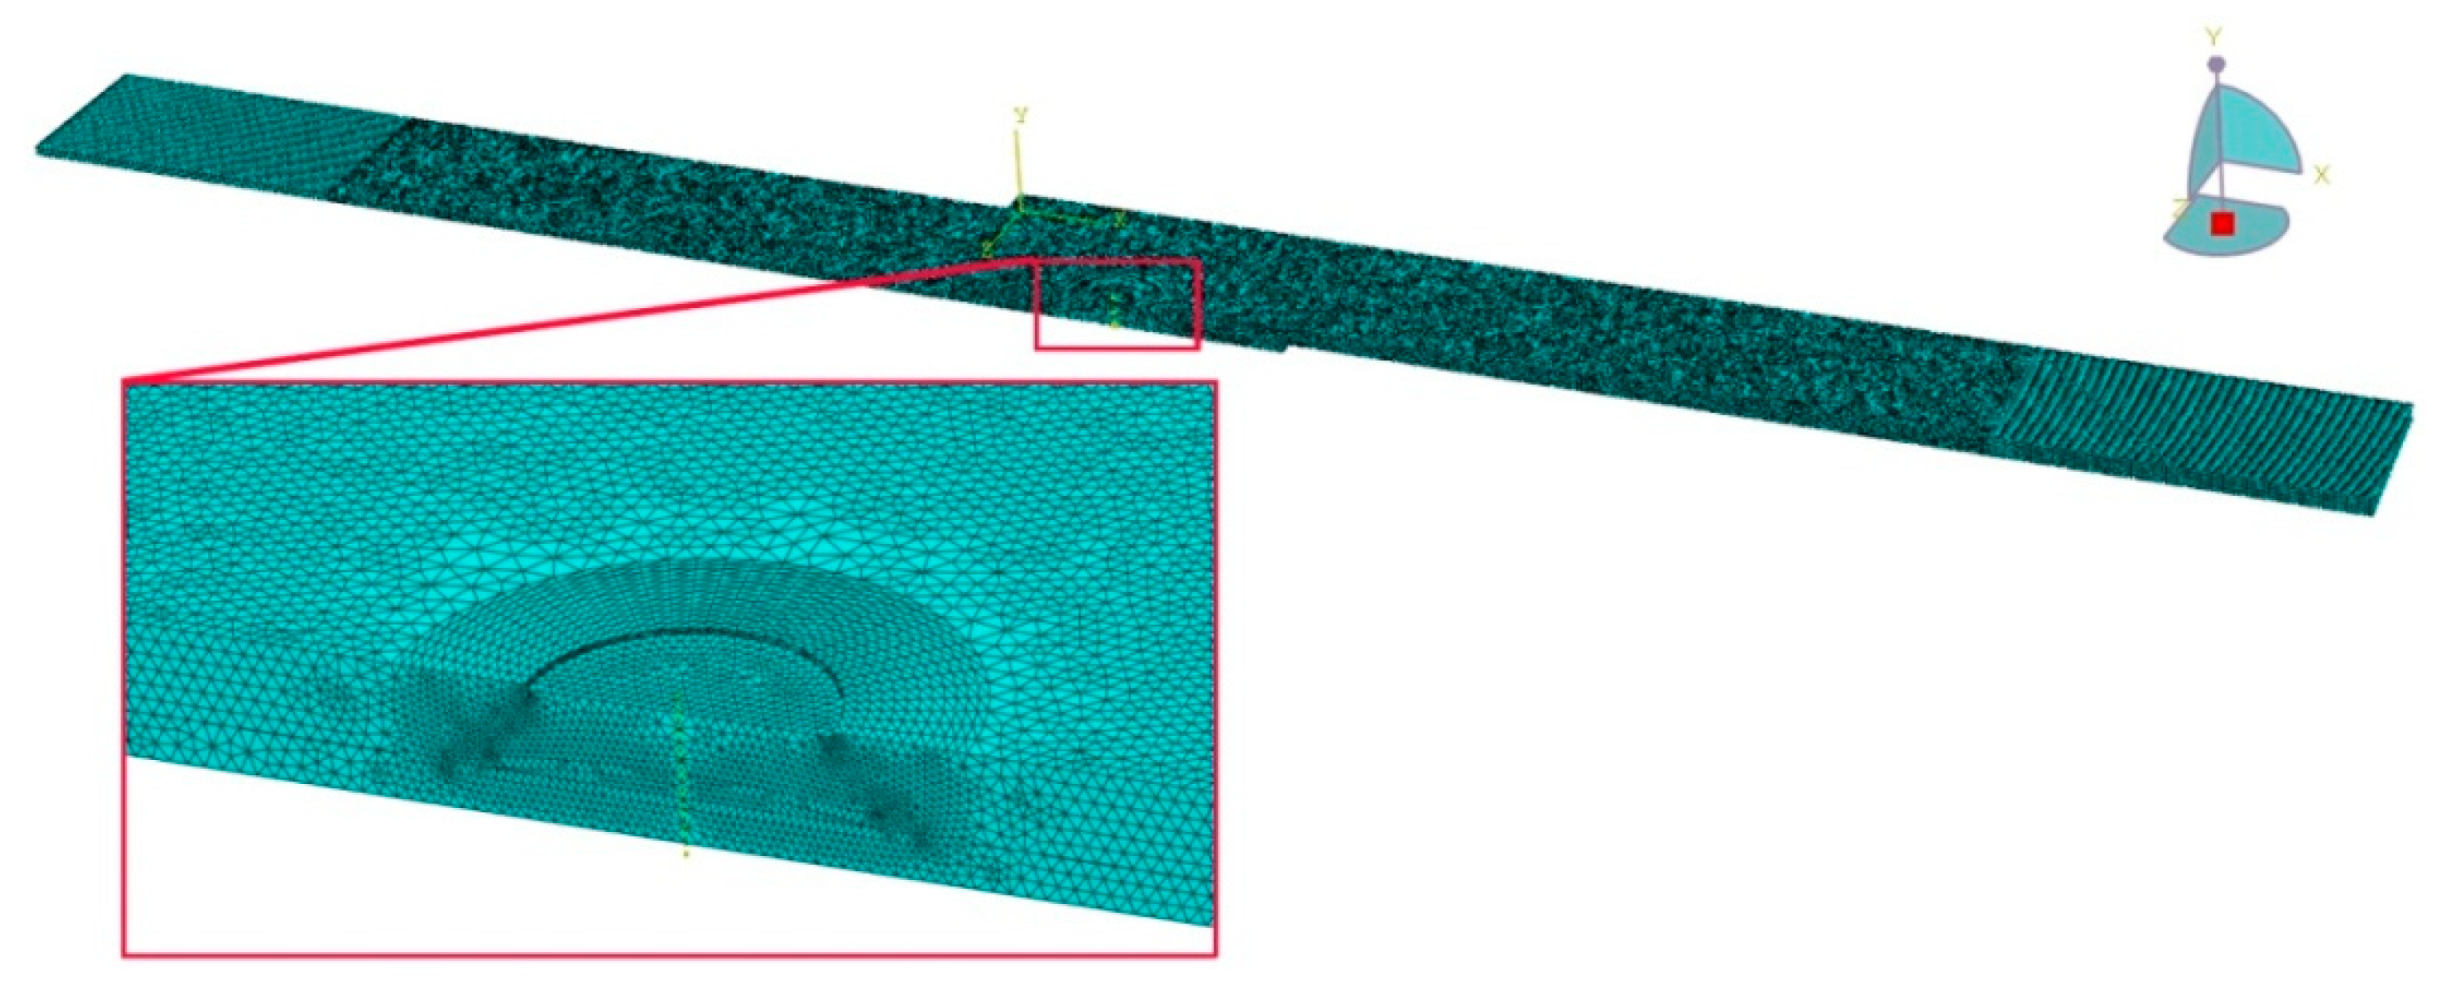
2.6. Numerical Modelling
2.7. X-ray Diffraction Measurements
3. Results and Discussion
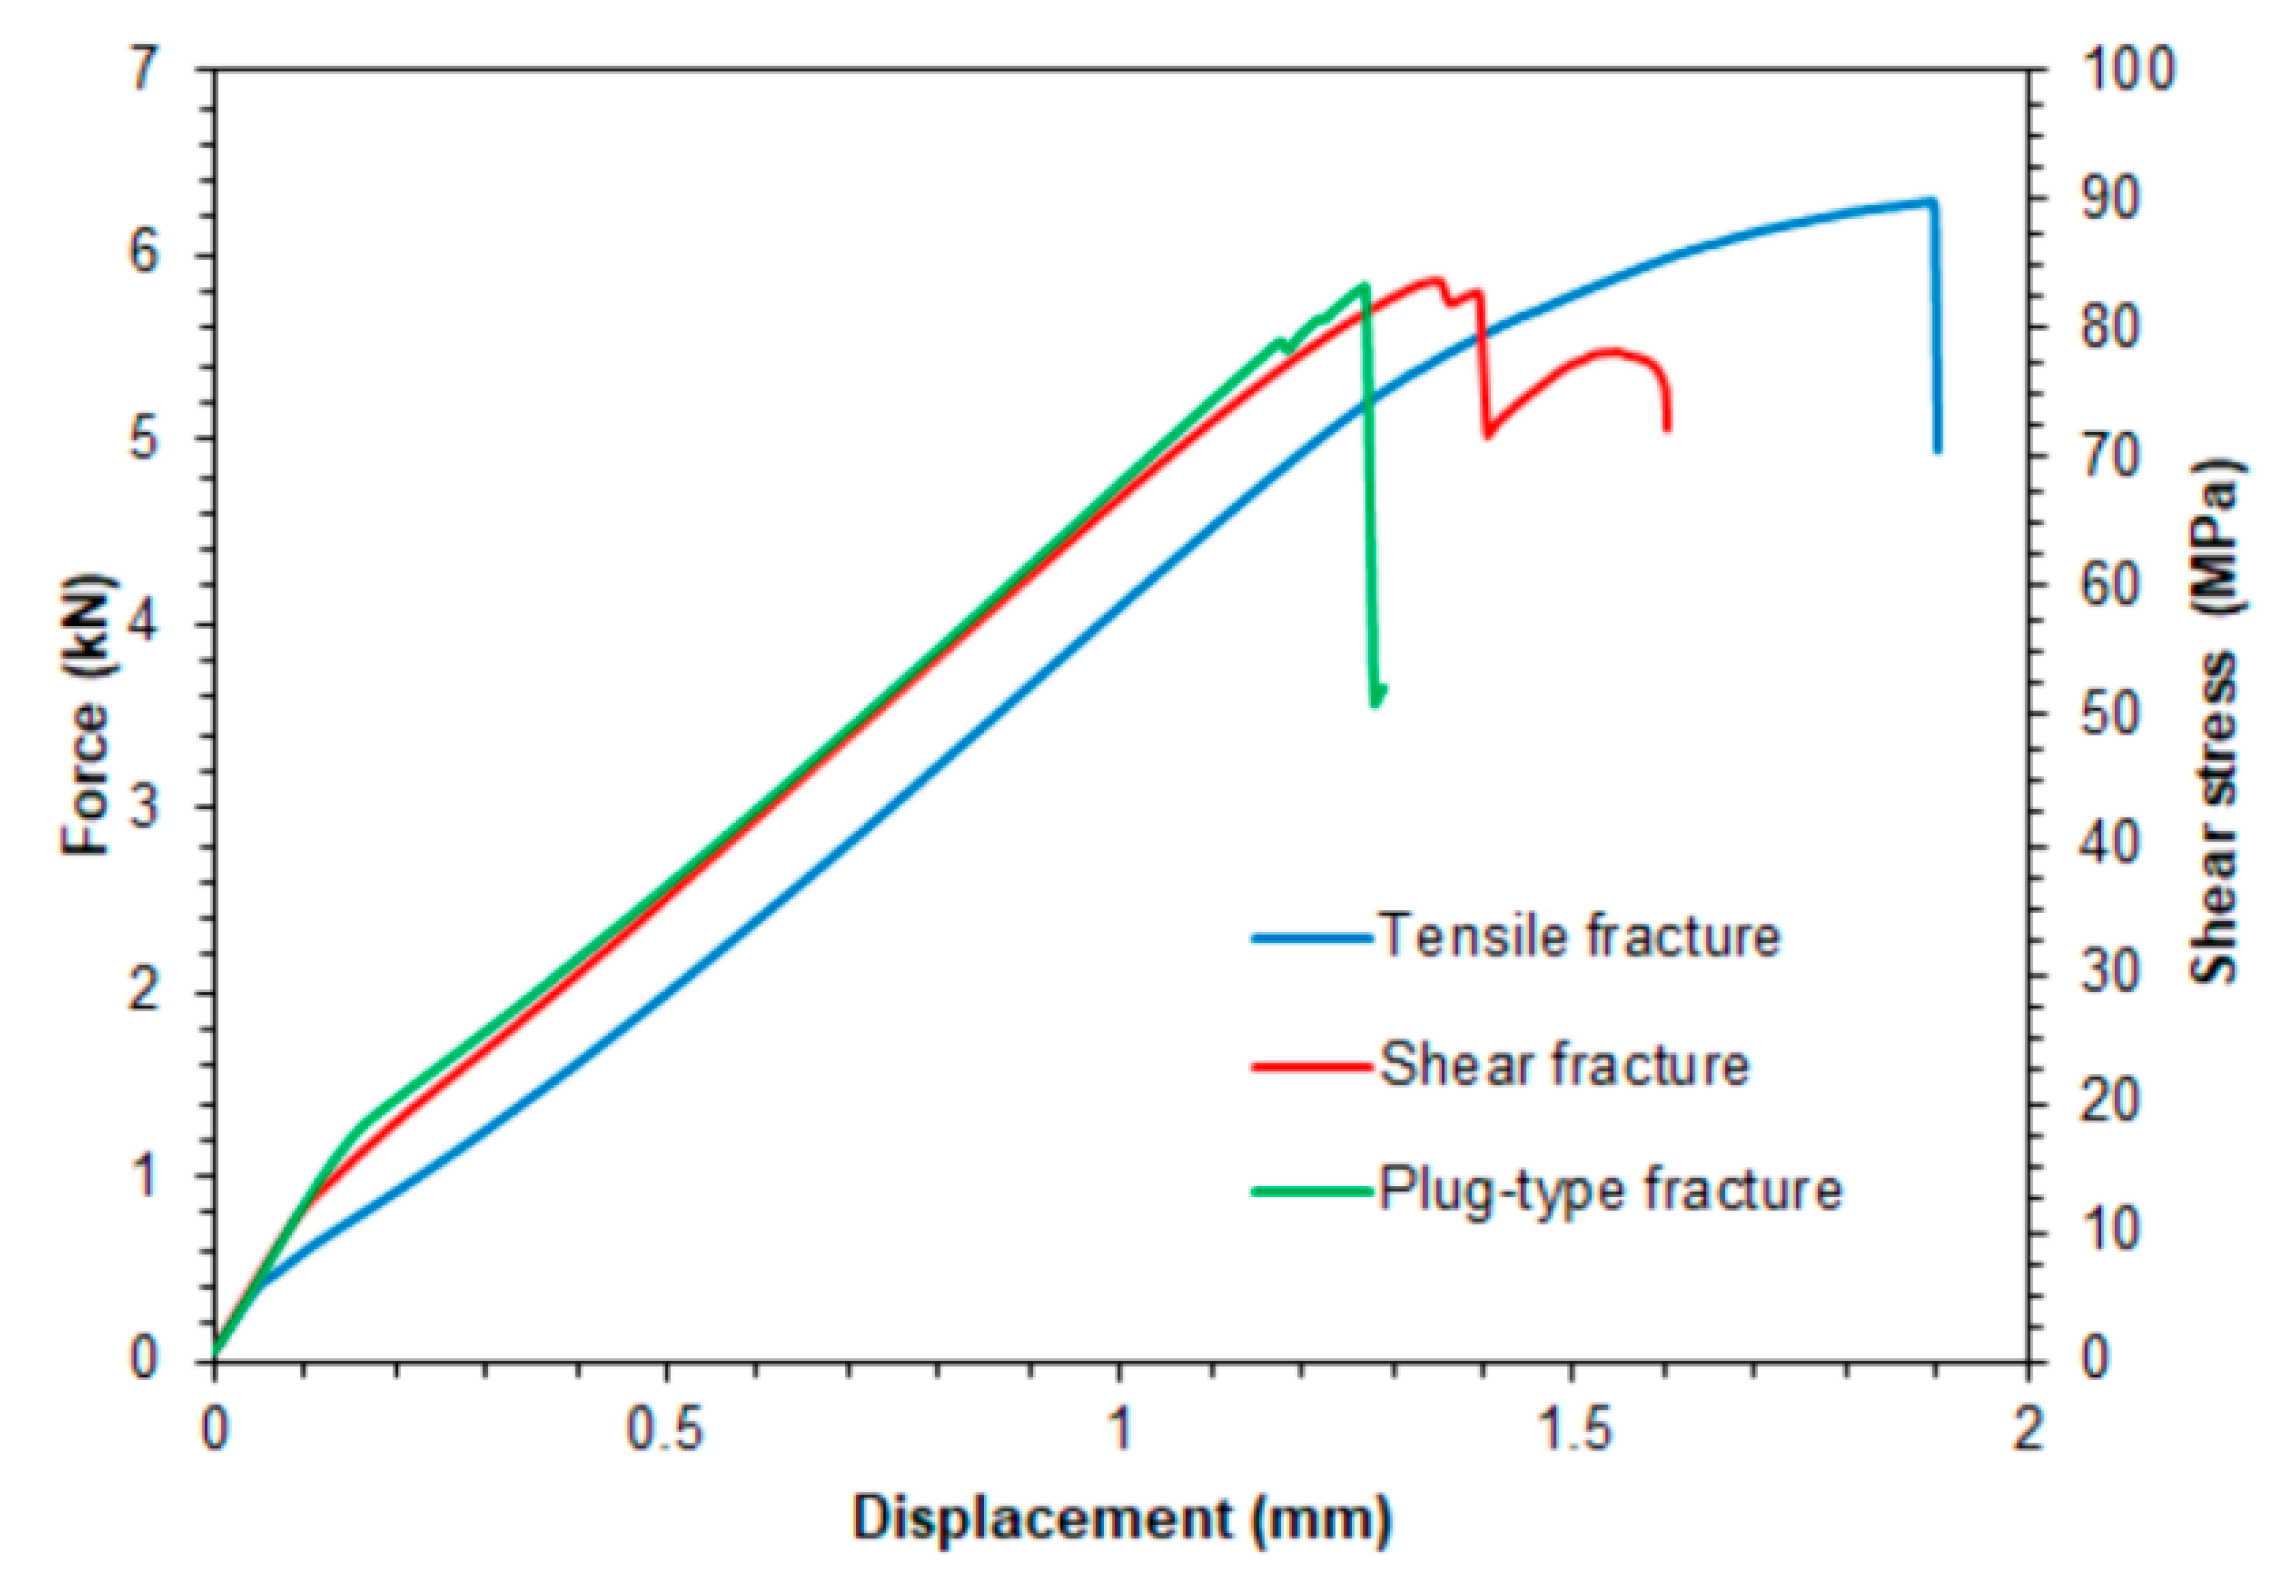
3.1. Tensile Properties
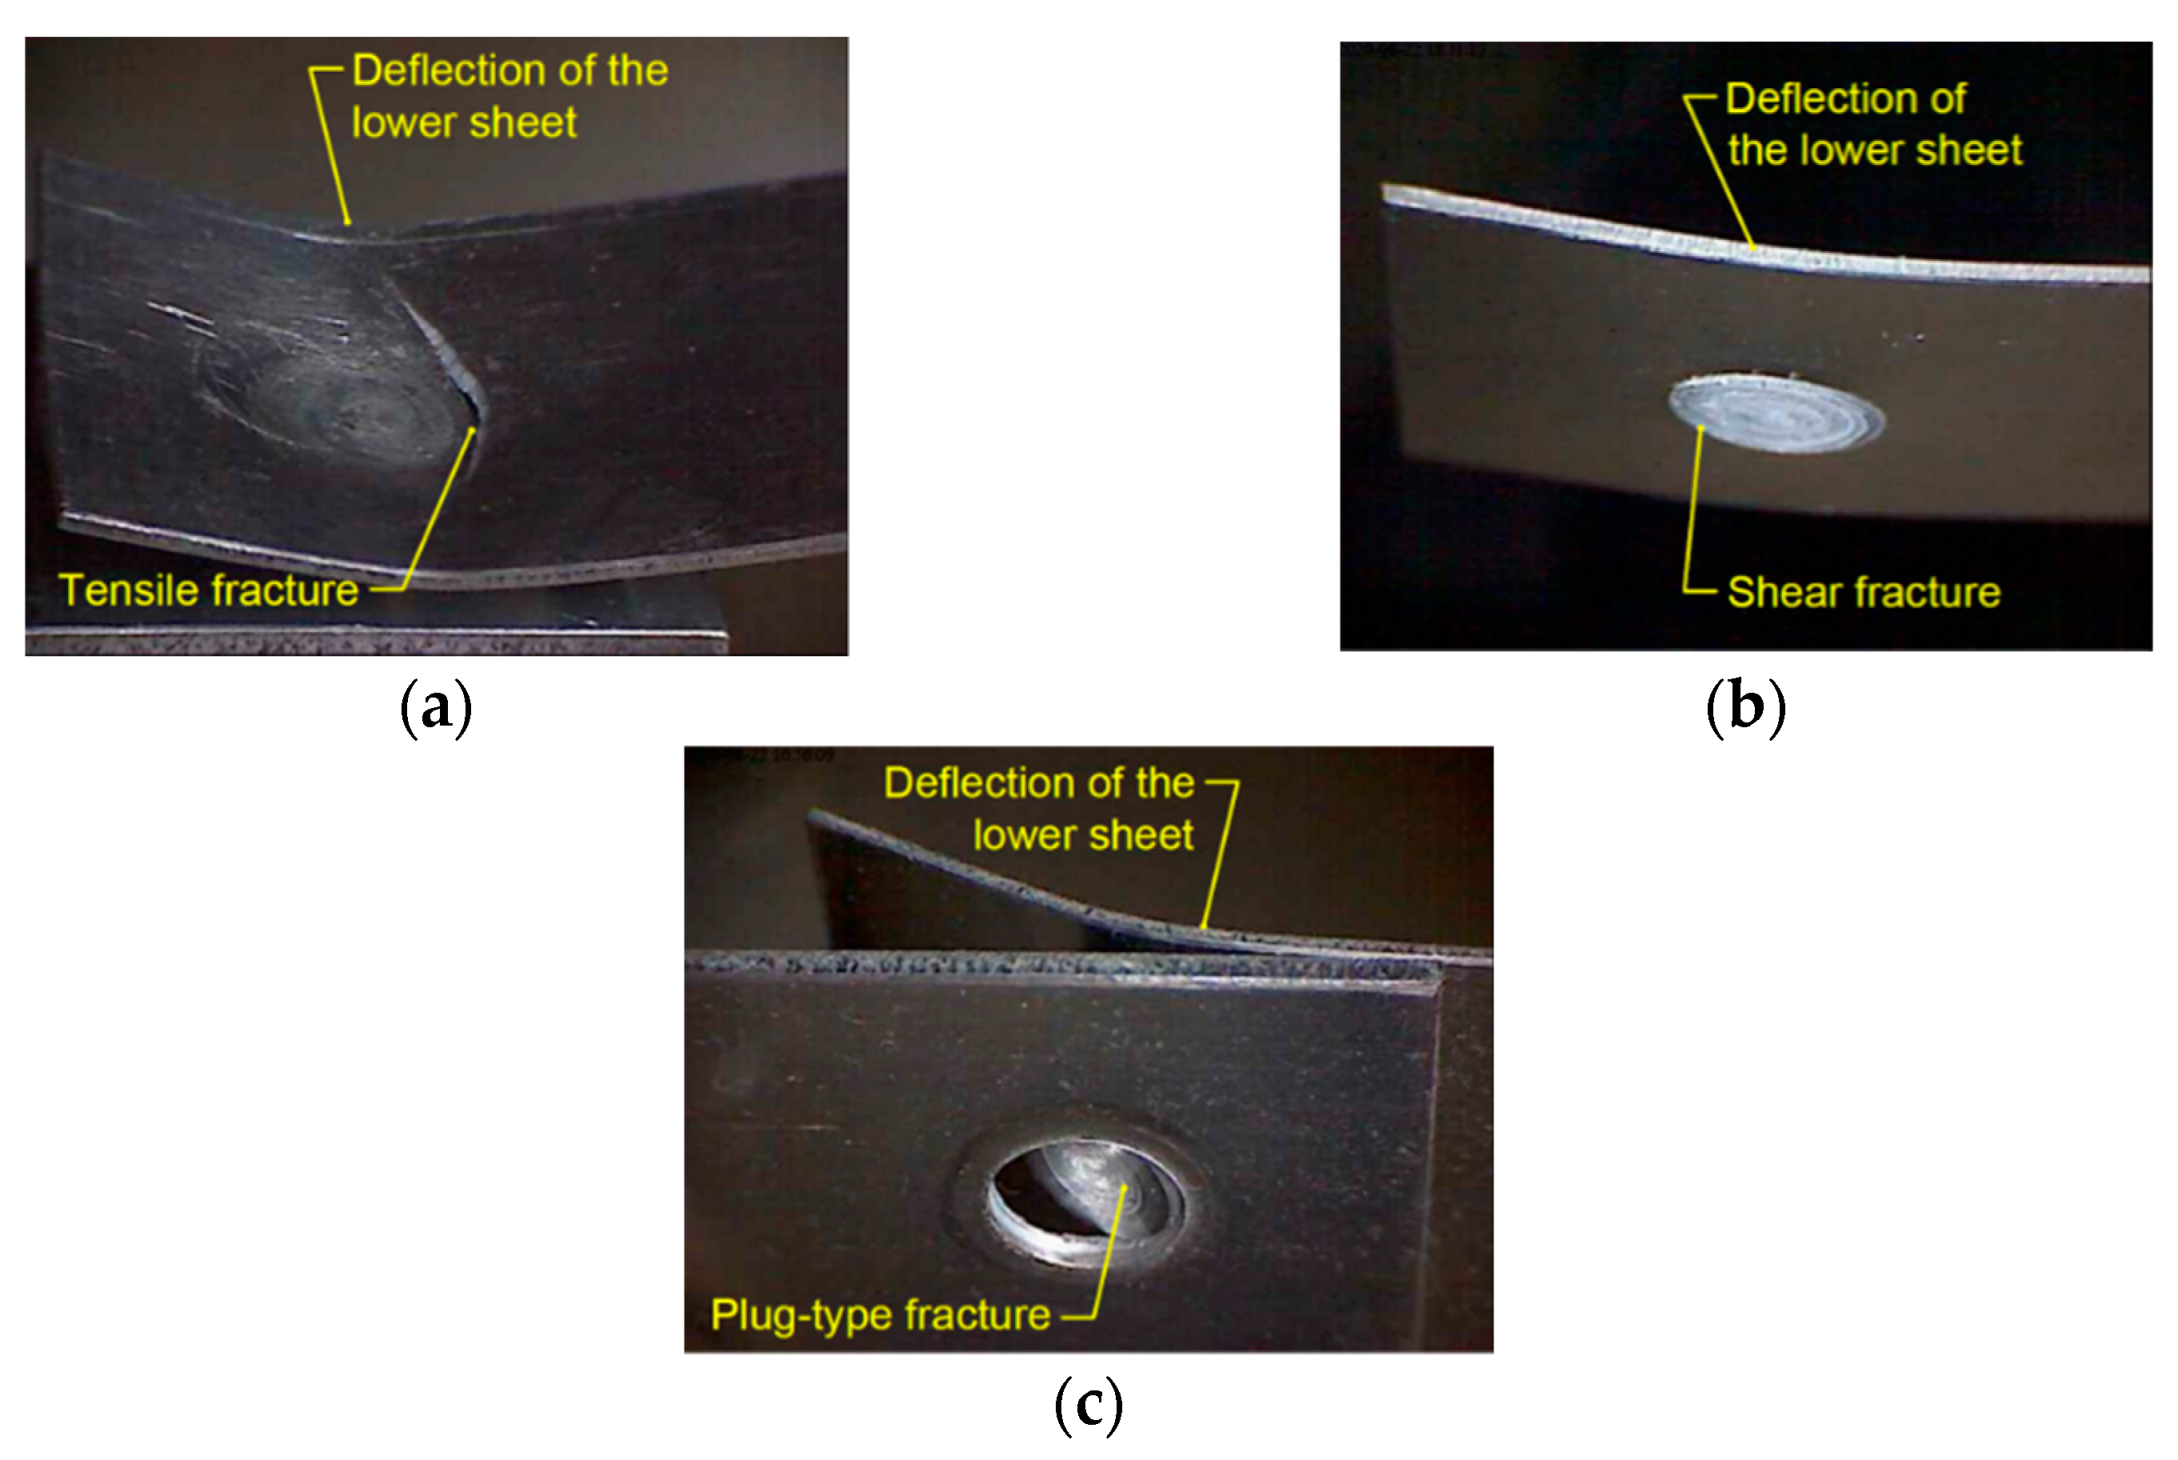
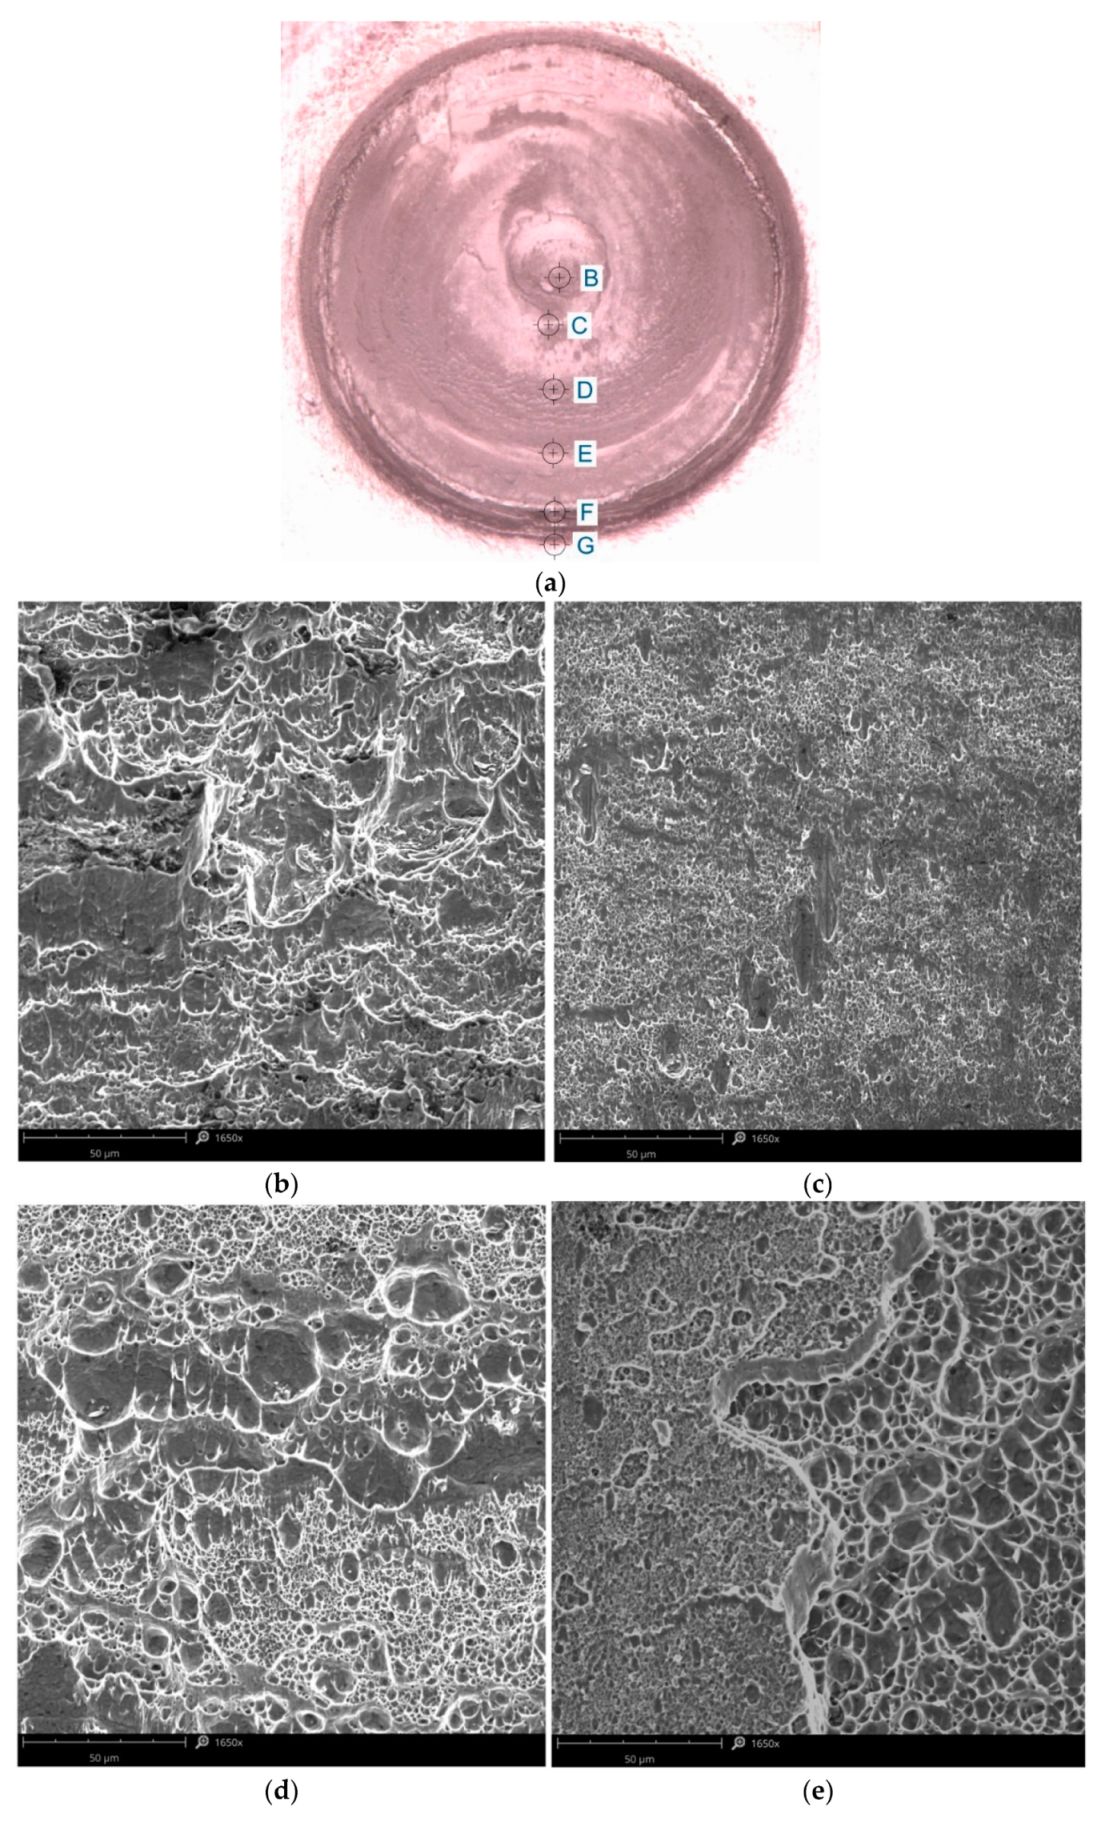
3.2. Analysis of the Tensile Fracture Mechanism
3.3. Analysis of the Shear Fracture Failure Mechanism
3.4. Analysis of the Plug-Type Fracture Mode
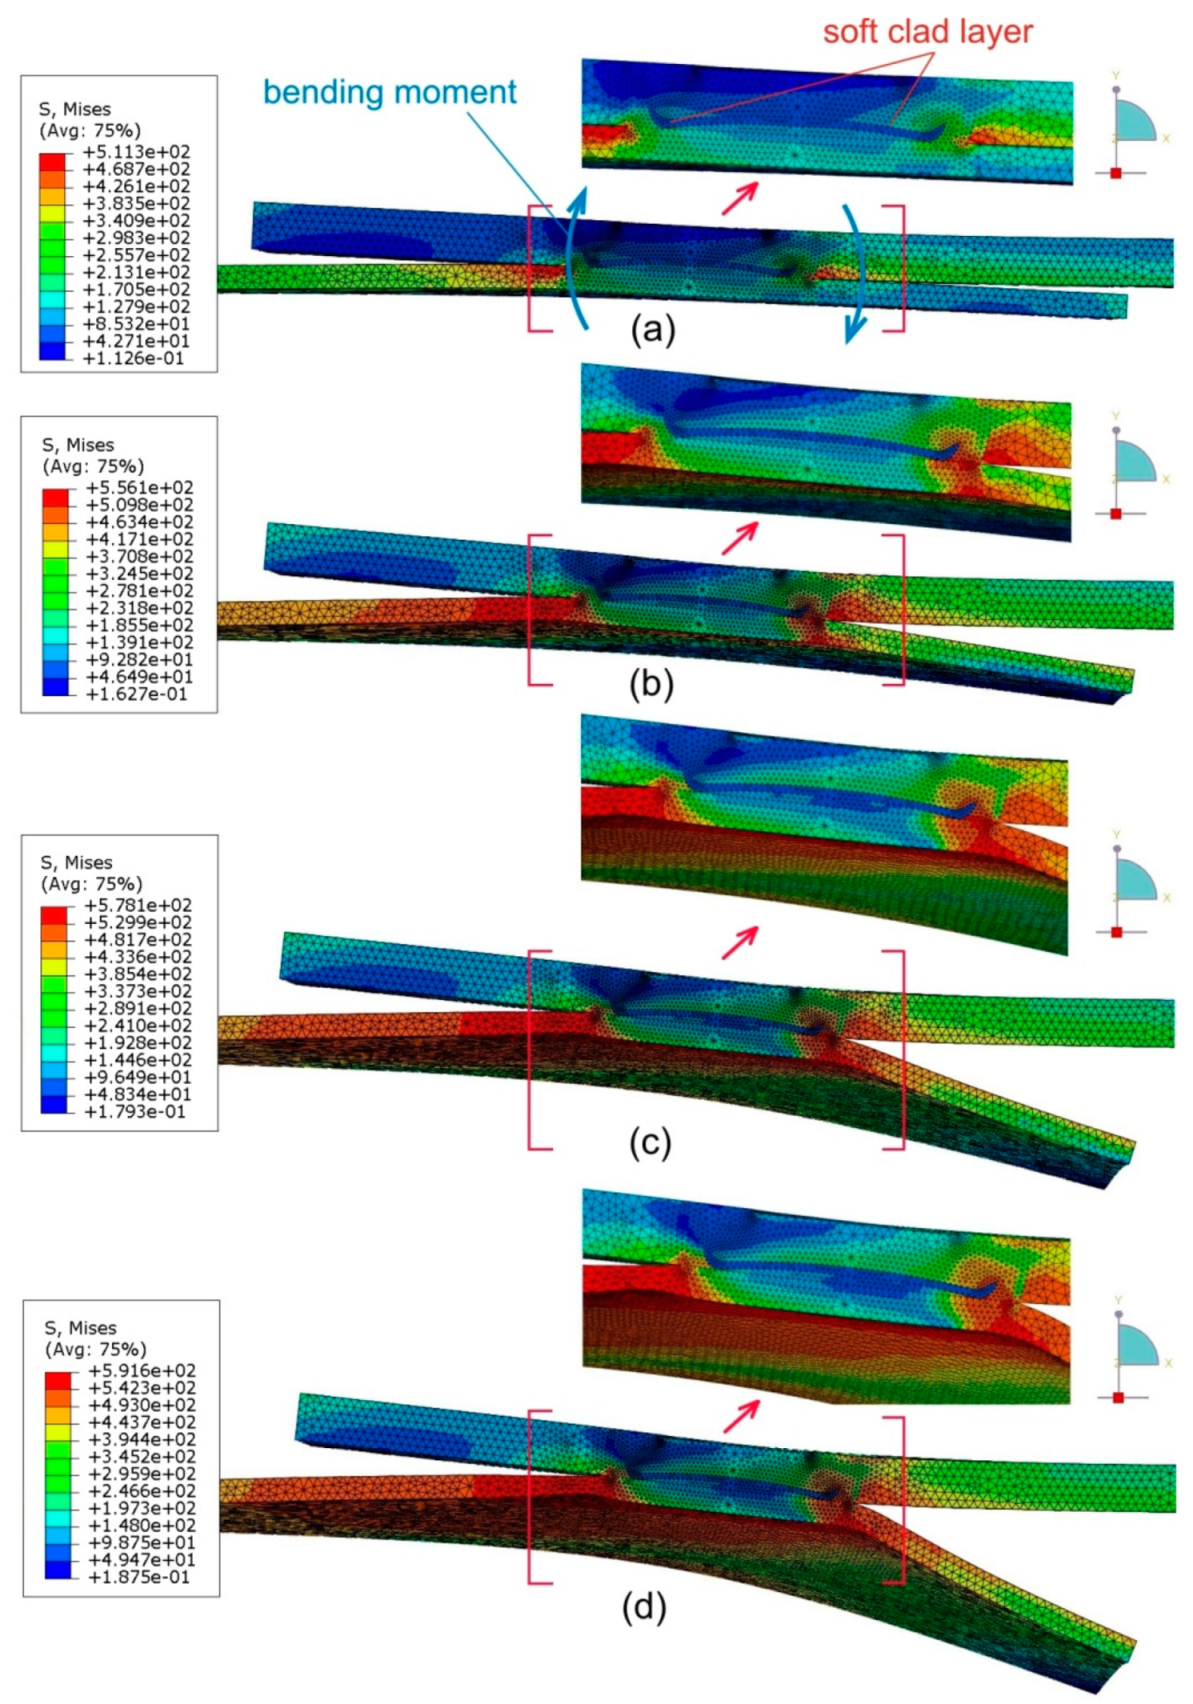
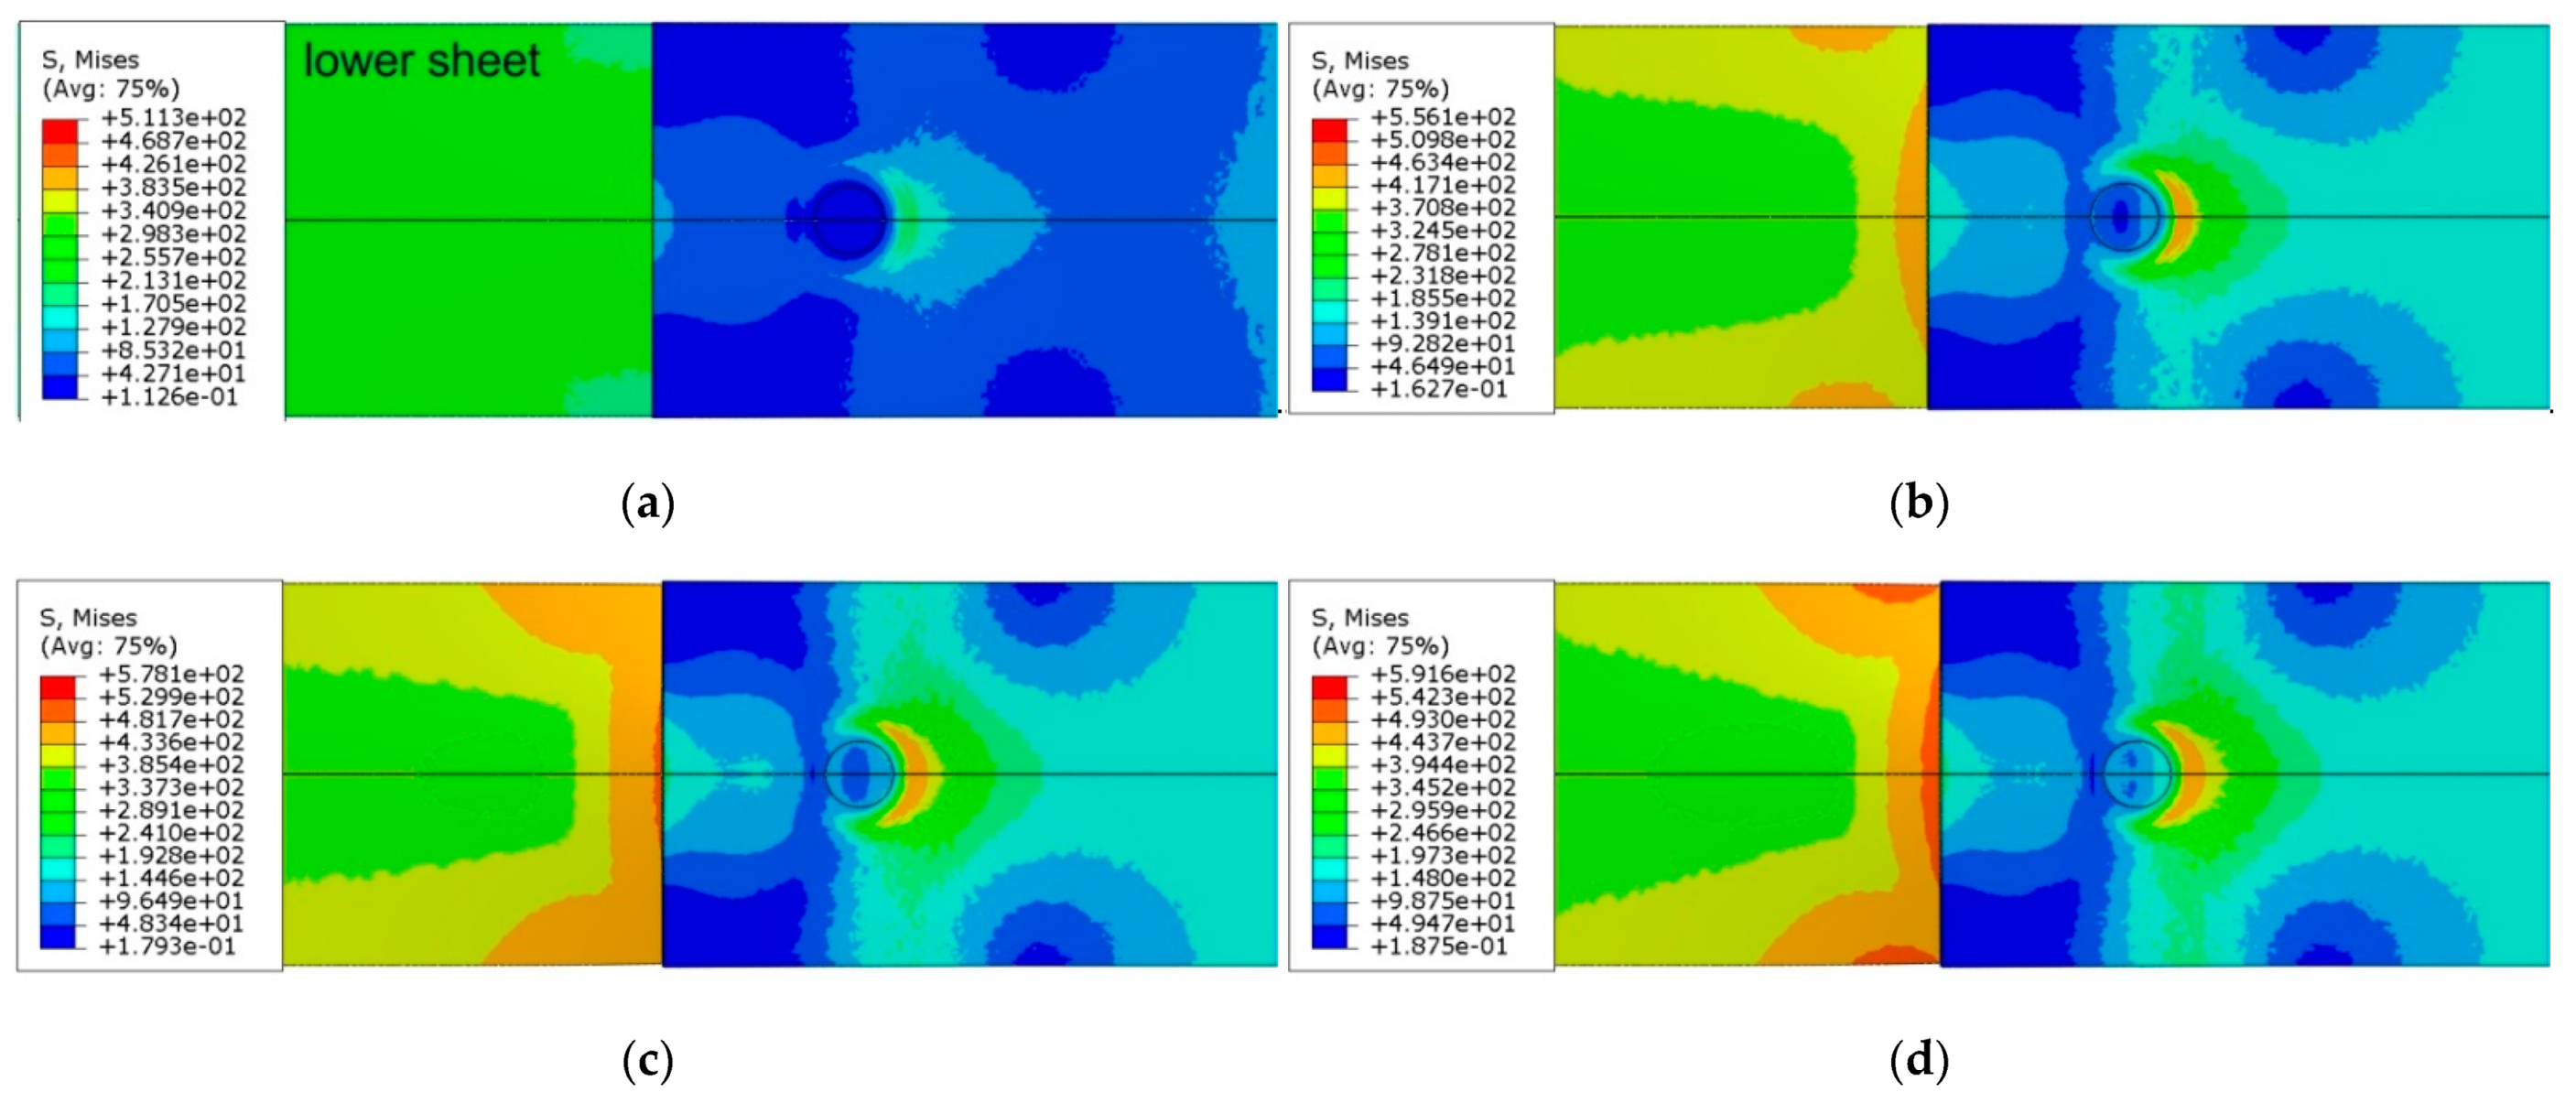
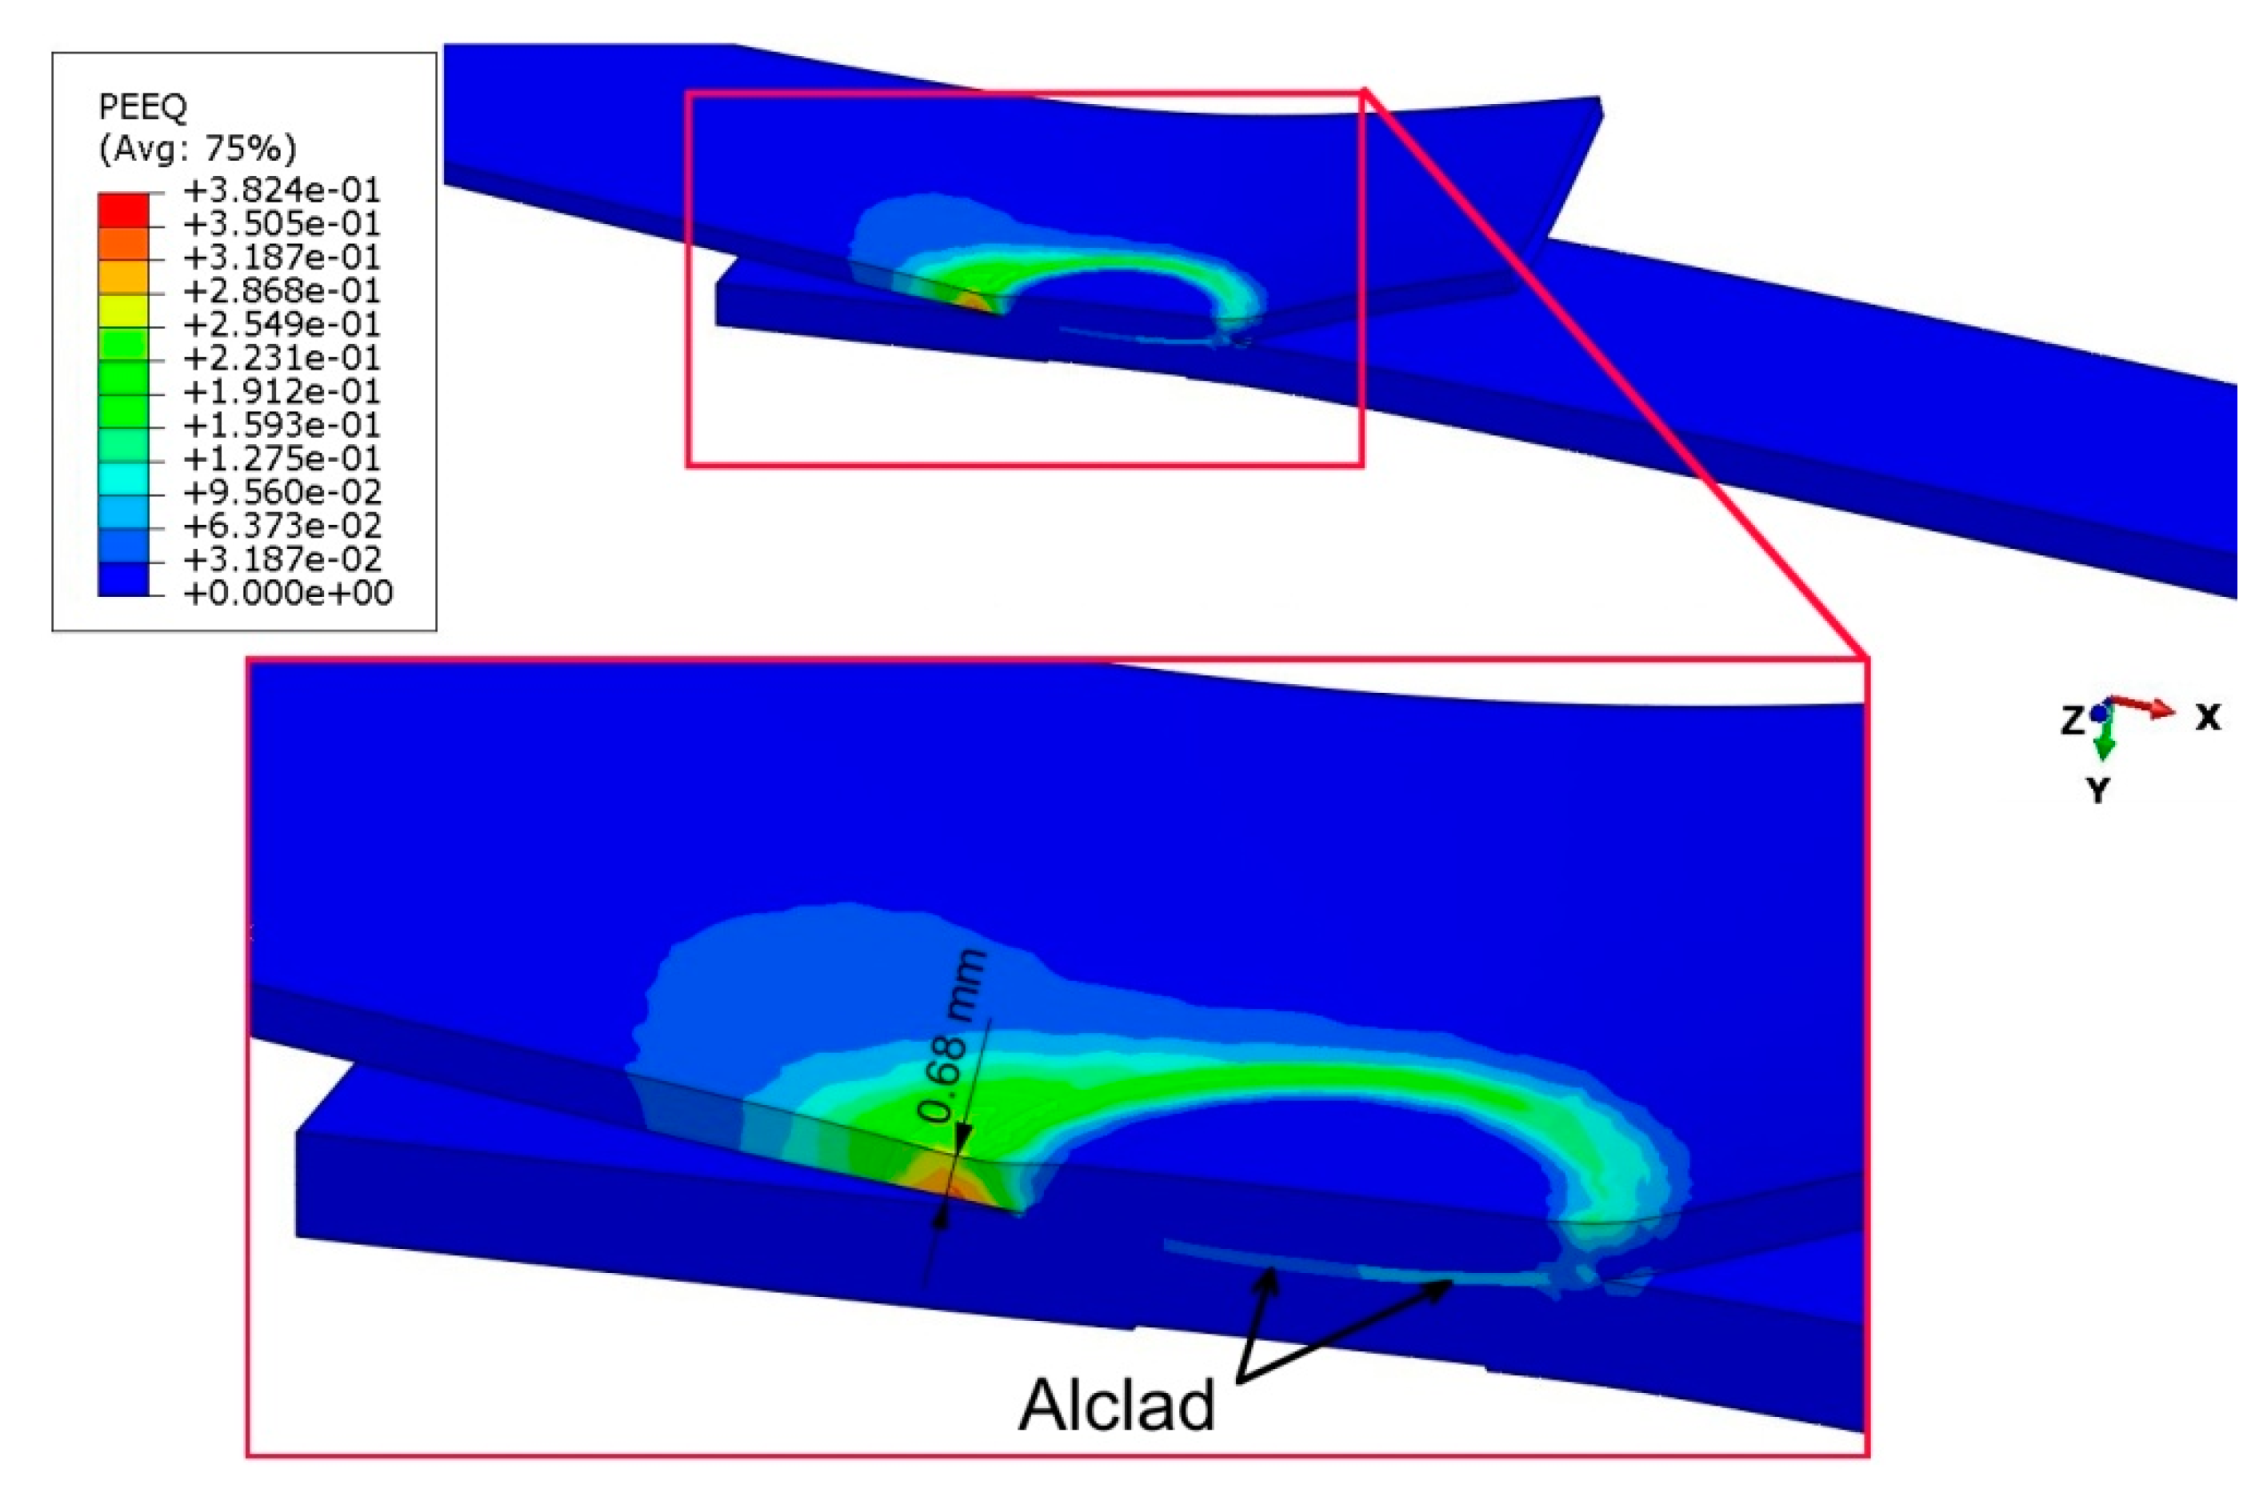
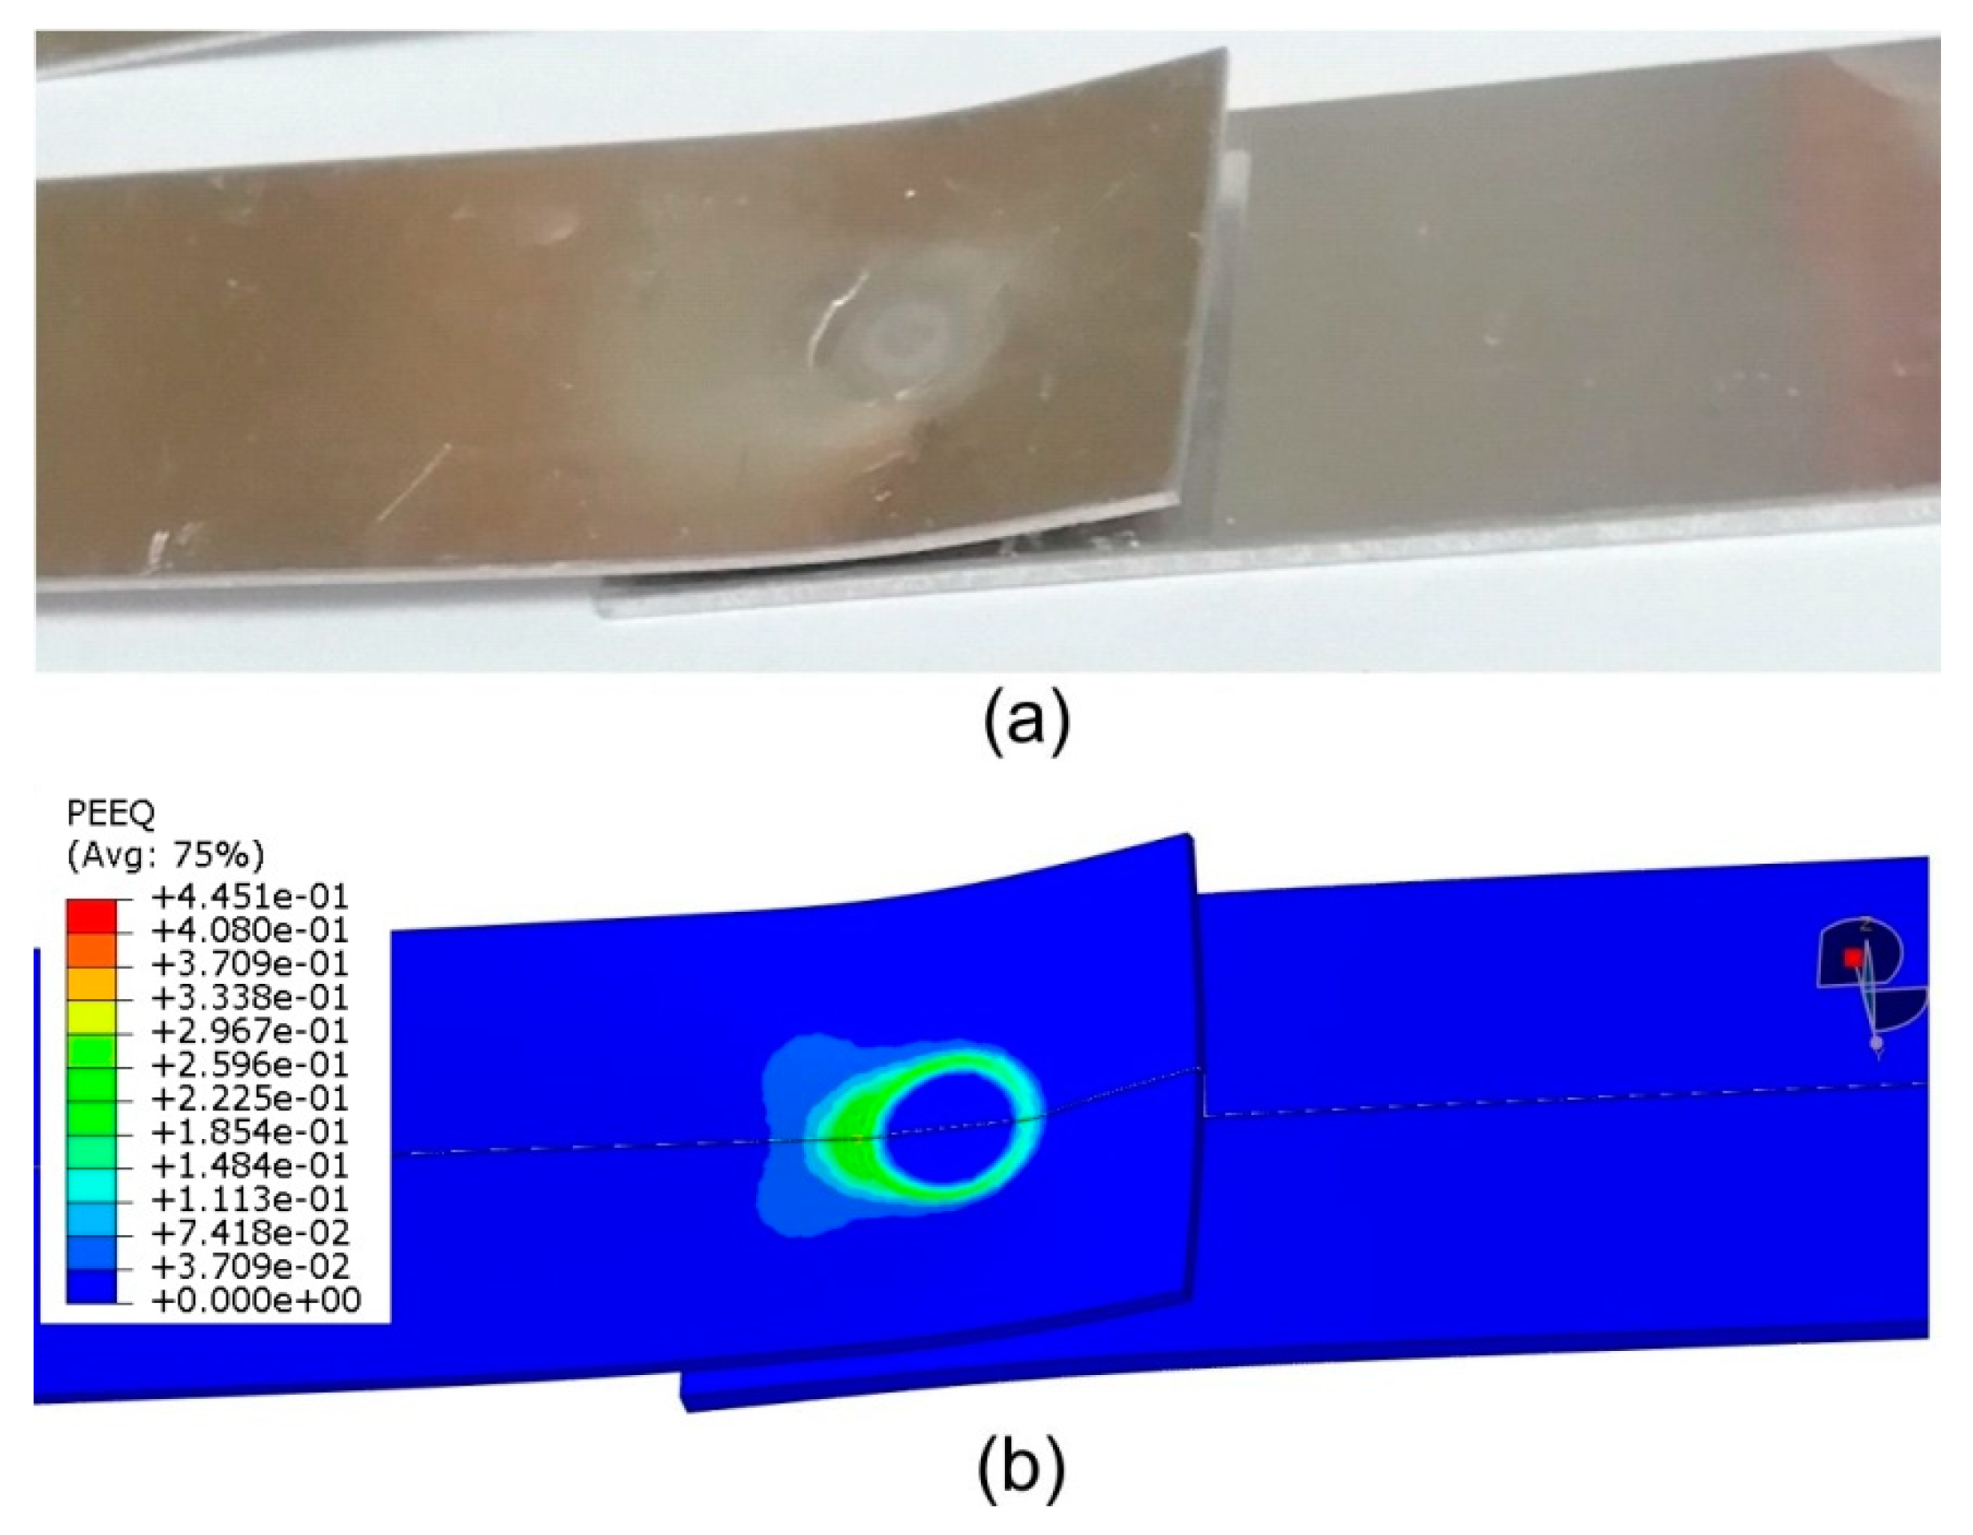
3.5. Numerical Modelling
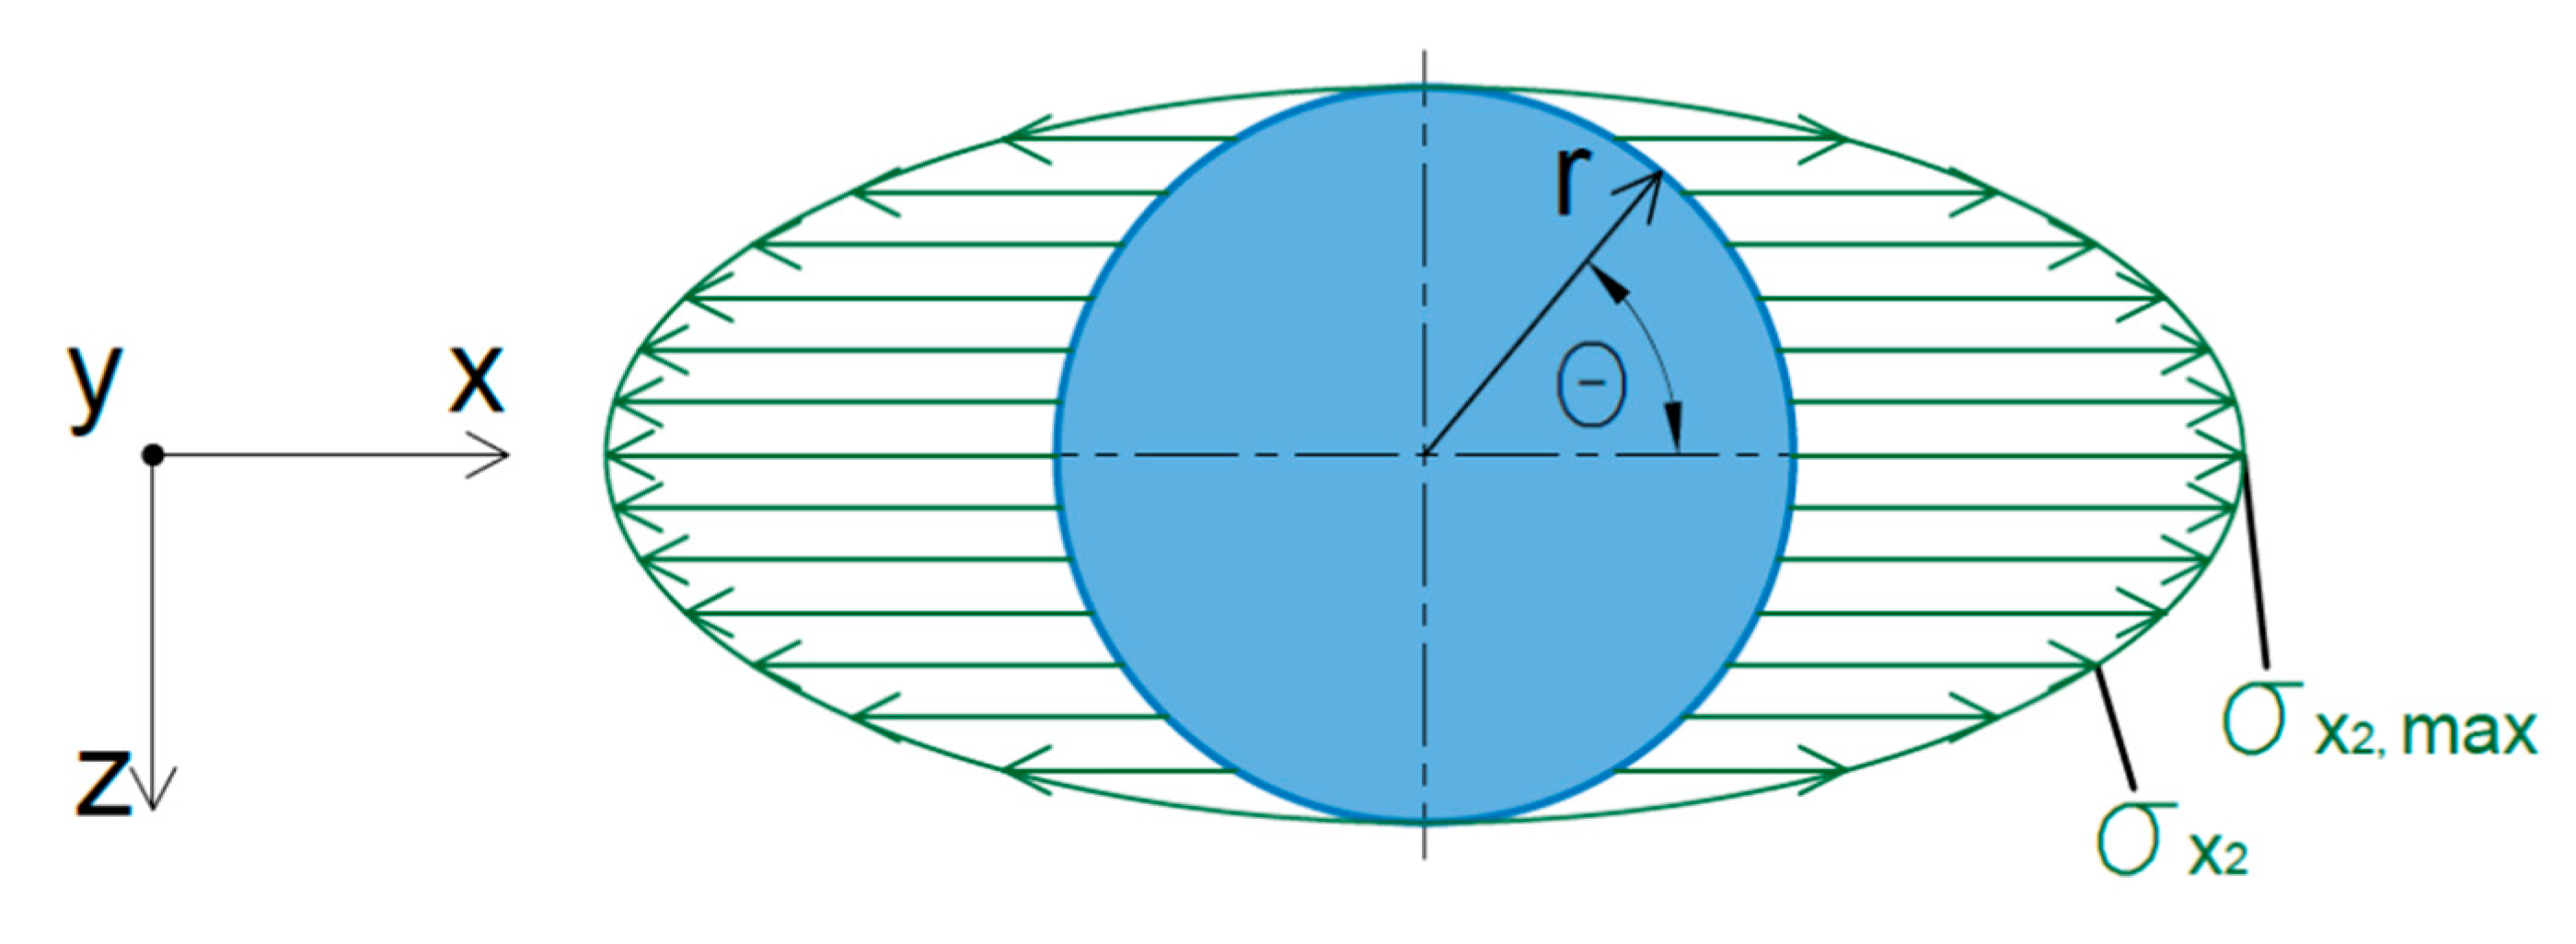
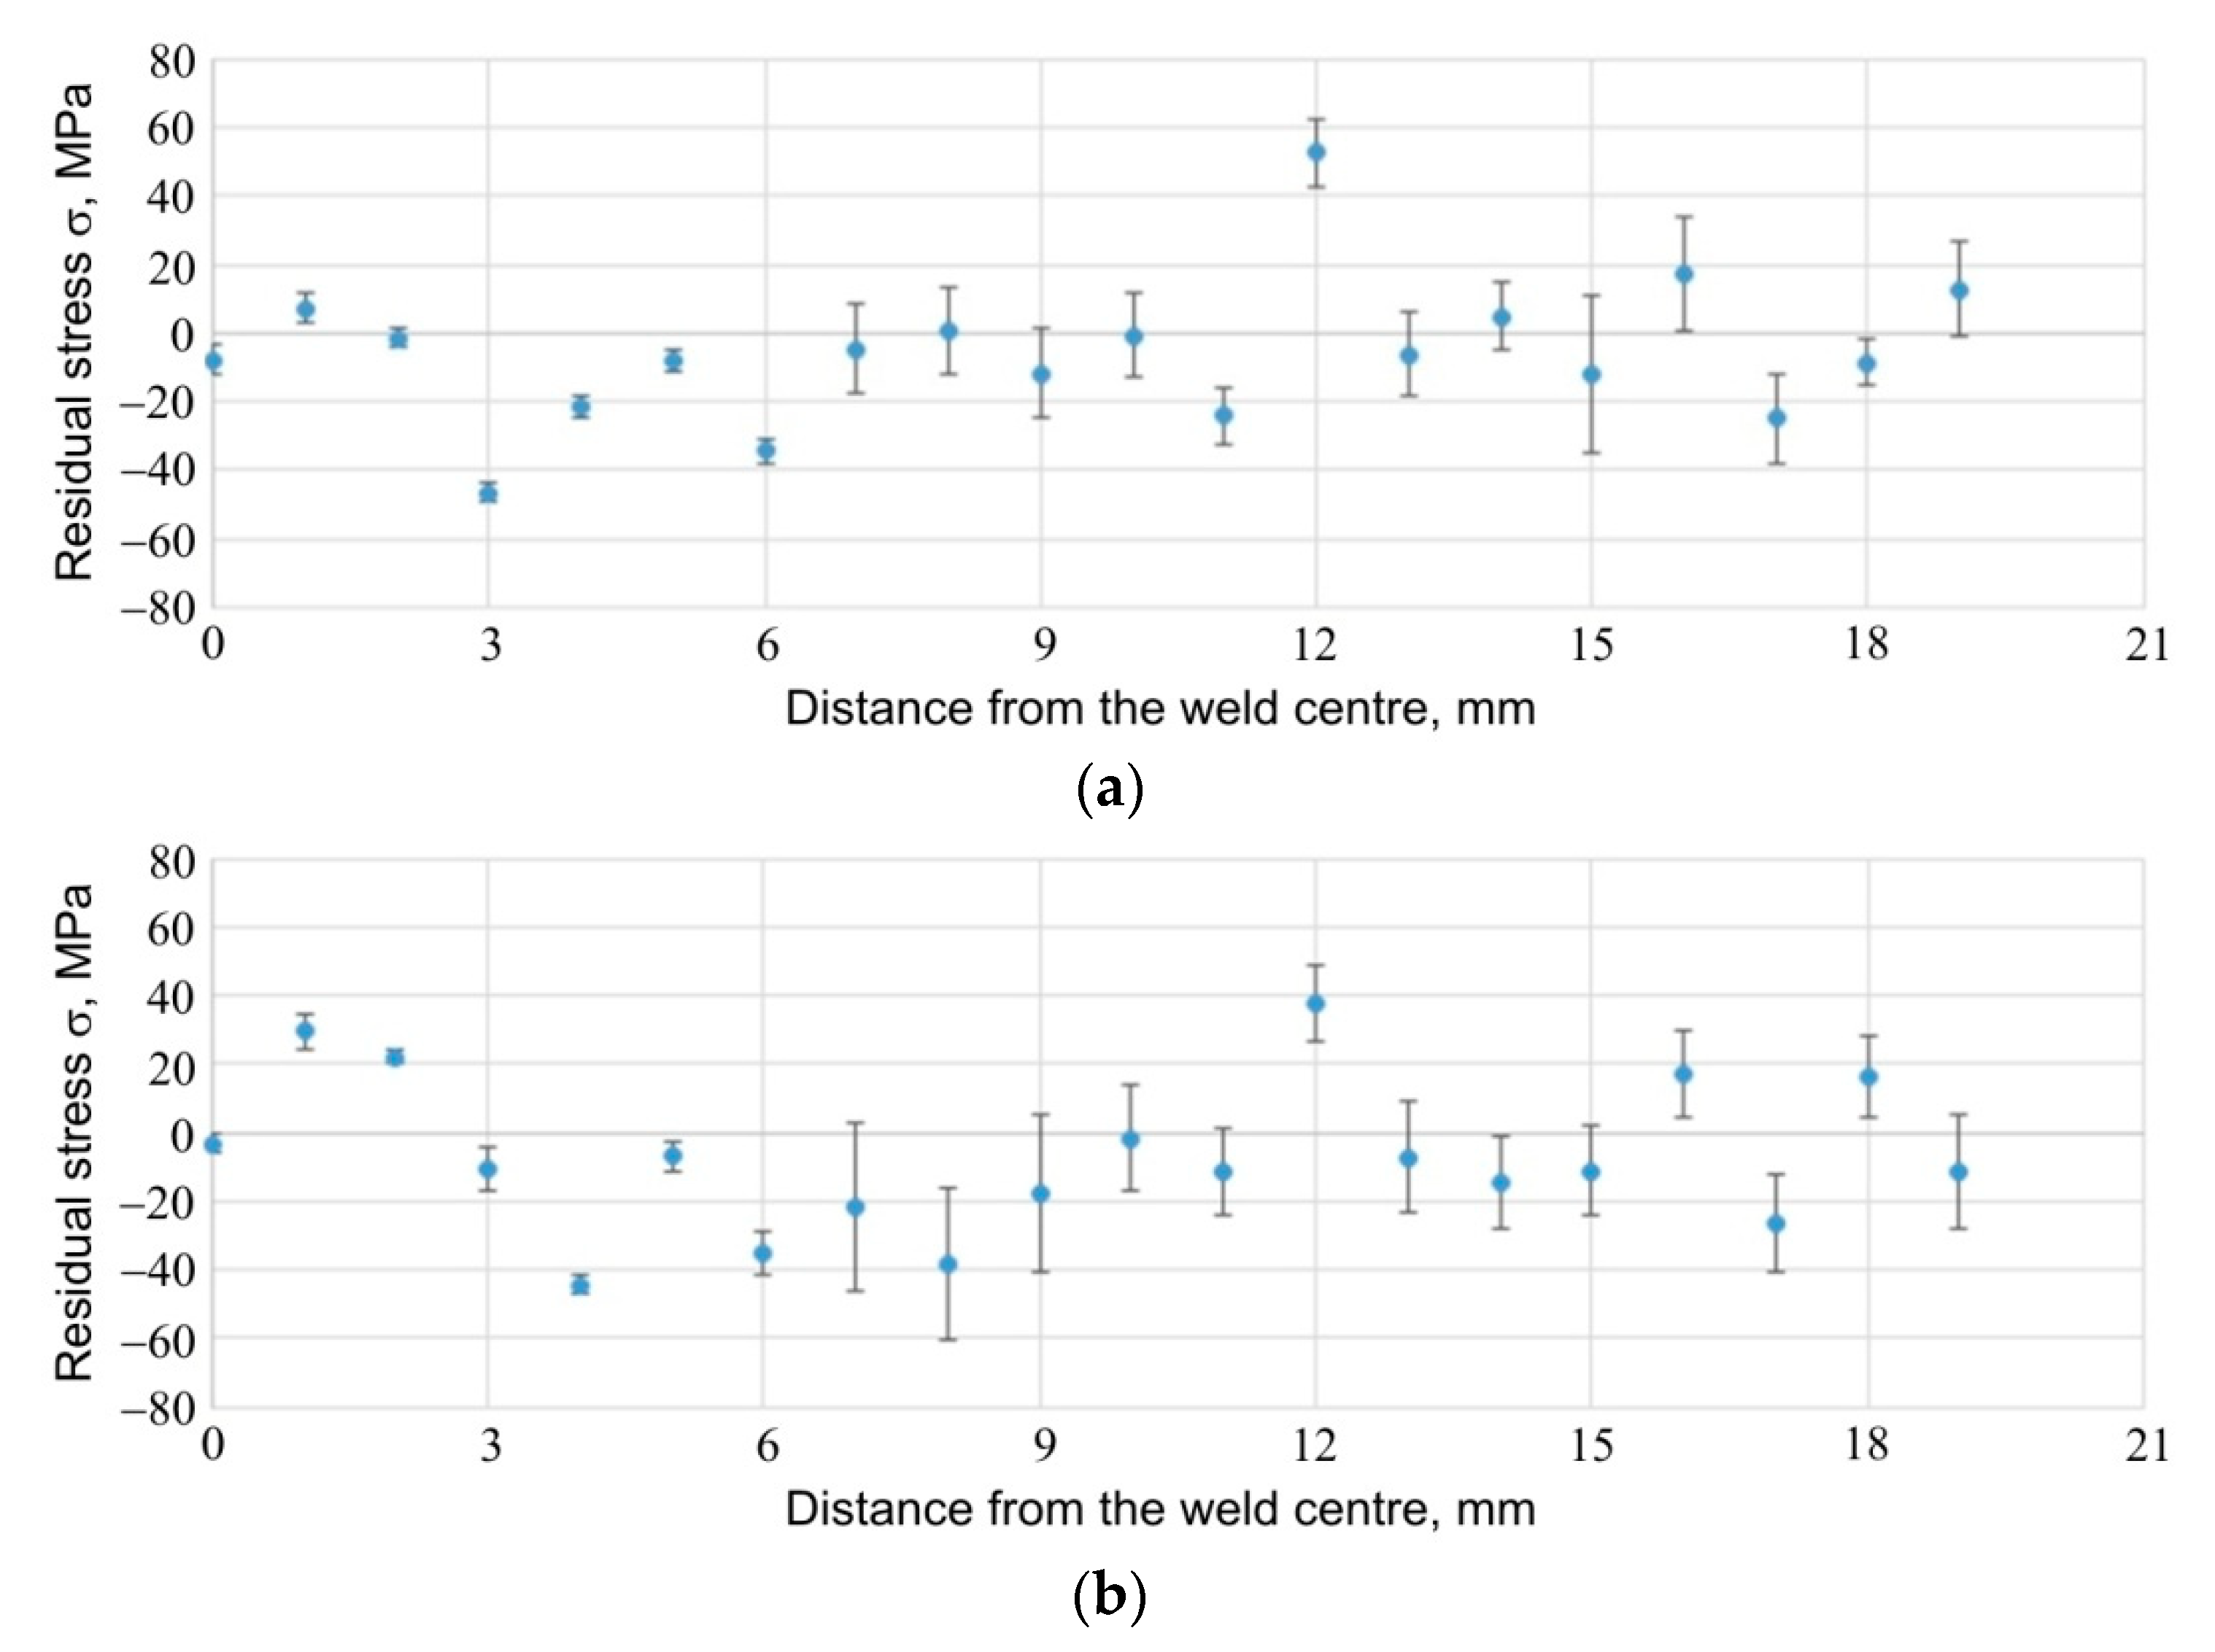
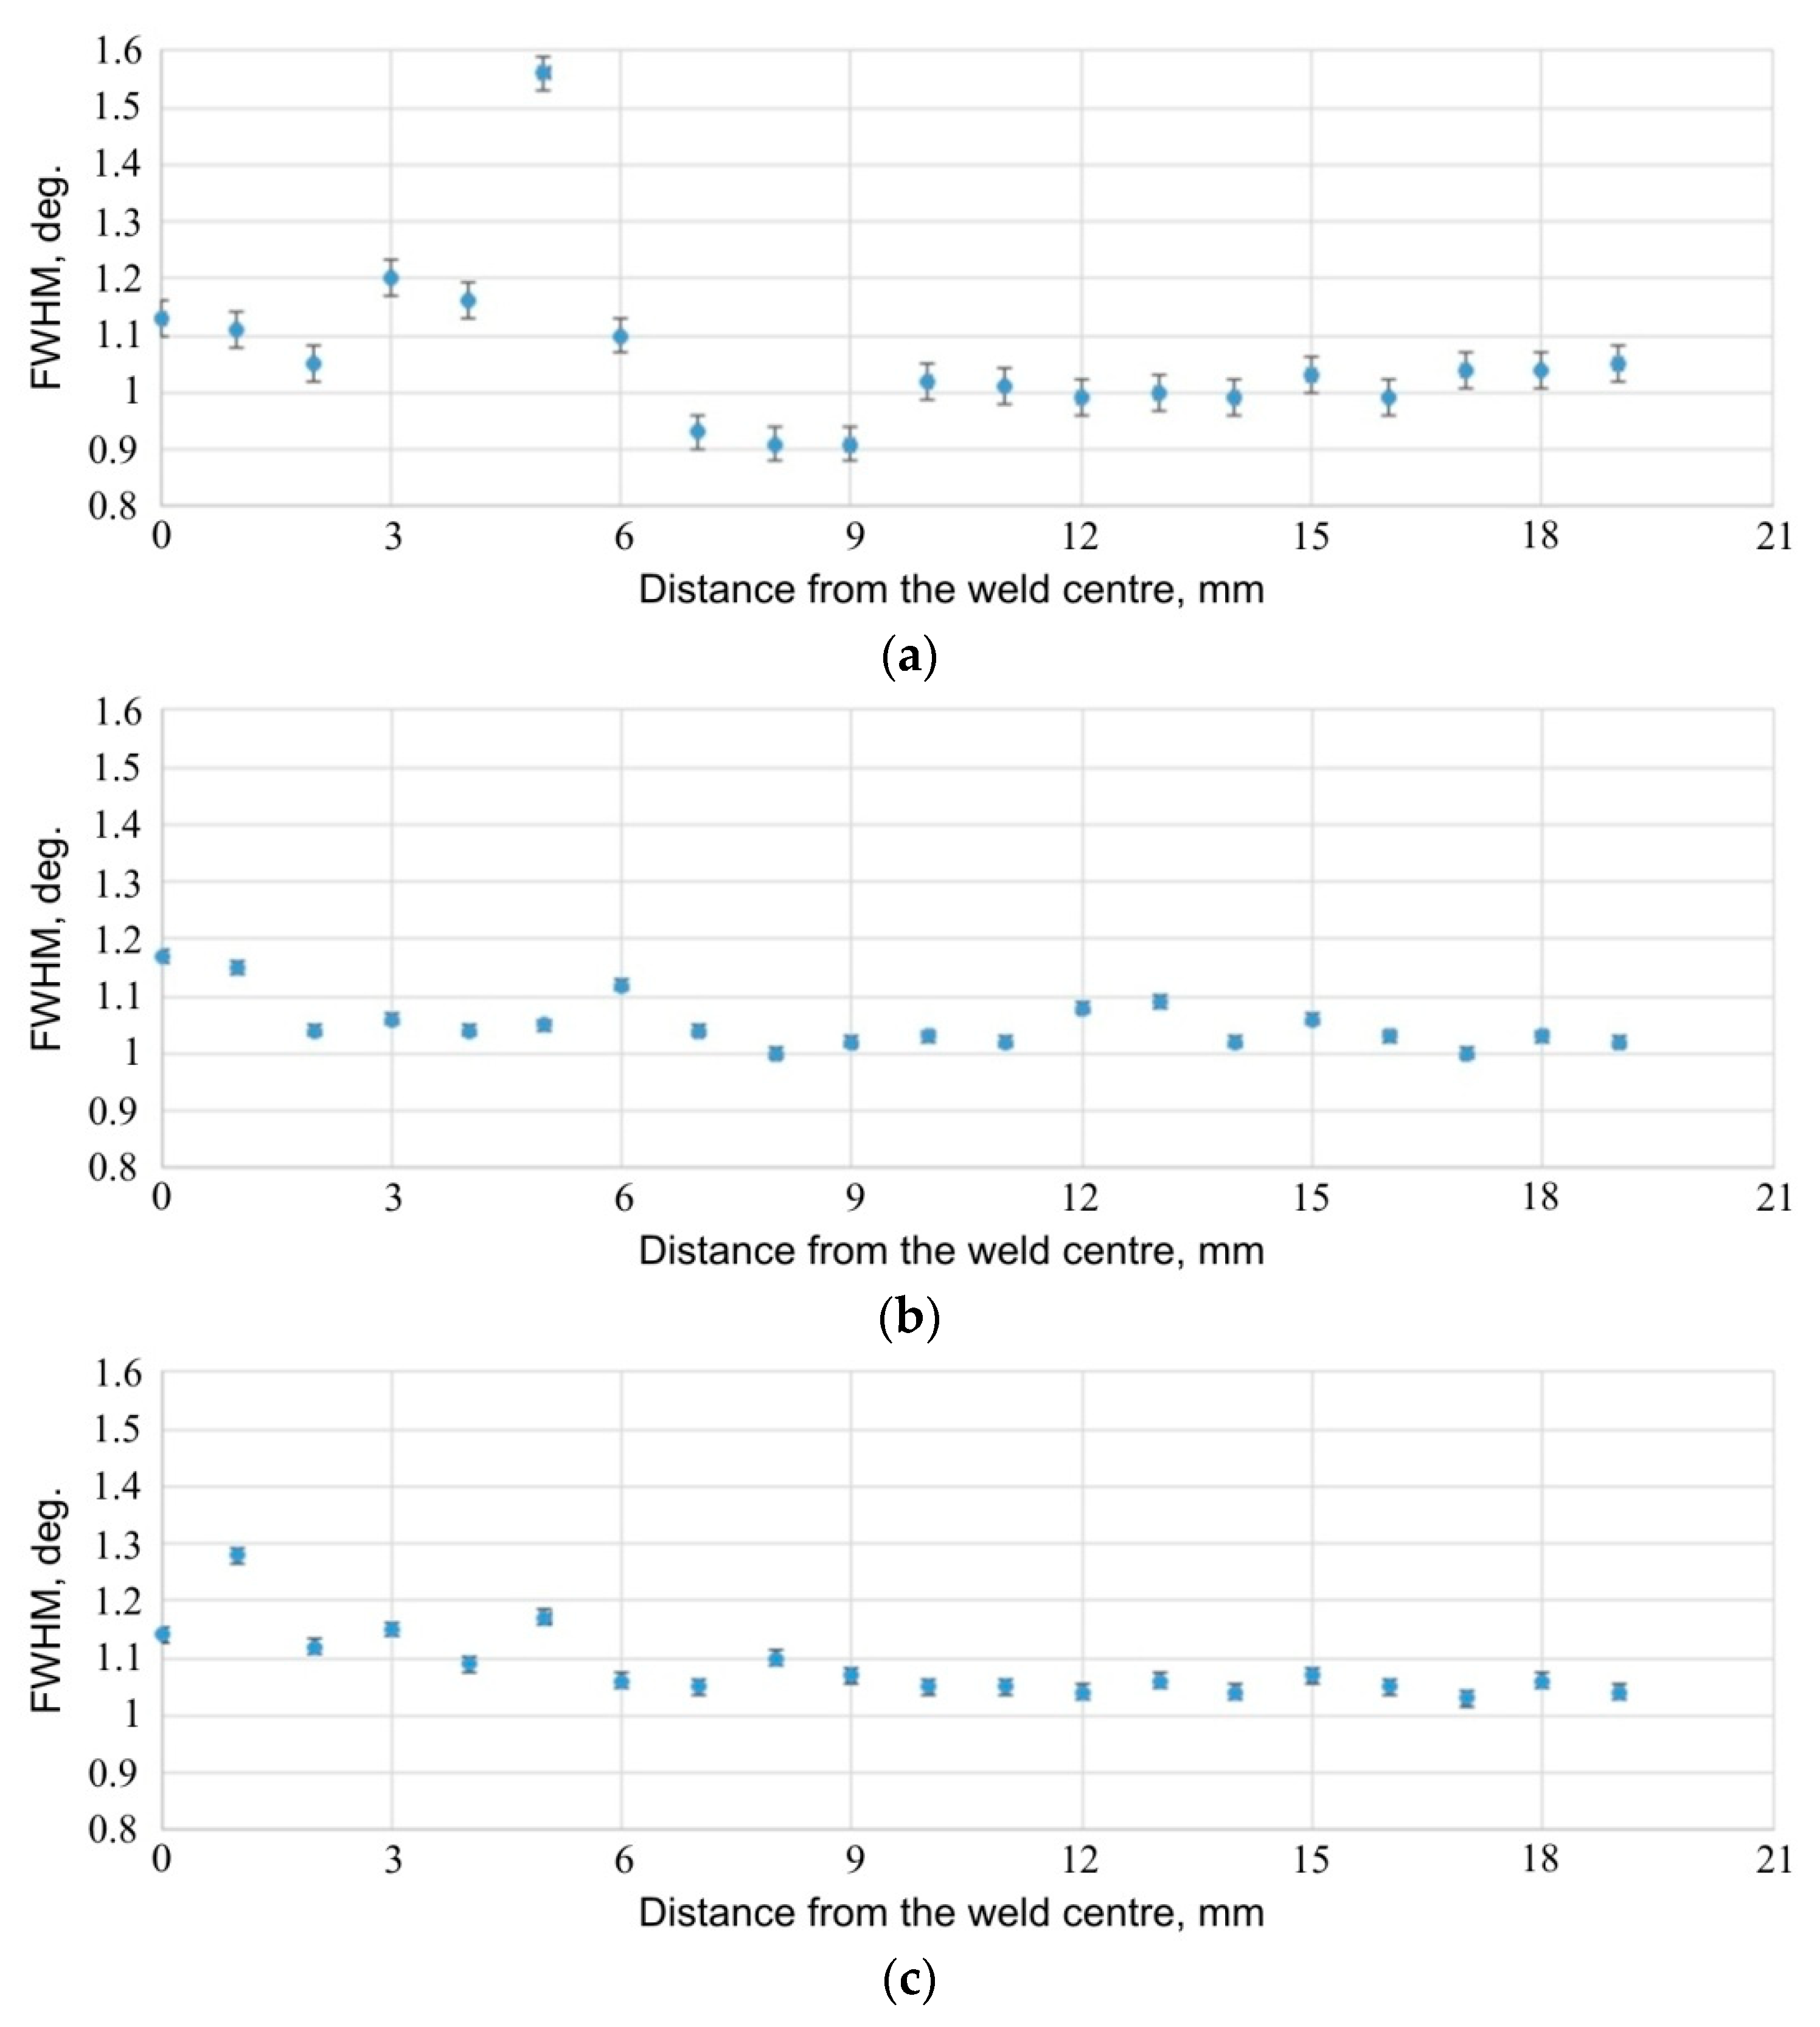
3.6. Analysis of Residual Stress Values with X-ray Diffraction
4. Conclusions
- The sample produced at the tool rotational speed n = 2400 rpm and duration of welding t = 3.5 s had the highest load capacity. The results of the tensile shear test revealed tensile fracture mode for this specimen.
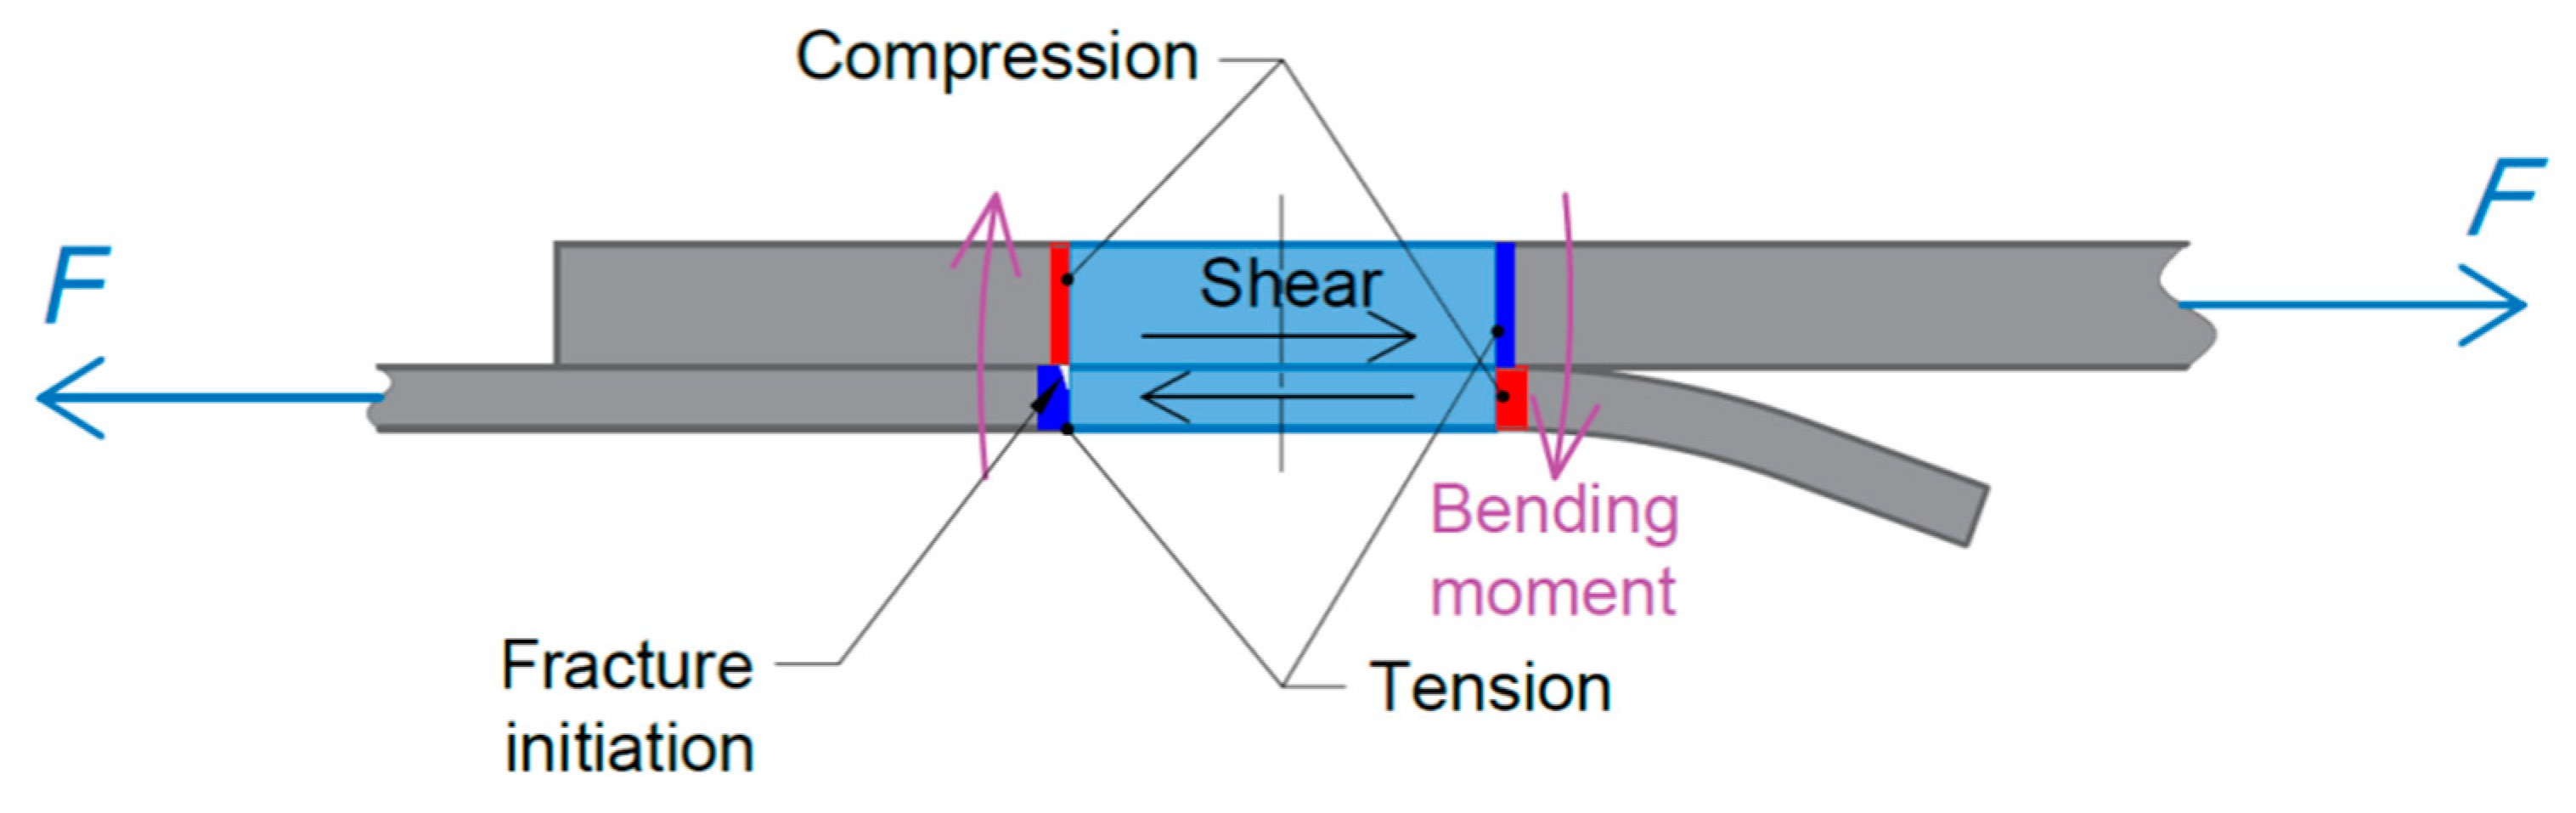
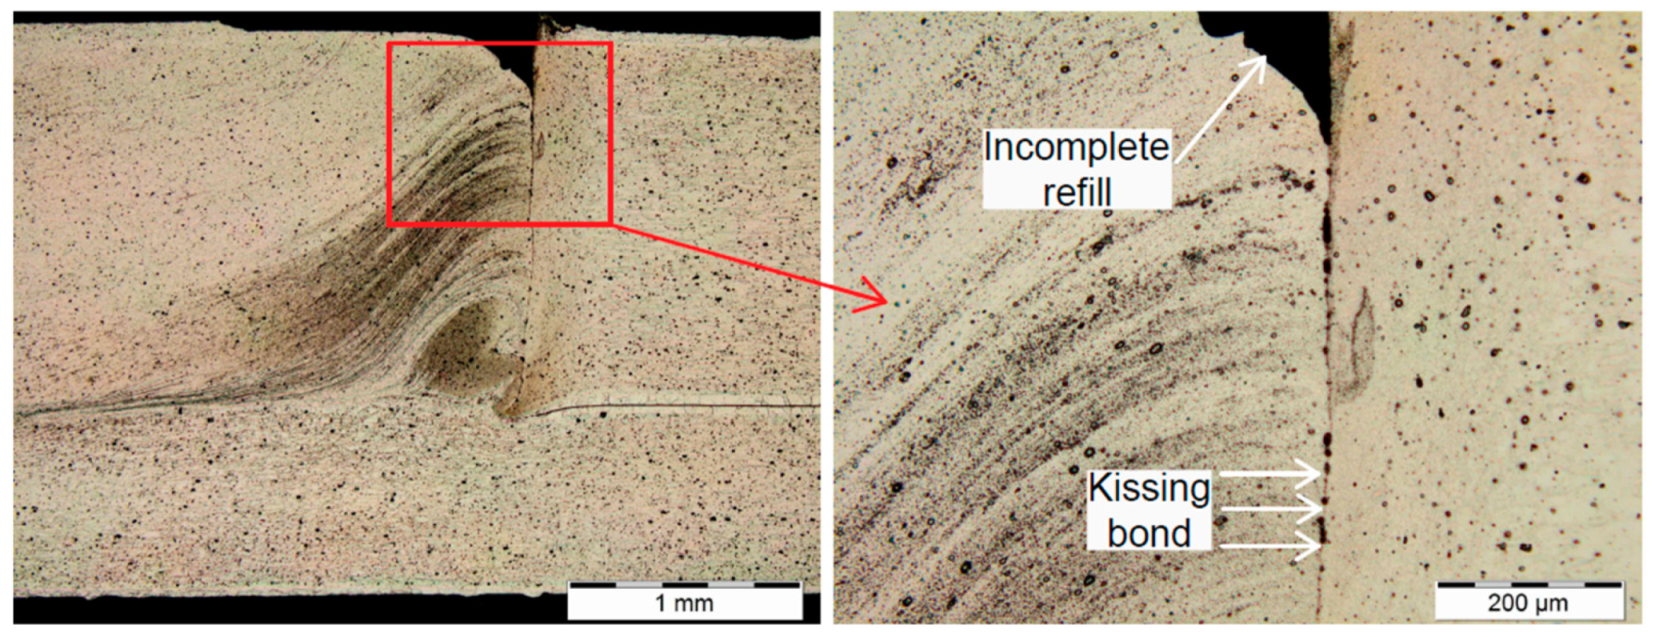
- As a result of insufficient plasticisation of the materials beeing joined during the RFSSW process with the parameters n = 2000 rpm and t = 2.5 s, a joint was produced, which showed the shear fracture mode. Microstructural analysis showed a fine-grained structure in the area of operation of the pin; however, the peripheral zone of the weld was subjected to less heat, which was associated with a weakening of the joint. The fracture initiated in this zone.
- Destruction of the weld through plug-type fracture mode is a weld defect associated with a weakened or insufficient mixing of material near the circumference of the weld in the upper sheet.
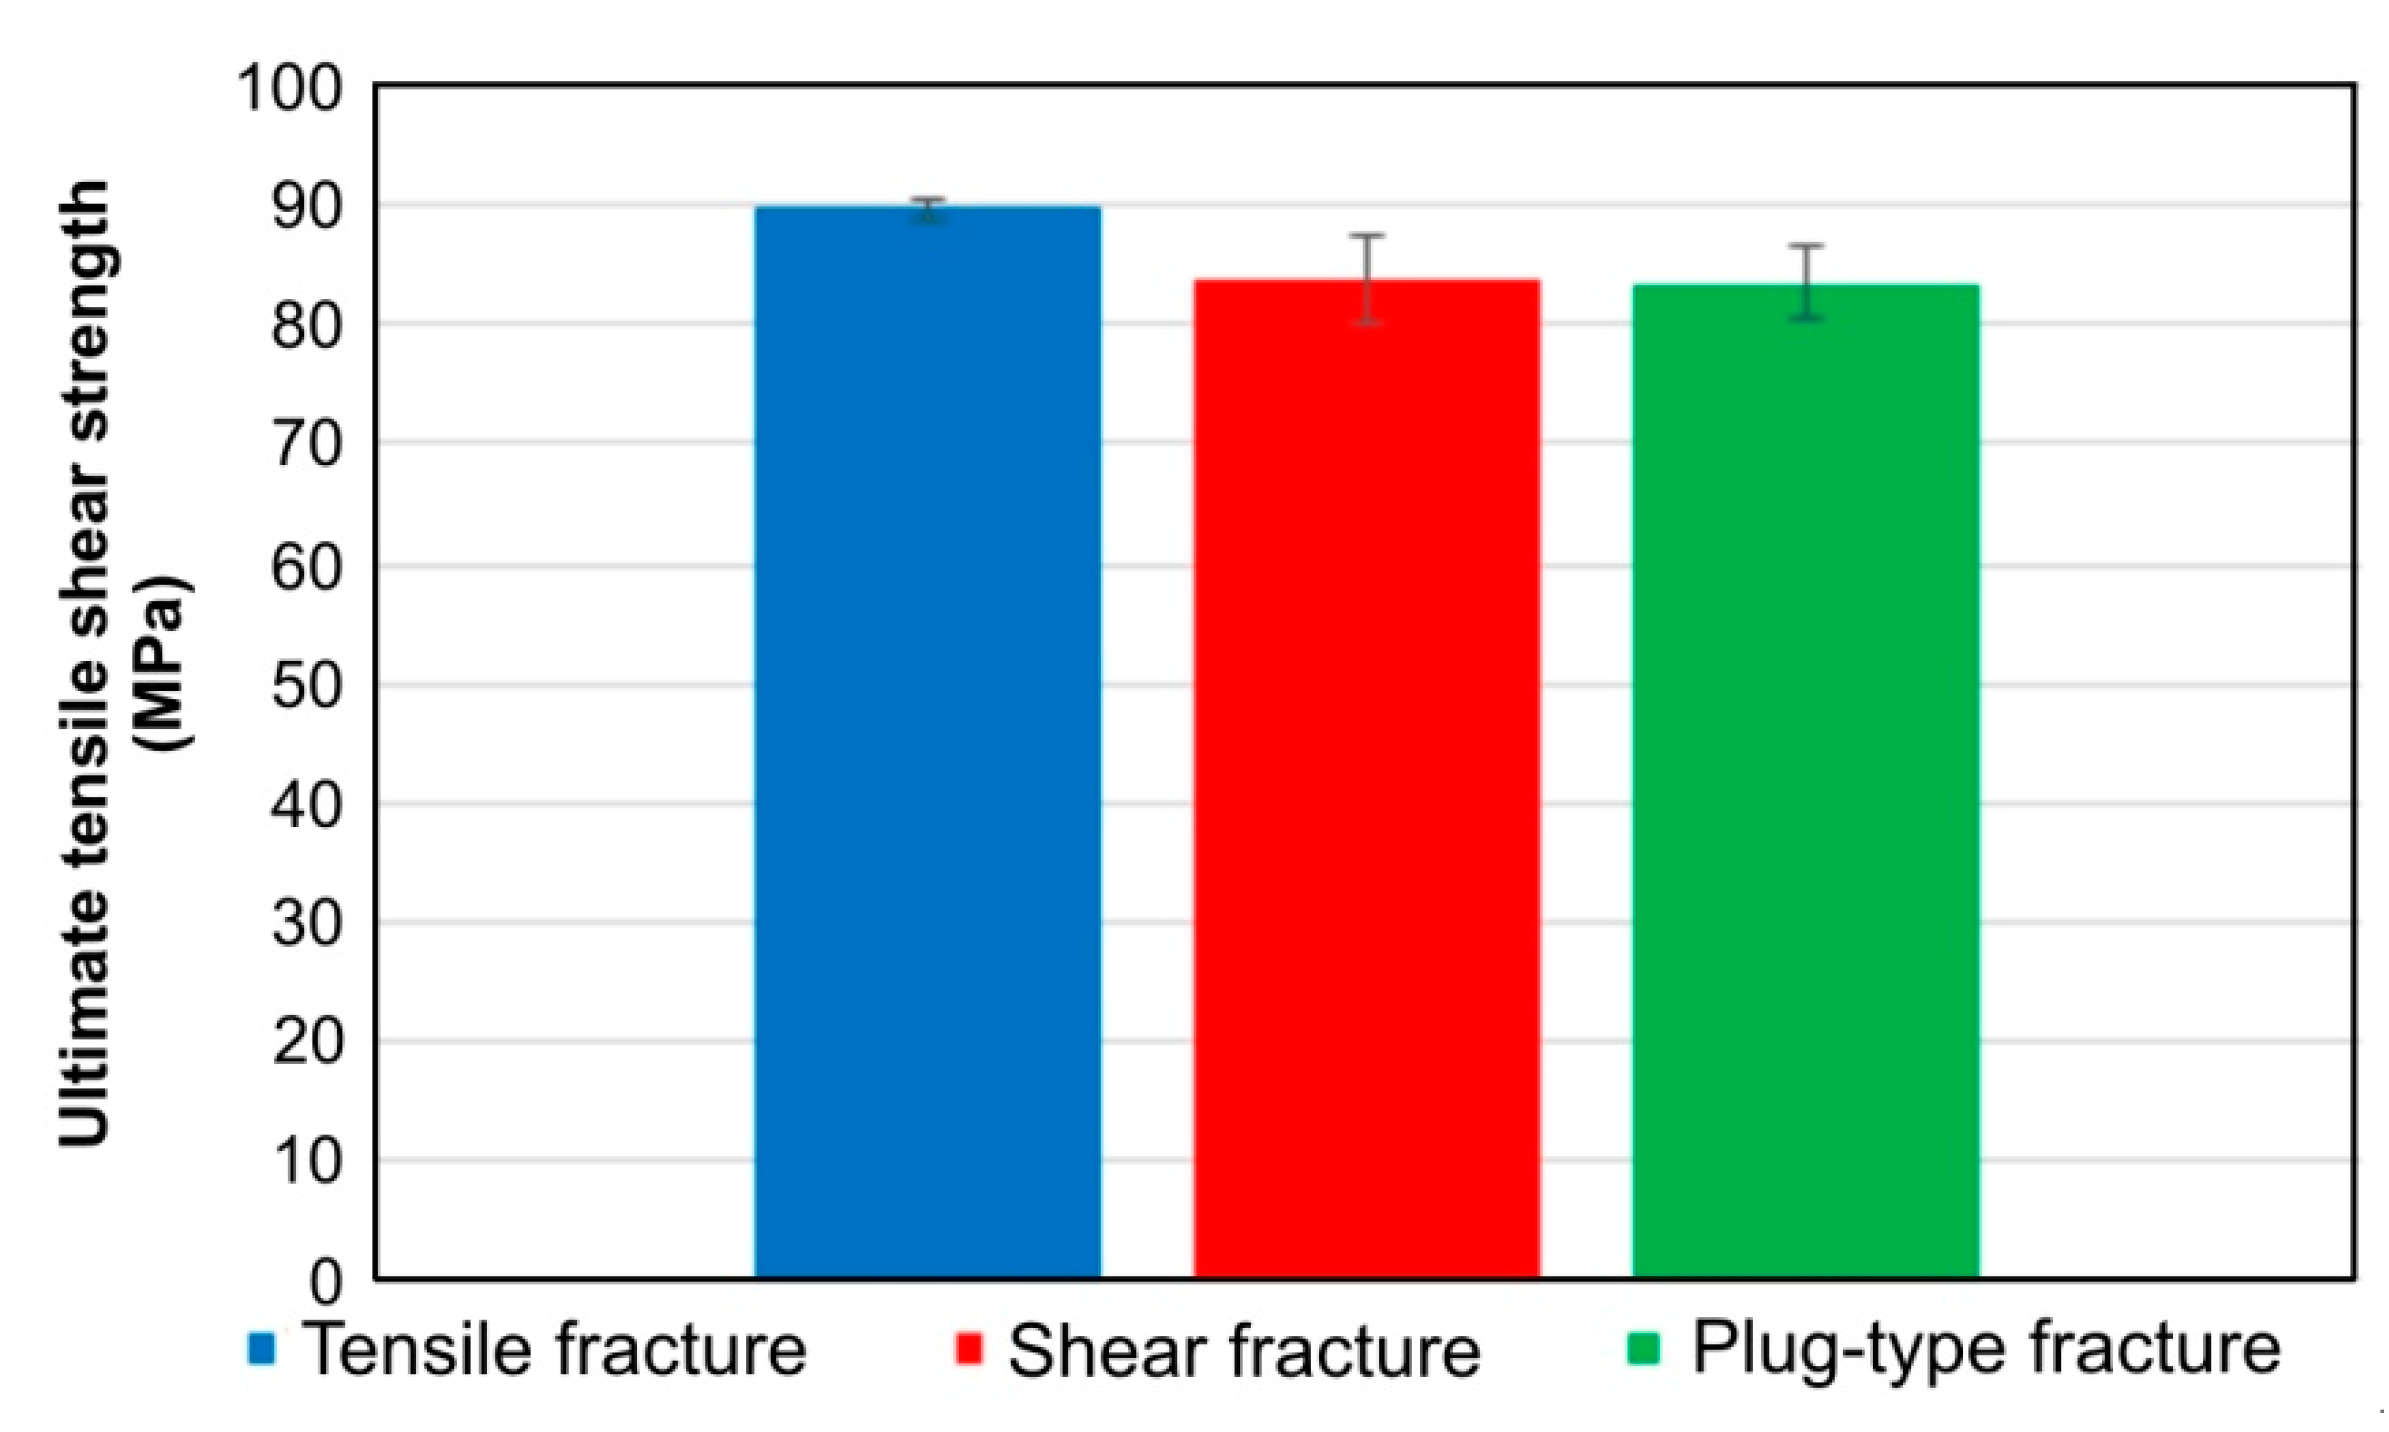
- The samples that were damaged due to the tensile fracture of the lower sheet were showed load capacity of 5.76 KN. The average value of load capacity for the shear fracture failure mechanism was 5.24 kN. The average value of the load capacity for plug-type fracture mode was 5.02 kN.
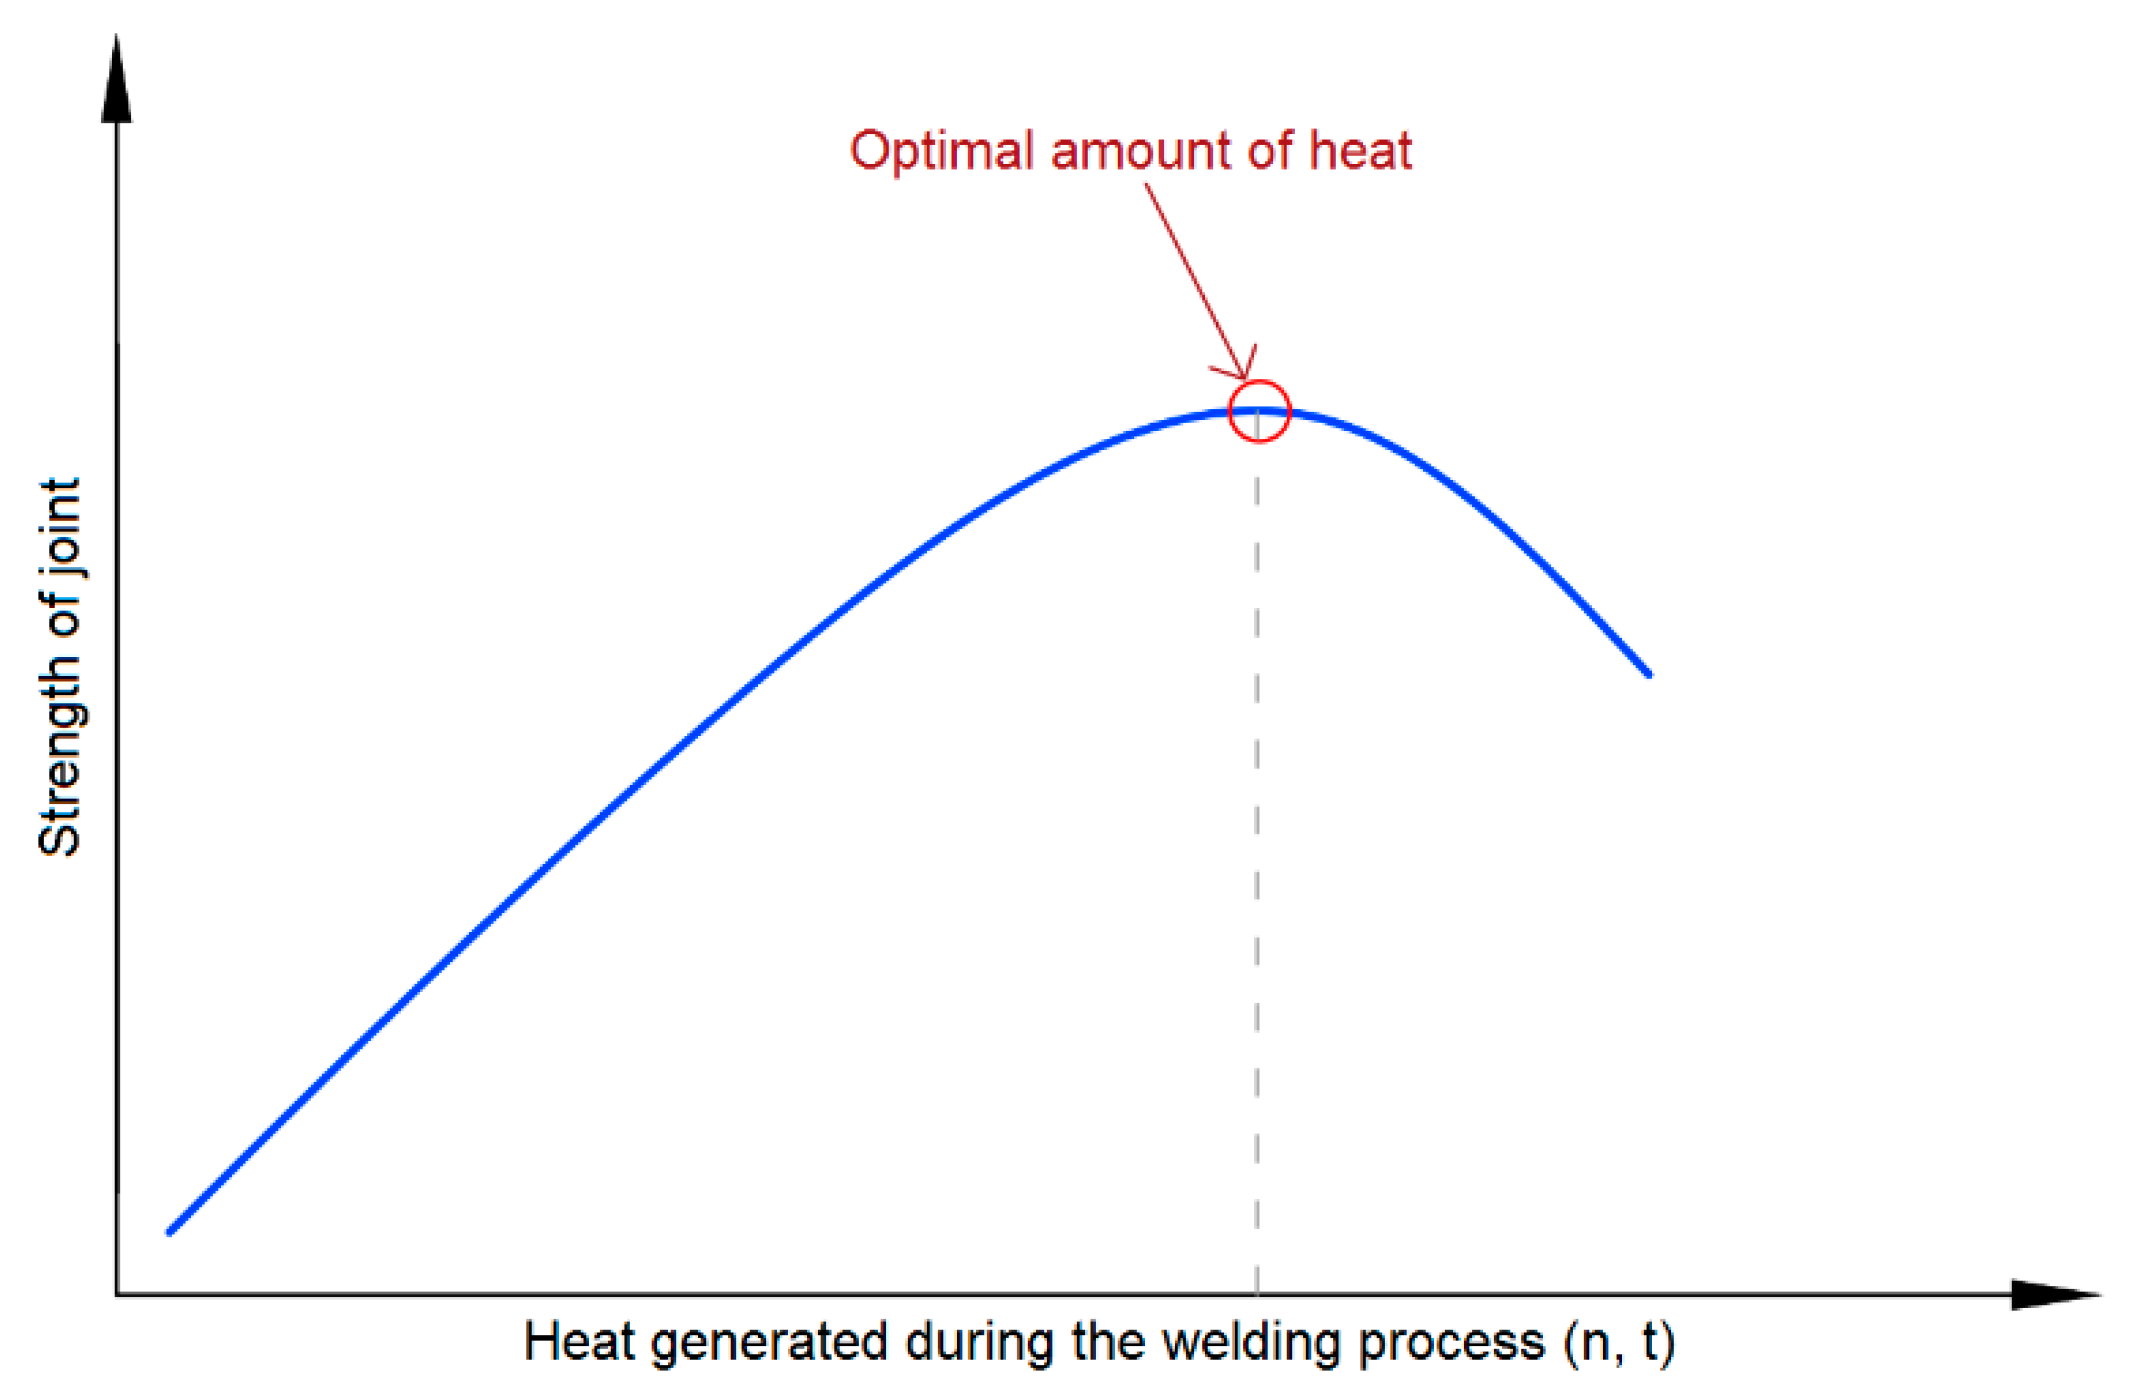
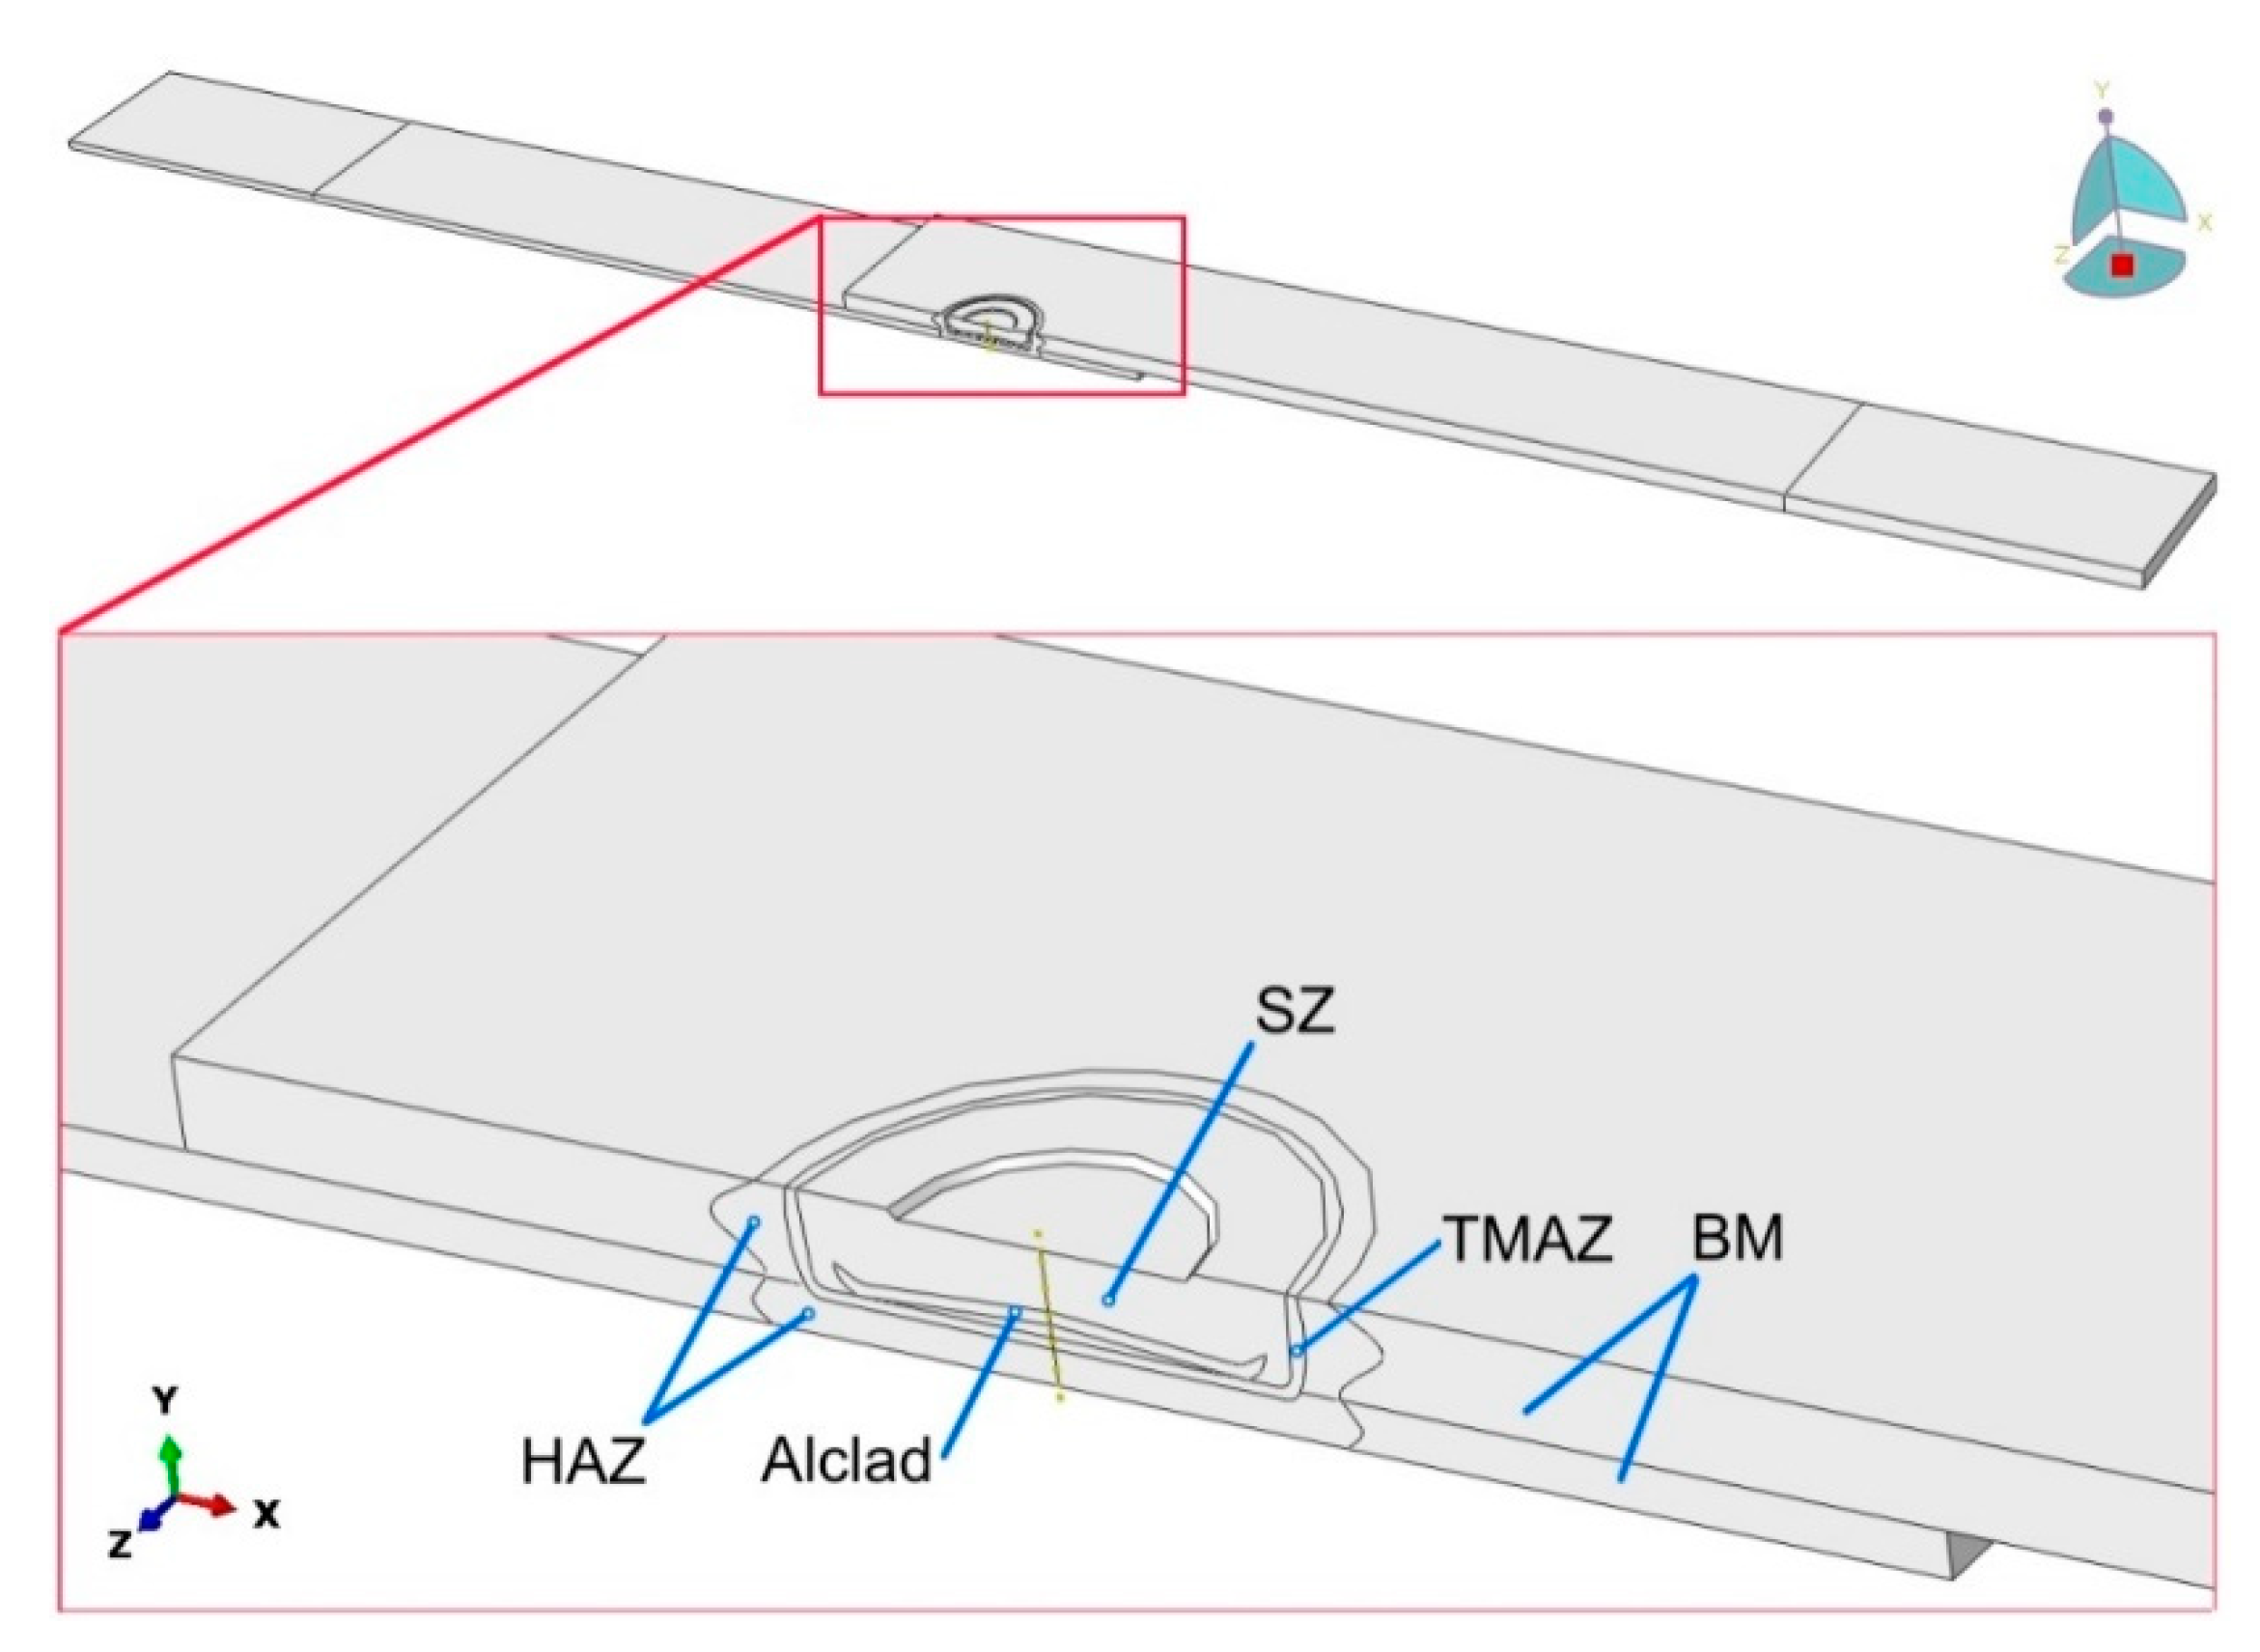
- The highest values of (i) tool rotation speed as well as (ii) welding time that were considered lead to the generation of an excessive amount of heat in the joining process, which in turn led to a significant expansion of the HAZ in both upper and lower sheets.
- It was found that there is an optimal amount of heat generated, which is necessary to produce the correct joint in terms of its load capacity. Excessive overheating of the joint leads to a weakening of the BM and thus a reduction in the strength of the joint.
- The processes taking place during thermo-mechanical joint formation change the value of the modulus of elasticity and the hardness of the weld nugget in relation to the BM.
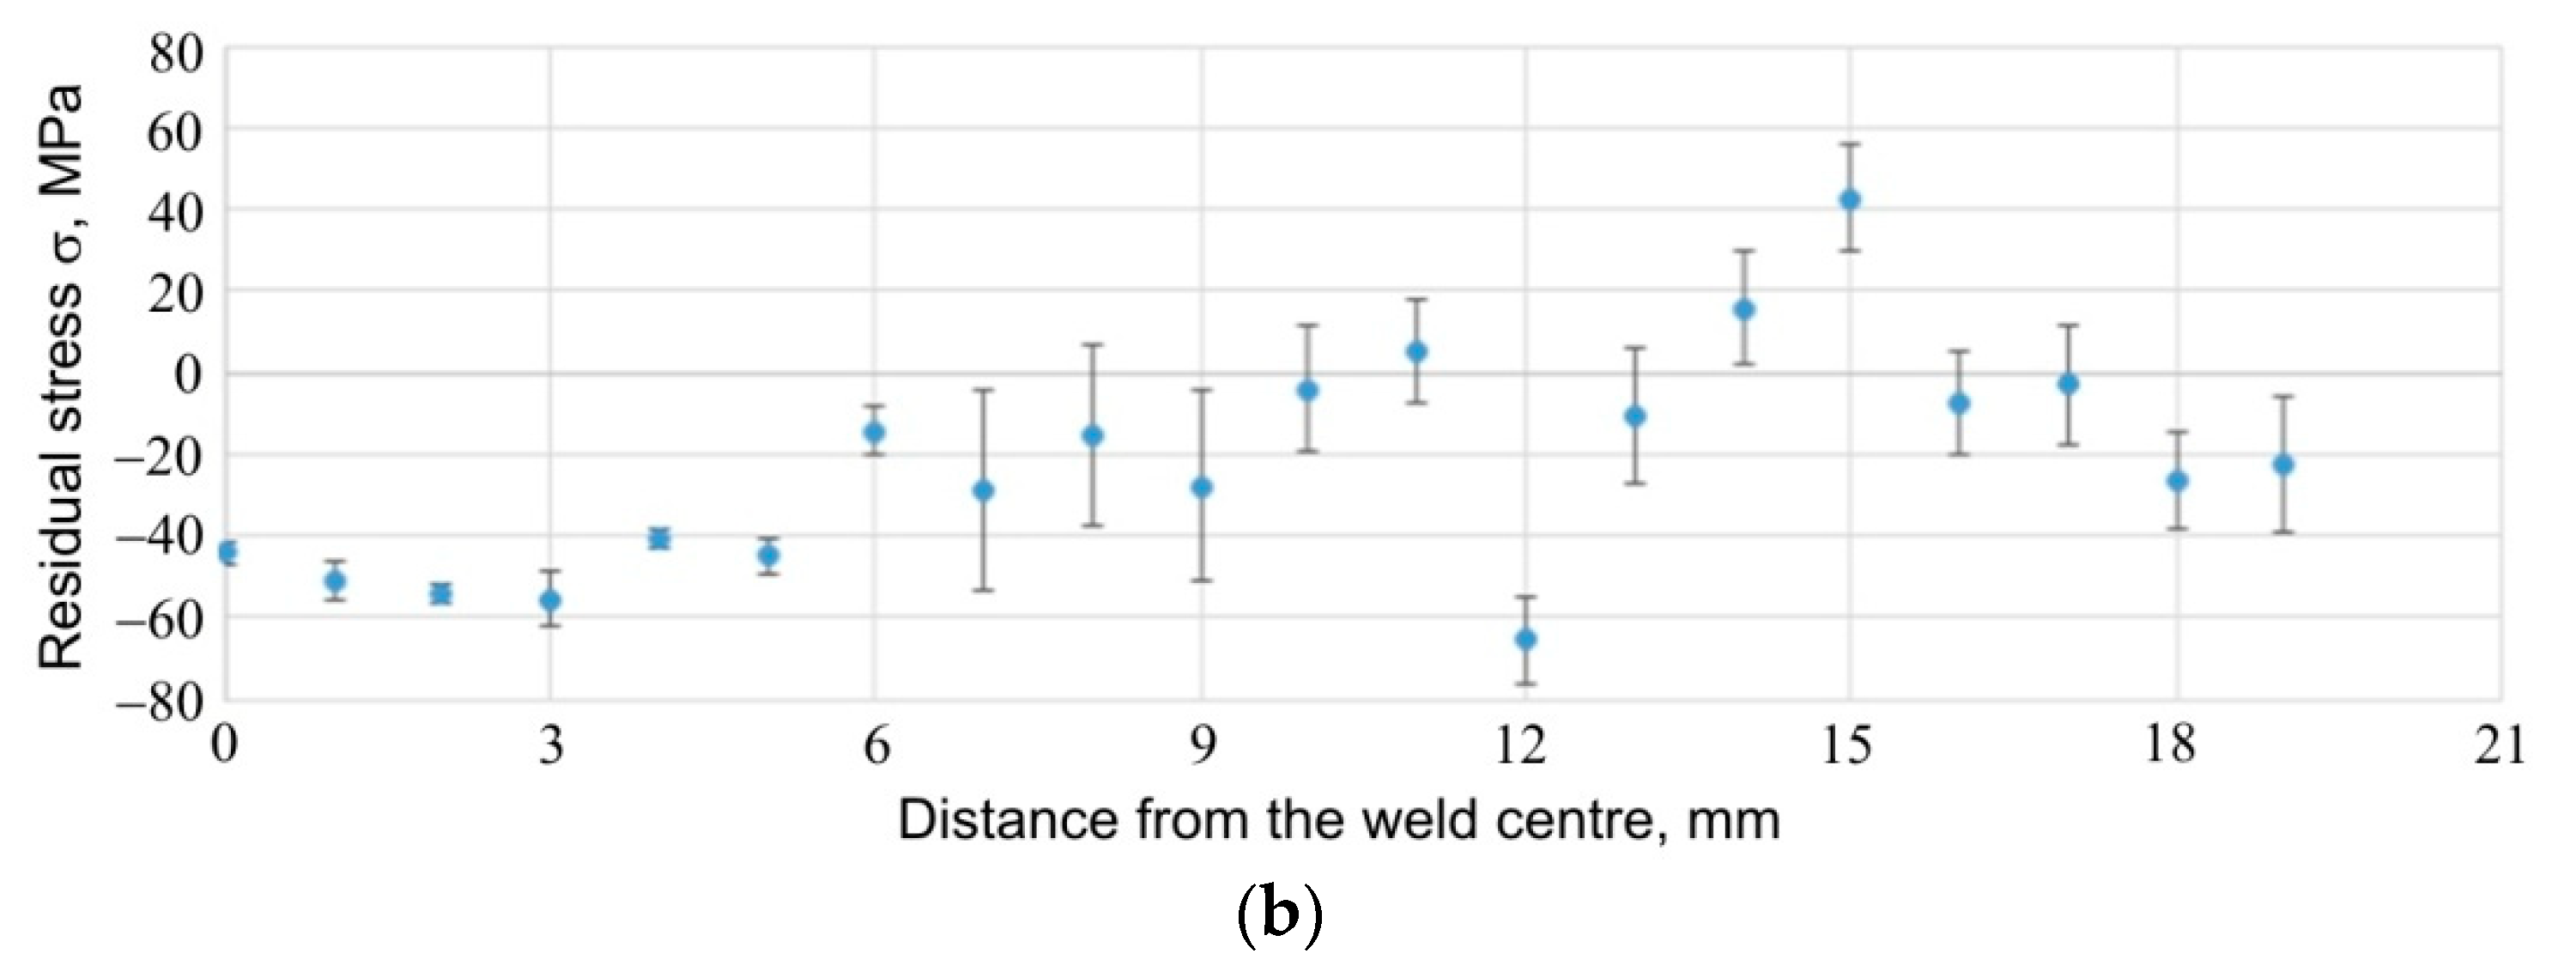
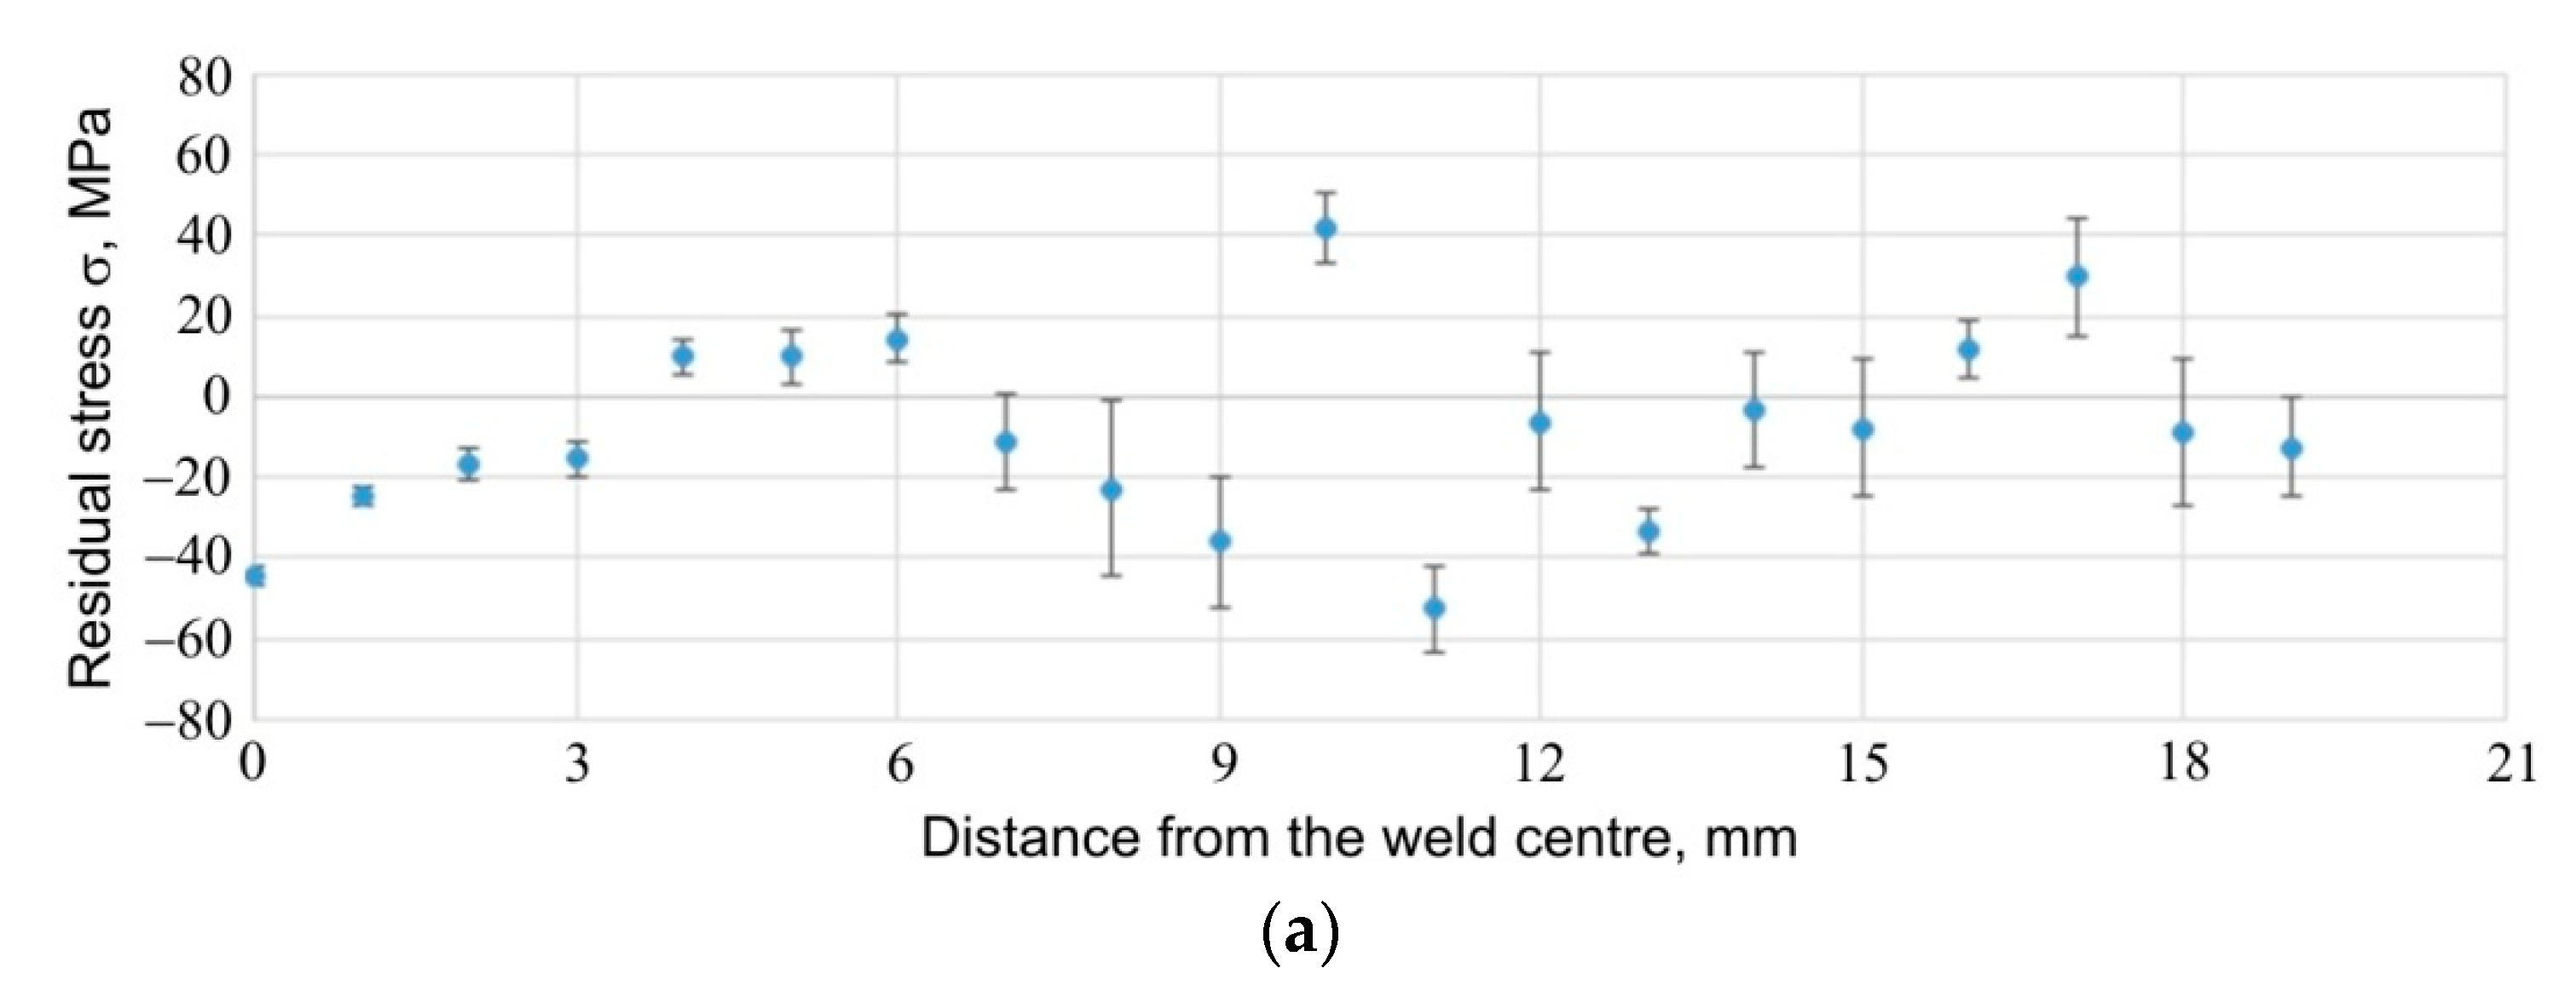
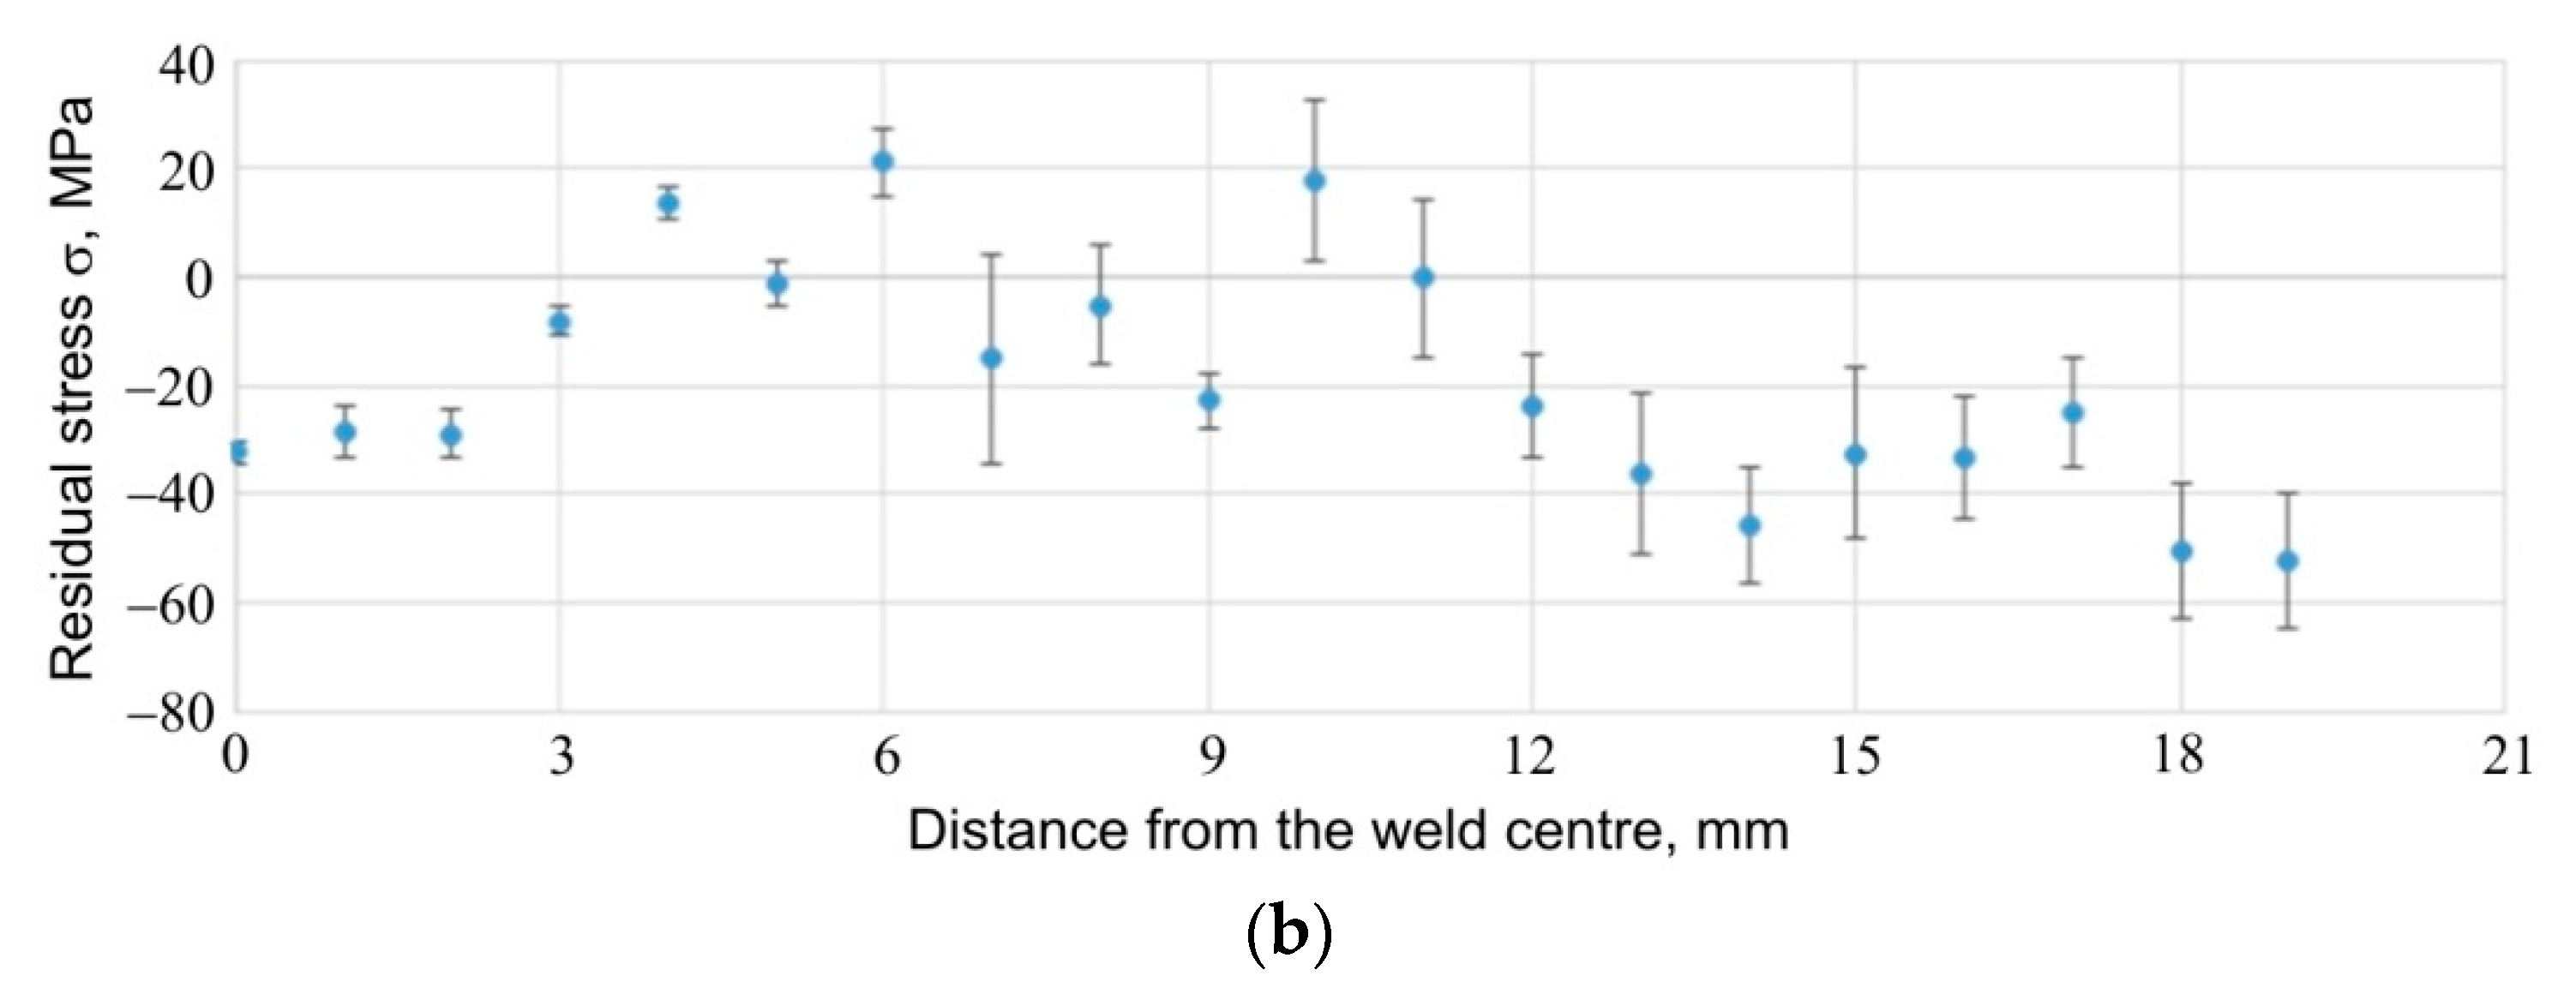
- Measurements of residual stresses along the axis specimens showed the presence of stresses with a certain constant value for the welded area on the side of the 1.6 mm thick plate. In the case of thinner sheet (0.8 mm), the stress value relaxed at a distance of about 3 mm from the centre of the weld. Precise determination of the stress values in the plate’s base material was disabled by the relatively coarse grain size of the material.
- For each specimen, for each plate and for each stress direction tested, the stress values are similar and range from about −60 MPa to about 40 MPa.
- In the case of stresses in the radial direction, for both the thicker and the thinner sheets, the stress values in the central area of the weld are similar, being compressive and approx. −40 MPa.
- It is worth considering more in-depth diffraction studies to determine the full stress tensor and to determine von Mises stress values to make the comparison with numerical modelling possible.
Author Contributions
Funding
Institutional Review Board Statement
Informed Consent Statement
Data Availability Statement
Conflicts of Interest
References
- Kubit, A.; Trzepiecinski, T.; Święch, Ł.; Faes, K.; Slota, J. Experimental and Numerical Investigations of Thin-Walled Stringer-Stiffened Panels Welded with RFSSW Technology under Uniaxial Compression. Materials 2019, 12, 1785. [Google Scholar] [CrossRef] [Green Version]
- Slota, J.; Jurcisin, M.; Spisak, E. Experimental and numerical analysis of local mechanical properties of drawn part. Key Eng. Mater. 2014, 586, 245–248. [Google Scholar] [CrossRef]
- Mehta, K.P.; Badheka, V.J. A review on dissimilar friction stir welding of copper to aluminum: Process, properties, and variants. Mater. Manuf. Process. 2016, 31, 233–254. [Google Scholar] [CrossRef]
- Schilling, C.; Dos Santos, J. Method and Device for Linking at Least Two Adjoining Work Pieces by Friction Welding. U.S. Patent 6,722,556, 20 April 2004. [Google Scholar]
- Sokoluk, M.; Cao, C.; Pan, S.; Li, X. Nanoparticle-enabled phase control for arc welding of unweldable aluminum alloy 7075. Nat. Commun. 2019, 10, 98. [Google Scholar] [CrossRef] [Green Version]
- Thomas, W.M.; Nicholas, E.D.; Needham, J.C.; Murch, M.G.; Templesmith, P.; Dawes, C.J. Friction Stir Butt Welding. International Patent Application No. PCT/GB92/02203; GB Patent Application No. 9125978.8, 6 December 1991. [Google Scholar]
- Balasubramaniam, G.L.; Boldsaikhan, E.; Fukuda, S.; Fujimoto, M.; Mamimuki, K. Effects of Refill Friction Stir Spot Weld Spacing and Edge Margin on Mechanical Properties of Multi-Spot-Welded Panels. J. Manuf. Mater. Process. 2020, 4, 55. [Google Scholar] [CrossRef]
- Schmal, C.; Meschut, G. Refill friction stir spot and resistance spot welding of aluminium joints with large total sheet thicknesses (III-1965-19). Weld. World 2020, 64, 1471–1480. [Google Scholar] [CrossRef]
- Mucha, J.; Kaščák, Ľ.; Witkowski, W. Research on the Influence of the AW 5754 Aluminum Alloy State Condition and Sheet Arrangements with AW 6082 Aluminum Alloy on the Forming Process and Strength of the ClinchRivet Joints. Materials 2021, 14, 2980. [Google Scholar] [CrossRef] [PubMed]
- Hoang, N.H.; Porcaro, R.; Langseth, M.; Hanssen, A.G. Self-piercing riveting connections using aluminium rivets. Int. J. Solids Struct. 2010, 47, 427–429. [Google Scholar] [CrossRef] [Green Version]
- Li, D.; Chrysanthou, A.; Patel, I.; Williams, G. Self-piercing riveting-a review. Int. J. Adv. Manuf. Technol. 2017, 92, 1777–1824. [Google Scholar] [CrossRef] [Green Version]
- Ang, H.Q. An Overview of Self-piercing Riveting Process with Focus on Joint Failures, Corrosion Issues and Optimisation Techniques. Chin. J. Mech. Eng. 2021, 34. [Google Scholar] [CrossRef]
- Haque, R. Quality of self-piercing riveting (SPR) joints from cross-sectional perspective: A review. Arch. Civ. Mech. Eng. 2018, 18, 83–93. [Google Scholar] [CrossRef]
- Al-Zubaidy, B.M.M. Material Interactions in a Novel Refill Friction Stir Spot Welding Approach to Joining Al-Al and Al-Mg Automotive Sheets. Ph.D. Thesis, University of Menchester, Menchester, UK, 2016. [Google Scholar]
- Schmal, C.; Meschut, G.; Buhl, N. Joining of high strength aluminum alloys by refill friction stir spot welding (III-1854-18). Weld. World 2019, 63, 541–550. [Google Scholar] [CrossRef]
- Nadan, R.; Roy, G.G.; Lienert, T.J.; Debroy, T. Three-dimensional heat and material flow during friction stir welding of mild steel. Acta. Mater. 2007, 55, 883–895. [Google Scholar] [CrossRef]
- Uematsu, Y.; Tokaji, K.; Tozaki, Y.; Kurita, T.; Murata, S. Effect of re-filling probe hole on tensile failure and fatigue behaviour of friction stir spot welded joints in Al–Mg–Si alloy. Int. J. Fatigue 2008, 30, 1956–1966. [Google Scholar] [CrossRef]
- Zhao, Y.Q.; Liu, H.J.; Chen, S.X.; Lin, Z.; Hou, J.C. Effects of sleeve plunge depth on microstructures and mechanical properties of friction spot welded alclad 7B04-T74 aluminum alloy. Mater. Des. 2014, 62, 40–46. [Google Scholar] [CrossRef]
- Okada, H.; Kamimuki, K.; Fujimoto, M. Assembly Study of Refill FSSW. SAE Int. J. Aerosp. 2013, 6, 299–304. [Google Scholar] [CrossRef]
- Boldsaikhan, E.; Fukuda, S.; Fujimoto, M.; Kamimuki, K.; Okada, H.; Duncan, B. Refill Friction Stir Spot Joining for Aerospace Aluminum Alloys. In Friction Stir Welding and Processing IX. The Minerals, Metals & Materials Series; Hovanski, Y., Mishra, R., Sato, Y., Upadhyay, P., Yan, D., Eds.; Springer: Cham, Switzerland, 2017; pp. 237–246. [Google Scholar]
- Rosendo, T.; Parra, B.; Tier, M.A.D. Mechanical and microstructural investigation of friction spot welded AA6181-T4 aluminium alloy. Mater. Des. 2011, 32, 1094–1100. [Google Scholar] [CrossRef]
- Suhuddin, U.; Fischer, V.; Kroeff, F. Microstructure and mechanical properties of friction spot welds of dissimilar AA5754 Al and AZ31 Mg alloy. Mater. Sci. Eng. A 2014, 590, 384–389. [Google Scholar] [CrossRef] [Green Version]
- Kluz, R.; Kubit, A.; Trzepiecinski, T.; Faes, K.; Bochnowski, W. A Weighting Grade-Based Optimization Method for Determining Refill Friction Stir Spot Welding Process Parameters. J. Mater. Eng. Perform. 2019, 28, 6471–6482. [Google Scholar] [CrossRef] [Green Version]
- Kubit, A.; Trzepiecinski, T.; Bochnowski, W.; Drabczyk, M.; Faes, K. Analysis of the mechanism of fatigue failure of the Refill Friction Stir Spot Welded overlap joints. Arch. Civ. Mech. Eng. 2019, 19, 1419–1430. [Google Scholar] [CrossRef]
- Maruschak, P.O.; Panin, S.V.; Stachowicz, F.; Danyliuk, I.M.; Vlasov, I.V.; Bischak, R.T. Structural levels of fatigue failure and damage estimation in 17Mn1Si steel on the basis of a multilevel approach of physical mesomechanics. Acta Mech. 2016, 227, 151–157. [Google Scholar] [CrossRef]
- Konovalov, S.V.; Ivanov, Y.E.; Stolboushkina, O.A.; Gromov, V.E. Dislocation Substructure Gradient Formation in Aluminumby Creep under Weak Potential. Arab. J. Sci. Eng. 2011, 36, 649–653. [Google Scholar] [CrossRef]
- ISO 6892-1:2016—Metallic Materials—Tensile Testing—Part 1: Method of Test at Room Temperature; International Organization for Standardization: Geneva, Switzerland, 2016.
- EN ISO 14273. Specimen Dimensions and Procedure for Shear Testing Resistance Spot, Seam and Embossed Projection Welds; International Organization for Standardization: Geneva, Switzerland, 2000. [Google Scholar]
- Rajakumar, S.; Balasubramanian, V. Correlation between weld nugget grain size, weld nugget hardness and tensile strength of friction stir welded commercial grade aluminium alloy joints. Mater. Des. 2012, 34, 242–251. [Google Scholar] [CrossRef]
- Chen, J.; Fujii, H.; Sun, Y.; Morisada, Y.; Kondoh, K.; Hashimoto, K. Effect of grain size on the microstructure and mechanical properties of friction stir welded non-combustive magnesium alloys. Mater. Sci. Eng. A 2012, 549, 176–184. [Google Scholar] [CrossRef]
- Kubit, A.; Trzepiecinski, T.; Faes, K.; Drabczyk, M.; Bochnowski, W.; Korzeniowski, M. Analysis of the effect of structural defects on the fatigue strength of RFSSW joints using C-scan scanning acoustic microscopy and SEM. Fatigue Fract. Eng. Mater. Struct. 2009, 42, 1308–1321. [Google Scholar] [CrossRef]
- Reddy, C. Evaluation of mechanical behavior of Al-alloy/Al2O3 metal matrix composites with respect to their constituents using taguchi technique. Int. J. Emerg. Technol Appl. Eng. Technol. Sci. 2011, 4, 26–32. [Google Scholar]
- Torabi, A.R.; Berto, F.; Razavi, S.M.J. Tensile failure prediction of U-notched plates under moderate-scale and large-scale yielding regimes. Theor. Appl. Fract. Mech. 2018, 97, 434–439. [Google Scholar] [CrossRef] [Green Version]
- Cahoon, J.R.; Broughton, W.H.; Kutzak, A.R. The determination of yield strength from hardness measurements. Metall. Trans. 1971, 2, 1979–1983. [Google Scholar]
- Noyan, I.C.; Cohen, J.B. Residual Stress: Measurement by Diffraction and Interpretation; Springer: New York, NY, USA, 2013. [Google Scholar]
- Fitzpatrick, M.E.; Fry, A.T.; Holdway, P.; Kandil, F.A.; Shackleton, J.; Suominen, L. Determination of residual stresses by X-ray diffraction. National Physical Laboratory. September 2005. Available online: http://www.npl.co.uk/publications/determination-of-residual-stresses-by-x-ray-diffraction (accessed on 4 June 2018).
- Standard EN 15305:2008: Non-Destructive Testing—Test Method for Residual Stress Analysis by X-ray Diffraction; European Committee for Standardization: Brussels, Belgium, 2008.
- XSTRESS 3000 X-ray Stress Analyzer. Software User’s Guide X3000 V. 1.22d; Stresstech Ou: Jyväskylä, Finland, 2007. [Google Scholar]
- Mazzaferro, J.A.E.; Rosendo, T.D.S.; Mazzaferro, C.C.P.; Ramos, F.D.; Tier, M.A.D.; Strohaecker, T.R.; Dos Santos, J.F. Preliminary Study on the Mechanical Behavior of Friction Spot Welds. Soldagem Inspeção 2009, 14, 238–247. [Google Scholar] [CrossRef] [Green Version]
- Rosendo, T.; Tier, M.; Mazzaferro, J.; Mazzaferro, C.; Strohaecker, T.R.; dos Santos, J.F. Mechanical performance of AA6181 refill friction spot welds under Lap shear tensile loading. Fatigue Fract. Eng. Mater. Struct. 2015, 38, 1443–1455. [Google Scholar] [CrossRef]
- Haque, R.; Wong, Y.C.; Paradowska, A.; Durandet, Y. Residual stress profiles in riveted joints of steel sheets. Sci. Technol. Weld. Join. 2014, 20, 199–207. [Google Scholar] [CrossRef]


| Rp0,2 (MPa) | Rm (MPa) | A50 (%) | K (MPa) | n | E, GPa |
|---|---|---|---|---|---|
| 413.7 | 482.6 | 7 | 610.9 | 0.045 | 70.836 |
| Number of Experiment | Tool Rotational Speed n (rpm) | Duration of Welding t (min) |
|---|---|---|
| E1 | 2800 | 3.5 |
| E2 | 2400 | 3.5 |
| E3 | 2000 | 2.5 |
| E4 | 1800 | 1.5 |
| E5 | 2200 | 2.5 |
| E6 | 2800 | 1.5 |
| Zone | Young’s Modulus E, GPa | HV0.1 | Yield Stress σy, MPa |
|---|---|---|---|
| SZ | 89.937 | 212.3 | 452.4 |
| TMAZ | 89.235 | 206.0 | 446.6 |
| HAZ | 89.974 | 195.1 | 436.7 |
Publisher’s Note: MDPI stays neutral with regard to jurisdictional claims in published maps and institutional affiliations. |
© 2021 by the authors. Licensee MDPI, Basel, Switzerland. This article is an open access article distributed under the terms and conditions of the Creative Commons Attribution (CC BY) license (https://creativecommons.org/licenses/by/4.0/).
Share and Cite
Kubit, A.; Trzepieciński, T.; Gadalińska, E.; Slota, J.; Bochnowski, W. Investigation into the Effect of RFSSW Parameters on Tensile Shear Fracture Load of 7075-T6 Alclad Aluminium Alloy Joints. Materials 2021, 14, 3397. https://doi.org/10.3390/ma14123397
Kubit A, Trzepieciński T, Gadalińska E, Slota J, Bochnowski W. Investigation into the Effect of RFSSW Parameters on Tensile Shear Fracture Load of 7075-T6 Alclad Aluminium Alloy Joints. Materials. 2021; 14(12):3397. https://doi.org/10.3390/ma14123397
Chicago/Turabian StyleKubit, Andrzej, Tomasz Trzepieciński, Elżbieta Gadalińska, Ján Slota, and Wojciech Bochnowski. 2021. "Investigation into the Effect of RFSSW Parameters on Tensile Shear Fracture Load of 7075-T6 Alclad Aluminium Alloy Joints" Materials 14, no. 12: 3397. https://doi.org/10.3390/ma14123397