1. Introduction
Ceramic materials, including ceramic–ceramic composites, have many desirable characteristics such as a resistance to aggressive environmental conditions [
1,
2,
3,
4], high hardness, and resistance to brittle fracture [
5,
6,
7,
8]. Thanks to these properties, ceramic materials are of great interest to the chemical, electromechanical, or fuel and energy industries. These materials can operate under conditions where plastic or metal components cannot always be used. Based on the literature, there are many methods of molding ceramic materials [
9,
10,
11]. Among them are methods such as tape casting [
12,
13], gel casting [
14,
15], and slip casting [
16,
17] or stereolithography [
18]. However, note that it is the choice of method for fabricating fittings that determines the properties of the resulting product.
In this study, the slip casting method was used to form ceramic fittings. It is a technology of fabricating samples that consists of pouring a ceramic mass, i.e., a suspension of ceramic particles in water, characterized by a high solid phase content and low viscosity. In this method, a mass of appropriately selected composition is poured into porous gypsum molds, in which moisture is removed from the slurry by capillary forces, resulting in a finished product [
19]. The slip casting method makes it possible to obtain a product with complex shapes without using high pressures and temperatures. In addition, a ceramic slurry containing different grain sizes can be used in this technology. Furthermore, in slurries containing powder particles of a similar size there is no segregation of particles, which is a common problem when forming composites from loose masses. A significant advantage of slip casting is the low cost of the equipment used. Unfortunately, apart from the several advantages of this method, its disadvantage is that as the pores of gypsum molds become clogged with tiny particles of ceramic materials, the “suction force” of the mold decreases the period of durability of the mass and thus the quality of subsequent semi-finished products changes. Despite some inconveniences associated with slip casting, it is still quite commonly used to form various ceramic materials such as mulllite-ZrO
2 [
20,
21], SiC [
22], Si
3N
4 [
23], ZrO
2 [
24,
25], ZnO [
26], or Al
2O
3 [
27] composites, among others.
Note that new equipment and technologies are placing higher demand on technical ceramics. Therefore, the optimization of the composition of the individual components in ceramic samples based on experimental tests is still the subject of numerous research works. Several research works continue to be devoted to Al
2O
3, ZrO
2, and Al
2O
3/ZrO
2. Due to their favorable mechanical properties, these materials have become widespread in recent years and have acquired an almost infinite field of application. Selected examples include sliding components, machine parts, and tools. At the same time, due to the growing awareness of the effects of anthropogenic activities on the environment, increasing attention is being focused on environmental aspects [
28,
29]. As a consequence of the pro-environmental policies of the European Union, implemented as part of the economic transition towards the circular economy (CE) [
30] and the European Green Deal [
31], increasing restrictions are imposed on the industry in terms of permitted levels of emissions to air, water, and soil, as well as in terms of the amount of waste generated [
30,
31]. As a result, the drive to reduce the environmental footprint has become one of the critical challenges facing the industry [
32,
33].
This study focuses on the research dedicated to the fabrication and characterization of Al2O3/ZrO2 samples via slip casting. In the first stage of the study, thermogravimetric analysis was carried out to determine the temperatures at which complete thermal decomposition of the organic additives used during fabricating fittings occurs. Dilatometric tests were then carried out to determine coefficients of thermal expansion, which are of important practical significance. Note, here, that technical ceramics, including Al2O3, ZrO2, and Al2O3/ZrO2 composites, can all operate at high temperatures. A wide range of machine parts are made from this ceramic, including sliding elements, gaskets for heating nozzles, coil heaters, or elements for column heaters. Therefore, it is imperative to determine the changes in material volume due to temperature increases or decreases that play a crucial role in the operation of these devices. In the next stage of the study, the density of the sample was determined using the hydrostatic method. In order to determine the phase structure before and after the sintering process, an analysis was performed with an X-ray diffractometer. The microstructure of the samples was characterized based on microscopic observations made using a scanning electron microscope. Stereological methods were used to quantitatively characterize the microstructure of the fabricated samples, including a computer image analysis, to determine the effect of ZrO2 content on Al2O3 grain growth. The final stage of the research focused on determining the environmental impacts accompanying the process of forming ceramic elements. This research is original and has not yet been described in the literature for slip cast fabricated fittings. In addition, monitoring the environmental impact accompanying Al2O3 and ZrO2 fabrication of fittings creates the possibility of consciously developing new solutions, which are more environmentally friendly and require less energy. It is, therefore, a research area that is part of solving global problems facing humanity today.
The subject of this paper is Al2O3- and ZrO2-based ceramic materials. The research presented is interdisciplinary in nature, covering the field of the material’s engineering as well as its physic and environmental interactions. The study made it possible to assess the suitability of Al2O3-based materials with ZrO2 additives obtained via slip casting. The results obtained have made a significant contribution to the development of fundamental knowledge in the field of ceramic matrix composites.
2. Materials and Methods
Commercially available powders were used in the experiment: ZrO
2 stabilized with 3% mol Y
2O
3 (TZ-PX-245; from Tosoh Co. (Tokyo, Japan) with a particle size of 0.04 µm and Al
2O
3 (TM-DAR; from Tamei Chemicals (Tokyo, Japan) with a particle size of 0.12 ± 0.3 µm. The densities of both powders were measured using a helium pycnometer (Accu Pyc II 1340 by Micromeritics, Norcross, GA, USA) and were 5.89 g/cm
3 and 3.98 g/cm
3, respectively. A complete characterization of the powders used in the experiment is presented in the study [
34].
The slip casting method was used to mold the samples bodies. This method was chosen because of its ability to form elements of any geometry and the absence of toxic additives in the suspension used to fabricate the samples. Distilled water was used as a solvent for the preparation of the ceramic slurries. Diammonium hydrogen citrate (DAC, d.d.a. Sigma-Aldrich, St. Louis, MO, USA) and citric acid (CA, d.d.a. POCH Gliwice/Avantor Performance Materials Poland) were used as liquefiers. A 10% polyvinyl alcohol (PVA, St. Louis, MO, USA, Sigma-Aldrich) water-based solution was also used.
First, the dispersant, a composition of DAC and CA, was dissolved in an appropriate amount of distilled water. The PVA solution was then added. The amount of binder and dispersant added was selected experimentally for the individual slurries. In the next step, ceramic ZrO2 and Al2O3 powders were added. Four slurries with different ZrO2 volume contents (0%, 2.5%, 25%, 100%) were prepared during the study. Each prepared mass was subjected to mixing at 300 rpm for 1 h in a centrifugal Retsch (Haan, Germany) PM400 planetary mill in alumina containers. The slurry prepared in this way was vented at 2200 rpm for 11 min in a THINKY ARE-250 machine from Thinky Corporation (Tokyo, Japan). The vented mass was then poured into gypsum molds to form 16 mm × 8 mm cylinders in the raw state. The samples were then dried in a laboratory oven at 30 °C for 24 h. In the last step, the fabricated green bodies were sintered in a Nabertherm GmbH model HT 08/18 furnace equipped with superkanthal heaters in an air atmosphere according to the following program: temperature rise 2 °C/min to 1400 °C, holding for 2 h, cooling at 3 °C/min. Both powders have high sintering activity and can be sintered in relatively low temperature of 1400 °C. Thus, such temperature was selected for the sintering process.
Within the framework of the present work, four series of samples were made: Series I—0 vol.% of ZrO
2, Series II—2.5 vol.% of ZrO
2, Series III—25 vol.% of ZrO
2, and Series IV—100 vol.% of ZrO
2. The compositions of each series are shown in
Table 1.
Thermogravimetric analysis was carried out to investigate the phenomena occurring in the fabricated ceramic fittings as a function of temperature at the assumed temperature process. The scope of the study included measuring mass loss and thermal effects as a function of temperature using Netzsch’s TG 449 F1 Jupiter thermogravimetric analyzer. Measurements were carried out in alundum crucibles. The green samples crushed in an agate mortar were the samples for analysis. The weight of the test portions was ~30 mg. Such small amounts of weighting guarantee excellent signals. The analysis was carried out in a flow of synthetic air (80/20 mixture of nitrogen and oxygen). The flow was constant and set at the value of 70 mL/min. Measurements were carried out in the temperature range from 24 to 1400 °C with a heating rate of 10 °C/min. The heating rate is much higher than the heating rate during the sintering process, which is because the signals in the Differential Thermal Analysis—DTA curve are more pronounced under these measurement conditions.
In contrast, the small sample size means that even at this rate of temperature increase, the temperature distribution in the sample is uniform. Automatic recording of sample weight loss and thermal effects was carried out during the measurement. Before measuring the samples, a calibration measurement was carried out on the empty crucibles, which were later used for testing. The calibration measurement was carried out under the same conditions and according to the same temperature program as the actual measurements to remove signals related to device effects. Thermogravimetric measurements as a function of temperature were then carried out.
Dilatometric tests were then carried out to determine the thermal expansion coefficients. The scope of the study included measuring changes in the linear dimensions of cylindrical specimens in the temperature range from 24 to 1000 °C with heating rate of 5 °C/min. A Netzsch dilatometer (model Dil 402C) (NETZSCH-Gerätebau GmbH, Selb, Germany) equipped with a quartz tube was used in this study.
The coefficient of thermal expansion was calculated from the results. The result obtained is the so-called physical expansion coefficient, i.e., the slope of the tangent to the curve of change in linear dimensions at one point over an infinitely small temperature interval and was calculated from Equation (1):
where
α is the thermal expansion coefficient,
l is the linear dimension of the sample at temperature
T, and
l0 is the linear dimension of the sample.
The technical coefficient of linear expansion of the samples in the temperature range was also determined as 100–500 °C using Formula (2):
where
is the technical expansion coefficient;
,
are the linear dimensions of the sample at temperature
T1 and
T2, respectively; and
l0 is the linear dimension of the sample.
Prior to dilatometric testing, the samples were sintered according to the sintering program described above in the section on fabricating samples. Prior to the measurements, the surfaces of the samples were ground using a grinder fitted with a diamond-coated disc to produce parallel surfaces.
Selected physical properties such as apparent density, relative density, and open porosity of the produced ceramic and ceramic composites were determined using the Archimedes method. In the experiment, the theoretical density of samples was determined on the basis of the rule of mixtures. Based on the helium pycnometer analyses of pure zirconia and alumina powders the theoretical density was calculated.
In this research, X-ray diffraction (XRD) tests were carried out using a Rigaku MiniFlex 2 (Rigaku Corporation, Tokyo, Japan) X-ray diffractogram with a copper lamp. Measurements were made over an angular range of 2θ = 20°–100° and with a step of 0.02° and a counting time of 1 s. Diffractometric data were processed using MDI JADE 7 software (MaterialsData, California, CA, USA). The ICDD PDF-4+ 2020 X-ray standard database was used to interpret the results. XRD studies were carried out for both the raw and sintered samples.
Microstructure analysis was performed based on fractographic observations. Fractographic analysis for fracture observation was performed using a JEOL scanning electron microscope model JSM-6610 (JEOL, Tokyo, Japan). The observations were carried out at an accelerating voltage of 15 kV. In order to obtain an image, it was necessary to cover the samples with a thin layer of carbon. For this purpose, a QUORUM Q150T ES sputtering machine was used (Headquarters, Laughton, East Sussex., UNITED KINGDOM).
Stereological analysis was performed to determine the effect of ZrO
2 content on Al
2O
3 grain growth and grain shape parameters in the composites. The MicroMeter program [
35,
36] was used to perform the quantitative analysis. A description of the determination of shape parameters has been presented in previous works [
37]. Furthermore, based on the image analysis of the microstructures of the composite samples (Series II and Series III), the specific areas of the Al
2O
3 phase boundaries were determined, which is characterized by the S
v parameter calculated by the MicroMeter program [
35,
36]. The unit of S
v is [1/µm]. This means that, by definition, S
v is the area of the phase boundaries in a unit volume [µm
2/µm
3] = [1/µm].
The environmental impacts associated with the production of Al
2O
3- and ZrO
2-based ceramic samples were determined using the Life Cycle Assessment (LCA) method. The analysis was based on the guidelines of ISO 14044 [
38], covering the sourcing and processing of raw materials—module A1—and the manufacture of product A3, as recommended for construction products in EN 15804 [
39]. The calculation methodology adopted is based on mass allocation. All impacts associated with the generation of components such as ZrO
2, Al
2O
3, DAC, CA, PVA, and distilled water were included in Module A1. The impacts associated with the generation and consumption of electricity to power the equipment used in the production of Al
2O
3/ZrO
2 samples under laboratory conditions are included in Module A3. The electricity consumption was determined based on the operating time and manufacturers’ information on the capacity of the equipment. The waste volume was estimated as 1.5% of the initial mass loss after the venting process. The environmental impacts determined were expressed per sample, with the weight resulting from the formulation. Inventory data (LCI) and environmental indicators used for LCA calculations derived from the Ecoinvent v. 3.7, Environmental Product Declaration (EPD) and the emission factors contained in the Kobize 2020 report [
40].
Table 2 shows the electricity consumption per Al
2O
3/ZrO
2 specimen.
3. Results and Discussion
When forming ceramic bodies, an essential step is the sintering process of the samples, which should be selected individually for each type of material. This is made possible by thermogravimetric analysis, which examines the phenomena that accompany the heating of the samples to high temperatures and allows the selection of favorable conditions for the sintering process.
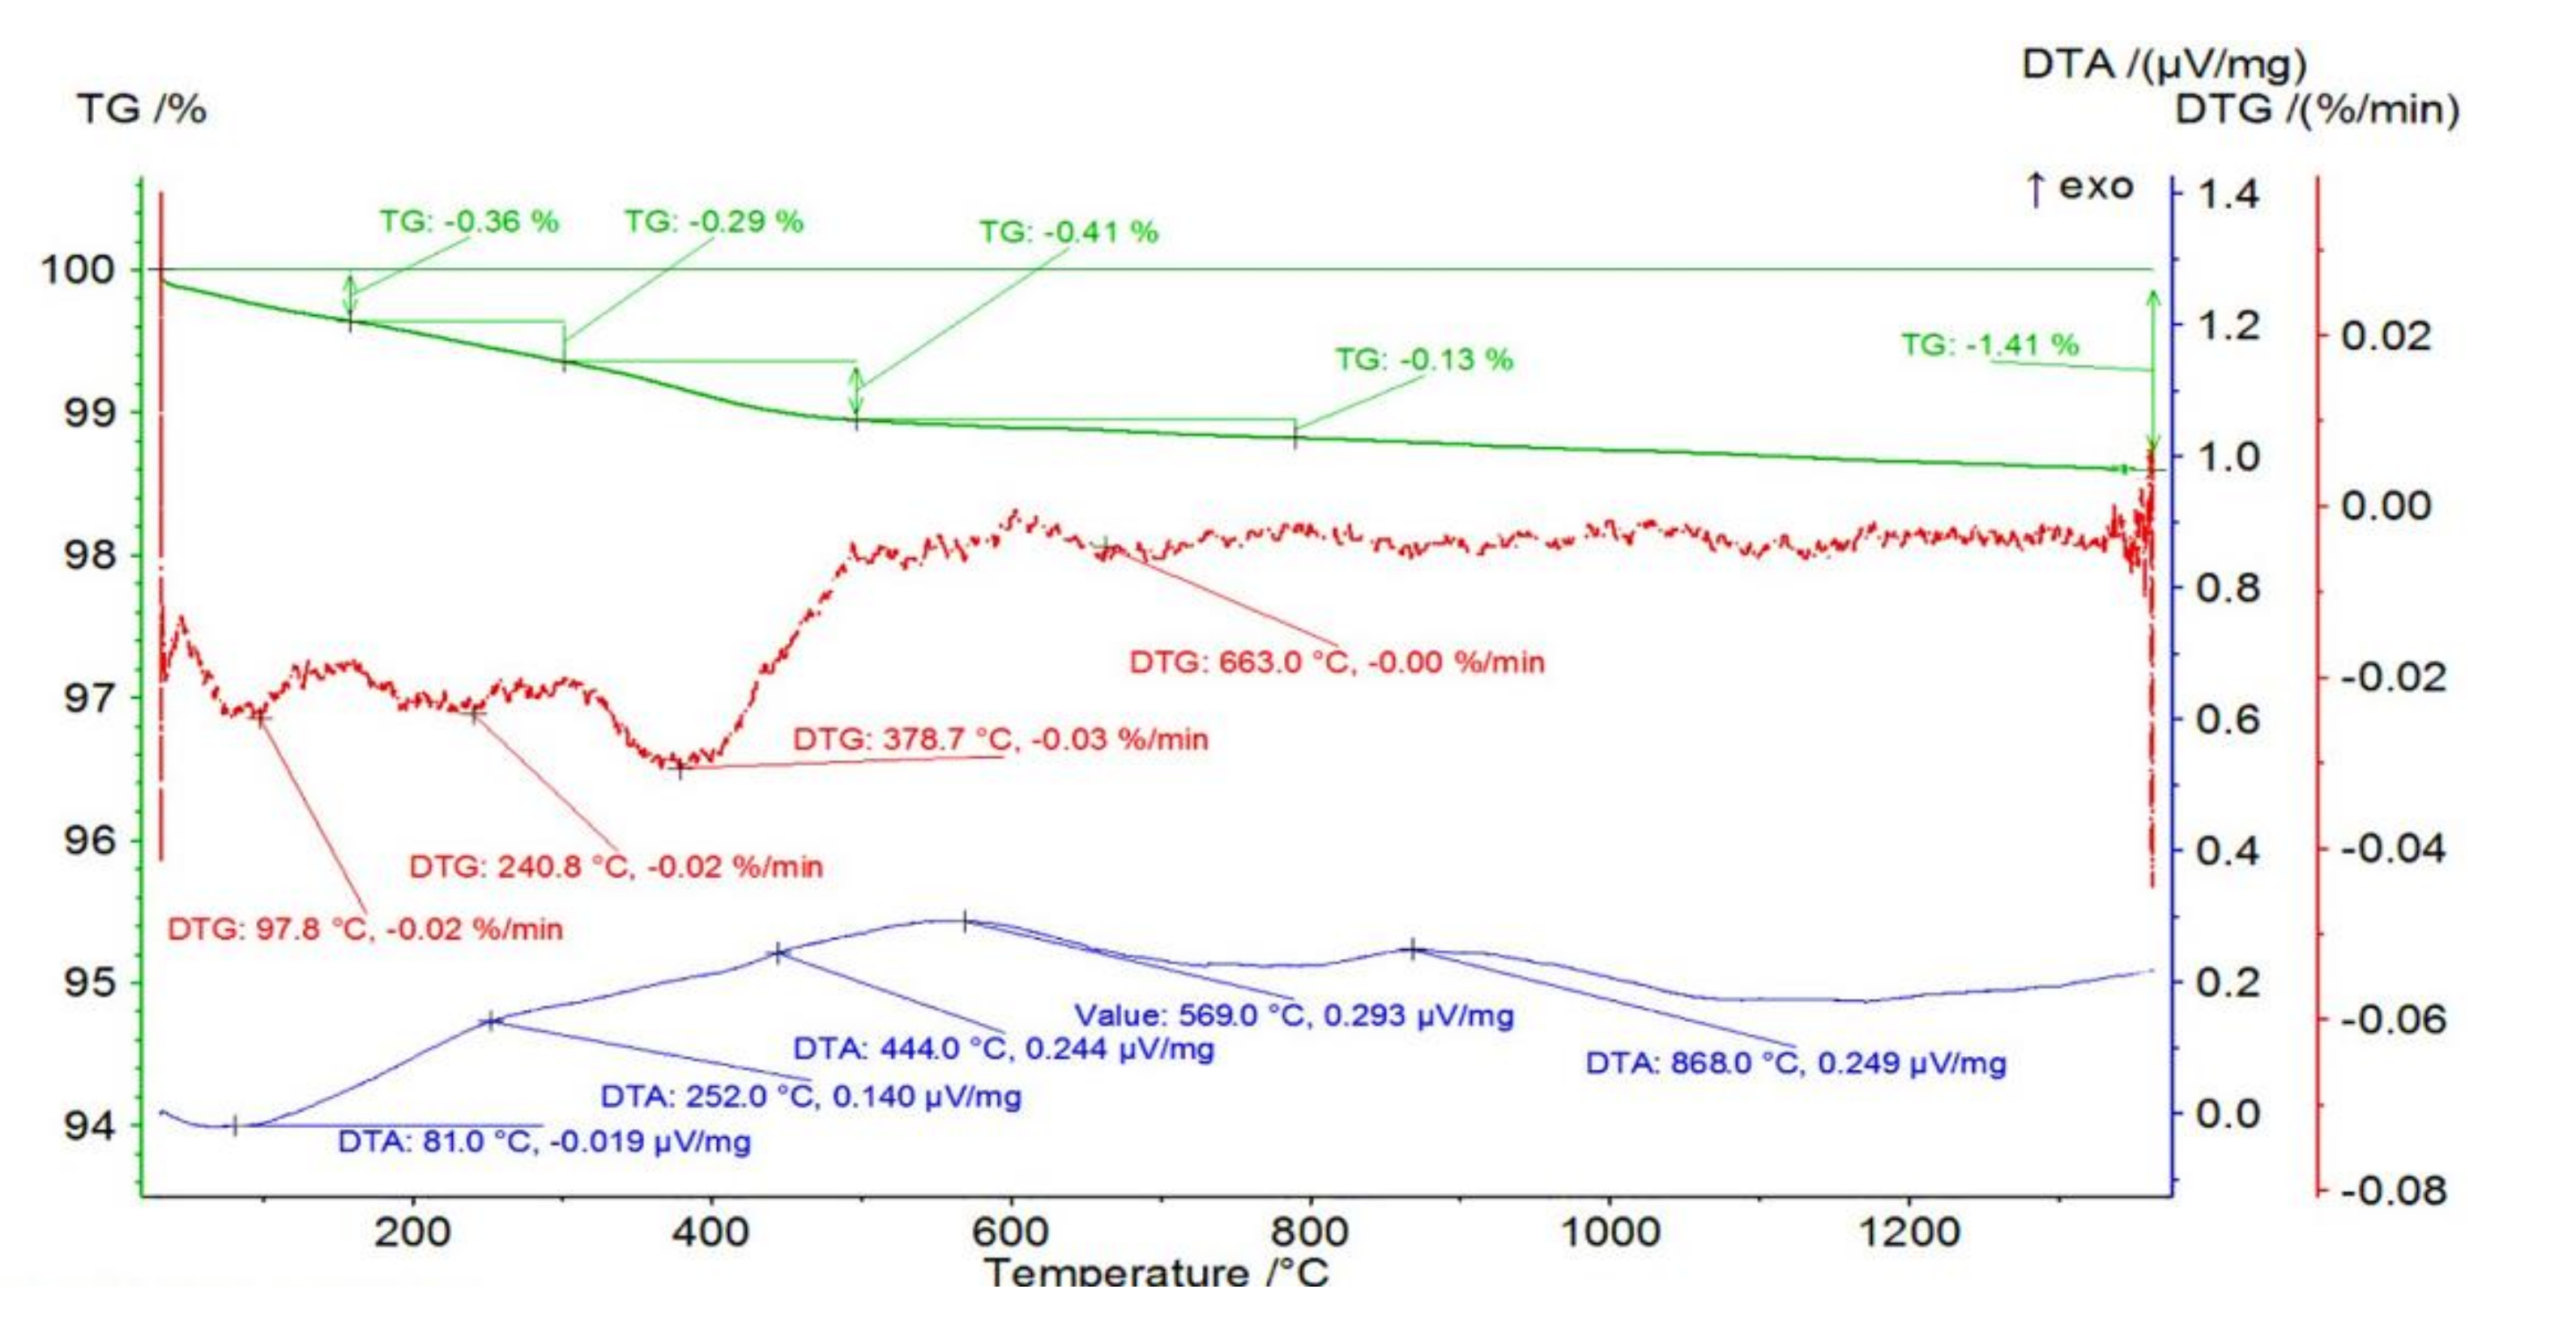
Figure 1 shows the mass changes for an example sample from the Series I—0 vol.% of ZrO
2 together with thermogravimetric (TG) curve and differential thermal analysis (DTA) curves as a function of temperature. From the curves obtained, it can be concluded that a total mass loss of 1.41% occurred in the sample containing 0 vol.% ZrO
2 (100 vol.% Al
2O
3). In the first stage, a mass loss of 0.36% occurred in the temperature range RT-158 °C with an associated endothermic effect with a maximum at 97.8 °C. Endothermic effect and temperature range indicating the process of getting rid of physically bound water. This was followed by a mass loss of 0.29% in the temperature range of 158 to 301 °C. The maximum mass loss rate was recorded at 240.8 °C with an associated fuzzy exothermic effect with a maximum at 252.0 °C.
Similarly, a mass loss of 0.41% was recorded in the temperature range of 301 to 496 °C with a maximum mass loss at 378.7 °C and a fuzzy exothermic effect at 444.0 °C. A slight mass loss of 0.13% was observed in the temperature range of 496 to 788 °C with a maximum on DTG at 663.0 °C and an exothermic peak on DTA at 569.0 °C. At 868.0 °C, a broad, fuzzy peak is visible on the DTA, which is not accompanied by mass changes. The last two steps result from the oxidation of organic additives.
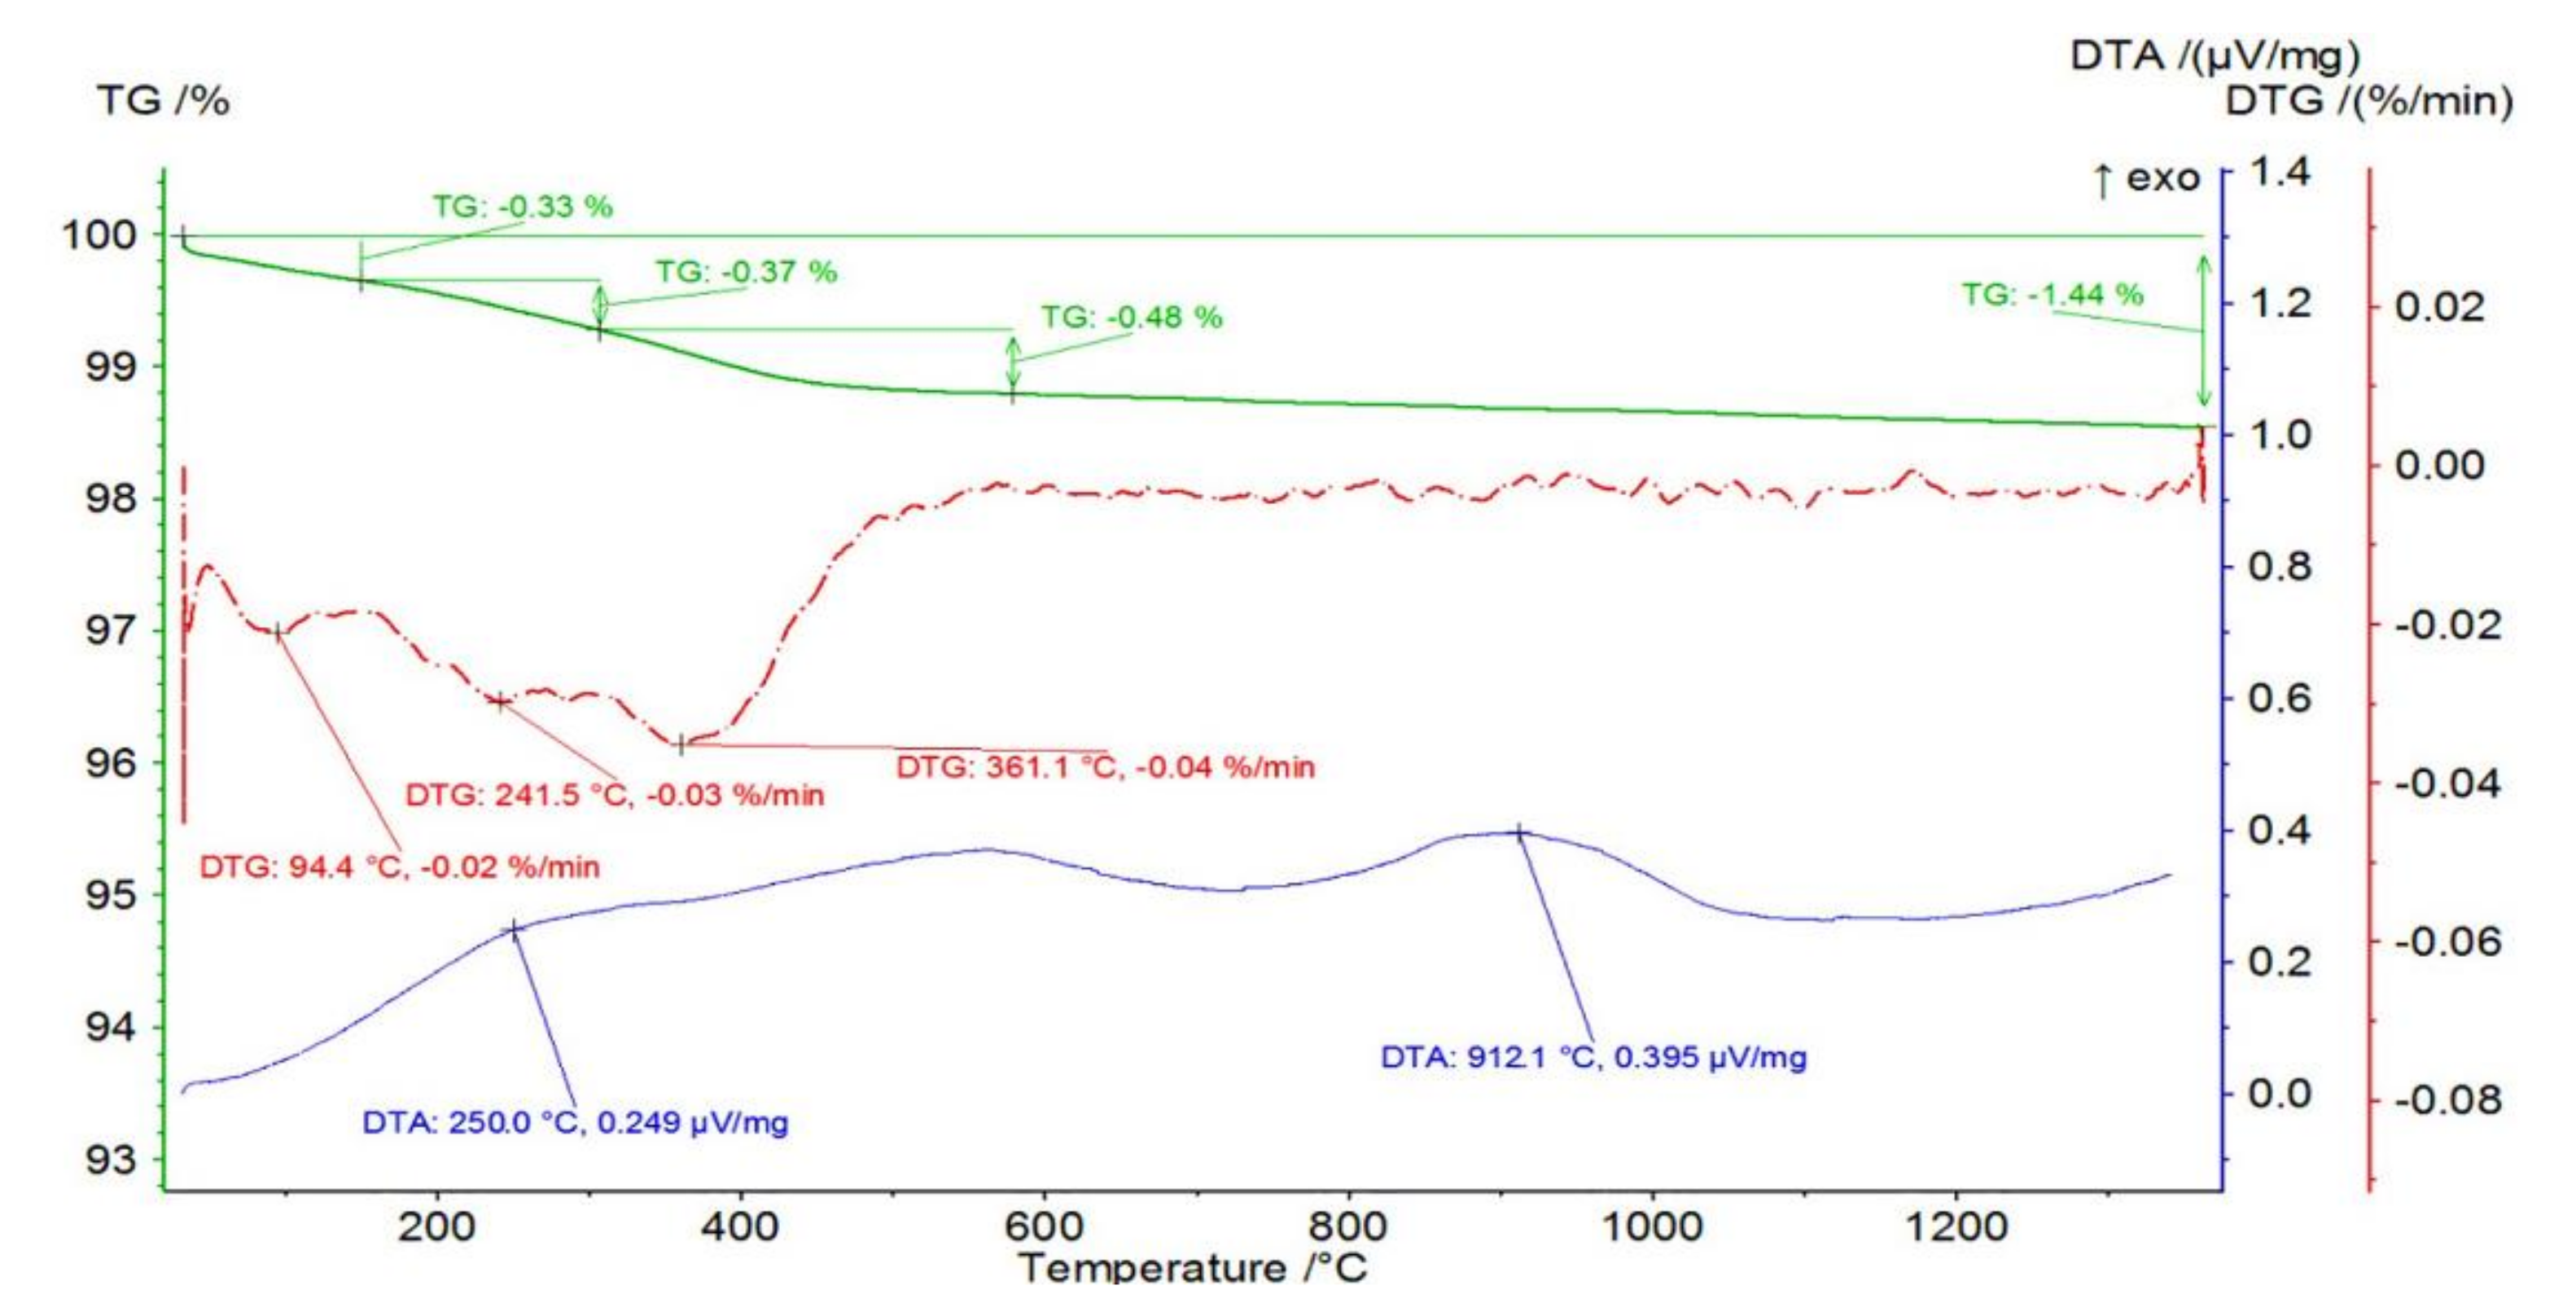
Figure 2 shows the mass change of an example sample from Series II—2.5 vol.% of ZrO
2 together with the TG and DTA curves as a function of temperature. From these, it can be concluded that there was a total mass loss of 1.44% in the sample containing 2.5% ZrO
2. In the first stage, a mass loss of 0.33% occurred in the RT-150 °C temperature range with an associated endothermic effect with a maximum at 94.4 °C with no apparent thermal effect. This was followed by a mass loss of 0.37% in the temperature range of 150 to 307 °C. The maximum mass loss rate was recorded at 241.5 °C with an associated fuzzy exothermic effect with a maximum at 250.0 °C. This step is probably due to the oxidation of organic additives. Similarly, a mass loss of 0.48% was recorded in the temperature range of 307 to 579 °C with a maximum mass loss at 361.1 °C and no apparent thermal effect. At 868.0 °C, a broad, fuzzy peak is visible on the DTA, which is not accompanied by mass changes.
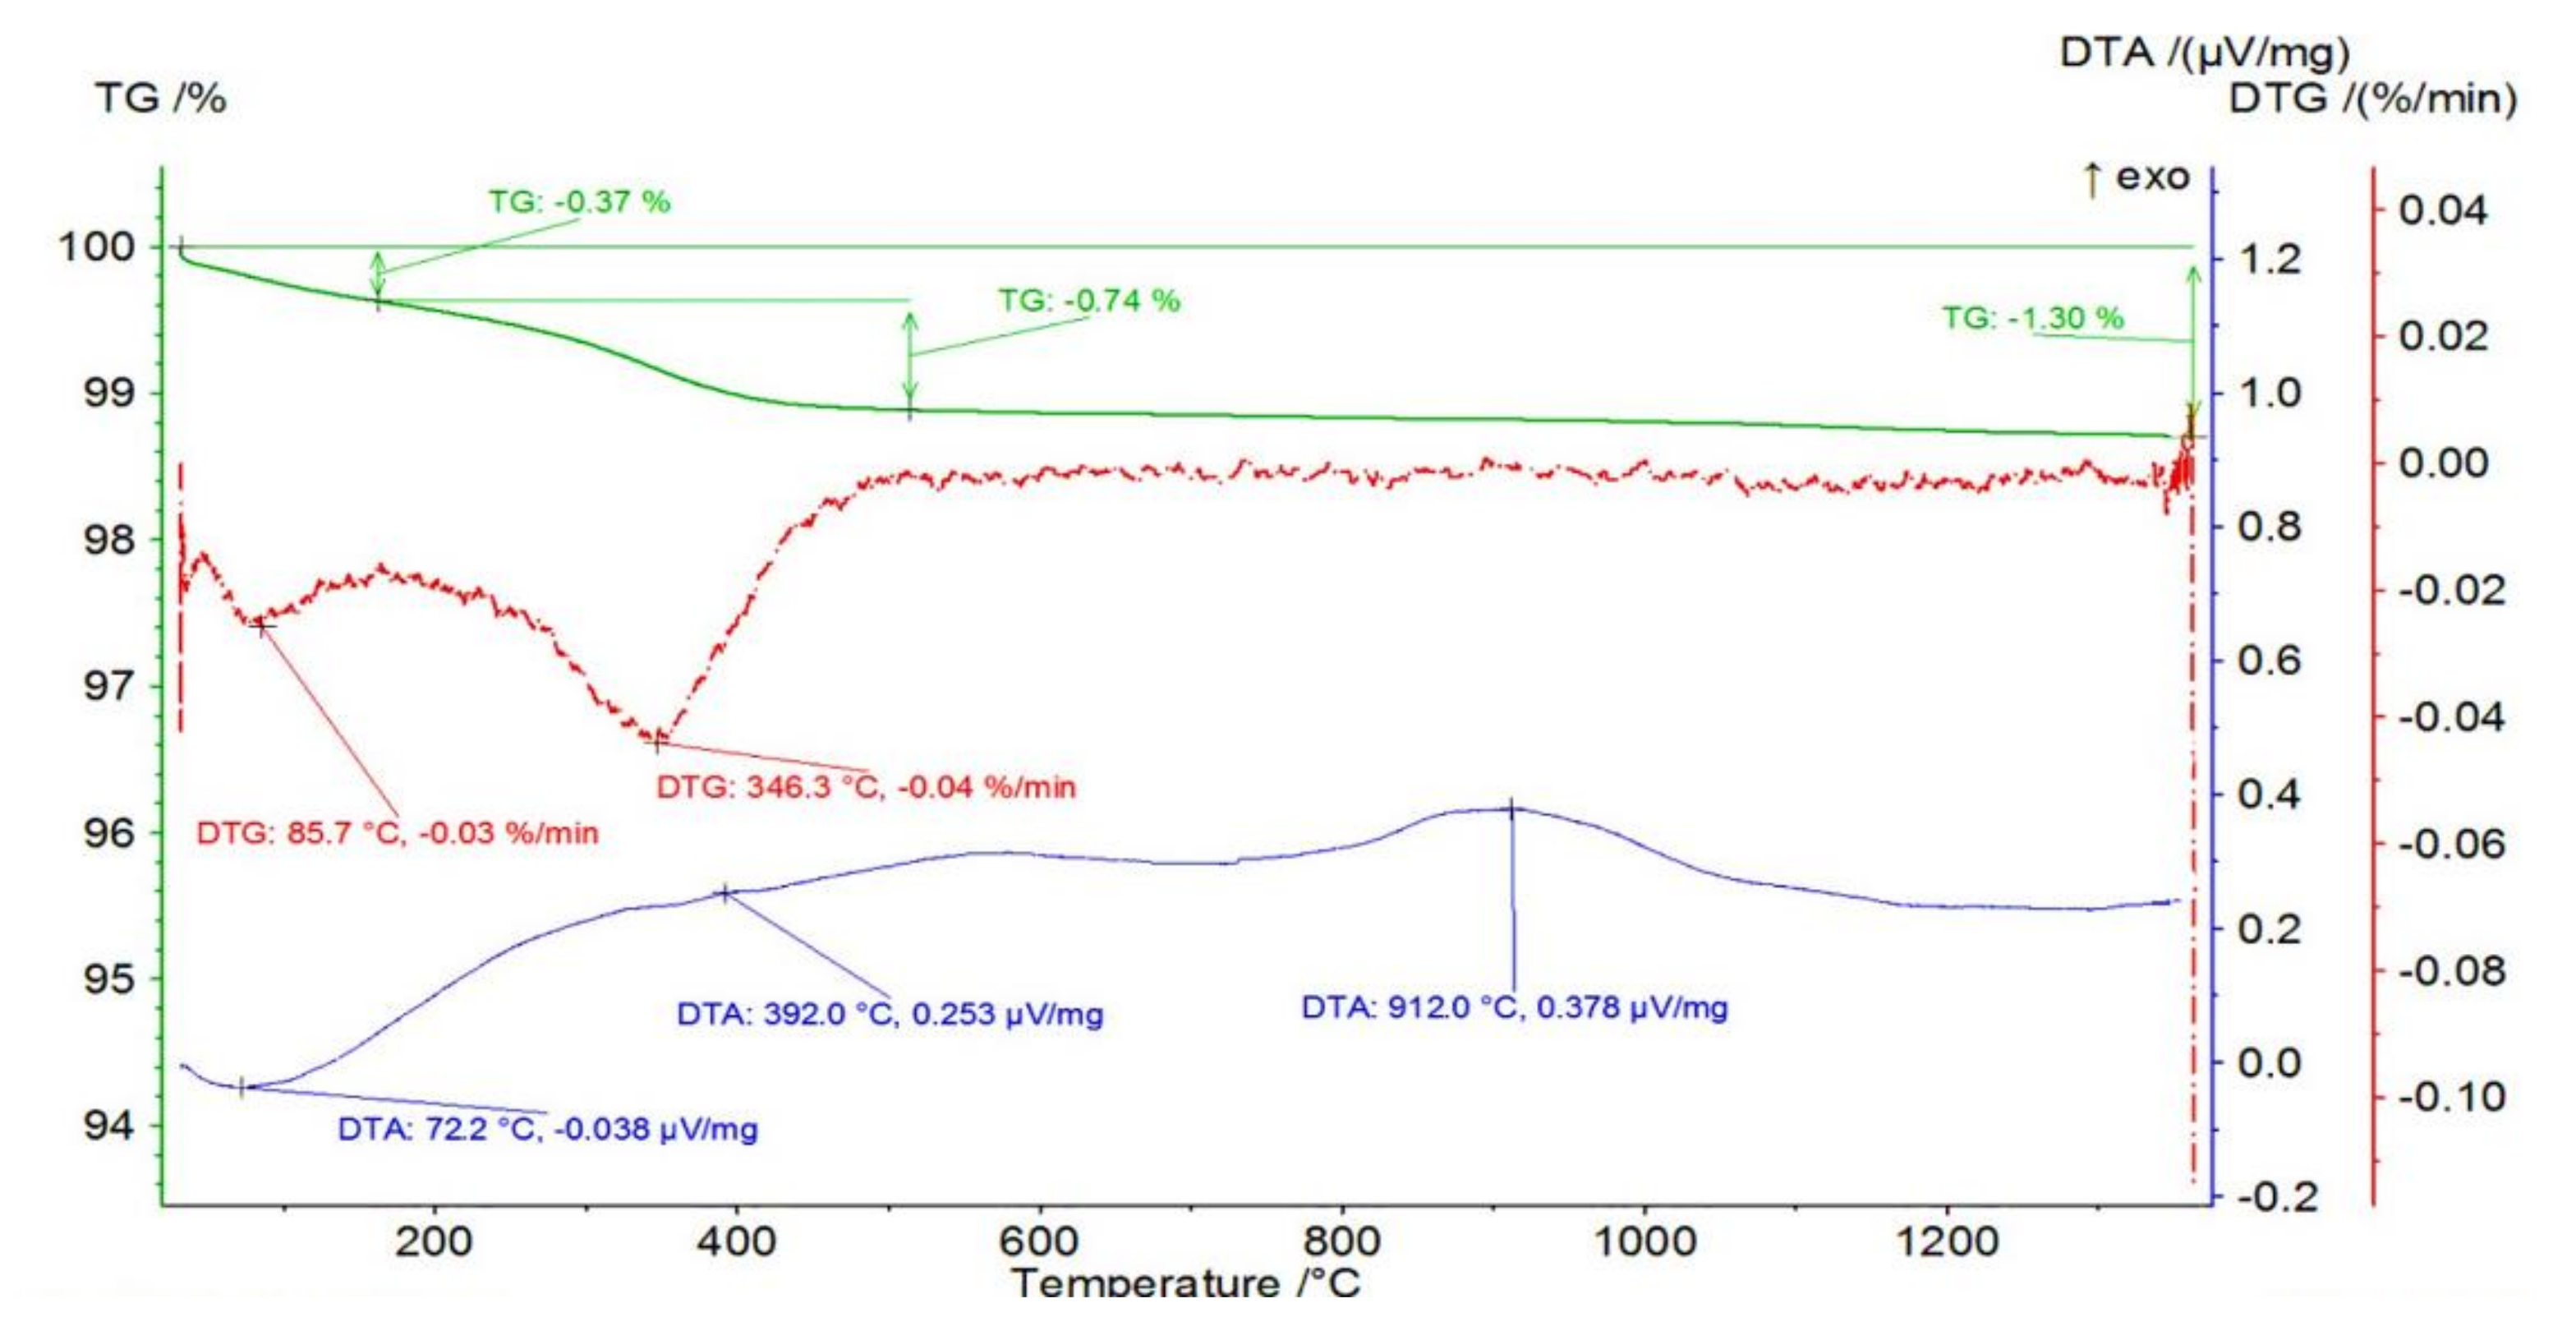
The mass changes occurring in an example sample from Series III containing 25 vol.% of ZrO
2 were investigated in the next step. The obtained mass change of the sample from Series III—25 vol.% of ZrO
2 with TG and DTA curves as a function of temperature is shown in
Figure 3. The obtained results show that a total mass loss of 1.30% occurred in the sample containing 25 vol.% ZrO
2. In the first stage, a mass loss of 0.37% occurred in the temperature range of RT-162 °C with an associated endothermic effect with a maximum at 72.2 °C. Endothermic effect and temperature range indicating a probable process of getting rid of physically bound water. This was followed by a mass loss of 0.74% in the temperature range of 162 to 514 °C. The maximum mass loss rate was recorded at 346.3 °C with an associated fuzzy exothermic effect with a maximum at 392.0 °C. The mass loss is probably due to oxidation of the organic additives. At 912.0 °C, a broad, fuzzy peak is visible on the DTA, which is not accompanied by mass changes.
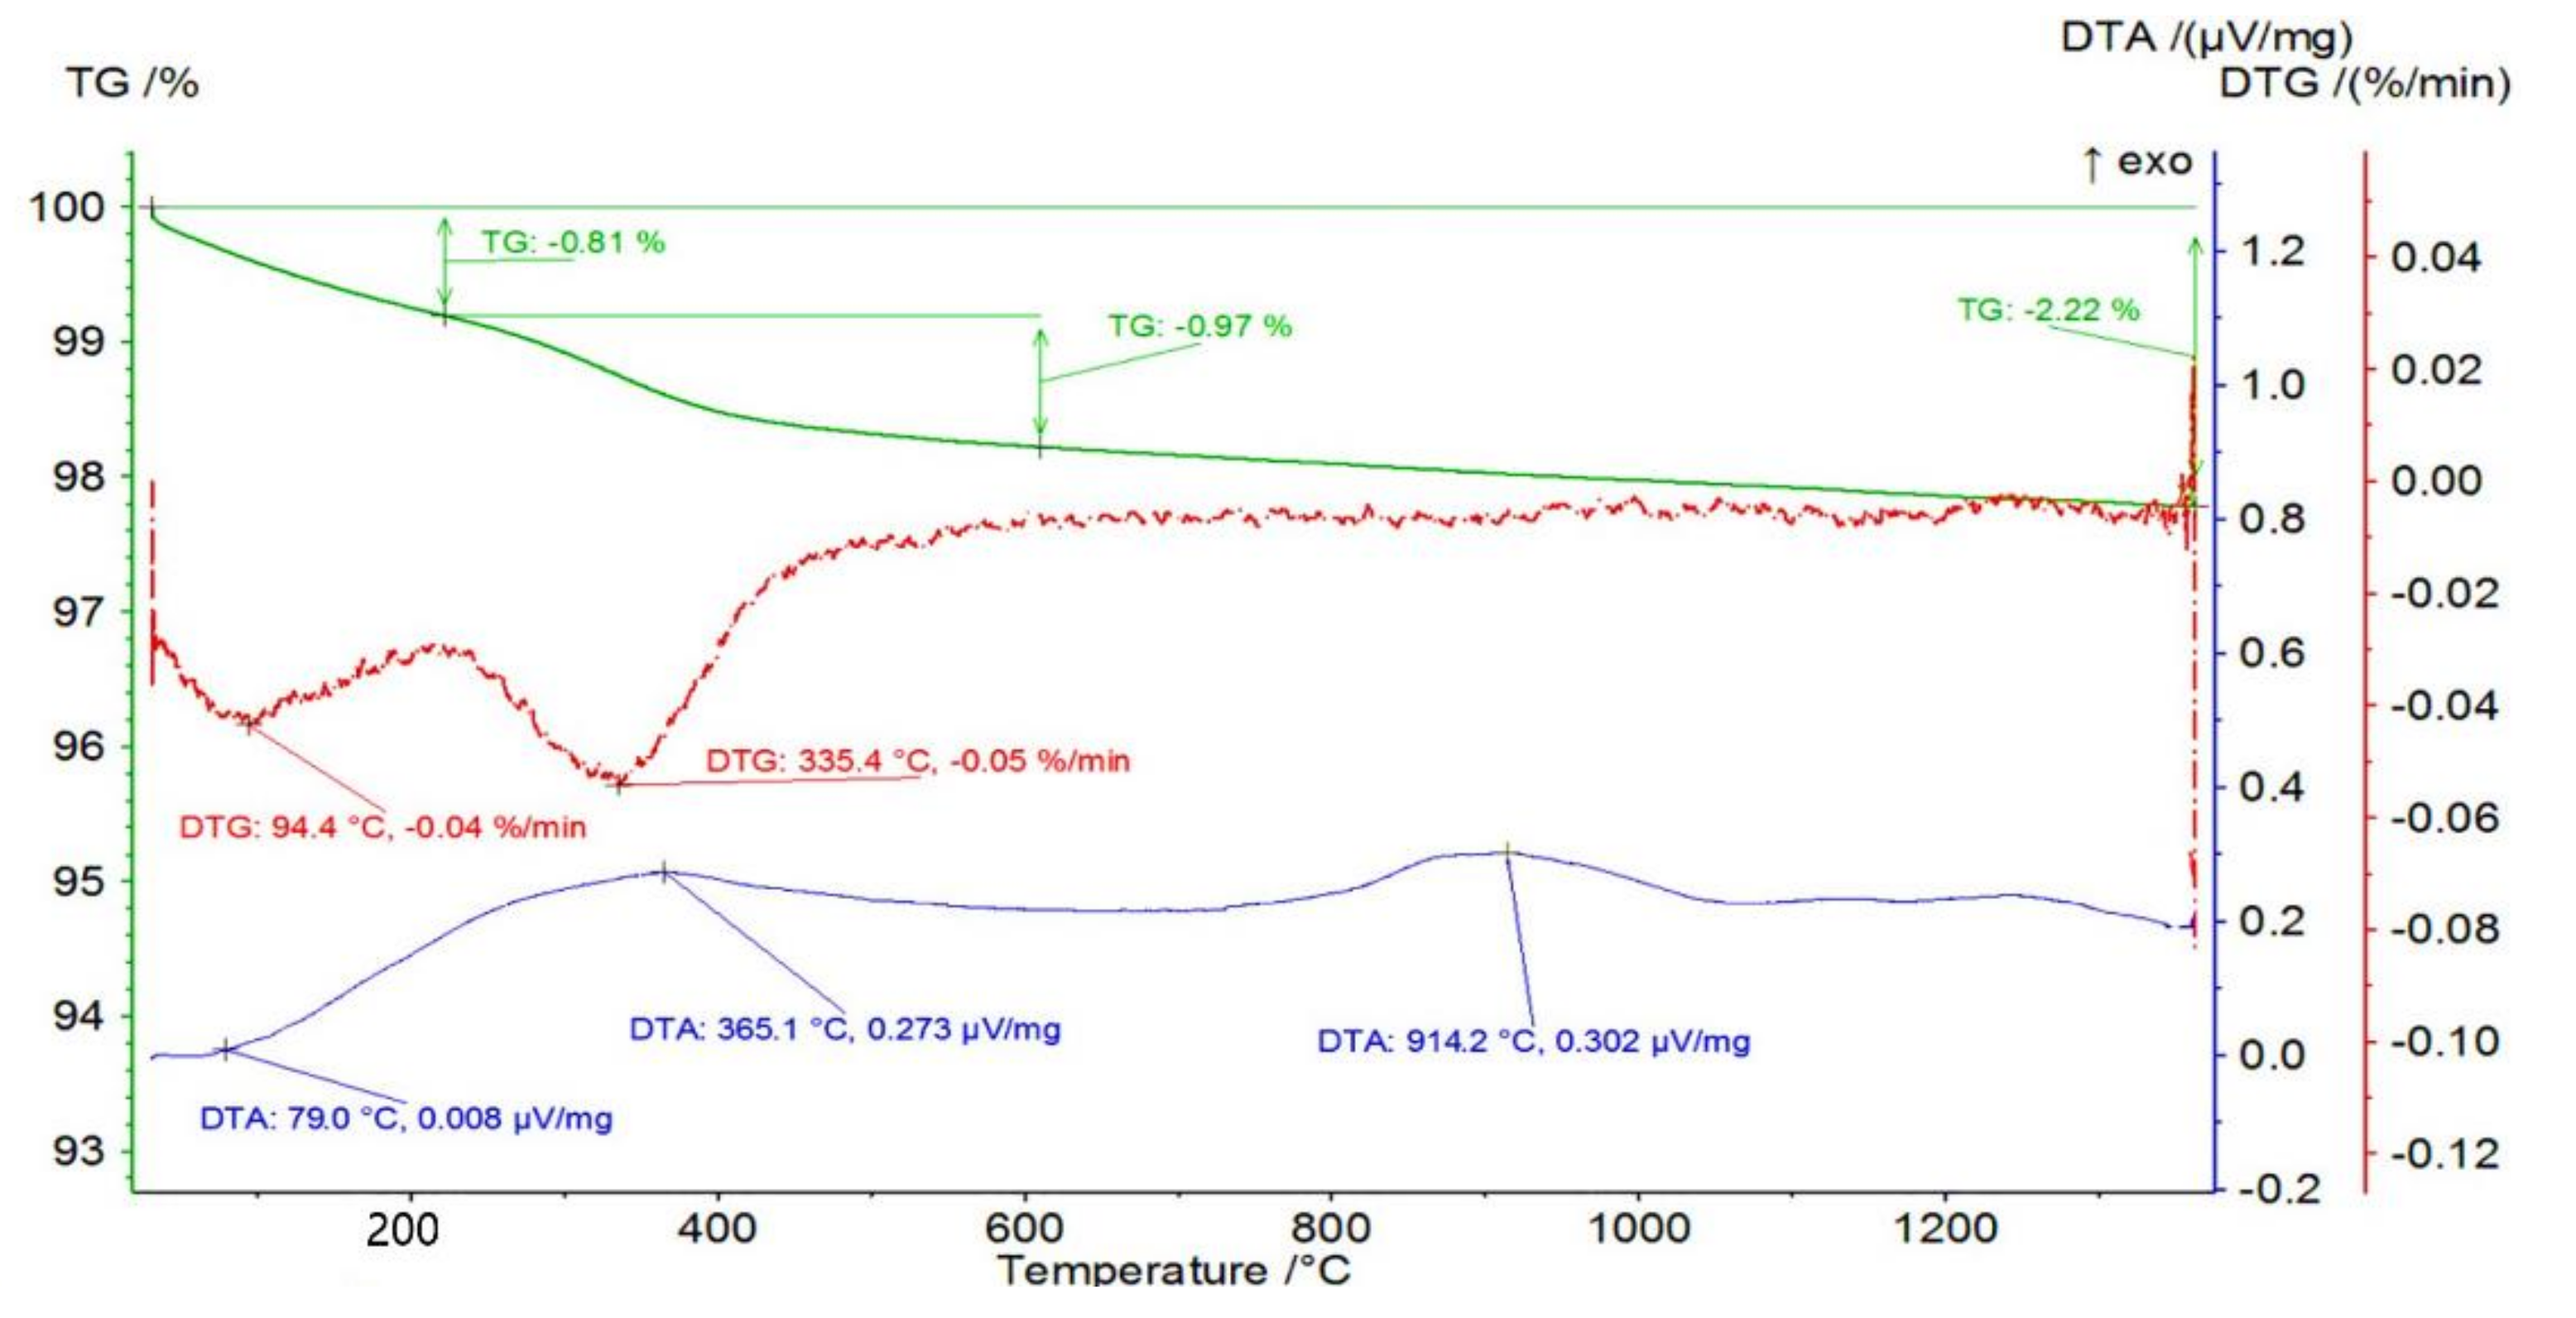
Measurements of mass loss and thermal effects as a function of temperature were then determined for the Series IV—100 vol.% ZrO
2 samples. The obtained curves of the mass change of an example sample from Series IV—100 vol.% of ZrO
2 together with the TG and DTA curves as a function of temperature are shown in
Figure 4. It was found that the sample containing 100% ZrO
2 had a total mass loss of 2.22%. In the first stage, a mass loss of 0.81% occurred in the temperature range RT-222 °C with an associated endothermic effect with a maximum at 79.0 °C. Endothermic effect and temperature range indicating a probable process of getting rid of physically bound water. This was followed by a mass loss of 0.97% in the temperature range of 222 to 610 °C. The maximum mass loss rate was recorded at 335.4 °C with an associated fuzzy exothermic effect with a maximum at 365.1 °C. The mass loss is probably due to oxidation of the organic additives. At 914.2 °C, a broad, fuzzy peak is visible on the DTA, which is not accompanied by mass changes.
A summary of the thermogravimetric analysis is shown in
Table 3. From an analysis of the results, it can be concluded that the first weight loss in all samples occurs up to 200 °C and is related to the removal of water. The evaporation temperature of the water is higher in this case as it is water physically bound to the components of the samples. Water molecules can be adsorbed on the surface of the powders and in the structure of the binder, which was PVA [
41]. The amount of humidity in the samples is within the range of 0.36 to 1.44 wt%. This amount and the fact that the value is not stable indicates that the amount of water in the samples is dependent on the atmospheric conditions (ceramic powder adsorbs water from air).
During a further increase in temperature, the weight loss is related to the thermal decomposition of the organic elements present in the sample (DAC, CA, and PVA). Based on temperature reports, the individual stages of weight loss can be attributed to the thermal decomposition of organic additives. DAC decomposes in the temperature range of ca. 180–600 °C and occurs in two stages at ~180–250 °C and ~400–600 °C. Citric acid decomposes at a slightly lower temperature of 180–500 °C, and this process also occurs in two stages (180–250 °C and 250–500 °C) [
42]. PVA decomposes in the temperature range of 200 to 450 °C. Analyzing the obtained results, it can be observed that as the ZrO
2 content in the sample increases, the number of decomposition steps decreases, the organic substances are decomposed simultaneously, giving a single fuzzy signal on the DTA curve. This may indicate stronger interactions occurring between the powder surface and the organic matter adsorbed on it.
One of the fundamental physical properties of solids is thermal expansion; it plays a significant practical role. Changes in the volume of bodies due to temperature changes are crucial to the functioning of many devices, e.g., nozzle gaskets. Therefore, it is essential to determine the thermal expansion coefficients for the molded materials at the basic research stage. Thermal expansion is the change in volume of a solid due to a change in temperature (heating or cooling) while maintaining constant pressure. Note that the volumetric expansion of solids is most often simplified by reducing the problem by controlling changes in the body length.
Consequently, linear expansion is often assigned to solid substances as an indicator of thermal expansion. In the experiment conducted, this simplification was also used.
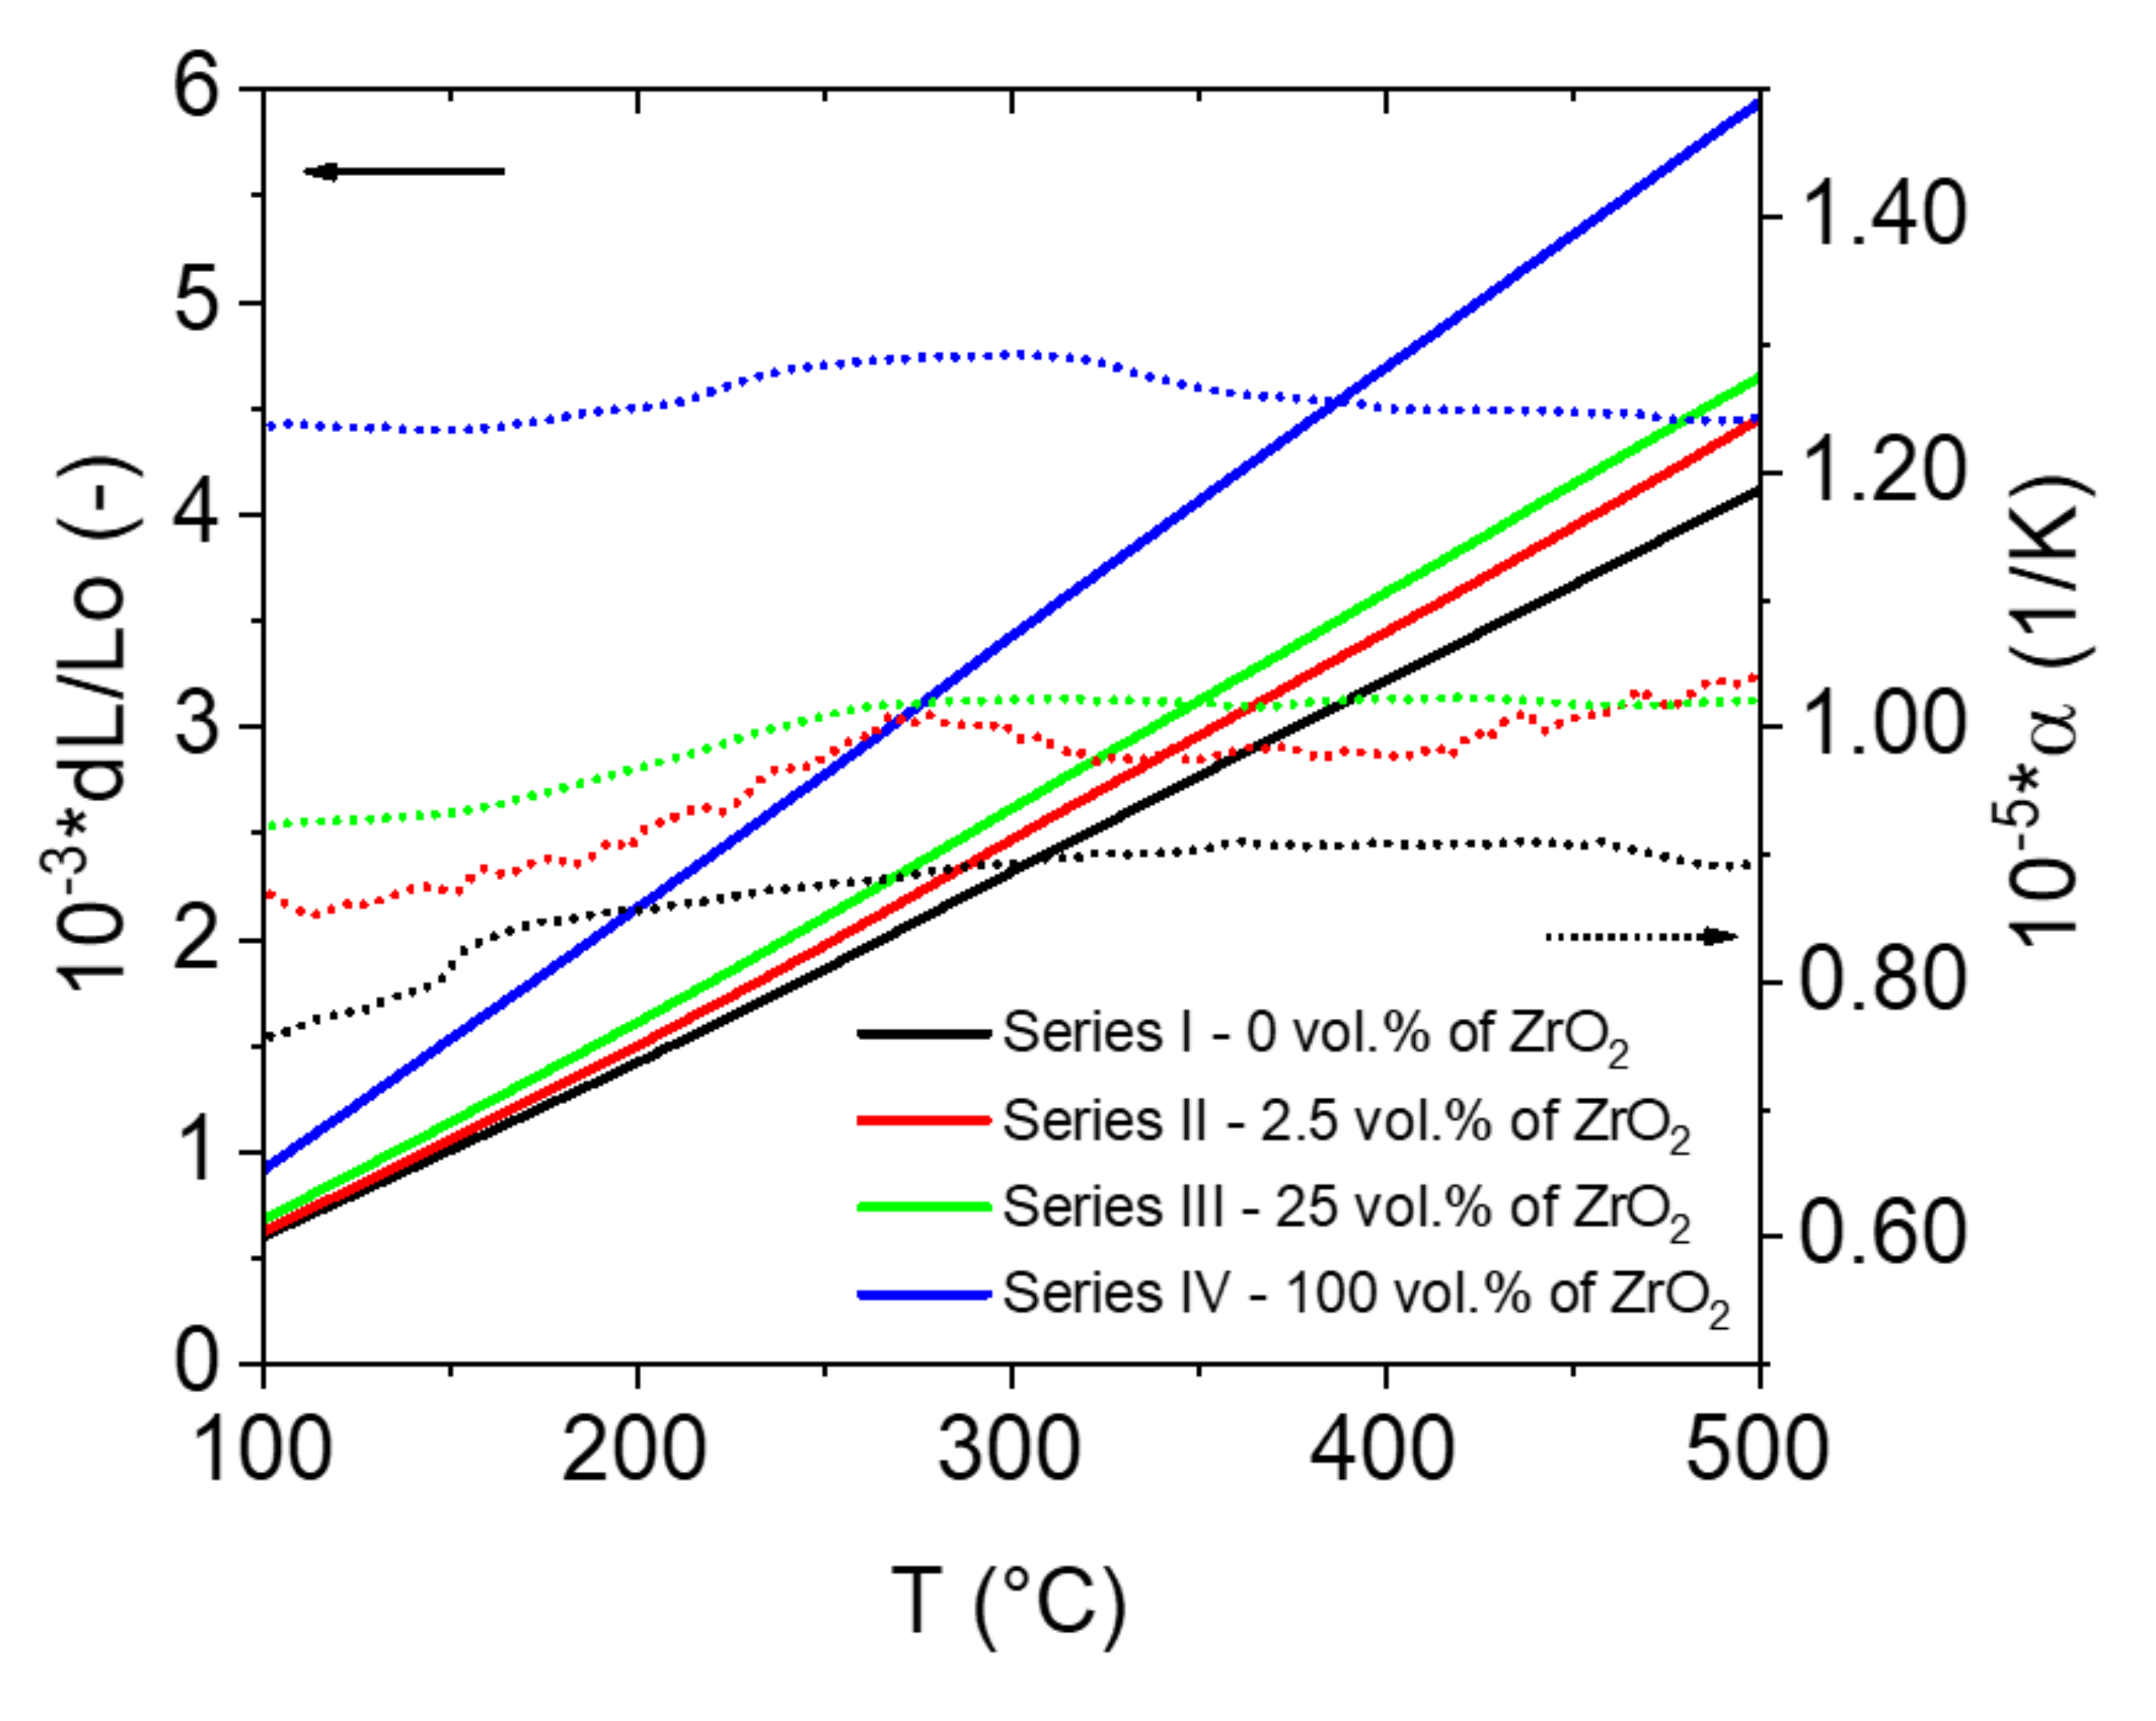
Figure 5 shows the resulting changes in the linear dimensions of the samples as a function of increasing and decreasing temperature. The coefficient of thermal expansion was calculated from the results. The α factor for the alumina sample increases slightly with increasing temperature and is in the range of 8.24 to 9.22 × 10
−6 1/K. The presence of zirconium oxide in the alumina matrix, even in small quantities, causes a significant increase in the expansion coefficient. The determined α-factor for composites in the alumina-zirconium oxide system containing 2.5 vol.%, zirconium oxide is 8.05–10.5 × 10
−6 1/K. For composites containing 25 vol.%, zirconium oxide was found to expand in the range of 7.26 to 10.1 × 10
−6 1/K. In contrast, the expansion of a material made solely from zirconium oxide ranges from 10.9–12.6 × 10
−6 1/K.
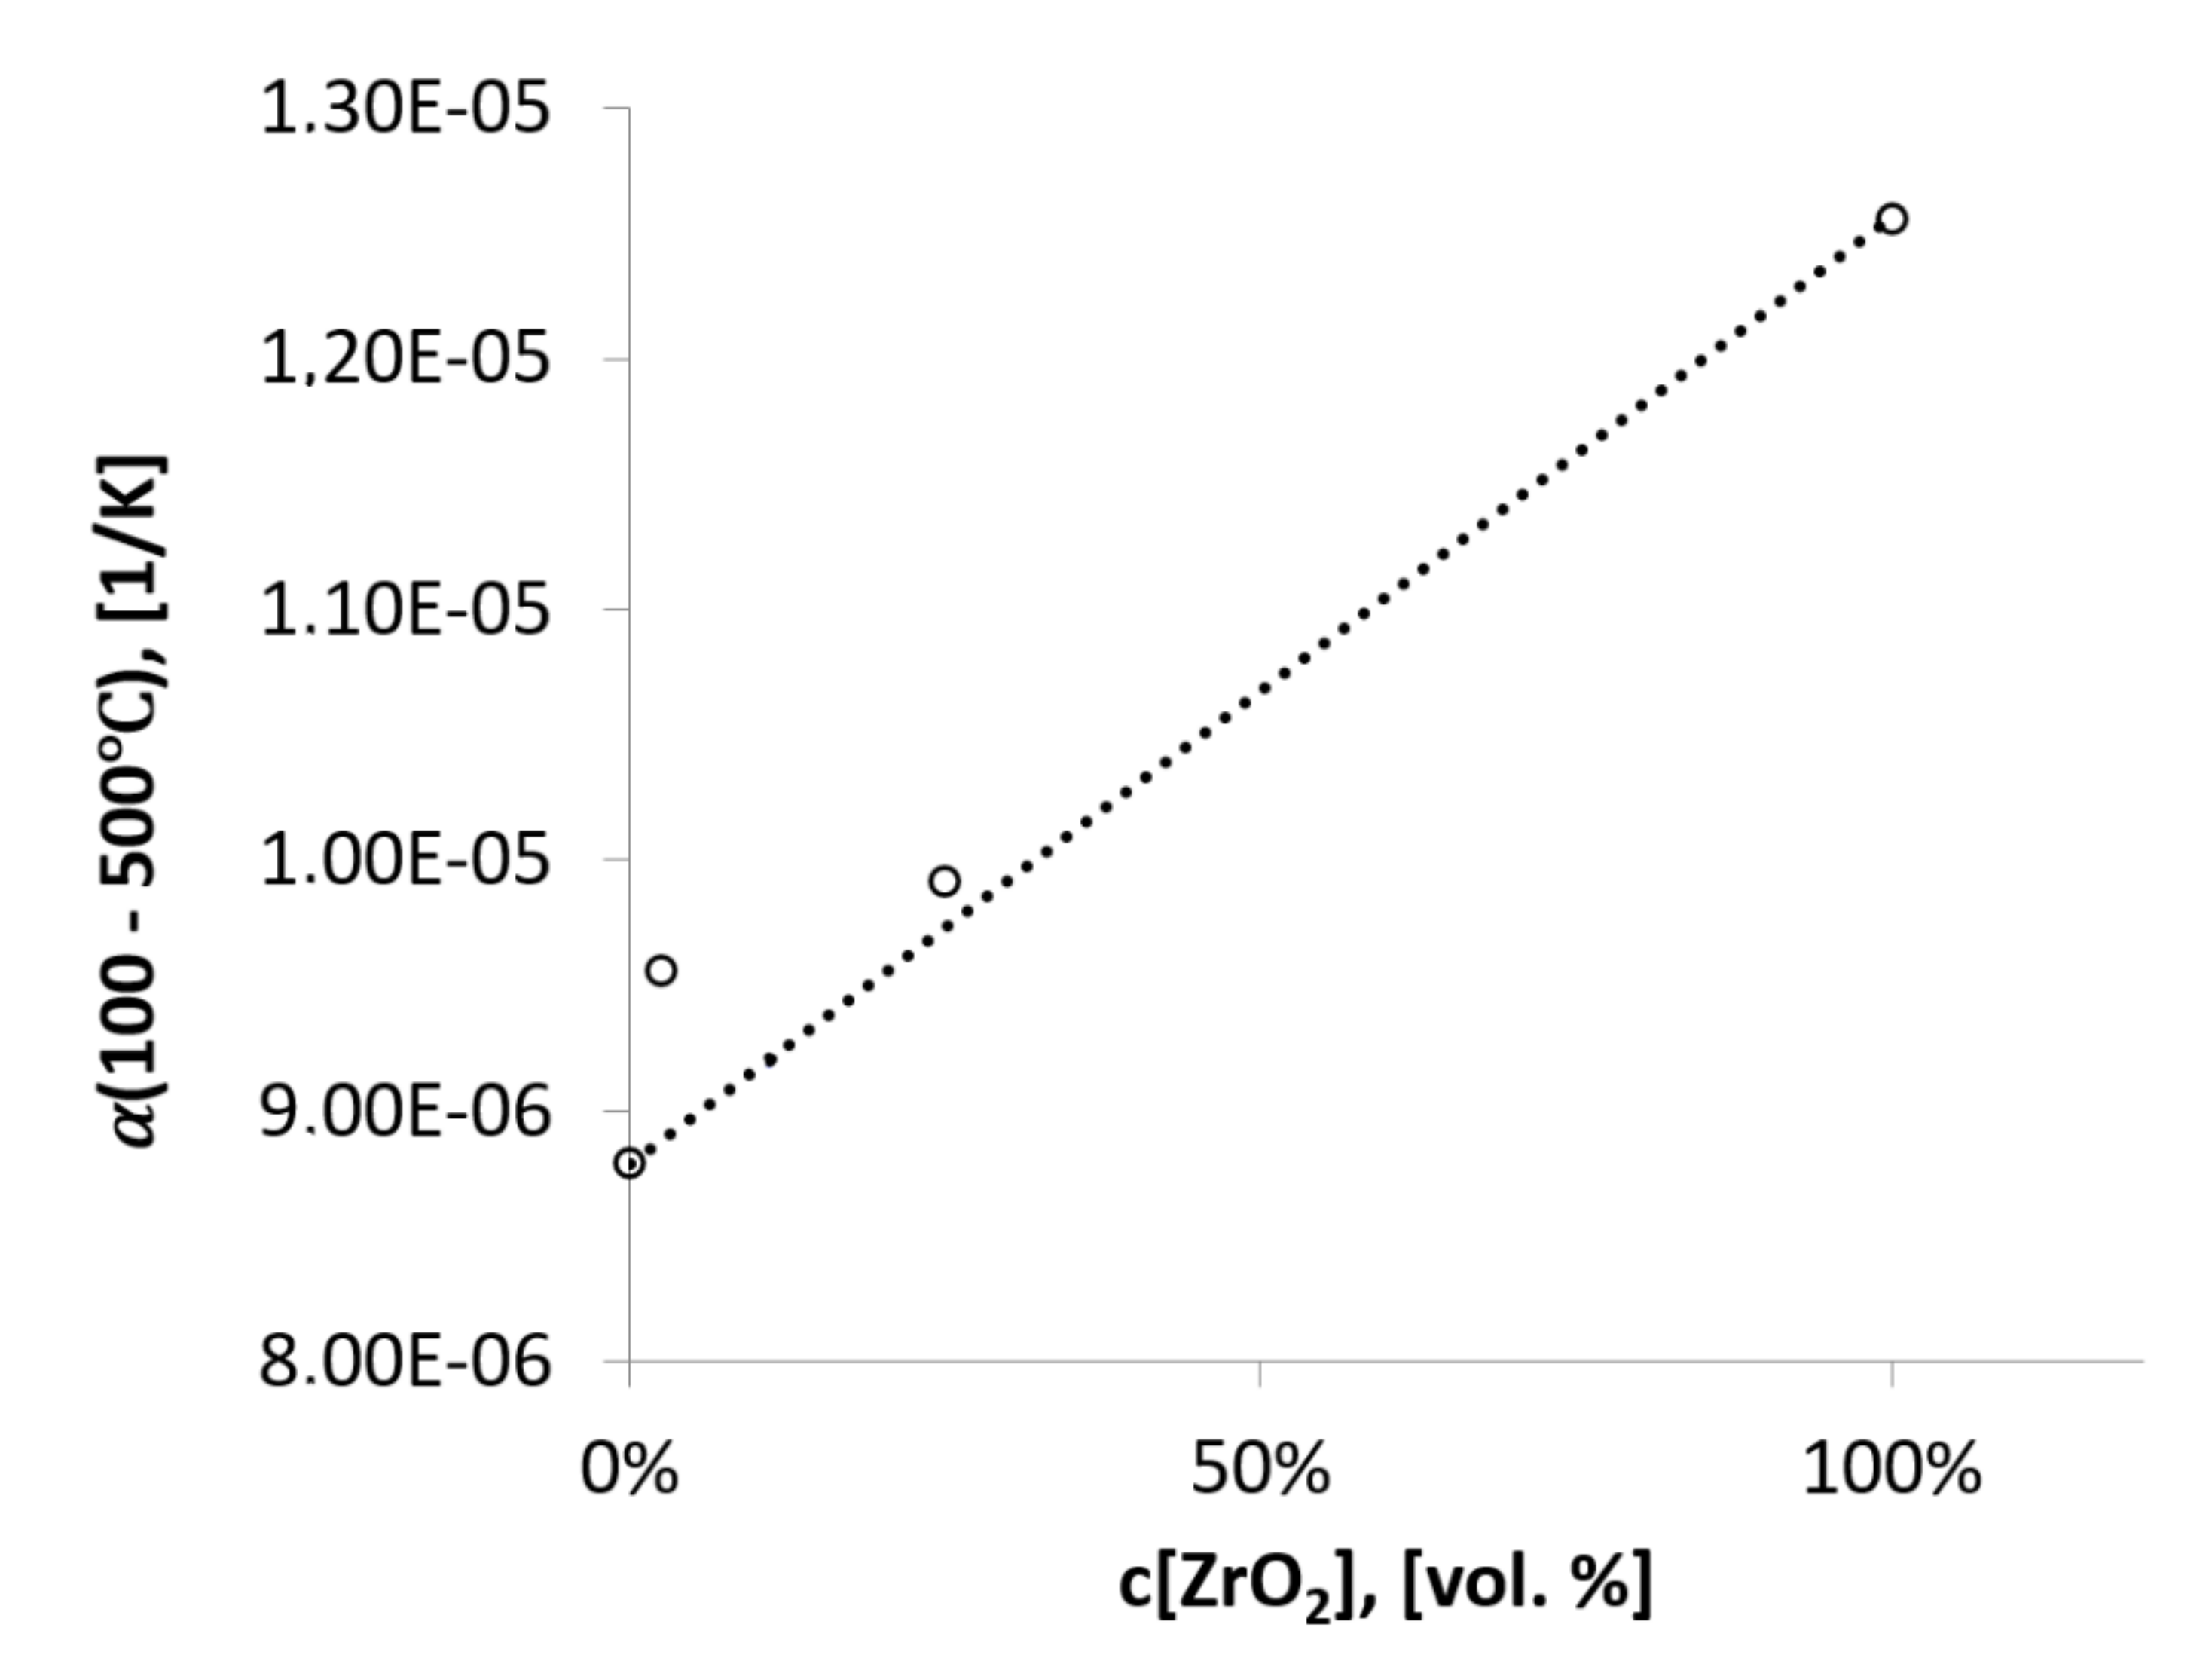
The values of the technical expansion coefficients in the temperature range of 100 to 500 °C are shown in
Table 4. The values of the technical coefficient of expansion
are averaged values of the coefficient of expansion. The values of the coefficients
as a function of zirconium oxide content are shown in the chart in
Figure 6. The chart shows the nonlinear nature of the dependence of the expansion coefficient on the concentration of zirconium oxide in the composite. Small amounts of zirconium oxide (2.5 vol.%) cause a jump in the coefficient
from 8.79 × 10
−6 1/K for the alumina sample to 9.56 × 10
−6 1/K for the composite containing 2.5 vol.% of zirconia. Such a phenomenon may indicate the presence of other phases in the composite (the composite is not a physical mixture). In contrast, composites containing 25 vol.% of zirconium oxide have a technical expansion coefficient value of 9.92 × 10
−6 1/K. This value is consistent with the linear nature of the coefficient changes (estimated from the law of additivity of properties).
Macroscopic observations in the sintered samples did not reveal visible defects, i.e., cracks or shape deformations. The densities of the specimen obtained are shown in
Table 4. Based on the results, it can be concluded that the ceramic fittings from Series I—0 vol.% of ZrO
2 and Series IV—100 vol.% of ZrO
2 had a very high relative density above 99%. It was noted that the relative density values for the samples containing 100 vol.% of ZrO
2 are slightly higher than the sample density values studied by Lada and her team [
43]. In their work, they obtained samples (100 vol.% ZrO
2) produced via slip casting with a density of 98%. The differences in values may be due to the type of ZrO
2 powder used, the solid phase content of the slurry used, or the sintering process [
43]. Based on the remaining density measurement results, the composites from the Al
2O
3/ZrO
2 system (Series II and III) were found to have a lower relative density than samples containing only Al
2O
3 or ZrO
2. From the results in
Table 5, it is noted that for ZTA composites, changing the ZrO
2 content in the sample does not significantly affect the change in relative density for Series II and Series III. The relative density for Series II and Series III composites were found to be 96.5% and 97%, respectively, which may indicate that mass transport in the composite was hindered due to the presence of another phase (ZrO
2).
Table 6 does not include the open porosity values for Series I and IV samples because the open porosity and water absorption are close to zero for samples with very high densities >99%. This is consistent with sintering theory because there should be no open pores at such high relative densities, so the absorbency should be zero.
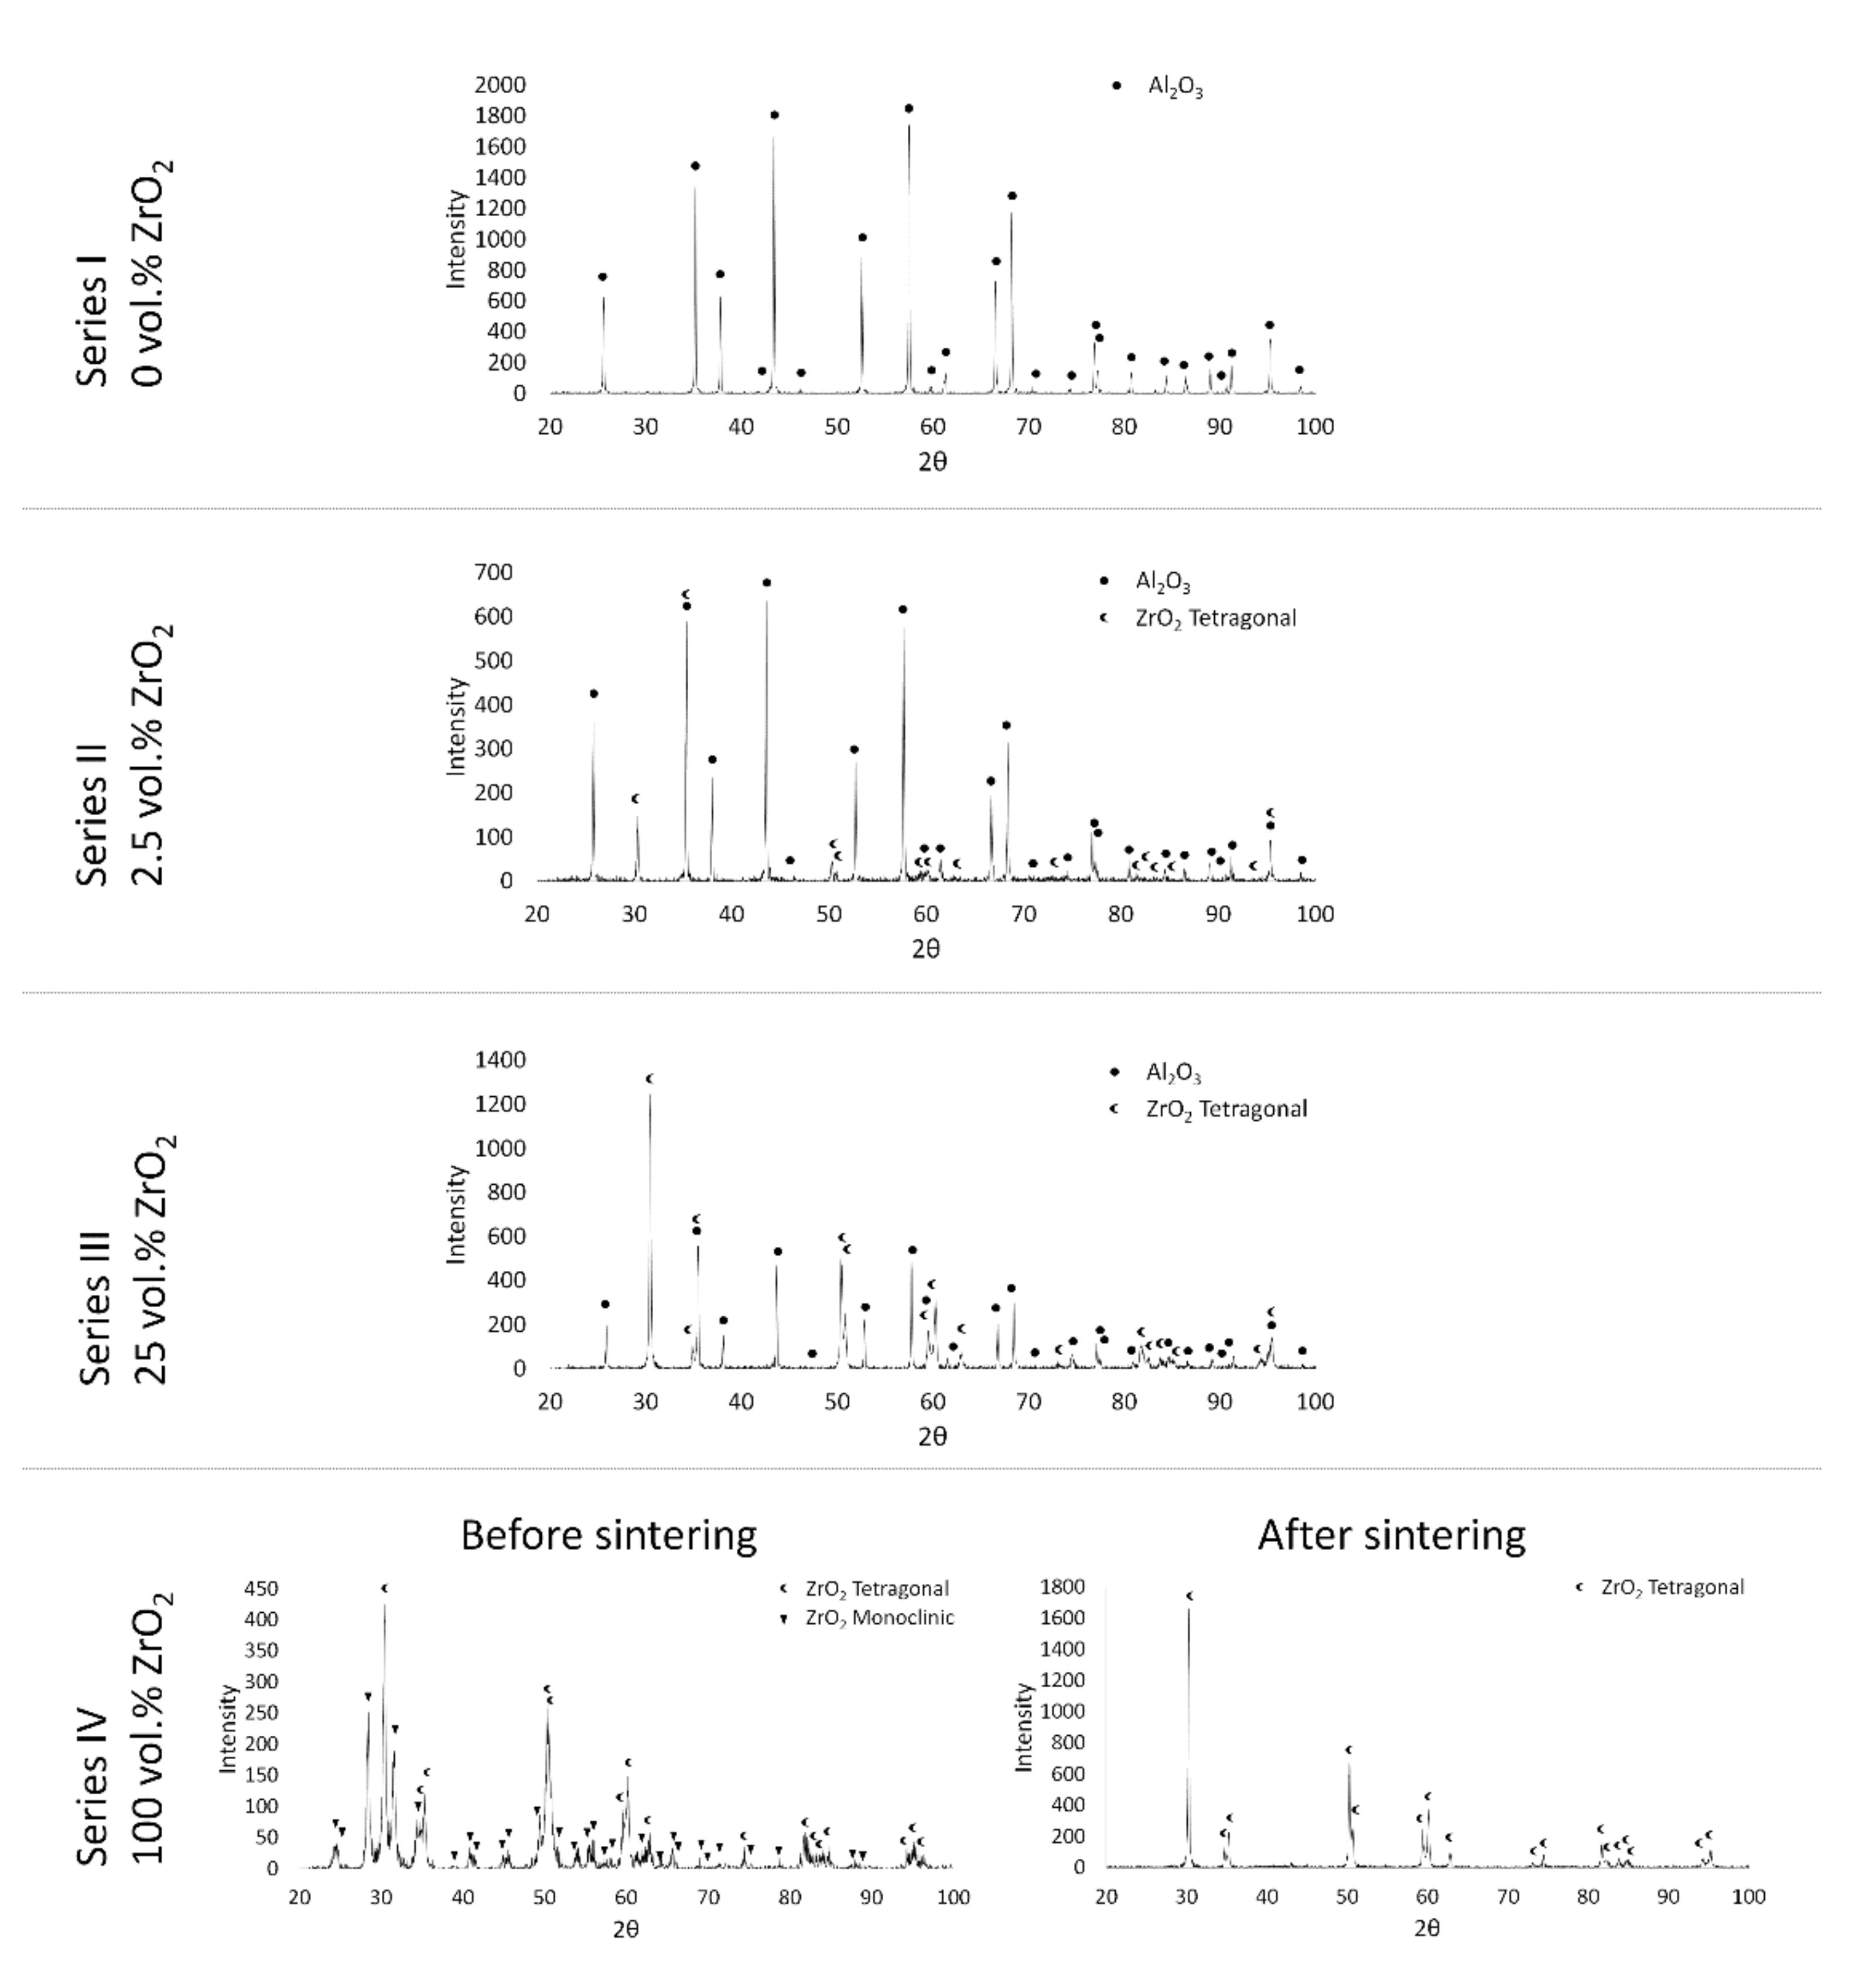
Figure 7 shows diffractograms of samples produced via slip casting through and after the sintering process with the main phases in the samples marked. From the phase analysis results obtained, it was observed that the diffractograms of Series I, II, and III samples after the sintering process do not differ significantly from the diffraction images for these materials before the sintering process. However, it is noticeable that there is an intense increase in the intensity of the individual peaks for the samples after the sintering process, which is due to the growth of grains and domains with a homogeneous crystalline structure. The XRD tests carried out showed that a sample containing 100 vol.% ZrO
2 before the sintering process contained a monoclinic and a tetragonal phase. In the case of Series II and III composites, no monoclinic or regular phase was observed both before and after sintering, which may be due to the small amount of monoclinic variety in the whole sample. Sintering at 1400 °C resulted in a complete transformation of the monoclinic to tetragonal phase for series IV. Note that the presence of a tetragonal variety of ZrO
2 increases the temperature stability of the material in operating conditions, e.g., as thermal barrier materials [
44]. As early as the late 1970s and early 1980s, several researchers showed in their work that, for both solid materials and coatings, materials containing the tetragonal variety of ZrO
2 exhibit greater mechanical strength, particularly against fracture, than those containing the monoclinic or regular variety [
45,
46,
47].
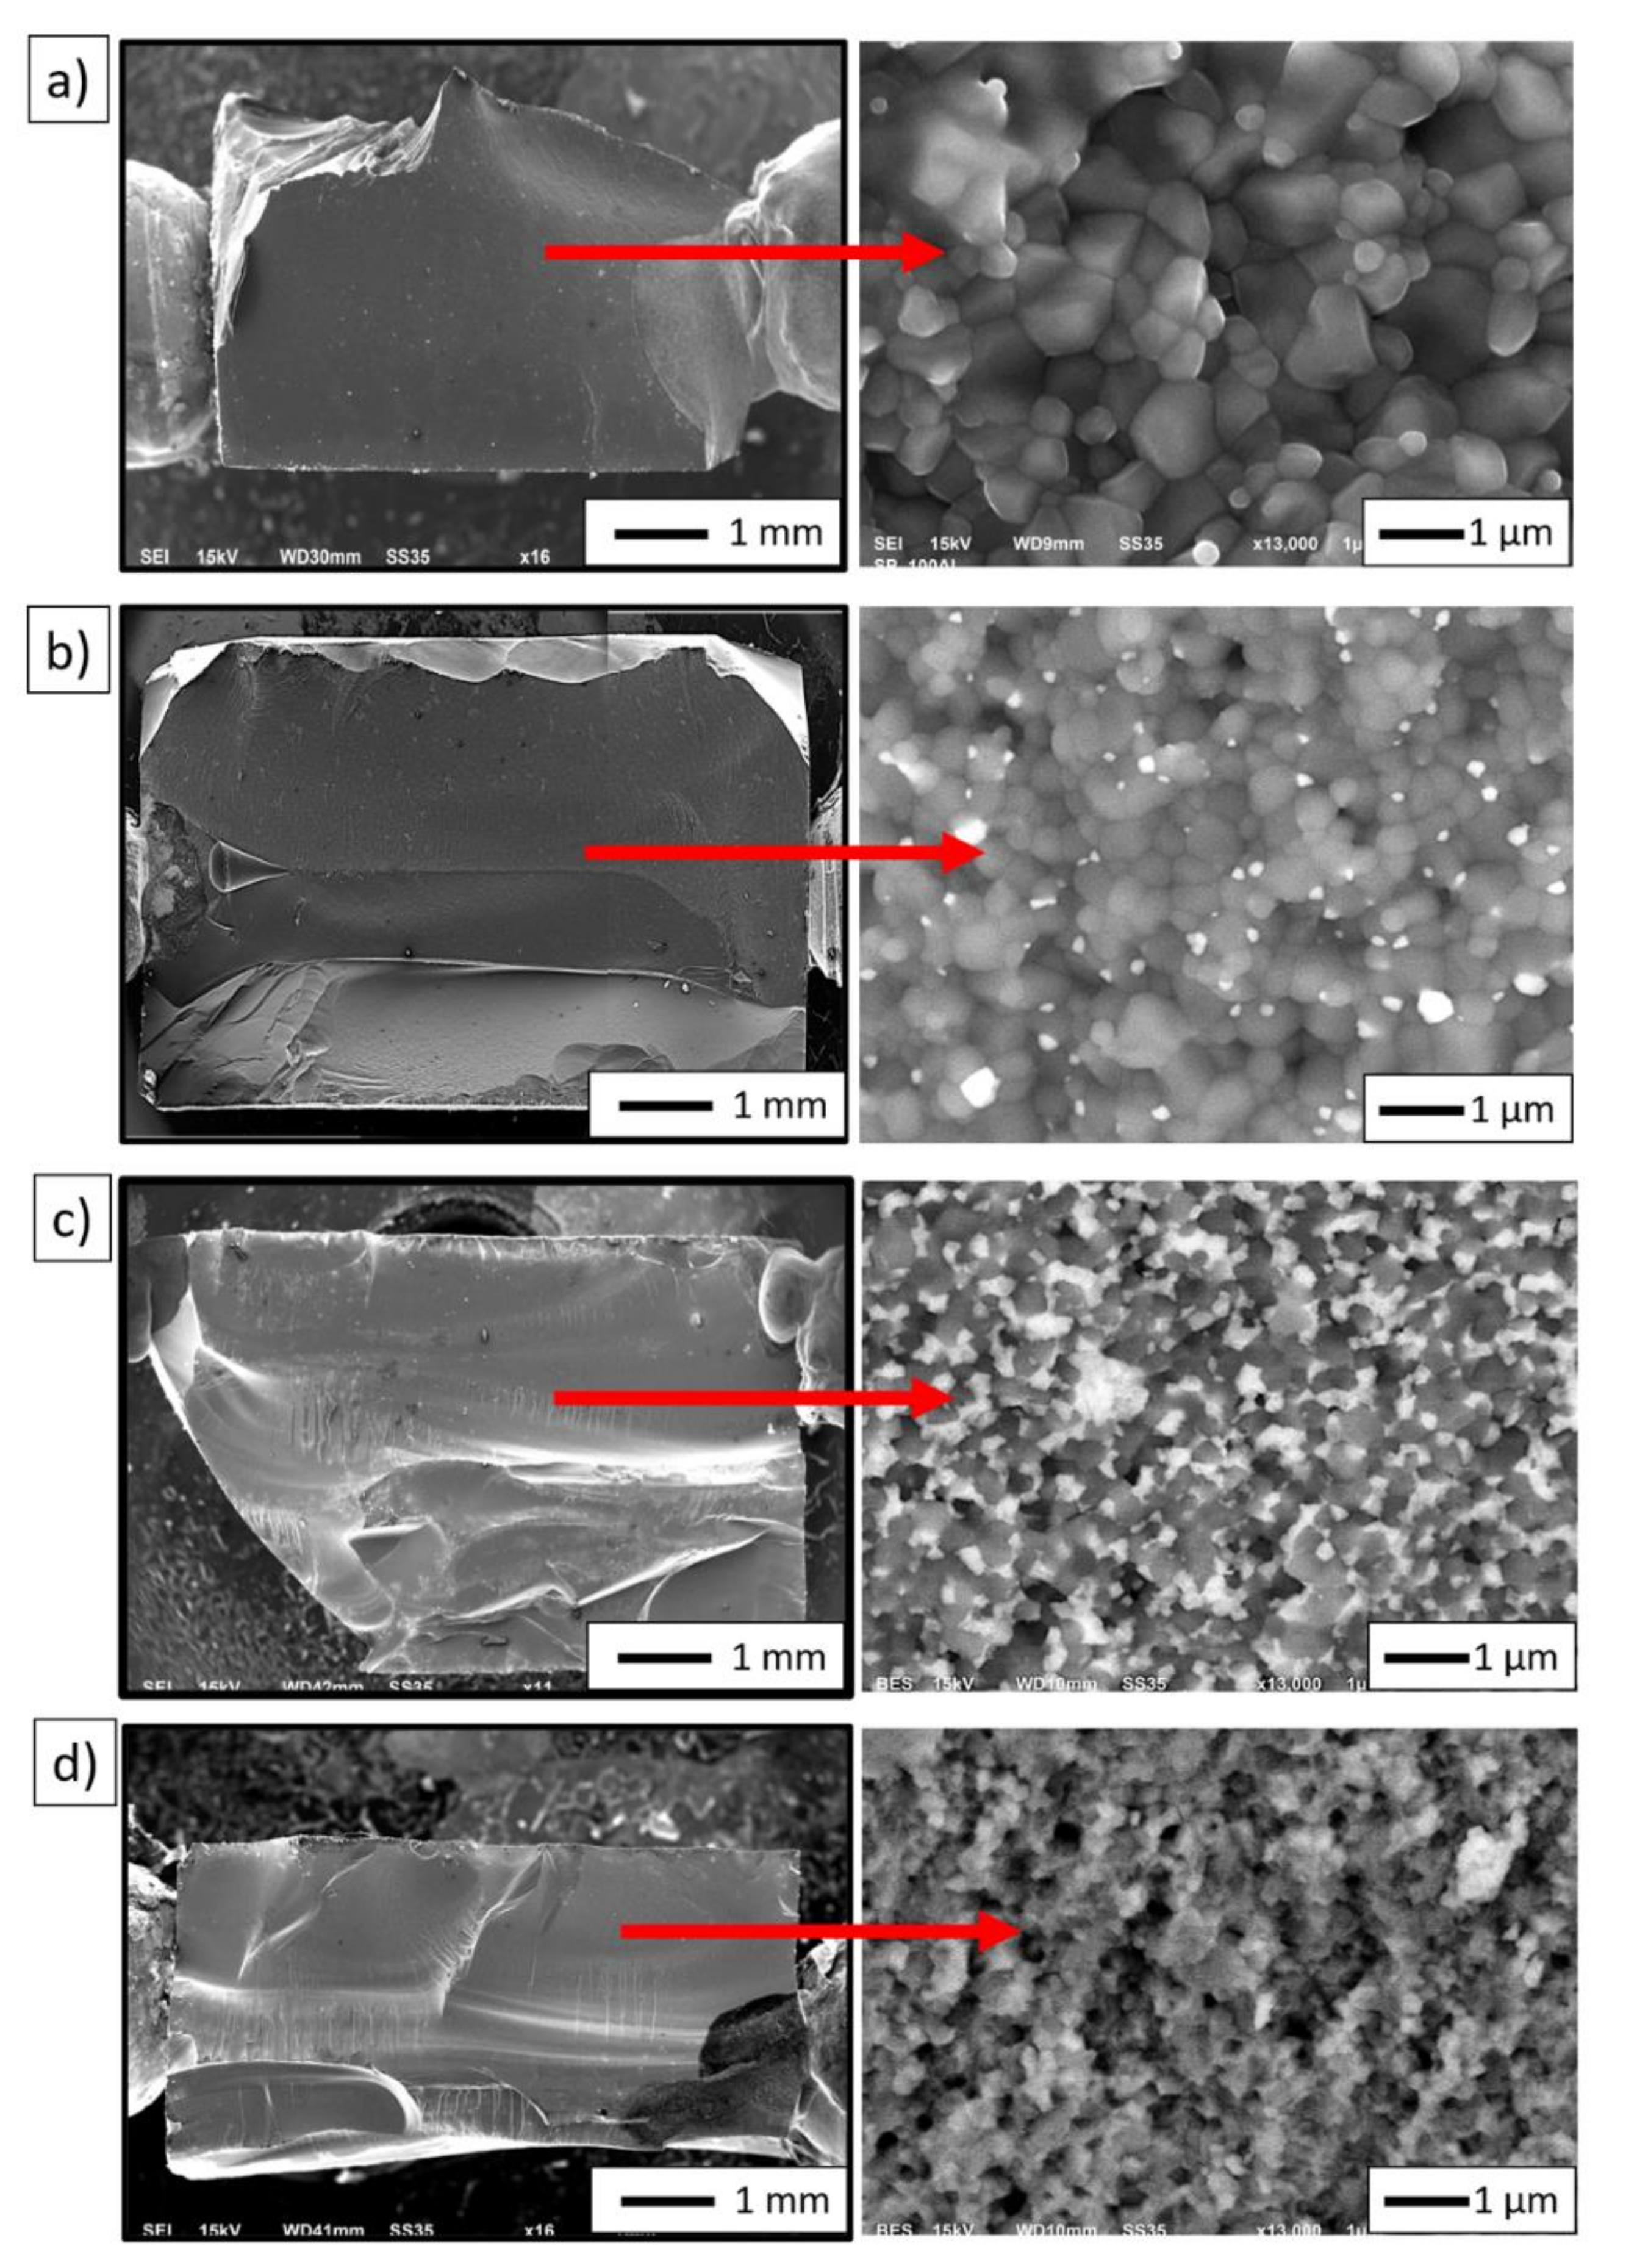
Figure 8 shows the results of a fractographic study carried out using a scanning electron microscope. In the images, the alumina grains are dark in color, while the zircon grains are lighter. Series I (100 vol.% Al
2O
3) is characterized by evenly spaced grains. In the Series IV sample (100 vol.% ZrO
2), the grains are irregular in shape. A directional grain arrangement was also observed for the last series. From the results obtained, it was found that the main crack initiated and propagated on the surface of the specimens for all the materials analyzed. Cracking was observed to occur along grain boundaries in both Al
2O
3/ZrO
2 composites and fittings containing 100 vol.% Al
2O
3 (Series I) and 100 vol.% ZrO
2 (Series IV). This means that the cracks in the shapes studied are of an intergranular brittle nature. Furthermore, observations of the composite samples by scanning electron microscopy showed a uniform distribution of ZrO
2 particles in the ceramic matrix throughout the test samples. Microstructural analysis of selected areas of the samples did not reveal the presence of areas characterized by excessive enrichment or depletion in ZrO
2 particles regardless of the amount of zirconium oxide phase.
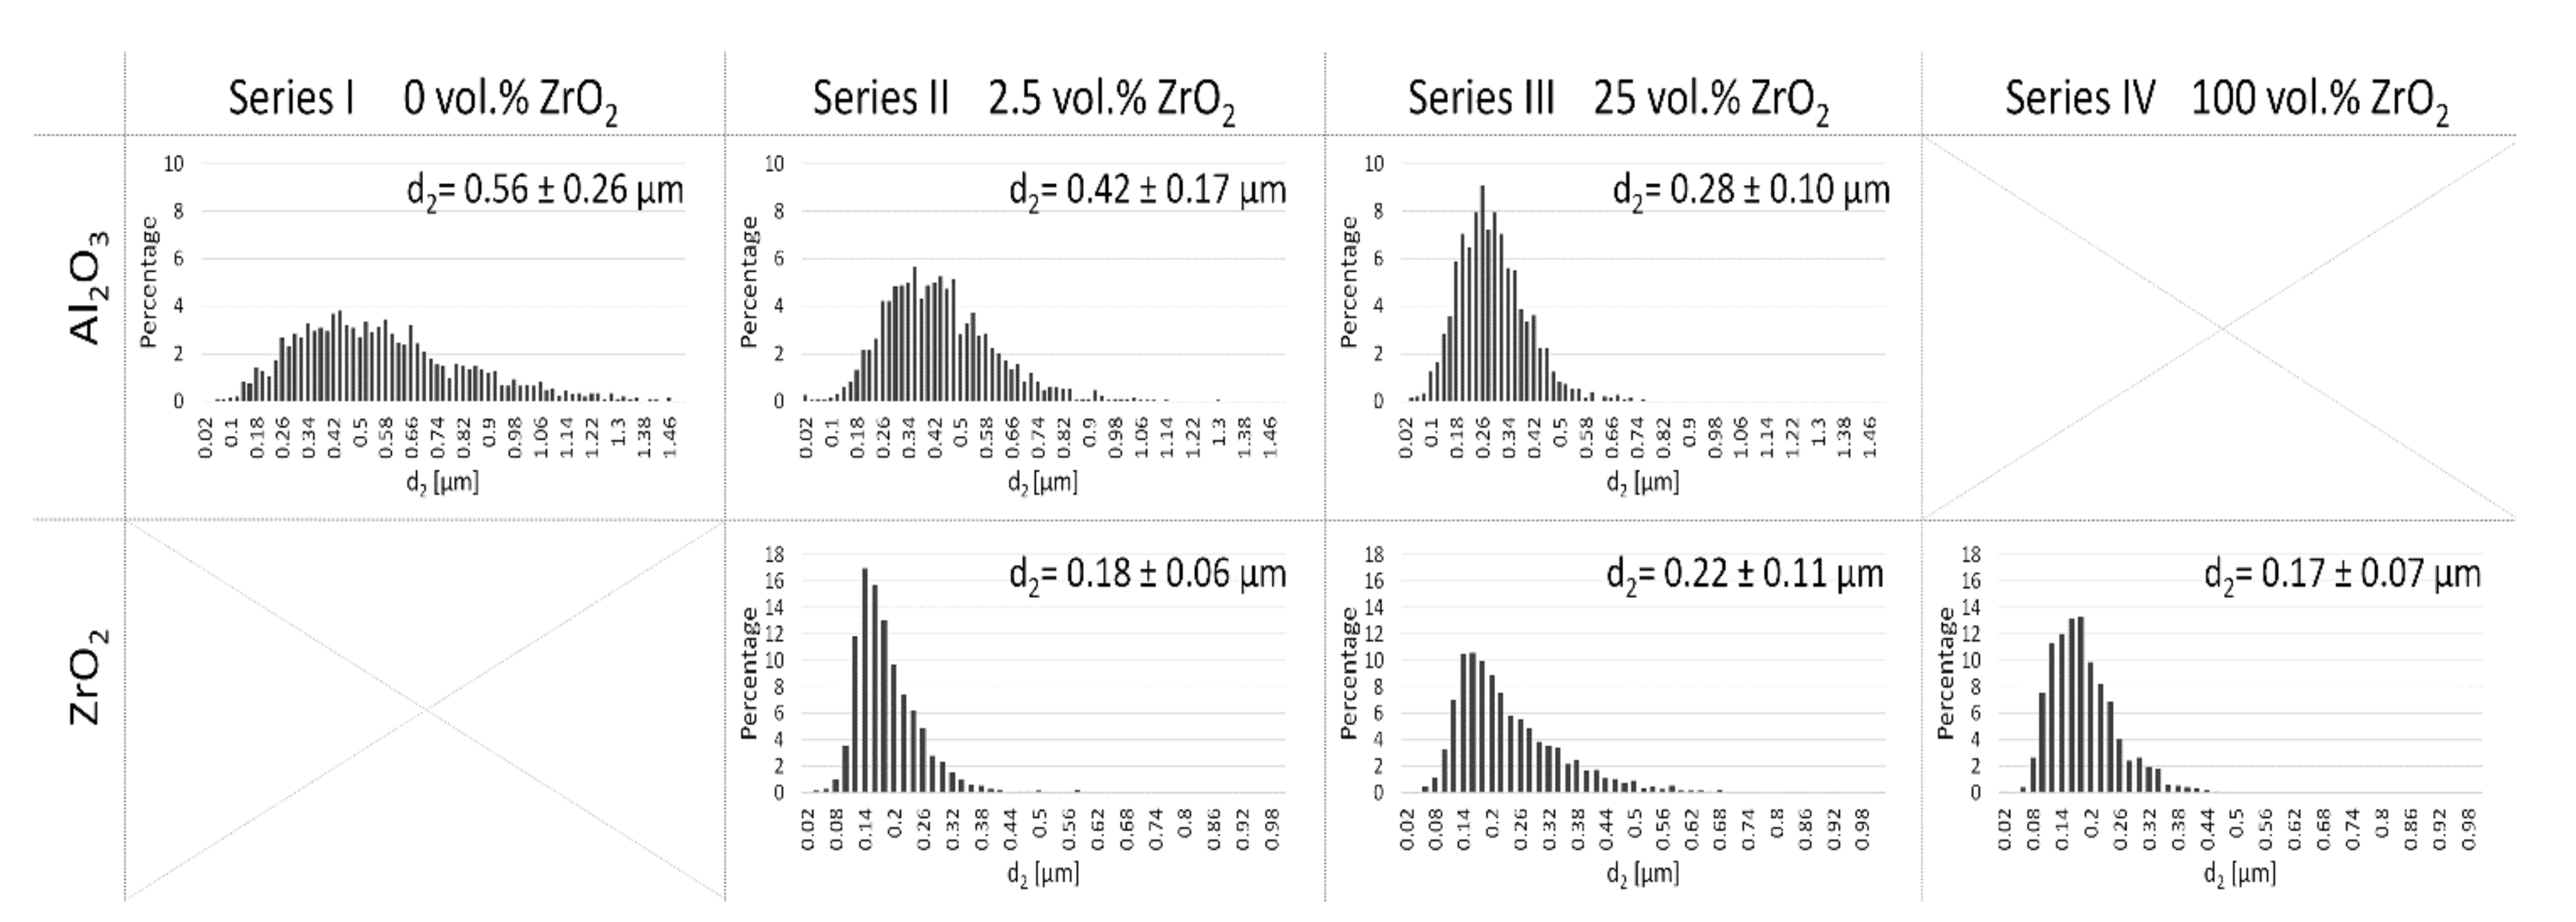
Image analysis was carried out in the next step based on the obtained microphotographs (
Figure 8). This made it possible to determine the average grain size of Al
2O
3 and ZrO
2 in the produced samples after the sintering process. The results obtained are shown in
Figure 9. Based on the average grain size values obtained, it can be concluded that the addition of zirconium oxide effectively reduces the growth of alumina grains. In samples containing 100% vol. Al
2O
3 (Series I), the average grain size of Al
2O
3 was 0.56 µm. However, the addition of 2.5 vol.% ZrO
2 (Series II) reduces Al
2O
3 grain growth by 25% (d
2 = 0.42 µm) than the average Al
2O
3 grain size in samples containing only Al
2O
3. Interestingly, the addition of 25 vol.% ZrO
2 reduces Al
2O
3 grain growth by 50% (d
2 = 0.28 µm) compared to Al
2O
3 grains in samples containing 100 vol.% Al
2O
3. This is consistent with the density results obtained and the conclusion that the presence of ZrO
2 grains in the matrix slightly hinders the densification of the Al
2O
3 matrix.
The results obtained are also in line with previous studies conducted with the same powder, using a different centrifugal slip casting method [
34]. It was determined that for series II (2.5 vol.% ZrO
2), the average grain size of ZrO
2 was 0.18 µm, while for series III (25 vol.% ZrO
2), the average grain size of ZrO
2 was 0.22 µm. However, for samples containing only ZrO
2, the average grain size of ZrO
2 was 0.17 µm. Furthermore, the results obtained for ZrO
2 grain size can also confirm the presence of a tetragonal phase in the sample. Literature data show that the tetragonal variety of ZrO
2 is distinguished by a certain metastability depending on the grain characteristics of the material [
46,
48]. Patil and his research team showed that as early as the 1970s, the finer the grain, the greater the durability of the tetragonal phase in the material [
48]. Adalberta and his research team came to similar conclusions in their study [
46].
Table 6 shows the grain shape parameters of Al
2O
3 and ZrO
2 in each series. Analysis of the results obtained showed that changing the ZrO
2 content in individual batches does not affect the grain shape parameters of Al
2O
3 and ZrO
2. The only deviation noted is the elongation of ZrO
2 grains with increasing ZrO
2 content in the samples.
The specific areas of the alumina phase boundaries in the Series II and Series III composites were then determined. Based on the results obtained, the specific surface areas of Al2O3 phase boundaries for series II—2.5 vol.% ZrO2 were 9.82 ± 0.22 [1/µm], while for series III—25 vol.% ZrO2 the Sv parameter was equal to 10.05 ± 0.56 [1/µm]. From the values obtained, it can be concluded that the Sv parameter decreases with increasing grain size of Al2O3 (Series II—d2 = 0.42 µm, Series III—d2 = 0.28 µm). This means that the surface area of the phase boundaries decreases with increasing ZrO2 content in the composite. This relationship is analogous to grain boundaries in metals. Namely, in metals, we can observe a relationship where the grain size is large, then the proportion of boundaries is small, and vice versa. In the composites studied, the proportion of interfacial boundaries is lower the larger the Al2O3 grains are.
Table 7 summarizes the Life Cycle Assessment (LCA) results of sintered Al
2O
3 and ZrO
2 systems containing 0 vol.%, 2.5 vol.%, 25 vol.%, and 100 vol.% ZrO
2, in terms of the acquisition and processing of raw materials—module A1, and their manufacture in the laboratory process—module A3. The results obtained indicate that increasing the ZrO
2 content in the composite increases the value of the environmental footprint of the sample in the A1 phase, which has also been shown in studies [
34,
37]. This phenomenon is related to the lower availability of zirconium in the Earth’s crust and the higher energy and material intensity of the ZrO
2 production process, compared to Al
2O
3 [
49,
50], which results in the fact that obtaining 1 kg of ZrO
2 raw material, is accompanied by greenhouse gas emissions ranging from 3.4 kg eq. CO
2, while for Al
2O
3, it is 2.84 kg CO
2 [
51]. In manufactured composite materials, the greenhouse gas emissions in phase A1, per kg of sample, are in the order of 2.25 kg eq. CO
2 and 2.43 kg eq. CO
2 for a ZrO
2 content of 2.5 vol.% and 25 vol.%, respectively. These impacts are comparable to the loads associated with the production of PVC or PP products [
52,
53]. As is well known, technologies are challenging to assess at an early stage of development. Making comparisons between different solutions, especially innovative and conventional solutions, is often complicated by differences in scale and resulting performance [
54,
55]. The analysis of the obtained LCA results of composites based on Al
2O
3 and ZrO
2, fabricated via slip casting method, in the light of the authors’ previously published works on the preparation of analogous ceramic materials by the centrifugal slip casting method [
34,
37], proves that the choice of laboratory infrastructure is the crucial aspect influencing the environmental characteristics of the process [
56]. The energy resource required to produce 1 kg of specimen by slip casting, using the infrastructure mentioned in the Materials and Methodology chapter, is 966 kWh, comparable to the electricity consumption of a hair dryer, used daily for 30 min, over a period of 2.5 years. On the other hand, the production of samples via the centrifugal slip casting method, which differs from the slip casting method by additionally using centrifugal casting, requires almost half the energy expenditure, amounting to 462 kWh per 1 kg of Al
2O
3 and ZrO
2 specimens [
34]. In this case, the size of the furnace chambers used for sintering the materials proved to be the determining factor for such a significant difference in the energy characteristics of the processes carried out under laboratory conditions.


 ,
, 


