Abstract
The traditional way for determination of molecular groups structure in crystals is the X-Ray diffraction analysis and it is based on an estimation of the interatomic distances. Here, we report the analysis of structural units in Y2O2SO4 using density functional theory calculations of electronic properties, lattice dynamics and experimental vibrational spectroscopy. The Y2O2SO4 powder was successfully synthesized by decomposition of Y2(SO4)3 at high temperature. According to the electronic band structure calculations, yttrium oxysulfate is a dielectric material. The difference between the oxygen–sulfur and oxygen–yttrium bond nature in Y2O2OS4 was shown based on partial density of states calculations. Vibrational modes of sulfur ions and [Y2O22+] chains were obtained theoretically and corresponding spectral lines observed in experimental Infrared and Raman spectra.
1. Introduction
The rising in experimental and theoretical studies of rare-earth-activated phosphors over the past decades is primarily associated with their applications in lighting, electronic displays, temperature sensing, etc. [1]. A large variety of rare-earth doped inorganic compounds have been synthesized, such as molybdates [2,3,4], tungstates [5,6,7], phosphates [8,9,10], aluminates [11,12,13] and silicates [14,15,16].
Since the chemical formula contains trivalent rare-earth (Re3+) ions, the common way for doping is a partial substitution of Re3+ with Ln3+ (Ln3+ = Ce, Pr, Nd, Sm, Eu, Tb, Dy, Ho, Er, Tm, Yb, Lu) ions. Recently, Re2O2SO4 oxysulfate was studied as a host for optical materials and it has been shown that the luminescent efficiency of Re2O2SO4:Ln3+ phosphorous depends on the size and shape of particles [17], for example, the Eu3+ doped nanosized Y2O2SO4 samples (18–89 nm, C2/c) show the quantum efficiencies ranging from η = 44–70% [18]. The 2–3 μm in diameter Y2O2SO4:Eu3+ was synthesized using a urea-based homogeneous precipitation technique based on a urea-ammonium sulfate system [19]. The Y2O2SO4:Tb3+ microflakes were prepared via an electrospinning process followed by calcination treatment [20]. The biomolecule-assisted hydrothermal route followed by calcination was used for the production of yttrium oxysulfate hollow spheres doped with Yb3+ and Eu3+ or Er3+ [21].
Traditionally, the search of nonlinear optical (NLO) materials focused on borate systems [22], on the other hand, several NLO sulfate crystals were synthesized in recent years [23,24,25,26,27]. As to the Re2O2SO4 oxysulfates, the crystal structure of Nd2O2SO4 [28] was solved in the non-centrosymmetric (I222) space group and thus this class of compounds can be a candidate for NLO materials. On the other hand, the crystal structure of Sm2O2SO4 [29] and Eu2O2SO4 [30] was solved in the centrosymmetric (C2/c) space group.
Determination of non-centrosymmetric or centrosymmetric space groups in Re2O2SO4:Ln3+ can be easily done with Infrared spectroscopy as has been shown in work by Yu.G. Denisenko [30]. The focus of such study must be pointed to the presence of the peak related to the symmetric stretching vibration of SO4 tetrahedra in case of the C2/c space group. However, it should be noted that while the interpretation of the spectral peaks related to vibrations of sulfate groups is beyond doubt, vibrations of rare-earth ions were explained as just Y-O vibrations and detailed description of these vibrations is completely absent in the literature. The spectral bands at 1220, 1130, 1060, 1000, 880, 660 and 610 cm−1 were observed in Infrared spectra of Y2O2SO4:Eu3+ and attributed to vibrations of SO42− ions, while the peak at 530 cm−1 was described as Y-O bond vibration [19]. In nanometer-sized Y2O2SO4:Eu3+, the Y-O bond peak was found at 560 cm−1 [31]. In Infrared spectra of Y2O2SO4 doped with Tb3+ ions, characteristic spectral bands related to sulfate vibrations and the Y-O stretching (at 539 cm−1) were observed [20]. Spectral peak related to the stretching vibrations of O-Y was found at 545 cm−1 in Y2O2SO4 [32]. The spectral bands in Y2O2SO4 nanoparticles at 1064, 1122, 133 and 664 have been attributed to SO42- ions while bands at 621 and 534 to Y-O vibrations [33]. There is no information at all about Raman spectra.
In this paper, we report the synthesis of Y2O2SO4, results of DFT (Density Functional Theory) calculations of electronic and vibrational properties and we demonstrated that spectral lines in Infrared and Raman spectra of Y2O2SO4 were associated with [SO4]2− and [Y2O22+] structural units.
2. Materials and Methods
2.1. Synthesis and Experimental Details
Yttrium oxysulfate was obtained by decomposition of yttrium sulfate Y2(SO4)3 (99.99%, Novosibirsk Rare Metals Plant, Novosibirsk, Russia) in an argon atmosphere at a temperature of 700 °C. A schematic of an installation for carrying out high temperature decomposition processes is shown in Figure 1. Argon of high purity 99.9999% was used to create an inert atmosphere. Temperature control and regulation was carried out using a microprocessor controller (“Thermokeramika”, Moscow, Russia). Temperature in the reaction zone was measured with a chromel-alumel thermocouple. A weighed portion of dry Y2(SO4)3 was placed in a quartz reactor and purged with argon for 30 min at a rate of 6 L/h. After that, the reactor was placed in a heated vertical furnace and held for 10 h. After the completion of the reduction process, the reactor was removed from the furnace and cooled to room temperature. The decomposition recovery process is described by the equation:
Y2(SO4)3 → Y2O2SO4 + 2SO2 + O2
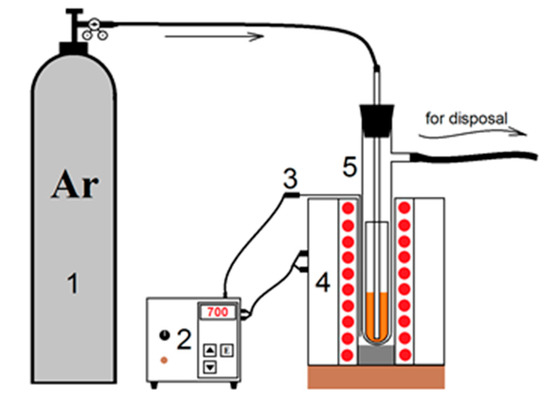
Figure 1.
Installation for the synthesis of yttrium oxysulfate. 1—argon tank; 2—thermoregulator; 3—thermocouple; 4—vertical oven; 5—quartz reactor.
Fourier-transformed Infrared spectroscopy (IR) was carried out with the use of a Fourier Transform Infrared Spectrometer FSM 1201, (Infraspec Ltd., Borovliany, Minsk district, Belarus). The sample for the investigation was prepared in a tablet form with addition of annealed KBr. IR spectrum was recorded with spectral resolution 4 cm−1. Raman spectrum was recorded using an i-Raman Plus spectrometer at a laser excitation wavelength of 785 nm and the spectral resolution was about 4 cm−1. The Infrared as well as the Raman spectrum was obtained at room temperature.
2.2. Calculation Details
All the density functional theory calculations [34,35] were performed with the CASTEP code (version 19.1.1) [36]. The 4s24p64d15s2, 3s23p4 and 2s22p4 valence electron configurations were used for Y, S and O, respectively. The local density approximation (LDA) based on the Perdew and Zunger parametrization [37] of the numerical results of Ceperley and Alder [38], and nonlocal exchange-correlation HSE06 functional [39] were used for calculation of electronic properties. The on-the-fly-generated norm-conserving pseudopotentials were used and the cutoff energy for the plane basis was chosen as 1150 eV. The convergence criteria for geometry optimization were set to 5.0 × 10⁻⁴ eV/Å for maximal force and 0.01 GPa for maximal stress. The density functional perturbation theory (DFPT) (linear response method) [40] was used to perform the calculation of vibrational properties. Different k-point density [41] was checked for Monkhorst–Pack sampling [42] and it was found that the 6 × 6 × 3 k-point set is enough.
3. Results and Discussion
Figure 2 presents the crystal structure of Y2O2SO4. Investigated sulfate presents a monoclinic structure with the C2/c space group (#15). As can be seen from Figure 2, the crystal structure consists of SO4 layers and layers formed with Y and O ions. Calculated values of lattice parameters and atomic coordinates are presented in Table 1 and compared with experimental data from ICDD PDF 53-0168.
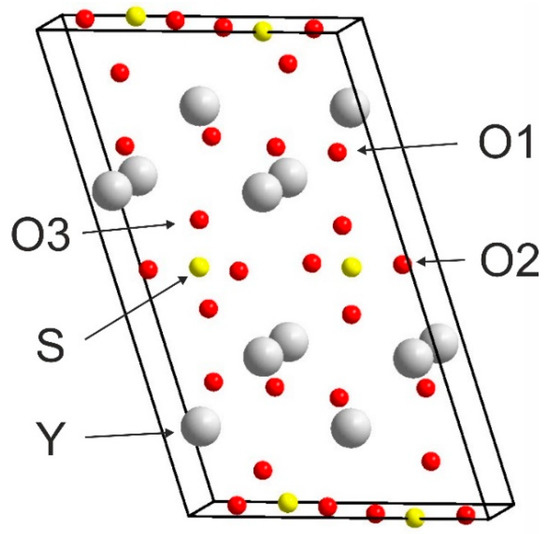
Figure 2.
Conventional cell of Y2O2SO4.

Table 1.
DFT calculated structural parameters for Y2O2SO4 in comparison to ICDD PDF 53-0168.
The Brillouin zone (BZ) of Y2O2SO4 and electronic band structure obtained using the local density approximation are shown in Figure 3. The path along high symmetry points of BZ was selected as: Γ–C|C2–Y2–Γ–M2–D|D2–A–Γ|L2–Γ–V2. Coordinates of these points are: Γ(0, 0, 0), C(−0.276, 0.276, 0), C2(−0.724, −0.276, 0), Y2(−0.5, −0.5, 0), M2(−0.5, −0.5, 0.5), D(−0.737, −0.263, 0.5), D2(−0.263, 0.263, 0), A(0, 0, 0.5), L2(−0.5, 0, 0.5), V2(−0.5, 0, 0) (Figure 3a). The conduction band minimum (CBM) is located at the Γ point, while the valence band maximum (VBM) is located between M2 and D k-point, thus making the Y2O2SO4 an indirect band gap material, the Egi = 5.32 eV (Figure 3b). However, the difference between indirect and direct electronic transition is small, the value of the calculated direct band gap is 5.37 eV. Taking into account that the experimental band gap value of Y2O2SO4 has not yet been published and DFT calculations in LDA approximation generate a band structure which underestimates the gap [43], the electronic band structure was calculated using the HSE06 hybrid functional. The value of indirect and direct electronic transition obtained with HSE06 are 7.126 and 7.131 eV correspondingly. In the meantime, the electronic density of states (DOS) and partial DOS are shown in Figure 4. It is clearly seen from Figure 4 that the top of valence band is formed by p-electron of oxygen, while the bottom of the conduction band comprises Y’s d-electrons. It is interesting to note that partial densities of states are different for oxygen ions in SO4 tetrahedra and O1 ions located between Y layers (see Figure 2) and the VBM is formed with O1 atoms. Thus, the wide band gap dielectric behaviors (Eg(HSE06) = 7.12 eV) of Y2O2SO4 are connected with the structural layer formed with Y and O1 atoms. The electronic density of states of O2 and O3 atoms (in SO4 tetrahedra) from −8 to −6 eV has contribution from 2s and 2p orbitals while the same region is empty in DOS of O1. We suppose that, in this case, the DOS of O1 in the range of −2.5–0 eV corresponds to the hybrid sp orbital, see Figure 4, and the OY4 molecule can be distinguished as a separate structural unit, see Figure 5.
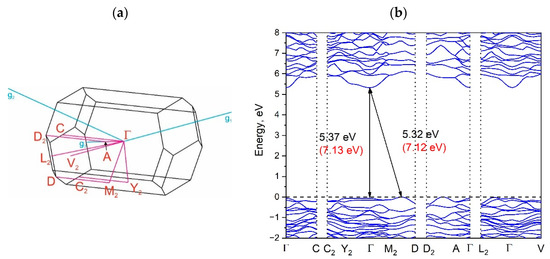
Figure 3.
Brillouin zone (a) and electronic band structure (b) of Y2O2SO4. Band gap values obtained with the hybrid functional are shown in parentheses in (b).
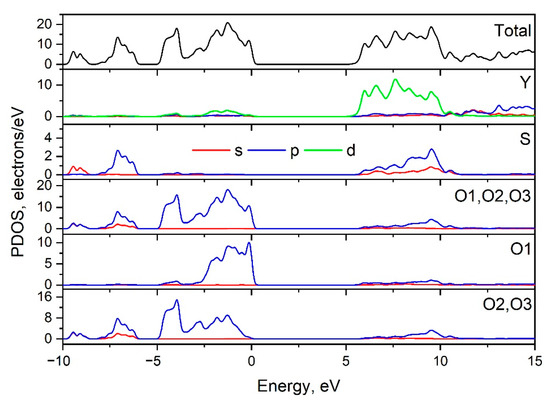
Figure 4.
Total and partial density of electronic states of Y2O2SO4.

Figure 5.
AB4 (A = S, O; B = O, Y) structural units in Y2O2SO4.
The Y2O2SO4 belongs to the monoclinic space group with the factor group symmetry C62h. Vibrational representation for the yttrium oxysulfate at the center of the Brillouin zone can be written as follow: Γvibr = 13Ag + 13Au + 14Bg + 14Bu. The Au + 2Bu are acoustical translational modes while the remaining Au and Bu modes are Infrared-active, the Ag and Bg are Raman-active vibrations. In the structure of Y2O2SO4, the SO4 tetrahedra occupy the positions with C2 symmetry and relation between free [SO4]2− ion with Td symmetry, its site symmetry and the factor group symmetry of the monoclinic cell are presented in Table 2. According to Table 2, nine internal vibrations of SO4 should be observed in Raman as in Infrared spectra. The Infrared and Raman spectra of Y2O2SO4 are presented in Figure 6. The total set of observed spectral lines, DFT calculated wavenumbers and mode assignments are presented in Table 3.

Table 2.
Correlation between internal vibrations of SO4 tetrahedra in Y2O2SO4.
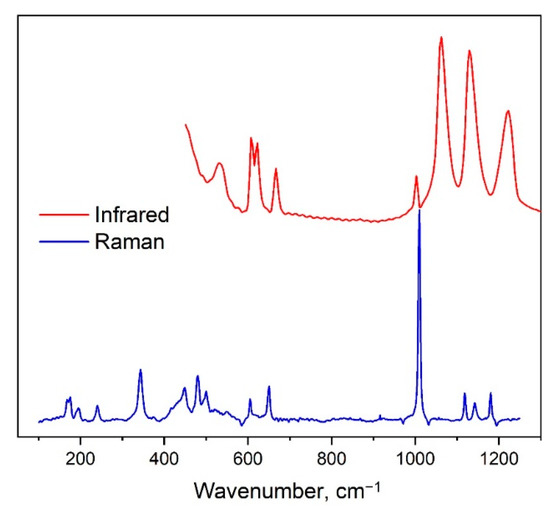
Figure 6.
Experimental Infrared and Raman spectra of Y2O2SO4.

Table 3.
Calculated and experimental phonon wavenumbers (cm−1) of Y2O2SO4 with proposed assignments. Notations: Irreps.—irreducible representations, str.—stretching, tr.—translation, rot.—rotation, def.—deformation.
The weak spectral band at 969 cm−1 in the Infrared spectrum and strongest band at 1009 cm−1 in the Raman spectrum are associated with ν1 symmetric stretching vibrations of SO4 groups. Spectral bands above 1000 cm−1 are antisymmetric stretching vibrations (ν3). Bands at 650 and 604 cm−1 in Raman spectrum are ν4 antisymmetric bending of SO4 tetrahedra. The ν4 modes appeared in the Infrared spectrum at 666, 621 and 608 cm−1. Spectral lines in Raman spectrum at 448 and 432 cm−1 are defined as ν2 symmetric bending of sulfur ions. The rotational vibration of SO4 appeared in Raman spectrum as the peak at 195 cm−1. The Raman peak at 168 cm−1 is explained as translations of SO4 in the SO4 structural layer.
Connection of the OY4 tetrahedra (Figure 5) into the chains creates the [Y2O22+] layers as shown in Figure 7 and vibrations of these layers have been found in Raman spectra. Spectral band at 500 cm−1 is related to O-O stretching, as shown in Figure 8a. The line at 480 cm−1 is an antiphase translation of O atoms along the layer, Figure 8b. The spectral line at 374 cm−1 is an antiphase vibration of O in [Y2O22+] structural units as shown in Figure 8c. The strong band at 344 cm−1 is an antiphase vibration of O atoms, Figure 8d. The Au mode (Infrared active) with a calculated wavenumber value equal to 546.7 cm−1 is a combination of ν2 vibrations of SO4 and O-O stretching, as shown in Figure 8e. The Bu mode at 499.1 cm−1 is a translation of O, as shown in Figure 8f. Thus, we can conclude that the wide spectral band at 532 cm−1 in Infrared spectra is devoted to oxygen vibration in [Y2O22+] chains, but not to Y-O vibrations as was stated earlier [19,20,31,32,33]. The assignment of remain vibrational modes is presented in Table 3.
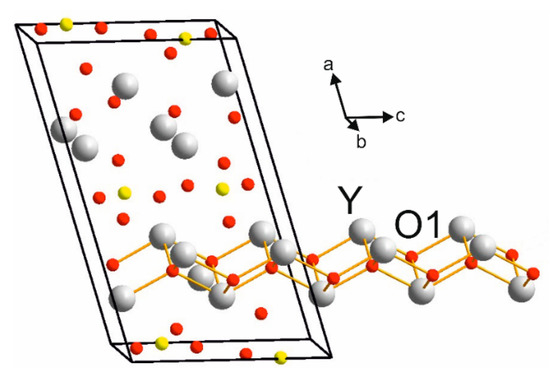
Figure 7.
Representation of [Y2O22+] layers in crystal structure of Y2O2SO4.
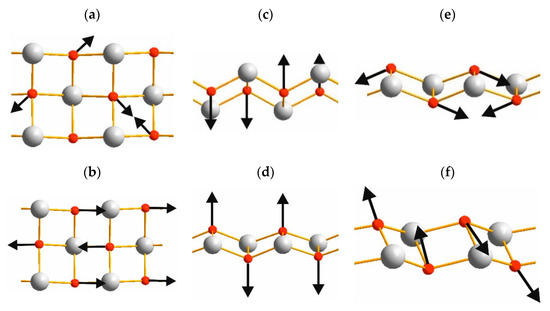
Figure 8.
Representative atomic vibrations of [Y2O22+] chains in Y2O2SO4: (a) Bg 533.1 cm−1, (b) Ag 505.3 cm−1, (c) Bg 383.2 cm−1, (d) Ag 352.5 cm−1, (e) Au 546.7 cm−1, (f) Bu 499.1 cm–1.
4. Conclusions
In summary, we have demonstrated that the lines in vibrational spectra of Y2O2SO4 should be interpreted in terms of vibrations of SO4 tetrahedra and layers composed of [Y2O22+] structural units. Calculated partial density of states shows different electron distribution for s and p orbitals in case of oxygen atoms in [SO4]2− and in case of [Y2O22+]. The formation of hybrid sp orbital in yttrium–oxygen chains is supposed. The electronic structure and band gap value of yttrium oxysulfate was presented for the first time.
Author Contributions
Conceptualization, A.S.O.; formal analysis, A.S.O. and Y.G.D.; investigation, A.S.O. and Y.G.D.; resources, Y.G.D.; writing—original draft preparation, A.S.O.; project administration, A.S.O. All authors have read and agreed to the published version of the manuscript.
Funding
This research received no external funding.
Institutional Review Board Statement
Not applicable.
Informed Consent Statement
Not applicable.
Data Availability Statement
The data presented in this study are available on request from the corresponding author.
Conflicts of Interest
The authors declare no conflict of interest.
References
- Qin, X.; Liu, X.; Huang, W.; Bettineli, M.; Liu, X. Lanthanide-activated phosphors based on 4f-5d optical transitions: Theoretical and experimental aspects. Chem. Rev. 2017, 117, 4488–4527. [Google Scholar] [CrossRef]
- Lim, C.S.; Aleksandrovsky, A.; Atuchin, V.; Molokeev, M.; Oreshonkov, A. Microwave-employed sol–gel synthesis of scheelite-type microcrystalline AgGd(MoO4)2:Yb3+/Ho3+ upconversion yellow phosphors and their spectroscopic properties. Crystals 2020, 10, 1000. [Google Scholar]
- Lim, C.S.; Aleksandrovsky, A.S.; Atuchin, V.V.; Molokeev, M.S.; Oreshonkov, A.S. Microwave sol-gel synthesis, microstructural and spectroscopic properties of scheelite-type ternary molybdate upconversion phosphor NaPbLa(MoO4)3:Er3+/Yb3+. J. Alloys Compd. 2020, 826, 152095. [Google Scholar] [CrossRef]
- Lim, C.S.; Aleksandrovsky, A.S.; Molokeev, M.S.; Oreshonkov, A.S.; Atuchin, V.V. Microwave synthesis and spectroscopic properties of ternary scheelite-type molybdate phosphors NaSrLa(MoO4)3:Er3+,Yb3+. J. Alloys Compd. 2017, 713, 156–163. [Google Scholar] [CrossRef]
- Lim, C.S.; Atuchin, V.V.; Aleksandrovsky, A.S.; Denisenko, Y.G.; Molokeev, M.S.; Oreshonkov, A.S. Fabrication of microcrystalline NaPbLa(WO4)3:Yb3+/Ho3+ phosphors and their upconversion photoluminescent characteristics. Korean J. Mater. Res. 2019, 29, 741–746. [Google Scholar] [CrossRef]
- Lim, C.S.; Aleksandrovsky, A.; Molokeev, M.; Oreshonkov, A.; Atuchin, V. Microwave sol–gel synthesis and upconversion photoluminescence properties of CaGd2(WO4)4:Er3+/Yb3+ phosphors with incommensurately modulated structure. J. Solid State Chem. 2015, 228, 160–166. [Google Scholar] [CrossRef]
- Otsuka, T.; Brehl, M.; Cicconi, M.R.; de Lighy, D.; Hayakawa, T. Thermal evolutions to glass-ceramics bearing calcium tungstate crystals in borate glasses doped with photoluminescent Eu3+ ions. Materials 2021, 14, 952. [Google Scholar] [CrossRef] [PubMed]
- Zhao, F.; Song, Z.; Liu, Q. Color-tunable persistent luminescence of Ca10M(PO4)7:Eu2+ (M = Li, Na, and K) with a β-Ca3(PO4)2-Type Structure. Inorg. Chem. 2021, 60, 3952–3960. [Google Scholar] [CrossRef]
- Wu, H.; Li, H.; Jiang, L.; Pang, R.; Zhang, S.; Li, D.; Liu, G.; Li, C.; Feng, J.; Zhang, H. Synthesis, structure and optical properties of novel thermally robust Dy3+-doped Ca9Sc(PO4)7 phosphors for NUV-excited white LEDs. J. Rare Earth. 2021, 39, 277–283. [Google Scholar] [CrossRef]
- Dahiya, M.; Siwach, A.; Dalai, M.; Kumar, D. Study of structural and luminescent characteristics of novel color tunable blue-green Tb3+-doped Na3Y(PO4)2 nanoparticles for NUV-based WLEDs. J. Mater. Sci: Mater. Electron. 2021, 32, 4166–4176. [Google Scholar]
- Zhai, B.; Xu, H.; Huang, Y.M. Annealing temperature dependent afterglow of Tb3+ doped CaAl2O4. Opt. Mater. 2021, 112, 110739. [Google Scholar] [CrossRef]
- Singh, M.N.; Barua, A.G.; Gartia, R.K. Thermoluminescence studies of Tm doped nanocrystalline Calcium Aluminate (CaAl2O4:Tm3+). Optik 2021, 228, 166151. [Google Scholar] [CrossRef]
- Shivaramu, N.J.; Coetsee, E.; Roos, W.D.; Nagabhushana, K.R.; Swart, H.C. Charge carrier trapping processes in un-doped and BaAl2O4:Eu3+ nanophosphor for thermoluminescent dosimeter applications. J. Phys. D Appl. Phys. 2020, 53, 475305. [Google Scholar] [CrossRef]
- Yin, Z.; Yuan, P.; Zhu, Z.; Li, T.; Yang, Y. Pr3+ doped Li2SrSiO4: An efficient visible-ultraviolet C up-conversion phosphor. Ceram. Int. 2021, 47, 4858–4863. [Google Scholar] [CrossRef]
- Shinde, V.V.; Tiwari, A.; Dhoble, S.J. Synthesis of RE3+ (RE3+ = Ce3+, Dy3+, Eu3+ and Tb3+) activated Gd2SiO5 optoelectronics materials for lighting. J. Mol. Struct. 2020, 1217, 128397. [Google Scholar] [CrossRef]
- Xie, L.; Luo, D.; Zhu, Y.; Xu, C.; Chen, G.-X.; Xu, R.-J.; Zhou, X.-Q.; Li, Y. Monitoring of hydroxyapatite conversion by luminescence intensity and color during mineralization of Sm3+-doped β-dicalcium silicate. J. Lumin. 2020, 226, 117468. [Google Scholar] [CrossRef]
- Xu, G.X.; Lian, J.B.; Wu, N.C.; Zhang, X.; He, J. Co-precipitation synthesis of La2O2SO4:Tb3+ phosphor and its conversion to La2O2S:Tb3+ ceramic scintillator via pressureless sintering in hydrogen. J. Ceram. Sci. Technol. 2018, 9, 345–352. [Google Scholar]
- Silva, I.G.N.; Morais, A.F.; Brito, H.F.; Mustafa, D. Y2O2SO4:Eu3+ nano-luminophore obtained by low temperature thermolysis of trivalent rare earth 5-sulfoisophthalate precursors. Ceram. Int. 2018, 44, 15700–15705. [Google Scholar] [CrossRef]
- Li, X.; Lian, J. Synthesis and characterizations of pompon-like Y2O2SO4:Eu3+ phosphors using a UBHP technique based on UAS system. Optik 2016, 127, 401–406. [Google Scholar] [CrossRef]
- Xing, T.H.; Song, L.X.; Xiong, J.; Cao, H.B.; Du, P.F. Preparation and luminescent properties of Tb3+ doped Y2O2SO4 microflakes. Adv. Appl. Ceram. 2013, 112, 455–459. [Google Scholar] [CrossRef]
- Chen, G.; Chen, F.; Liu, X.; Ma, W.; Luo, H.; Li, J.; Ma, R.; Qiu, G. Hollow spherical rare-earth-doped yttrium oxysulfate: A novel structure for upconversion. Nano Res. 2014, 7, 1093–1102. [Google Scholar] [CrossRef]
- Oreshonkov, A.S.; Roginskii, E.M.; Shestakov, N.P.; Gudim, I.A.; Temerov, V.L.; Nemtsev, I.V.; Molokeev, M.S.; Adichtchev, S.V.; Pugachev, A.M.; Denisenko, Y.G. Structural, electronic and vibrational properties of YAl3(BO3)4. Materials 2020, 13, 545. [Google Scholar] [CrossRef] [PubMed]
- Wu, C.; Lin, L.; Wu, T.; Huang, Z.; Zhang, C. Deep-ultraviolet transparent alkali metal–rare earth metal sulfate NaY(SO4)2·H2O as a nonlinear optical crystal: Synthesis and characterization. CrystEngComm 2021, 23, 2945. [Google Scholar] [CrossRef]
- Liu, H.; Wu, Q.; Liu, L.; Lin, Z.; Halasyamani, P.S.; Chen, X.; Qin, J. AgBi(SO4)(IO3)2: Aliovalent substitution induces structure dimensional upgrade and second harmonic generation enhancement. Chem. Commun. 2021, 57, 3712. [Google Scholar] [CrossRef]
- Li, Y.; Liang, F.; Zhao, S.; Li, L.; Wu, Z.; Ding, Q.; Liu, S.; Lin, Z.; Hong, M.; Luo, J. Two non-π-conjugated deep-UV nonlinear optical sulfates. J. Am. Chem. Soc. 2019, 141, 3833–3837. [Google Scholar] [CrossRef]
- Chen, K.; Yang, Y.; Peng, G.; Yang, S.; Yan, T.; Fan, H.; Lin, Z.; Ye, N. A2Bi2(SO4)2Cl4 (A = NH4, K, Rb): Achieving a subtle balance of the large second harmonic generation effect and sufficient birefringence in sulfate nonlinear optical materials. J. Mater. Chem. C 2019, 7, 9900. [Google Scholar] [CrossRef]
- Netzsch, P.; Bariss, H.; Bayarjargal, L.; Höppe, H.A. Tb(HSO4)(SO4)—A green emitting hydrogensulfate sulfate with second harmonic generation response. Dalton Trans. 2019, 48, 16377. [Google Scholar] [CrossRef]
- Golovnev, N.N.; Molokeev, M.S.; Vereshchagin, S.N.; Atuchin, V.V. Synthesis and thermal transformation of a neodymium(III) complex [Nd(HTBA)2(C2H3O2)(H2O)2]·2H2O to non-centrosymmetric oxosulfate Nd2O2SO4. J. Coord. Chem. 2015, 68, 1865–1877. [Google Scholar] [CrossRef]
- Denisenko, Y.G.; Sal’nikova, E.I.; Basova, S.A.; Molokeev, M.S.; Krylov, A.S.; Aleksandrovsky, A.S.; Oreshonkov, A.S.; Atuchin, V.V.; Volkova, S.S.; Khritokhin, N.A.; et al. Synthesis of samarium oxysulfate Sm2O2SO4 in the high-temperature oxidation reaction and its structural, thermal and luminescent properties. Molecules 2020, 25, 1330. [Google Scholar] [CrossRef] [PubMed]
- Denisenko, Y.G.; Molokeev, M.S.; Krylov, A.S.; Aleksandrovsky, A.S.; Oreshonkov, A.S.; Azarapin, N.O.; Plyusnin, P.E.; Sal’nikova, E.I.; Andreev, O.V. High-temperature oxidation of europium (II) sulfide. J. Ind. Eng. Chem. 2019, 79, 62–70. [Google Scholar] [CrossRef]
- Lian, J.; Qin, H.; Liang, P.; Liu, F. Co-precipitation synthesis of Y2O2SO4:Eu3+ nanophosphor and comparison of photoluminescence properties with Y2O3:Eu3+ and Y2O2S:Eu3+ nanophosphors. Solid State Sci. 2015, 48, 147–154. [Google Scholar] [CrossRef]
- Song, L.; Shao, X.; Du, P.; Cao, H.; Hui, Q.; Xing, T.; Xiong, J. A facile preparation and the luminescent properties of Eu3+-doped Y2O2SO4 nanopieces. Mater. Res. Bull. 2013, 48, 4896–4900. [Google Scholar] [CrossRef]
- Shafaie, F.; Hadadzadech, H.; Behnamfar, M.T.; Rudbari, H.A. Electrocatalytic activity of a mononuclear yttrium(III)-methyl orange complex and Y2O2SO4 nanoparticles for adsorption/desorption of hydrogen. Mater. Chem. Phys. 2016, 184, 222–232. [Google Scholar] [CrossRef]
- Hohenberg, P.; Kohn, W. Inhomogeneous electron gas. Phys. Rev. 1964, 136, B864–B871. [Google Scholar] [CrossRef]
- Kohn, W.; Sham, L.J. Self-consistent equations including exchange and correlation effects. Phys. Rev. 1965, 140, A1133–A1138. [Google Scholar] [CrossRef]
- Clark, S.J.; Segall, M.D.; Pickard, C.J.; Hasnip, P.J.; Probert, M.I.J.; Refson, K.; Payne, M.C. First principles methods using CASTEP. Z. Kristallogr. 2005, 220, 567–570. [Google Scholar] [CrossRef]
- Perdew, J.P.; Zunger, A. Self-interaction correction to density-functional approximations for many-electron systems. Phys. Rev. B. 1981, 23, 5048. [Google Scholar] [CrossRef]
- Ceperley, D.M.; Alder, B.J. Ground state of the electron gas by a stochastic method. Phys. Rev. Lett. 1980, 45, 566. [Google Scholar] [CrossRef]
- Krukau, A.V.; Vydrov, O.A.; Izmaylov, A.F.; Scuseria, G.E. Influence of the exchange screening parameter on the performance of screened hybrid functionals. J. Chem. Phys. 2006, 125, 224106. [Google Scholar] [CrossRef]
- Baroni, S.; de Gironcoli, S.; Corso, A.D.; Giannozzi, P. Phonons and related crystal properties from density-functional perturbation theory. Rev. Mod. Phys. 2001, 73, 515–562. [Google Scholar] [CrossRef]
- Deng, Z.; Li, Z.; Wang, W.; She, J. Vibrational properties and Raman spectra of pristine and fluorinated blue phosphorene. Phys. Chem. Chem. Phys. 2019, 21, 1059–1066. [Google Scholar] [CrossRef] [PubMed]
- Monkhorst, H.J.; Pack, J.D. Special points for Brillonin-zone integrations. Phys. Rev. B. 1976, 13, 5188–5192. [Google Scholar] [CrossRef]
- Perdew, J.P. Density functional theory and the band gap problem. Int. J. Quantum Chem. 1986, 19, 497–523. [Google Scholar] [CrossRef]
- Nakamoto, K. Infrared and Raman Spectra of Inorganic and Coordination Compounds, 6th ed.; Wiley: New York, NY, USA, 2009. [Google Scholar]
Publisher’s Note: MDPI stays neutral with regard to jurisdictional claims in published maps and institutional affiliations. |
© 2021 by the authors. Licensee MDPI, Basel, Switzerland. This article is an open access article distributed under the terms and conditions of the Creative Commons Attribution (CC BY) license (https://creativecommons.org/licenses/by/4.0/).